Embed Size (px)
Citation preview
VISIONlite™ Application Software for Thermo Spectronic
UV/Vis and Vis Spectrophotometers
Operator’s Manual
ii VISIONlite Operator’s Manual
Software version 1.0 Manual release 1.0 Copyright 2002: ascanis OHG Ueberlingen, Germany
Table of Contents
VISIONlite Operator’s Manual iii
General .........................................................................................................................1
Introduction............................................................................................................................ 1 Startup................................................................................................................................... 1
Hardware Requirements.................................................................................................... 1 Connecting the Spectrophotometer to the PC ................................................................... 1 Installing the Software ....................................................................................................... 2 Applicable Instruments and Accessories ........................................................................... 3 Starting the Modules.......................................................................................................... 3
General Functions......................................................................................................4 Layout of Program Windows ................................................................................................. 4
Parameter Entry................................................................................................................. 5 Operating Toolbar.............................................................................................................. 5 Menu Bar ........................................................................................................................... 5
Methods Concept .................................................................................................................. 9 Measurement Sequence ..................................................................................................... 10 Graphics Functions (Scan and Rate only)........................................................................... 13 Printing ................................................................................................................................ 16 Results Space ..................................................................................................................... 17
Scan Module .............................................................................................................19 Rate Module..............................................................................................................21 Fixed Module ............................................................................................................23 Quant Module ...........................................................................................................25 Appendix...................................................................................................................29
Information for Specific Spectrophotometer Models ........................................................... 29 File Extensions .................................................................................................................... 32 Problem Solving .................................................................................................................. 32
Table of Contents
iv VISIONlite Operator’s Manual
General
VISIONlite Operator’s Manual 1
General
Introduction VISIONlite is a software package to control UV/Vis and Vis spectrophotometers in the Thermo Spectronic GENESYS™, Helios series, AquaMate, BioMate 3 and 5 and UV-1 instruments. The package includes various data recording and data evaluation functions. VISIONlite is a 32-bit software running under current Microsoft Windows® versions. The software consists of 4 separate modules:
• Scan Recording spectra • Rate Recording reaction curves • Fixed Recording sample absorption at single wavelength points • Quant Quantification according to the Beer-Lambert law
The modules are very similar in their design. They differ only in their typical functions. Each module records data in a similar fashion and allows measurement conditions and a specific data processing procedure to be entered; e.g., peak identification, saving and printing the results. Settings for the measurement can be saved as a recallable method file. Only one module at a time can access the spectrophotometer. To change to a different measurement module requires the active module to be closed. Various settings differ according to the individual instrument and accessory, such as the selectable wavelength range or the number of cells in a cell changer. The applicable instruments are described below and in the appendix.
Startup
Hardware Requirements VISIONlite requires a standard PC with a 32-bit Microsoft Windows® operating system; e.g., Windows 95, 98, 2000, NT and XP. The screen must have a minimum resolution of 800x600 pixels. An RS232C (serial) interface must be installed to connect the spectrophotometer. VISIONlite requires approximately 5 MB hard disk space. There should be sufficient free additional hard disk space to store data.
Connecting the Spectrophotometer to the PC All applicable spectrophotometer models are connected to the PC via RS232C interface. The COM 1 port is used as the default interface; alternatively the software can be configured to run with other COM ports. Make sure to use the interface cable configuration recommended by Thermo Spectronic.
General
2 VISIONlite Operator’s Manual
Installing the Software If your operating system is Windows NT, 2000 or XP, you have to be registered as the administrator. First, close all other active applications. Normally the installation routine starts automatically when you insert the software CD into the PC. If it does not start, please start the setup.exe routine in the main CD directory. Thereafter, the installation routine will guide you through the installation procedure. Also, read the latest information not yet printed in the Operation Guide in the readme text, which is prompted for display at the end of the installation. The following steps are performed:
• You are reminded to close all running applications. Exit the installation if this is not yet the case.
• According to Windows conventions, the software installs to the c:\program files\VISIONlite directory. Use the Change directory button to choose a different directory.
• In the next window, select English as the software language. • Thereafter select your type of spectrophotometer. • In the next window, select the com port where the instrument is attached, typically COM
1. • The software usually is installed in its own program group. Optionally select a different
program group. After the data is collected, data transfer from CD to the hard disk is initiated. If the software already has been installed before, the system will overwrite all files which are older than those of the new installation, or which have the same date and time of generation. Files that have been modified in previous usage, (for example, the initialization file or the default method files) might be newer than those on the installation disk. In this case, you are asked if you want to keep these files. Select Yes, if you want to keep the file, or No, if you want to have it updated. Select No to all, if you want to have a completely new installation. At the end of the installation, you are asked if you want to see the readme file. This text file holds the latest information not yet included in this manual. After reading, close the editor window. If you want to use two spectrophotometers with the PC, you should install VISIONlite twice. Make sure that you select a different COM port, a different program directory and a different program group. The second installation will overwrite the program icons on the desktop. Therefore, start the programs via the start menu or establish additional icons. As long as you do not use the same module (e.g, SCAN), you generally can run the instruments in parallel.
General
VISIONlite Operator’s Manual 3
Applicable Instruments and Accessories The various instruments that can be used with VISIONlite have different technical (e.g., the wavelength range, the scanning speed, or the accessory installations and options). Additionally, the behavior of the instruments (e.g., the instrument live display under PC control) is different. The spectrophotometer models are divided into 3 groups:
1. GENESYS 6/10, BioMate 3 2. GENESYS 20, Helios ε 3. UV 1, Helios α- δ, BioMate 5, AquaMate
The appendix describes the instrument aspects that are relevant to the use of the software. The following accessories can be used and are supported by the software:
• 6-position cell changer (group 1) or 7-position cell changer (group 3) • sipper (group 3)
Starting the Modules Before you start the modules, look up the information about your specific instrument in the spectrophotometer guide and in the appendix of this manual. Some models, for example, must be switched to remote control. The modules can be started either from their program group or with the respective icons on the Windows desktop. When started, the software reads the current instrument settings and activates the Live Display, if the connection has been established successfully. If unsuccessful, the software displays an error message and the Live Display remains inactive. After accepting this error message, however, offline data and method handling will be possible. After installing or removing an accessory, it is necessary to restart the software so that the new configuration is detected.
General Functions
4 VISIONlite Operator’s Manual
General Functions This chapter describes the functions, which are identical or similar for all modules. Details of operation, which are unique to each module, are described in their respective chapters.
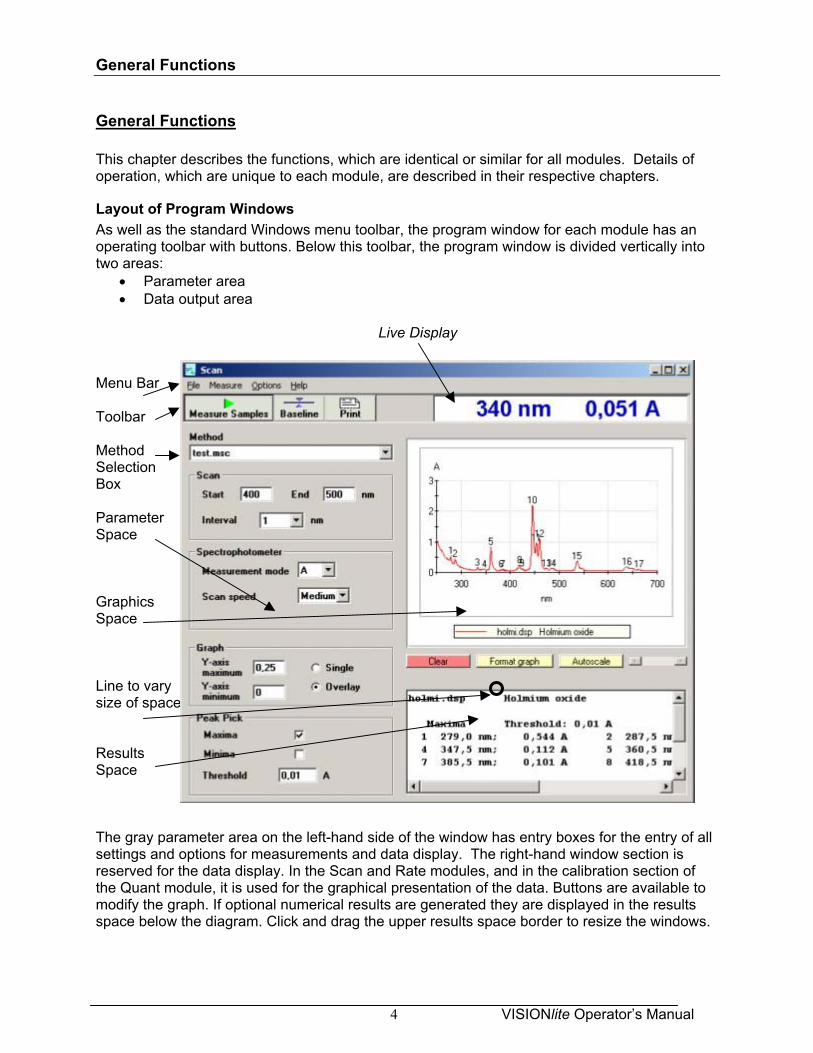
Layout of Program Windows As well as the standard Windows menu toolbar, the program window for each module has an operating toolbar with buttons. Below this toolbar, the program window is divided vertically into two areas:
• Parameter area • Data output area
Live Display
Menu Bar Toolbar Method Selection Box Parameter Space Graphics Space Line to vary size of spaces Results Space The gray parameter area on the left-hand side of the window has entry boxes for the entry of all settings and options for measurements and data display. The right-hand window section is reserved for the data display. In the Scan and Rate modules, and in the calibration section of the Quant module, it is used for the graphical presentation of the data. Buttons are available to modify the graph. If optional numerical results are generated they are displayed in the results space below the diagram. Click and drag the upper results space border to resize the windows.
General Functions
VISIONlite Operator’s Manual 5
In the Fixed and Quant modules, the full data display output area is used for the numerical report.
Note: When the list of results becomes larger than the available results space, a scroll bar will appear to allow you to scroll the window so you may view all the data. Do not use the scroll bar during data acquisition. This may cause incomplete or erroneous data collection.
Parameter Entry In the parameter area, choose the method or the settings for the measurement and data display. The exact presentation of parameters depends on the respective module and spectrophotometer. Further information is provided in the chapter on the modules and spectrophotometer types. Depending on the specific parameters, selection boxes or selection buttons are available. An error message is displayed if the allowed range of a parameter entry is exceeded. You can also use the Tab keys to move from one entry box another.
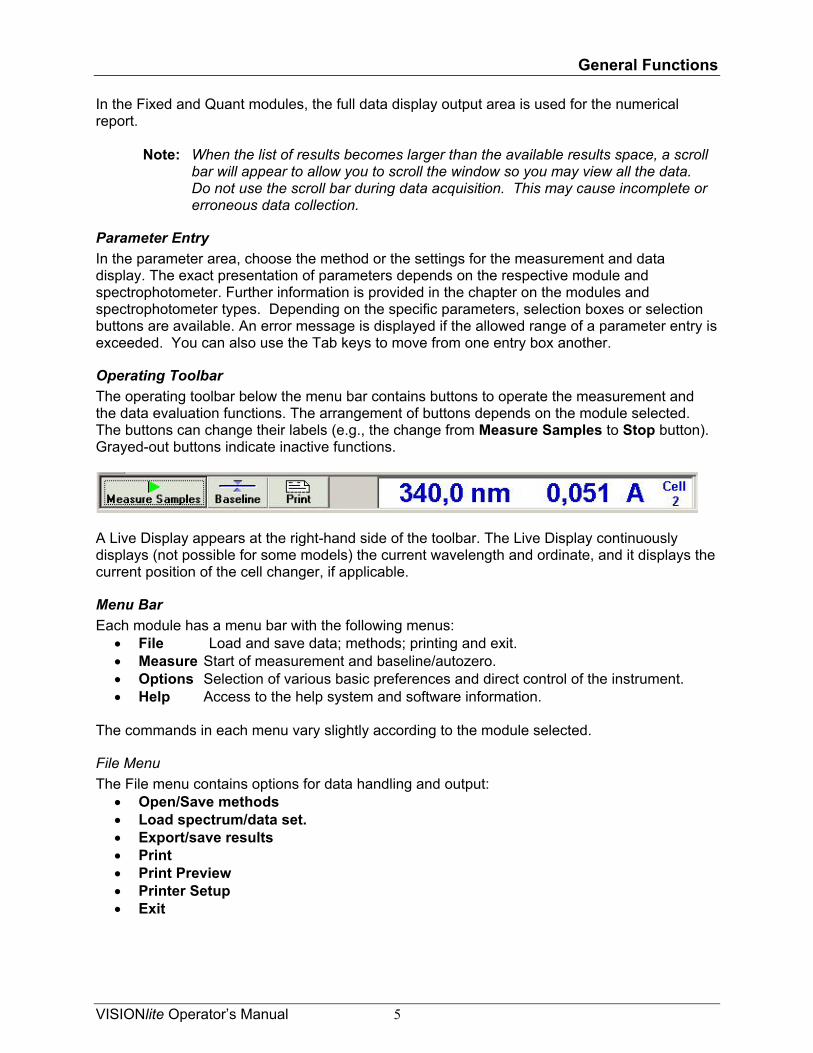
Operating Toolbar The operating toolbar below the menu bar contains buttons to operate the measurement and the data evaluation functions. The arrangement of buttons depends on the module selected. The buttons can change their labels (e.g., the change from Measure Samples to Stop button). Grayed-out buttons indicate inactive functions.
A Live Display appears at the right-hand side of the toolbar. The Live Display continuously displays (not possible for some models) the current wavelength and ordinate, and it displays the current position of the cell changer, if applicable.
Menu Bar Each module has a menu bar with the following menus:
• File Load and save data; methods; printing and exit. • Measure Start of measurement and baseline/autozero. • Options Selection of various basic preferences and direct control of the instrument. • Help Access to the help system and software information.
The commands in each menu vary slightly according to the module selected.
File Menu The File menu contains options for data handling and output:
• Open/Save methods • Load spectrum/data set. • Export/save results • Print • Print Preview • Printer Setup • Exit
General Functions
6 VISIONlite Operator’s Manual
An option to save the spectra and the rate data set (Fixed and Quant modules) with the results is not available since these data are stored to disk automatically. Additionally, the graph window offers an option to save spectra/data sets. Open Method Open Method presents a window listing all methods of the currently active module in the Method directory. A different directory may be selected, if desired. Select the requested method and select by clicking on the Open button. The stored method settings are transferred to the various parameter entry boxes. Alternatively you may select a method from the method selection box. Save Method Save Method is used to save the current measurement and display parameters to disk as a method, which can be accessed for later use. The command opens a File Save window, where you enter the method filename. The respective method file extension is attached automatically. The current method directory is displayed as the directory for saving the method; however, you can select different directories, if desired. Load Spectrum/Data Set (only Scan and Rate modules) Load Spectrum/Data Set is only available in the Scan and Rate modules. With this command, you load stored spectra and data set files from disk to the graph. All graph functions are available. It is possible to inspect older data, to compare and to re-evaluate them. The command displays a selection window, which lists all stored data of the currently active module in the data directory. A different directory may be selected. Select the requested file and load the setting using the Open button. Export Results (not Scan module) Export Results allows results to be saved to disk as shown in the results space. The data are stored as xxx.csv files. The files contain all general information with data and results in tabular form. The files can be imported into spreadsheet programs. Note: Spectra and rate data sets can be exported from the File window. Load Results Load Results allows stored results to be displayed. A selection window enables you to select the desired filename and directory. Print Print prints the currently displayed results. You can select the printer, the number of copies, etc. in the print window, as well asset the printer attributes. Print Preview Print Preview opens a print preview window, which shows a preview of the printed report. In this window, you can swap pages; modify the size of the presentation, and start the printout. Close the window to return to the module.
General Functions
VISIONlite Operator’s Manual 7
Printer Setup Printer Setup allows you to preset various printer settings (as with the Print command). The printer driver determines the possible options. Exit Exit closes the currently active module. This is necessary, for example, to change to another module. If you have modified any parameters of the current method you are asked whether you wish to save these changes.
Measure Menu The Measure menu includes:
• Samples • Baseline or Autozero
Note: Baseline: Background correction for a wavelength range (Scan module)
Autozero: Background correction for a single wavelength point (Rate, Fixed, Quant modules)
The Samples option starts a measurement series. The Baseline/Autozero option starts a background correction. You can also activate each option with a function key; the required function key is listed after the option name. Using a function key is often more convenient while performing an analysis in the laboratory.
• Samples/Stop F5 • Baseline/Autozero F6 • Manual Control F4
The respective reactions, settings and procedures are described under the individual modules.
Options Menu The Options menu includes the following:
• Preferences • Manual Control
Preferences Preferences are used to define basic settings of the software, the spectrophotometer and printing. The settings are grouped through tabs.
General Functions
8 VISIONlite Operator’s Manual
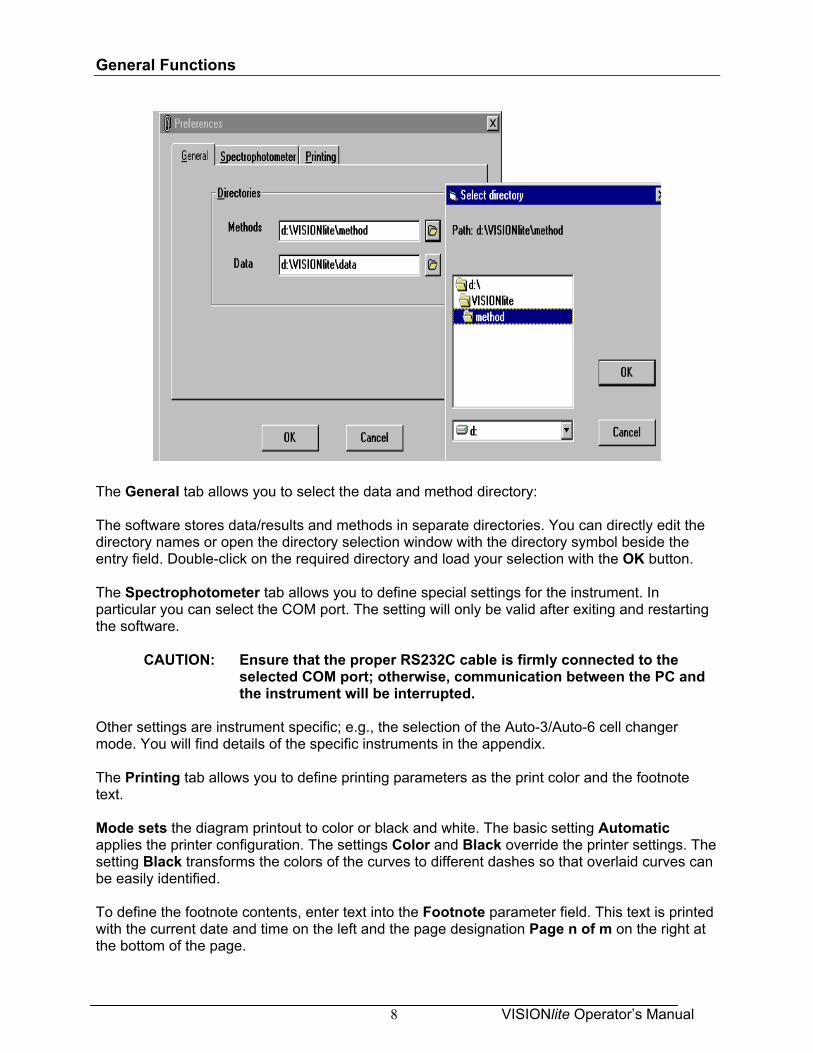
The General tab allows you to select the data and method directory: The software stores data/results and methods in separate directories. You can directly edit the directory names or open the directory selection window with the directory symbol beside the entry field. Double-click on the required directory and load your selection with the OK button. The Spectrophotometer tab allows you to define special settings for the instrument. In particular you can select the COM port. The setting will only be valid after exiting and restarting the software. CAUTION: Ensure that the proper RS232C cable is firmly connected to the
selected COM port; otherwise, communication between the PC and the instrument will be interrupted.
Other settings are instrument specific; e.g., the selection of the Auto-3/Auto-6 cell changer mode. You will find details of the specific instruments in the appendix. The Printing tab allows you to define printing parameters as the print color and the footnote text. Mode sets the diagram printout to color or black and white. The basic setting Automatic applies the printer configuration. The settings Color and Black override the printer settings. The setting Black transforms the colors of the curves to different dashes so that overlaid curves can be easily identified. To define the footnote contents, enter text into the Footnote parameter field. This text is printed with the current date and time on the left and the page designation Page n of m on the right at the bottom of the page.
General Functions
VISIONlite Operator’s Manual 9
Note: All modules share the modifications to the settings. Manual Control Manual Control allows you to drive the instrument to a specific wavelength, to autozero at the selected wavelength and to read the ordinate value from the Live Display. No further measurements, displays or printouts are possible. If an accessory is attached, the control options of this accessory are also displayed, (e.g., driving the cell changer to a position or starting the sipper pump). Note: The spectrophotometer will only execute the wavelength drive or move the cell
changer when the entry has been accepted. This is done by pressing the OK button or by moving to another entry field.
Help Menu The Help menu follows the standard Windows conventions. The Contents command is used to open a comprehensive help system. You operate this help system according to standard Windows conventions. Also use the F1 function key to open the help system with a page that corresponds to the currently active window. The Info command displays information about the software version and copyrights.
Methods Concept Each measurement is performed with defined parameters. These parameter settings are treated as method files. The name of the current method is shown in the method selection box in the “parameter’s area”: You can save and restore methods for your tests. Each module uses a specific method type, which is characterized by its file extension:
• Scan .msc • Rate .mra • Fixed .mfx • Quant .mqa
When a module is used for the first time, the basic method test.mxx is opened. You can modify the settings of the basic method and you can save these settings as the modified basic method. You can also program and save methods under new method names. To save a method, use the Save Method. The method directory as defined in the Preferences command is displayed as the default directory. If you select an existing method filename, an overwrite message will warn you about overwriting the existing method file.
General Functions
10 VISIONlite Operator’s Manual
You may load existing methods in either of 2 ways: • Select a method in the method selection box in the parameter area, • Use Open Method in the File menu.
The method selection box lists all methods of the current method directory as defined by Preferences. Additionally, those methods are listed which were loaded from other directories during the current working session. Select a method by clicking on the highlighted item. Open Method will also allow you to access method files from other directories. After you have done so, the method is also listed in the method selection box during the current session. It will not appear in the list if the software has been closed and restarted.
Measurement Sequence After selection of a method or modification of parameters, you start a measurement with the Measure Samples button in each module. A sample information window is displayed. In this window you enter the characteristics of the sample or sample group to be measured. Then place the sample(s) into the instrument, close the sample compartment cover and press Measure or the Enter key to actually start the instrument data recording. The results are displayed during and after the measurement. After the run, the sample information window is presented again to define the next sample/sample group. Proceed as above or click on the Close button.
Starting a Measurement To perform a measurement, use the Measure Samples button to start the measurement. A sample information window is displayed. If a baseline/autozero run has not yet been executed, you will be requested to insert a blank sample for the first measurement. Alternatively, you can insert the blank sample beforehand and start the baseline/autozero run with the Baseline/Autozero button in the toolbar.
Sample Information Window You define the next sample/sample group (cell changer mode) to be measured in the sample information window. The window contains entry tools as described below. A baseline/autozero run can be defined.
General Functions
VISIONlite Operator’s Manual 11
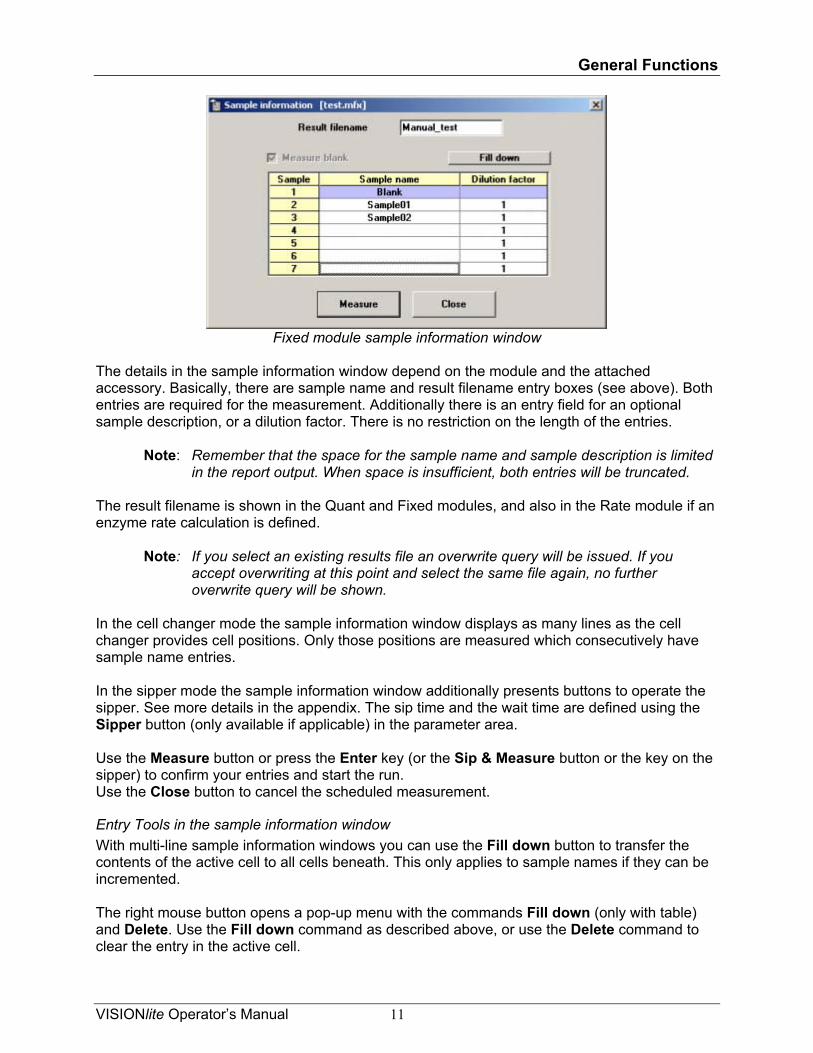
Fixed module sample information window
The details in the sample information window depend on the module and the attached accessory. Basically, there are sample name and result filename entry boxes (see above). Both entries are required for the measurement. Additionally there is an entry field for an optional sample description, or a dilution factor. There is no restriction on the length of the entries. Note: Remember that the space for the sample name and sample description is limited
in the report output. When space is insufficient, both entries will be truncated. The result filename is shown in the Quant and Fixed modules, and also in the Rate module if an enzyme rate calculation is defined. Note: If you select an existing results file an overwrite query will be issued. If you
accept overwriting at this point and select the same file again, no further overwrite query will be shown.
In the cell changer mode the sample information window displays as many lines as the cell changer provides cell positions. Only those positions are measured which consecutively have sample name entries. In the sipper mode the sample information window additionally presents buttons to operate the sipper. See more details in the appendix. The sip time and the wait time are defined using the Sipper button (only available if applicable) in the parameter area. Use the Measure button or press the Enter key (or the Sip & Measure button or the key on the sipper) to confirm your entries and start the run. Use the Close button to cancel the scheduled measurement.
Entry Tools in the sample information window With multi-line sample information windows you can use the Fill down button to transfer the contents of the active cell to all cells beneath. This only applies to sample names if they can be incremented. The right mouse button opens a pop-up menu with the commands Fill down (only with table) and Delete. Use the Fill down command as described above, or use the Delete command to clear the entry in the active cell.
General Functions
12 VISIONlite Operator’s Manual
Baseline/Autozero in the sample information window If no baseline/autozero run has been performed under the current method conditions, you will be requested in the sample information window to do this. The (first) sample name field is designated as Blank. You cannot modify this entry (as shown by the blue field). Insert the cell containing the blank into the instrument and start the run. If a baseline/autozero run has already been performed, it is still possible to repeat this -- and also at any time within a series of samples – by activating the Measure Blank selection box above the table.
Measurement After starting the run, the Stop button is presented so that you can cancel the run at any time. During the run the results are shown in the graphics and/or results area according to the selected module, the selected data evaluation, and the instrument in use.
End of Measurement After the run, the sample information window for the next sample/sample group is presented. Proceed as described above, or stop the measurement series with the Close button. Thereafter you can start another series of measurements or perform the following tasks (depending on the specific module), for example:
• Use the Recalculate button to re-run the enzyme rate calculation with modified parameters.
• Use the graphics window. Among other things you can re-run the peak pick function or export a spectrum.
• Export results as a file for spreadsheet software. If you plan another measurement with similar sample(s) you start the measurement again with the Measure Samples button. If you are using a different solvent or cell type you should perform another autozero/baseline run. If you plan another measurement with a new method, select the new method or modify the parameter settings accordingly. If you want to use another measurement type, you must exit the current software module and open the requested software module.
General Functions
VISIONlite Operator’s Manual 13
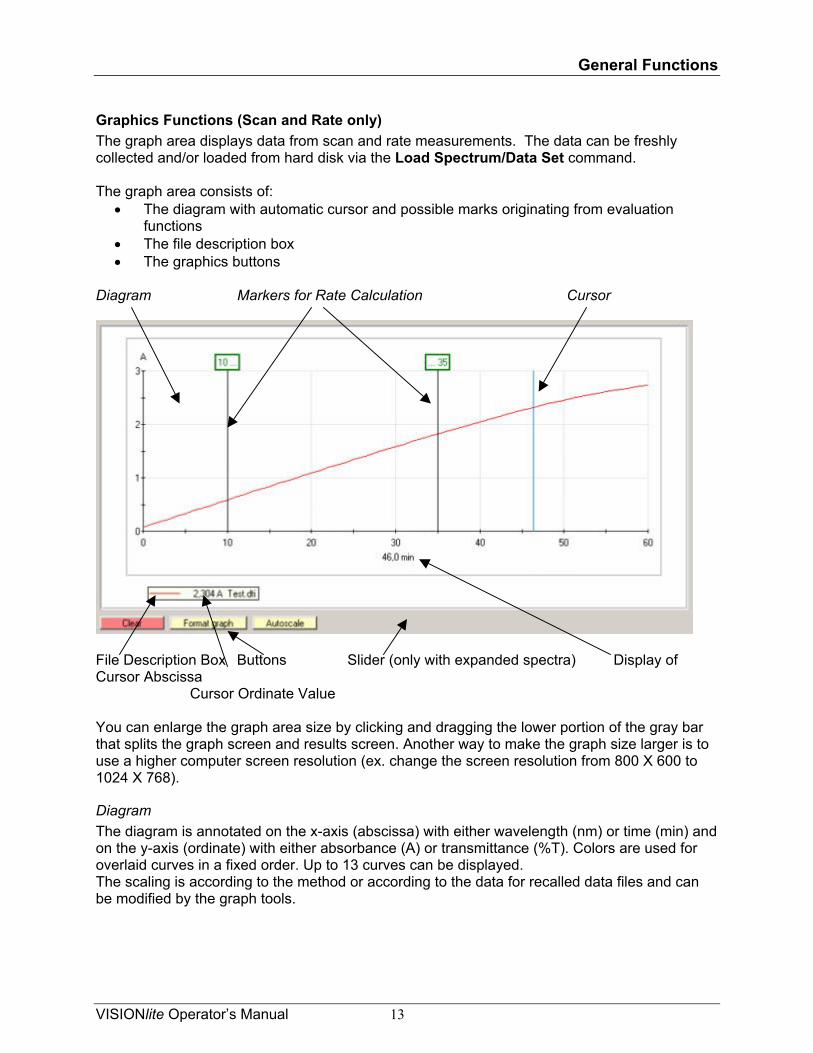
Graphics Functions (Scan and Rate only) The graph area displays data from scan and rate measurements. The data can be freshly collected and/or loaded from hard disk via the Load Spectrum/Data Set command. The graph area consists of:
• The diagram with automatic cursor and possible marks originating from evaluation functions
• The file description box • The graphics buttons
Diagram Markers for Rate Calculation Cursor
File Description Box Buttons Slider (only with expanded spectra) Display of Cursor Abscissa Cursor Ordinate Value You can enlarge the graph area size by clicking and dragging the lower portion of the gray bar that splits the graph screen and results screen. Another way to make the graph size larger is to use a higher computer screen resolution (ex. change the screen resolution from 800 X 600 to 1024 X 768).
Diagram The diagram is annotated on the x-axis (abscissa) with either wavelength (nm) or time (min) and on the y-axis (ordinate) with either absorbance (A) or transmittance (%T). Colors are used for overlaid curves in a fixed order. Up to 13 curves can be displayed. The scaling is according to the method or according to the data for recalled data files and can be modified by the graph tools.
General Functions
14 VISIONlite Operator’s Manual
Expand View As an alternative to expansion via cursor (see below), you can expand any area within the diagram via the mouse and keyboard: Position the mouse pointer at any corner point of the area to be expanded. Then hold the Shift key and drag the mouse pointer with pressed left mouse button over the area to be expanded. The area will be framed. After releasing the mouse button, the framed area will be expanded to the full size of the diagram. If you release the Shift key first, the frame will be removed. Note: Take care not to use the Ctrl key instead of the Shift key.
Cursor Whenever you move the mouse pointer into the diagram, a blue vertical cursor line is added to the diagram, which follows the mouse movement. The current abscissa position of the cursor is displayed below the abscissa axis. At the same time the corresponding ordinate value is added to the file description box. The ordinate value is taken from the nearest measured datum point. Expand View using Cursor (spectra only) An expansion of an abscissa section can be selected via cursor: Position the mouse pointer at the left or right edge of the area to be expanded. Then move the mouse pointer with pressed left mouse button over the area to be expanded. The area will be shown in inverse colors. After releasing the mouse button, the highlighted area will be expanded to the full size of the diagram with unmodified ordinate scaling. A slider is additionally available (see below). To return to default expansion uses the Autoscale button. Note: For the Rate module, the described cursor entry is used to define the abscissa
(time) range for the enzyme rate calculation.
File Description Box The file description box lists all curves currently displayed in the diagram with:
• Color of the curve, • Filename, • Sample description, • Current cursor ordinate value (if cursor active).
If the mouse pointer is moved into the file description box, it changes into a hand symbol. This is to draw your attention to the option to click on a filename. This will open the File Information Window. Note: According to Windows conventions, the mouse pointer does not change its
shape if a menu or a selection list is open.
General Functions
VISIONlite Operator’s Manual 15
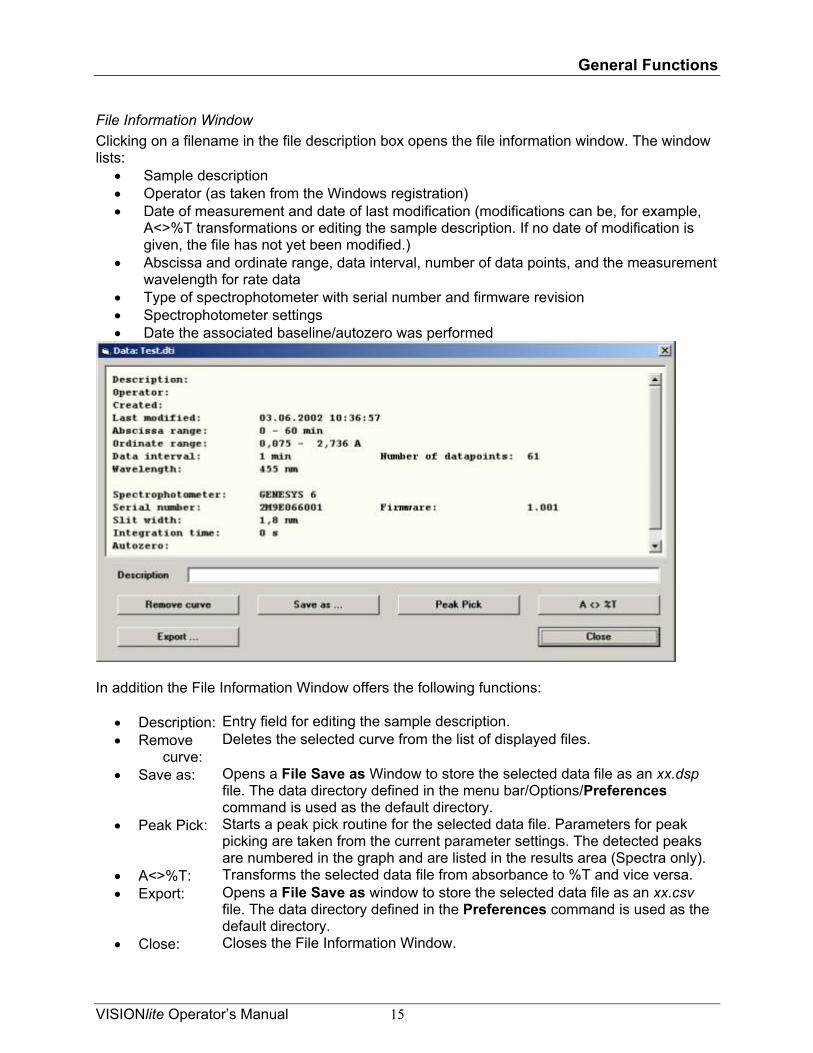
File Information Window Clicking on a filename in the file description box opens the file information window. The window lists:
• Sample description • Operator (as taken from the Windows registration) • Date of measurement and date of last modification (modifications can be, for example,
A<>%T transformations or editing the sample description. If no date of modification is given, the file has not yet been modified.)
• Abscissa and ordinate range, data interval, number of data points, and the measurement wavelength for rate data
• Type of spectrophotometer with serial number and firmware revision • Spectrophotometer settings • Date the associated baseline/autozero was performed
In addition the File Information Window offers the following functions:
• Description: Entry field for editing the sample description. • Remove
curve: Deletes the selected curve from the list of displayed files.
• Save as: Opens a File Save as Window to store the selected data file as an xx.dsp file. The data directory defined in the menu bar/Options/Preferences command is used as the default directory.
• Peak Pick: Starts a peak pick routine for the selected data file. Parameters for peak picking are taken from the current parameter settings. The detected peaks are numbered in the graph and are listed in the results area (Spectra only).
• A<>%T: Transforms the selected data file from absorbance to %T and vice versa. • Export: Opens a File Save as window to store the selected data file as an xx.csv
file. The data directory defined in the Preferences command is used as the default directory.
• Close: Closes the File Information Window.
General Functions
16 VISIONlite Operator’s Manual
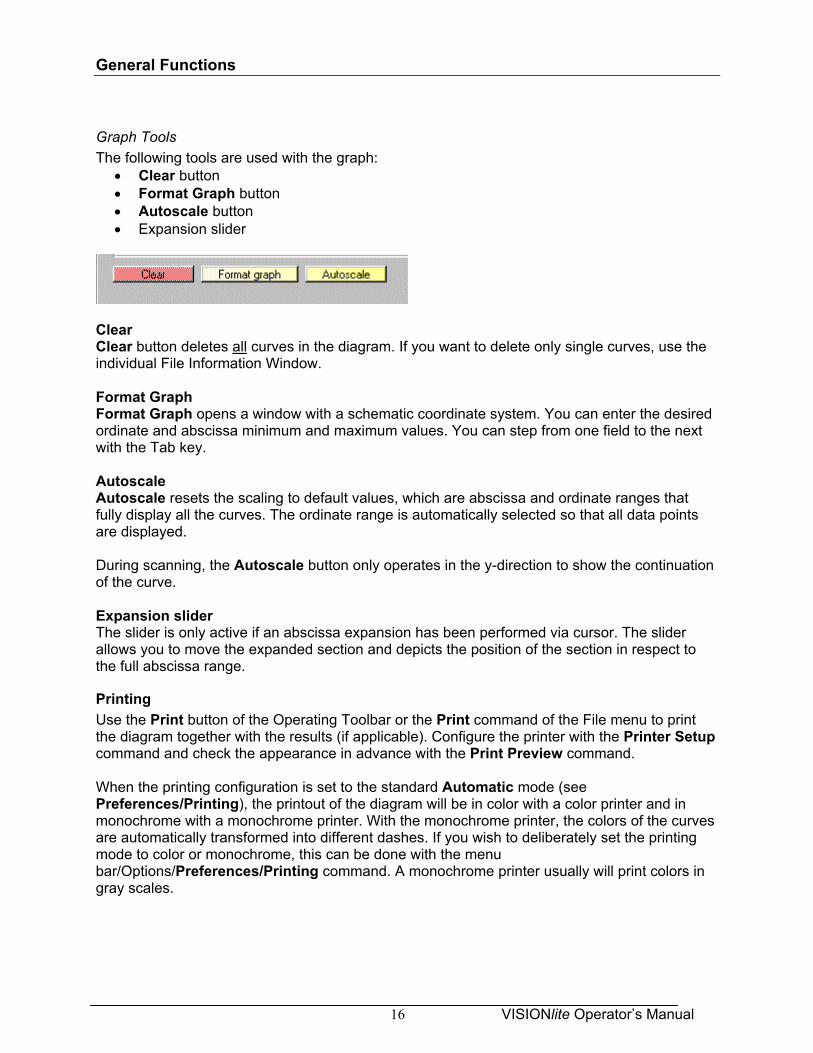
Graph Tools The following tools are used with the graph:
• Clear button • Format Graph button • Autoscale button • Expansion slider
Clear Clear button deletes all curves in the diagram. If you want to delete only single curves, use the individual File Information Window. Format Graph Format Graph opens a window with a schematic coordinate system. You can enter the desired ordinate and abscissa minimum and maximum values. You can step from one field to the next with the Tab key. Autoscale Autoscale resets the scaling to default values, which are abscissa and ordinate ranges that fully display all the curves. The ordinate range is automatically selected so that all data points are displayed. During scanning, the Autoscale button only operates in the y-direction to show the continuation of the curve. Expansion slider The slider is only active if an abscissa expansion has been performed via cursor. The slider allows you to move the expanded section and depicts the position of the section in respect to the full abscissa range.
Printing Use the Print button of the Operating Toolbar or the Print command of the File menu to print the diagram together with the results (if applicable). Configure the printer with the Printer Setup command and check the appearance in advance with the Print Preview command. When the printing configuration is set to the standard Automatic mode (see Preferences/Printing), the printout of the diagram will be in color with a color printer and in monochrome with a monochrome printer. With the monochrome printer, the colors of the curves are automatically transformed into different dashes. If you wish to deliberately set the printing mode to color or monochrome, this can be done with the menu bar/Options/Preferences/Printing command. A monochrome printer usually will print colors in gray scales.
General Functions
VISIONlite Operator’s Manual 17
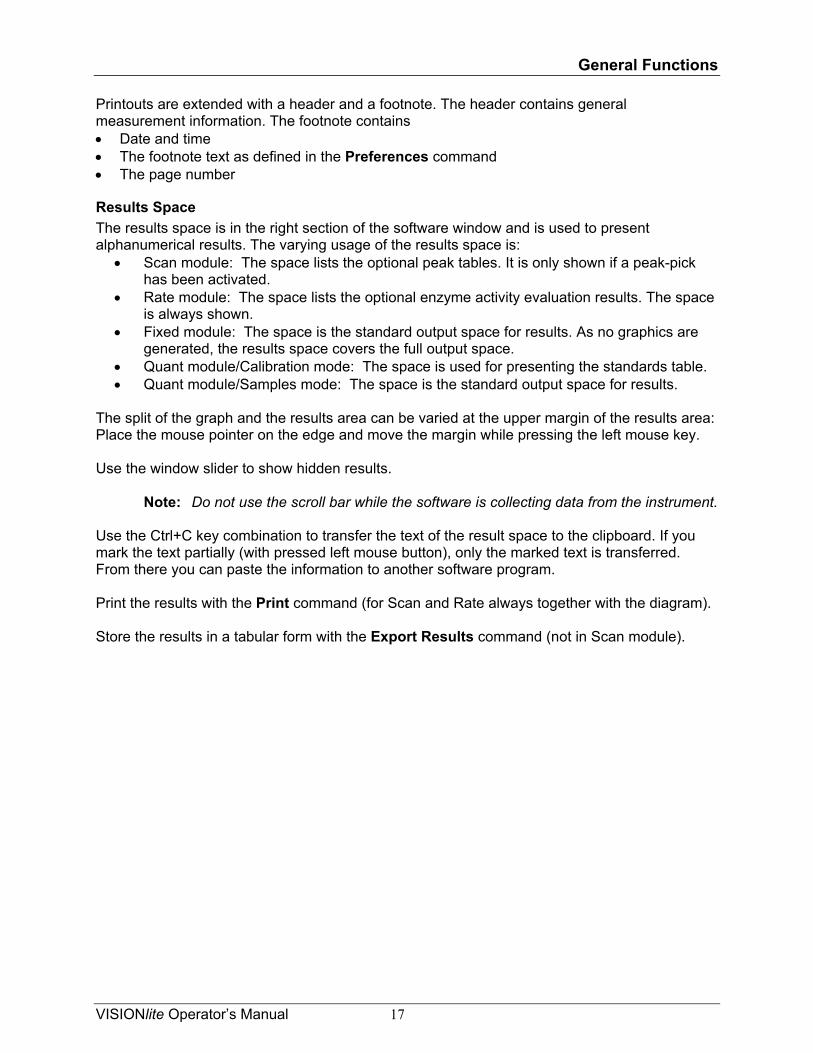
Printouts are extended with a header and a footnote. The header contains general measurement information. The footnote contains • Date and time • The footnote text as defined in the Preferences command • The page number
Results Space The results space is in the right section of the software window and is used to present alphanumerical results. The varying usage of the results space is:
• Scan module: The space lists the optional peak tables. It is only shown if a peak-pick has been activated.
• Rate module: The space lists the optional enzyme activity evaluation results. The space is always shown.
• Fixed module: The space is the standard output space for results. As no graphics are generated, the results space covers the full output space.
• Quant module/Calibration mode: The space is used for presenting the standards table. • Quant module/Samples mode: The space is the standard output space for results.
The split of the graph and the results area can be varied at the upper margin of the results area: Place the mouse pointer on the edge and move the margin while pressing the left mouse key. Use the window slider to show hidden results. Note: Do not use the scroll bar while the software is collecting data from the instrument. Use the Ctrl+C key combination to transfer the text of the result space to the clipboard. If you mark the text partially (with pressed left mouse button), only the marked text is transferred. From there you can paste the information to another software program. Print the results with the Print command (for Scan and Rate always together with the diagram). Store the results in a tabular form with the Export Results command (not in Scan module).
General Functions
18 VISIONlite Operator’s Manual
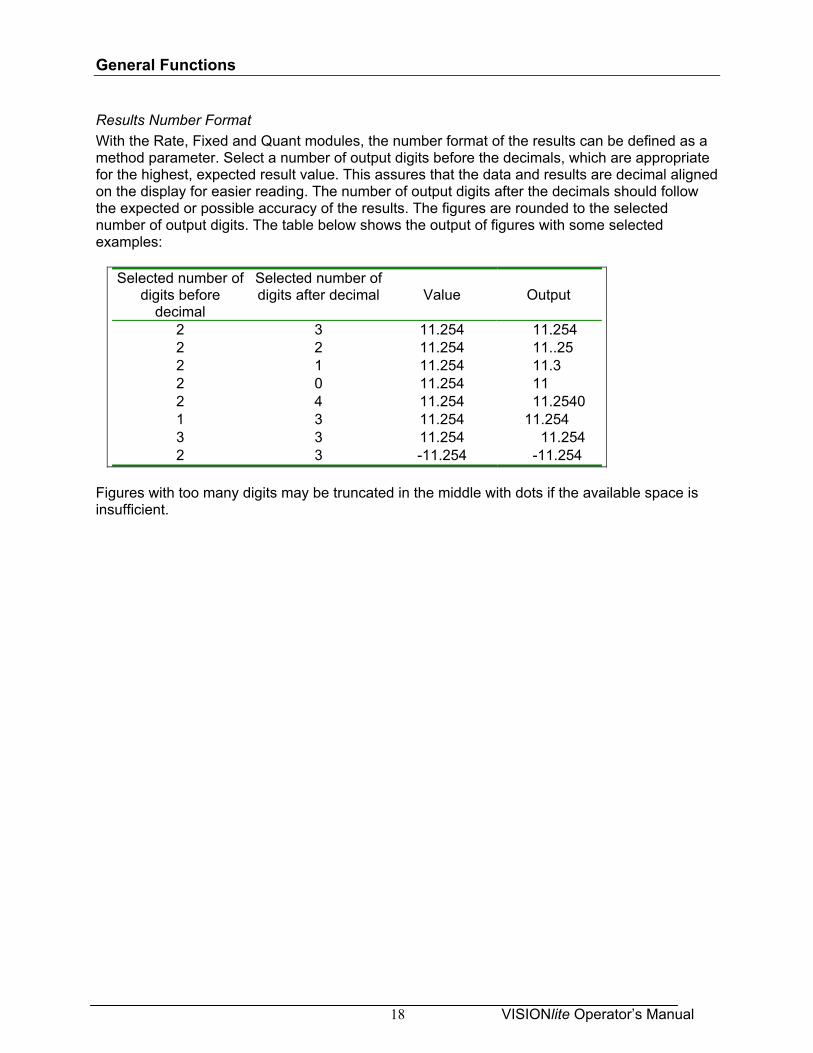
Results Number Format With the Rate, Fixed and Quant modules, the number format of the results can be defined as a method parameter. Select a number of output digits before the decimals, which are appropriate for the highest, expected result value. This assures that the data and results are decimal aligned on the display for easier reading. The number of output digits after the decimals should follow the expected or possible accuracy of the results. The figures are rounded to the selected number of output digits. The table below shows the output of figures with some selected examples:
Selected number of digits before
decimal
Selected number of digits after decimal Value Output
2 3 11.254 11.254 2 2 11.254 11..25 2 1 11.254 11.3 2 0 11.254 11 2 4 11.254 11.2540 1 3 11.254 11.254 3 3 11.254 11.254 2 3 -11.254 -11.254
Figures with too many digits may be truncated in the middle with dots if the available space is insufficient.
Scan Module
VISIONlite Operator’s Manual 19
Scan Module The scan module is used to record sample spectra in a selectable wavelength range and with an optional peak pick. The working range of the spectrophotometer determines the maximum wavelength range. The recorded spectra are automatically saved to disk with the selected sample name as the filename and the extension xx.dsp in the data directory. The parameters are summarized in the following groups:
• Scan • Spectrophotometer • Graph • Peak Pick
For later inspection or evaluation, spectra can be loaded into the graph via the Load Spectrum command.
Scan Parameter Group The entry of Start and End wavelengths (nm) defines the spectral range to be scanned. Additionally you enter the interval (nm) as the data point distance. The defaults and other settings are determined by the capabilities of the spectrophotometer. The wavelength range may automatically be adjusted by the system, if the scan range is not a multiple of the data interval.
Spectrophotometer Parameter Group In the Measurement mode selection box, you select whether data are recorded (and listed) in absorbance (A) or in transmittance (%T). Further entry fields are dependent on the capabilities of the spectrophotometer; e.g., scan speed. When a sipper is attached, a Sipper button opens a sipper parameter window.
Graph Parameter Group You define the graph scaling via the Y-axis minimum and Y-axis maximum entry boxes. Note: Data exceeding the selected range are nevertheless recorded. During and after the measurement you can still adjust the ordinate scaling. The selection buttons Single/Overlay define whether the data are overlaid in the graph or if the graph is cleared for each new curve.
Scan Module
20 VISIONlite Operator’s Manual
Peak Pick Parameter Group In this parameter group, you define if and how a peak pick is executed. If neither of the Maxima or Minima control boxes are activated (you can select one or both options), no peak pick will be performed. However, they can be activated after running the test via the file information window. The Threshold entry box defines the minimum height for a peak or valley to be detected as such. In this way very small peaks due to noise can be eliminated. The value is given in respect to the selected ordinate mode. Note: The Maxima and minima boxes, which checked, activate the Peak Pick button
function I in the file information window). Once the Peak Pick button is checked, the displayed graphs (obtained either by collecting data or loading a spectrum from memory) will include the Peak Pick labels. To turn the Peak Pick off, clear the graphs from the display and deselect the maxima and minima boxes. The next graph displayed will not show the Peak Pick labels.
Measurement To run a measurement, select a stored method or enter new parameters. If you want to use the selected parameter settings for repeated use, save the method via the Save Method command. If a suitable baseline/autozero run has not yet been performed, you may perform a run in advance via the Baseline function or a baseline/auto zero run will automatically be performed when the measure button is pressed. Start the measurement via the Measure Samples button. Enter the sample data to the Sample Information Window and press the Measure button. Terminate the series of measurements with the Close button in the next Sample Information Window. After completing the series of measurements you may:
• Print the diagram with results (if applicable) • Use the graph area. Among other things you can start a new peak pick or export the
spectrum to other software
Rate Module
VISIONlite Operator’s Manual 21
Rate Module The Rate module is used to record time-dependent changes of the sample absorption at a specific wavelength. From this curve, the sample enzyme activity can optionally be calculated via the slope of the curve. The recorded data sets are automatically saved to disk with the selected sample name and the extension xx.dti in the data directory. The optional enzyme activity results are stored under the selected result filename with the extension xx.rra as a result text file. The parameters are summarized in the following groups:
• Rate • Spectrophotometer • Graph • Rate calculation
For later inspection or evaluation, data sets can be loaded into the graph by the Load Data Set command.
Rate Parameter Group The general parameters you enter are the Measurement time (min), the Data interval (s) and the measurement Wavelength (nm). Measurement time and data interval determine the number of data points to be recorded. The minimum data interval is determined by the spectrophotometer. Note: If the selected data interval is too small to measure all samples in cell changer
mode, the lowest possible data interval will be used instead.
Spectrophotometer Parameter Group In the Measurement mode selection box you select whether data are recorded in absorbance (A) or in transmittance (%T). For rate calculation measurements, the data must be in absorbance. Further entry fields are dependent on the capabilities of the spectrophotometer; e.g., scan speed. When the sipper is attached a Sipper button opens a sipper parameter window.
Graph Parameter Group You define the graph scaling via the Y-axis minimum and Y-axis maximum entry boxes. Note: Data exceeding the selected range are nevertheless recorded. You can still adjust the ordinate scaling during and after the measurement.
Rate Module
22 VISIONlite Operator’s Manual
Rate Calculation Parameter Group To calculate the enzyme activity via a zero order rate calculation, the slope of the curve must be determined in the linear section of the curve. The slope is then multiplied by the Enzyme factor to obtain the enzyme activity value. If an enzyme activity evaluation is requested, you enter the enzyme specific Enzyme factor – otherwise the entry field is left blank. The factor is entered as a negative value if absorbance decreases during the run. The linear range of the curve is selected via from and to (min) entry fields. To define the output of results, the number of Output digits before and after the decimals can be selected. Additionally you enter an enzyme Unit or select it from the list of units. To re-calculate the enzyme activity after the measurement, modify the Rate calculation settings and click on the Recalculate button. You can alternatively enter the values for the From and To entry fields by dragging the cursor with pressed left mouse key from the desired start to the end time of evaluation.
Measurement To run a measurement, select a stored method or enter new parameters. If you want to use the selected parameter settings for repeated use, save the method with the Save Method command. If a suitable autozero run has not yet been performed, perform a run in advance via the Autozero function. Alternately you will be requested to perform an autozero run in the Sample Information Window. Start the measurement with the Measure Samples button. Enter the sample data to the Sample Information Window and press the Measure button. Note: If you select an existing result filename an overwrite query will be issued. If you
accept overwriting at this point and select the same filename again, no further overwrite query will be shown.
Note: During measurement all menu and button functions (except for the Autoscale
button) are locked in order to maintain correct measurement timing. Terminate the series of measurements with the Close button in the next Sample Information Window. Note: Enzyme activity is calculated for up to 100 runs recorded in a series. If a data set
is loaded from disk however only the data shown in the graph are evaluated. After completing the series of measurements you may:
• Print the diagram with results (if applicable) • Recalculate the enzyme activity: modify the Rate calculation settings and click on the
Recalculate button. The results space is cleared and rewritten • Use the graph area. For example, start a new peak pick or export the spectrum into
other software. • Export the optional results with the Export results command for use with other software.
Fixed Module
VISIONlite Operator’s Manual 23
Fixed Module The Fixed module is used to record sample absorption at single wavelengths. The data can be processed by means of simple functions (difference or ratio). The recorded readings and results are automatically saved to disk under the selected result filename with the extension xx.rfx as a text file in the data directory. The parameters are summarized in the following groups:
• Test • Spectrophotometer
For later inspection or evaluation, data sets can be loaded into the Print Preview window via the Load Results command.
Test Parameter Group In this parameter group, you enter the measurement wavelengths into a table and select the Mode. If no calculations are required, set the Mode to Wavelength(s). In this mode you can enter up to 31 wavelength values (less for some models), which are measured automatically in sequence. Further Mode options are:
• Wavelength difference f1 • WL1 – f2 • WL2 • Wavelength difference with reference
(wavelength) f1 • (WL1 – RefWL) – f2 • (WL2–RefWL)
• Wavelength ratio f1 • WL1 / WL2 • Wavelength ratio with reference (wavelength) f1 • (WL1 – RefWL) / (WL2 – RefWL)
In these modes you can enter 2 or 3 wavelengths into the table, which are designated as WL1, WL2 and RefWL. In addition you can enter factors f1 and f2, which extend the difference or ratio calculations as listed above. If no factors are required, enter a value of 1. To define the output of results the number of Output digits before and after the decimals can be selected. You can enter the Unit or select it from the list of units.
Spectrophotometer Parameter Group In the Measurement mode selection box you select whether data are recorded in absorbance (A) or in transmittance (%T). Further entry fields are dependant on the spectrophotometer capabilities, e.g. integration time. When the sipper is attached a Sipper button opens a sipper parameter window.
Fixed Module
24 VISIONlite Operator’s Manual
Measurement To run a measurement, select a stored method or enter new parameters. If you want to use the selected parameter settings for repeated use, save the method via the Save Method command. If a suitable autozero run has not yet been performed, perform a run in advance via the Autozero function. Alternately you will be requested to perform an autozero run in the Sample Information Window. Start the measurement via the Measure Samples button. Enter the sample data to the Sample Information Window and press the Measure button. Note: The Dilution Factor entry is not applicable to the Wavelength(s) Mode. Note: If you select an existing result filename an overwrite message will be displayed. If
you accept overwriting at this point and select the same filename again, no further overwrite message will be shown.
Terminate the series of measurements with the Close button in the next Sample Information Window. After completing the series of measurements you may:
• Print the results • Export the results with the Export results command for use with other software.
Quant Module
VISIONlite Operator’s Manual 25
Quant Module The Quant module is used to quantify analytes according to the Beer-Lambert law. The procedure includes the calibration of the analysis, either by entering a known calibration factor or by measuring a series of standards. Measuring a series of standards generates a calibration function. Once the calibration function has been generated, it can be used for repeated measurements with optional re-calibration. The default method “test” does not include a calibration. The recorded readings and results are automatically saved to disk under the selected result filename with the extension xx.rqa as a text file in the data directory. The parameters are summarized in the following groups:
• Calibration • Spectrophotometer
For later inspection or evaluation, results can be loaded into the Print Preview window via the Load Results command.
Samples and Calibration Mode The Quant module operates in 2 modes: Calibration mode: You use this mode to enter all basic parameters and the calibration
data. You can either enter the calibration factor (if known) or measure a series of standards to determine the calibration function. Once calibration has been performed, switch to the sample mode with the Go to Samples Mode button.
Samples Mode: You use this mode to measure the samples and generate the concentration results. The measurement and calibration parameters cannot be modified. However, it is possible to switch back to the calibration mode by clicking on the Go to Calibration Mode button.
Calibration Parameter Group The basic settings are defined in the Calibration parameter group:
• Curve type, i.e. calibration factor or one of 4 calibration functions • Measurement Wavelength • Number of Output digits before and after the decimals for displaying the samples
concentration results • Unit of standards and samples. You can enter the Unit or select it from the list of units • Numerical value of the Calibration factor, if applicable
If you enter the calibration factor (F = c / A; c = F • A), no calibration measurements are required. The Measure Standards button is then inactive and you can immediately switch to the samples mode. Alternately you select one of the 4 calibration functions:
• Linear through Zero (min. 1 standard) • Linear with Intercept (min. 2 standards) • Quadratic through Zero (min. 2 standards) • Quadratic with Intercept (min. 3 standards)
Quant Module
26 VISIONlite Operator’s Manual
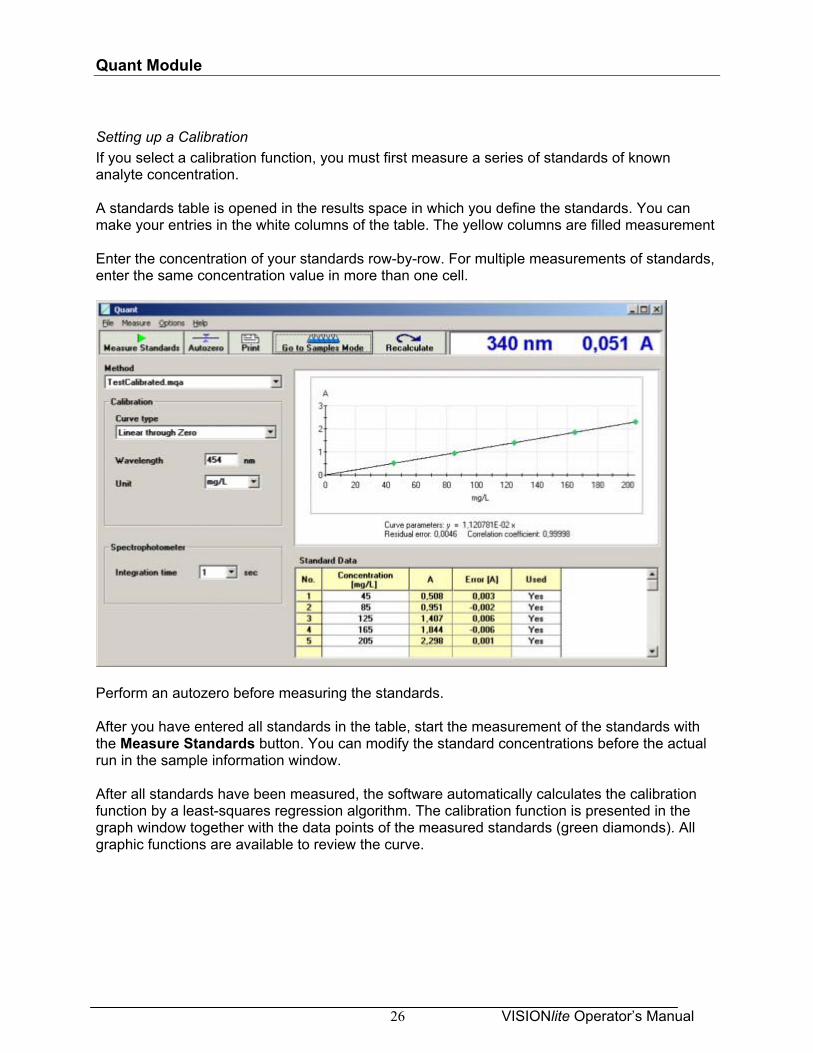
Setting up a Calibration If you select a calibration function, you must first measure a series of standards of known analyte concentration. A standards table is opened in the results space in which you define the standards. You can make your entries in the white columns of the table. The yellow columns are filled measurement Enter the concentration of your standards row-by-row. For multiple measurements of standards, enter the same concentration value in more than one cell.
Perform an autozero before measuring the standards. After you have entered all standards in the table, start the measurement of the standards with the Measure Standards button. You can modify the standard concentrations before the actual run in the sample information window. After all standards have been measured, the software automatically calculates the calibration function by a least-squares regression algorithm. The calibration function is presented in the graph window together with the data points of the measured standards (green diamonds). All graphic functions are available to review the curve.
Quant Module
VISIONlite Operator’s Manual 27
In addition the following coefficients are given: • The mathematical function of the calibration curve with its calibration coefficients. • The residual error of the curve fit. The value should be near zero (typically <0.01). • The correlation coefficient of the fit. The value should be close to 1 (typically >0.99).
Warning: If you change the measurement wavelength during or after calibration,
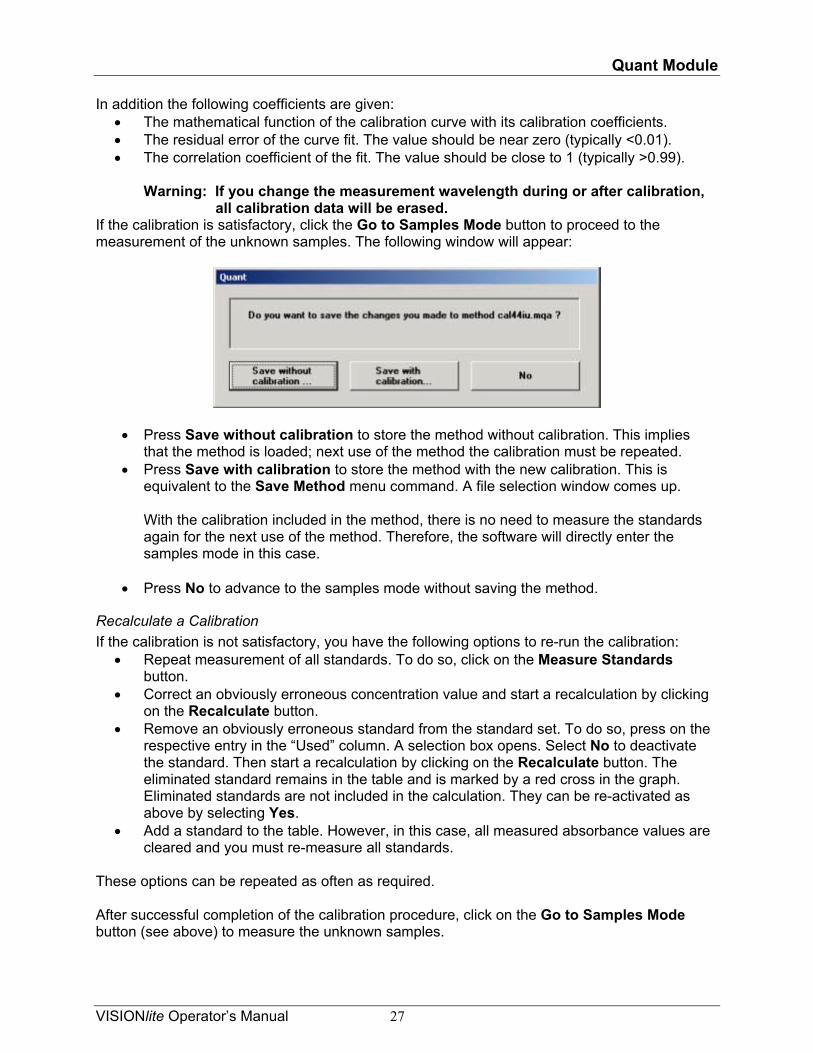
all calibration data will be erased. If the calibration is satisfactory, click the Go to Samples Mode button to proceed to the measurement of the unknown samples. The following window will appear:
• Press Save without calibration to store the method without calibration. This implies that the method is loaded; next use of the method the calibration must be repeated.
• Press Save with calibration to store the method with the new calibration. This is equivalent to the Save Method menu command. A file selection window comes up. With the calibration included in the method, there is no need to measure the standards again for the next use of the method. Therefore, the software will directly enter the samples mode in this case.
• Press No to advance to the samples mode without saving the method.
Recalculate a Calibration If the calibration is not satisfactory, you have the following options to re-run the calibration:
• Repeat measurement of all standards. To do so, click on the Measure Standards button.
• Correct an obviously erroneous concentration value and start a recalculation by clicking on the Recalculate button.
• Remove an obviously erroneous standard from the standard set. To do so, press on the respective entry in the “Used” column. A selection box opens. Select No to deactivate the standard. Then start a recalculation by clicking on the Recalculate button. The eliminated standard remains in the table and is marked by a red cross in the graph. Eliminated standards are not included in the calculation. They can be re-activated as above by selecting Yes.
• Add a standard to the table. However, in this case, all measured absorbance values are cleared and you must re-measure all standards.
These options can be repeated as often as required. After successful completion of the calibration procedure, click on the Go to Samples Mode button (see above) to measure the unknown samples.
Quant Module
28 VISIONlite Operator’s Manual
Spectrophotometer Parameter Group Parameters in the spectrophotometer group are dependant on the capabilities of the spectrophotometer; e.g., integration time. All measurements are performed in absorbance. When a sipper is attached, a Sipper button opens a sipper parameter window.
Measurement To run a measurement, select a stored method or enter new parameters by changing to the calibration mode. If you want to use the selected parameter settings for repeated use, save the method via the Save Method command. If a suitable baseline/autozero run has not yet been performed, perform a run in advance via the Autozero function. Alternately, it will automatically perform a baseline/autozero run in the Sample Information Window. Start the measurement via the Measure Samples button. Enter the sample data to the Sample Information Window and press the Measure button. Note: If you select an existing result filename an overwrite query will be issued. If you
accept overwriting at this point and select the same filename again, no further overwrite query will be shown.
Terminate the series of measurements with the Close button in the next Sample Information Window. After the series of measurements you can:
• Print the results together with calibration graph or transfer results via clipboard • Export the results via the Export results menu command for use with other software.
Appendix
VISIONlite Operator’s Manual 29
Appendix
Information for Specific Spectrophotometer Models
GENESYS 6, 10,20, BioMate 3 These spectrophotometers are recording split-beam instruments. Note: The instrument keyboard cannot be switched off. As long as the instrument is
under PC control, the instrument keyboard should not be used. Otherwise, system crashes and erroneous data may result.
Error Messages When you start the software and the instrument is not connected to the proper COM port or is not yet switched on, or is already in the initialization phase, an error message will appear. Display and Standby When no measurements are being performed, the instrument display blinks. This is due to the continuous communication between the PC and the spectrophotometer to keep the Live Display running and is no indication of possible malfunctioning. If the instrument is configured with a lamp saving standby time, and if no measurements are done for 5 minutes, the software will quit the communication. After the selected standby time then the instrument itself then will go into the standby mode and will shut down the lamp. During spectrum scanning, the instrument display is blank. Also, the software Live Display and the graph remain blank since the data are transferred to the software only when the scan is finished. The blinking Stop button, however, shows that the measurement is running. After the end of the scan, the graph is displayed and the Live Display is reactivated. Autozero/Baseline An autozero run is required whenever the scan range or the data interval or wavelength is changed. Specific Parameters The scan speed of GENESYS 6 is selected in three levels. With a 1nm data interval these levels correspond to:
• Slow approx. 100 nm/min • Medium approx. 200 nm/min • Fast approx. 400 nm/min
The other models of this group do not offer a choice of scan speeds. A scan must cover at least 5 data points. Cell Changer These modules can use a 6-cell changer. The first position of the cell changer B is reserved solely for the blank and cannot be used for sample measurements. An autozero is always performed at this position. An alternative cell holder (Auto-3) is offered to permit the use of long-path cells. You can define use of this holder using the menu bar/Options/Preferences/Spectrophotometer command. This setting is valid for all modules.
Appendix
30 VISIONlite Operator’s Manual
Note: After installing or removing the cell changer, it is necessary to restart the
software so that the new configuration can be detected.
GENESYS 20, Helios ε GENESYS 20 and compatibles are non-scanning, single-beam spectrophotometers. With the VISIONlite software, scanning and multi-wavelength measurements are made possible. However some limitations occur: Note: Scanning data should only be used to detect peak positions. When performing Fixed and Rate Measurements; an autozero should be done immediately before the measurement is started. Note: The instrument and the software displays may display different photometric
values. This is because the instrument display presents uncorrected values, whereas the software display presents corrected readings if possible.
Error Messages When you start the software, an error message Instrument offline will be displayed if the instrument has not finalized its initialization. Baseline/Autozero As non-scanning instruments, these units do not perform an automatic scan or store baseline correction data. Therefore, the software must drive the instrument to each data collection point individually. The scan speed is approx. 40 nm/min at a 1nm data interval. Smaller intervals are not reasonable since the spectral bandpass (8nm) is distinctly larger. For baseline correction, the software actuates an autozero at the scan start wavelength and then collects the correction data. With a larger scan range, it may be possible that the dynamic range is exceeded. If so, the entire correction run is repeated. Possible instrument error messages due to low signals are ignored. During the autozero run, only the wavelength is shown in the Live Display. Scanning Data can become unreliable at larger signal differences in the scan range. Therefore it is recommended to scan only smaller ranges; i.e., 100nm.
UV 1, Helios α, ß, γ,-δ, BioMate 5, AquaMate These units are scanning double-beam instruments for the UV/Vis or Vis ranges. They can be equipped with a 7-cell changer and/or a Sipper. Important: For establishing communication between software and instrument, it is necessary
to switch the instrument to REMOTE mode. You do this by pressing the REMOTE key at the spectrophotometer (right-hand key under the software-defined keys). If the instrument is not in REMOTE mode, the software will present the error message “No response from instrument”.
Appendix
VISIONlite Operator’s Manual 31
During REMOTE mode, the keyboard is locked and the instrument’s LC display only indicates REMOTE mode operation. To switch back to normal instrument operation, first exit the software and then press the Home key. Note: After installing or removing an accessory, it is necessary to restart the software
so that the new configuration is detected.
Note: During measurements, the sample compartment cover must not be opened. Otherwise the communication will be interrupted with an error message.
Error Messages When starting the software during initialization, the error message “Instrument is initializing please wait” is presented. If a measurement has been interrupted, an immediate start of a new measurement will return an instrument error. This error reports that the instrument is still busy. Specific Parameters UV 1 and compatibles allow a number of further settings compared to the other models. For measurements at fixed wavelengths (Rate, Fixed and Quant modules) an integration time can be entered. This entry determines the time over which the signal is averaged to improve its signal-to-noise ratio. High integration times however increase the measurement time. Especially when using the cell changer the measurement time is substantially increased. The Preferences command allows you to switch the light sources with UV 1 and compatibles. An entry in any one module applies to all other modules. If, however, a specific light source is required for a measurement, the necessary source is switched on automatically. Scan speeds can be selected up to 3800nm/min. If a fast scan speed has been selected together with a smaller data interval, an appropriate slower scan speed is used automatically. A scan speed of 0nm/min can also be selected. This setting corresponds to the IntelliScan mode, where the scan speed is automatically optimized to maintain a constant noise ratio. The spectral bandpass may be selected in the Preferences (instrument limited). The setting is included as a method parameter. The Fixed mode allows you to enter up to 20 single wavelengths.
Appendix
32 VISIONlite Operator’s Manual
Sipper Accessory for UV 1 and Compatibles The instrument series can be equipped with a sipper accessory, which includes a peristaltic pump and a flow-through cell. The sipper increases the sample throughput by automated sample aspiration. A number of additional parameter settings are relevant to sipper operation:
• Manual Control, the sipper can pump in both directions (sample delivery and return). To stop pumping, press on the red Stop button.
• Each module displays an additional Sipper button in the Spectrophotometer parameter group. Clicking on this button opens a sipper definition window, where you enter the aspiration volume and the wait time. The wait time is a short time interval between sampling and measuring to allow the flow to settle and bubbles to rise. The settings are stored with the method.
The default aspiration volume setting is 1 mL. This volume is an approximate value. To have an exact value for critical samples, you can calibrate the aspiration volume via the basic spectrophotometer functions.
• The Sip & Measure button of the sample information window is designed for routine measurements. Clicking on this button aspirates the sample for the selected time, waits for the delay time and then automatically measures the sample. The hardware button on the sipper performs the same function.
• Alternatively, you may use the Sip button of the sample information window. Aspirate the sample as long as required and stop the aspiration by pressing the red Stop button. Then use the Measure button to start the measurement separately.
File Extensions Various file types are generated and used by the software. The three-character file extensions allow you to distinguish the various file types. The file names can be of any length. All data and results files are contained in the data directory, while all method files are contained in the methods directory.
Scan Method Files xx.msc Rate Method Files xx.mra Fixed Method Files xx.mfx Quant Method Files xx.mqa Scan Files (Spectrum) xx.dsp Rate Files xx.dti Rate Results Files xx.rra Fixed Results Files xx.rfx Quant Results Files xx.rqa Export Results Files xx.csv (Scan and Rate data sets; Rate, Fixed and Quant results)
Problem Solving Error Messages Error messages generally are self-explanatory and given in English. The complier can generate the following messages: Error message: Instrument offline.
Appendix
VISIONlite Operator’s Manual 33
Instrument not switched on; not in remote mode or at initialization. Cable to PC is not securely connected to the correct port.
Error message: Path/File access error.
File probably write-protected. Error message: Internal error retrieving device control block for the port (cmdsend).
PC probably was in stand-by mode before. Error message: Error accessing the spectrophotometer via com port n: port already open. Probably another module already has communication with spectrophotometer. Error message: Error communicating with the spectrometer …………… Command error ………
Be sure that the spectrophotometer is on its main menu screen. Error may occur with some units, if the instrument is not switched to the main menu screen (ATC mode). RS232C Cables PC-Spectrophotometer GENESYS 6/10/20, Helios epsilon, BioMate 3: 1:1, 9-pin female/9-pin female part # 335942 UV 1, Helios alpha-delta, BioMate 5, AquaMate: Null Modem, 9-pin female/9-pin
female, part #. 4013 172 82111 Precision of calculations The software performs all calculations with high precision with data as recorded from the spectrophotometer. For presentation, data and results are shown as rounded figures with a limited number of decimals. In some cases, therefore, there may be deviation of the results shown to those results calculated with the presented data. The number of decimals for the results may be defined in the method. Note: Data are generally presented with 4 significant figures, i.e., 3 figures after the
decimal for A (absorbance) data and 1 figure after the decimal point for %T (%transmittance data. It can however be selected to show all data with an additional figure. Edit the “ascapp.ini” file in the program directory and add “ordplus” as the option for the Config Options parameter in the Configuration section.
Component No.: 335993-10063, Rev. A, 09/02 Item No.: 335993-10001
THERMO SPECTRONIC (North America) 820 Linden Avenue, Rochester, NY 14625, USA Telephone: (800) 654-9955 or (585) 248-4000 Fax: (585) 248-4200 E-Mail: [email protected] Web Site: www.thermospectronic.com
THERMO SPECTRONIC (Europe) Mercers Row, Cambridge CB5 8HY, UK Telephone: Int +44 (0) 1223 446655 Fax: Int +44 (0) 1223 446644 E-Mail: [email protected] Web Site: www.thermospectronic.com
THERMO SPECTRONIC (Asia Pacific, Middle East, Africa, India and Latin America) Contact Rochester, New York, USA SPECTRONIC is a registered trademark of Thermo Spectronic. GENESYS and BioMate are trademarks of Thermo Spectronic. Thermo Spectronic is an ISO Systems Certified Company.