Embed Size (px)
Citation preview
1
A Force for GoodThe Most Responsible and Profitable
Investment Holding/Management
Company in the Caribbean Basin
Vision Statement
32
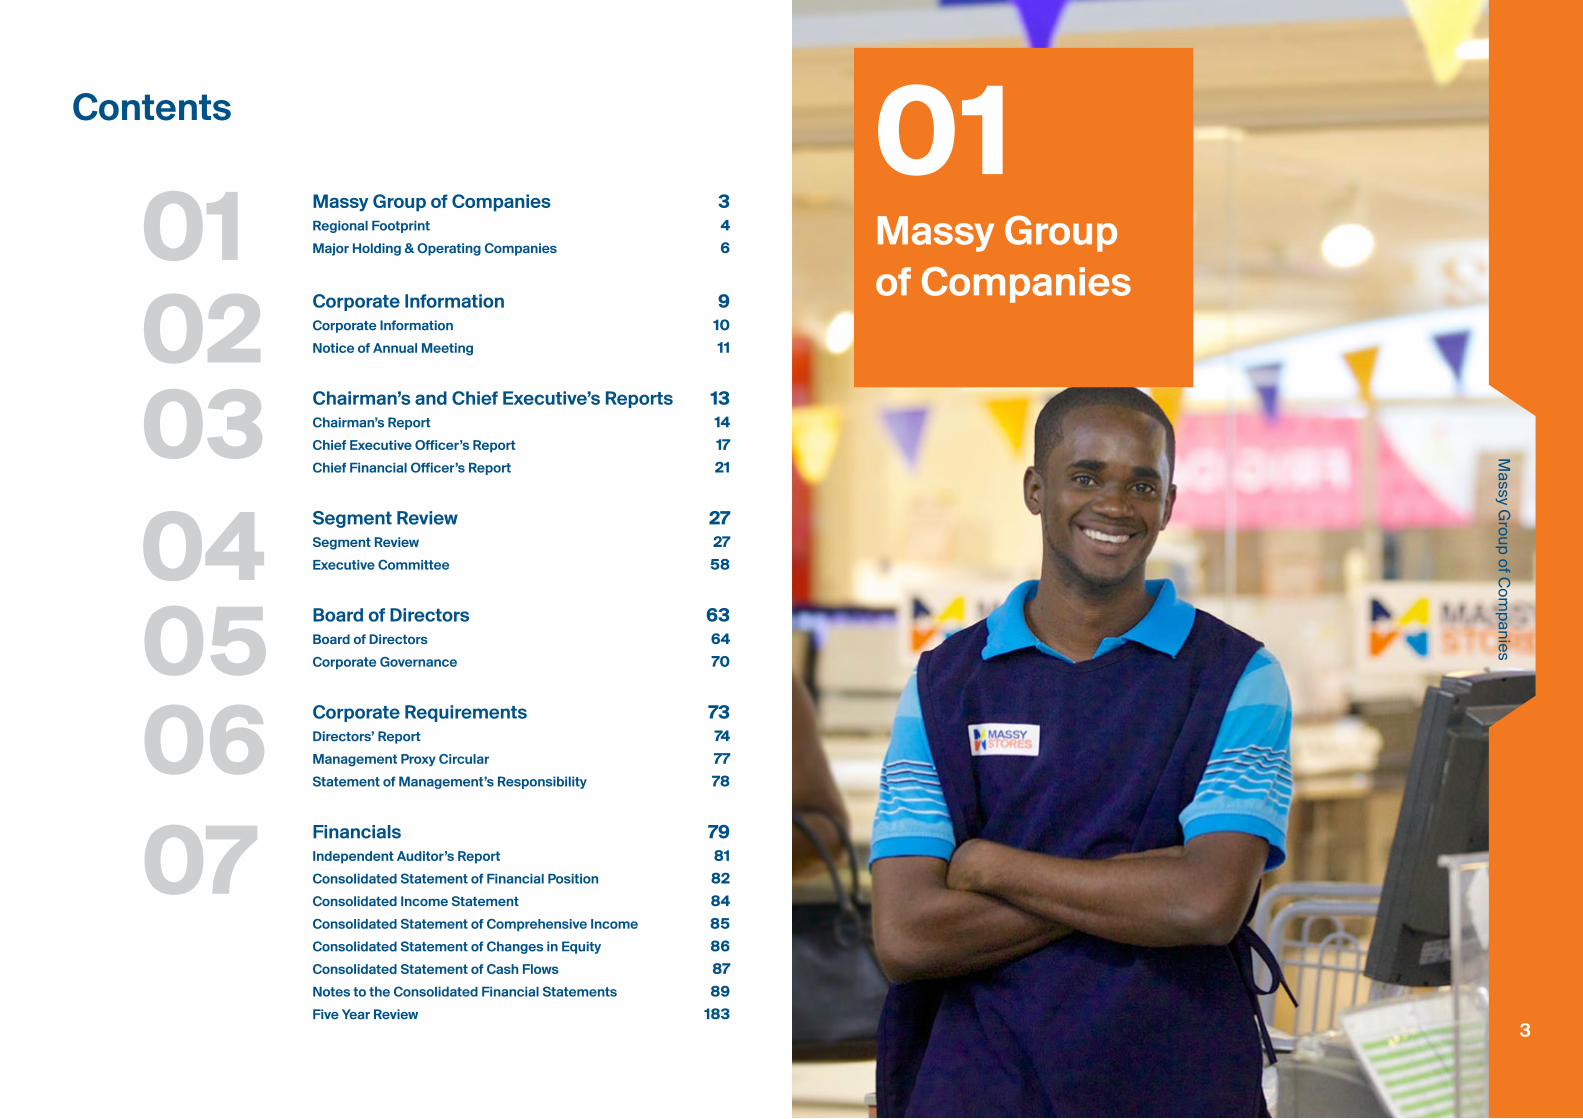
Massy Group of Companies 3
Regional Footprint 4 Major Holding & Operating Companies 6
Corporate Information 9Corporate Information 10 Notice of Annual Meeting 11
Chairman’s and Chief Executive’s Reports 13
Chairman’s Report 14 Chief Executive Officer’s Report 17 Chief Financial Officer’s Report 21
Segment Review 27Segment Review 27 Executive Committee 58
Board of Directors 63Board of Directors 64 Corporate Governance 70
Corporate Requirements 73Directors’ Report 74 Management Proxy Circular 77 Statement of Management’s Responsibility 78
Financials 79Independent Auditor’s Report 81 Consolidated Statement of Financial Position 82 Consolidated Income Statement 84 Consolidated Statement of Comprehensive Income 85 Consolidated Statement of Changes in Equity 86 Consolidated Statement of Cash Flows 87 Notes to the Consolidated Financial Statements 89Five Year Review 183
Contents
01020304050607
Massy Group of Companies
Massy G
roup of Com
panies
3
01
54
BARBADOS
TRINIDAD & TOBAGO
GUYANA
ANTIGUA
ST LUCIA
CURACAO
ST VINCENT
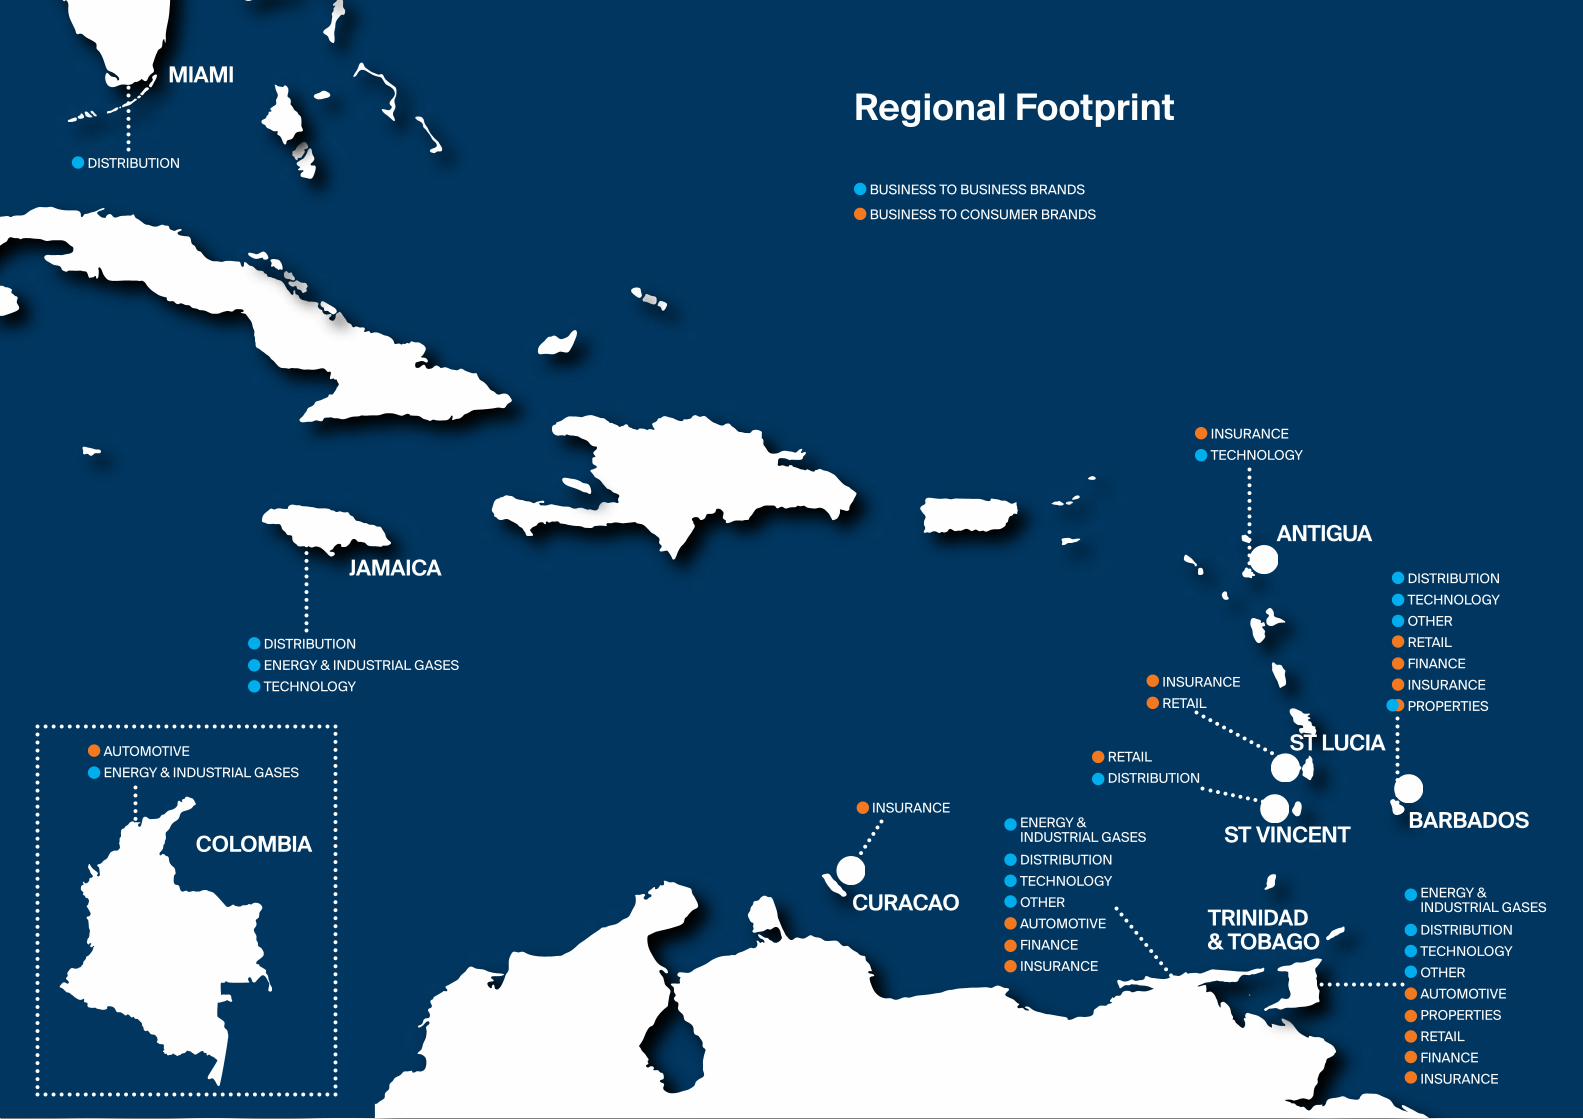
BUSINESS TO BUSINESS BRANDS
BUSINESS TO CONSUMER BRANDS
Regional Footprint
INSURANCE
TECHNOLOGY
INSURANCE
RETAIL
DISTRIBUTION
TECHNOLOGY
OTHER
RETAIL
FINANCE
INSURANCE
PROPERTIES
ENERGY & INDUSTRIAL GASES
DISTRIBUTION
TECHNOLOGY
OTHER
AUTOMOTIVE
PROPERTIES
RETAIL
FINANCE
INSURANCE
ENERGY & INDUSTRIAL GASES
DISTRIBUTION
TECHNOLOGY
OTHER
AUTOMOTIVE
FINANCE
INSURANCE
MIAMI
JAMAICA
COLOMBIA
DISTRIBUTION
DISTRIBUTION
ENERGY & INDUSTRIAL GASES
TECHNOLOGY
AUTOMOTIVE
ENERGY & INDUSTRIAL GASESRETAIL
DISTRIBUTION
INSURANCE

76
COLOMBIA
Massy Energy Colombia
SURINAME
NM Kersten Energy N.V. (Suriname)
INTEGRATED RETAIL
TRINIDAD
Massy Stores (Trinidad)
Massy Distribution (Trinidad)
- Massy Distribution
- Massy Trading
Massy Finance GFC Ltd.
Massy Remittance Services (Trinidad) Ltd., representing the
MoneyGram Franchise
Massy Card Ltd.
Massy Credit Plus Ltd.
BARBADOS
Massy Stores (Barbados) Ltd.
Massy Distribution (Barbados) Ltd.
Massy Shipping Services (Barbados) Ltd.
GUYANA
Massy Distribution Guyana Inc.
- Massy Distribution
- Massy Trading
ST. LUCIA
Consolidated Foods Ltd. (St. Lucia)
Massy Distribution (St. Lucia) Ltd.
ST. VINCENT
Consolidated Foods Ltd. (St. Vincent)
JAMAICA
Massy Distribution (Jamaica) Limited
Major Holding & Operating Companies
Massy Holdings Ltd.
Massy Ltd.
The Massy Foundation
AUTOMOTIVE & INDUSTRIAL EQUIPMENT
TRINIDAD & TOBAGO
Massy Machinery Ltd.
Massy Motors Ltd.
Massy Motors (Tobago) Ltd.
Massy Motors Automotive Components Ltd.
Massy Pres-T-Con Ltd.
GUYANA
Massy Industries (Guyana) Ltd.
COLOMBIA
Massy Delima Grupo Automotriz S.A.S.
ENERGY & INDUSTRIAL GASES
TRINIDAD
Massy Energy (Trinidad) Ltd.
Massy Energy Engineered Solutions Ltd.
Massy Energy Fabric Maintenance Ltd.
Massy Energy Production Resources Ltd.
Massy Energy Investments Ltd.
Massy Energy Supply Chain Solutions Ltd.
Massy Wood Group Ltd.
Massy Gas Products Holdings Ltd.
Massy Gas Products Ltd.
Massy Gas Products (Trinidad) Ltd.
Massy Petrochemicals Services Ltd.
Massy Gas Products Investments Ltd.
Massy Gas Products Operations Ltd.
Massy Carbonics Ltd.
Caribbean Gas Chemicals Company Ltd.
GUYANA
Massy Gas Products (Guyana) Ltd.
JAMAICA
Massy Gas Products (Jamaica) Limited
01INSURANCE
Massy United Insurance Ltd.
INFORMATION, TECHNOLOGY &
COMMUNICATIONS
TRINIDAD
Massy Technologies (Trinidad) Ltd. (Holding company)
Massy Technologies InfoCom (Trinidad) Ltd.
Massy Technologies Applied Imaging (Trinidad) Ltd.
Massy Communications Ltd.
BARBADOS
Massy Technologies InfoCom (Barbados) Ltd.
Massy Technologies InfoCom (Caribbean) Ltd.
GUYANA
Massy Technologies InfoCom (Guyana) Ltd.
JAMAICA
Massy Technologies InfoCom (Jamaica) Limited
Massy Technologies Applies Imaging (Jamaica) Limited
ANTIGUA
Massy Technologies InfoCom (Antigua) Ltd.
OTHER INVESTMENTS
TRINIDAD
Massy Properties (Trinidad) Ltd.
Massy Realty (Trinidad) Ltd.
BARBADOS
Massy Realty (Barbados) Ltd.

98
02CorporateInformation
Corporate Inform
ation
9
1110
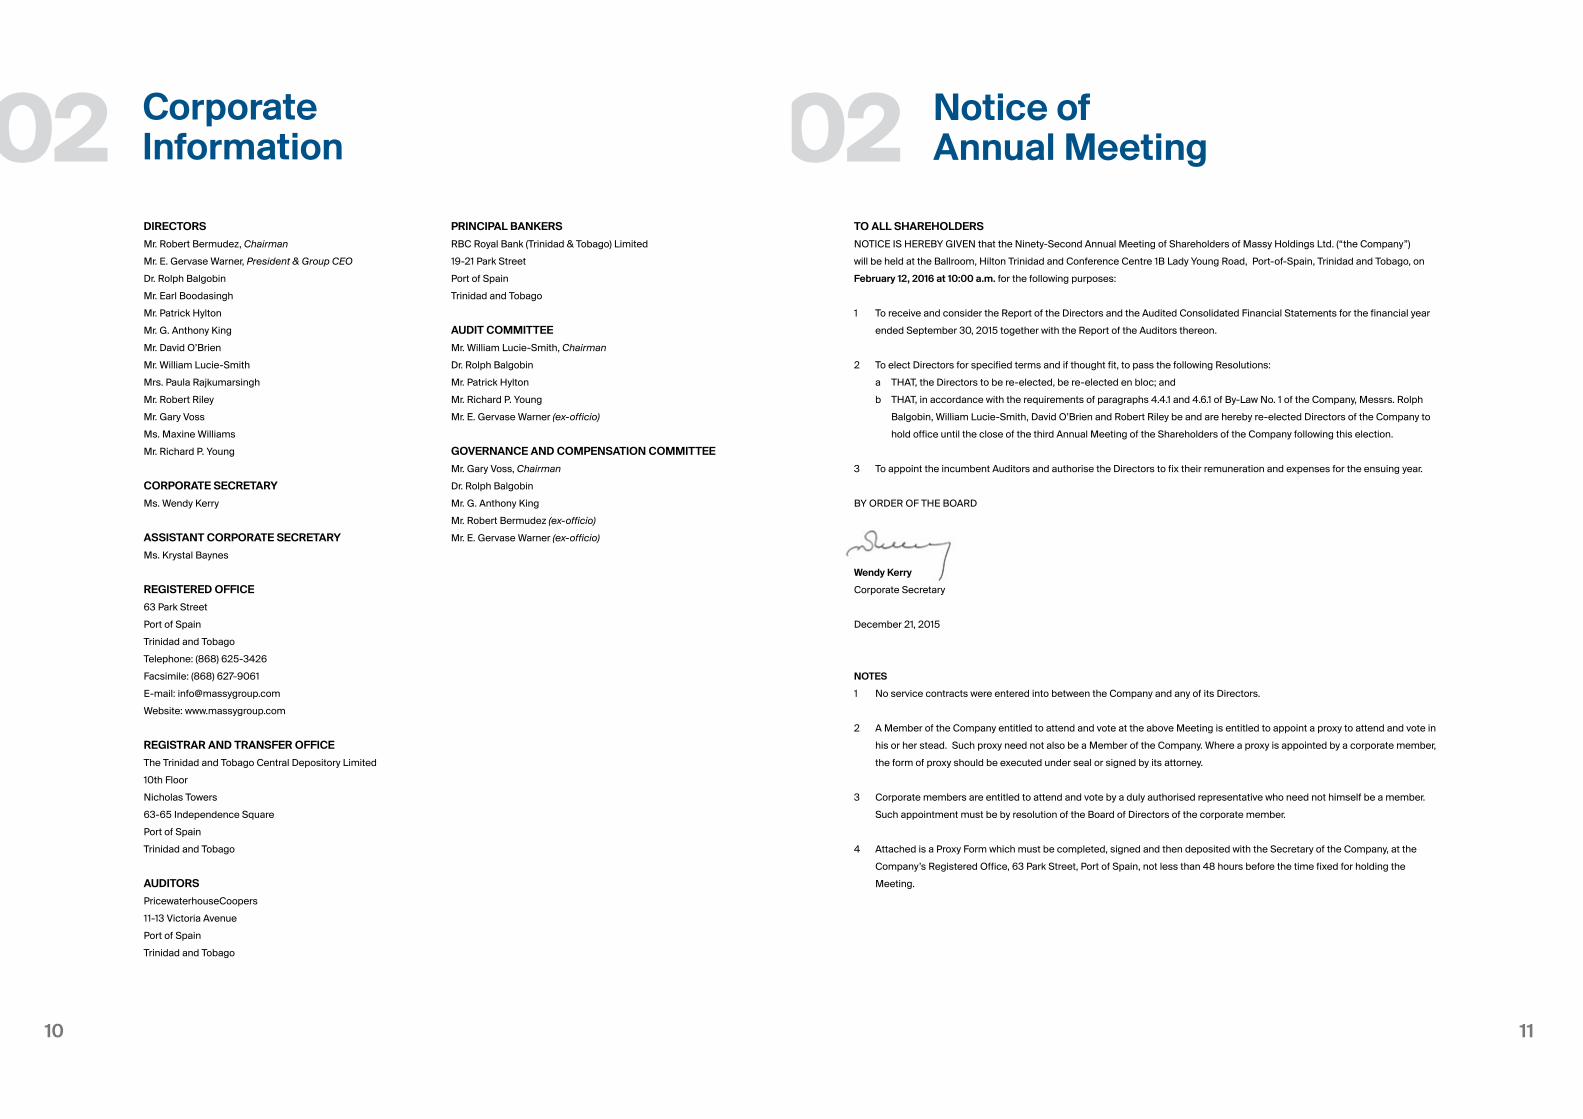
Notice of Annual Meeting02
TO ALL SHAREHOLDERS
NOTICE IS HEREBY GIVEN that the Ninety-Second Annual Meeting of Shareholders of Massy Holdings Ltd. (“the Company”)
will be held at the Ballroom, Hilton Trinidad and Conference Centre 1B Lady Young Road, Port-of-Spain, Trinidad and Tobago, on
February 12, 2016 at 10:00 a.m. for the following purposes:
1 To receive and consider the Report of the Directors and the Audited Consolidated Financial Statements for the financial year
ended September 30, 2015 together with the Report of the Auditors thereon.
2 To elect Directors for specified terms and if thought fit, to pass the following Resolutions:
a THAT, the Directors to be re-elected, be re-elected en bloc; and
b THAT, in accordance with the requirements of paragraphs 4.4.1 and 4.6.1 of By-Law No. 1 of the Company, Messrs. Rolph
Balgobin, William Lucie-Smith, David O’Brien and Robert Riley be and are hereby re-elected Directors of the Company to
hold office until the close of the third Annual Meeting of the Shareholders of the Company following this election.
3 To appoint the incumbent Auditors and authorise the Directors to fix their remuneration and expenses for the ensuing year.
BY ORDER OF THE BOARD
Wendy Kerry
Corporate Secretary
December 21, 2015
NOTES
1 No service contracts were entered into between the Company and any of its Directors.
2 A Member of the Company entitled to attend and vote at the above Meeting is entitled to appoint a proxy to attend and vote in
his or her stead. Such proxy need not also be a Member of the Company. Where a proxy is appointed by a corporate member,
the form of proxy should be executed under seal or signed by its attorney.
3 Corporate members are entitled to attend and vote by a duly authorised representative who need not himself be a member.
Such appointment must be by resolution of the Board of Directors of the corporate member.
4 Attached is a Proxy Form which must be completed, signed and then deposited with the Secretary of the Company, at the
Company’s Registered Office, 63 Park Street, Port of Spain, not less than 48 hours before the time fixed for holding the
Meeting.
DIRECTORS
Mr. Robert Bermudez, Chairman
Mr. E. Gervase Warner, President & Group CEO
Dr. Rolph Balgobin
Mr. Earl Boodasingh
Mr. Patrick Hylton
Mr. G. Anthony King
Mr. David O’Brien
Mr. William Lucie-Smith
Mrs. Paula Rajkumarsingh
Mr. Robert Riley
Mr. Gary Voss
Ms. Maxine Williams
Mr. Richard P. Young
CORPORATE SECRETARY
Ms. Wendy Kerry
ASSISTANT CORPORATE SECRETARY
Ms. Krystal Baynes
REGISTERED OFFICE
63 Park Street
Port of Spain
Trinidad and Tobago
Telephone: (868) 625-3426
Facsimile: (868) 627-9061
E-mail: [email protected]
Website: www.massygroup.com
REGISTRAR AND TRANSFER OFFICE
The Trinidad and Tobago Central Depository Limited
10th Floor
Nicholas Towers
63-65 Independence Square
Port of Spain
Trinidad and Tobago
AUDITORS
PricewaterhouseCoopers
11-13 Victoria Avenue
Port of Spain
Trinidad and Tobago
PRINCIPAL BANKERS
RBC Royal Bank (Trinidad & Tobago) Limited
19-21 Park Street
Port of Spain
Trinidad and Tobago
AUDIT COMMITTEE
Mr. William Lucie-Smith, Chairman
Dr. Rolph Balgobin
Mr. Patrick Hylton
Mr. Richard P. Young
Mr. E. Gervase Warner (ex-officio)
GOVERNANCE AND COMPENSATION COMMITTEE
Mr. Gary Voss, Chairman
Dr. Rolph Balgobin
Mr. G. Anthony King
Mr. Robert Bermudez (ex-officio)
Mr. E. Gervase Warner (ex-officio)
Corporate Information02

1312
03Chairman’s andChief Executive’s Reports
Chairm
an’s and Chief Executive’s R
eports
13
1514
Chairm
an’s Report
REGIONAL OVERVIEW
The Massy Group continues to be A Force for Good in the
CARICOM region and uses its strong reputation and balance
sheet to make investments to assure future growth.
In Trinidad and Tobago, Massy pre-launched its new Internet
and TV service. This will revolutionise the telecommunications
industry, as the Group pioneers a fully fibre-optic network,
literally bringing fibre to the home providing lightning fast
internet connections and the most high definition (HD) TV
channels in the market. In September 2015, the Group and
its partners, Mitsubishi Corporation and Mitsubishi Gas
Corporation made the Financial Investment Decision to
proceed with the construction of a Methanol and Dimethyl
Ether (DME) plant at Union Estate in La Brea. Through Massy
Motors Ltd., the Group also acquired 50 percent of the
Volkswagen Dealership, Best Auto Limited, from Southern
Sales & Services Co. Ltd. to attain full control. While an official
recession was announced in December 2015, and the country
continues to adjust to the “new normal” in global energy prices,
Massy will continue to seek out new opportunities for growth in
order to add value to both our shareholders and customers.
The economic outlook in Barbados continues to be cautious.
The country’s well-capitalised banking sector and efforts
to repair its national finances should provide a platform for
growing business confidence and investment opportunities
for the future. Our operating companies have performed
creditably in 2015 and we will continue to focus on operational
efficiency and improved productivity in this challenging
economic climate. Massy remains committed to growing
and investing in its businesses in Barbados, which includes
our planned new Massy Stores location at Kendal Hill and the
renovation of the Massy Stores Sunset Crest location. This
year, in reviewing our asset portfolio, the decision was made
to divest our shareholdings in Banks Holdings Ltd. and Magna
Rewards Caribbean Inc.
Our recent acquisition of Consolidated Foods Limited,
operating in St. Lucia and St. Vincent and the Grenadines,
has shown positive results. In the latter part of the year, the
stores in St. Vincent and the Grenadines were successfully re-
branded and in 2016 the St.Lucia stores will be re-branded.
Massy continues to invest in Guyana and is in the process of
developing two Massy Stores locations to be opened in 2016.
Our recent investment in the expansion and centralisation of
our warehousing facility, concluded in 2015, strengthened our
value chain and augers well for new growth in this area. While
reduced income earned from gold, rice and sugar throughout
2015 have tempered the high growth trajectory for the country,
it continues to experience economic growth.
In Jamaica, economic improvement continues at a moderate
pace. The country continues to adjust as mandated by the
International Monetary Fund (IMF) and is making strides in
that regard. The debt to GDP ratio is expected to improve from
147 percent in 2012 to roughly 120 percent from 2015 going
forward into 2016. Increasing tourist arrivals and a lower oil
import bill have provided unexpected green shoots which are
supporting economic recovery. Massy will continue to focus
on the organic growth of its businesses there.
The economic outlook for Suriname remains positive. With
a significant investment pipeline that spans new projects in
the gold, oil and other extractive industries, GDP growth is
expected to remain healthy at around 2-3 percent per year.
Massy Energy was able to make a significant breakthrough
into this territory for the second time with two ongoing projects
in the new oil refinery under construction by Staatsolie
Maatschappij Suriname, the State Oil Company.
Our foray into the Latin American market, through our
acquisitions of Massy Delima Grupo Automotriz S.A.S. and
Massy Energy Colombia S.A.S., has proven to be successful
as we recorded a full year of positive results, operating both
businesses in this territory. Colombia remains the growth
leader among all Latin American countries for 2015. Though
lower oil prices have led to a significant devaluation of the
Colombia Peso, creating an inflationary environment, the
outlook remains positive and GDP growth is expected to
continue in the order of 3-5 percent in the next few years.
APPRECIATION
In October 2015, Earl Boodasingh, former Executive Vice
President and former Executive Chairman, Integrated Retail
Business Unit, retired from the Board of Massy Holdings
Ltd. He served as a Director for the past 7 years, with 34
years of unbroken service as a Senior Executive of Massy. I
wish to thank Earl for his years of service on the Board and
as an astute Executive. Earl had the particularly unique
challenge of unifying the Retail, Distribution and Logistics
Lines of Business, to create the Integrated Retail Business
Unit, into which he engendered a culture of shared values and
accountability.
Earl will be succeeded by Frere Delmas, and we are
pleased to welcome Frere to the Board of Massy Holdings Ltd.
Frere has assumed the position of Executive Vice President
and Executive Chairman of the Integrated Retail Business
Unit. Frere will also continue to maintain his role as Country
Manager for the Massy Group in Barbados, a position which
he assumed in January 2013. Frere has an accumulated
wealth of management experience and knowledge in the
supermarket industry and wholesale distribution, which he
acquired during his 36-year career in the field. He continues
to offer his expertise in these areas in his current position, by
providing leadership oversight at the domestic level as well as
15
Chairman’s Report
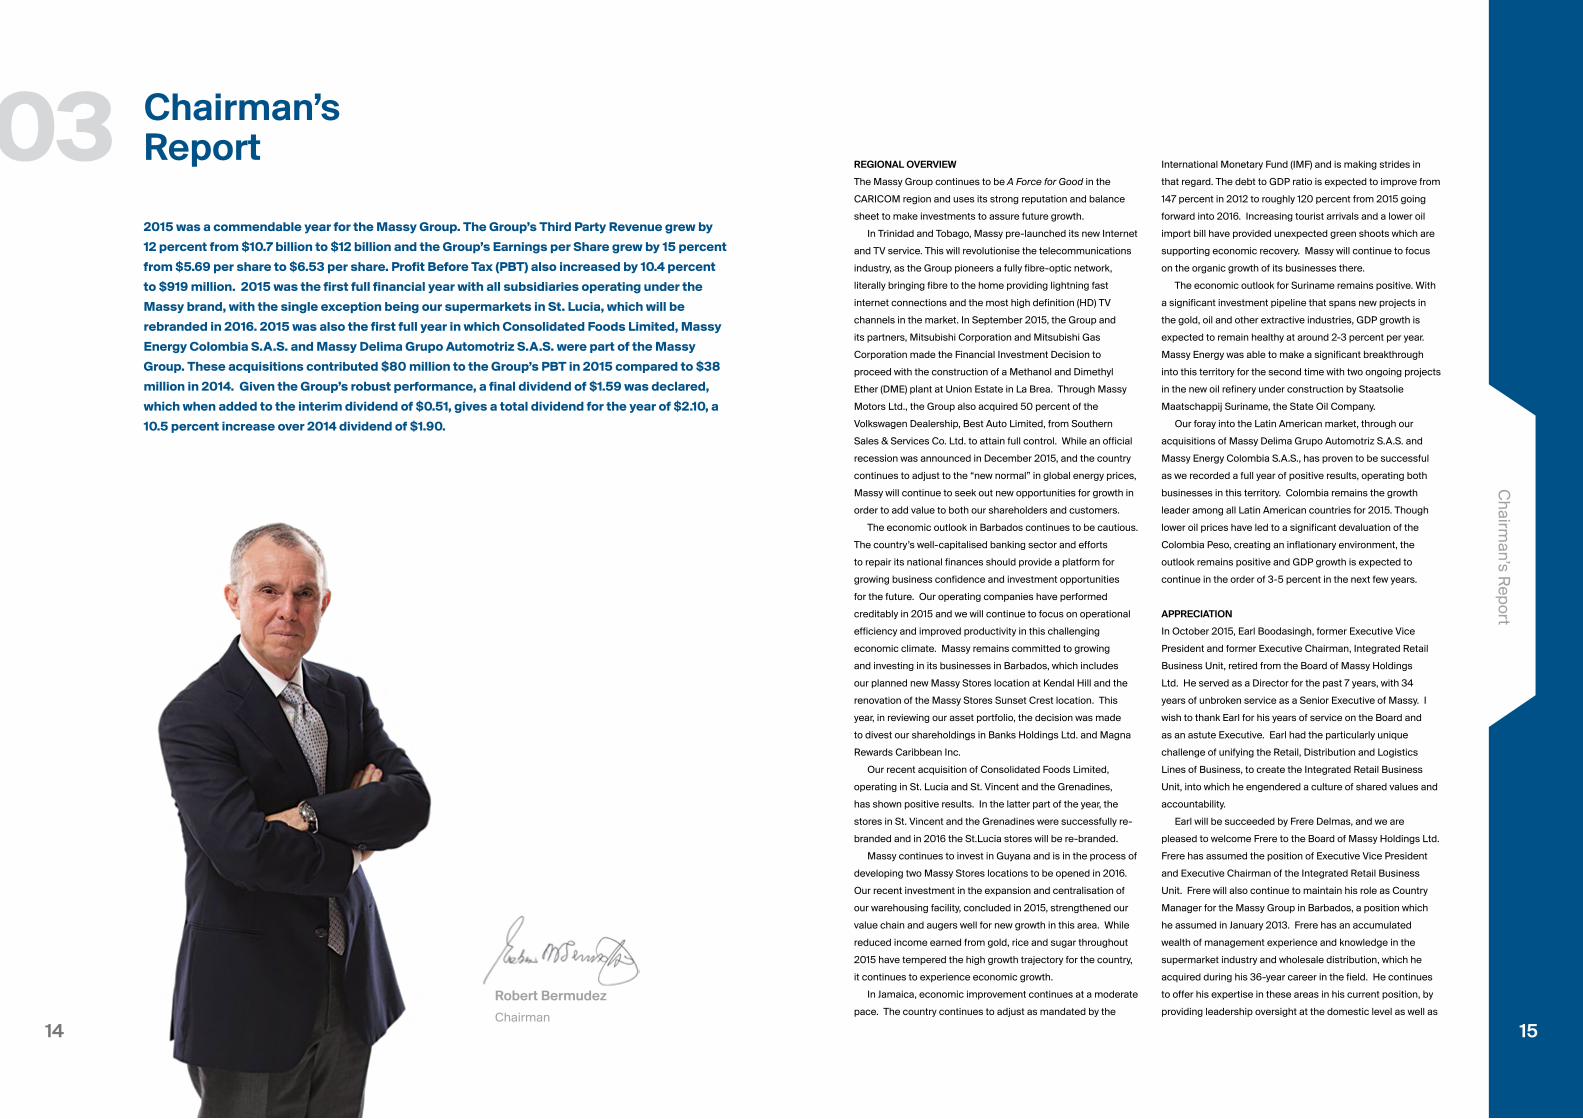
2015 was a commendable year for the Massy Group. The Group’s Third Party Revenue grew by
12 percent from $10.7 billion to $12 billion and the Group’s Earnings per Share grew by 15 percent
from $5.69 per share to $6.53 per share. Profit Before Tax (PBT) also increased by 10.4 percent
to $919 million. 2015 was the first full financial year with all subsidiaries operating under the
Massy brand, with the single exception being our supermarkets in St. Lucia, which will be
rebranded in 2016. 2015 was also the first full year in which Consolidated Foods Limited, Massy
Energy Colombia S.A.S. and Massy Delima Grupo Automotriz S.A.S. were part of the Massy
Group. These acquisitions contributed $80 million to the Group’s PBT in 2015 compared to $38
million in 2014. Given the Group’s robust performance, a final dividend of $1.59 was declared,
which when added to the interim dividend of $0.51, gives a total dividend for the year of $2.10, a
10.5 percent increase over 2014 dividend of $1.90.
Robert Bermudez
Chairman
03
1716
Chairman’s Report
for Massy’s retail interests in St. Lucia. He is a former Executive
Chairman for Massy’s Retail Business Unit and, before that,
was the Executive Chairman of the BS&T Food Retail and
Distribution Division as well as a BS&T Director. Prior to starting
his career, Frere pursued studies in Business Administration at
Loughborough College in the United Kingdom.
CLOSING REMARKS
On behalf of the Massy Holdings Board, I wish to express my
appreciation to the Massy employees for their commitment
and dedication which was reflected in our exemplary
performance over the past year. Thank you all for embracing
and representing our brand, Massy, and for living the values of
the organisation. I also wish to thank our Group Executives and
leadership teams who inspire and motivate our employees to
‘transform life’ in their day to day interactions with customers,
colleagues and communities. Finally, I wish to express my
gratitude to all our shareholders who continue to demonstrate
confidence in Massy and its people. I wish to also extend deep
gratitude to my fellow Directors for their support and guidance,
as we look forward to another fruitful year.
Chief Executive Officer’s Report
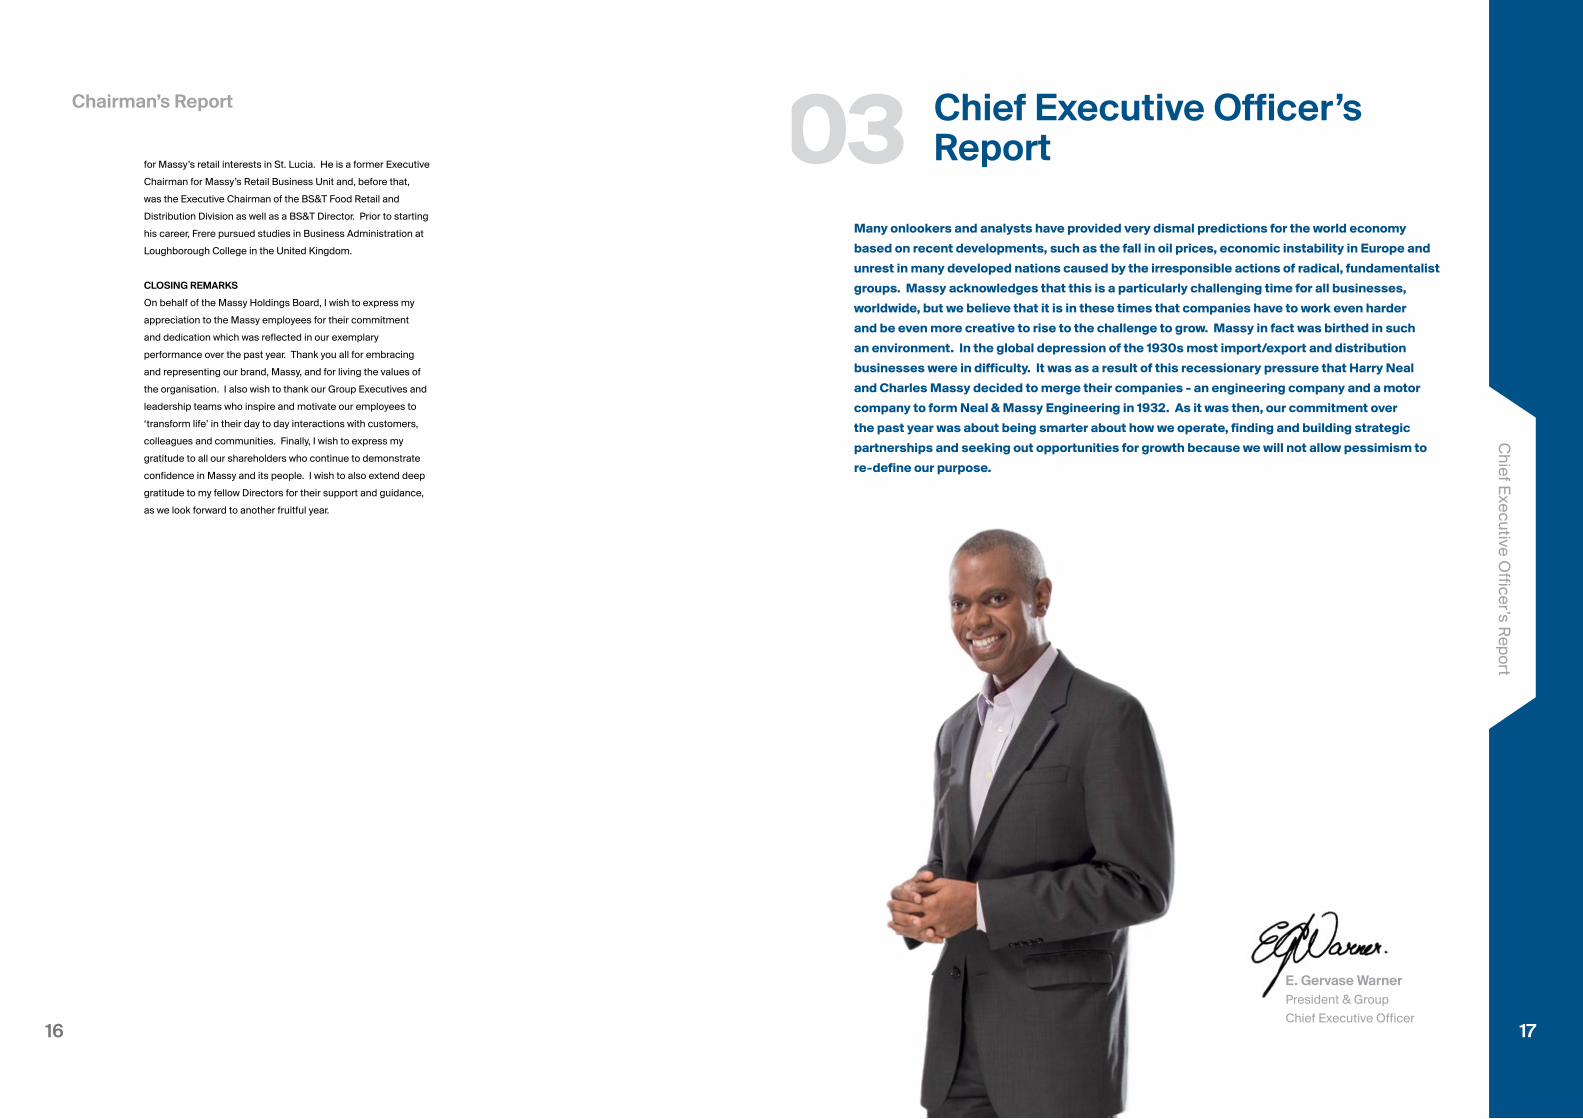
Many onlookers and analysts have provided very dismal predictions for the world economy
based on recent developments, such as the fall in oil prices, economic instability in Europe and
unrest in many developed nations caused by the irresponsible actions of radical, fundamentalist
groups. Massy acknowledges that this is a particularly challenging time for all businesses,
worldwide, but we believe that it is in these times that companies have to work even harder
and be even more creative to rise to the challenge to grow. Massy in fact was birthed in such
an environment. In the global depression of the 1930s most import/export and distribution
businesses were in difficulty. It was as a result of this recessionary pressure that Harry Neal
and Charles Massy decided to merge their companies - an engineering company and a motor
company to form Neal & Massy Engineering in 1932. As it was then, our commitment over
the past year was about being smarter about how we operate, finding and building strategic
partnerships and seeking out opportunities for growth because we will not allow pessimism to
re-define our purpose.
E. Gervase Warner President & Group Chief Executive Officer
03C
hief Executive Offi
cer’s Report
17
1918
Currently, we are focused on deploying a combination of
defensive and offensive strategies to grow in the prevailing
environment. Our cost reduction strategy is more focused on
operational efficiency as opposed to cost cutting which is often
the first go-to strategy in tightening economies. Cost cutting
typically involves lowering head count, reducing operating
costs and rationalising business portfolios but compromises
quality and customer service and breeds pessimism which
can demoralise employees. We believe that if we improve our
efficiency, maintain a motivated workforce and manage our
assets well, we can ensure that our expenditure is value-driven.
We are pursuing opportunities by finding new market segments,
exploring strategic investments with long term payoffs and
acquiring talent and assets of businesses which become
available during a downturn. In some instances we have had
to make some difficult decisions, such as divesting businesses
which were not a strategic fit for the organisation.
FINANCIAL REVIEW
Massy’s Group audited results for the FY 2015, reported a
15 percent increase in the Group’s Earning Per Share (EPS)
from $5.69 per share to $6.53 per share. This commendable
performance arose from a 12 percent increase in Third Party
Revenue to $12 billion and a 10.4 percent increase in the
Group’s Profit Before Tax (PBT) to $919 million. The three
top performing Business Units contributing to PBT were the
Automotive & Industrial Equipment Business Unit with a 13
percent increase over 2014, the Energy & Industrial Gases
Business Unit and the Integrated Retail Business Unit, both
showing a 6 percent increase over 2014.
The Group’s acquisition strategy is paying off. In addition
to contributing $1 billion to the $1.2 billion increase in
Group Revenue, recent acquisitions of the majority stake in
Consolidated Foods Limited (St. Lucia), Massy Energy Colombia
and Massy Delima Grupo Automotriz S.A.S. (Colombia)
accounted for $80 million of the Group’s PBT in 2015 versus
$38 million in 2014.
OUR BRAND ONE YEAR LATER
2015 marked a full year of operating with a new brand, Massy,
which helped us to refine our identity to better deliver on our
strategy. We continue to pursue greater integration within the
Massy Group to uncomplicate the lives of the people we serve
in the territories in which we operate. Our brand promise is to
make things easy again: easier to buy, easier to own, easier
to use and, ultimately, easier to enjoy and we want to remove
the barriers that make life complicated. To deliver on that
brand promise, we shared accountability across all businesses
and shared collaboration among our leadership, which was
unprecedented. Unified with a common purpose of ‘creating
value, transforming life,’ we were guided by our values of
honesty and integrity, responsibility, growth and continuous
improvement, collaboration and love and care to deliver on
our brand promise.
OPERATIONALISING OUR ECOSYSTEMS
In 2015 we dedicated a significant amount of time and
resources in operationalising our ecosystems. Our consumer
finance business and our insurance business in particular
were developed and extended to deliver on the brand
promise as we grew our customer loyalty programme and
increased our insurance service points at key consumer-
facing locations, namely Massy Motors (Port of Spain and
Tobago) showrooms and at the Massy SuperCentre in
Trincity which was opened in the first quarter of the financial
year under review. This marked a major development in
the advancement of our superstore model, first unveiled
in Barbados at the Warrens location, where we created the
opportunity for consumers to buy non-food items, such as
electronics and appliances, with the added convenience
of being able to use their Massy Credit Card and earn and
redeem points through the Massy loyalty programme.
We also entered into a new business, Massy
Communications | Internet • TV which we believe will
significantly enhance the value proposition of our ecosystems
at strategic Massy Stores locations in Trinidad and Tobago.
Since 2006, Massy Communications Ltd. has provided high-
speed data over its fibre optic backbone network to business
in Trinidad. The Group took the bold decision to extend that
network to homes to provide consumers with the fastest,
most reliable Internet and TV service possible. Through
Massy Communications’ fibre-based technology we are able
to offer what will be the fastest internet speed on the market
and TV packages, which will include the widest selection
of channels, and the most HD channels. We have decided
to rollout the service in phases, starting with communities
nearest our Massy stores where we know affiliation for the
brand is strongest.
In September 2015, the Group and its partners,
Mitsubishi Corporation and Mitsubishi Gas Corporation
made the Financial Investment Decision to proceed with the
construction of a Methanol and DME plant at Union Industrial
Estate, La Brea. This project is an important element of the
Group’s diversification strategy and will provide much needed
Foreign Direct Investment to Trinidad and Tobago and foreign
exchange earnings for the Group.
LEADERSHIP AND EMPLOYEE TRANSFORMATION
In 2015, for the first time in the history of the organisation we
rolled out our first ever group-wide employee engagement
Chief Executive Officer’s Report
survey which was a critical feedback mechanism to systemically
understand where we are doing well and where we are falling
short in meeting the expectations of our 11,000 employees.
The top-level survey findings showed that the confidence in the
future of Massy, employees having the training they need to do
their jobs well and senior leadership commitment to providing
high-quality products and services to external customers were
the greatest drivers of engagement. The results of the survey
guided the development of specific company plans, which are
still in progress, for improving operational efficiency as well as
the culture of the Group.
We also cascaded Shareholder Value Added (SVA) to all
levels of the organisation in Retail, Auto and Distribution
Lines of Business to educate and empower employees in
participating in driving performance. The value of this exercise,
conducted in workshops, in the larger companies was in
creating awareness and understanding among all employees
about how their actions and responsibilities affect the value that
is created within their business.
STRIVING FOR STRATEGIC FIT
There were several achievements in the year, discussed in
detail in the subsequent segment reviews, which demonstrated
our focus on ensuring the right strategic fit for the Group.
Noteworthy moves included our acquisition of the outstanding
50 percent shareholding in Best Auto Limited, the Volkswagen
dealership of Massy Motors which we previously shared with
Southern Sales & Services Co. Ltd. Following on our acquisition
of the majority shareholding of Gablewoods Supermart
Limited (GSL) in the first quarter of the 2014 financial year, we
successfully re-branded the Save-A-Lot supermarkets based
in St. Vincent and the Grenadines. We continued to deliver on
our store modernisation programme and re-opened several
remodelled stores in Trinidad and Barbados. Our Massy Card
credit card was rolled out in both Trinidad and Barbados
and recorded impressive growth in the Barbados market.
The customer loyalty programme also achieved impressive
growth in Trinidad and Tobago, with over 180,000 primary and
secondary Massy Card holders in Trinidad and Tobago.
We also divested some of our businesses which were
not aligned to our long-term growth strategy. In Barbados,
we divested our 20 percent shareholding in Banks Holdings
Limited; and in our Distribution Line of Business we divested
Massy Shipping Services (Trinidad) Ltd. Our shareholding in
Magna Rewards Caribbean Inc. was also sold, as the Group
focuses its loyalty initiatives on the Massy Card. In 2016, the
Magna Rewards card in Barbados will be transitioned to the
Massy Card.
HEALTH, SAFETY, SECURITY & THE ENVIRONMENT (HSSE)
The 2014-2015 was a year of mixed performance in HSSE.
With the main goal of accident and injury prevention
remaining as top priority, the focus across the Group
continues to be embedding an HSSE culture across all
layers of the organisation. It is with deep regret and sorrow
that I register three fatalities which resulted from business
operations – a driving-related fatality of a pedestrian, a
fall from height of a contractor as well as the death of
an employee while on duty. These incidents have been
thoroughly investigated and action plans immediately
installed not only within the respective operating businesses
but applied throughout the entire Massy Group as learnings
to ensure that mistakes and process deficiencies are not
repeated.
In an attempt to proactively prevent the recurrence of
incidents like these, we have been dedicated to measuring
and tracking our leading and lagging indicators. In 2015 we
conducted 19,163 workplace inspections and 19,731 equipment
inspections; 997 HSSE audits and 9,608 HSSE inspections.
In addition to the formation of two robust Group HSSE
Committees – a Steering Committee and a Working
Committee, over the past year, the Group also introduced
a HSSE Information Management System, referred to as
the HSSE Portal. The portal streamlines the input of HSSE
data such as both positive and negative HSSE performance
metrics, incident reports, HSSE cultural data as well as
HSSE Loss Control and Business Continuity Management
Assessments. The available data is analysed to identify
notable trends which may require intervention or may be used
for key learnings.
We have also conducted on-going HSSE training to have
in house HSSE professionals trained as US OSHA General
Industry authorised trainers. These US OSHA General
Industry authorised trainers will in turn train other Massy
employees internally on various critical areas pertaining
to HSSE. Additionally, this past year saw safety leadership
training being facilitated for the Integrated Retail Business
Unit in Barbados and Trinidad, and this was conducted
to enhance the Massy Leadership’s commitment to
HSSE, and contribute to a more seamless adoption and
implementation of Corporate HSSE Policies and Procedures.
In total, the Group completed 144,475 training hours for
the year. The Group’s leadership also played a critical
role in conceptualising an Incident Command Structure,
encompassing requirements under both the HSSE and
Business Continuity Management Systems, to develop a
formalised approach to crisis management.
2120
CUSTOMER SERVICE
In 2015 we focused on strengthening our internal capability
and systems and worked to build consistency in our approach
to several of the elements within the Customer Service
Management System (CSMS). Customer service training is
a critical component in our drive to excellence. A Customer
Service train-the-trainer programme was held in Trinidad where
seventeen persons were certified to execute customer service
training in their respective companies.
Customer feedback is a fundamental aspect to
understanding and prioritising where our improvement
efforts must be focussed. As a result, the Group entered
into an exclusive agreement with the American Customer
Satisfaction Index to use their methodology for the Massy
companies within the Caribbean region. This provides us
with a standardised measurement approach and allows us to
benchmark performance against global leaders in selected
industries. Massy Stores commenced the benchmarking of
their performance against the leading supermarkets in the US
and identified critical improvement areas to be addressed.
CSMS audits also increased in 2015 with seven of
the twenty-five companies deploying the CSMS being
evaluated. The Group’s trained internal CSMS auditors have
been assessing the quality of the CSMS implementation
and suggesting improvement strategies for the respective
businesses. This approach also enabled us to identify
innovative solutions and best practices being attempted in the
various subsidiaries and replicate them in other businesses.
CORPORATE SOCIAL RESPONSIBILITY
Across the region, our companies persist in efforts to develop
and transform their communities through our growing corporate
social responsibility portfolio and flagship community projects.
The Massy Group is continuously impacting our communities in
more meaningful and sustainable ways.
The Massy Foundation Barbados was launched in June
2015 with a commitment to Education and Skills Development,
Health, Humanitarian Causes, Environmental Issues, Heritage,
Arts and Culture. This is the second Massy Foundation to be
incorporated in the Caribbean, the first being the Trinidad and
Tobago-based Foundation which was established in 1979. In
2015, the Massy Foundation Barbados partnered with key
stakeholders, such as the Ministry of Health and the Queen
Elizabeth Hospital, to support polyclinics and the hospital. NGO
partnerships in the health sector were also forged with agencies
such as the Barbados Diabetes Foundation, Heart & Stroke
Foundation of Barbados and the Barbados Cancer Society.
The Massy Foundation’s flagship youth empowerment
initiative in Trinidad and Tobago, the Boys to Men programme,
ran 10 programmes in 2015 – Port of Spain (2 programmes);
San Fernando (2 programmes); Chaguanas; Youth Training
Centre (YTC); Mayaro/Guayaguare; La Brea; Barataria and
Tobago. The programme now has graduated over 700
young leaders. Many of these graduates have returned to
the programme as leaders and have enhanced the ability to
conduct simultaneous programmes. This year a Leadership
Development Programme was rolled out to expand the skill
set and leadership abilities of a core cadre of 30 programme
leaders, who understudied mentors in communications,
financial planning and goal setting.
A full report on our corporate social responsibility efforts
across the region is included as a separate submission and
may be downloaded at www.massygroup.com
CLOSING REMARKS
In 2015 we welcomed Julie Avey to the Executive
Committee as the Senior Vice President (SVP) – Human
Resources. In this role Julie will have oversight of all Human
Resource Management functions of the Massy Group,
including Employee Benefits, Industrial Relations, Change
Management, Group Culture Transformation and Training &
Development. Prior to her appointment, Julie held the position
of CEO of Massy Delima Grupo Automotriz S.A.S. in Cali,
Colombia which was Massy’s first acquisition in Colombia in
2013. From 2010 to 2013 she was the After Sales Director at
Massy Motors Ltd. with a 6 month responsibility as Dealership
Director for the San Fernando business.
Julie succeeds Angela Hamel-Smith, former Group Human
Resources Manager who has officially retired but will continue
to assist with specific initiatives through September 2016.
Angela has worked with the Group for the past 20 years
and has been an invaluable asset to Massy. In addition to
her professional duties, Angela has provided wise counsel
to every member of the Group’s leadership and has also
mentored and coached several employees, at all levels. On
behalf of all employees of Massy I wish to thank Angela for
her heart, her guidance, her leadership and her wisdom in this
role.
While the economic outlook for the Group’s primary
economies are not promising, we appreciate the confidence
shown by our employees, customers and shareholders in the
Group’s strength and ability to weather the turbulent times
ahead. The Group is the strongest it has ever been from
brand, balance sheet and corporate readiness perspectives.
Chief Executive Officer’s Report
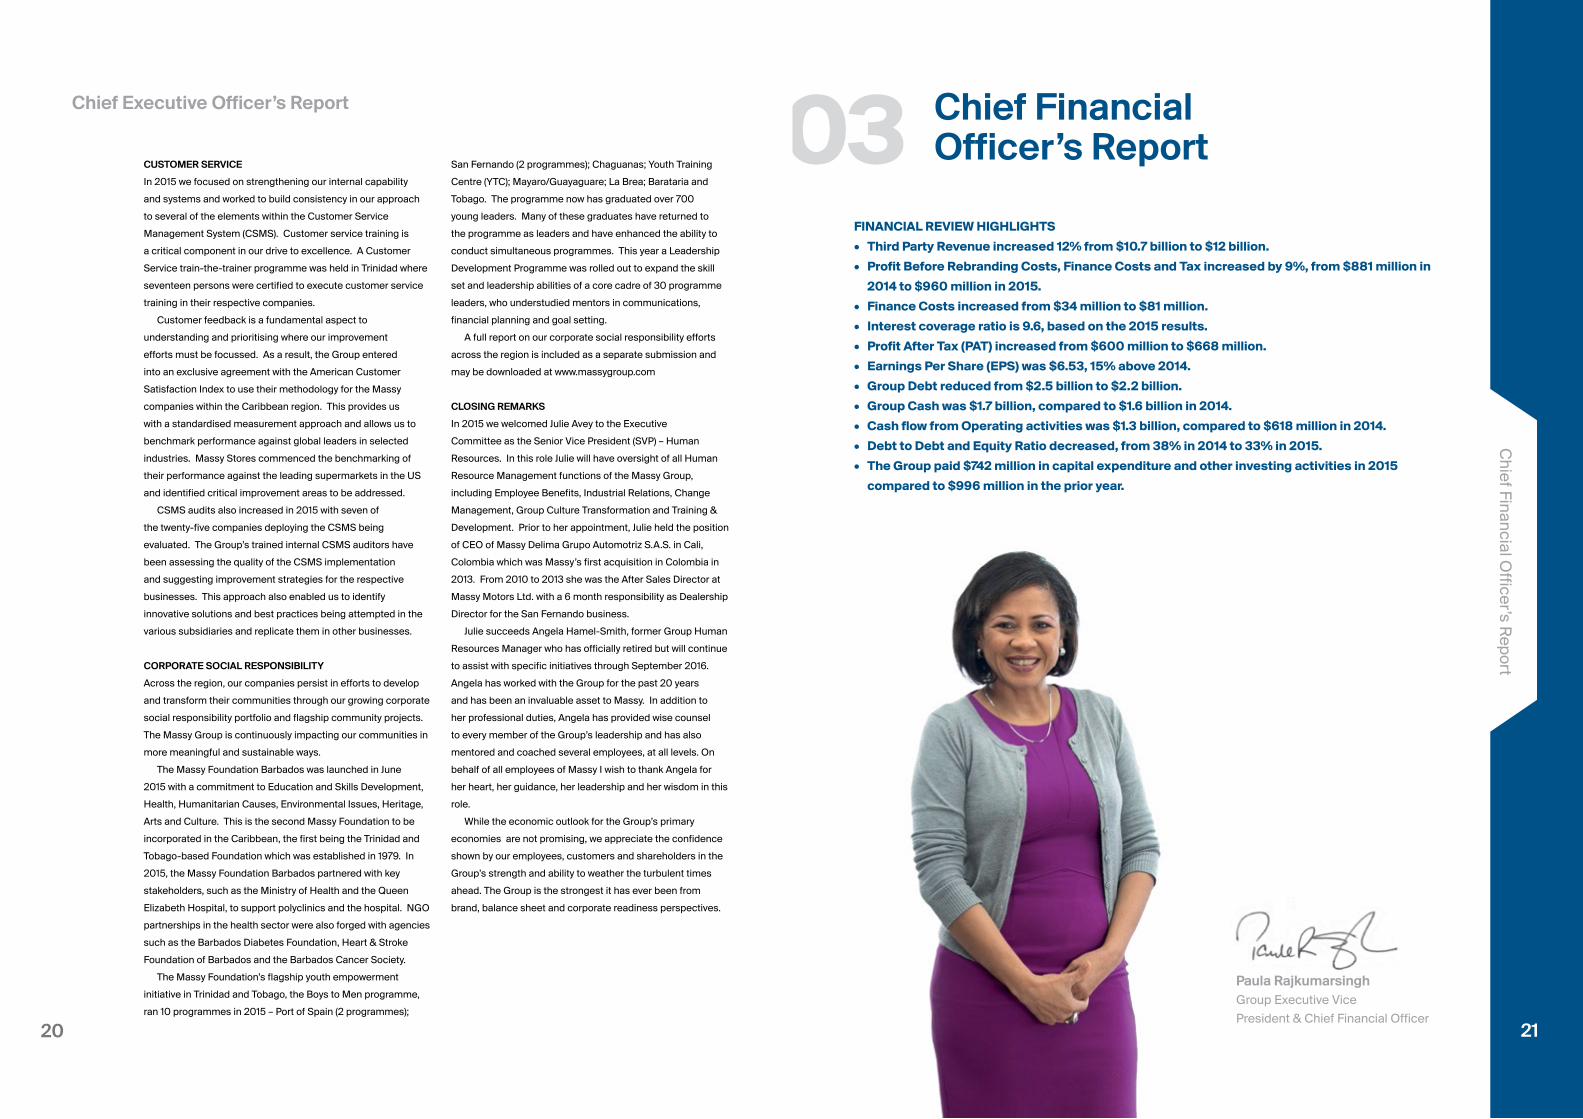
FINANCIAL REVIEW HIGHLIGHTS
• Third Party Revenue increased 12% from $10.7 billion to $12 billion.
• Profit Before Rebranding Costs, Finance Costs and Tax increased by 9%, from $881 million in
2014 to $960 million in 2015.
• Finance Costs increased from $34 million to $81 million.
• Interest coverage ratio is 9.6, based on the 2015 results.
• Profit After Tax (PAT) increased from $600 million to $668 million.
• Earnings Per Share (EPS) was $6.53, 15% above 2014.
• Group Debt reduced from $2.5 billion to $2.2 billion.
• Group Cash was $1.7 billion, compared to $1.6 billion in 2014.
• Cash flow from Operating activities was $1.3 billion, compared to $618 million in 2014.
• Debt to Debt and Equity Ratio decreased, from 38% in 2014 to 33% in 2015.
• The Group paid $742 million in capital expenditure and other investing activities in 2015
compared to $996 million in the prior year.
Chief Financial Officer’s Report
Paula Rajkumarsingh Group Executive Vice President & Chief Financial Officer
Chief Financial O
fficer’s R
eport
21
03
2322
OVERVIEW
Massy’s Business Units and Lines of Business performed
commendably in 2015. Our emphasis on operational execution
and cash flow contributed to the delivery of robust results in
the prevailing economic environment. Operating Profit before
finance costs for the financial year 2015 closed at $960 million
(9 percent increase over 2014). The refinancing and terming
out of the Group’s long term debt in July 2014 resulted in an
increase in interest cost in the Head Office and Business Units’
results. Notably, our new acquisitions, purchased at different
dates in 2014, performed well and contributed $80 million in
operating profit in 2015, a substantial increase when compared
to $38 million in 2014. In addition, negative goodwill of $29.5
million, which arose from the Massy Energy Colombia S.A.S.
acquisition completed in October 2014, was recorded in this
year’s results. The one-off rebranding cost of $58 million was
booked in September 2014 while $0.3 million in a net write back
of rebranding provisions was reported in September 2015.
The regional trading economies continue to be weak as
many governments are saddled with mounting debt and
falling commodity prices. The Trinidad and Tobago operations
contributed 50 percent to third party revenue and 60 percent to
Profit before Head Office and Other Adjustments, Rebranding
Costs and Tax compared to 61 percent in 2014. The new
investments in Colombia contributed $838 million in revenue
and $23 million in profit in 2015.
Overall in 2015, the Group reported 12 percent growth in
Revenue, with 9 percent growth in operating profit from our
subsidiaries, before rebranding costs. Excluding rebranding
costs, EPS increased by 6 percent to $6.53. With the
rebranding costs of $58 million in 2014, EPS grew by 15 percent.
BUSINESS UNIT PERFORMANCE
With the exception of our Insurance, ITC and Other Investment
portfolio, all other Business Units showed robust growth over
2014. Strong performances were noted in our Retail Line
of Business, Energy & Industrial Gases and Automotive &
Industrial Equipment Business Units.
The following lists the key business highlights for 2015
excluding the rebranding costs in the Business Units:
The Automotive & Industrial Equipment Business Unit
concluded the year with strong results. The Business Unit
reported revenue growth of 8 percent and growth of 10 percent
or $22 million in profit before rebranding costs and tax. The
non – recurrence of special write offs in 2014 and improved
operating performance by Massy Machinery Ltd. and Massy
Automotive Components Ltd. have contributed to growth in
2015. The Business Unit’s primary operation, Massy Motors
Ltd., experienced a 1 percent decrease in revenue and gross
margins were under pressure. The Colombia operations
contributed 2 percent to the Business Unit’s profitability in
2015. Its growth in sales volumes and the TTD profitability
improved despite the 56 percent devaluation of the
Colombian Peso against the US Dollar.
The Energy & Industrial Gases Business Unit had revenue
growth of 53 percent or $516 million and growth of 4 percent
or $10 million in profit before rebranding costs and tax. The
acquisition of Massy Energy Colombia in the first quarter
of the financial year contributed profits of $16 million and
revenue of $582 million. This improvement from the Colombia
acquisition was offset by the increased cost of pursuing
several business development initiatives and a reduction in
profitability in the Energy Services Companies in Trinidad.
Massy Energy Engineered Solutions Ltd. suffered a 12
percent reduction in sales as a result of the sharp slowdown
in contracts in the sector and the startup of special projects
in 2014. The performance of Massy Gas Products improved
in Jamaica but declined in Trinidad compared to 2014. The
Business Unit is directly affected by the downward pressure
on commodity prices and the associated actions of the
energy industry operators in Trinidad, Colombia and the wider
region to curtail operating cost and defer capital expenditures.
The Information Technology & Communications Business
Unit recorded reasonable results in 2015 with revenue growth
of 3 percent and flat profitability. The companies operating in
Trinidad performed as expected and the Jamaican operations
recorded a 9 percent PBT reduction, when compared to the
prior year, resulting from a 20 percent decline in sales. The
Jamaica operation had a major one off sale in 2014. The
newly-acquired shareholding in the Costa Rica ITC company
in 2014 and investment in the consumer broadband and IPTV
venture in 2015 contributed losses for this period.
The Integrated Retail Business Unit experienced growth
of 8 percent in revenue and 1 percent in profit before
rebranding costs and tax. Challenging and competitive trading
environments continue to place pressure on margins and
comparable sales growth in most of the territories in which we
operate. The growth in this Business Unit was primarily driven
by the contributions from the retail acquisition in St. Lucia, St.
Vincent and the Grenadines and our retail and distribution
operations in Trinidad. Top line growth in retail in Trinidad was
fueled primarily through an increase in the average customer
basket size which improved by 5.5 percent to $143.94 year on
year. The new Massy Stores SuperCentre in Trincity was also a
significant contributor to this growth. The Distribution operations
showed improvements in their supply chain management.
Chief Financial Officer’s Report
Our Retail and Distribution businesses in Barbados
experienced flat revenue growth but 10 percent increase in
profits due to significant cost reduction initiatives. Barbados
made strides toward economic recovery in 2015 as real GDP
growth improved in 2015, as the economy was bolstered by
increased tourism activity. The consumer finance contribution
declined in 2015 largely due to increased costs associated
with developing and marketing the new credit card and hire
purchase business in Trinidad and Barbados. At the end of the
year, the Group completed the divestiture of all its shipping
services operations in Trinidad.
The Insurance Business Unit showed revenue growth of 20
percent but a 17 percent reduction in profitability. Gross Written
Premiums (GWP) in the Property line of business declined in
Barbados and Trinidad, when compared to the prior year. In the
regional territories, GWP exceeded 2014 results due to large
wins in Bahamas and Antigua. The improvement in contribution
from the property class of business is a result of the pro-
rata earning of portfolio transfer as recognised from the new
reinsurance arrangements effective January 2015. This, coupled
with the lower ceded premium amounts in the larger territories
of Barbados and Trinidad, and the new reinsurance structure,
enables the company to improve its profitability on the property
lines of business. Net Claims incurred exceeded prior year by
49 percent, driven by poor loss experience in the Barbados
automotive insurance portfolio and Dominica hurricane losses.
The poor loss experience in Barbados, particularly impacted by
the frequency and severity of personal injury claims, accounted
for the negative performance of the automotive insurance
business. Falling interest rates on the Company’s deposit and
bond portfolio has led to a decline in the Investment Income
earned for the quarter, coupled with unrealised losses on its
equities portfolio.
In Other Investments portfolio, revenue declined by 6 percent
and profitability dropped by 17 percent. The major contributor
to the decline was the drop in profitability of the extraction
department of Roberts Manufacturing Co. Ltd., which suffered
from the reduction in Soyabean prices. Feed quality issues also
impacted sales and provisioning for claims.
The Head Office and unallocated cost was $143 million, a
decrease of $18 million or 11 percent over the previous year.
These costs include head office department costs, unallocated
interest costs and several miscellaneous costs which were not
allocated to Business Units, and which fluctuate quarterly and
annually. Head office department costs increased slightly by 2
percent. Interest cost increased by $20 million, largely due to
the full year cost on the bond which was issued in the prior year.
Financials
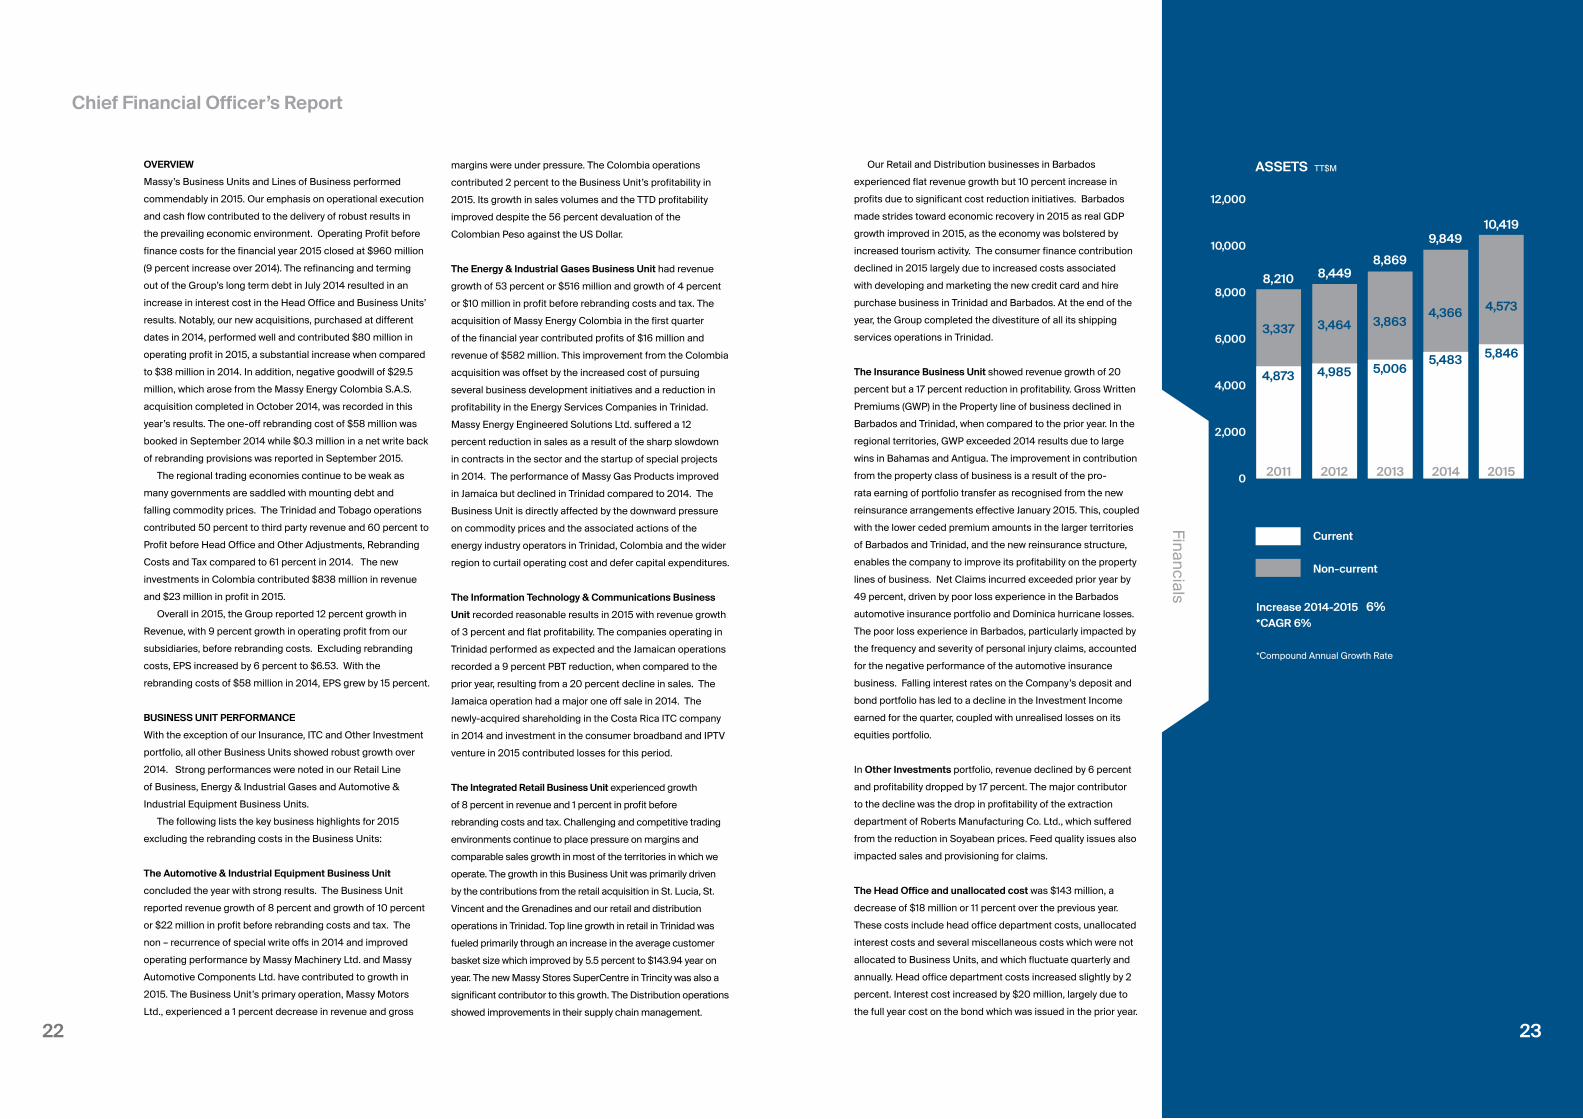
ASSETS TT$M
Increase 2014-2015 6%*CAGR 6%
*Compound Annual Growth Rate
12,000
10,000
8,000
6,000
4,000
2,000
0 2011 2012 2013 2014 2015
4,873
3,337
3,337
8,210
4,985
3,464
3,4648,449
5,006
3,863
3,8638,869
5,483
4,366
4,3669,849
5,846
4,573
4,57310,419
Non-current
Current
23
2524 25
Financials
This increase was offset by the negative goodwill recorded on
the Massy Energy Colombia acquisition.
FINANCE COSTS
Interest costs increased from $34 million to $ 81 million. The
new bond valued at $1.2 billion was issued in two tranches in
July 2014 which resulted in two months of interest cost reported
in 2014 when compared to 12 months reported in 2015. The
funds borrowed in 2014 were used to support long term growth
initiatives and to refinance our borrowings.
PROFITS FROM ASSOCIATES AND JOINT VENTURES
The profit from associates and joint ventures decreased from
$43 million to $40 million. The performance of associates and
joint ventures was mixed with joint ventures in the ITC Business
Unit contributing operating losses, while Massy Wood Group
Ltd. and the oxygen plant investments continued to contribute
positive results.
TAXATION CHARGE
The taxation charge for the Group increased slightly from $232
million to $251 million, and the effective tax rate remained at 27
percent.
BALANCE SHEET
The Balance sheet was further strengthened during the year, as
evidenced by stable liquidity ratios and reduction in debt. Total
assets increased from $9.8 billion to $10.4 billion at the end of
September 2015 and the net assets per share was $44.55 at
end of financial year, compared to $40.93 in 2014. The Group’s
leverage decreased from 62 percent to 50 percent with the
repayment of USD loans and other higher cost debt resulting
in total borrowings reducing from $2.5 billion to $2.2 billion.
81 percent of the borrowings are long-term borrowings in
Trinidad and Tobago Dollars. Total cash increased slightly from
$1.6 billion to $1.7 billion as there were strong operating cash
flows through earnings growth and effective working capital
management.
The cash used for investing activities increased by 16
percent from $373 million in 2014 to $431 million in 2015.
This year the Group invested $268 million in new acquisitions
and new businesses, namely Massy Energy Colombia
S.A.S., the Massy Internet TV project and the Natural Gas to
Petrochemicals Plant with Mitsubishi Corporation, Mitsubishi
Gas Chemical Corporation and the Government of the Republic
of Trinidad and Tobago. Regular capital expenditure was mainly
focused on Guyana and Trinidad.
Our financial activities had a net outflow of $497 million in
cash in 2015 compared to an inflow of cash of $504 million
in 2014. In 2014, the Trinidad and Tobago bond receipts were
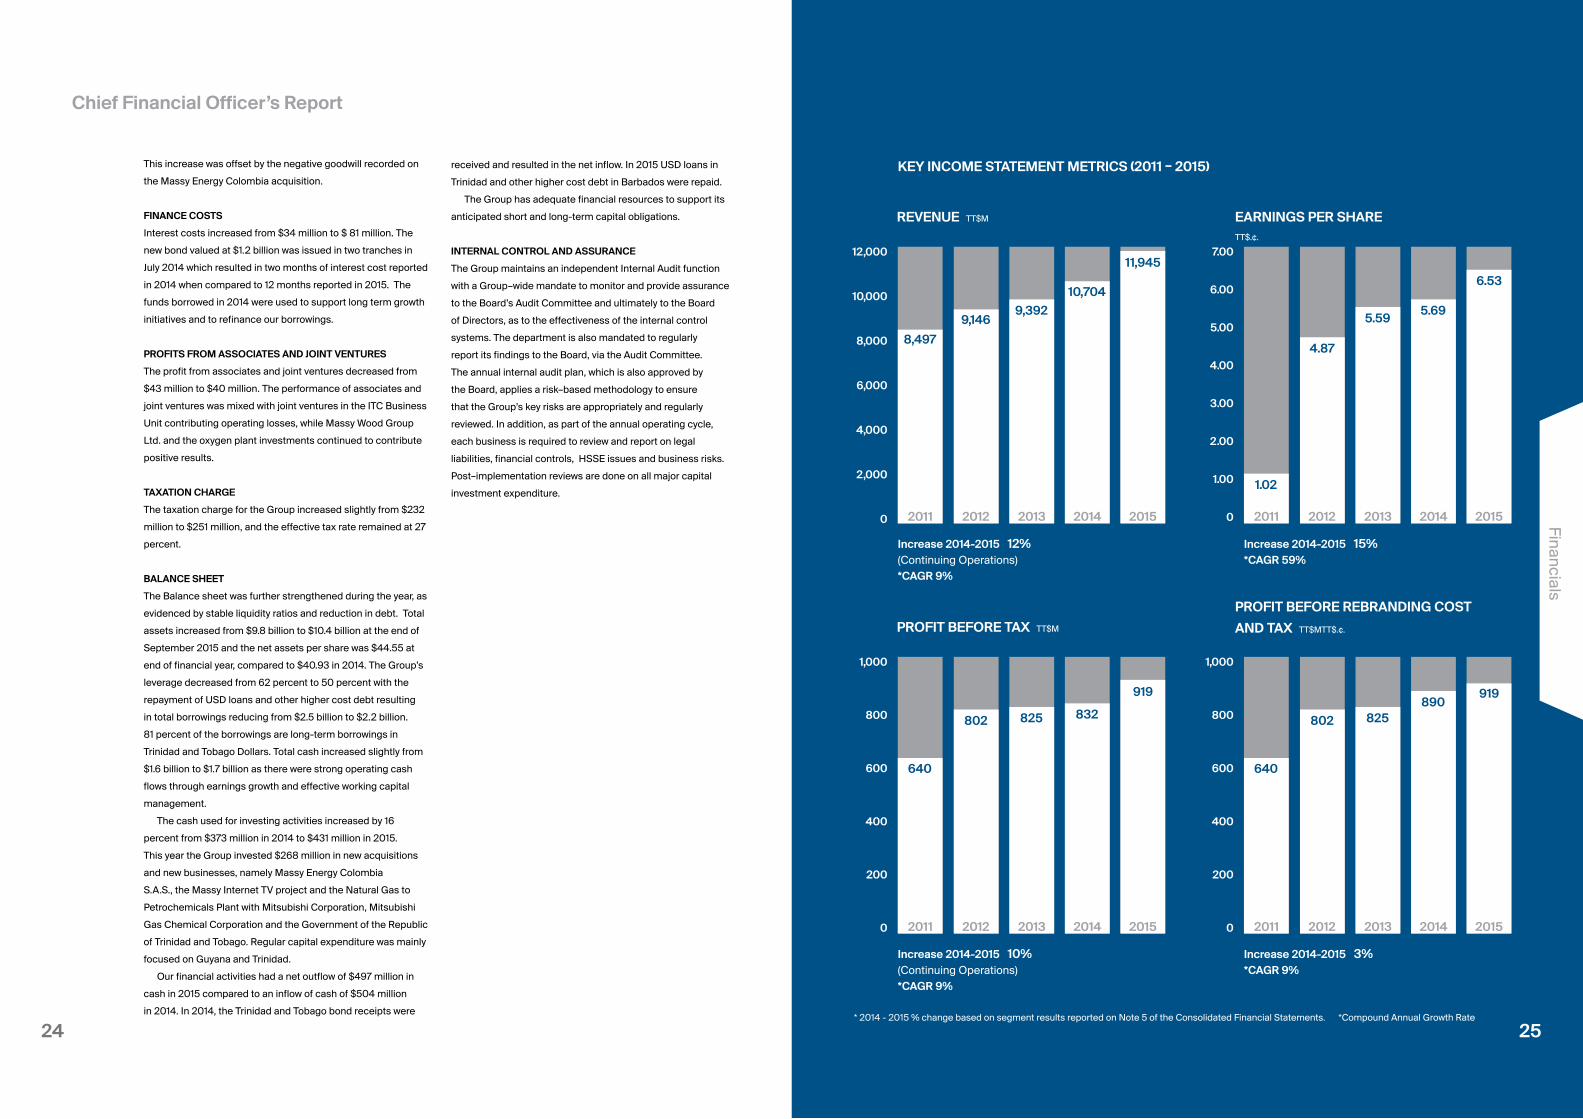
REVENUE TT$M
PROFIT BEFORE TAX TT$M
EARNINGS PER SHARE TT$.¢.
PROFIT BEFORE REBRANDING COST
AND TAX TT$MTT$.¢.
Increase 2014-2015 12%(Continuing Operations)*CAGR 9%
Increase 2014-2015 10%(Continuing Operations)*CAGR 9%
Increase 2014-2015 15%*CAGR 59%
Increase 2014-2015 3%*CAGR 9%
12,000
10,000
8,000
6,000
4,000
2,000
0
1,000
800
600
400
200
0
7.00
6.00
5.00
4.00
3.00
2.00
1.00
0
1,000
800
600
400
200
0
* 2014 - 2015 % change based on segment results reported on Note 5 of the Consolidated Financial Statements. *Compound Annual Growth Rate
2011
2011
2011
2011
2012
2012
2012
2012
2013
2013
2013
2013
2014
2014
2014
2014
2015
2015
2015
2015
8,497
640
1.02
640
9,146
802
4.87
802
9,392
825
5.59
825
10,704
832
5.69
890
11,945
919
6.53
919
KEY INCOME STATEMENT METRICS (2011 – 2015)received and resulted in the net inflow. In 2015 USD loans in
Trinidad and other higher cost debt in Barbados were repaid.
The Group has adequate financial resources to support its
anticipated short and long-term capital obligations.
INTERNAL CONTROL AND ASSURANCE
The Group maintains an independent Internal Audit function
with a Group–wide mandate to monitor and provide assurance
to the Board’s Audit Committee and ultimately to the Board
of Directors, as to the effectiveness of the internal control
systems. The department is also mandated to regularly
report its findings to the Board, via the Audit Committee.
The annual internal audit plan, which is also approved by
the Board, applies a risk–based methodology to ensure
that the Group’s key risks are appropriately and regularly
reviewed. In addition, as part of the annual operating cycle,
each business is required to review and report on legal
liabilities, financial controls, HSSE issues and business risks.
Post–implementation reviews are done on all major capital
investment expenditure.
Chief Financial Officer’s Report
2726
04SegmentReview
Segm
ent Review
27
2928
this market. The market of Valle de Cauca (of which Cali is the
capital) grew 9.9 percent while the brands we sold at Massy
Delima Grupo Automotriz S.A.S. grew 18.4 percent. The
strategies to build our foundation for Massy Motors Colombia
have been similar to those in Trinidad, incorporating strong
supplier relationships, upgrading showrooms and employee
facilities, focusing on customer satisfaction particularly in after
sales and empowering employees with clear direction and
measurement of key performance indicators.
We opened a new Mazda showroom in the North of Cali. Our
Kia dealership in South Cali has been expanded and a new Kia
workshop in the south of Cali was opened to provide additional
after sales support. An additional warehouse for housing new
cars and completing Pre-Delivery Inspection (PDI) away from
the Dealership has led to increased customer parking at the
dealerships and workshops. We also obtained exclusive rights
for selling Fiat in Cali and Eje Cafetero (the coffee zone). The
workshops received 1st and 2nd place ratings in an external
audit by Qualitas (independent firm contracted by FCA – Fiat
Chrysler Automobiles, the parent brand).
Positioning Massy Machinery as a world class Caterpillar
Dealer
Massy Machinery Ltd. continued its drive toward becoming a
world class CAT Dealer. To this end, we have strengthened our
alignment with Caterpillar by focusing on contamination control,
technical certification, customer loyalty, data analytics and
digital solutions. We continue to strive for service excellence
and deeper employee engagement. In 2015, the business
benefited financially from various strategies that we embarked
on in the prior year. Our Energy and Transport Division,
servicing power systems and marine applications, proved to be
successful. Our construction and truck divisions also showed
robust growth.
Expanding National/Alamo franchises into 14 countries
including Colombia
The Belize and Turks and Caicos sublicenses continue to
perform creditably and we were able to secure the franchise
rights to the National Brand for Colombia. In Colombia we
signed a sublicense agreement with Chegwin Goelkel S.A.S.
who now represents the National and Alamo brands across
6 locations in three large Colombian cities, Barranquilla,
Santa Marta and Cartagena. In September 2015 we signed a
new agreement with Enterprise Holdings Ltd. which granted
us usage rights to the Enterprise Brand in 14 territories. We
recently opened a National/Alamo location at the Cali airport.
2014
2014
2014
2015
2015
2015
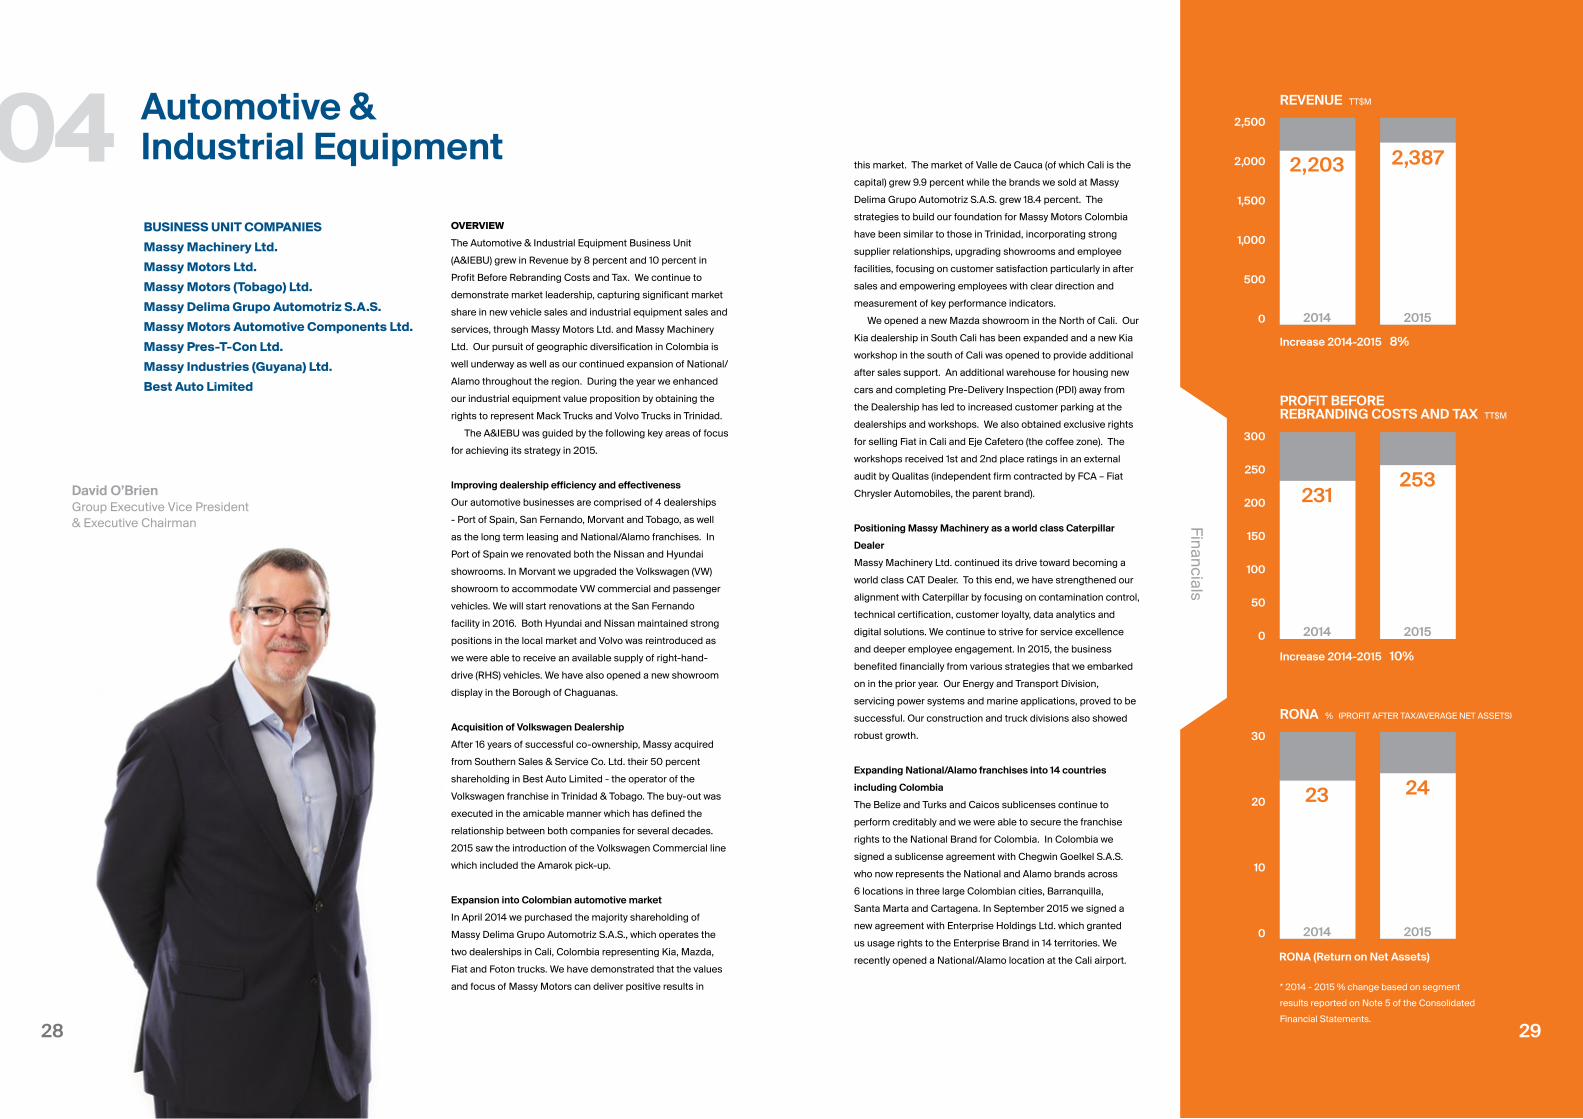
REVENUE TT$M
PROFIT BEFORE REBRANDING COSTS AND TAX TT$M
RONA % (PROFIT AFTER TAX/AVERAGE NET ASSETS)
Increase 2014-2015 8%
Increase 2014-2015 10%
RONA (Return on Net Assets)
2,203
231
23
2,387
253
24
2,500
2,000
1,500
1,000
500
0
300
250
200
150
100
50
0
30
20
10
0
* 2014 - 2015 % change based on segment
results reported on Note 5 of the Consolidated
Financial Statements.
29
Financials
04 Automotive & Industrial Equipment
David O’Brien Group Executive Vice President & Executive Chairman
OVERVIEW
The Automotive & Industrial Equipment Business Unit
(A&IEBU) grew in Revenue by 8 percent and 10 percent in
Profit Before Rebranding Costs and Tax. We continue to
demonstrate market leadership, capturing significant market
share in new vehicle sales and industrial equipment sales and
services, through Massy Motors Ltd. and Massy Machinery
Ltd. Our pursuit of geographic diversification in Colombia is
well underway as well as our continued expansion of National/
Alamo throughout the region. During the year we enhanced
our industrial equipment value proposition by obtaining the
rights to represent Mack Trucks and Volvo Trucks in Trinidad.
The A&IEBU was guided by the following key areas of focus
for achieving its strategy in 2015.
Improving dealership efficiency and effectiveness
Our automotive businesses are comprised of 4 dealerships
- Port of Spain, San Fernando, Morvant and Tobago, as well
as the long term leasing and National/Alamo franchises. In
Port of Spain we renovated both the Nissan and Hyundai
showrooms. In Morvant we upgraded the Volkswagen (VW)
showroom to accommodate VW commercial and passenger
vehicles. We will start renovations at the San Fernando
facility in 2016. Both Hyundai and Nissan maintained strong
positions in the local market and Volvo was reintroduced as
we were able to receive an available supply of right-hand-
drive (RHS) vehicles. We have also opened a new showroom
display in the Borough of Chaguanas.
Acquisition of Volkswagen Dealership
After 16 years of successful co-ownership, Massy acquired
from Southern Sales & Service Co. Ltd. their 50 percent
shareholding in Best Auto Limited - the operator of the
Volkswagen franchise in Trinidad & Tobago. The buy-out was
executed in the amicable manner which has defined the
relationship between both companies for several decades.
2015 saw the introduction of the Volkswagen Commercial line
which included the Amarok pick-up.
Expansion into Colombian automotive market
In April 2014 we purchased the majority shareholding of
Massy Delima Grupo Automotriz S.A.S., which operates the
two dealerships in Cali, Colombia representing Kia, Mazda,
Fiat and Foton trucks. We have demonstrated that the values
and focus of Massy Motors can deliver positive results in
BUSINESS UNIT COMPANIES
Massy Machinery Ltd.
Massy Motors Ltd.
Massy Motors (Tobago) Ltd.
Massy Delima Grupo Automotriz S.A.S.
Massy Motors Automotive Components Ltd.
Massy Pres-T-Con Ltd.
Massy Industries (Guyana) Ltd.
Best Auto Limited
3130
Changing operating model at Massy Automotive Components
Ltd.
In the last year, Massy Automotive Components Ltd. (MACL)
focused on wrapping up manufacturing operations of the
battery business and transitioning to a full importation and
distribution business model. The company also consolidated
the expanded parts wholesaling business to facilitate the
creation of a distribution entity, serving the automotive market.
MACL also concentrated on expanding the Massy Quick
Service Franchise to improve the accessibility of services for its
customers.
HSSE AND CUSTOMER SERVICE
On the service side of the business, our QuikService operations
in Chagauans, Charlieville, Arima and Petit Valley have
significantly reduced the waiting time for a service appointment
while making the service experience much more personal.
The Company’s HSSE performance improved slightly. versus
the prior year with the automotive companies registering 3
lost-time incidents, two of which were motor vehicle related.
All companies surpassed their HSSE input targets and Massy
Motors retained its STOW certification.
Automotive & Industrial Equipment
BUSINESS UNIT COMPANIES
Massy Energy (Trinidad) Ltd.
Massy Energy Engineered Solutions Ltd.
Massy Energy Fabric Maintenance Ltd.
Massy Energy Production Resources Ltd.
Massy Energy Investments Ltd.
Massy Energy Supply Chain Solutions Ltd.
Massy Wood Group Ltd.
Massy Gas Products Holdings Ltd.
Massy Gas Products Ltd.
Massy Gas Products (Trinidad) Ltd.
Energy & Industrial Gases
Eugene Tiah Executive Chairman
Massy Gas Products (Jamaica) Limited
Massy Gas Products (Guyana) Ltd.
Massy Petrochemical Services Ltd.
Massy Gas Products Investments Ltd.
Massy Gas Products Operations Ltd.
Massy Carbonics Ltd.
Caribbean Gas Chemicals Company Ltd.
Massy Energy Colombia S.A.S.
Neal & Massy Kersten Energy Services N.V.
(Suriname)
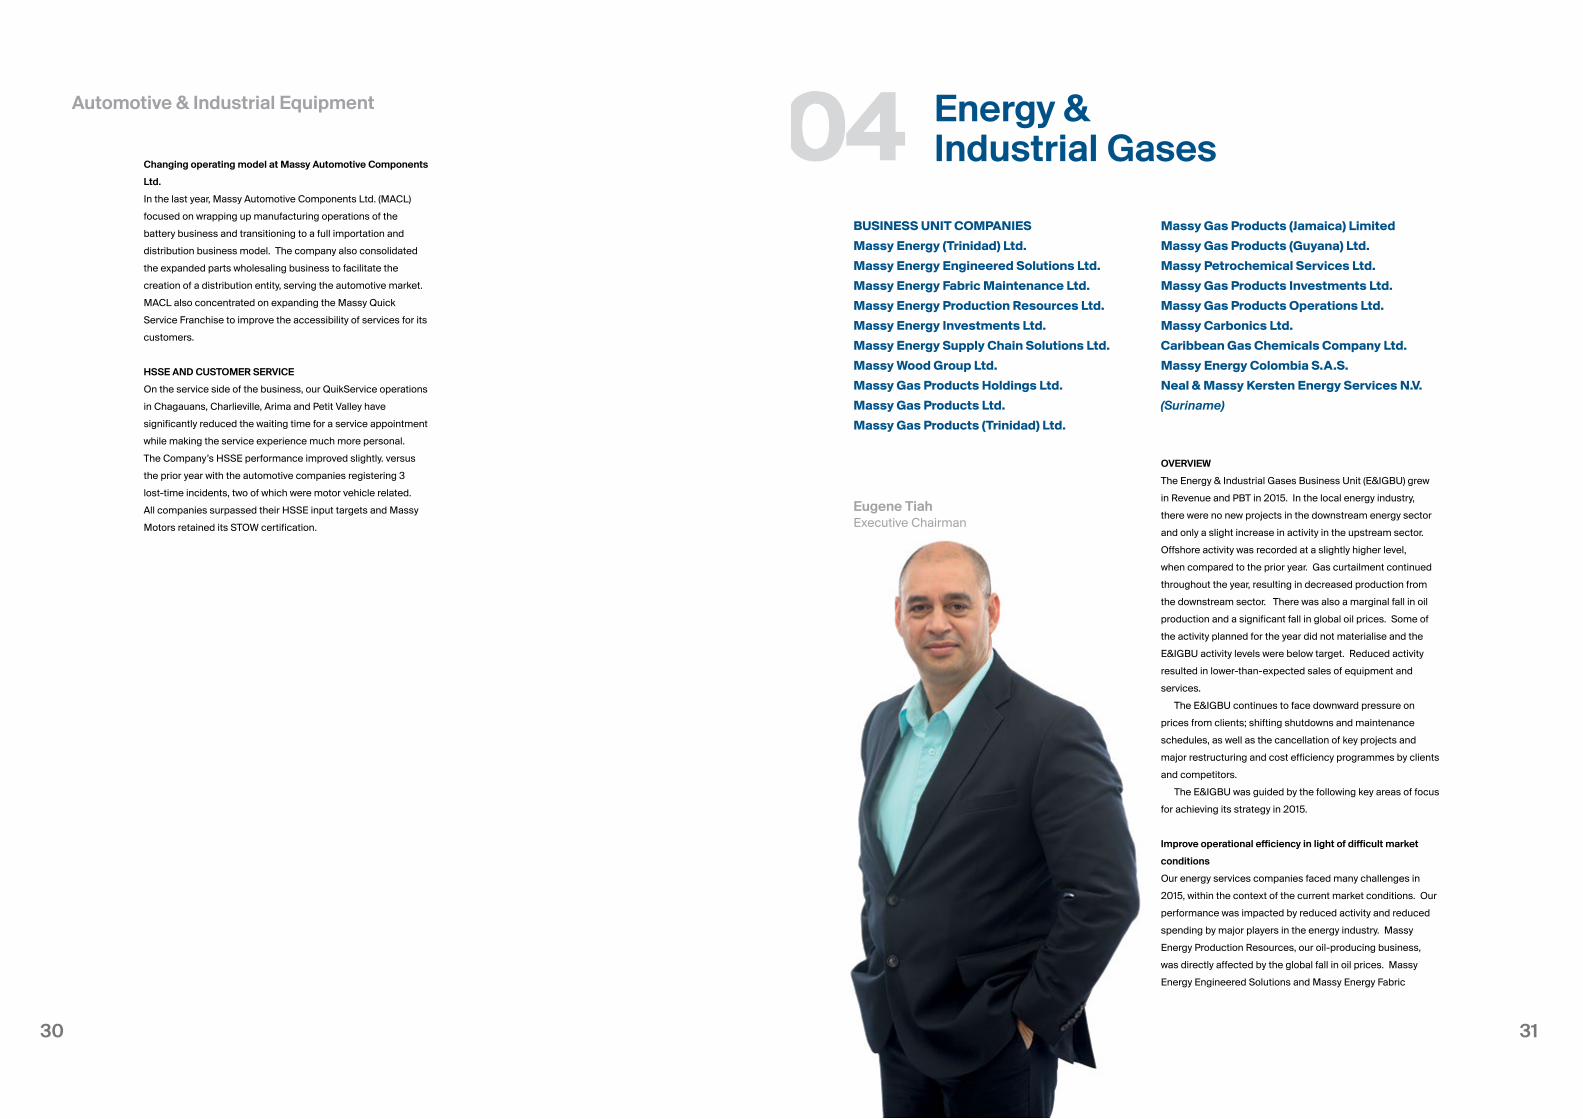
OVERVIEW
The Energy & Industrial Gases Business Unit (E&IGBU) grew
in Revenue and PBT in 2015. In the local energy industry,
there were no new projects in the downstream energy sector
and only a slight increase in activity in the upstream sector.
Offshore activity was recorded at a slightly higher level,
when compared to the prior year. Gas curtailment continued
throughout the year, resulting in decreased production from
the downstream sector. There was also a marginal fall in oil
production and a significant fall in global oil prices. Some of
the activity planned for the year did not materialise and the
E&IGBU activity levels were below target. Reduced activity
resulted in lower-than-expected sales of equipment and
services.
The E&IGBU continues to face downward pressure on
prices from clients; shifting shutdowns and maintenance
schedules, as well as the cancellation of key projects and
major restructuring and cost efficiency programmes by clients
and competitors.
The E&IGBU was guided by the following key areas of focus
for achieving its strategy in 2015.
Improve operational efficiency in light of difficult market
conditions
Our energy services companies faced many challenges in
2015, within the context of the current market conditions. Our
performance was impacted by reduced activity and reduced
spending by major players in the energy industry. Massy
Energy Production Resources, our oil-producing business,
was directly affected by the global fall in oil prices. Massy
Energy Engineered Solutions and Massy Energy Fabric
04
3332
Maintenance were indirectly affected due to the reduction in
spend by the larger oil and gas producers.
E&IGBU initiated a process excellence drive to improve
operational efficiency. This included:
• the review and realignment of key business processes with
business strategy
• the review of existing organisational structures and the
identification of necessary changes to support business
strategy, the assessment of competency development and
assurance frameworks and the selection of a preferred
framework for deployment
• a focus on driving out waste
• the enhancement of collaboration across the Business
Unit operating companies to fully leverage the collective
capability and enhance project and initiative implementation.
Massy Gas Products Trinidad, in pursuit of improved
cost and process efficiency, has commenced a systematic
methodology to introduce available technology to enhance a
number of its processes. These include, but are not limited to,
bar coding to better manage cylinder tracking, on-site invoicing
to minimise conveyance and automation of sections of the
cylinder filling process to increase output per unit time.
Entering new markets and expanding our customer base
Massy Energy Colombia and Massy Wood Group exceeded
expectations despite depressed, global market conditions in
the industry. Massy Wood Group expanded its customer base
in Trinidad with the addition of the Atlantic Train 4 contract.
Further, Massy Wood Group has been awarded a five year
contract, by bpTT, to provide services to its operations in
Trinidad & Tobago. Massy Energy Colombia also secured a
contract extension to provide energy services for Reficar in
Colombia. In Suriname we continue to work through the Massy
-Kersten N.V. to provide instrument and electrical technician
services for the start-up of the new Staatsolie Refinery.
At Massy Gas Products (Trinidad), three new export markets
for liquid carbon dioxide and other industrial gases were added
in 2015. Over the past year, we commenced shipments to
Guyana, Colombia and Curacao and close to year end, signed
a new supply agreement for liquid carbon dioxide with a major
bottler in the Dominican Republic. An investment was made
in the supply and installation of two 30,000 lbs. liquid carbon
dioxide storage tanks at the leading bottler in Haiti. This will
facilitate greater on-island storage and improvement in the
turnaround time of the vessels used to ship the product. Total
exports in 2015 recorded a 18.7 percent year-on-year increase
and this export thrust will continue in 2016.
Our primary project in the downstream sector has been
our investment in the establishment of a Natural Gas to
Petrochemicals Complex, with Mitsubishi Corporation,
2014
2014
2014
2015
2015
2015
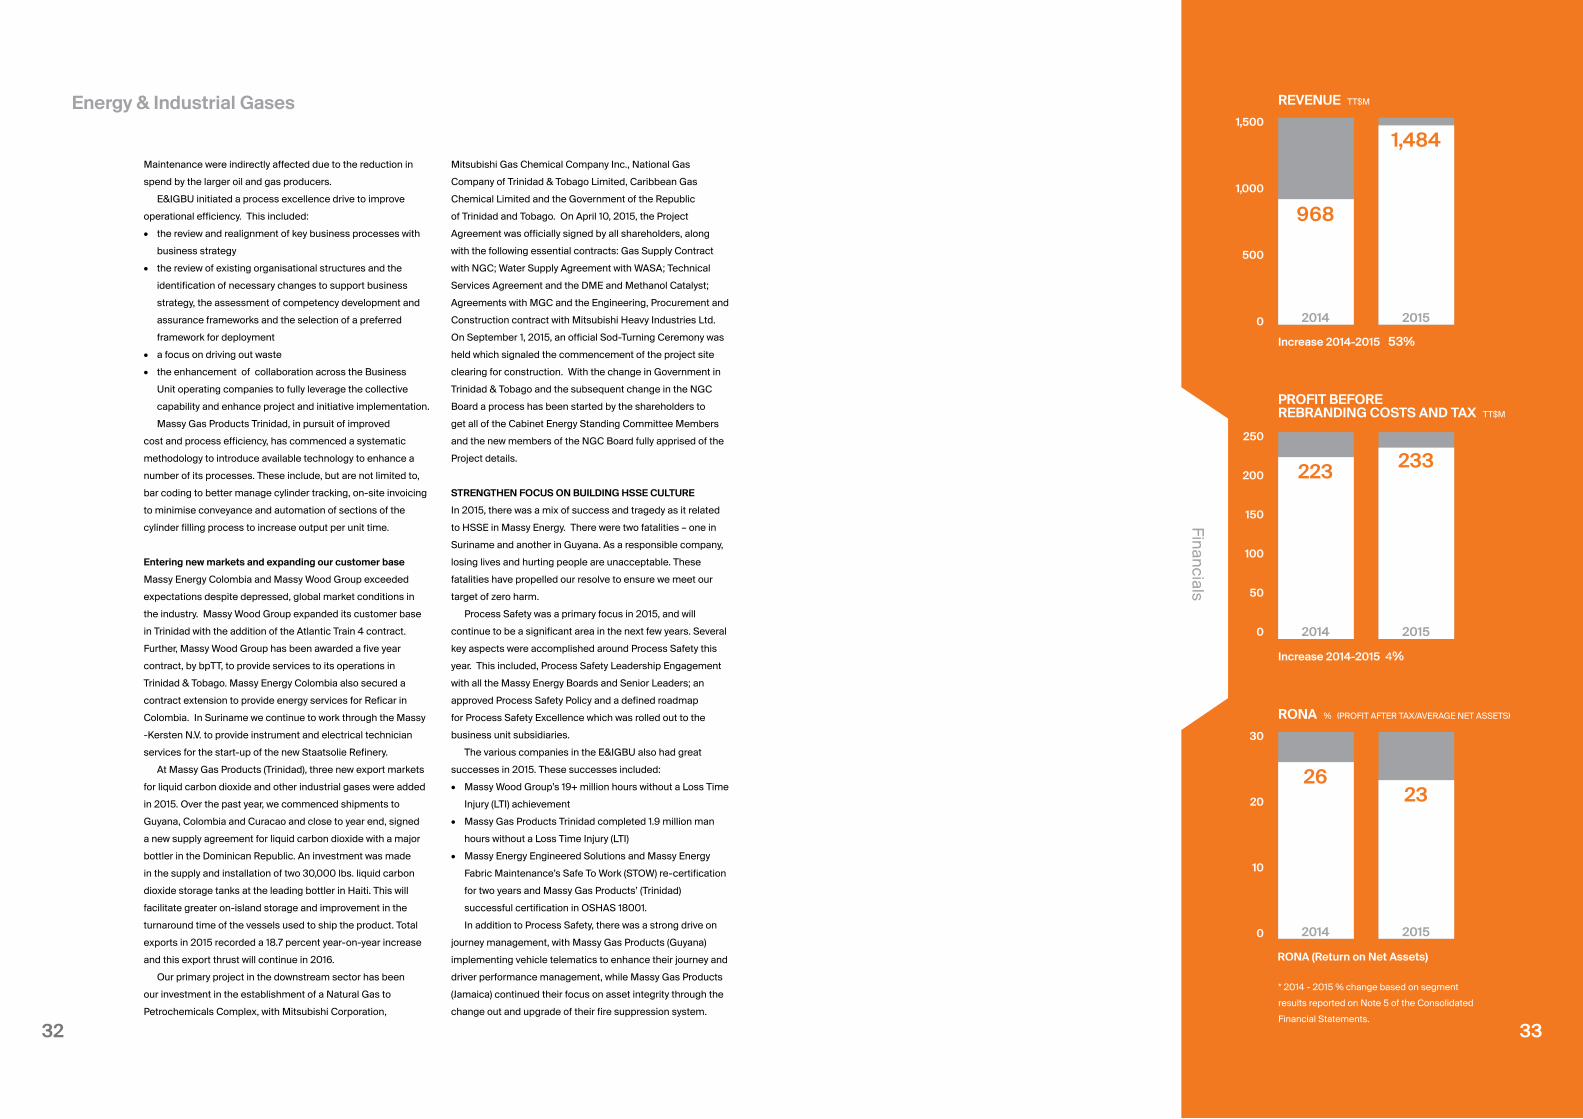
REVENUE TT$M
PROFIT BEFORE REBRANDING COSTS AND TAX TT$M
RONA % (PROFIT AFTER TAX/AVERAGE NET ASSETS)
Increase 2014-2015 53%
Increase 2014-2015 4%
RONA (Return on Net Assets)
968
223
26
1,484
233
23
1,500
1,000
500
0
250
200
150
100
50
0
30
20
10
0
* 2014 - 2015 % change based on segment
results reported on Note 5 of the Consolidated
Financial Statements.
33
Financials
Mitsubishi Gas Chemical Company Inc., National Gas
Company of Trinidad & Tobago Limited, Caribbean Gas
Chemical Limited and the Government of the Republic
of Trinidad and Tobago. On April 10, 2015, the Project
Agreement was officially signed by all shareholders, along
with the following essential contracts: Gas Supply Contract
with NGC; Water Supply Agreement with WASA; Technical
Services Agreement and the DME and Methanol Catalyst;
Agreements with MGC and the Engineering, Procurement and
Construction contract with Mitsubishi Heavy Industries Ltd.
On September 1, 2015, an official Sod-Turning Ceremony was
held which signaled the commencement of the project site
clearing for construction. With the change in Government in
Trinidad & Tobago and the subsequent change in the NGC
Board a process has been started by the shareholders to
get all of the Cabinet Energy Standing Committee Members
and the new members of the NGC Board fully apprised of the
Project details.
STRENGTHEN FOCUS ON BUILDING HSSE CULTURE
In 2015, there was a mix of success and tragedy as it related
to HSSE in Massy Energy. There were two fatalities – one in
Suriname and another in Guyana. As a responsible company,
losing lives and hurting people are unacceptable. These
fatalities have propelled our resolve to ensure we meet our
target of zero harm.
Process Safety was a primary focus in 2015, and will
continue to be a significant area in the next few years. Several
key aspects were accomplished around Process Safety this
year. This included, Process Safety Leadership Engagement
with all the Massy Energy Boards and Senior Leaders; an
approved Process Safety Policy and a defined roadmap
for Process Safety Excellence which was rolled out to the
business unit subsidiaries.
The various companies in the E&IGBU also had great
successes in 2015. These successes included:
• Massy Wood Group’s 19+ million hours without a Loss Time
Injury (LTI) achievement
• Massy Gas Products Trinidad completed 1.9 million man
hours without a Loss Time Injury (LTI)
• Massy Energy Engineered Solutions and Massy Energy
Fabric Maintenance’s Safe To Work (STOW) re-certification
for two years and Massy Gas Products’ (Trinidad)
successful certification in OSHAS 18001.
In addition to Process Safety, there was a strong drive on
journey management, with Massy Gas Products (Guyana)
implementing vehicle telematics to enhance their journey and
driver performance management, while Massy Gas Products
(Jamaica) continued their focus on asset integrity through the
change out and upgrade of their fire suppression system.
Energy & Industrial Gases

3534
transformational benefits, regionally. Once the study has been
completed and the business case approved, the necessary
resources will be put in place to execute the plan.
Shareholder Value Added (SVA), an internal measurement
tool which gauges the value we create for shareholders through
our operations and processes, was further operationalised by
rolling it down to the lower supervisory levels of the IRBU. An
in-depth educational program was developed that allows these
employees to accurately identify the impact of their day-to-day
operational decisions on shareholder value. To further ingrain
this SVA focus during the upcoming financial year, we will
incentivise additional management team members to create
positive shareholder value.
A significant amount of work was also done in the IRBU
to continue to enhance our Customer Service Management
Systems (CSMS), our Health, Safety, Security and Environment
(HSSE) Systems and our ISO Systems across the region.
2014
2014
2014
2015
2015
2015
REVENUE TT$M
PROFIT BEFORE REBRANDING COSTS AND TAX TT$M
RONA % (PROFIT AFTER TAX/AVERAGE NET ASSETS)
Increase 2014-2015 8%
Increase 2014-2015 1%(Includes subgroup charges)
RONA (Return on Net Assets)
6,193
364
15
6,688
367
14
8,000
6,000
4,000
2,000
0
500
400
300
200
100
0
20
15
10
5
0
* 2014 - 2015 % change based on segment
results reported on Note 5 of the Consolidated
Financial Statements.
35
Financials
BUSINESS UNIT COMPANIES
Divisions of Massy Integrated Retail Ltd.
- Massy Stores (Trinidad)
- Massy Distribution
- Massy Trading
Massy Stores (Barbados) Ltd.
Consolidated Foods Ltd. (St. Lucia)
Consolidated Foods Ltd. (St. Vincent)
Massy Distribution Guyana Inc.
- Massy Distribution
- Massy Trading
Integrated Retail
Earl Boodasingh Executive ChairmanIntegrated Retail Business Unit
Massy Distribution (Barbados) Ltd.
Massy Distribution (Jamaica) Ltd.
Massy Distribution (St. Lucia) Ltd.
Massy Finance GFC Ltd.
Massy Remittance Services (Trinidad) Ltd.,
representing the MoneyGram Franchise
Massy Card Ltd.
Massy Credit Plus Ltd.
INDUSTRY OVERVIEW
After a full year of operating under the re-branded Massy,
the Integrated Retail Business Unit (IRBU), which consists
of the Retail, Distribution and Consumer Finance Lines
of Business (LoB), deepened its integration efforts. The
IRBU is responsible for the leading supermarket chain in
Trinidad, Barbados and St. Lucia – Massy Stores – as well
as world-class distribution facilities – Massy Distribution - in
these territories as well as in Guyana and St. Vincent. Our
Consumer Finance LoB leverages the strength of Massy
consumer-facing businesses (in terms of their geographic
footprint and wide customer base of over 600,000 customer
transactions per week), to provide integrated financial and
value-added services. The Consumer Finance LoB, which
was responsible for improving the automotive financing
offerings, developing Massy’s loyalty program and the
closed loop Massy Credit Card, was a significant catalyst in
the integration process and recorded considerable growth
in sign-ups, particularly through Massy Stores, over the
past year. Our retail acquisition in St. Lucia (Gablewoods
Supermart Ltd.) continues to perform well and it should be
noted that the relationship between the distribution and retail
operating companies in St. Lucia was strengthened.
Efforts like these bring the IRBU closer to realising its
vision of executing an Integrated Retail Business Model
in all the territories in which we operate. It also fosters the
spirit of collaboration that we view as a source of competitive
advantage. In addition to improving integration, emphasis
was also placed on elevating our operational efficiency.
The IRBU commenced an extensive review of our financial
and sales business processes specifically in the retail
and distribution operations in Trinidad and Barbados. The
objective of this initiative was to explore the introduction
of global best practices which will lead to reduced cost
through efficiency improvements and generally redound to
04
3736
re-brand three additional stores in the next year. In St. Vincent,
we converted our three Save-A-Lot stores, rebranded to Massy
Stores, to the traditional supermarket format.
In Barbados, we refurbished our Six Roads store and had
a full year performance at our Haggatt Hall location. We have
established that there is cannibalisation in our current store
network in the south east of Barbados. This resulted in the
decision to close our branch in Sargeant’s Village (JB’s) leaving
us with an opportunity to leverage the property at this location
which we own, by opening a discounter format store, focusing
on limited product range and price.
Growth in new markets
In Guyana, work commenced on our first store located in
Providence, which will be opening early in 2016. Notably,
this will be our 47th store across all territories. Additionally,
construction work began on our second store which is a
planned SuperCentre in the Movietowne complex Georgetown,
taking our retail presence to 5 territories.
This year we recorded a full year of results in St. Lucia and
St. Vincent as opposed to 9 months in the previous year. We
continue to make progress on the integration of the acquisition
into the wider, regional, retail group.
Operational efficiency and synergies
Cost compression exercises were executed throughout the
existing store network in all territories. There was a sensitisation
and overall drive to monitor expenses which resulted in reduced
spend in areas such as employee costs, maintenance and
training. Notably, in Barbados LED lighting was retrofitted
in three stores and a solar grid installed at the Warrens
SuperCentre in 2015. We will continue to explore the installation
of solar grids in new store development projects including the
Kendal Hill and Sunset Crest locations.
Category management is already in place in St. Lucia and
St. Vincent and is expected to be fully implemented in Trinidad
and Barbados in this financial year. This initiative is being rolled
out in two phases; phase one includes the implementation of
a new organisational structure while phase two involves the
category management system, shelf management criteria
and SKU rationalisation. Additionally, regional procurement is
a priority for the new financial year. In collaboration with Massy
Distribution we intend to continue exploring opportunities to
coordinate and consolidate procurement activities, as well as
expand the range of our private label product lines.
Report standardisation is currently in progress with the roll
out of the QPR financial reporting tool. The implementation has
already been completed in Trinidad and is expected to be rolled
out in Barbados, St. Lucia and St. Vincent in 2016. Notably, SVA
has been included in the QPR reporting tool in Trinidad with the
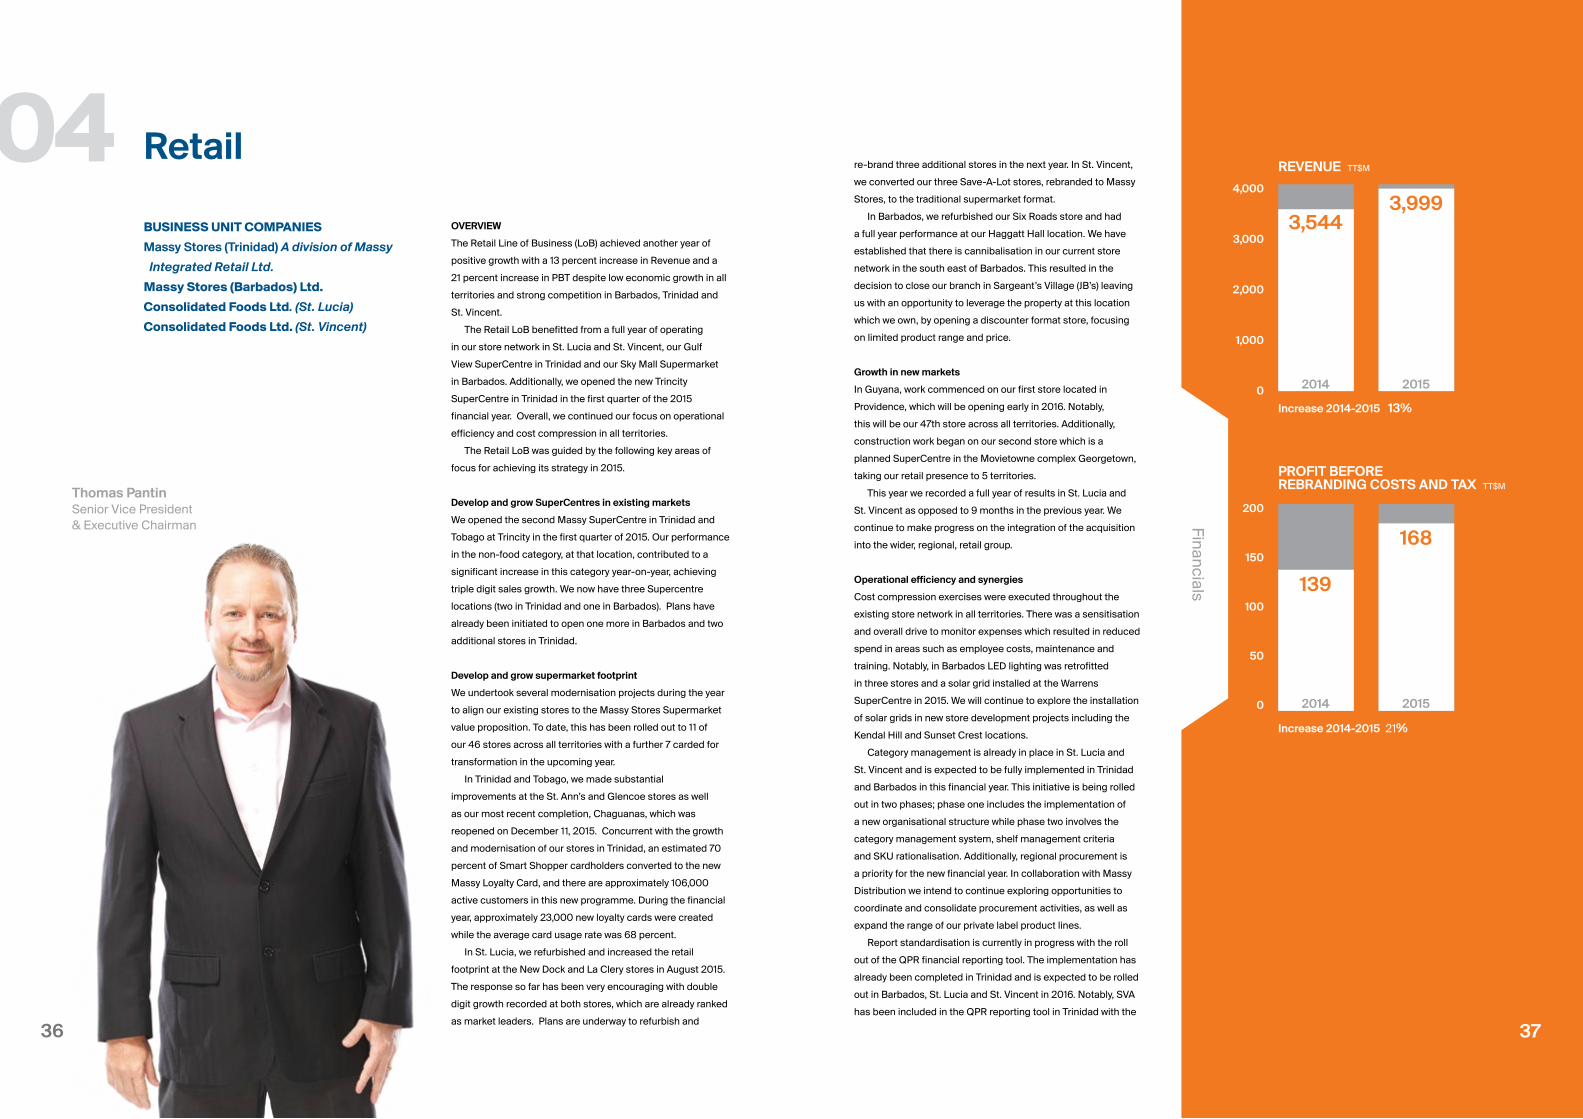
2014
2014
2015
2015
REVENUE TT$M
PROFIT BEFORE REBRANDING COSTS AND TAX TT$M
Increase 2014-2015 13%
Increase 2014-2015 21%
3,544
139
3,999
168
4,000
3,000
2,000
1,000
0
200
150
100
50
0
37
Financials
BUSINESS UNIT COMPANIES
Massy Stores (Trinidad) A division of Massy
Integrated Retail Ltd.
Massy Stores (Barbados) Ltd.
Consolidated Foods Ltd. (St. Lucia)
Consolidated Foods Ltd. (St. Vincent)
Retail
Thomas Pantin Senior Vice President & Executive Chairman
OVERVIEW
The Retail Line of Business (LoB) achieved another year of
positive growth with a 13 percent increase in Revenue and a
21 percent increase in PBT despite low economic growth in all
territories and strong competition in Barbados, Trinidad and
St. Vincent.
The Retail LoB benefitted from a full year of operating
in our store network in St. Lucia and St. Vincent, our Gulf
View SuperCentre in Trinidad and our Sky Mall Supermarket
in Barbados. Additionally, we opened the new Trincity
SuperCentre in Trinidad in the first quarter of the 2015
financial year. Overall, we continued our focus on operational
efficiency and cost compression in all territories.
The Retail LoB was guided by the following key areas of
focus for achieving its strategy in 2015.
Develop and grow SuperCentres in existing markets
We opened the second Massy SuperCentre in Trinidad and
Tobago at Trincity in the first quarter of 2015. Our performance
in the non-food category, at that location, contributed to a
significant increase in this category year-on-year, achieving
triple digit sales growth. We now have three Supercentre
locations (two in Trinidad and one in Barbados). Plans have
already been initiated to open one more in Barbados and two
additional stores in Trinidad.
Develop and grow supermarket footprint
We undertook several modernisation projects during the year
to align our existing stores to the Massy Stores Supermarket
value proposition. To date, this has been rolled out to 11 of
our 46 stores across all territories with a further 7 carded for
transformation in the upcoming year.
In Trinidad and Tobago, we made substantial
improvements at the St. Ann’s and Glencoe stores as well
as our most recent completion, Chaguanas, which was
reopened on December 11, 2015. Concurrent with the growth
and modernisation of our stores in Trinidad, an estimated 70
percent of Smart Shopper cardholders converted to the new
Massy Loyalty Card, and there are approximately 106,000
active customers in this new programme. During the financial
year, approximately 23,000 new loyalty cards were created
while the average card usage rate was 68 percent.
In St. Lucia, we refurbished and increased the retail
footprint at the New Dock and La Clery stores in August 2015.
The response so far has been very encouraging with double
digit growth recorded at both stores, which are already ranked
as market leaders. Plans are underway to refurbish and
04
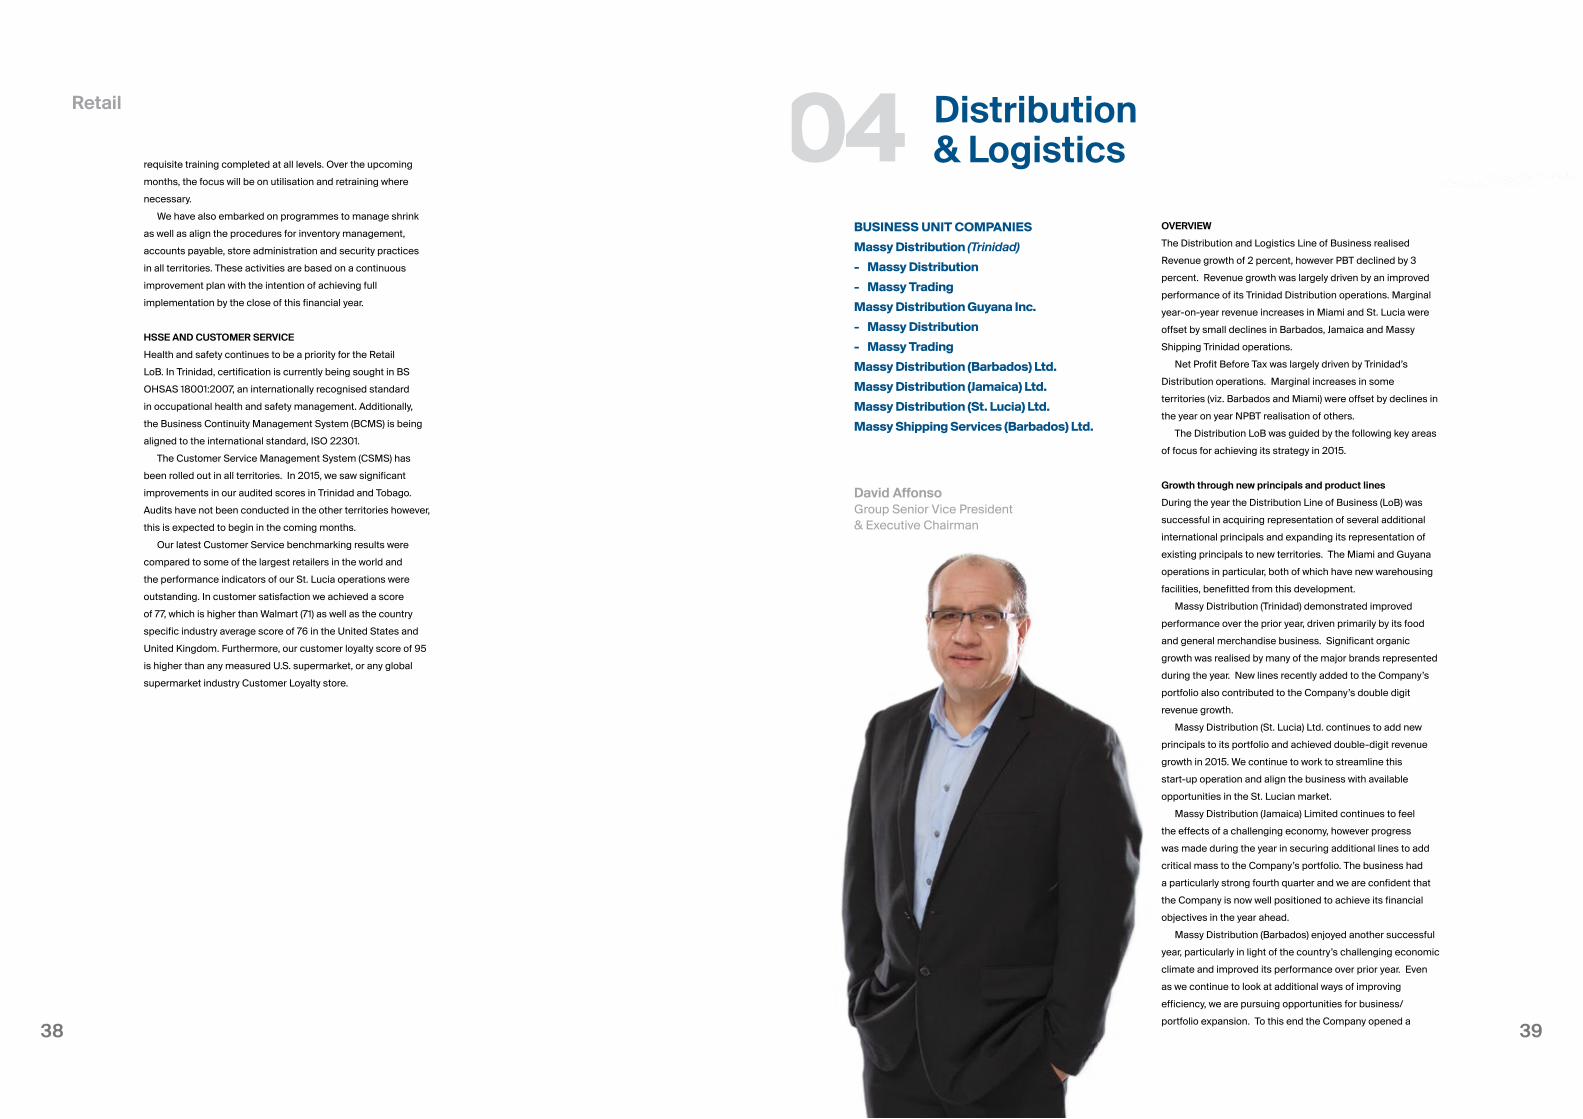
3938
Retail
requisite training completed at all levels. Over the upcoming
months, the focus will be on utilisation and retraining where
necessary.
We have also embarked on programmes to manage shrink
as well as align the procedures for inventory management,
accounts payable, store administration and security practices
in all territories. These activities are based on a continuous
improvement plan with the intention of achieving full
implementation by the close of this financial year.
HSSE AND CUSTOMER SERVICE
Health and safety continues to be a priority for the Retail
LoB. In Trinidad, certification is currently being sought in BS
OHSAS 18001:2007, an internationally recognised standard
in occupational health and safety management. Additionally,
the Business Continuity Management System (BCMS) is being
aligned to the international standard, ISO 22301.
The Customer Service Management System (CSMS) has
been rolled out in all territories. In 2015, we saw significant
improvements in our audited scores in Trinidad and Tobago.
Audits have not been conducted in the other territories however,
this is expected to begin in the coming months.
Our latest Customer Service benchmarking results were
compared to some of the largest retailers in the world and
the performance indicators of our St. Lucia operations were
outstanding. In customer satisfaction we achieved a score
of 77, which is higher than Walmart (71) as well as the country
specific industry average score of 76 in the United States and
United Kingdom. Furthermore, our customer loyalty score of 95
is higher than any measured U.S. supermarket, or any global
supermarket industry Customer Loyalty store.
BUSINESS UNIT COMPANIES
Massy Distribution (Trinidad)
- Massy Distribution
- Massy Trading
Massy Distribution Guyana Inc.
- Massy Distribution
- Massy Trading
Massy Distribution (Barbados) Ltd.
Massy Distribution (Jamaica) Ltd.
Massy Distribution (St. Lucia) Ltd.
Massy Shipping Services (Barbados) Ltd.
Distribution & Logistics
David Affonso Group Senior Vice President & Executive Chairman
OVERVIEW
The Distribution and Logistics Line of Business realised
Revenue growth of 2 percent, however PBT declined by 3
percent. Revenue growth was largely driven by an improved
performance of its Trinidad Distribution operations. Marginal
year-on-year revenue increases in Miami and St. Lucia were
offset by small declines in Barbados, Jamaica and Massy
Shipping Trinidad operations.
Net Profit Before Tax was largely driven by Trinidad’s
Distribution operations. Marginal increases in some
territories (viz. Barbados and Miami) were offset by declines in
the year on year NPBT realisation of others.
The Distribution LoB was guided by the following key areas
of focus for achieving its strategy in 2015.
Growth through new principals and product lines
During the year the Distribution Line of Business (LoB) was
successful in acquiring representation of several additional
international principals and expanding its representation of
existing principals to new territories. The Miami and Guyana
operations in particular, both of which have new warehousing
facilities, benefitted from this development.
Massy Distribution (Trinidad) demonstrated improved
performance over the prior year, driven primarily by its food
and general merchandise business. Significant organic
growth was realised by many of the major brands represented
during the year. New lines recently added to the Company’s
portfolio also contributed to the Company’s double digit
revenue growth.
Massy Distribution (St. Lucia) Ltd. continues to add new
principals to its portfolio and achieved double-digit revenue
growth in 2015. We continue to work to streamline this
start-up operation and align the business with available
opportunities in the St. Lucian market.
Massy Distribution (Jamaica) Limited continues to feel
the effects of a challenging economy, however progress
was made during the year in securing additional lines to add
critical mass to the Company’s portfolio. The business had
a particularly strong fourth quarter and we are confident that
the Company is now well positioned to achieve its financial
objectives in the year ahead.
Massy Distribution (Barbados) enjoyed another successful
year, particularly in light of the country’s challenging economic
climate and improved its performance over prior year. Even
as we continue to look at additional ways of improving
efficiency, we are pursuing opportunities for business/
portfolio expansion. To this end the Company opened a
04
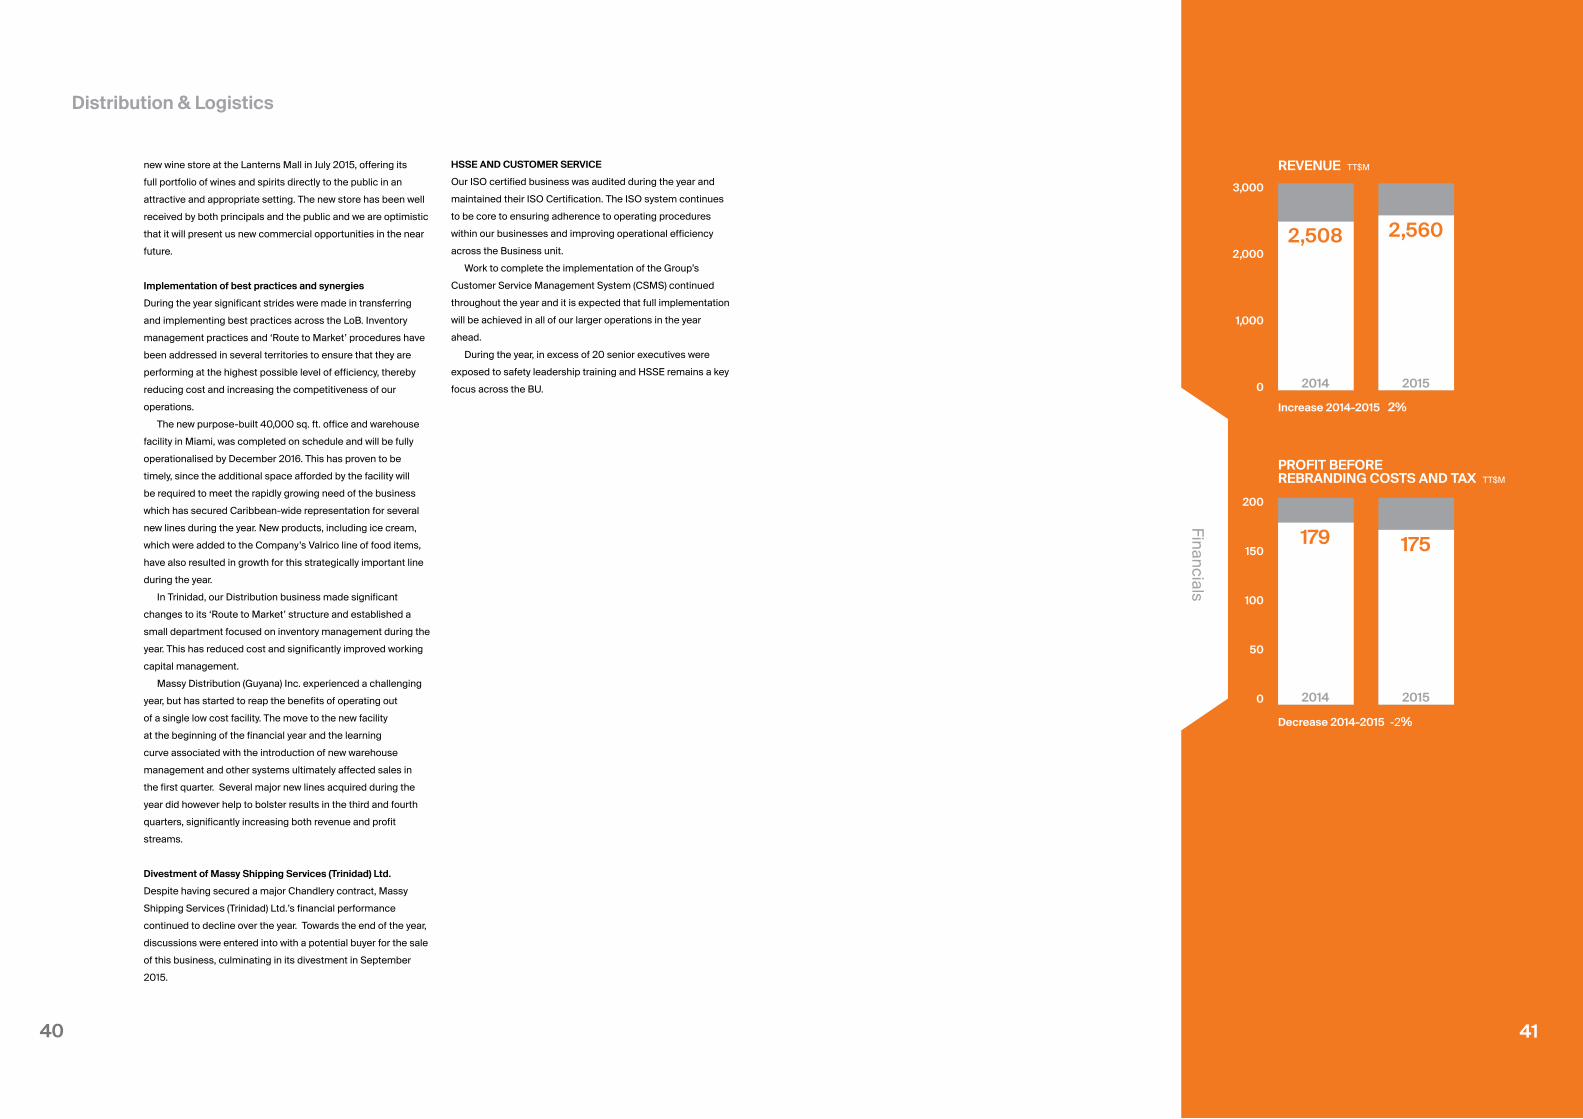
4140
new wine store at the Lanterns Mall in July 2015, offering its
full portfolio of wines and spirits directly to the public in an
attractive and appropriate setting. The new store has been well
received by both principals and the public and we are optimistic
that it will present us new commercial opportunities in the near
future.
Implementation of best practices and synergies
During the year significant strides were made in transferring
and implementing best practices across the LoB. Inventory
management practices and ‘Route to Market’ procedures have
been addressed in several territories to ensure that they are
performing at the highest possible level of efficiency, thereby
reducing cost and increasing the competitiveness of our
operations.
The new purpose-built 40,000 sq. ft. office and warehouse
facility in Miami, was completed on schedule and will be fully
operationalised by December 2016. This has proven to be
timely, since the additional space afforded by the facility will
be required to meet the rapidly growing need of the business
which has secured Caribbean-wide representation for several
new lines during the year. New products, including ice cream,
which were added to the Company’s Valrico line of food items,
have also resulted in growth for this strategically important line
during the year.
In Trinidad, our Distribution business made significant
changes to its ‘Route to Market’ structure and established a
small department focused on inventory management during the
year. This has reduced cost and significantly improved working
capital management.
Massy Distribution (Guyana) Inc. experienced a challenging
year, but has started to reap the benefits of operating out
of a single low cost facility. The move to the new facility
at the beginning of the financial year and the learning
curve associated with the introduction of new warehouse
management and other systems ultimately affected sales in
the first quarter. Several major new lines acquired during the
year did however help to bolster results in the third and fourth
quarters, significantly increasing both revenue and profit
streams.
Divestment of Massy Shipping Services (Trinidad) Ltd.
Despite having secured a major Chandlery contract, Massy
Shipping Services (Trinidad) Ltd.’s financial performance
continued to decline over the year. Towards the end of the year,
discussions were entered into with a potential buyer for the sale
of this business, culminating in its divestment in September
2015.
2014
2014
2015
2015
REVENUE TT$M
PROFIT BEFORE REBRANDING COSTS AND TAX TT$M
Increase 2014-2015 2%
Decrease 2014-2015 -2%
2,508
179
2,560
175
3,000
2,000
1,000
0
200
150
100
50
0
41
Financials
Distribution & Logistics
HSSE AND CUSTOMER SERVICE
Our ISO certified business was audited during the year and
maintained their ISO Certification. The ISO system continues
to be core to ensuring adherence to operating procedures
within our businesses and improving operational efficiency
across the Business unit.
Work to complete the implementation of the Group’s
Customer Service Management System (CSMS) continued
throughout the year and it is expected that full implementation
will be achieved in all of our larger operations in the year
ahead.
During the year, in excess of 20 senior executives were
exposed to safety leadership training and HSSE remains a key
focus across the BU.
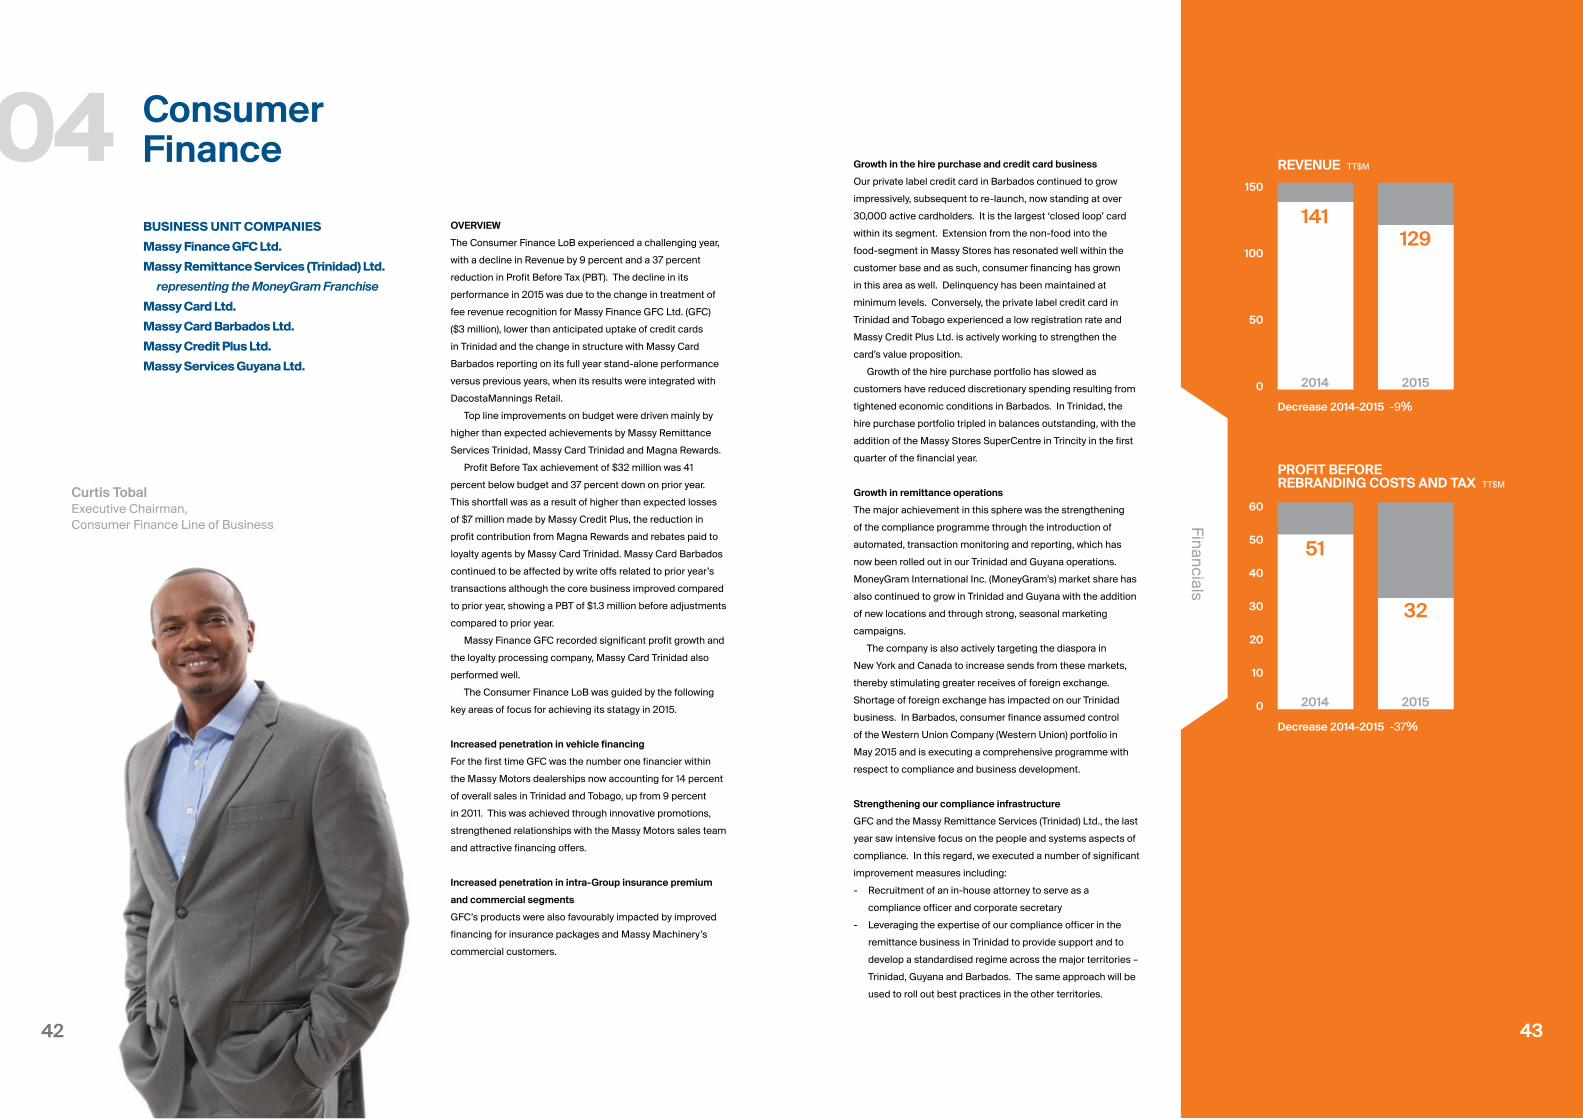
4342
Growth in the hire purchase and credit card business
Our private label credit card in Barbados continued to grow
impressively, subsequent to re-launch, now standing at over
30,000 active cardholders. It is the largest ‘closed loop’ card
within its segment. Extension from the non-food into the
food-segment in Massy Stores has resonated well within the
customer base and as such, consumer financing has grown
in this area as well. Delinquency has been maintained at
minimum levels. Conversely, the private label credit card in
Trinidad and Tobago experienced a low registration rate and
Massy Credit Plus Ltd. is actively working to strengthen the
card’s value proposition.
Growth of the hire purchase portfolio has slowed as
customers have reduced discretionary spending resulting from
tightened economic conditions in Barbados. In Trinidad, the
hire purchase portfolio tripled in balances outstanding, with the
addition of the Massy Stores SuperCentre in Trincity in the first
quarter of the financial year.
Growth in remittance operations
The major achievement in this sphere was the strengthening
of the compliance programme through the introduction of
automated, transaction monitoring and reporting, which has
now been rolled out in our Trinidad and Guyana operations.
MoneyGram International Inc. (MoneyGram’s) market share has
also continued to grow in Trinidad and Guyana with the addition
of new locations and through strong, seasonal marketing
campaigns.
The company is also actively targeting the diaspora in
New York and Canada to increase sends from these markets,
thereby stimulating greater receives of foreign exchange.
Shortage of foreign exchange has impacted on our Trinidad
business. In Barbados, consumer finance assumed control
of the Western Union Company (Western Union) portfolio in
May 2015 and is executing a comprehensive programme with
respect to compliance and business development.
Strengthening our compliance infrastructure
GFC and the Massy Remittance Services (Trinidad) Ltd., the last
year saw intensive focus on the people and systems aspects of
compliance. In this regard, we executed a number of significant
improvement measures including:
- Recruitment of an in-house attorney to serve as a
compliance officer and corporate secretary
- Leveraging the expertise of our compliance officer in the
remittance business in Trinidad to provide support and to
develop a standardised regime across the major territories –
Trinidad, Guyana and Barbados. The same approach will be
used to roll out best practices in the other territories.
2014
2014
2015
2015
REVENUE TT$M
PROFIT BEFORE REBRANDING COSTS AND TAX TT$M
Decrease 2014-2015 -9%
Decrease 2014-2015 -37%
141
51
129
32
150
100
50
0
60
50
40
30
20
10
0
43
Financials
BUSINESS UNIT COMPANIES
Massy Finance GFC Ltd.
Massy Remittance Services (Trinidad) Ltd.
representing the MoneyGram Franchise
Massy Card Ltd.
Massy Card Barbados Ltd.
Massy Credit Plus Ltd.
Massy Services Guyana Ltd.
ConsumerFinance
Curtis Tobal Executive Chairman,Consumer Finance Line of Business
OVERVIEW
The Consumer Finance LoB experienced a challenging year,
with a decline in Revenue by 9 percent and a 37 percent
reduction in Profit Before Tax (PBT). The decline in its
performance in 2015 was due to the change in treatment of
fee revenue recognition for Massy Finance GFC Ltd. (GFC)
($3 million), lower than anticipated uptake of credit cards
in Trinidad and the change in structure with Massy Card
Barbados reporting on its full year stand-alone performance
versus previous years, when its results were integrated with
DacostaMannings Retail.
Top line improvements on budget were driven mainly by
higher than expected achievements by Massy Remittance
Services Trinidad, Massy Card Trinidad and Magna Rewards.
Profit Before Tax achievement of $32 million was 41
percent below budget and 37 percent down on prior year.
This shortfall was as a result of higher than expected losses
of $7 million made by Massy Credit Plus, the reduction in
profit contribution from Magna Rewards and rebates paid to
loyalty agents by Massy Card Trinidad. Massy Card Barbados
continued to be affected by write offs related to prior year’s
transactions although the core business improved compared
to prior year, showing a PBT of $1.3 million before adjustments
compared to prior year.
Massy Finance GFC recorded significant profit growth and
the loyalty processing company, Massy Card Trinidad also
performed well.
The Consumer Finance LoB was guided by the following
key areas of focus for achieving its statagy in 2015.
Increased penetration in vehicle financing
For the first time GFC was the number one financier within
the Massy Motors dealerships now accounting for 14 percent
of overall sales in Trinidad and Tobago, up from 9 percent
in 2011. This was achieved through innovative promotions,
strengthened relationships with the Massy Motors sales team
and attractive financing offers.
Increased penetration in intra-Group insurance premium
and commercial segments
GFC’s products were also favourably impacted by improved
financing for insurance packages and Massy Machinery’s
commercial customers.
04
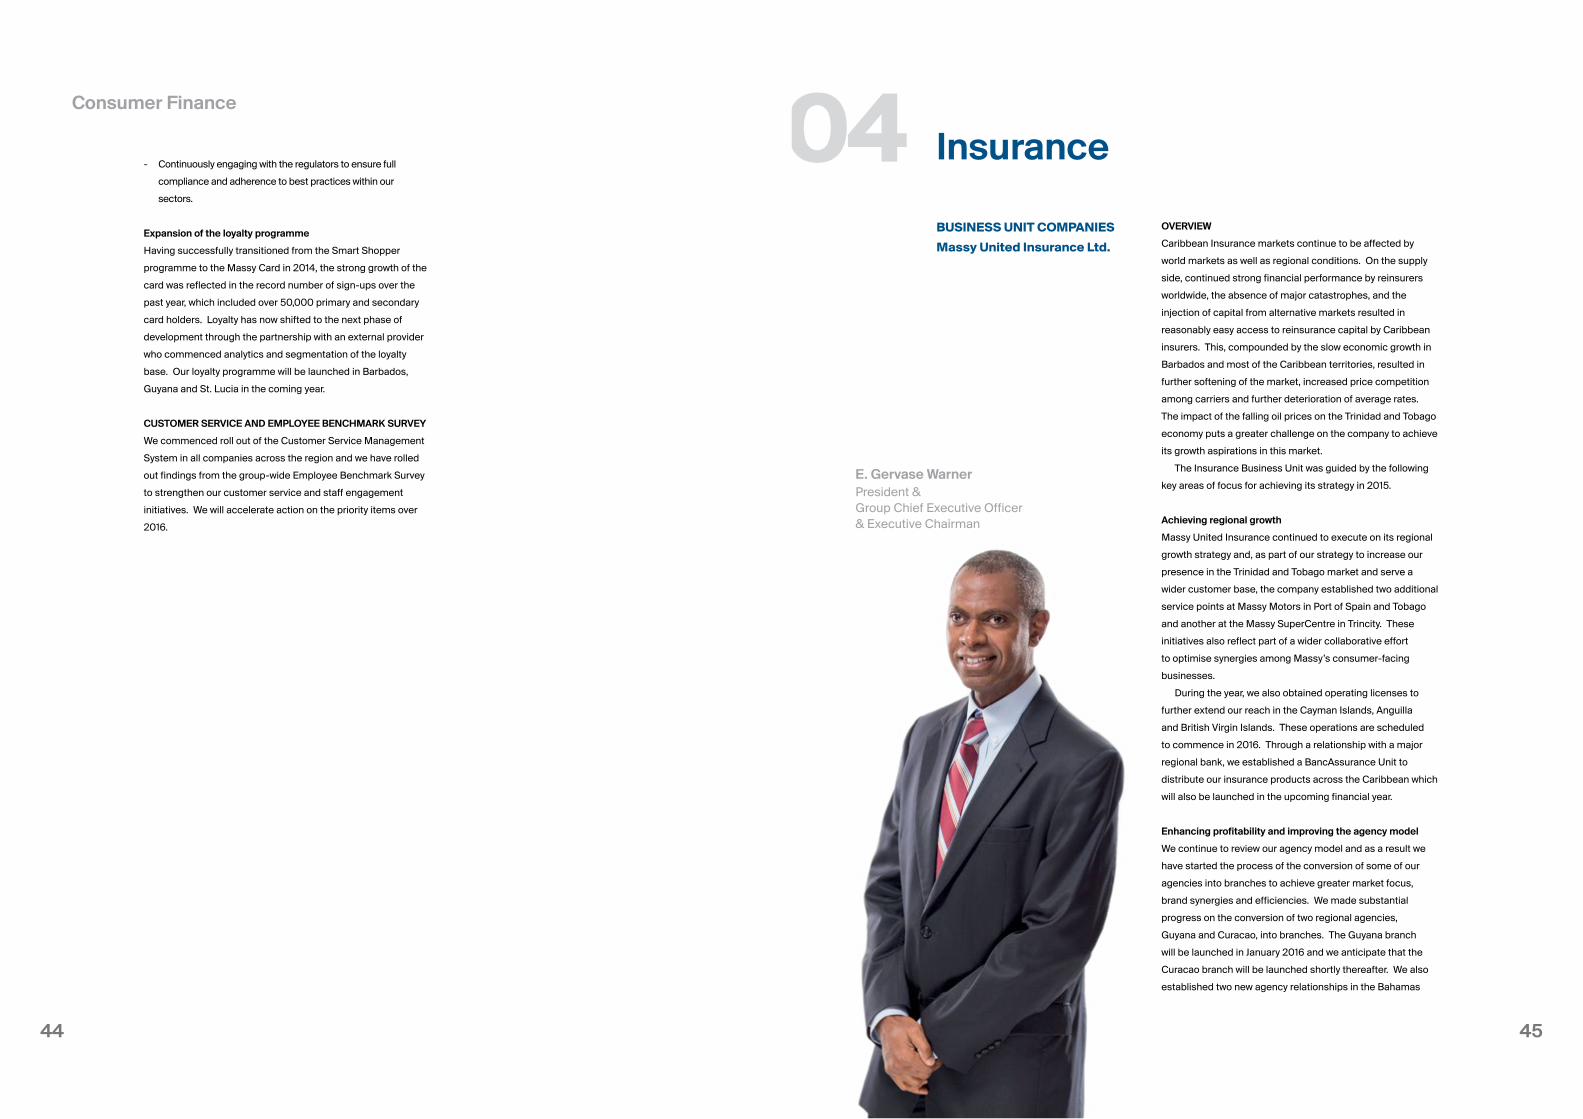
4544
BUSINESS UNIT COMPANIES
Massy United Insurance Ltd.
Insurance
E. Gervase Warner President & Group Chief Executive Officer& Executive Chairman
OVERVIEW
Caribbean Insurance markets continue to be affected by
world markets as well as regional conditions. On the supply
side, continued strong financial performance by reinsurers
worldwide, the absence of major catastrophes, and the
injection of capital from alternative markets resulted in
reasonably easy access to reinsurance capital by Caribbean
insurers. This, compounded by the slow economic growth in
Barbados and most of the Caribbean territories, resulted in
further softening of the market, increased price competition
among carriers and further deterioration of average rates.
The impact of the falling oil prices on the Trinidad and Tobago
economy puts a greater challenge on the company to achieve
its growth aspirations in this market.
The Insurance Business Unit was guided by the following
key areas of focus for achieving its strategy in 2015.
Achieving regional growth
Massy United Insurance continued to execute on its regional
growth strategy and, as part of our strategy to increase our
presence in the Trinidad and Tobago market and serve a
wider customer base, the company established two additional
service points at Massy Motors in Port of Spain and Tobago
and another at the Massy SuperCentre in Trincity. These
initiatives also reflect part of a wider collaborative effort
to optimise synergies among Massy’s consumer-facing
businesses.
During the year, we also obtained operating licenses to
further extend our reach in the Cayman Islands, Anguilla
and British Virgin Islands. These operations are scheduled
to commence in 2016. Through a relationship with a major
regional bank, we established a BancAssurance Unit to
distribute our insurance products across the Caribbean which
will also be launched in the upcoming financial year.
Enhancing profitability and improving the agency model
We continue to review our agency model and as a result we
have started the process of the conversion of some of our
agencies into branches to achieve greater market focus,
brand synergies and efficiencies. We made substantial
progress on the conversion of two regional agencies,
Guyana and Curacao, into branches. The Guyana branch
will be launched in January 2016 and we anticipate that the
Curacao branch will be launched shortly thereafter. We also
established two new agency relationships in the Bahamas
04- Continuously engaging with the regulators to ensure full
compliance and adherence to best practices within our
sectors.
Expansion of the loyalty programme
Having successfully transitioned from the Smart Shopper
programme to the Massy Card in 2014, the strong growth of the
card was reflected in the record number of sign-ups over the
past year, which included over 50,000 primary and secondary
card holders. Loyalty has now shifted to the next phase of
development through the partnership with an external provider
who commenced analytics and segmentation of the loyalty
base. Our loyalty programme will be launched in Barbados,
Guyana and St. Lucia in the coming year.
CUSTOMER SERVICE AND EMPLOYEE BENCHMARK SURVEY
We commenced roll out of the Customer Service Management
System in all companies across the region and we have rolled
out findings from the group-wide Employee Benchmark Survey
to strengthen our customer service and staff engagement
initiatives. We will accelerate action on the priority items over
2016.
Consumer Finance
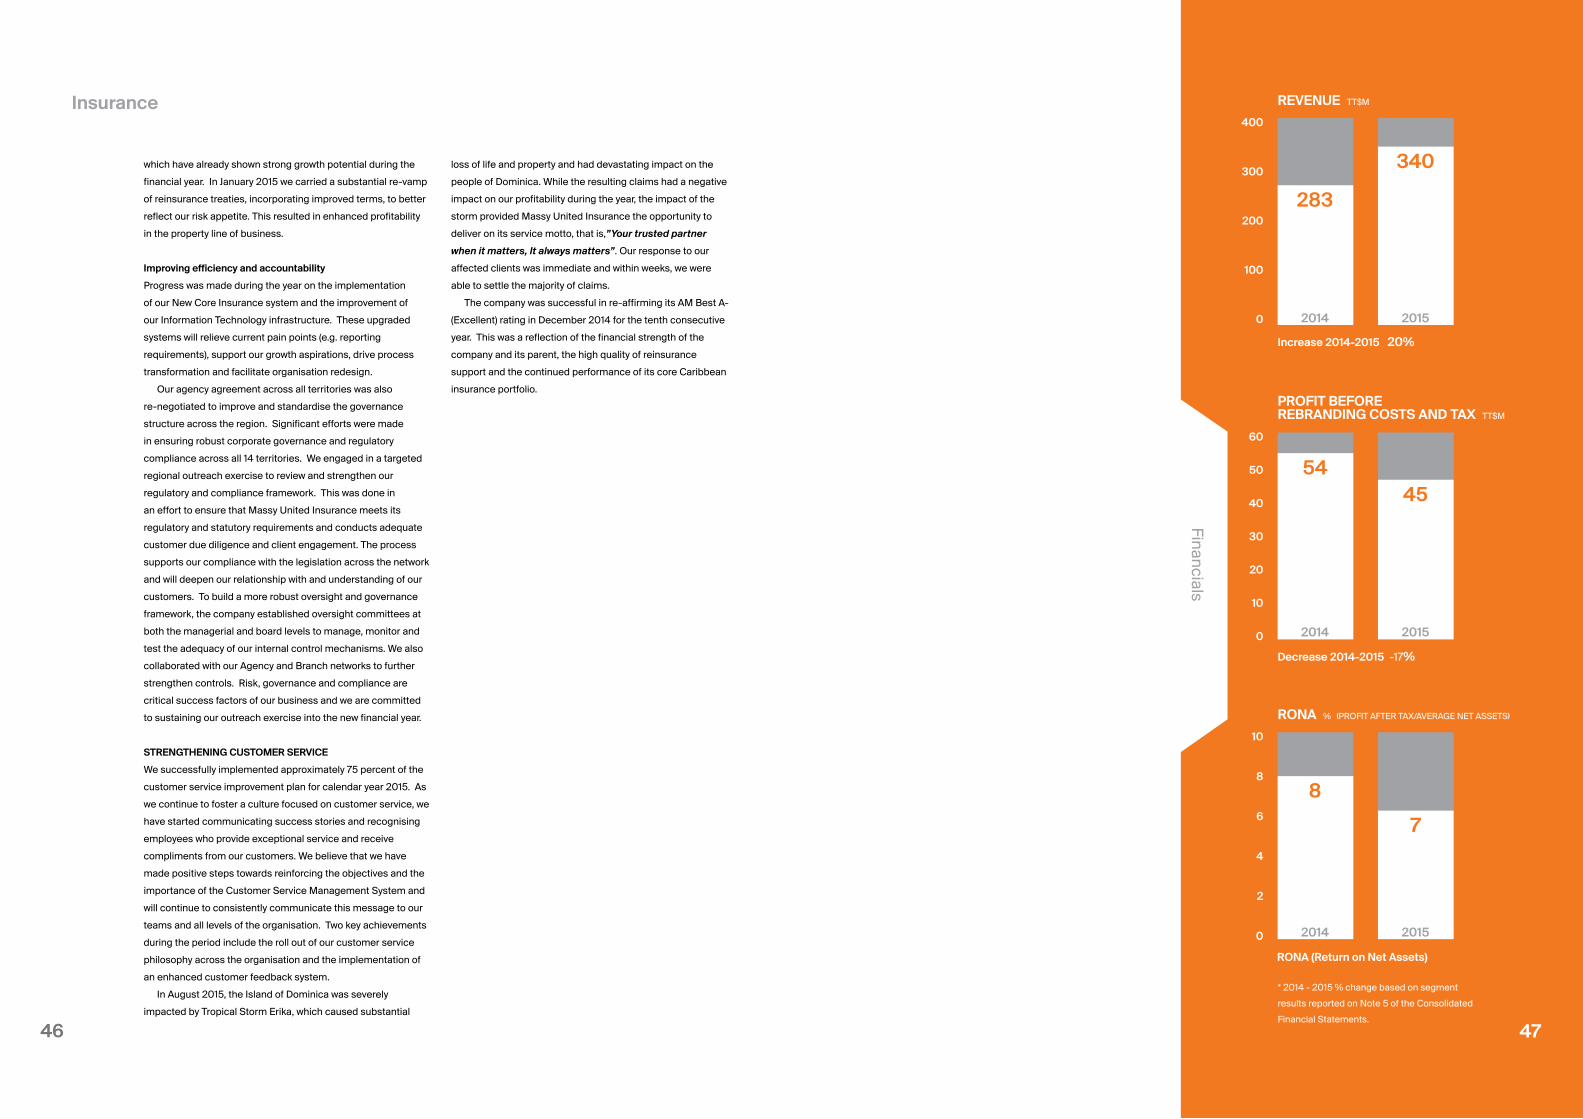
4746
loss of life and property and had devastating impact on the
people of Dominica. While the resulting claims had a negative
impact on our profitability during the year, the impact of the
storm provided Massy United Insurance the opportunity to
deliver on its service motto, that is,”Your trusted partner
when it matters, It always matters”. Our response to our
affected clients was immediate and within weeks, we were
able to settle the majority of claims.
The company was successful in re-affirming its AM Best A-
(Excellent) rating in December 2014 for the tenth consecutive
year. This was a reflection of the financial strength of the
company and its parent, the high quality of reinsurance
support and the continued performance of its core Caribbean
insurance portfolio.
Insurance
2014
2014
2014
2015
2015
2015
REVENUE TT$M
PROFIT BEFORE REBRANDING COSTS AND TAX TT$M
RONA % (PROFIT AFTER TAX/AVERAGE NET ASSETS)
Increase 2014-2015 20%
Decrease 2014-2015 -17%
RONA (Return on Net Assets)
283
54
8
340
45
7
400
300
200
100
0
60
50
40
30
20
10
0
10
8
6
4
2
0
* 2014 - 2015 % change based on segment
results reported on Note 5 of the Consolidated
Financial Statements.
47
Financials
which have already shown strong growth potential during the
financial year. In January 2015 we carried a substantial re-vamp
of reinsurance treaties, incorporating improved terms, to better
reflect our risk appetite. This resulted in enhanced profitability
in the property line of business.
Improving efficiency and accountability
Progress was made during the year on the implementation
of our New Core Insurance system and the improvement of
our Information Technology infrastructure. These upgraded
systems will relieve current pain points (e.g. reporting
requirements), support our growth aspirations, drive process
transformation and facilitate organisation redesign.
Our agency agreement across all territories was also
re-negotiated to improve and standardise the governance
structure across the region. Significant efforts were made
in ensuring robust corporate governance and regulatory
compliance across all 14 territories. We engaged in a targeted
regional outreach exercise to review and strengthen our
regulatory and compliance framework. This was done in
an effort to ensure that Massy United Insurance meets its
regulatory and statutory requirements and conducts adequate
customer due diligence and client engagement. The process
supports our compliance with the legislation across the network
and will deepen our relationship with and understanding of our
customers. To build a more robust oversight and governance
framework, the company established oversight committees at
both the managerial and board levels to manage, monitor and
test the adequacy of our internal control mechanisms. We also
collaborated with our Agency and Branch networks to further
strengthen controls. Risk, governance and compliance are
critical success factors of our business and we are committed
to sustaining our outreach exercise into the new financial year.
STRENGTHENING CUSTOMER SERVICE
We successfully implemented approximately 75 percent of the
customer service improvement plan for calendar year 2015. As
we continue to foster a culture focused on customer service, we
have started communicating success stories and recognising
employees who provide exceptional service and receive
compliments from our customers. We believe that we have
made positive steps towards reinforcing the objectives and the
importance of the Customer Service Management System and
will continue to consistently communicate this message to our
teams and all levels of the organisation. Two key achievements
during the period include the roll out of our customer service
philosophy across the organisation and the implementation of
an enhanced customer feedback system.
In August 2015, the Island of Dominica was severely
impacted by Tropical Storm Erika, which caused substantial
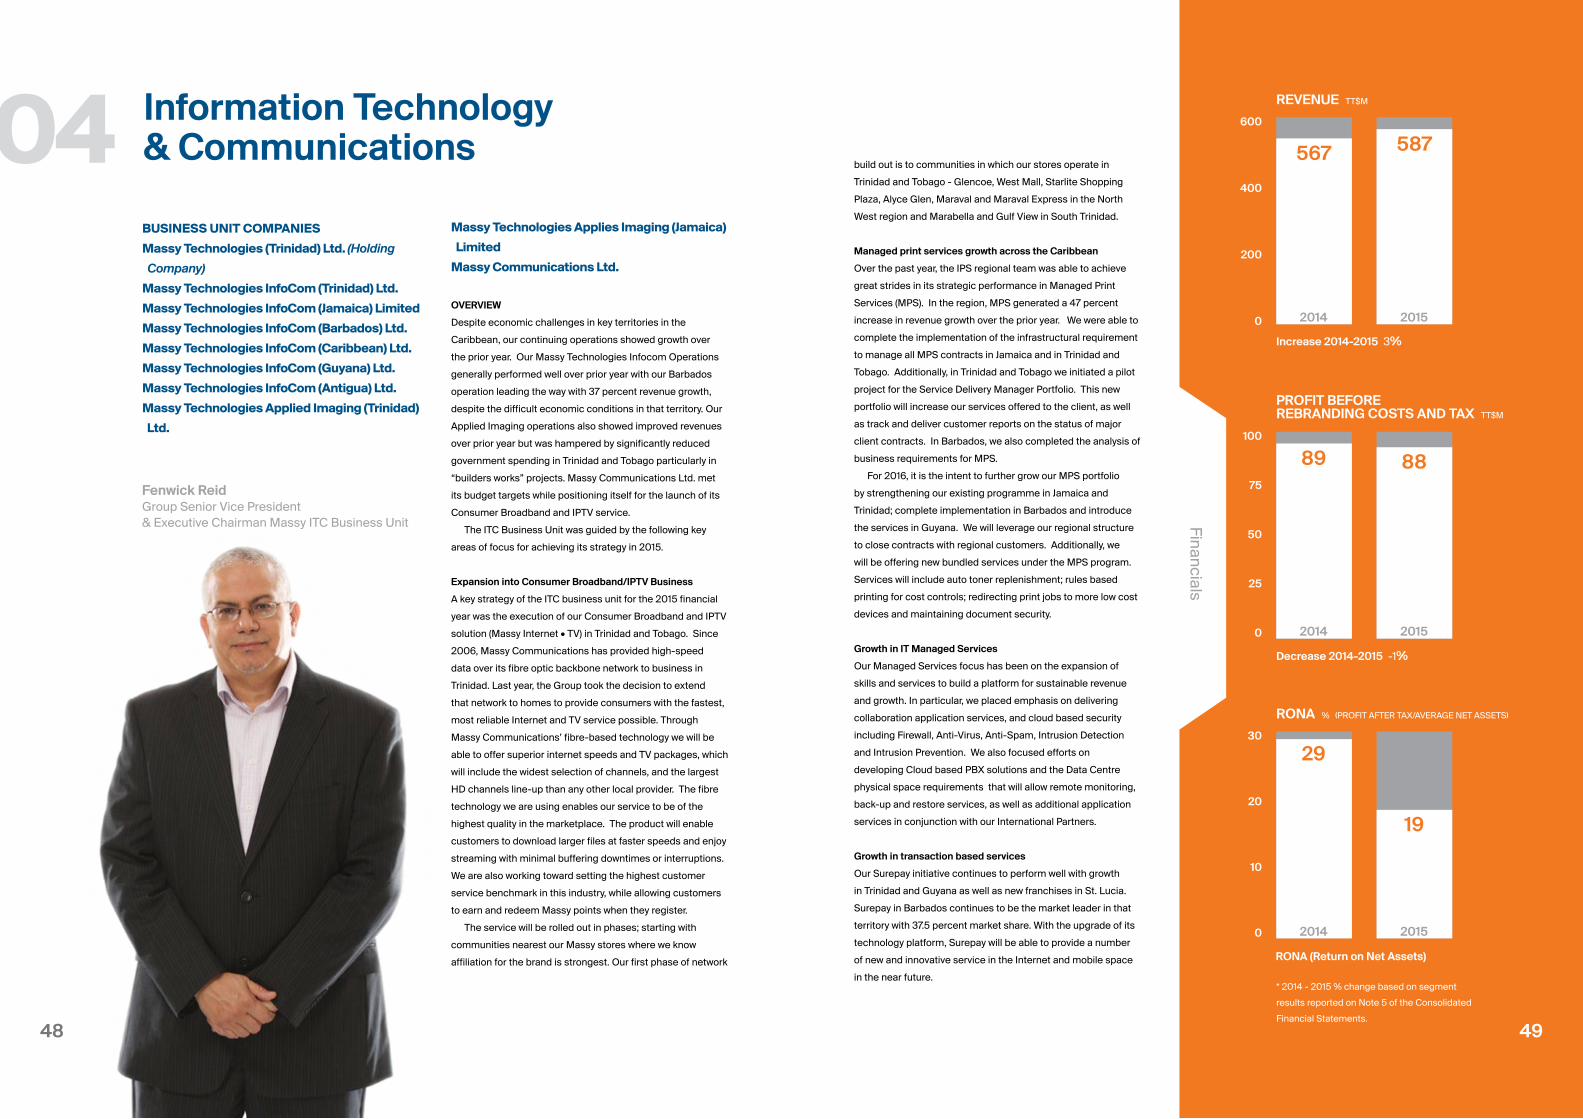
4948
build out is to communities in which our stores operate in
Trinidad and Tobago - Glencoe, West Mall, Starlite Shopping
Plaza, Alyce Glen, Maraval and Maraval Express in the North
West region and Marabella and Gulf View in South Trinidad.
Managed print services growth across the Caribbean
Over the past year, the IPS regional team was able to achieve
great strides in its strategic performance in Managed Print
Services (MPS). In the region, MPS generated a 47 percent
increase in revenue growth over the prior year. We were able to
complete the implementation of the infrastructural requirement
to manage all MPS contracts in Jamaica and in Trinidad and
Tobago. Additionally, in Trinidad and Tobago we initiated a pilot
project for the Service Delivery Manager Portfolio. This new
portfolio will increase our services offered to the client, as well
as track and deliver customer reports on the status of major
client contracts. In Barbados, we also completed the analysis of
business requirements for MPS.
For 2016, it is the intent to further grow our MPS portfolio
by strengthening our existing programme in Jamaica and
Trinidad; complete implementation in Barbados and introduce
the services in Guyana. We will leverage our regional structure
to close contracts with regional customers. Additionally, we
will be offering new bundled services under the MPS program.
Services will include auto toner replenishment; rules based
printing for cost controls; redirecting print jobs to more low cost
devices and maintaining document security.
Growth in IT Managed Services
Our Managed Services focus has been on the expansion of
skills and services to build a platform for sustainable revenue
and growth. In particular, we placed emphasis on delivering
collaboration application services, and cloud based security
including Firewall, Anti-Virus, Anti-Spam, Intrusion Detection
and Intrusion Prevention. We also focused efforts on
developing Cloud based PBX solutions and the Data Centre
physical space requirements that will allow remote monitoring,
back-up and restore services, as well as additional application
services in conjunction with our International Partners.
Growth in transaction based services
Our Surepay initiative continues to perform well with growth
in Trinidad and Guyana as well as new franchises in St. Lucia.
Surepay in Barbados continues to be the market leader in that
territory with 37.5 percent market share. With the upgrade of its
technology platform, Surepay will be able to provide a number
of new and innovative service in the Internet and mobile space
in the near future.
BUSINESS UNIT COMPANIES
Massy Technologies (Trinidad) Ltd. (Holding
Company)
Massy Technologies InfoCom (Trinidad) Ltd.
Massy Technologies InfoCom (Jamaica) Limited
Massy Technologies InfoCom (Barbados) Ltd.
Massy Technologies InfoCom (Caribbean) Ltd.
Massy Technologies InfoCom (Guyana) Ltd.
Massy Technologies InfoCom (Antigua) Ltd.
Massy Technologies Applied Imaging (Trinidad)
Ltd.
Information Technology& Communications
Fenwick Reid Group Senior Vice President & Executive Chairman Massy ITC Business Unit
Massy Technologies Applies Imaging (Jamaica)
Limited
Massy Communications Ltd.
OVERVIEW
Despite economic challenges in key territories in the
Caribbean, our continuing operations showed growth over
the prior year. Our Massy Technologies Infocom Operations
generally performed well over prior year with our Barbados
operation leading the way with 37 percent revenue growth,
despite the difficult economic conditions in that territory. Our
Applied Imaging operations also showed improved revenues
over prior year but was hampered by significantly reduced
government spending in Trinidad and Tobago particularly in
“builders works” projects. Massy Communications Ltd. met
its budget targets while positioning itself for the launch of its
Consumer Broadband and IPTV service.
The ITC Business Unit was guided by the following key
areas of focus for achieving its strategy in 2015.
Expansion into Consumer Broadband/IPTV Business
A key strategy of the ITC business unit for the 2015 financial
year was the execution of our Consumer Broadband and IPTV
solution (Massy Internet • TV) in Trinidad and Tobago. Since
2006, Massy Communications has provided high-speed
data over its fibre optic backbone network to business in
Trinidad. Last year, the Group took the decision to extend
that network to homes to provide consumers with the fastest,
most reliable Internet and TV service possible. Through
Massy Communications’ fibre-based technology we will be
able to offer superior internet speeds and TV packages, which
will include the widest selection of channels, and the largest
HD channels line-up than any other local provider. The fibre
technology we are using enables our service to be of the
highest quality in the marketplace. The product will enable
customers to download larger files at faster speeds and enjoy
streaming with minimal buffering downtimes or interruptions.
We are also working toward setting the highest customer
service benchmark in this industry, while allowing customers
to earn and redeem Massy points when they register.
The service will be rolled out in phases; starting with
communities nearest our Massy stores where we know
affiliation for the brand is strongest. Our first phase of network
04
2014
2014
2014
2015
2015
2015
REVENUE TT$M
PROFIT BEFORE REBRANDING COSTS AND TAX TT$M
RONA % (PROFIT AFTER TAX/AVERAGE NET ASSETS)
Increase 2014-2015 3%
Decrease 2014-2015 -1%
RONA (Return on Net Assets)
567
89
29
587
88
19
600
400
200
0
100
75
50
25
0
30
20
10
0
* 2014 - 2015 % change based on segment
results reported on Note 5 of the Consolidated
Financial Statements.
Financials
49
5150
SUBSIDIARIES
BCB Communications Incorporated (BCB) (51 percent)
recorded a decline in profit versus prior year as a result
of decreased advertising activity by some of its affiliates.
However, on the positive side, the reduction in affiliates
advertising was somewhat offset by an increase in advertising
activity by key external clients. BCB will continue to seek new
growth opportunities locally, as well as leverage the growth of
social media services as more clients look to incorporate this
into their communications plans.
Massy Properties (Barbados) Ltd. experienced a decrease
in profit this year versus prior year, primarily due to increased
expenses and sluggish property sales. Expenses were higher
as a result of government taxation in the form of a solid waste
tax and an increase in land taxes. This was somewhat abated
by an increase in rental income from a full year’s operation
of the fully tenanted Dome Mall and increased revenue
from the real estate division (Massy Realty Ltd.). In the next
financial year - with the recent completion of phase two of the
Dome complex - there will be an additional 18,000 sq. ft. of
commercial space available.
Massy Properties (Trinidad) Ltd. owns several
commercial properties throughout Trinidad & Tobago
and leases to both the public and private sector. Apart
from Commercial Leasing, the Company provides Facility
and Project Management services, Parking, Conference
and Dining facilities to its tenants and the general public.
Notwithstanding a tumultuous 2015 for Trinidad & Tobago,
the Company surpassed the previous year’s revenues and
KPI targets, despite having less than 100 percent occupancy
for almost the entire year. The company continued to focus
on robust cost controls whilst ensuring the buildings and
equipment were well-maintained, with particular attention to
excellent customer service delivery.
Massy Realty (Trinidad) Ltd. continues to provide real
estate brokerage services as well as consultancy services
to a number of clients. The downward pressures in the local
economy, resulting from the contraction in the energy sector,
have affected the commercial and residential rental markets,
however market prices remain unaffected.
Roberts Manufacturing Company Limited (Roberts
Manufacturing) 50.5 percent) had a disappointing year with
decreased profit and sales. During the financial year - due
to increased competition and softer commodity prices -
the company passed on savings to customers in the form
of price reduction. This assisted the livestock industry in
OtherInvestments
SUBSIDIARIES
BCB Communications Inc. (Holding 51%)
Massy Properties (Barbados) Ltd.
Massy Properties (Trinidad) Ltd.
Massy Realty (Trinidad) Ltd.
Roberts Manufacturing Company Limited
(Holding 50.5%)
Seawell Air Services Limited
ASSOCIATES
Caribbean Airport Services Ltd. (Holding 49%)
Signia Financial Group Incorporated (Holding 20%)
Information Technology & Communications
Strengthening overseas investments in Latin America
Our investments in Latin America have shown some
improvement over the past year with Colombia leading the way
with significant performance improvements over prior year and
the implementation of new technology solutions in its home
market.
HSSE AND CUSTOMER SERVICE
Massy Technologies saw positive variances, ranging from
5 – 70 percent in its cumulative HSSE leading indicators
pertaining to training, workplace inspections, audits, facilities
risk assessments, drills and safety meetings. Two of its Trinidad
and Tobago based companies, Massy Technologies Applied
Imaging (Trinidad) Ltd. and Massy Communications were able
to attain recertification of their high level STOW Certification
while Massy Technologies InfoCom (Trinidad) Ltd. maintained
its certification successfully during that period. Our regional
offices in Barbados and Jamaica signed off on 30 HSSE
policies which will contribute to laying the foundation for a
robust safety management system in those territories. The
safety culture initiatives saw the continuation of the quarterly
HSSE Newsletters, the introduction of interactive Stress
Management sessions and HSSE-centered townhall meetings.
Looking forward, HSSE within Massy Technologies will see
new innovative sessions introduced into its HSSE Training
Matrix, continuation of its OSH centered medical surveillance
programme and continued support to its regional offices.
The introduction of the Massy Customer Service
Management System (CSMS) has been a catalyst for change
at Massy Technologies. While customer-centricity has always
been part of our corporate philosophy, the CSMS provides
the opportunity to enhance and strengthen our ability to add
value to our customers. Strategic planning, resulting in the
development and implementation of a number of key activities
over the past year, has augured well for the enhancement of the
Customer Service focus in the organisation. Staff involvement
in the development of the Massy Technologies Group Customer
Service Philosophy has been aptly complemented by the
development and establishment of the leadership engagement
meetings, customer service department meetings and updates
to the recruitment and orientation policy and procedures.
04
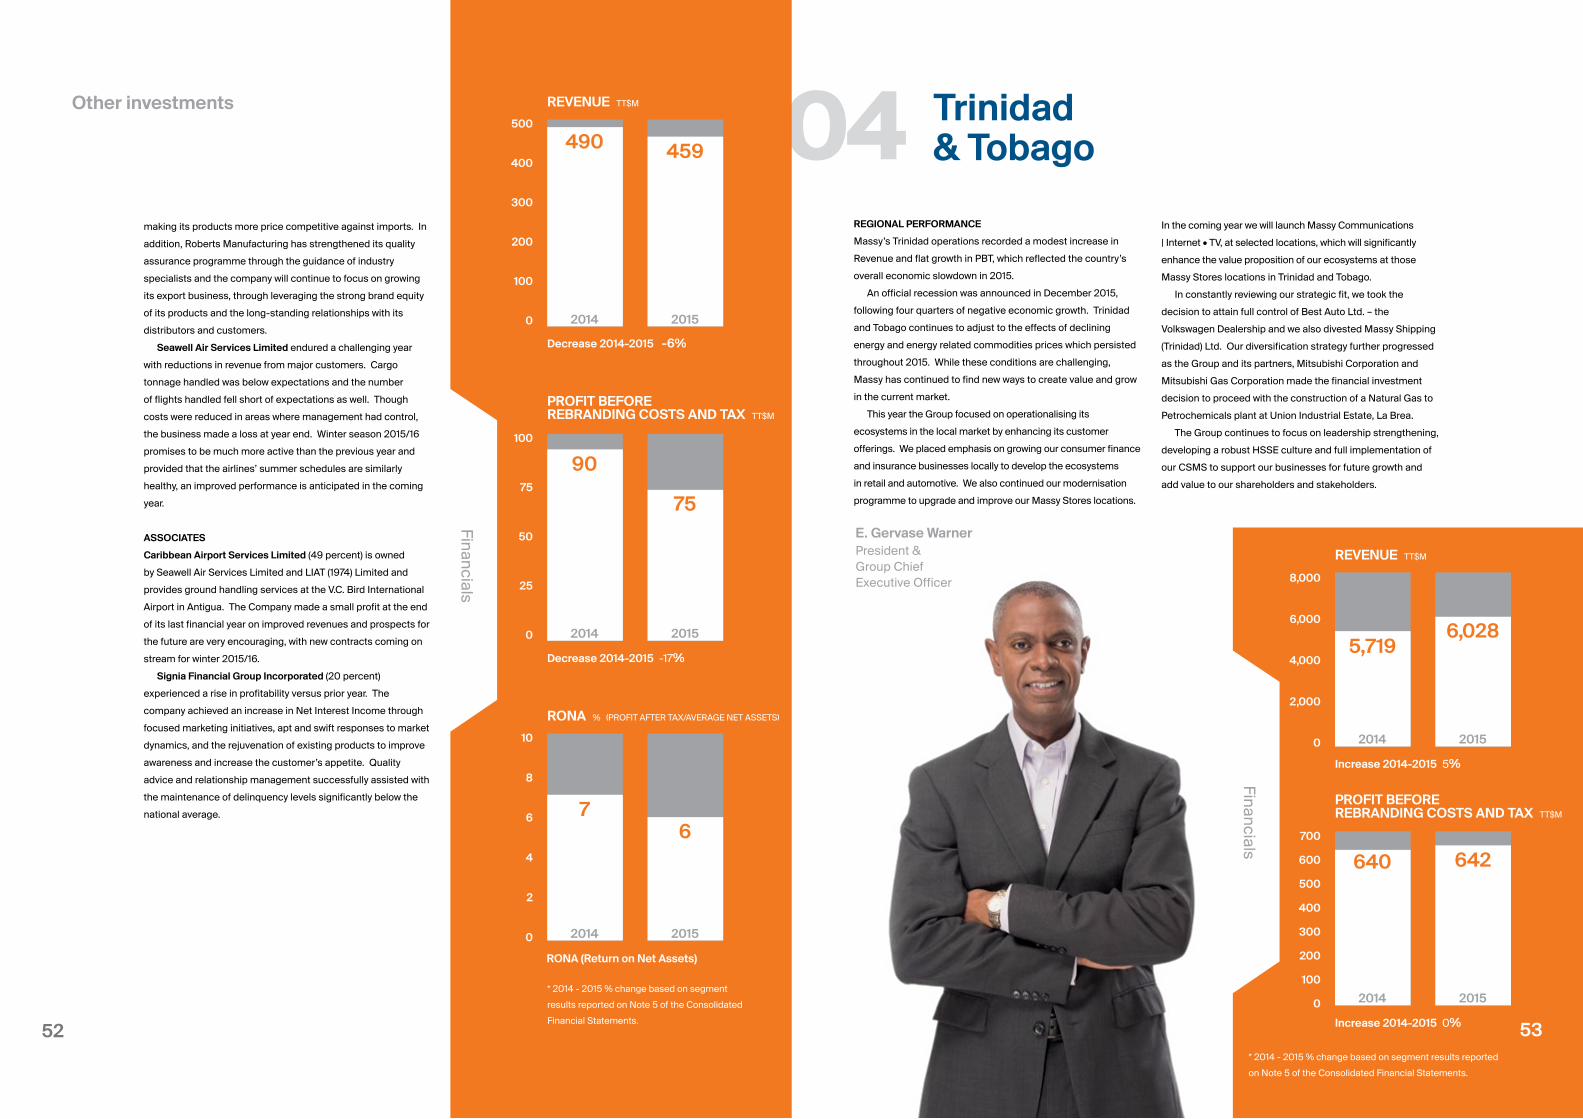
5352
04 Trinidad& Tobago
E. Gervase Warner President & Group Chief Executive Officer
REGIONAL PERFORMANCE
Massy’s Trinidad operations recorded a modest increase in
Revenue and flat growth in PBT, which reflected the country’s
overall economic slowdown in 2015.
An official recession was announced in December 2015,
following four quarters of negative economic growth. Trinidad
and Tobago continues to adjust to the effects of declining
energy and energy related commodities prices which persisted
throughout 2015. While these conditions are challenging,
Massy has continued to find new ways to create value and grow
in the current market.
This year the Group focused on operationalising its
ecosystems in the local market by enhancing its customer
offerings. We placed emphasis on growing our consumer finance
and insurance businesses locally to develop the ecosystems
in retail and automotive. We also continued our modernisation
programme to upgrade and improve our Massy Stores locations.
In the coming year we will launch Massy Communications
| Internet • TV, at selected locations, which will significantly
enhance the value proposition of our ecosystems at those
Massy Stores locations in Trinidad and Tobago.
In constantly reviewing our strategic fit, we took the
decision to attain full control of Best Auto Ltd. – the
Volkswagen Dealership and we also divested Massy Shipping
(Trinidad) Ltd. Our diversification strategy further progressed
as the Group and its partners, Mitsubishi Corporation and
Mitsubishi Gas Corporation made the financial investment
decision to proceed with the construction of a Natural Gas to
Petrochemicals plant at Union Industrial Estate, La Brea.
The Group continues to focus on leadership strengthening,
developing a robust HSSE culture and full implementation of
our CSMS to support our businesses for future growth and
add value to our shareholders and stakeholders.
2014
2014
2015
2015
REVENUE TT$M
PROFIT BEFORE REBRANDING COSTS AND TAX TT$M
Increase 2014-2015 0%
Increase 2014-2015 5%
640
5,719
642
6,028
8,000
6,000
4,000
2,000
0
700
600
500
400
300
200
100
0
* 2014 - 2015 % change based on segment results reported
on Note 5 of the Consolidated Financial Statements.
Financials
53
making its products more price competitive against imports. In
addition, Roberts Manufacturing has strengthened its quality
assurance programme through the guidance of industry
specialists and the company will continue to focus on growing
its export business, through leveraging the strong brand equity
of its products and the long-standing relationships with its
distributors and customers.
Seawell Air Services Limited endured a challenging year
with reductions in revenue from major customers. Cargo
tonnage handled was below expectations and the number
of flights handled fell short of expectations as well. Though
costs were reduced in areas where management had control,
the business made a loss at year end. Winter season 2015/16
promises to be much more active than the previous year and
provided that the airlines’ summer schedules are similarly
healthy, an improved performance is anticipated in the coming
year.
ASSOCIATES
Caribbean Airport Services Limited (49 percent) is owned
by Seawell Air Services Limited and LIAT (1974) Limited and
provides ground handling services at the V.C. Bird International
Airport in Antigua. The Company made a small profit at the end
of its last financial year on improved revenues and prospects for
the future are very encouraging, with new contracts coming on
stream for winter 2015/16.
Signia Financial Group Incorporated (20 percent)
experienced a rise in profitability versus prior year. The
company achieved an increase in Net Interest Income through
focused marketing initiatives, apt and swift responses to market
dynamics, and the rejuvenation of existing products to improve
awareness and increase the customer’s appetite. Quality
advice and relationship management successfully assisted with
the maintenance of delinquency levels significantly below the
national average.
2014
2014
2014
2015
2015
2015
REVENUE TT$M
PROFIT BEFORE REBRANDING COSTS AND TAX TT$M
RONA % (PROFIT AFTER TAX/AVERAGE NET ASSETS)
Decrease 2014-2015 -6%
Decrease 2014-2015 -17%
RONA (Return on Net Assets)
490
90
7
459
75
6
500
400
300
200
100
0
100
75
50
25
0
10
8
6
4
2
0
* 2014 - 2015 % change based on segment
results reported on Note 5 of the Consolidated
Financial Statements.
Financials
Other investments
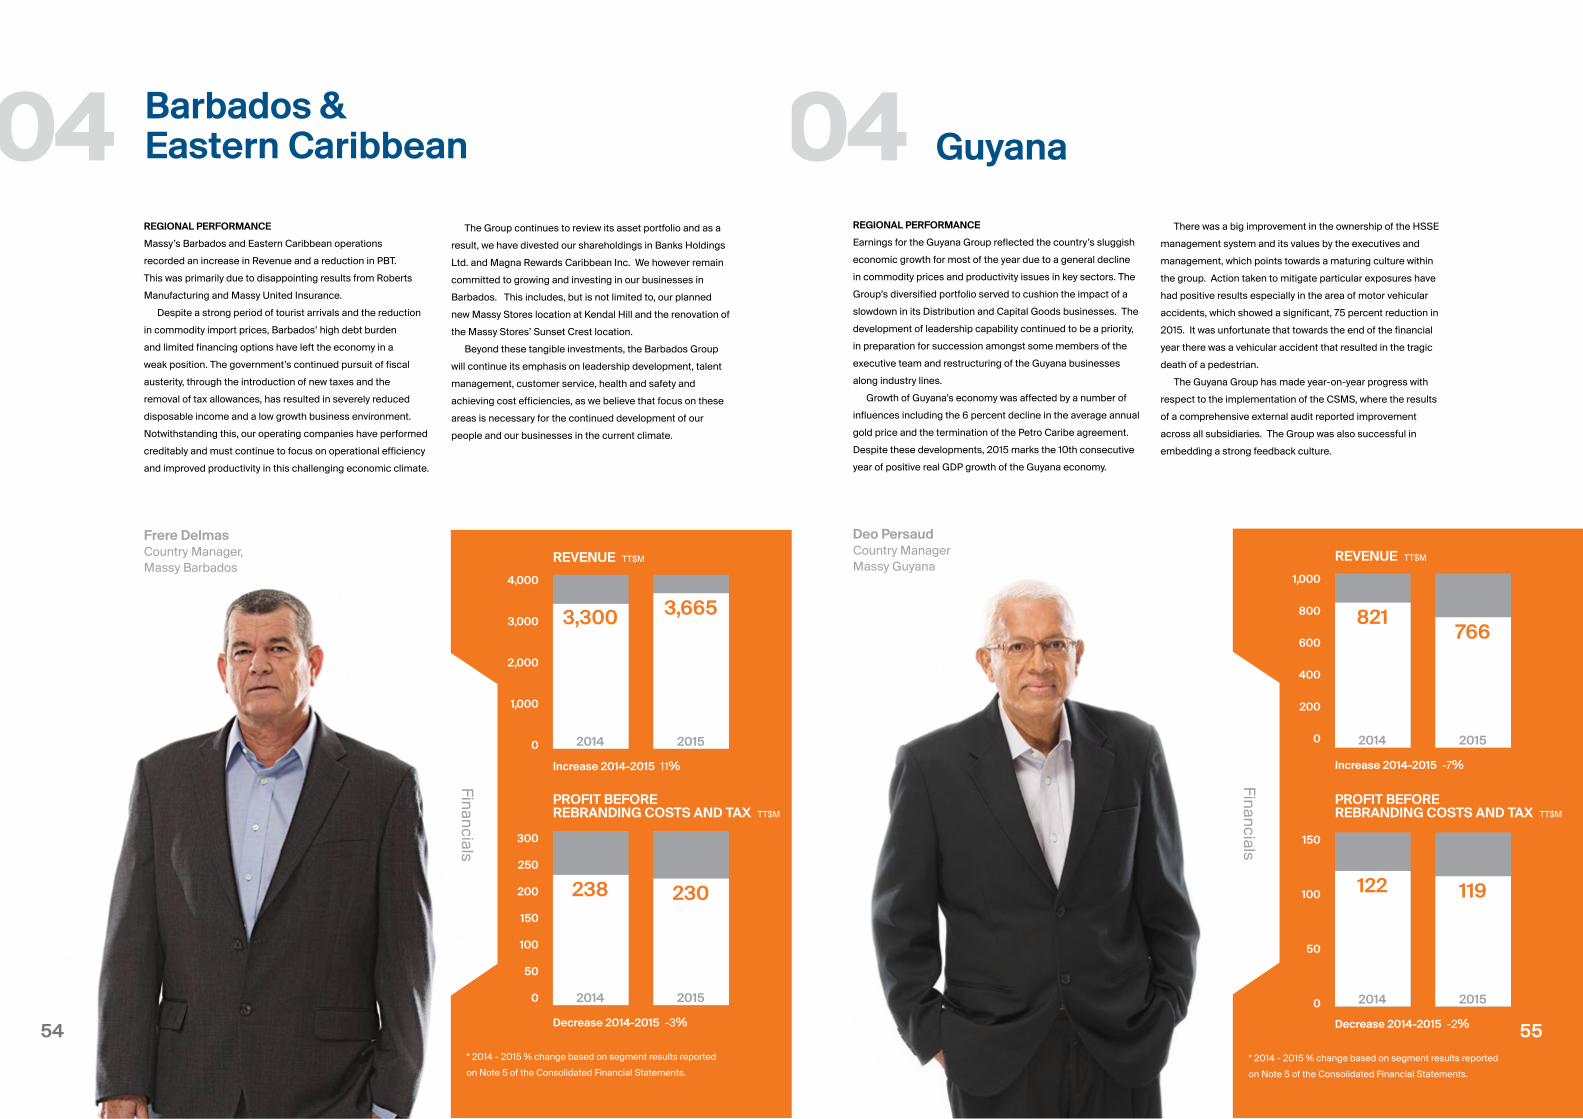
5554
Guyana
Deo Persaud Country Manager Massy Guyana
REGIONAL PERFORMANCE
Earnings for the Guyana Group reflected the country’s sluggish
economic growth for most of the year due to a general decline
in commodity prices and productivity issues in key sectors. The
Group’s diversified portfolio served to cushion the impact of a
slowdown in its Distribution and Capital Goods businesses. The
development of leadership capability continued to be a priority,
in preparation for succession amongst some members of the
executive team and restructuring of the Guyana businesses
along industry lines.
Growth of Guyana’s economy was affected by a number of
influences including the 6 percent decline in the average annual
gold price and the termination of the Petro Caribe agreement.
Despite these developments, 2015 marks the 10th consecutive
year of positive real GDP growth of the Guyana economy.
04 04
2014
2014
2015
2015
REVENUE TT$M
Decrease 2014-2015 -2%
Increase 2014-2015 -7%
122
821
119
766
1,000
800
600
400
200
0
150
100
50
0
* 2014 - 2015 % change based on segment results reported
on Note 5 of the Consolidated Financial Statements.
Financials
55
There was a big improvement in the ownership of the HSSE
management system and its values by the executives and
management, which points towards a maturing culture within
the group. Action taken to mitigate particular exposures have
had positive results especially in the area of motor vehicular
accidents, which showed a significant, 75 percent reduction in
2015. It was unfortunate that towards the end of the financial
year there was a vehicular accident that resulted in the tragic
death of a pedestrian.
The Guyana Group has made year-on-year progress with
respect to the implementation of the CSMS, where the results
of a comprehensive external audit reported improvement
across all subsidiaries. The Group was also successful in
embedding a strong feedback culture.
Barbados &Eastern Caribbean
Frere Delmas Country Manager, Massy Barbados
REGIONAL PERFORMANCE
Massy’s Barbados and Eastern Caribbean operations
recorded an increase in Revenue and a reduction in PBT.
This was primarily due to disappointing results from Roberts
Manufacturing and Massy United Insurance.
Despite a strong period of tourist arrivals and the reduction
in commodity import prices, Barbados’ high debt burden
and limited financing options have left the economy in a
weak position. The government’s continued pursuit of fiscal
austerity, through the introduction of new taxes and the
removal of tax allowances, has resulted in severely reduced
disposable income and a low growth business environment.
Notwithstanding this, our operating companies have performed
creditably and must continue to focus on operational efficiency
and improved productivity in this challenging economic climate.
The Group continues to review its asset portfolio and as a
result, we have divested our shareholdings in Banks Holdings
Ltd. and Magna Rewards Caribbean Inc. We however remain
committed to growing and investing in our businesses in
Barbados. This includes, but is not limited to, our planned
new Massy Stores location at Kendal Hill and the renovation of
the Massy Stores’ Sunset Crest location.
Beyond these tangible investments, the Barbados Group
will continue its emphasis on leadership development, talent
management, customer service, health and safety and
achieving cost efficiencies, as we believe that focus on these
areas is necessary for the continued development of our
people and our businesses in the current climate.
2014
2014
2015
2015
REVENUE TT$M
PROFIT BEFORE REBRANDING COSTS AND TAX TT$M
PROFIT BEFORE REBRANDING COSTS AND TAX TT$M
Decrease 2014-2015 -3%
Increase 2014-2015 11%
238
3,300
230
3,665
4,000
3,000
2,000
1,000
0
300
250
200
150
100
50
0
* 2014 - 2015 % change based on segment results reported
on Note 5 of the Consolidated Financial Statements.
Financials
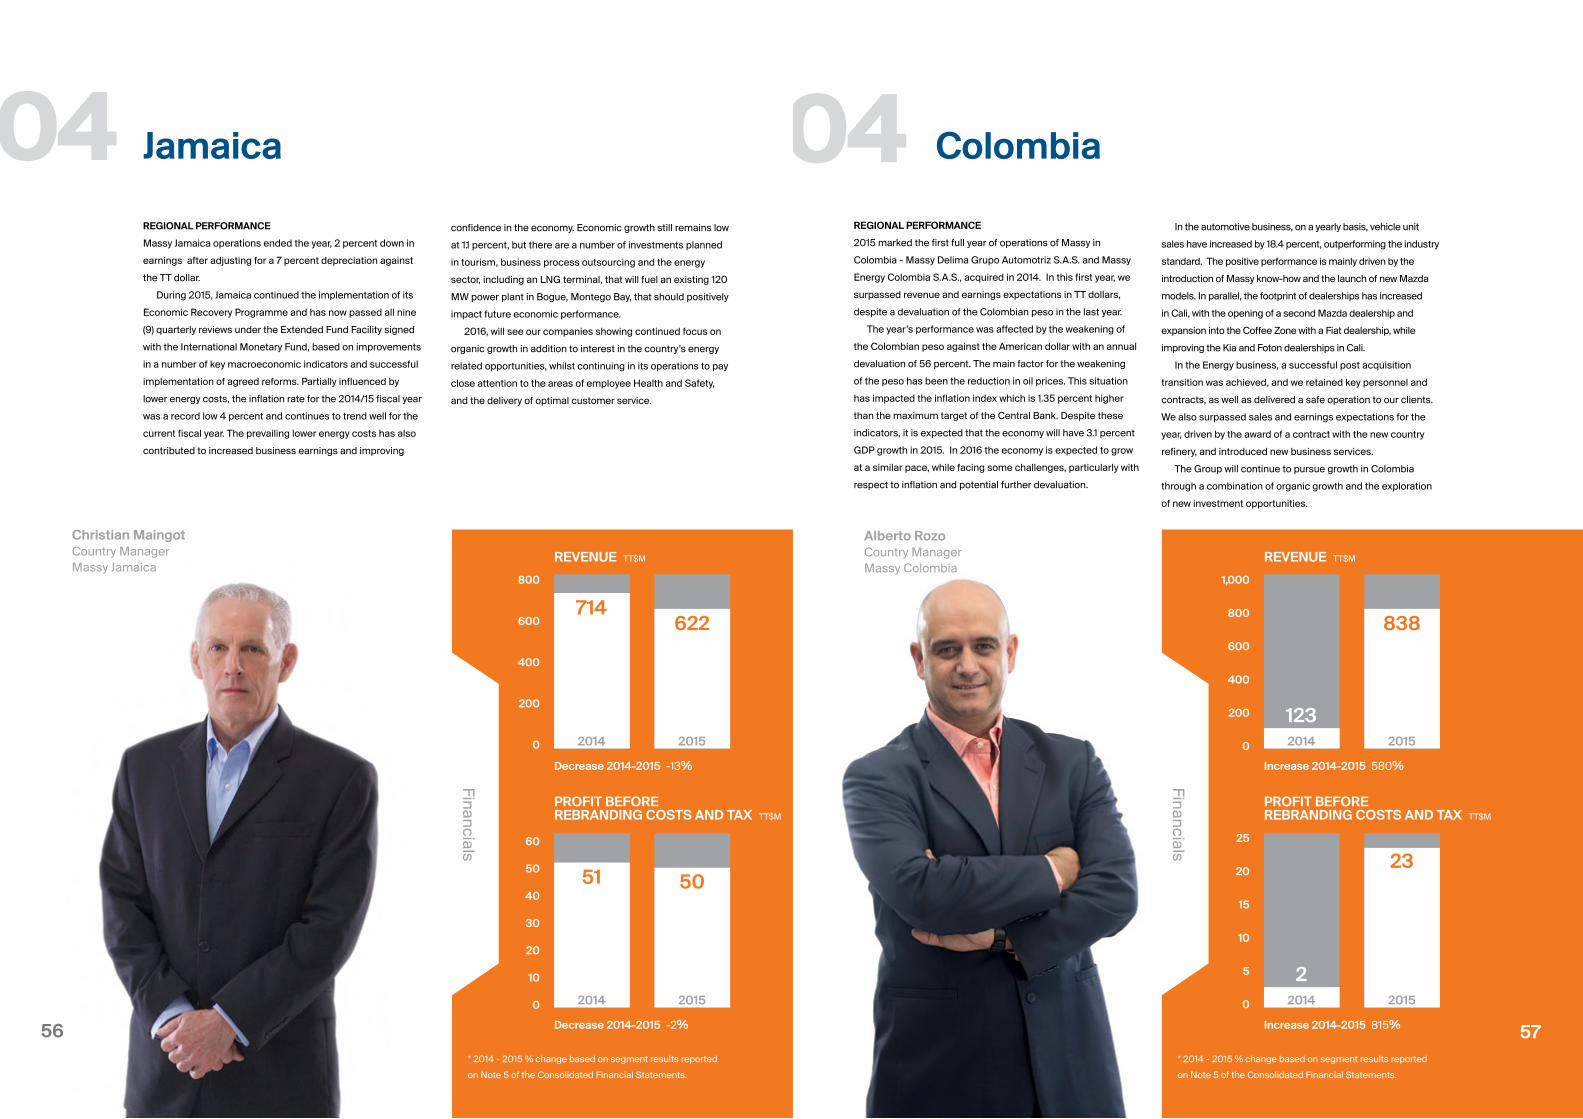
5756
Colombia
Alberto Rozo Country Manager Massy Colombia
REGIONAL PERFORMANCE
2015 marked the first full year of operations of Massy in
Colombia - Massy Delima Grupo Automotriz S.A.S. and Massy
Energy Colombia S.A.S., acquired in 2014. In this first year, we
surpassed revenue and earnings expectations in TT dollars,
despite a devaluation of the Colombian peso in the last year.
The year’s performance was affected by the weakening of
the Colombian peso against the American dollar with an annual
devaluation of 56 percent. The main factor for the weakening
of the peso has been the reduction in oil prices. This situation
has impacted the inflation index which is 1.35 percent higher
than the maximum target of the Central Bank. Despite these
indicators, it is expected that the economy will have 3.1 percent
GDP growth in 2015. In 2016 the economy is expected to grow
at a similar pace, while facing some challenges, particularly with
respect to inflation and potential further devaluation.
04 In the automotive business, on a yearly basis, vehicle unit
sales have increased by 18.4 percent, outperforming the industry
standard. The positive performance is mainly driven by the
introduction of Massy know-how and the launch of new Mazda
models. In parallel, the footprint of dealerships has increased
in Cali, with the opening of a second Mazda dealership and
expansion into the Coffee Zone with a Fiat dealership, while
improving the Kia and Foton dealerships in Cali.
In the Energy business, a successful post acquisition
transition was achieved, and we retained key personnel and
contracts, as well as delivered a safe operation to our clients.
We also surpassed sales and earnings expectations for the
year, driven by the award of a contract with the new country
refinery, and introduced new business services.
The Group will continue to pursue growth in Colombia
through a combination of organic growth and the exploration
of new investment opportunities.
Jamaica
Christian Maingot Country Manager Massy Jamaica
REGIONAL PERFORMANCE
Massy Jamaica operations ended the year, 2 percent down in
earnings after adjusting for a 7 percent depreciation against
the TT dollar.
During 2015, Jamaica continued the implementation of its
Economic Recovery Programme and has now passed all nine
(9) quarterly reviews under the Extended Fund Facility signed
with the International Monetary Fund, based on improvements
in a number of key macroeconomic indicators and successful
implementation of agreed reforms. Partially influenced by
lower energy costs, the inflation rate for the 2014/15 fiscal year
was a record low 4 percent and continues to trend well for the
current fiscal year. The prevailing lower energy costs has also
contributed to increased business earnings and improving
04confidence in the economy. Economic growth still remains low
at 1.1 percent, but there are a number of investments planned
in tourism, business process outsourcing and the energy
sector, including an LNG terminal, that will fuel an existing 120
MW power plant in Bogue, Montego Bay, that should positively
impact future economic performance.
2016, will see our companies showing continued focus on
organic growth in addition to interest in the country’s energy
related opportunities, whilst continuing in its operations to pay
close attention to the areas of employee Health and Safety,
and the delivery of optimal customer service.
2014 2014
2014 2014
2015 2015
2015 2015
REVENUE TT$M REVENUE TT$M
REVENUE TT$M
PROFIT BEFORE REBRANDING COSTS AND TAX TT$M
PROFIT BEFORE REBRANDING COSTS AND TAX TT$M
Decrease 2014-2015 -2% Increase 2014-2015 815%
Decrease 2014-2015 -13% Increase 2014-2015 580%
51
2
714
123
5023
622 838
800
600
400
200
0
1,000
800
600
400
200
0
60
50
40
30
20
10
0
25
20
15
10
5
0
* 2014 - 2015 % change based on segment results reported
on Note 5 of the Consolidated Financial Statements.
* 2014 - 2015 % change based on segment results reported
on Note 5 of the Consolidated Financial Statements.
Financials
Financials
57
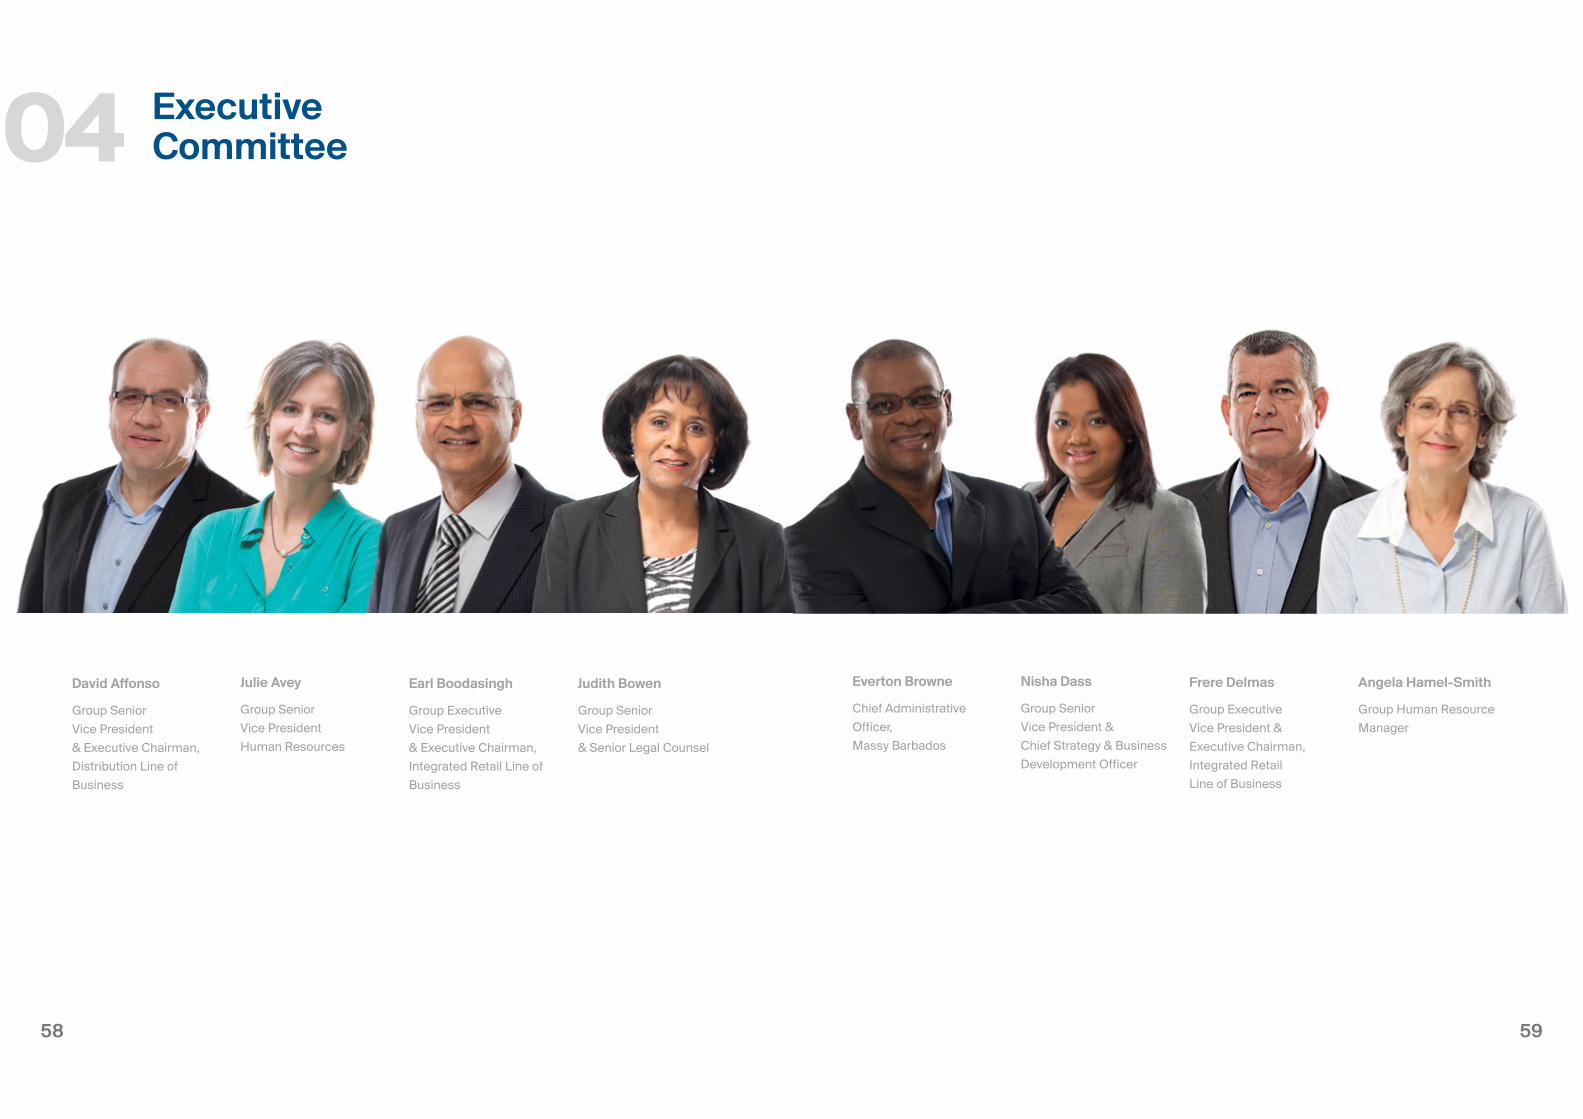
5958
Everton Browne
Chief Administrative Officer,Massy Barbados
Nisha Dass
Group Senior Vice President & Chief Strategy & Business Development Officer
Angela Hamel-Smith
Group Human Resource Manager
Frere Delmas
Group Executive Vice President & Executive Chairman, Integrated Retail Line of Business
04 ExecutiveCommittee
David Affonso
Group Senior Vice President & Executive Chairman, Distribution Line of Business
Julie Avey
Group Senior Vice President Human Resources
Judith Bowen
Group Senior Vice President & Senior Legal Counsel
Earl Boodasingh
Group Executive Vice President & Executive Chairman, Integrated Retail Line of Business

6160
Deo Persaud
Country Manager, Massy Guyana Group
Paula Rajkumarsingh
Group Executive Vice President & Chief Financial Officer
Alberto Rozo
Country Manager, Massy Colombia
Fenwick Reid
Group Senior Vice President & Executive Chairman, Information, Technolgy & Communications Business Unit
Executive Committee
Susan Hamel-Smith
Group Corporate Marketing
Wendy Kerry
Corporate Secretary & Legal Advisor
Thomas Pantin
Group Senior Vice President & Executive Chairman, Retail Line of Business
David O’Brien
Group Executive Vice President & Executive Chairman, Automotive & Industrial Equipment Business Unit
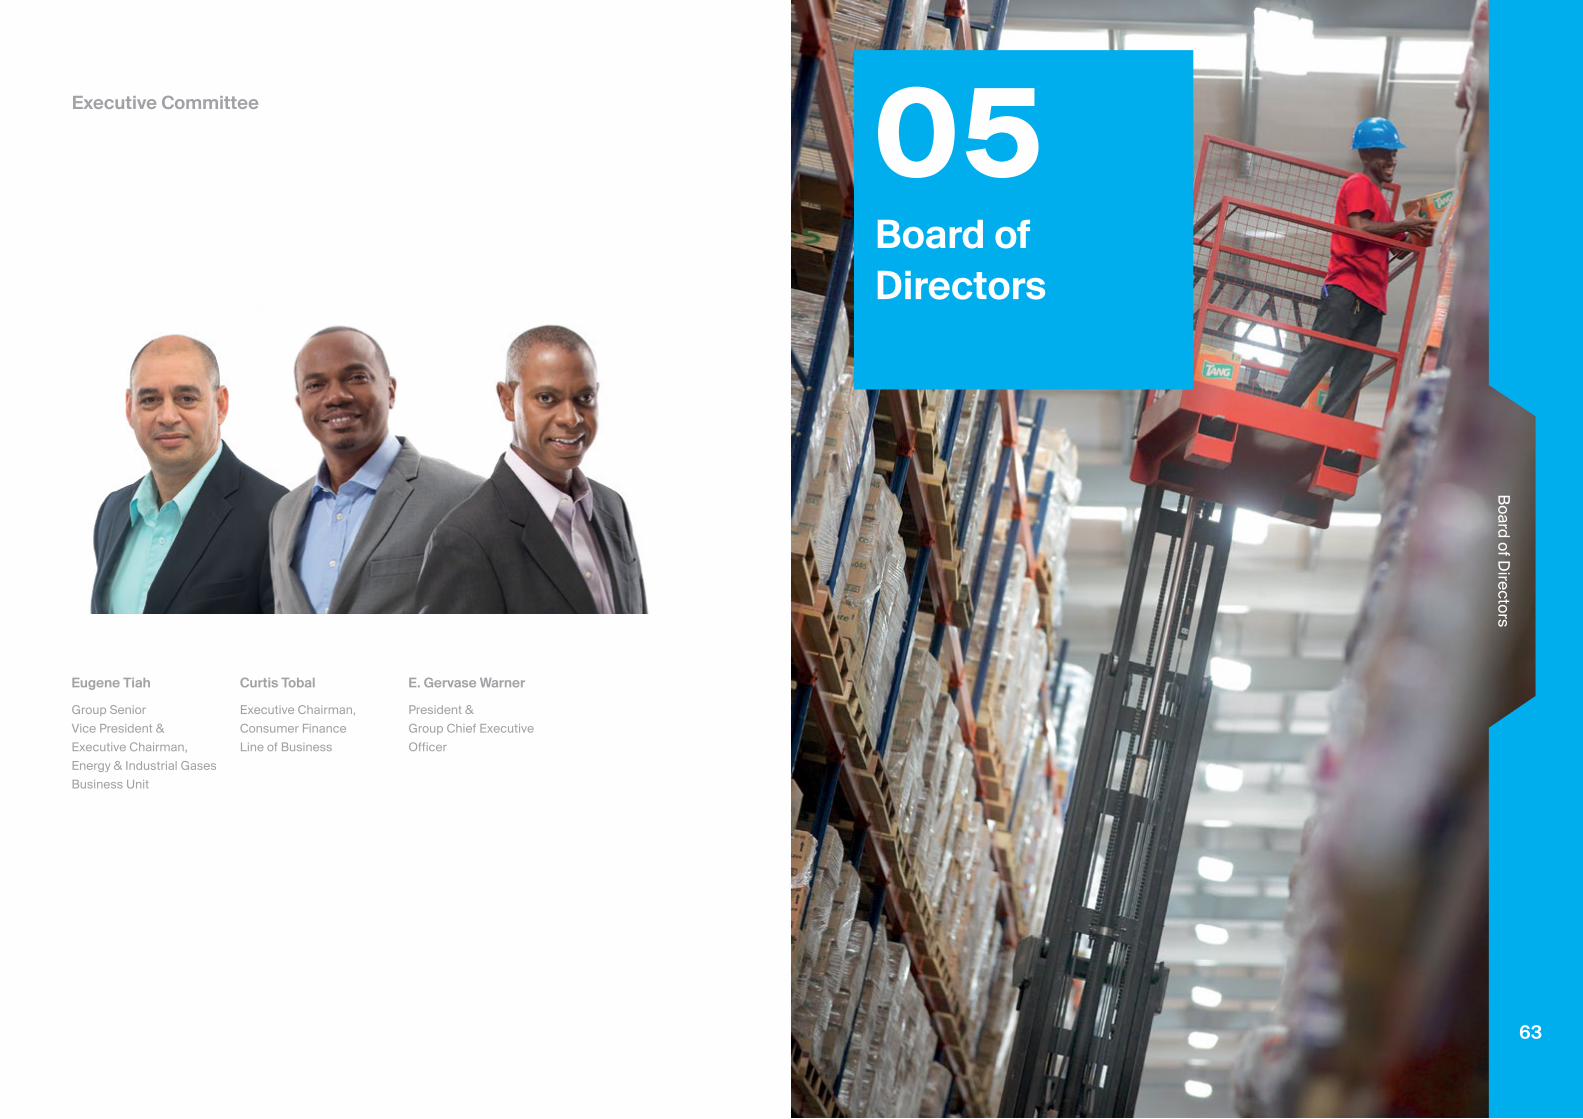
6362
05Board ofDirectors
Board of D
irectors
63
Executive Committee
Eugene Tiah
Group Senior Vice President & Executive Chairman, Energy & Industrial Gases Business Unit
Curtis Tobal
Executive Chairman, Consumer Finance Line of Business
E. Gervase Warner
President & Group Chief Executive Officer

6564
Patrick Hylton
Non-Executive Director Jamaica Citizen
G. Anthony King
Non-Executive DirectorBarbados Citizen
David O’Brien
Group Executive Vice Presdent & Executive Chairman, Automotive & Industrial EquipmentBusiness UnitTrinidad and Tobago Citizen
William Lucie-Smith
Non-Executive DirectorTrinidad and Tobago Citizen
The Board of Directors05
Robert Bermudez
Non-Executive Director & ChairmanTrinidad and Tobago Citizen
E. Gervase Warner
Executive Director, President & Group Chief Executive Officer Trinidad and Tobago Citizen
Earl Boodasingh
Group Executive Vice Presdent & Executive Chairman, Integrated Retail Business Unit Trinidad and Tobago Citizen
Rolph Balgobin
Non-Executive Director Trinidad and Tobago Citizen
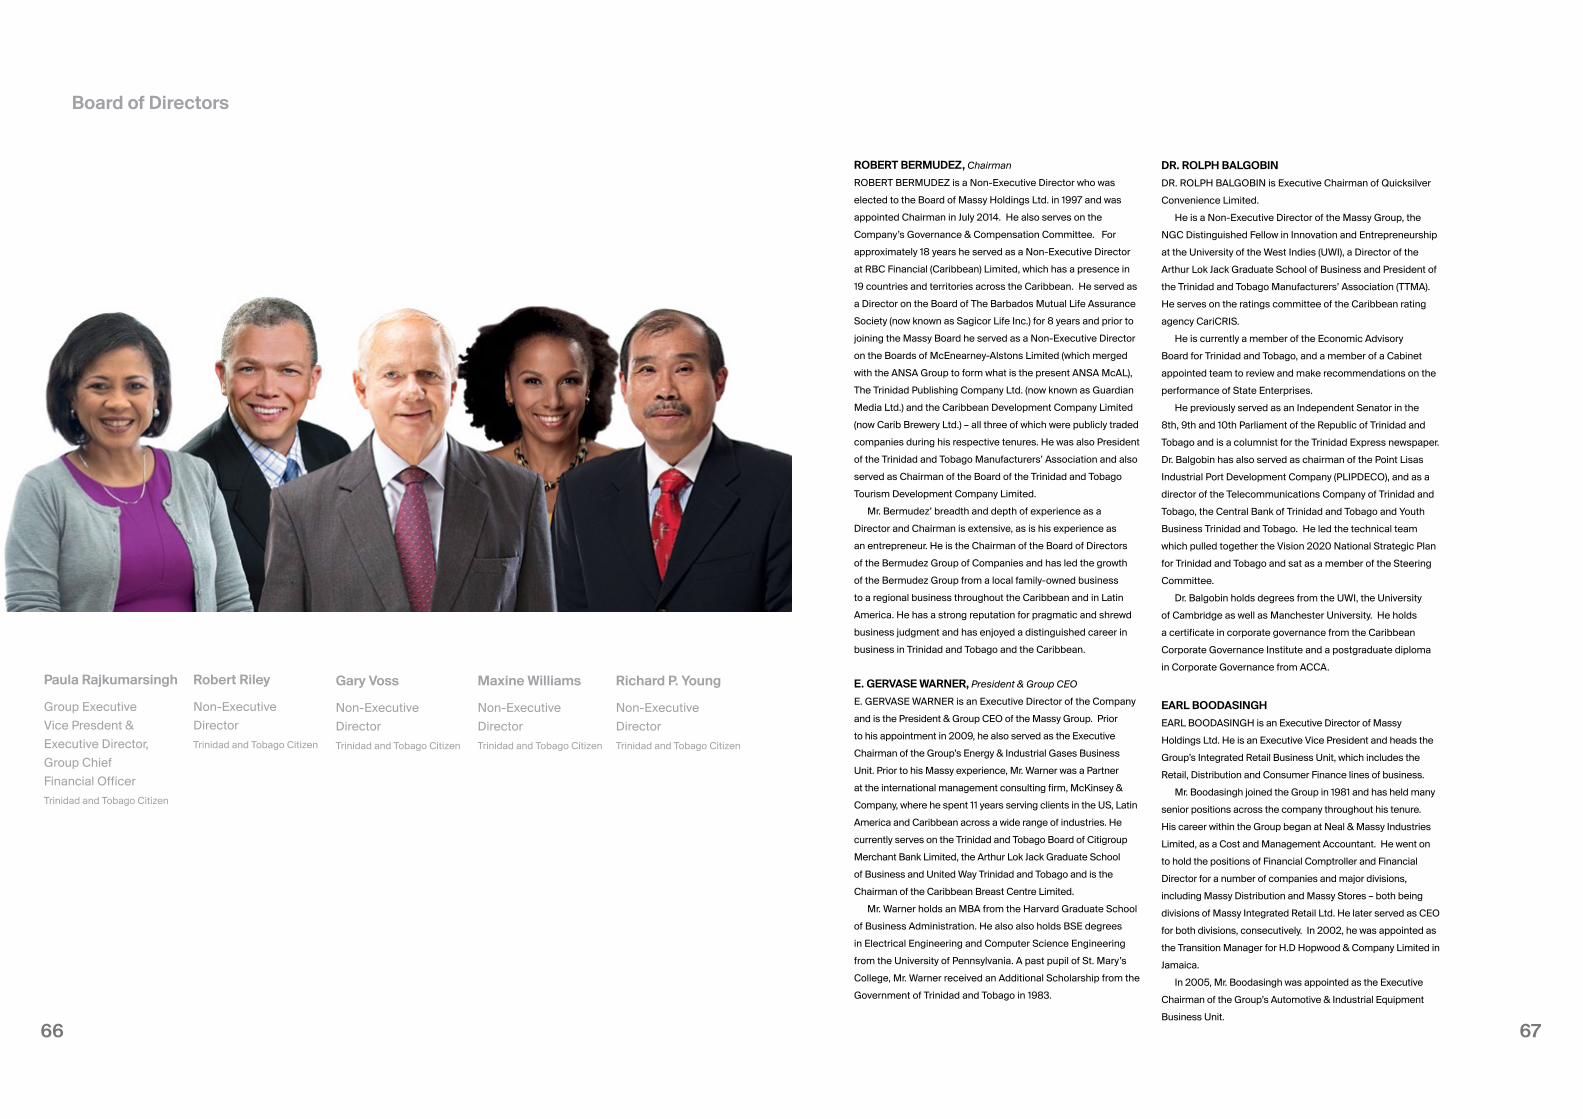
6766
Board of Directors
Richard P. Young
Non-Executive Director Trinidad and Tobago Citizen
Paula Rajkumarsingh
Group Executive Vice Presdent & Executive Director, Group Chief Financial OfficerTrinidad and Tobago Citizen
Robert Riley
Non-Executive Director Trinidad and Tobago Citizen
Maxine Williams
Non-Executive Director Trinidad and Tobago Citizen
Gary Voss
Non-Executive Director Trinidad and Tobago Citizen
ROBERT BERMUDEZ, Chairman
ROBERT BERMUDEZ is a Non-Executive Director who was
elected to the Board of Massy Holdings Ltd. in 1997 and was
appointed Chairman in July 2014. He also serves on the
Company’s Governance & Compensation Committee. For
approximately 18 years he served as a Non-Executive Director
at RBC Financial (Caribbean) Limited, which has a presence in
19 countries and territories across the Caribbean. He served as
a Director on the Board of The Barbados Mutual Life Assurance
Society (now known as Sagicor Life Inc.) for 8 years and prior to
joining the Massy Board he served as a Non-Executive Director
on the Boards of McEnearney-Alstons Limited (which merged
with the ANSA Group to form what is the present ANSA McAL),
The Trinidad Publishing Company Ltd. (now known as Guardian
Media Ltd.) and the Caribbean Development Company Limited
(now Carib Brewery Ltd.) – all three of which were publicly traded
companies during his respective tenures. He was also President
of the Trinidad and Tobago Manufacturers’ Association and also
served as Chairman of the Board of the Trinidad and Tobago
Tourism Development Company Limited.
Mr. Bermudez’ breadth and depth of experience as a
Director and Chairman is extensive, as is his experience as
an entrepreneur. He is the Chairman of the Board of Directors
of the Bermudez Group of Companies and has led the growth
of the Bermudez Group from a local family-owned business
to a regional business throughout the Caribbean and in Latin
America. He has a strong reputation for pragmatic and shrewd
business judgment and has enjoyed a distinguished career in
business in Trinidad and Tobago and the Caribbean.
E. GERVASE WARNER, President & Group CEO
E. GERVASE WARNER is an Executive Director of the Company
and is the President & Group CEO of the Massy Group. Prior
to his appointment in 2009, he also served as the Executive
Chairman of the Group’s Energy & Industrial Gases Business
Unit. Prior to his Massy experience, Mr. Warner was a Partner
at the international management consulting firm, McKinsey &
Company, where he spent 11 years serving clients in the US, Latin
America and Caribbean across a wide range of industries. He
currently serves on the Trinidad and Tobago Board of Citigroup
Merchant Bank Limited, the Arthur Lok Jack Graduate School
of Business and United Way Trinidad and Tobago and is the
Chairman of the Caribbean Breast Centre Limited.
Mr. Warner holds an MBA from the Harvard Graduate School
of Business Administration. He also also holds BSE degrees
in Electrical Engineering and Computer Science Engineering
from the University of Pennsylvania. A past pupil of St. Mary’s
College, Mr. Warner received an Additional Scholarship from the
Government of Trinidad and Tobago in 1983.
DR. ROLPH BALGOBIN
DR. ROLPH BALGOBIN is Executive Chairman of Quicksilver
Convenience Limited.
He is a Non-Executive Director of the Massy Group, the
NGC Distinguished Fellow in Innovation and Entrepreneurship
at the University of the West Indies (UWI), a Director of the
Arthur Lok Jack Graduate School of Business and President of
the Trinidad and Tobago Manufacturers’ Association (TTMA).
He serves on the ratings committee of the Caribbean rating
agency CariCRIS.
He is currently a member of the Economic Advisory
Board for Trinidad and Tobago, and a member of a Cabinet
appointed team to review and make recommendations on the
performance of State Enterprises.
He previously served as an Independent Senator in the
8th, 9th and 10th Parliament of the Republic of Trinidad and
Tobago and is a columnist for the Trinidad Express newspaper.
Dr. Balgobin has also served as chairman of the Point Lisas
Industrial Port Development Company (PLIPDECO), and as a
director of the Telecommunications Company of Trinidad and
Tobago, the Central Bank of Trinidad and Tobago and Youth
Business Trinidad and Tobago. He led the technical team
which pulled together the Vision 2020 National Strategic Plan
for Trinidad and Tobago and sat as a member of the Steering
Committee.
Dr. Balgobin holds degrees from the UWI, the University
of Cambridge as well as Manchester University. He holds
a certificate in corporate governance from the Caribbean
Corporate Governance Institute and a postgraduate diploma
in Corporate Governance from ACCA.
EARL BOODASINGH
EARL BOODASINGH is an Executive Director of Massy
Holdings Ltd. He is an Executive Vice President and heads the
Group’s Integrated Retail Business Unit, which includes the
Retail, Distribution and Consumer Finance lines of business.
Mr. Boodasingh joined the Group in 1981 and has held many
senior positions across the company throughout his tenure.
His career within the Group began at Neal & Massy Industries
Limited, as a Cost and Management Accountant. He went on
to hold the positions of Financial Comptroller and Financial
Director for a number of companies and major divisions,
including Massy Distribution and Massy Stores – both being
divisions of Massy Integrated Retail Ltd. He later served as CEO
for both divisions, consecutively. In 2002, he was appointed as
the Transition Manager for H.D Hopwood & Company Limited in
Jamaica.
In 2005, Mr. Boodasingh was appointed as the Executive
Chairman of the Group’s Automotive & Industrial Equipment
Business Unit.
6968
ROBERT RILEY
ROBERT RILEY is a Non-Executive Director and Executive
Director of Robert Riley Leadership and Energy Consulting, a
London based international consulting firm working with CEOs
and Executive Leadership teams to improve Leadership and
Performance through assessment, coaching and experiential
training in Africa, Asia and the Caribbean. Until March 2015, he
was the Group Head of Safety and Operations Risk, Culture and
Capability of BP PLC (London). His career with BP spanned over
two decades, during which time he served as the Chairman and
Chief Executive Officer of BP Trinidad & Tobago LLC, Business
Unit Leader and Vice President of Law and Government Affairs.
In 2009 he was conferred the degree of Doctor of Laws, Honoris
Causa from the University of the West Indies for his contribution
to energy sector development policy. Mr. Riley was awarded the
Chaconia Gold medal for his contribution to national economic
development in Trinidad and Tobago in 2003. He graduated with
honours degrees in Law and Agriculture from the University of
the West Indies and is an Attorney-at-Law.
He was elected to the Board of Massy Holdings Ltd. effective
December 17, 2014.
GARY VOSS
GARY VOSS is a Non-Executive Director of Massy Holdings Ltd.
and a former Chairman of Unilever Caribbean Limited. He joined
Lever Brothers West Indies Limited in 1982 as Technical Director
and was appointed Chairman and Managing Director in 1987. He
retired from Unilever in 2001. His early career was spent with the
(then) Texaco Pointe-a-Pierre refinery, the Caribbean Industrial
Research Institute (CARIRI) and the Iron and Steel Company of
Trinidad and Tobago (ISCOTT).
Mr. Voss’ previous posts include Superintendent, Direct
Reduction at ISCOTT, Head of Engineering at CARIRI, President
of the Trinidad and Tobago Manufacturers’ Association
and President of the Caribbean Association of Industry and
Commerce. He also served as a Director of RBC Financial
(Caribbean) Limited and several of its subsidiaries up until
October 2015.
Mr. Voss is a Chemical Engineer by profession and holds a
Bachelor of Science degree with Honours from Birmingham
University in the United Kingdom.
MAXINE WILLIAMS
MAXINE WILLIAMS is a Non-Executive Director and is the
Global Director of Diversity at Facebook. In this role, she
develops strategies to harness the unlimited potential of
Facebook’s talent while managing a high performing team
of diversity programme managers from the company’s
headquarters in California. Prior to Facebook, she served as
the Director of Diversity for a global law firm with a focus on
cross-border expertise, particularly in international arbitration,
project finance, banking and anti-trust. She was responsible
for developing and implementing a global diversity plan
for the multi-national law firm comprised of almost 2000
attorneys, two-thirds of whom were based in offices outside
of the United States with clients in 115 countries around the
world. As an attorney, she has represented clients in criminal,
civil and industrial courts in Trinidad and Tobago and in the
United Kingdom at the Privy Council. Ms. Williams has worked
with multiple international organisations on development
and human rights issues and has had a parallel career as a
broadcast journalist and on-air presenter. Ms. Williams is a
graduate of Yale University, she received her law degree with
first class honors from Oxford University, where she was a
Rhodes Scholar.
RICHARD P. YOUNG
RICHARD PETER YOUNG, appointed as a Non-Executive
Director in December 2012, is a retired Finance professional
with the designation of a Chartered Accountant. He has over
40 years’ experience in Accounting, Auditing, Insurance
and Banking, having operated at the leadership level of
PricewaterhouseCoopers Trinidad & Tobago and Scotiabank
Trinidad & Tobago.
He has served as President of the Institute of Chartered
Accountants of Trinidad & Tobago, Chairman of the Trinidad
& Tobago Stock Exchange and President of the Bankers
Association of Trinidad & Tobago.
He is a Non-Executive Director of Sagicor Financial
Corporation and currently Chairman of Catholic Media Services
Limited.
PATRICK HYLTON
PATRICK HYLTON is a Non-Executive Director and is the Group
Managing Director of Jamaica’s largest commercial bank, the
National Commercial Bank Jamaica Limited (NCB). His rise
to national and international prominence began when he was
appointed a leading role by the Government in the rehabilitation
of the Jamaican financial sector during the mid-1990s. His
wealth of experience in the financial services industry propelled
him to the position of Managing Director of the Financial Sector
Adjustment Company (FINSAC). His successful completion of
that undertaking culminated in the national award of the Order
of Distinction, Commander Class, being bestowed on him by
the Prime Minister and Governor General of Jamaica in 2002.
Mr. Hylton joined NCB in 2002 as Deputy Group Managing
Director and in 2004, he was appointed Group Managing
Director and has led the organisation to achieve record growth
in profitability. Mr. Hylton is an Honours Graduate in Business
Administration and an Associate of the Chartered Institute of
Bankers (ACIB), London. He is a Past President of the Jamaica
Bankers Association and in addition to being a Director of
NCB; he is the Chairman of Harmonisation Limited, NCB
Capital Markets Limited and the Mona School of Business and
Management.
He sits on several boards including the Caribbean
Information and Credit Rating Services (CariCRIS) and the Mona
School of Business and Management (UWI).
He is an avid reader and sports enthusiast with track and
field holding a special place.
G. ANTHONY KING
G. ANTHONY KING is a Non-Executive Director whose business
career spans over 40 years, 28 of which were spent with the
Group as an executive. Prior to his departure from the Group in
October 2004, to take up the appointment as Chief Executive
Officer of the Barbados Shipping & Trading Company Limited
(BS&T), he chaired the Group’s Eastern Caribbean Group of
Companies. After the take-over of BS&T in 2008 by Massy
Holdings Ltd., Mr. King became a Group Executive Vice President
but also remained as BS&T’s CEO. He played an instrumental
role in co-ordinating the integration of BS&T’s operations into the
Group. With that process substantially complete, he retired as an
executive of the Group during 2012. Mr. King is also a Director
of other publicly traded companies in Barbados and of various
private companies.
He has been associated with various private sector
organisations, including serving as Past President of the
Barbados Chamber of Commerce & Industry, a former Director
of the Caribbean Association of Industry and Commerce and
a former Trustee of the Barbados Youth Business Trust. He
recently retired as a Director of the Barbados Private Sector
Association, the umbrella private sector body in Barbados, but
continues to participate in the community, as the Chairman of
the Tourism Development Corporation in Barbados. Mr. King
joined the Board of Massy Holdings Ltd. in December 2008.
WILLIAM LUCIE-SMITH
WILLIAM LUCIE-SMITH is a Non-Executive Director. He is
a Chartered Accountant by profession and a former Senior
Partner of PricewaterhouseCoopers (Trinidad & Tobago),
where he led its Corporate Finance and Recoveries practice.
Mr. Lucie-Smith has extensive experience in mergers and
acquisitions, taxation and valuations and holds an MA degree
from Oxford University in Philosophy, Politics and Economics.
He currently serves as a Non-Executive Director on a number
of boards, including Republic Bank Limited and Sagicor
Financial Corporation.
DAVID O’BRIEN
DAVID O’BRIEN serves as an Executive Director. He is the
Executive Chairman of the Group’s Automotive & Industrial
Equipment Business Unit and serves on a number of boards
of Massy subsidiary companies. He joined the Group in 2006,
during which time, he also served as the Executive Chairman
of the Financial, Property and the Other Investments Business
Unit. Prior to joining the Group, he held a number of senior
positions at Sagicor Life Incorporated, including Investment
Manager, Deputy General Manager and Executive Vice
President & General Manager of Sagicor’s Trinidad operations.
Mr. O’Brien has also held directorships on the boards of
RGM Limited, DFL Caribbean Limited, and the Tourism and
Development Company of Trinidad and Tobago. He was also
the Chairman of the North Central Regional Health Authority,
a member of the Multi-Sectorial Core Group for Trinidad and
Tobago’s Vision 2020 and Chairman of the committee to
establish the National Policy for Disabled Persons.
PAULA RAJKUMARSINGH
PAULA RAJKUMARSINGH is an Executive Director and Group
Chief Financial Officer. She is a Corporate Financial Executive,
with over 12 years of experience at a senior management
level. She currently serves as a Director on the Parent Board
of CIBC First Caribbean International Bank in Barbados and
Trinidad and Tobago. She is a Director of the Trinidad and
Tobago Chamber of Industry and Commerce and serves
as a Director for the St. Joseph Convent Cluny Board of
Management. She previously served on the boards of the
Sugar Manufacturing Company and a private equity fund.
Board of Directors
7170
BOARD REPORT
Strengthening the Framework for Effective Governance
In continuing efforts to further strengthen the framework
for effective governance, the Board of Directors, on the
recommendation of the Governance & Compensation
Committee (G&C Committee), reviewed and adopted the Massy
Holdings Ltd.Board of Directors’ Charter on November 6, 2014.
Strengthening the composition and performance of the Board
and Board Committees
Recruitment and Nomination
Massy Holdings Ltd.’s Board is comprised of thirteen Directors;
nine Non-Executive and four Executive Directors. On October
31, 2015, Mr. Earl Boodasingh retired from the Company and
the Board of Directors of the Company. On November 6,
2015, at a Meeting of the Board of Directors, the Board, on
the recommendation of the Governance & Compensation
Committee, appointed Mr. Frere Delmas as a Director of the
Company to fill the vacancy created by the retirement of Mr.
Boodasingh.
Director Training
Over the past year, one Director successfully completed the
Certificate in Corporate Governance Training which was offered
by the Caribbean Corporate Governance Institute. Three
Directors are currently participating in this 4 part programme
in 2015.
Directors serving on the Boards of Group subsidiary
companies, which are required to comply with Anti-Money
Laundering and Counter Financing of Terrorism legislation,
received training on the duties, obligations and liabilities of
directors.
Board, Committee and Director Evaluation
The Board and Committee Evaluation system is in the process
of being reviewed to further, strengthen and enhance the
system in 2016.
Strengthening Loyalty and Independence
The Board held 9 meetings for the year ended September 30,
2015 to discharge its responsibilities and the average number
of Directors in attendance at the Meetings was ten.
Annually, Board Members and Senior Management,
disclosed whether they directly or indirectly or on behalf of third
parties, have a material interest in any transaction or matter
directly affecting the Company.
Directors continue to be subject to performance reviews
which include an assessment of sound and independent
thought, judgement and contributions.
Enhanced Disclosure and Accountability
Massy Holdings Ltd.’s disclosure regime continues to be
strong and disclosures are timely and accurate. Over the past
year, in addition to quarterly and annual financial disclosures
and disclosures regarding the Company’s performance and
activities, the Company filed and published five material
change reports and notices within the prescribed time frame.
Notices of these material changes were published in two
newspapers in both Trinidad and Tobago and Barbados and
also on the Company’s website, where they remain archived
and available for viewing.
Strengthening Stakeholder Relationships
The Company held its Annual Meeting of Shareholders in
2015 where substantive presentations were made regarding
the Company’s financial performance and strategic plans.
At the Meeting, proposal was also made to Shareholders
to vote on de-listing from the Barbados Stock Exchange.
Presentations were also made, prior to the Annual Meeting, to
the Company’s Barbados Registered Shareholders regarding
the de-listing proposal. During these Meetings, the Chairman
facilitated the questioning of the Board, Senior Management
and the Auditors, by the Company’s Shareholders.
BOARD COMMITTEE REPORTS
Massy Holdings Ltd.’s two Board Committees - the Audit
Committee and the G&C Committee, again this year reviewed
and approved their respective Charters. The Board continues
to receive reports from the respective committee chairmen
on their work and respective areas of oversight. In addition to
these reports and as a matter of process, the Minutes of all
Committee Meetings are tabled for note at Massy Holdings
Ltd’s. Board Meetings.
REPORT OF THE AUDIT COMMITTEE
Audit Committee structure
The Massy Holdings Ltd. Audit Committee is comprised of
5 Directors, of which four are Non-Executive Directors. The
Members of the Audit Committee as at September 30, 2015
were:
Corporate Governance
Corporate G
overnance
71
05Mr. William Lucie-Smith (Chairman)
Dr. Rolph Balgobin
Mr. Patrick Hylton
Mr. Richard P. Young
Mr. E. Gervase Warner (Ex-Officio)
The Audit Committee Charter, the Internal Audit Charter and the
Delegation of Authority for Non-Audit Services, provided by the
External Auditor, were last reviewed and adopted by the Massy
Holdings Ltd. Board on February 9, 2015. The report of the Audit
Committee for 2015 follows.
Meetings
The Audit Committee held 6 meetings for the year ended
September 30, 2015 to discharge its responsibilities.
Structure of Internal Audit
The appointed Group Internal Auditor is responsible for the
overall Group Internal Audit Function and adherence to the
International Standards for the Professional Practice of Internal
Auditing of The Institute of Internal Auditors. The Group
Internal Auditor reports administratively to the Group Chief
Executive Officer and functionally to the Chairman of the Audit
Committee and Internal Audit has unfettered access to the
Audit Committee.
Independence of Internal Audit
The Audit Committee is satisfied that the Internal Audit function
has been discharged in an objective and transparent manner.
Further, the Audit Committee has satisfied itself that the
performance of the function is not subject to management’s
undue influence.
Internal Control and The Internal Audit Function
The Massy Holdings Ltd. Board is responsible for the
Company’s system of internal controls and for reviewing its
effectiveness. The ongoing monitoring of the adequacy and
effectiveness of the Group’s internal control systems is the
primary responsibility of Internal Audit. The Audit Committee is
satisfied that Management, by approved risk corrective actions,
adequately remedied any weaknesses in internal controls
highlighted in the internal audit reports.
External Audit
The Audit Committee reviewed and approved the External
Auditor’s approach to and scope of their examination of the
financial statements for the 2015 financial year. The Members
are satisfied that PricewaterhouseCoopers has planned
the audit to obtain reasonable assurance that the financial
statements are free of material misstatement and present a
fair view of the financial position of the Group as at September
30, 2015 and the results of its operations and its cash flows for
the year then ended in accordance with International Financial
Reporting Standards.
Financial Statements
During 2015, the interim unaudited financial statements were
presented to the Audit Committee at its quarterly meetings
for review and recommendation for adoption by the Massy
Holdings Ltd. Board. The Audit Committee is satisfied that
the audited financial statements contained in this Annual
Report are complete, consistent with information known to
its Members and in conformity with appropriate accounting
principles that have been consistently applied.
Whistle-Blower Reports
Internal Audit continues to play a central role in ensuring that
whistle-blower procedures are effective and over the past
year, conducted a number of whistle-blower investigations.
In the coming year, the department will be further increasing
its capacity in this regard. These reports as it related to
non-financial whistle-blower matters continue to be cross-
reported to the G&C Committee.
REPORT OF THE GOVERNANCE & COMPENSATION
COMMITTEE
The Governance & Compensation Committee Structure
The G&C Committee is comprised of 5 Directors of which
four are Non-Executive Directors. The Members of the G&C
Committee as at September 30, 2015 were:
Mr. Gary Voss (Chairman)
Dr. Rolph Balgobin
Mr. G. Anthony King
Mr. Robert Bermudez (Ex-Officio)
Mr. E. Gervase Warner (Ex-Officio)
The G&C Committee’s Charter was last reviewed and adopted
by the Massy Holdings Ltd. Board on March 10, 2015. The
objectives of the G&C Committee are to develop, implement
and periodically review guidelines for appropriate corporate
governance of the Massy Holdings Ltd. Group of Companies
in furtherance of the Company’s commitment to good
corporate governance.
The G&C Committee’s responsibilities include:
1 To review the size and composition of the Massy
Holdings Ltd. Board and its Committees and to make
recommendations for new appointments;
7372
2 To review and make recommendations to the Massy
Holdings Ltd. Board in relation to the Company’s written
policies addressing matters such as ethics, business
conduct, conflict of interest, disclosure, insider trading and
whistle-blower protection;
3 To develop, implement and oversee an evaluation process
for the Massy Holdings Ltd. Board, its Committees and
individual Directors, to assess Board and Committee
effectiveness;
4 Approval/oversight of the remuneration, performance and
incentive awards of Senior Executives; and
5 Approval and oversight of the recruitment, engagement and
promotion of Senior Executives of the Massy Holdings Ltd.
Group.
Meetings
The G&C Committee held four meetings for the year ended
September 30, 2015 and among its accomplishments for the
year were:
• Review and recommendation for the approval of the Board;
Company’s Securities Trading and Corporate Disclosure
Policies;
• Review of the Board, Board Committee and Director
performance evaluation tools and system;
• Review of Executive Management Remuneration;
• Review and ratification of Independent Directors appointed
to subsidiary company boards; and
• On-going oversight for ‘non-financial’ whistle blower
matters and review of process for further strengthening and
enhancement.
Corporate Governance 06Corporate Requirements
Corporate R
equirements
73

7574
DIRECTORS’, SENIOR OFFICERS’ & CONNECTED PERSONS’ INTERESTS
Set out below are the Directors, Senior Officers and their connected persons with interests in the shares of Massy Holdings Ltd. and
the holders of the ten (10) largest blocks of shares in the Company as at September 30, 2015.
Directors and Senior Officers Position Shareholding Indirect Beneficial Shareholdings
Rolph Balgobin 6,525 Nil
Robert Bermudez 14,820 13,029
Earl Boodasingh 153,040 Nil
Patrick Hylton Nil Nil
Gerald Anthony King 75,000 Nil
William Lucie-Smith Nil 22,897
David O’Brien 54,463 Nil
Paula Rajkumarsingh 145,017 Nil
Robert Riley 2,595 Nil
Gary Voss Nil Nil
Elliot Gervase Warner 161,588 Nil
Maxine Williams Nil Nil
Richard P. Young 2,000 Nil
David Affonso 10,317 Nil
Julie Avey 7,727 Nil
Judith Bowen 31,225 Nil
Everton Browne Nil 118
Nisha Dass 7,056 Nil
Frere Delmas 19,409 Nil
Natasha Elias-Wilson 13,291 Nil
Angela Hamel-Smith 82,296 Nil
Susan Hamel-Smith 82,617 Nil
Wendy Kerry 1,483 Nil
Christian Maingot Nil Nil
Nisa Nathu Hari 2,994 Nil
Thomas Pantin 59,157 Nil
Doodnauth Persaud 29,492 Nil
Fenwick Reid 65,453 Nil
Alberto Rozo Nil Nil
Zyreene Sarafat 4,984 Nil
Baajnath Sirinath 25,640 Nil
Eugene Tiah 290 Nil
Curtis Tobal 24,788 Nil
Paula Rajkumarsingh, a Director (together with Curtis Lee Poy) holds a non-beneficial interest in 1,209,769 shares as a co-trustee of
the Neal & Massy Group Profit Sharing Plan.
Direct
ors’ Report
75
The Directors have pleasure in submitting their Report and the Audited Financial Statements for the financial year ended September
30, 2015
PRINCIPAL ACTIVITIES
The main activity is that of a Holding Company.
FINANCIAL RESULTS FOR THE YEAR
2015
Profit attributable to shareholders 638,406
Dividends paid (185,695)
Profit retained for the year 452,711
Other movements on revenue reserves (23,931)
Balance brought forward 3,442,388
Retained earnings at end of year 3,871,168
DIVIDENDS
The Directors declared an interim dividend of $0.51 and then a final dividend of $1.59 per share, making a total dividend of $2.10 per
share for the financial year. The final dividend will be paid on or after January 25, 2016 to Shareholders whose names appear on the
Register of members of the Company at the close of business on January 8, 2016.
DIRECTORS
Pursuant to paragraph 4.4.1 and 4.6.1. of By-Law No. 1 of the Company, Messrs. Rolph Balgobin, William Lucie-Smith, David O’Brien
and Robert Riley retire from the Board by rotation and being eligible offer themselves for re-election until the close of the third Annual
Meeting following this appointment.
DIRECTORS’ AND SENIOR OFFICERS’ INTERESTS
These should be read as part of this report.
AUDITORS
The Auditors, PricewaterhouseCoopers, retire and being eligible offer themselves for re-appointment.
BY ORDER OF THE BOARD
Wendy Kerry
Corporate Secretary
December 21, 2015
Directors’Report06
7776
Management Proxy Circular06
Managem
ent Proxy Circular
77
REPUBLIC OF TRINIDAD AND TOBAGO
THE COMPANIES ACT, CH. 81:01
[SECTION 144]
1 Name of Company: MASSY HOLDINGS LTD.
Company No.: M 4805 (C)
2 Particulars of Meeting:
Ninety Second Annual Meeting of Shareholders of the above named Company to be held at the Ballroom, Hilton Trinidad and
Conference Centre, 1B Lady Young Road, Port-of-Spain, Trinidad at 10:00 a.m. on February 12, 2016.
3 Solicitation:
It is intended to vote the Proxy solicited hereby (unless the shareholder directs otherwise) in favour of all resolutions specified
therein.
4 Any Director’s statement submitted pursuant to Section 76(2):
No statement has been received from any Director pursuant to Section 76(2) of the Companies Act, Ch. 81:01.
5 Any Auditor’s statement submitted pursuant to Section 171(1):
No statement has been received from the Auditors of the Company pursuant to Section 171(1) of the Companies Act, Ch. 81:01.
6 Any Shareholder’s proposal submitted pursuant to Sections 116(a) and 117(2):
No proposal has been received from any Shareholder pursuant to Sections 116(a) and 117(2) of the Companies Act, Ch. 81:01.
Date Name and Title Signature
December 21, 2015 Wendy Kerry
Corporate Secretary
HOLDERS OF THE TEN (10) LARGEST BLOCKS OF SHARES
Shareholders Number of Shares
1 National Insurance Board 19,801,051
2 RBC/RBTT Nominee Services Limited 10,221,719
3 RBC/RBTT Trust Limited 8,831,842
4 Republic Bank Limited 8,728,107
5 T&T Unit Trust Corporation 5,068,198
6 First Citizens Trust & Asset Management 4,377,547
7 Trintrust Limited 3,443,474
8 Guardian Life Of The Caribbean 2,120,431
9 Sagicor (Equity) Fund (Barbados) 1,350,347
10 Neon Liberty Lorikeet Master Fund Lp 1,244,775
NOTES
1 The Indirect Beneficial Shareholding of Directors and Senior Officers corresponds to the Trinidad & Tobago Stock Exchange Rules
(Rule 600) regarding the shareholdings of persons connected to Directors and Senior Officers. It includes the indirect beneficial
ownership/control of shares held by; (i) entities that a person owns/controls >50% shares, (ii) the Director’s/Senior Officer’s husband
or wife, and (iii) the Director’s/Senior Officer’s minor children
2 RBC/RBTT Nominee Services Limited holds a non-beneficial interest in 10,221,719 shares for the Neal & Massy Group Pension
Employee Share Ownership Plan.
3 Paula Rajkumarsingh, a Director (together with Curtis Lee Poy) holds a non-beneficial interest in 1,209,769 shares as a co-trustee
of the Neal & Massy Group Profit Sharing Plan.
4 National Insurance Board Limited holds a substantial interest in the issued share capital of the Company. A substantial interest
means one-tenth or more of the issued share capital of the Company.
5 There have been no changes to the Substantial Interests occurring between the end of the Company’s financial year and one
month prior to the date of the Notice convening the Annual Meeting.
6 There were no beneficial interests attached to any shares in the names of the Directors in the Company’s subsidiary companies
such shares being held by the Directors as nominees of the Company or its subsidiaries.
7 At no time during, or at the end of the financial year, were any material contracts or proposed material contracts granted by the
Company, or any of its subsidiary companies, to any Director or Proposed Director of the Company.
Director’s Report
7978
07Financials
Financials
79
The accompanying consolidated financial statements of Massy
Holdings Ltd. and its subsidiaries (the Group) were prepared by
management, who is responsible for the integrity and fairness
of the information presented. Management acknowledges its
responsibility for the preparation of the consolidated financial
statements annually and for establishing and maintaining an
adequate internal control structure and procedures for financial
reporting and safeguarding the assets of the Group.
It is management’s responsibility to apply the appropriate
accounting policies and make accounting estimates that are
reasonable. Management is responsible for ensuring that
the consolidated statements presented are a true and fair
presentation of the state of affairs of the Group which includes
ensuring that the controls over the information from which the
consolidated statements are derived are designed and properly
monitored in a manner which would allow accurate information
to be provided. In addition, management is responsible for
ensuring that the information presented is free from material
misstatement whether due to fraud or error.
Management accepts responsibility for the annual
consolidated financial statements as well as the responsibility
for the maintenance of the accounting records and internal
controls which form the basis of the consolidated financial
statements. The consolidated financial statements of Massy
Holdings Ltd. and its subsidiaries are prepared in accordance
with International Financial Reporting Standards and the
appropriate accounting policies have been established and
applied in a manner which give a true and fair view of the
Group’s financial affairs and operating results.
In addition, it is noteworthy to mention that nothing has come
to the attention of management to indicate that the Group will
not remain a going concern for the next twelve months from the
date of this statement.
Statement ofManagement’s Responsibility06
E. Gervase Warner
President & Group
Chief Executive Officer
December 21, 2015
Paula Rajkumarsingh Group Executive Vice
President & Group
Chief Financial Officer
December 21, 2015
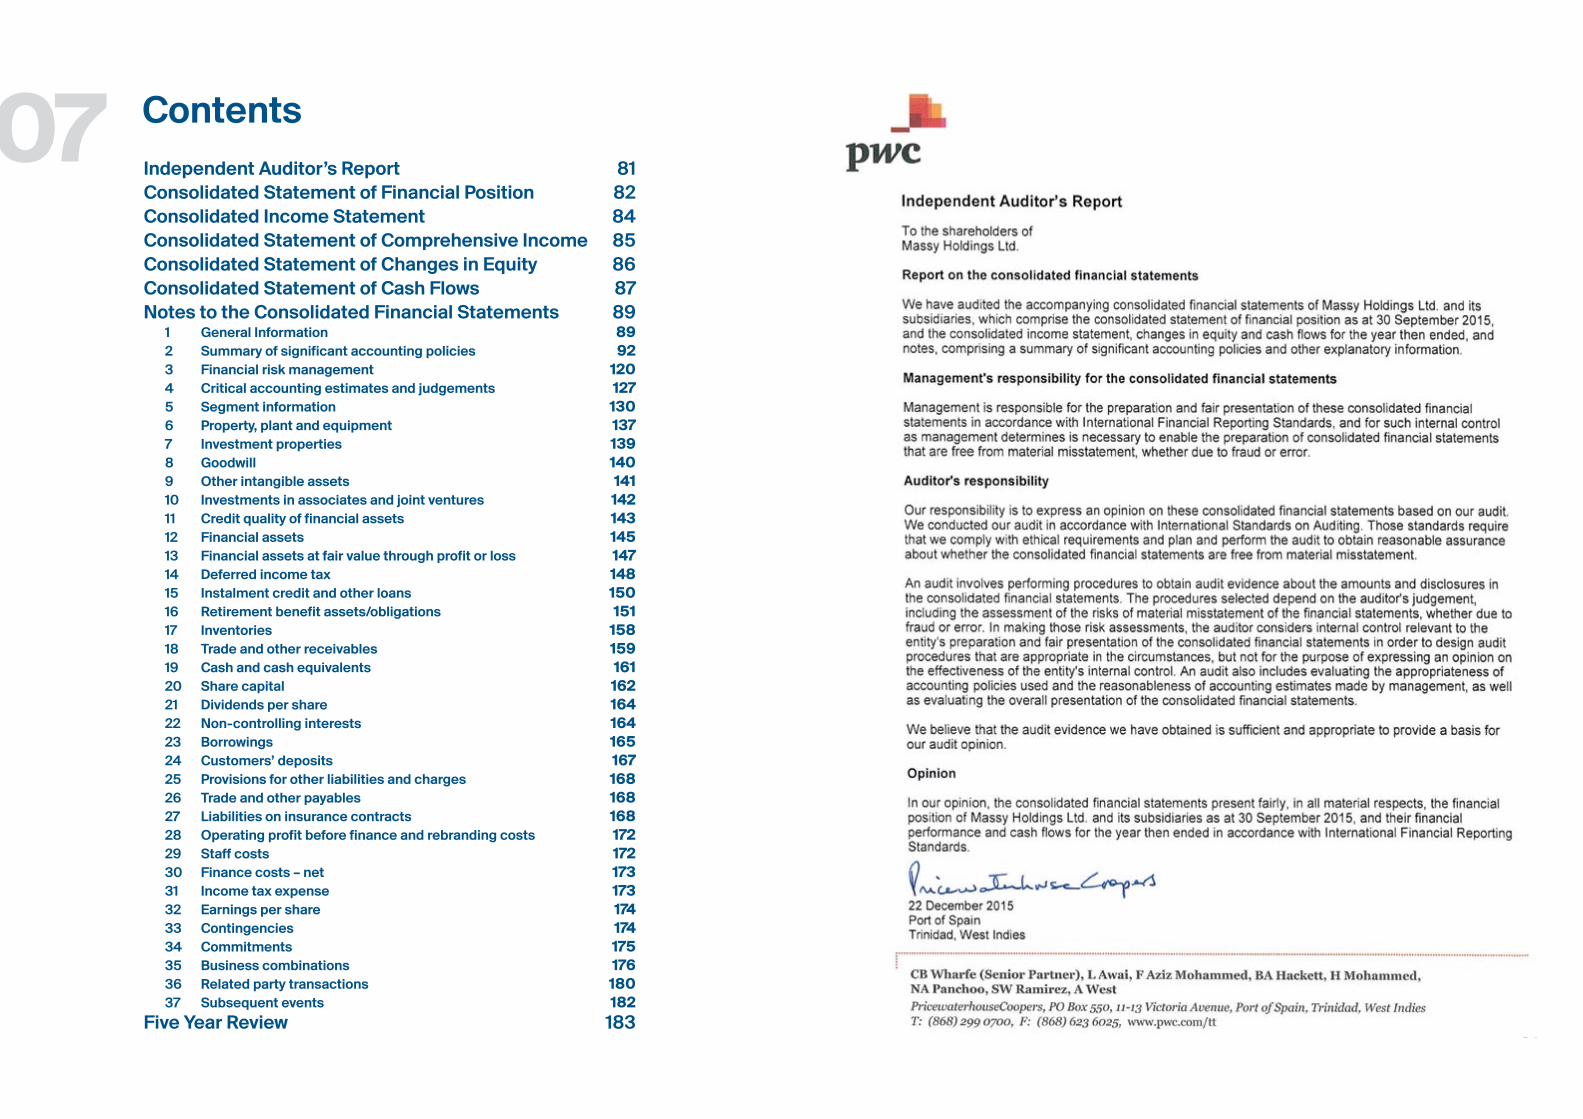
8180
07Independent Auditor’s Report 81Consolidated Statement of Financial Position 82Consolidated Income Statement 84Consolidated Statement of Comprehensive Income 85Consolidated Statement of Changes in Equity 86Consolidated Statement of Cash Flows 87Notes to the Consolidated Financial Statements 89
1 General Information 89 2 Summary of significant accounting policies 923 Financial risk management 1204 Critical accounting estimates and judgements 1275 Segment information 1306 Property, plant and equipment 1377 Investment properties 1398 Goodwill 1409 Other intangible assets 14110 Investments in associates and joint ventures 14211 Credit quality of financial assets 14312 Financial assets 14513 Financial assets at fair value through profit or loss 14714 Deferred income tax 14815 Instalment credit and other loans 15016 Retirement benefit assets/obligations 15117 Inventories 15818 Trade and other receivables 15919 Cash and cash equivalents 16120 Share capital 16221 Dividends per share 16422 Non-controlling interests 16423 Borrowings 16524 Customers’ deposits 16725 Provisions for other liabilities and charges 16826 Trade and other payables 16827 Liabilities on insurance contracts 16828 Operating profit before finance and rebranding costs 17229 Staff costs 17230 Finance costs – net 17331 Income tax expense 17332 Earnings per share 17433 Contingencies 17434 Commitments 17535 Business combinations 17636 Related party transactions 18037 Subsequent events 182
Five Year Review 183
Contents
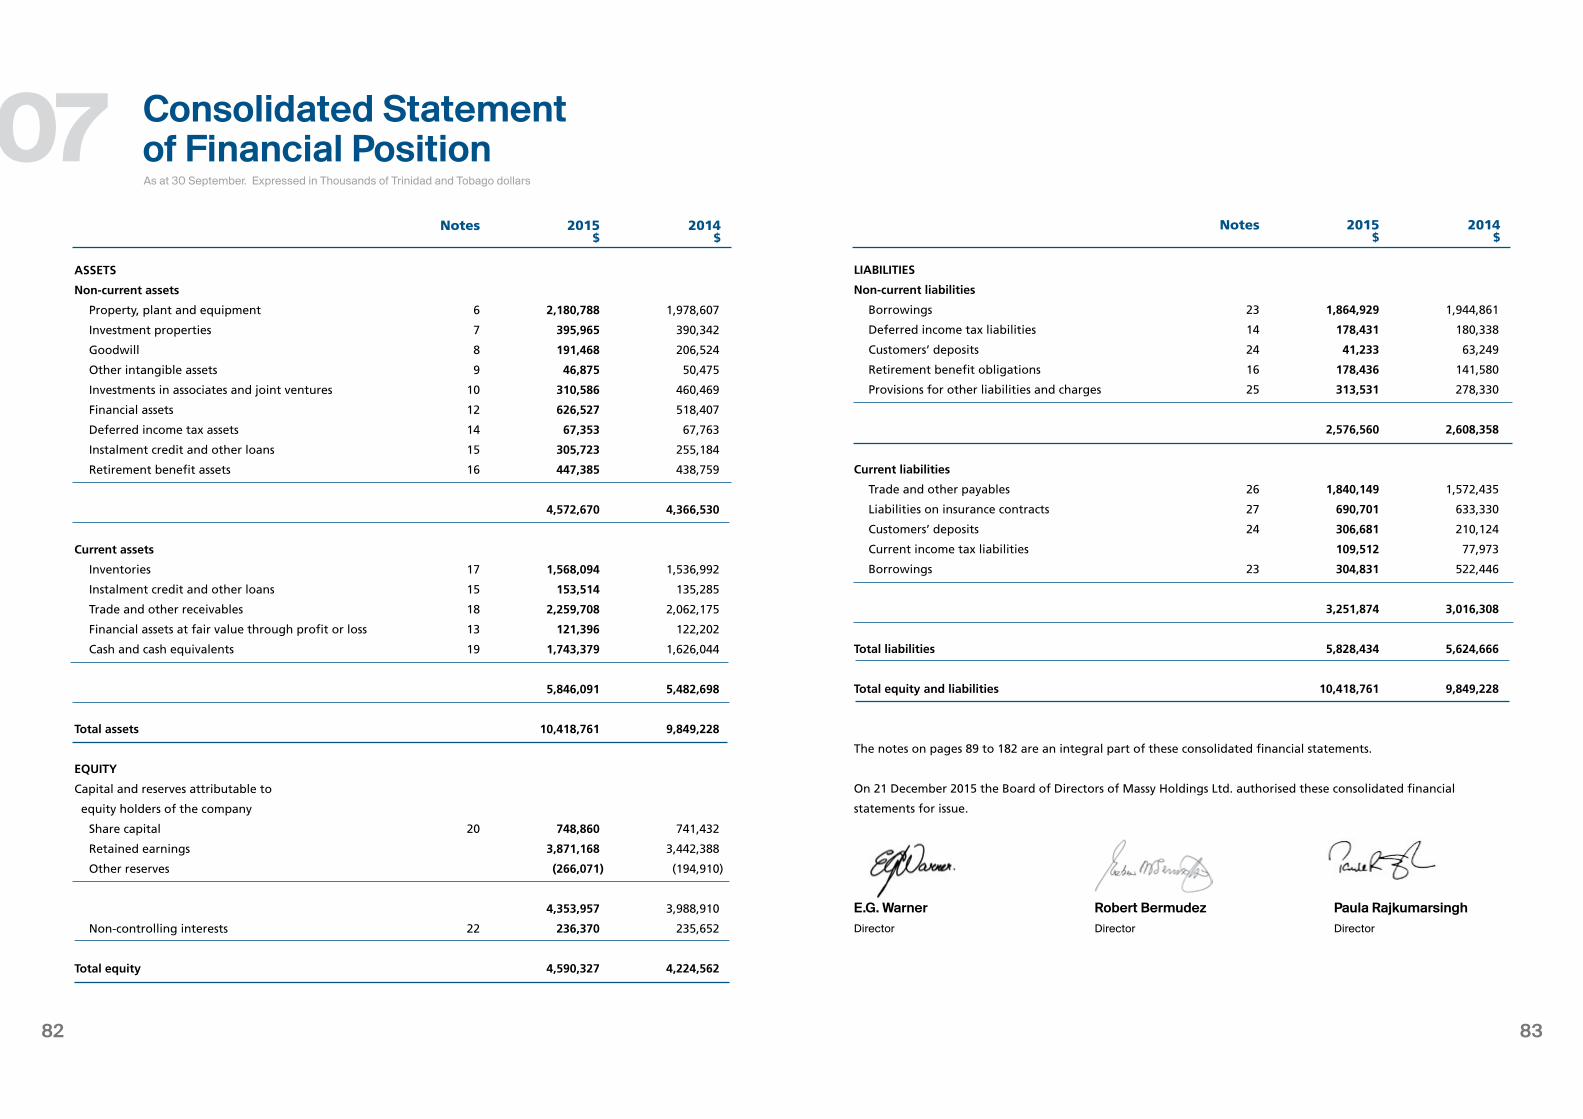
8382
Notes 2015 2014 $ $
LIABILITIES
Non-current liabilities
Borrowings 23 1,864,929 1,944,861
Deferred income tax liabilities 14 178,431 180,338
Customers’ deposits 24 41,233 63,249
Retirement benefit obligations 16 178,436 141,580
Provisions for other liabilities and charges 25 313,531 278,330
2,576,560 2,608,358
Current liabilities
Trade and other payables 26 1,840,149 1,572,435
Liabilities on insurance contracts 27 690,701 633,330
Customers’ deposits 24 306,681 210,124
Current income tax liabilities 109,512 77,973
Borrowings 23 304,831 522,446
3,251,874 3,016,308
Total liabilities 5,828,434 5,624,666
Total equity and liabilities 10,418,761 9,849,228
The notes on pages 89 to 182 are an integral part of these consolidated financial statements.
On 21 December 2015 the Board of Directors of Massy Holdings Ltd. authorised these consolidated financial
statements for issue.
E.G. Warner Robert Bermudez Paula RajkumarsinghDirector Director Director
ASSETS
Non-current assets
Property, plant and equipment 6 2,180,788 1,978,607
Investment properties 7 395,965 390,342
Goodwill 8 191,468 206,524
Other intangible assets 9 46,875 50,475
Investments in associates and joint ventures 10 310,586 460,469
Financial assets 12 626,527 518,407
Deferred income tax assets 14 67,353 67,763
Instalment credit and other loans 15 305,723 255,184
Retirement benefit assets 16 447,385 438,759
4,572,670 4,366,530
Current assets
Inventories 17 1,568,094 1,536,992
Instalment credit and other loans 15 153,514 135,285
Trade and other receivables 18 2,259,708 2,062,175
Financial assets at fair value through profit or loss 13 121,396 122,202
Cash and cash equivalents 19 1,743,379 1,626,044
5,846,091 5,482,698
Total assets 10,418,761 9,849,228
EQUITY
Capital and reserves attributable to
equity holders of the company
Share capital 20 748,860 741,432
Retained earnings 3,871,168 3,442,388
Other reserves (266,071) (194,910)
4,353,957 3,988,910
Non-controlling interests 22 236,370 235,652
Total equity 4,590,327 4,224,562
Notes 2015 2014 $ $
As at 30 September. Expressed in Thousands of Trinidad and Tobago dollars
Consolidated Statement of Financial Position 07

8584
Profit for the year 668,314 600,099
Other comprehensive income:
Items that will not be reclassified to profit or loss
- remeasurement of defined benefit pension plans (19,199) 13,084
(19,199) 13,084
Items that may be subsequently reclassified
to profit or loss
- available for sale financial assets 12 157 1,666
- currency translation differences (79,238) (45,550)
(79,081) (43,884)
Other comprehensive loss for the year, net of tax (98,280) (30,800)
Total comprehensive income for the year 570,034 569,299
Attributable to:
- owners of the parent 547,524 524,274
- non-controlling interests 22,510 45,025
Total comprehensive income for the year 570,034 569,299
The notes on pages 89 to 182 are an integral part of these consolidated financial statements.
Year ended 30 September. Expressed in Thousands of Trinidad and Tobago dollars
Consolidated Statement of Comprehensive Income07
Notes 2015 2014 $ $
Revenue 5 11,944,843 10,703,801
Operating profit before finance costs
and rebranding costs 28 959,851 880,801
Finance costs - net 30 (81,314) (33,857)
878,537 846,944
Share of results of associates and joint ventures 10 40,202 43,444
Profit before rebranding costs and income tax 918,739 890,388
Rebranding costs 5 359 (57,909)
Profit before income tax 919,098 832,479
Income tax expense 31 (250,784) (232,380)
Profit for the year 668,314 600,099
Profit attributable to owners of the parent 638,406 555,003
Profit attributable to non-controlling interests 22 29,908 45,096
Profit for the year 668,314 600,099
Earnings per share attributable to the owners of the parent
during the year (expressed in TT$ per share)
Basic earnings per share 32 6.53 5.69
Diluted earnings per share 32 6.53 5.69
Dividends per share 21 2.10 1.90
Dividends paid per share 21 1.90 1.76
The notes on pages 89 to 182 are an integral part of these consolidated financial statements.
Year ended 30 September. Expressed in Thousands of Trinidad and Tobago dollars
Consolidated Income Statement 07
Notes 2015 2014 $ $
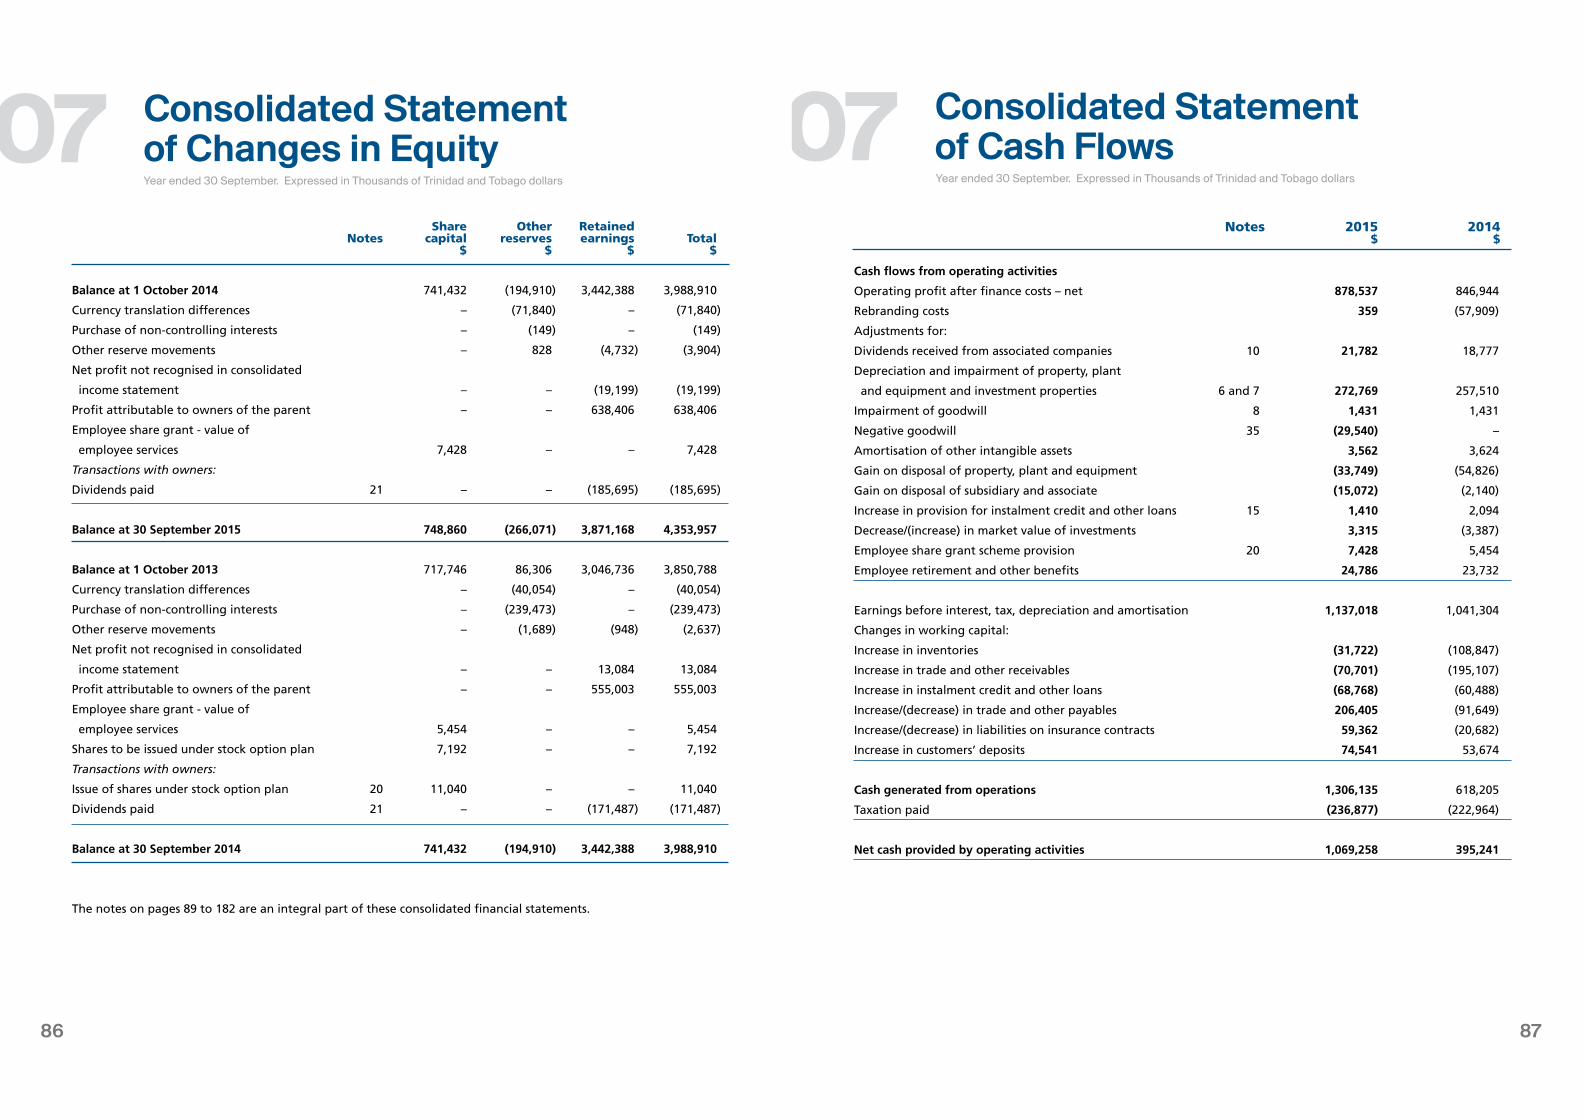
8786
Year ended 30 September. Expressed in Thousands of Trinidad and Tobago dollars
Consolidated Statementof Changes in Equity07
Share Other Retained Notes capital reserves earnings Total $ $ $ $
Balance at 1 October 2014 741,432 (194,910) 3,442,388 3,988,910
Currency translation differences – (71,840) – (71,840)
Purchase of non-controlling interests – (149) – (149)
Other reserve movements – 828 (4,732) (3,904)
Net profit not recognised in consolidated
income statement – – (19,199) (19,199)
Profit attributable to owners of the parent – – 638,406 638,406
Employee share grant - value of
employee services 7,428 – – 7,428
Transactions with owners:
Dividends paid 21 – – (185,695) (185,695)
Balance at 30 September 2015 748,860 (266,071) 3,871,168 4,353,957
Balance at 1 October 2013 717,746 86,306 3,046,736 3,850,788
Currency translation differences – (40,054) – (40,054)
Purchase of non-controlling interests – (239,473) – (239,473)
Other reserve movements – (1,689) (948) (2,637)
Net profit not recognised in consolidated
income statement – – 13,084 13,084
Profit attributable to owners of the parent – – 555,003 555,003
Employee share grant - value of
employee services 5,454 – – 5,454
Shares to be issued under stock option plan 7,192 – – 7,192
Transactions with owners:
Issue of shares under stock option plan 20 11,040 – – 11,040
Dividends paid 21 – – (171,487) (171,487)
Balance at 30 September 2014 741,432 (194,910) 3,442,388 3,988,910
The notes on pages 89 to 182 are an integral part of these consolidated financial statements.
Year ended 30 September. Expressed in Thousands of Trinidad and Tobago dollars
Consolidated Statement of Cash Flows07
Notes 2015 2014 $ $
Cash flows from operating activities
Operating profit after finance costs – net 878,537 846,944
Rebranding costs 359 (57,909)
Adjustments for:
Dividends received from associated companies 10 21,782 18,777
Depreciation and impairment of property, plant
and equipment and investment properties 6 and 7 272,769 257,510
Impairment of goodwill 8 1,431 1,431
Negative goodwill 35 (29,540) –
Amortisation of other intangible assets 3,562 3,624
Gain on disposal of property, plant and equipment (33,749) (54,826)
Gain on disposal of subsidiary and associate (15,072) (2,140)
Increase in provision for instalment credit and other loans 15 1,410 2,094
Decrease/(increase) in market value of investments 3,315 (3,387)
Employee share grant scheme provision 20 7,428 5,454
Employee retirement and other benefits 24,786 23,732
Earnings before interest, tax, depreciation and amortisation 1,137,018 1,041,304
Changes in working capital:
Increase in inventories (31,722) (108,847)
Increase in trade and other receivables (70,701) (195,107)
Increase in instalment credit and other loans (68,768) (60,488)
Increase/(decrease) in trade and other payables 206,405 (91,649)
Increase/(decrease) in liabilities on insurance contracts 59,362 (20,682)
Increase in customers’ deposits 74,541 53,674
Cash generated from operations 1,306,135 618,205
Taxation paid (236,877) (222,964)
Net cash provided by operating activities 1,069,258 395,241
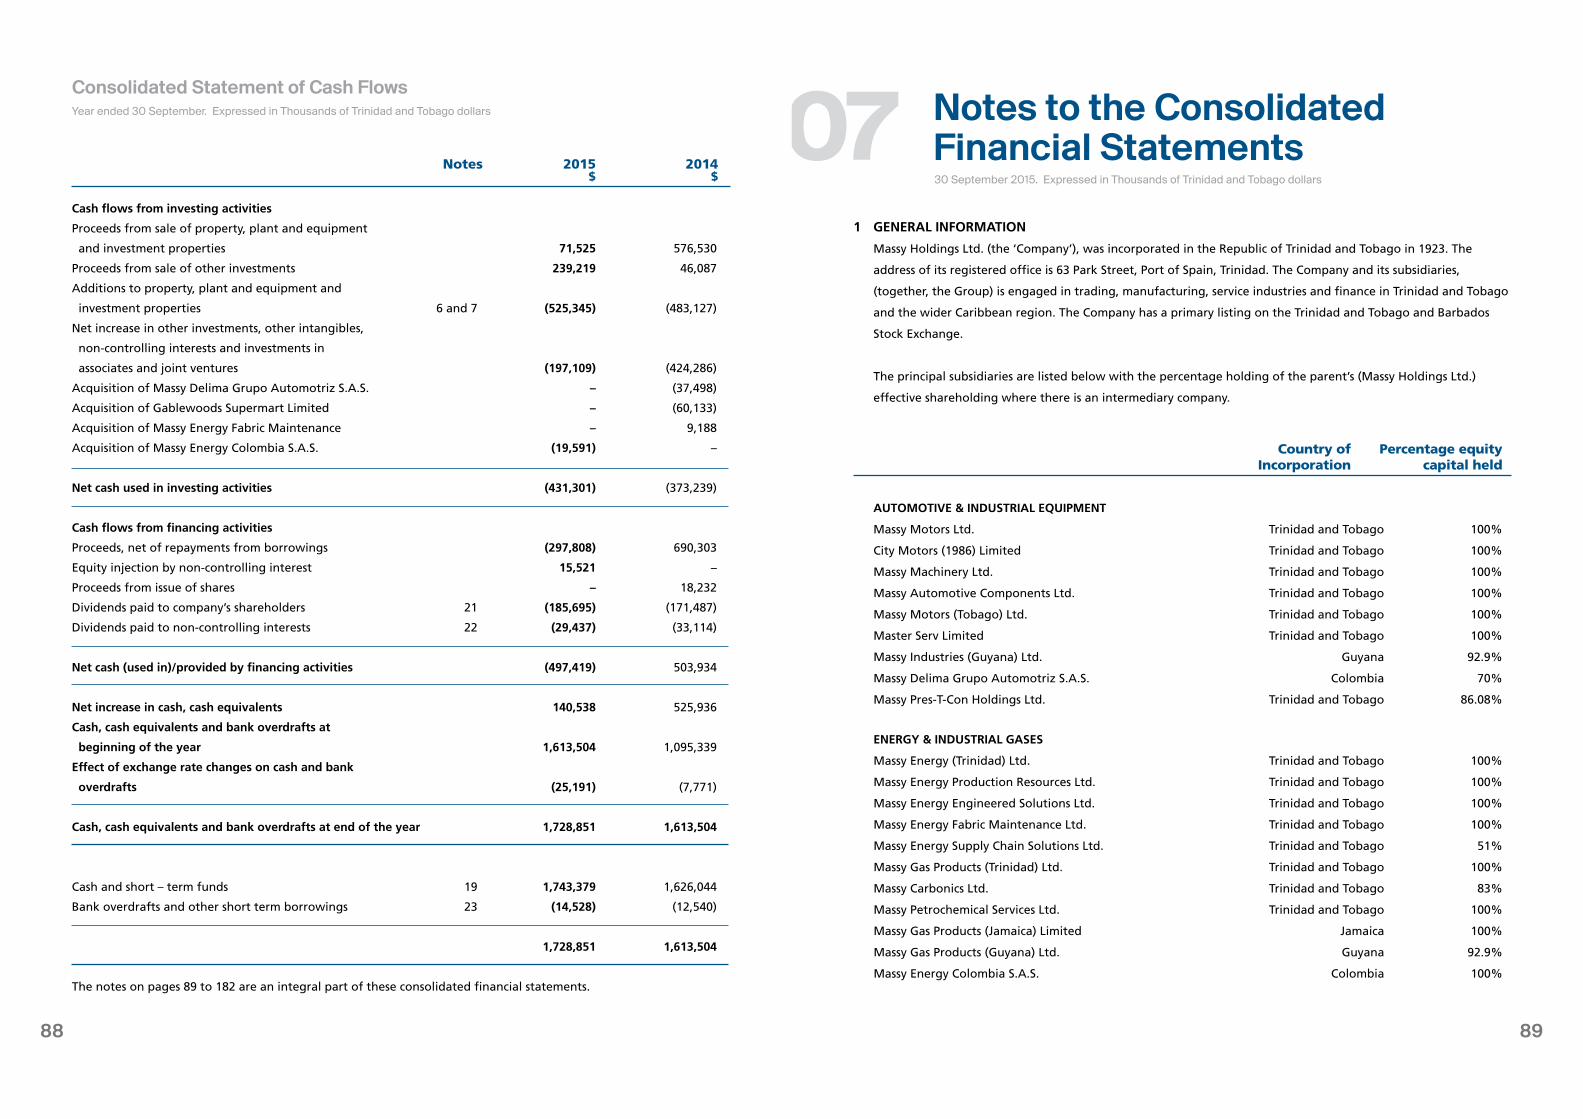
8988
Consolidated Statement of Cash Flows
Notes 2015 2014 $ $
Cash flows from investing activities
Proceeds from sale of property, plant and equipment
and investment properties 71,525 576,530
Proceeds from sale of other investments 239,219 46,087
Additions to property, plant and equipment and
investment properties 6 and 7 (525,345) (483,127)
Net increase in other investments, other intangibles,
non-controlling interests and investments in
associates and joint ventures (197,109) (424,286)
Acquisition of Massy Delima Grupo Automotriz S.A.S. – (37,498)
Acquisition of Gablewoods Supermart Limited – (60,133)
Acquisition of Massy Energy Fabric Maintenance – 9,188
Acquisition of Massy Energy Colombia S.A.S. (19,591) –
Net cash used in investing activities (431,301) (373,239)
Cash flows from financing activities
Proceeds, net of repayments from borrowings (297,808) 690,303
Equity injection by non-controlling interest 15,521 –
Proceeds from issue of shares – 18,232
Dividends paid to company’s shareholders 21 (185,695) (171,487)
Dividends paid to non-controlling interests 22 (29,437) (33,114)
Net cash (used in)/provided by financing activities (497,419) 503,934
Net increase in cash, cash equivalents 140,538 525,936
Cash, cash equivalents and bank overdrafts at
beginning of the year 1,613,504 1,095,339
Effect of exchange rate changes on cash and bank
overdrafts (25,191) (7,771)
Cash, cash equivalents and bank overdrafts at end of the year 1,728,851 1,613,504
Cash and short – term funds 19 1,743,379 1,626,044
Bank overdrafts and other short term borrowings 23 (14,528) (12,540)
1,728,851 1,613,504
The notes on pages 89 to 182 are an integral part of these consolidated financial statements.
Year ended 30 September. Expressed in Thousands of Trinidad and Tobago dollars
1 GENERAL INFORMATION
Massy Holdings Ltd. (the ‘Company’), was incorporated in the Republic of Trinidad and Tobago in 1923. The
address of its registered office is 63 Park Street, Port of Spain, Trinidad. The Company and its subsidiaries,
(together, the Group) is engaged in trading, manufacturing, service industries and finance in Trinidad and Tobago
and the wider Caribbean region. The Company has a primary listing on the Trinidad and Tobago and Barbados
Stock Exchange.
The principal subsidiaries are listed below with the percentage holding of the parent’s (Massy Holdings Ltd.)
effective shareholding where there is an intermediary company.
Country of Percentage equity Incorporation capital held
AUTOMOTIVE & INDUSTRIAL EQUIPMENT
Massy Motors Ltd. Trinidad and Tobago 100%
City Motors (1986) Limited Trinidad and Tobago 100%
Massy Machinery Ltd. Trinidad and Tobago 100%
Massy Automotive Components Ltd. Trinidad and Tobago 100%
Massy Motors (Tobago) Ltd. Trinidad and Tobago 100%
Master Serv Limited Trinidad and Tobago 100%
Massy Industries (Guyana) Ltd. Guyana 92.9%
Massy Delima Grupo Automotriz S.A.S. Colombia 70%
Massy Pres-T-Con Holdings Ltd. Trinidad and Tobago 86.08%
ENERGY & INDUSTRIAL GASES
Massy Energy (Trinidad) Ltd. Trinidad and Tobago 100%
Massy Energy Production Resources Ltd. Trinidad and Tobago 100%
Massy Energy Engineered Solutions Ltd. Trinidad and Tobago 100%
Massy Energy Fabric Maintenance Ltd. Trinidad and Tobago 100%
Massy Energy Supply Chain Solutions Ltd. Trinidad and Tobago 51%
Massy Gas Products (Trinidad) Ltd. Trinidad and Tobago 100%
Massy Carbonics Ltd. Trinidad and Tobago 83%
Massy Petrochemical Services Ltd. Trinidad and Tobago 100%
Massy Gas Products (Jamaica) Limited Jamaica 100%
Massy Gas Products (Guyana) Ltd. Guyana 92.9%
Massy Energy Colombia S.A.S. Colombia 100%
30 September 2015. Expressed in Thousands of Trinidad and Tobago dollars
Notes to the Consolidated Financial Statements07
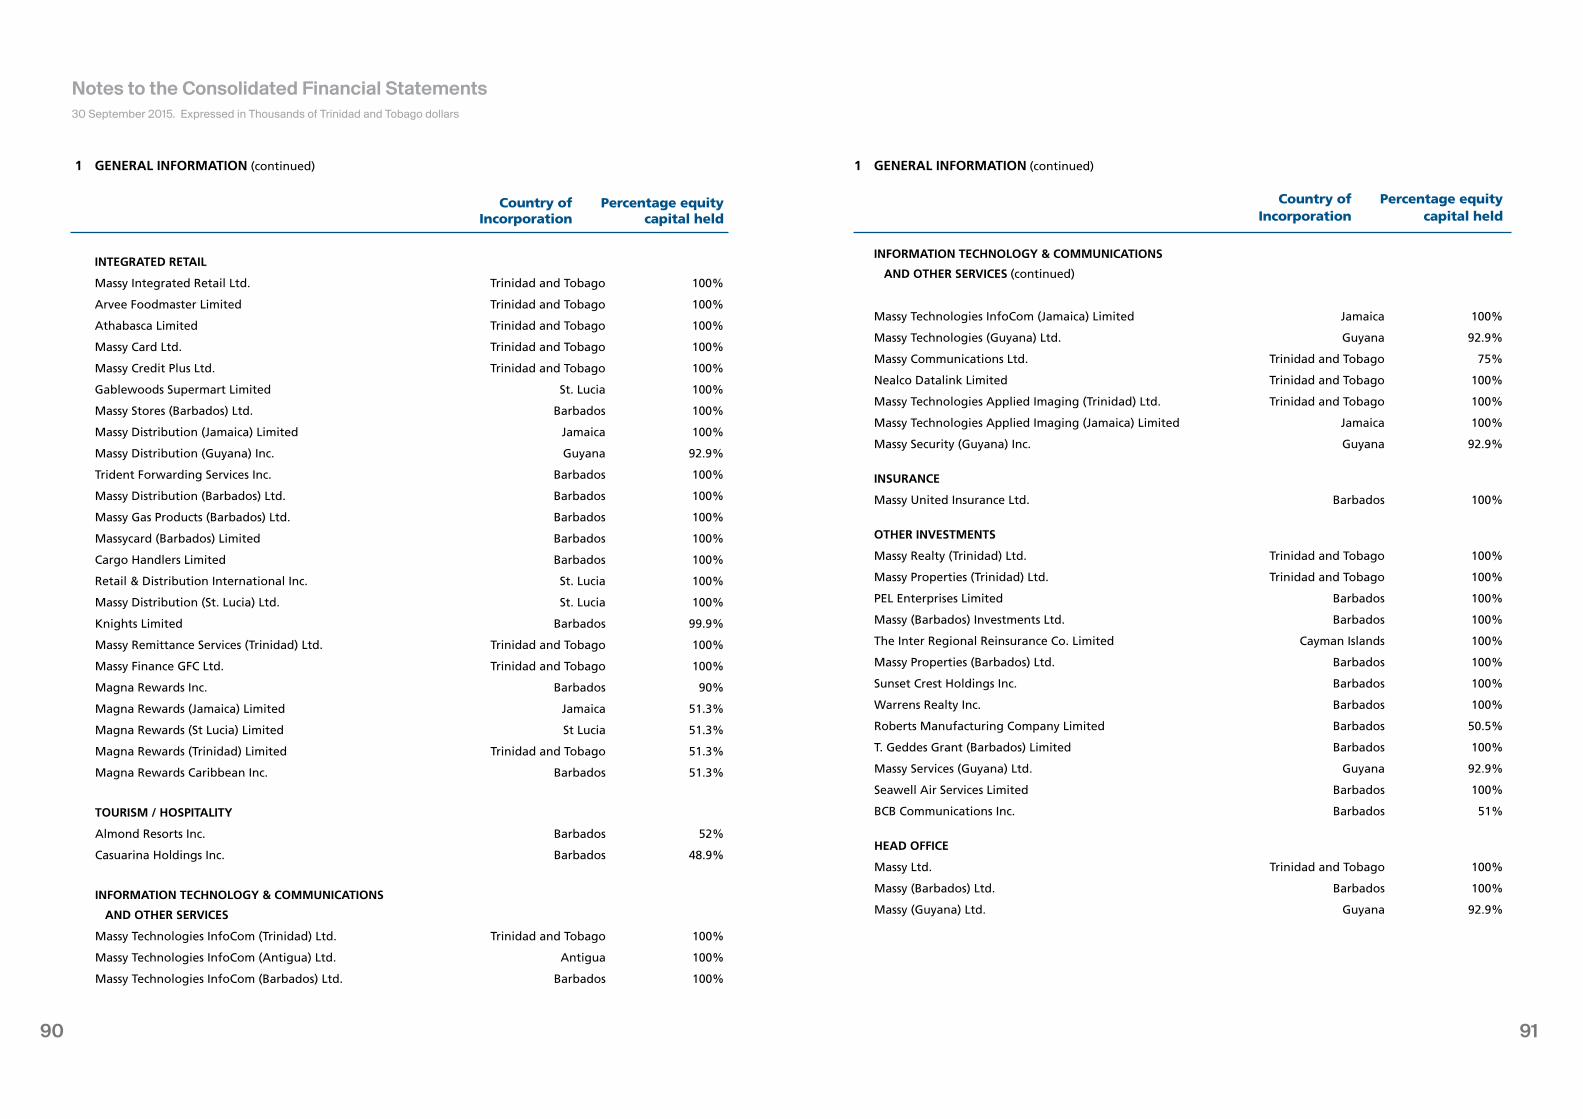
9190
1 GENERAL INFORMATION (continued)
Country of Percentage equity Incorporation capital held
INTEGRATED RETAIL
Massy Integrated Retail Ltd. Trinidad and Tobago 100%
Arvee Foodmaster Limited Trinidad and Tobago 100%
Athabasca Limited Trinidad and Tobago 100%
Massy Card Ltd. Trinidad and Tobago 100%
Massy Credit Plus Ltd. Trinidad and Tobago 100%
Gablewoods Supermart Limited St. Lucia 100%
Massy Stores (Barbados) Ltd. Barbados 100%
Massy Distribution (Jamaica) Limited Jamaica 100%
Massy Distribution (Guyana) Inc. Guyana 92.9%
Trident Forwarding Services Inc. Barbados 100%
Massy Distribution (Barbados) Ltd. Barbados 100%
Massy Gas Products (Barbados) Ltd. Barbados 100%
Massycard (Barbados) Limited Barbados 100%
Cargo Handlers Limited Barbados 100%
Retail & Distribution International Inc. St. Lucia 100%
Massy Distribution (St. Lucia) Ltd. St. Lucia 100%
Knights Limited Barbados 99.9%
Massy Remittance Services (Trinidad) Ltd. Trinidad and Tobago 100%
Massy Finance GFC Ltd. Trinidad and Tobago 100%
Magna Rewards Inc. Barbados 90%
Magna Rewards (Jamaica) Limited Jamaica 51.3%
Magna Rewards (St Lucia) Limited St Lucia 51.3%
Magna Rewards (Trinidad) Limited Trinidad and Tobago 51.3%
Magna Rewards Caribbean Inc. Barbados 51.3%
TOURISM / HOSPITALITY
Almond Resorts Inc. Barbados 52%
Casuarina Holdings Inc. Barbados 48.9%
INFORMATION TECHNOLOGY & COMMUNICATIONS
AND OTHER SERVICES
Massy Technologies InfoCom (Trinidad) Ltd. Trinidad and Tobago 100%
Massy Technologies InfoCom (Antigua) Ltd. Antigua 100%
Massy Technologies InfoCom (Barbados) Ltd. Barbados 100%
30 September 2015. Expressed in Thousands of Trinidad and Tobago dollars
Notes to the Consolidated Financial Statements
1 GENERAL INFORMATION (continued)
Country of Percentage equity Incorporation capital held
INFORMATION TECHNOLOGY & COMMUNICATIONS
AND OTHER SERVICES (continued)
Massy Technologies InfoCom (Jamaica) Limited Jamaica 100%
Massy Technologies (Guyana) Ltd. Guyana 92.9%
Massy Communications Ltd. Trinidad and Tobago 75%
Nealco Datalink Limited Trinidad and Tobago 100%
Massy Technologies Applied Imaging (Trinidad) Ltd. Trinidad and Tobago 100%
Massy Technologies Applied Imaging (Jamaica) Limited Jamaica 100%
Massy Security (Guyana) Inc. Guyana 92.9%
INSURANCE
Massy United Insurance Ltd. Barbados 100%
OTHER INVESTMENTS
Massy Realty (Trinidad) Ltd. Trinidad and Tobago 100%
Massy Properties (Trinidad) Ltd. Trinidad and Tobago 100%
PEL Enterprises Limited Barbados 100%
Massy (Barbados) Investments Ltd. Barbados 100%
The Inter Regional Reinsurance Co. Limited Cayman Islands 100%
Massy Properties (Barbados) Ltd. Barbados 100%
Sunset Crest Holdings Inc. Barbados 100%
Warrens Realty Inc. Barbados 100%
Roberts Manufacturing Company Limited Barbados 50.5%
T. Geddes Grant (Barbados) Limited Barbados 100%
Massy Services (Guyana) Ltd. Guyana 92.9%
Seawell Air Services Limited Barbados 100%
BCB Communications Inc. Barbados 51%
HEAD OFFICE
Massy Ltd. Trinidad and Tobago 100%
Massy (Barbados) Ltd. Barbados 100%
Massy (Guyana) Ltd. Guyana 92.9%
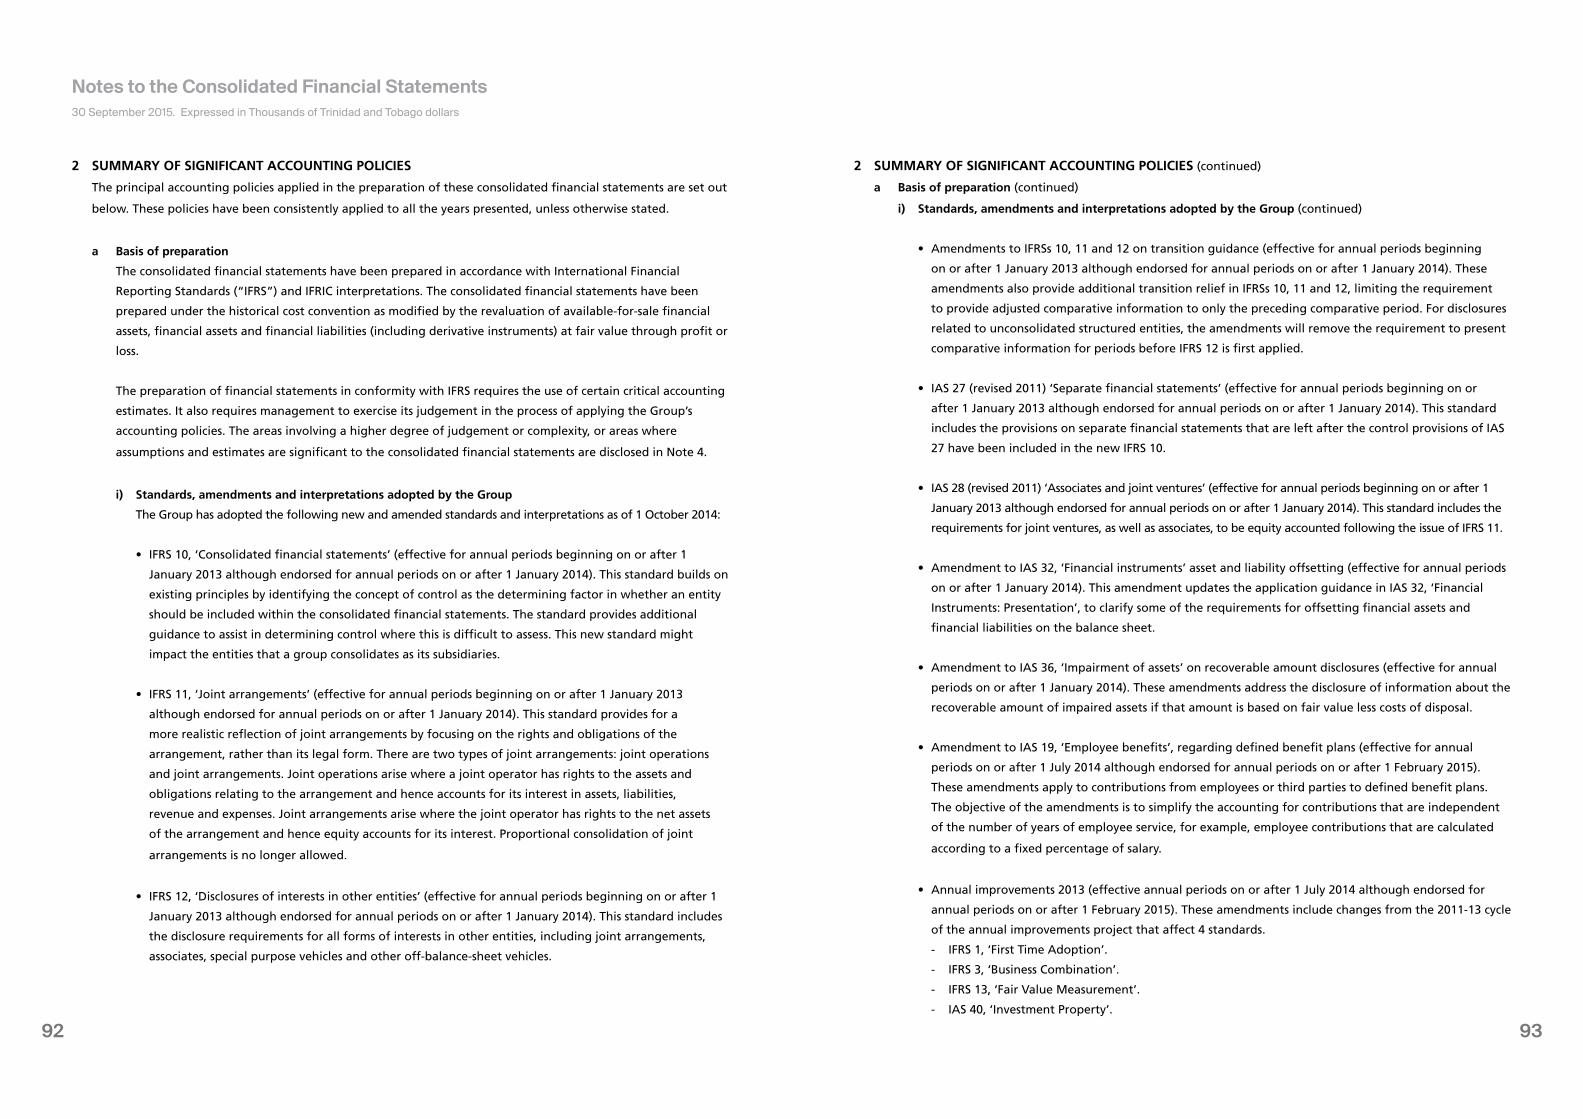
9392
2 SUMMARY OF SIGNIFICANT ACCOUNTING POLICIES
The principal accounting policies applied in the preparation of these consolidated financial statements are set out
below. These policies have been consistently applied to all the years presented, unless otherwise stated.
a Basis of preparation
The consolidated financial statements have been prepared in accordance with International Financial
Reporting Standards (“IFRS”) and IFRIC interpretations. The consolidated financial statements have been
prepared under the historical cost convention as modified by the revaluation of available-for-sale financial
assets, financial assets and financial liabilities (including derivative instruments) at fair value through profit or
loss.
The preparation of financial statements in conformity with IFRS requires the use of certain critical accounting
estimates. It also requires management to exercise its judgement in the process of applying the Group’s
accounting policies. The areas involving a higher degree of judgement or complexity, or areas where
assumptions and estimates are significant to the consolidated financial statements are disclosed in Note 4.
i) Standards, amendments and interpretations adopted by the Group
The Group has adopted the following new and amended standards and interpretations as of 1 October 2014:
• IFRS 10, ‘Consolidated financial statements’ (effective for annual periods beginning on or after 1
January 2013 although endorsed for annual periods on or after 1 January 2014). This standard builds on
existing principles by identifying the concept of control as the determining factor in whether an entity
should be included within the consolidated financial statements. The standard provides additional
guidance to assist in determining control where this is difficult to assess. This new standard might
impact the entities that a group consolidates as its subsidiaries.
• IFRS 11, ‘Joint arrangements’ (effective for annual periods beginning on or after 1 January 2013
although endorsed for annual periods on or after 1 January 2014). This standard provides for a
more realistic reflection of joint arrangements by focusing on the rights and obligations of the
arrangement, rather than its legal form. There are two types of joint arrangements: joint operations
and joint arrangements. Joint operations arise where a joint operator has rights to the assets and
obligations relating to the arrangement and hence accounts for its interest in assets, liabilities,
revenue and expenses. Joint arrangements arise where the joint operator has rights to the net assets
of the arrangement and hence equity accounts for its interest. Proportional consolidation of joint
arrangements is no longer allowed.
• IFRS 12, ‘Disclosures of interests in other entities’ (effective for annual periods beginning on or after 1
January 2013 although endorsed for annual periods on or after 1 January 2014). This standard includes
the disclosure requirements for all forms of interests in other entities, including joint arrangements,
associates, special purpose vehicles and other off-balance-sheet vehicles.
30 September 2015. Expressed in Thousands of Trinidad and Tobago dollars
Notes to the Consolidated Financial Statements
2 SUMMARY OF SIGNIFICANT ACCOUNTING POLICIES (continued)
a Basis of preparation (continued)
i) Standards, amendments and interpretations adopted by the Group (continued)
• Amendments to IFRSs 10, 11 and 12 on transition guidance (effective for annual periods beginning
on or after 1 January 2013 although endorsed for annual periods on or after 1 January 2014). These
amendments also provide additional transition relief in IFRSs 10, 11 and 12, limiting the requirement
to provide adjusted comparative information to only the preceding comparative period. For disclosures
related to unconsolidated structured entities, the amendments will remove the requirement to present
comparative information for periods before IFRS 12 is first applied.
• IAS 27 (revised 2011) ‘Separate financial statements’ (effective for annual periods beginning on or
after 1 January 2013 although endorsed for annual periods on or after 1 January 2014). This standard
includes the provisions on separate financial statements that are left after the control provisions of IAS
27 have been included in the new IFRS 10.
• IAS 28 (revised 2011) ‘Associates and joint ventures’ (effective for annual periods beginning on or after 1
January 2013 although endorsed for annual periods on or after 1 January 2014). This standard includes the
requirements for joint ventures, as well as associates, to be equity accounted following the issue of IFRS 11.
• Amendment to IAS 32, ‘Financial instruments’ asset and liability offsetting (effective for annual periods
on or after 1 January 2014). This amendment updates the application guidance in IAS 32, ‘Financial
Instruments: Presentation’, to clarify some of the requirements for offsetting financial assets and
financial liabilities on the balance sheet.
• Amendment to IAS 36, ‘Impairment of assets’ on recoverable amount disclosures (effective for annual
periods on or after 1 January 2014). These amendments address the disclosure of information about the
recoverable amount of impaired assets if that amount is based on fair value less costs of disposal.
• Amendment to IAS 19, ‘Employee benefits’, regarding defined benefit plans (effective for annual
periods on or after 1 July 2014 although endorsed for annual periods on or after 1 February 2015).
These amendments apply to contributions from employees or third parties to defined benefit plans.
The objective of the amendments is to simplify the accounting for contributions that are independent
of the number of years of employee service, for example, employee contributions that are calculated
according to a fixed percentage of salary.
• Annual improvements 2013 (effective annual periods on or after 1 July 2014 although endorsed for
annual periods on or after 1 February 2015). These amendments include changes from the 2011-13 cycle
of the annual improvements project that affect 4 standards.
- IFRS 1, ‘First Time Adoption’.
- IFRS 3, ‘Business Combination’.
- IFRS 13, ‘Fair Value Measurement’.
- IAS 40, ‘Investment Property’.
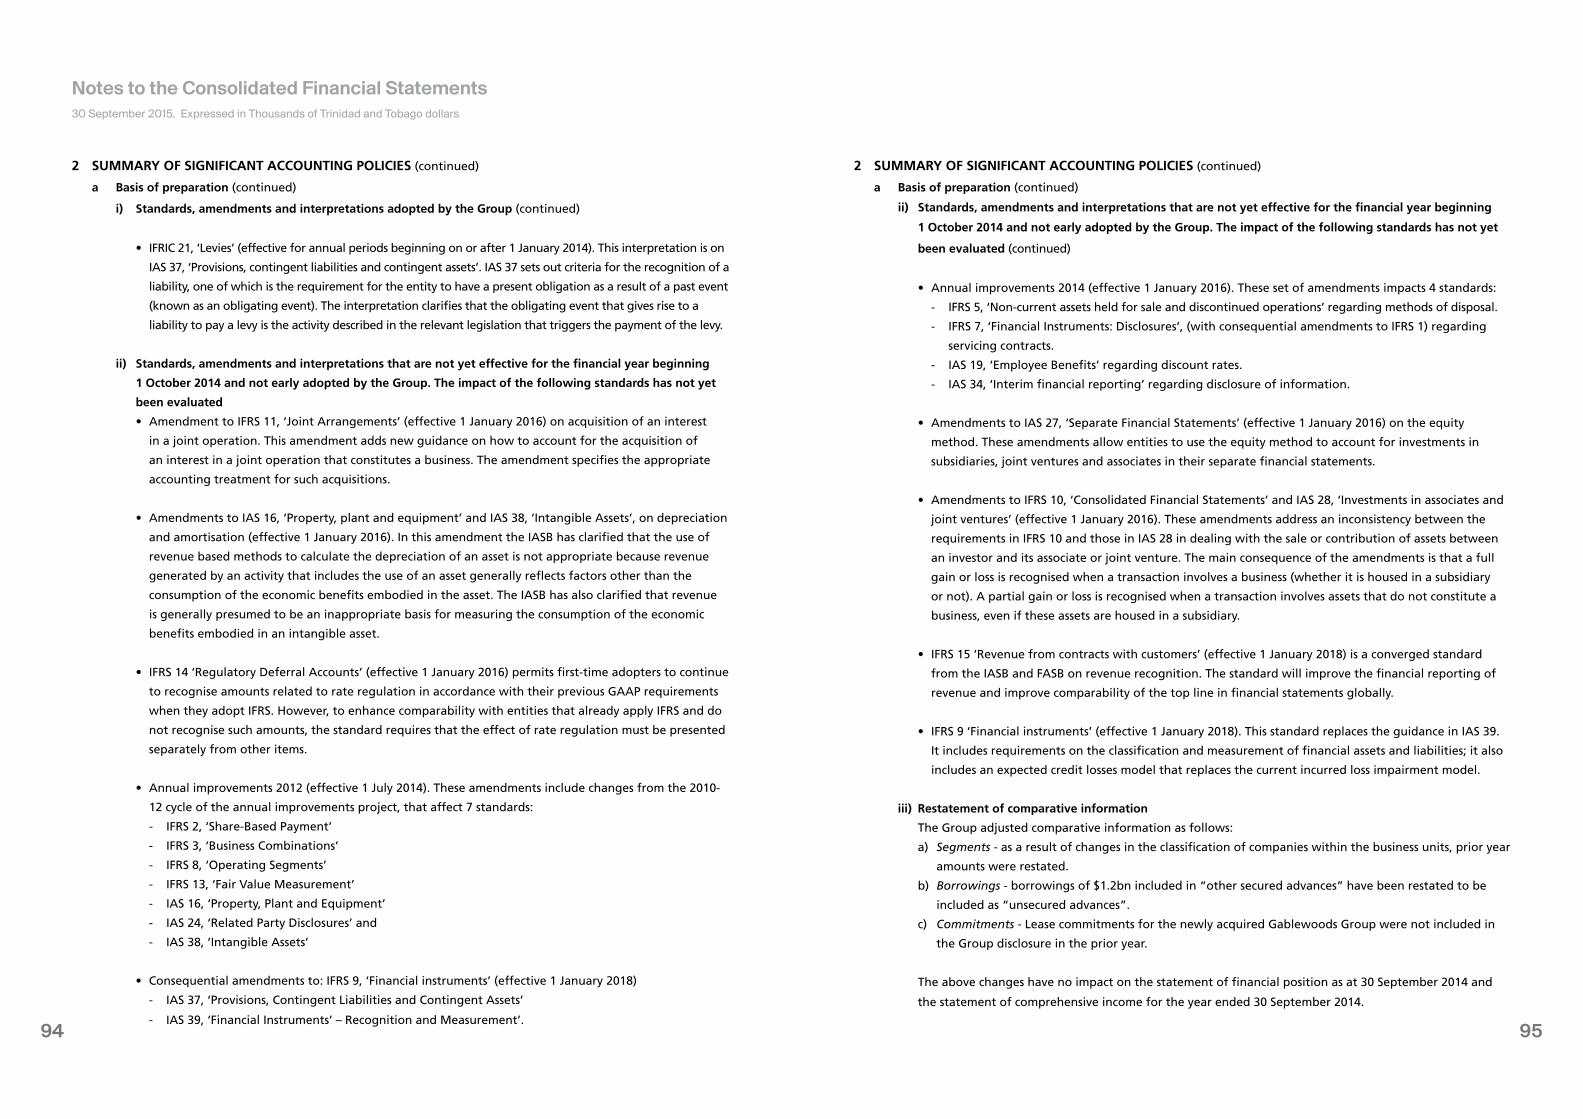
9594
30 September 2015. Expressed in Thousands of Trinidad and Tobago dollars
Notes to the Consolidated Financial Statements
2 SUMMARY OF SIGNIFICANT ACCOUNTING POLICIES (continued)
a Basis of preparation (continued)
i) Standards, amendments and interpretations adopted by the Group (continued)
• IFRIC 21, ‘Levies’ (effective for annual periods beginning on or after 1 January 2014). This interpretation is on
IAS 37, ‘Provisions, contingent liabilities and contingent assets’. IAS 37 sets out criteria for the recognition of a
liability, one of which is the requirement for the entity to have a present obligation as a result of a past event
(known as an obligating event). The interpretation clarifies that the obligating event that gives rise to a
liability to pay a levy is the activity described in the relevant legislation that triggers the payment of the levy.
ii) Standards, amendments and interpretations that are not yet effective for the financial year beginning
1 October 2014 and not early adopted by the Group. The impact of the following standards has not yet
been evaluated
• Amendment to IFRS 11, ‘Joint Arrangements’ (effective 1 January 2016) on acquisition of an interest
in a joint operation. This amendment adds new guidance on how to account for the acquisition of
an interest in a joint operation that constitutes a business. The amendment specifies the appropriate
accounting treatment for such acquisitions.
• Amendments to IAS 16, ‘Property, plant and equipment’ and IAS 38, ‘Intangible Assets’, on depreciation
and amortisation (effective 1 January 2016). In this amendment the IASB has clarified that the use of
revenue based methods to calculate the depreciation of an asset is not appropriate because revenue
generated by an activity that includes the use of an asset generally reflects factors other than the
consumption of the economic benefits embodied in the asset. The IASB has also clarified that revenue
is generally presumed to be an inappropriate basis for measuring the consumption of the economic
benefits embodied in an intangible asset.
• IFRS 14 ‘Regulatory Deferral Accounts’ (effective 1 January 2016) permits first-time adopters to continue
to recognise amounts related to rate regulation in accordance with their previous GAAP requirements
when they adopt IFRS. However, to enhance comparability with entities that already apply IFRS and do
not recognise such amounts, the standard requires that the effect of rate regulation must be presented
separately from other items.
• Annual improvements 2012 (effective 1 July 2014). These amendments include changes from the 2010-
12 cycle of the annual improvements project, that affect 7 standards:
- IFRS 2, ‘Share-Based Payment’
- IFRS 3, ‘Business Combinations’
- IFRS 8, ‘Operating Segments’
- IFRS 13, ‘Fair Value Measurement’
- IAS 16, ‘Property, Plant and Equipment’
- IAS 24, ‘Related Party Disclosures’ and
- IAS 38, ‘Intangible Assets’
• Consequential amendments to: IFRS 9, ‘Financial instruments’ (effective 1 January 2018)
- IAS 37, ‘Provisions, Contingent Liabilities and Contingent Assets’
- IAS 39, ‘Financial Instruments’ – Recognition and Measurement’.
2 SUMMARY OF SIGNIFICANT ACCOUNTING POLICIES (continued)
a Basis of preparation (continued)
ii) Standards, amendments and interpretations that are not yet effective for the financial year beginning
1 October 2014 and not early adopted by the Group. The impact of the following standards has not yet
been evaluated (continued)
• Annual improvements 2014 (effective 1 January 2016). These set of amendments impacts 4 standards:
- IFRS 5, ‘Non-current assets held for sale and discontinued operations’ regarding methods of disposal.
- IFRS 7, ‘Financial Instruments: Disclosures’, (with consequential amendments to IFRS 1) regarding
servicing contracts.
- IAS 19, ‘Employee Benefits’ regarding discount rates.
- IAS 34, ‘Interim financial reporting’ regarding disclosure of information.
• Amendments to IAS 27, ‘Separate Financial Statements’ (effective 1 January 2016) on the equity
method. These amendments allow entities to use the equity method to account for investments in
subsidiaries, joint ventures and associates in their separate financial statements.
• Amendments to IFRS 10, ‘Consolidated Financial Statements’ and IAS 28, ‘Investments in associates and
joint ventures’ (effective 1 January 2016). These amendments address an inconsistency between the
requirements in IFRS 10 and those in IAS 28 in dealing with the sale or contribution of assets between
an investor and its associate or joint venture. The main consequence of the amendments is that a full
gain or loss is recognised when a transaction involves a business (whether it is housed in a subsidiary
or not). A partial gain or loss is recognised when a transaction involves assets that do not constitute a
business, even if these assets are housed in a subsidiary.
• IFRS 15 ‘Revenue from contracts with customers’ (effective 1 January 2018) is a converged standard
from the IASB and FASB on revenue recognition. The standard will improve the financial reporting of
revenue and improve comparability of the top line in financial statements globally.
• IFRS 9 ‘Financial instruments’ (effective 1 January 2018). This standard replaces the guidance in IAS 39.
It includes requirements on the classification and measurement of financial assets and liabilities; it also
includes an expected credit losses model that replaces the current incurred loss impairment model.
iii) Restatement of comparative information
The Group adjusted comparative information as follows:
a) Segments - as a result of changes in the classification of companies within the business units, prior year
amounts were restated.
b) Borrowings - borrowings of $1.2bn included in “other secured advances” have been restated to be
included as “unsecured advances”.
c) Commitments - Lease commitments for the newly acquired Gablewoods Group were not included in
the Group disclosure in the prior year.
The above changes have no impact on the statement of financial position as at 30 September 2014 and
the statement of comprehensive income for the year ended 30 September 2014.
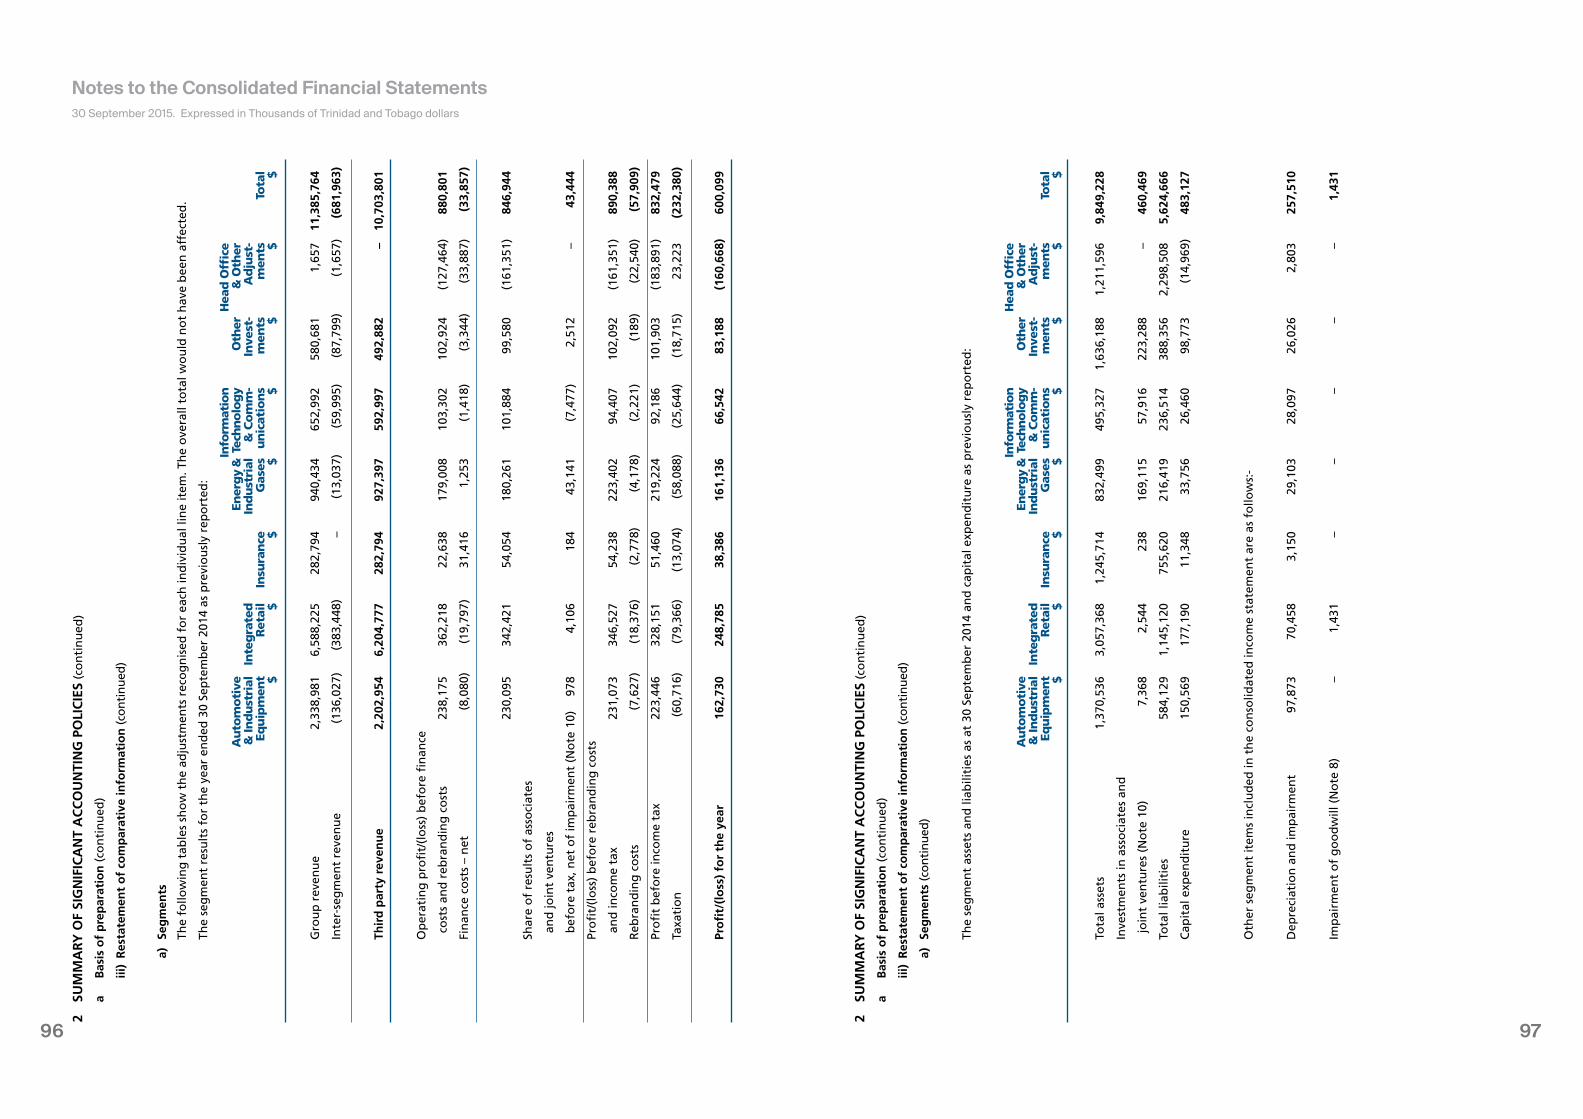
9796
2 SU
MM
ARY
OF
SIG
NIF
ICA
NT
AC
CO
UN
TIN
G P
OLI
CIE
S (c
on
tin
ued
)
a B
asis
of
pre
par
atio
n (
con
tin
ued
)
iii)
Res
tate
men
t o
f co
mp
arat
ive
info
rmat
ion
(co
nti
nu
ed)
a)
Seg
men
ts
The
follo
win
g t
able
s sh
ow
th
e ad
just
men
ts r
eco
gn
ised
fo
r ea
ch in
div
idu
al li
ne
item
. Th
e o
vera
ll to
tal w
ou
ld n
ot
hav
e b
een
aff
ecte
d.
The
seg
men
t re
sult
s fo
r th
e ye
ar e
nd
ed 3
0 Se
pte
mb
er 2
014
as p
revi
ou
sly
rep
ort
ed:
Info
rmat
ion
H
ead
Offi
ce
Au
tom
oti
ve
Ener
gy
& T
ech
no
log
y O
ther
&
Oth
er
& In
du
stri
al
Inte
gra
ted
Ind
ust
rial
&
Co
mm
- In
vest
- A
dju
st-
Eq
uip
men
t R
etai
l In
sura
nce
G
ases
u
nic
atio
ns
men
ts
men
ts
Tota
l
$ $
$ $
$ $
$ $
Gro
up
rev
enu
e 2,
338,
981
6,58
8,22
5 28
2,79
4 94
0,43
4 65
2,99
2 58
0,68
1 1,
657
11,3
85,7
64
Inte
r-se
gm
ent
reve
nu
e
(136
,027
) (3
83,4
48)
– (1
3,03
7)
(59,
995)
(8
7,79
9)
(1,6
57)
(681
,963
)
Thir
d p
arty
rev
enu
e 2,
202,
954
6,20
4,77
7 28
2,79
4 92
7,39
7 59
2,99
7 49
2,88
2 –
10,7
03,8
01
Op
erat
ing
pro
fit/
(lo
ss)
bef
ore
fin
ance
co
sts
and
reb
ran
din
g c
ost
s 23
8,17
5 36
2,21
8 22
,638
17
9,00
8 10
3,30
2 10
2,92
4 (1
27,4
64)
880,
801
Fin
ance
co
sts
– n
et
(8,0
80)
(19,
797)
31
,416
1,
253
(1,4
18)
(3,3
44)
(33,
887)
(3
3,85
7)
23
0,09
5 34
2,42
1 54
,054
18
0,26
1 10
1,88
4 99
,580
(1
61,3
51)
846,
944
Shar
e o
f re
sult
s o
f as
soci
ates
an
d jo
int
ven
ture
s
bef
ore
tax
, net
of
imp
airm
ent
(No
te 1
0)
978
4,10
6 18
4 43
,141
(7
,477
) 2,
512
– 43
,444
Pro
fit/
(lo
ss)
bef
ore
reb
ran
din
g c
ost
s
an
d in
com
e ta
x 23
1,07
3 34
6,52
7 54
,238
22
3,40
2 94
,407
10
2,09
2 (1
61,3
51)
890,
388
Reb
ran
din
g c
ost
s (7
,627
) (1
8,37
6)
(2,7
78)
(4,1
78)
(2,2
21)
(189
) (2
2,54
0)
(57,
909)
Pro
fit
bef
ore
inco
me
tax
223,
446
328,
151
51,4
60
219,
224
92,1
86
101,
903
(183
,891
) 83
2,47
9
Taxa
tio
n
(60,
716)
(7
9,36
6)
(13,
074)
(5
8,08
8)
(25,
644)
(1
8,71
5)
23,2
23
(232
,380
)
Pro
fit/
(lo
ss)
for
the
year
16
2,73
0 24
8,78
5 38
,386
16
1,13
6 66
,542
83
,188
(1
60,6
68)
600,
099
2 SU
MM
ARY
OF
SIG
NIF
ICA
NT
AC
CO
UN
TIN
G P
OLI
CIE
S (c
on
tin
ued
)
a B
asis
of
pre
par
atio
n (
con
tin
ued
)
iii)
Res
tate
men
t o
f co
mp
arat
ive
info
rmat
ion
(co
nti
nu
ed)
a)
Seg
men
ts (
con
tin
ued
)
Th
e se
gm
ent
asse
ts a
nd
liab
iliti
es a
s at
30
Sep
tem
ber
201
4 an
d c
apit
al e
xpen
dit
ure
as
pre
vio
usl
y re
po
rted
:
Info
rmat
ion
H
ead
Offi
ce
Au
tom
oti
ve
Ener
gy
& T
ech
no
log
y O
ther
&
Oth
er
& In
du
stri
al
Inte
gra
ted
Ind
ust
rial
&
Co
mm
- In
vest
- A
dju
st-
Eq
uip
men
t R
etai
l In
sura
nce
G
ases
u
nic
atio
ns
men
ts
men
ts
Tota
l
$ $
$ $
$ $
$ $
Tota
l ass
ets
1,37
0,53
6 3,
057,
368
1,24
5,71
4 83
2,49
9 49
5,32
7 1,
636,
188
1,21
1,59
6 9,
849,
228
Inve
stm
ents
in a
sso
ciat
es a
nd
jo
int
ven
ture
s (N
ote
10)
7,
368
2,54
4 23
8 16
9,11
5 57
,916
22
3,28
8 –
460,
469
Tota
l lia
bili
ties
58
4,12
9 1,
145,
120
755,
620
216,
419
236,
514
388,
356
2,29
8,50
8 5,
624,
666
Cap
ital
exp
end
itu
re
150,
569
177,
190
11,3
48
33,7
56
26,4
60
98,7
73
(14,
969)
48
3,12
7
Oth
er s
egm
ent
item
s in
clu
ded
in t
he
con
solid
ated
inco
me
stat
emen
t ar
e as
fo
llow
s:-
Dep
reci
atio
n a
nd
imp
airm
ent
97,8
73
70,4
58
3,15
0 29
,103
28
,097
26
,026
2,
803
257,
510
Imp
airm
ent
of
go
od
will
(N
ote
8)
– 1,
431
– –
– –
– 1,
431
30 September 2015. Expressed in Thousands of Trinidad and Tobago dollars
Notes to the Consolidated Financial Statements
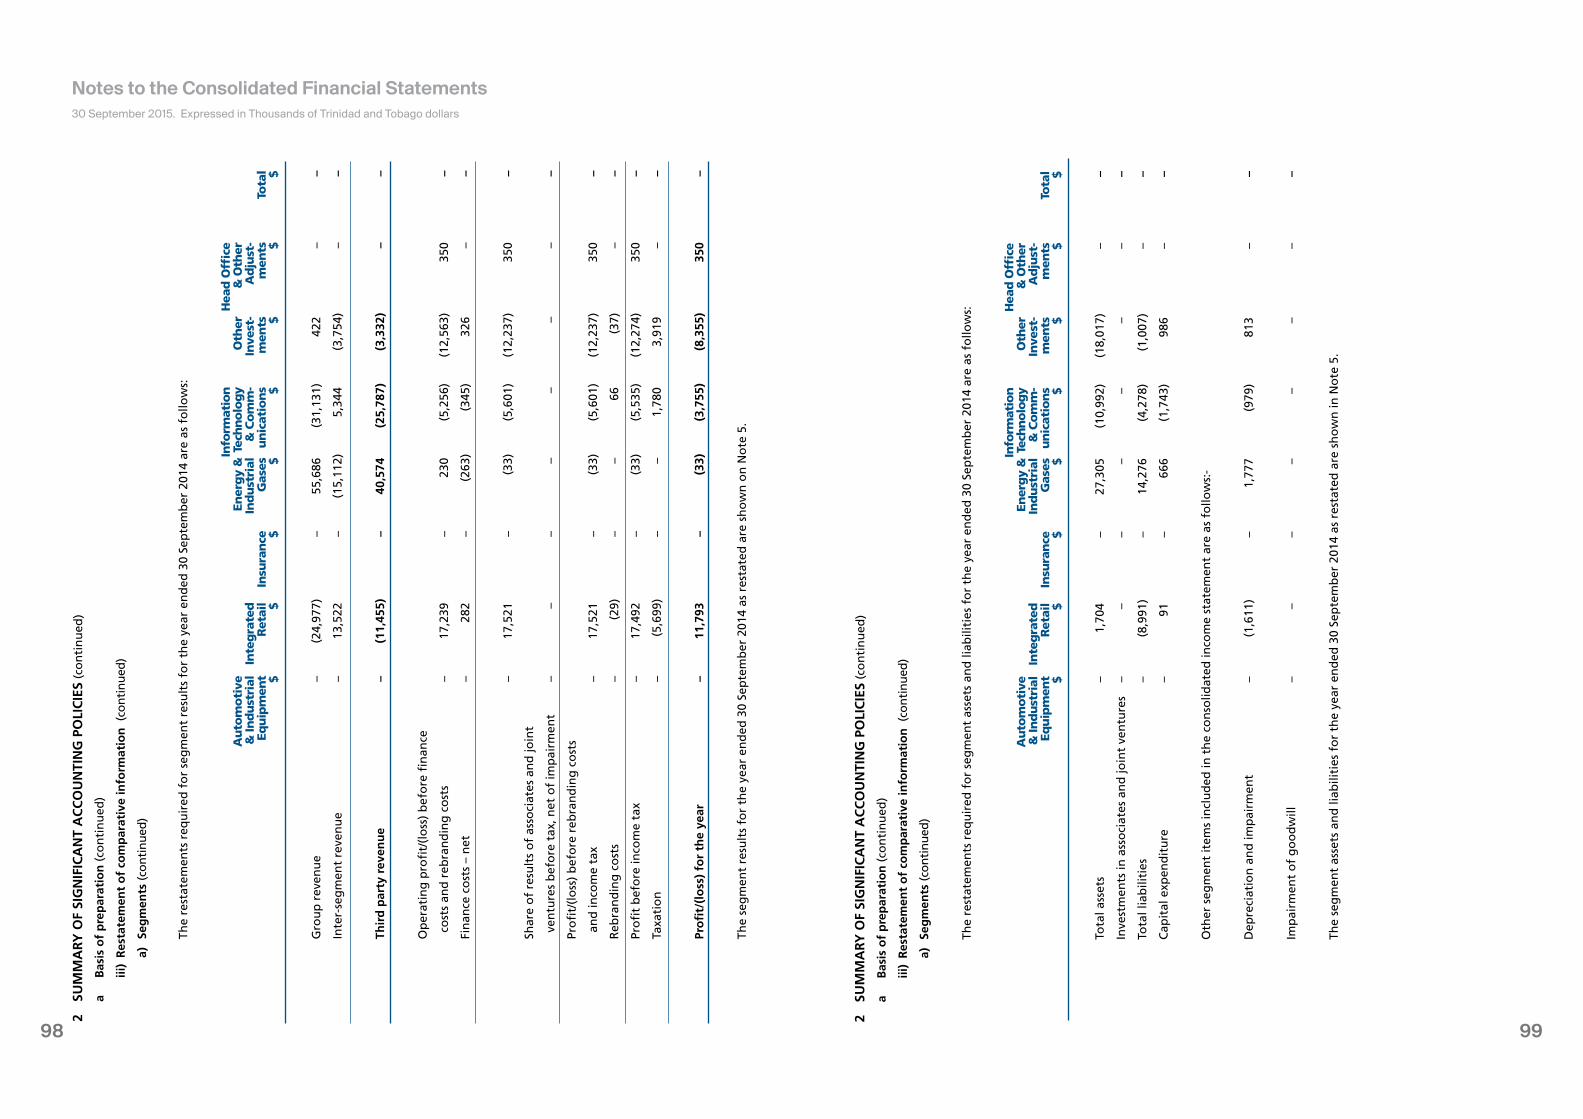
9998
30 September 2015. Expressed in Thousands of Trinidad and Tobago dollars
Notes to the Consolidated Financial Statements2
SUM
MA
RY O
F SI
GN
IFIC
AN
T A
CC
OU
NTI
NG
PO
LIC
IES
(co
nti
nu
ed)
a B
asis
of
pre
par
atio
n (
con
tin
ued
)
iii)
Res
tate
men
t o
f co
mp
arat
ive
info
rmat
ion
(co
nti
nu
ed)
a)
Seg
men
ts (
con
tin
ued
)
Th
e re
stat
emen
ts r
equ
ired
fo
r se
gm
ent
resu
lts
for
the
year
en
ded
30
Sep
tem
ber
201
4 ar
e as
fo
llow
s:
Info
rmat
ion
H
ead
Offi
ce
Au
tom
oti
ve
Ener
gy
& T
ech
no
log
y O
ther
&
Oth
er
& In
du
stri
al
Inte
gra
ted
Ind
ust
rial
&
Co
mm
- In
vest
- A
dju
st-
Eq
uip
men
t R
etai
l In
sura
nce
G
ases
u
nic
atio
ns
men
ts
men
ts
Tota
l
$ $
$ $
$ $
$ $
Gro
up
rev
enu
e –
(24,
977)
–
55,6
86
(31,
131)
42
2 –
–
Inte
r-se
gm
ent
reve
nu
e
– 13
,522
–
(15,
112)
5,
344
(3,7
54)
– –
Thir
d p
arty
rev
enu
e –
(11,
455)
–
40,5
74
(25,
787)
(3
,332
) –
–
Op
erat
ing
pro
fit/
(lo
ss)
bef
ore
fin
ance
co
sts
and
reb
ran
din
g c
ost
s –
17,2
39
– 23
0 (5
,256
) (1
2,56
3)
350
–
Fin
ance
co
sts
– n
et
– 28
2 –
(263
) (3
45)
326
– –
–
17,5
21
– (3
3)
(5,6
01)
(12,
237)
35
0 –
Shar
e o
f re
sult
s o
f as
soci
ates
an
d jo
int
ven
ture
s b
efo
re t
ax, n
et o
f im
pai
rmen
t
– –
– –
– –
– –
Pro
fit/
(lo
ss)
bef
ore
reb
ran
din
g c
ost
s
an
d in
com
e ta
x –
17,5
21
– (3
3)
(5,6
01)
(12,
237)
35
0 –
Reb
ran
din
g c
ost
s –
(29)
–
– 66
(3
7)
– –
Pro
fit
bef
ore
inco
me
tax
– 17
,492
–
(33)
(5
,535
) (1
2,27
4)
350
–
Taxa
tio
n
– (5
,699
) –
– 1,
780
3,91
9 –
–
Pro
fit/
(lo
ss)
for
the
year
–
11,7
93
– (3
3)
(3,7
55)
(8,3
55)
350
–
The
seg
men
t re
sult
s fo
r th
e ye
ar e
nd
ed 3
0 Se
pte
mb
er 2
014
as r
esta
ted
are
sh
ow
n o
n N
ote
5.
2 SU
MM
ARY
OF
SIG
NIF
ICA
NT
AC
CO
UN
TIN
G P
OLI
CIE
S (c
on
tin
ued
)
a B
asis
of
pre
par
atio
n (
con
tin
ued
)
iii)
Res
tate
men
t o
f co
mp
arat
ive
info
rmat
ion
(co
nti
nu
ed)
a)
Seg
men
ts (
con
tin
ued
)
Th
e re
stat
emen
ts r
equ
ired
fo
r se
gm
ent
asse
ts a
nd
liab
iliti
es f
or
the
year
en
ded
30
Sep
tem
ber
201
4 ar
e as
fo
llow
s:
Info
rmat
ion
H
ead
Offi
ce
Au
tom
oti
ve
Ener
gy
& T
ech
no
log
y O
ther
&
Oth
er
& In
du
stri
al
Inte
gra
ted
Ind
ust
rial
&
Co
mm
- In
vest
- A
dju
st-
Eq
uip
men
t R
etai
l In
sura
nce
G
ases
u
nic
atio
ns
men
ts
men
ts
Tota
l
$ $
$ $
$ $
$ $
Tota
l ass
ets
– 1,
704
– 27
,305
(1
0,99
2)
(18,
017)
–
–
Inve
stm
ents
in a
sso
ciat
es a
nd
join
t ve
ntu
res
–
– –
– –
– –
–
Tota
l lia
bili
ties
–
(8,9
91)
– 14
,276
(4
,278
) (1
,007
) –
–
Cap
ital
exp
end
itu
re
– 91
–
666
(1,7
43)
986
– –
Oth
er s
egm
ent
item
s in
clu
ded
in t
he
con
solid
ated
inco
me
stat
emen
t ar
e as
fo
llow
s:-
Dep
reci
atio
n a
nd
imp
airm
ent
– (1
,611
) –
1,77
7 (9
79)
813
– –
Imp
airm
ent
of
go
od
will
–
– –
– –
– –
–
The
seg
men
t as
sets
an
d li
abili
ties
fo
r th
e ye
ar e
nd
ed 3
0 Se
pte
mb
er 2
014
as r
esta
ted
are
sh
ow
n in
No
te 5
.
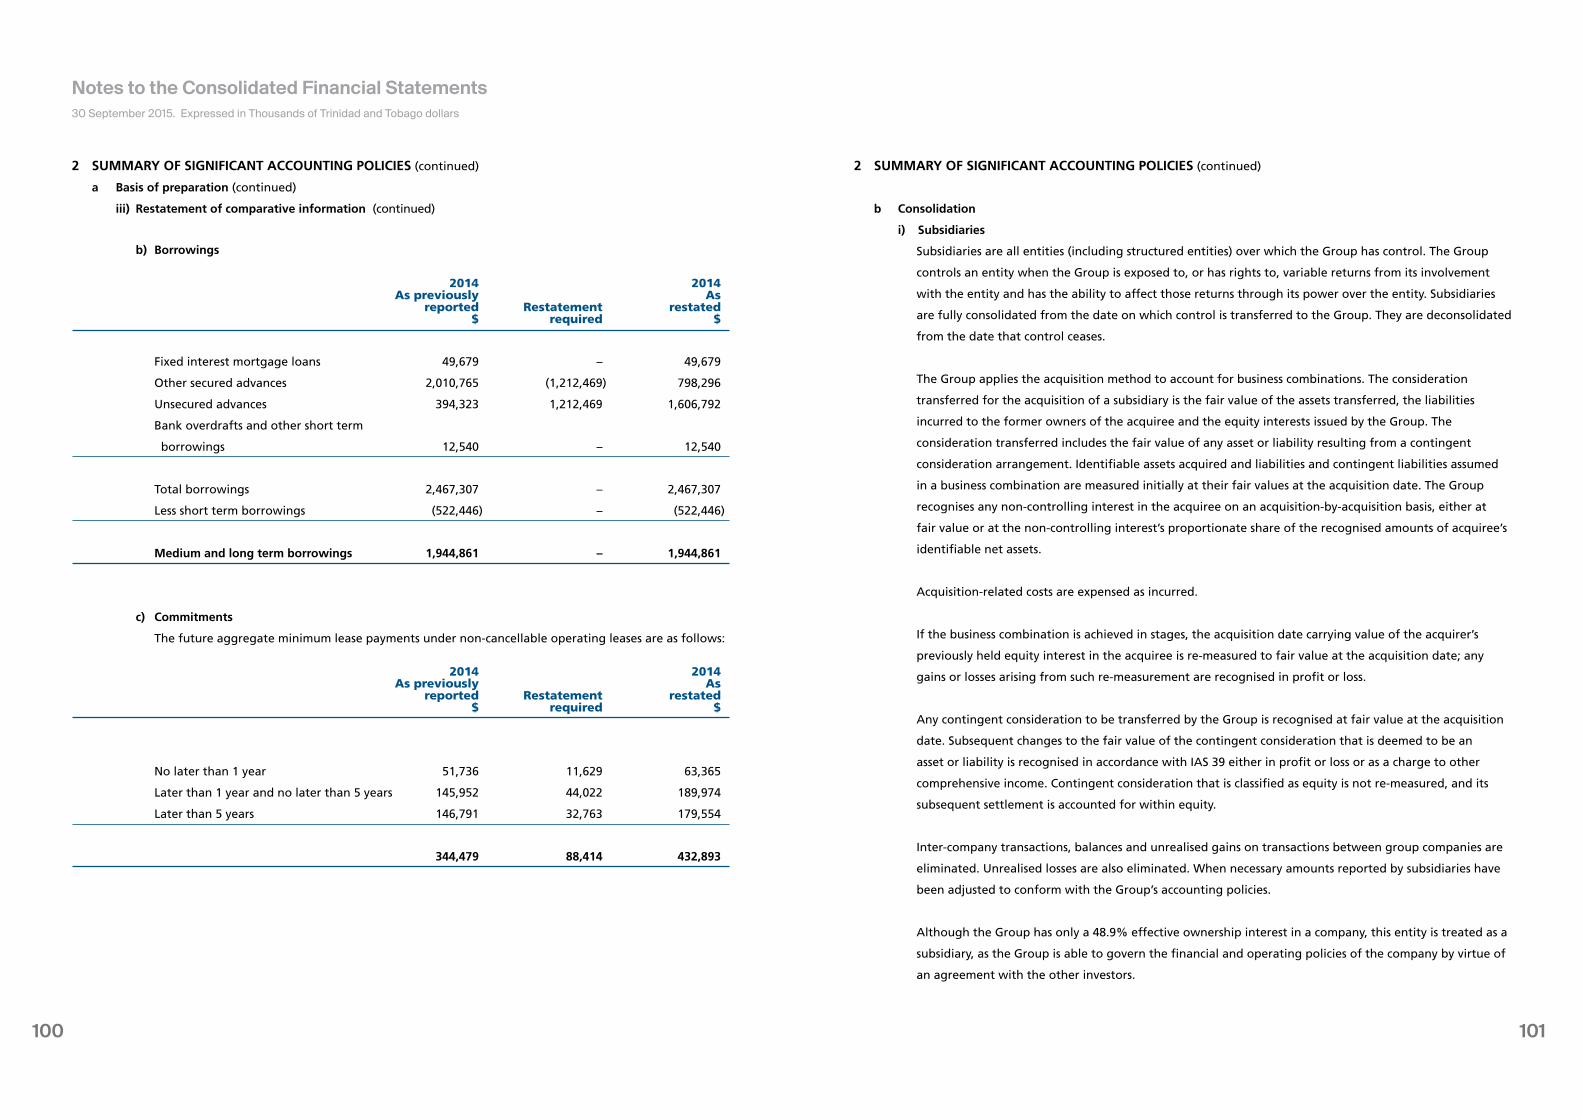
101100
2 SUMMARY OF SIGNIFICANT ACCOUNTING POLICIES (continued)
a Basis of preparation (continued)
iii) Restatement of comparative information (continued)
b) Borrowings
2014 2014 As previously As reported Restatement restated $ required $
Fixed interest mortgage loans 49,679 – 49,679
Other secured advances 2,010,765 (1,212,469) 798,296
Unsecured advances 394,323 1,212,469 1,606,792
Bank overdrafts and other short term
borrowings 12,540 – 12,540
Total borrowings 2,467,307 – 2,467,307
Less short term borrowings (522,446) – (522,446)
Medium and long term borrowings 1,944,861 – 1,944,861
c) Commitments
The future aggregate minimum lease payments under non-cancellable operating leases are as follows:
2014 2014 As previously As reported Restatement restated $ required $
No later than 1 year 51,736 11,629 63,365
Later than 1 year and no later than 5 years 145,952 44,022 189,974
Later than 5 years 146,791 32,763 179,554
344,479 88,414 432,893
2 SUMMARY OF SIGNIFICANT ACCOUNTING POLICIES (continued)
b Consolidation
i) Subsidiaries
Subsidiaries are all entities (including structured entities) over which the Group has control. The Group
controls an entity when the Group is exposed to, or has rights to, variable returns from its involvement
with the entity and has the ability to affect those returns through its power over the entity. Subsidiaries
are fully consolidated from the date on which control is transferred to the Group. They are deconsolidated
from the date that control ceases.
The Group applies the acquisition method to account for business combinations. The consideration
transferred for the acquisition of a subsidiary is the fair value of the assets transferred, the liabilities
incurred to the former owners of the acquiree and the equity interests issued by the Group. The
consideration transferred includes the fair value of any asset or liability resulting from a contingent
consideration arrangement. Identifiable assets acquired and liabilities and contingent liabilities assumed
in a business combination are measured initially at their fair values at the acquisition date. The Group
recognises any non-controlling interest in the acquiree on an acquisition-by-acquisition basis, either at
fair value or at the non-controlling interest’s proportionate share of the recognised amounts of acquiree’s
identifiable net assets.
Acquisition-related costs are expensed as incurred.
If the business combination is achieved in stages, the acquisition date carrying value of the acquirer’s
previously held equity interest in the acquiree is re-measured to fair value at the acquisition date; any
gains or losses arising from such re-measurement are recognised in profit or loss.
Any contingent consideration to be transferred by the Group is recognised at fair value at the acquisition
date. Subsequent changes to the fair value of the contingent consideration that is deemed to be an
asset or liability is recognised in accordance with IAS 39 either in profit or loss or as a charge to other
comprehensive income. Contingent consideration that is classified as equity is not re-measured, and its
subsequent settlement is accounted for within equity.
Inter-company transactions, balances and unrealised gains on transactions between group companies are
eliminated. Unrealised losses are also eliminated. When necessary amounts reported by subsidiaries have
been adjusted to conform with the Group’s accounting policies.
Although the Group has only a 48.9% effective ownership interest in a company, this entity is treated as a
subsidiary, as the Group is able to govern the financial and operating policies of the company by virtue of
an agreement with the other investors.
30 September 2015. Expressed in Thousands of Trinidad and Tobago dollars
Notes to the Consolidated Financial Statements
103102
2 SUMMARY OF SIGNIFICANT ACCOUNTING POLICIES (continued)
b Consolidation (continued)
ii) Transactions with non-controlling interests
The Group treats transactions with non-controlling interests as transactions with equity owners of the
Group. For purchases from non-controlling interests, the difference between any consideration paid and
the relevant share acquired of the carrying value of net assets of the subsidiary is recorded in equity. Gains
or losses on disposals to non-controlling interests are also recorded in equity.
When the Group ceases to have control or significant influence, any retained interest in the entity is
remeasured to its fair value, with the change in carrying amount recognised in profit or loss. The fair
value is the initial carrying amount for the purposes of subsequently accounting for the retained interest
as an associate, joint venture or financial asset. In addition, any amounts previously recognised in other
comprehensive income in respect of that entity are accounted for as if the Group had directly disposed of
the related assets or liabilities. This may mean that amounts previously recognised in other comprehensive
income are reclassified to profit or loss.
If the ownership interest in an associate is reduced but significant influence is retained, only a
proportionate share of the amounts previously recognised in other comprehensive income are reclassified
to profit or loss where appropriate.
iii) Associates and Joint ventures
Associates are all entities over which the Group has significant influence but not control, generally
accompanying a shareholding of between 20% and 50% of the voting rights.
Investments in associates are accounted for using the equity method of accounting and are initially
recognised at cost. The Group’s investment in associates includes goodwill (net of any accumulated
impairment loss) identified on acquisition.
The Group’s share of its associates’ post acquisition profits or losses is recognised in the consolidated
income statement, and its share of post-acquisition movements in reserves is recognised in reserves. The
cumulative post-acquisition movements are adjusted against the carrying amount of the investment.
When the Group’s share of losses in an associate equals or exceeds its interest in the associate, including
any other unsecured receivables, the Group does not recognise further losses, unless it has incurred
obligations or made payments on behalf of the associate. Joint ventures are also accounted for using the
equity method. The Group discontinues the use of the equity method from the date on which it ceases to
have joint control over, or have significant influence in, a jointly controlled entity.
Unrealised gains on transactions between the Group and its associates and joint ventures are eliminated
to the extent of the Group’s interest in the associates. Unrealised losses are also eliminated unless the
transaction provides evidence of an impairment of the asset transferred.
2 SUMMARY OF SIGNIFICANT ACCOUNTING POLICIES (continued)
b Consolidation (continued)
iii) Associates and Joint ventures (continued)
Accounting policies of associates and joint ventures have been changed where necessary to ensure
consistency with the policies adopted by the Group.
Dilution gains and losses arising in investments in associates are recognised in the consolidated income
statement.
c Segment reporting
Operating segments are reported in a manner consistent with the internal reporting provided to the chief
operating decision-maker. The chief operating decision-maker, who is responsible for allocating resources
and assessing performance of the operating segments, has been identified as the Chief Executive Officer who
makes strategic decisions.
d Foreign currency translation
i) Functional and presentation currency
Items included in the financial statements of each of the Group’s entities are measured using the currency
of the primary economic environment in which the entity operates (‘the functional currency’). The
consolidated financial statements are presented in Trinidad and Tobago dollars, which is the Group’s
presentation currency.
ii) Transactions and balances
Foreign currency transactions are translated into the functional currency using the exchange rates
prevailing at the dates of the transactions. Foreign exchange gains and losses resulting from the
settlement of such transactions and from the translation at year-end exchange rates of monetary assets
and liabilities denominated in foreign currencies are recognised in the consolidated statement of
comprehensive income.
Translation differences on non-monetary financial assets and liabilities, such as equities held at fair value
through profit or loss are recognised as part of the fair value gain or loss.
Translation differences on non-monetary items such as equities classified as available-for-sale financial
assets are included in other reserves in equity.
Translation differences on debt securities and other monetary financial assets measured at fair value are
included in foreign exchange gains and losses.
30 September 2015. Expressed in Thousands of Trinidad and Tobago dollars
Notes to the Consolidated Financial Statements
105104
2 SUMMARY OF SIGNIFICANT ACCOUNTING POLICIES (continued)
d Foreign currency translation (continued)
iii) Group companies
The results and financial position of all the Group entities (none of which has the currency of a
hyperinflationary economy) that have a functional currency different from the presentation currency are
translated into the presentation currency as follows:
a) assets and liabilities for each statement of financial position presented are translated at the closing
rate at the date of that statement of financial position;
b) income and expenses for each income statement are translated at average exchange rates (unless
this average is not a reasonable approximation of the cumulative effect of the rates prevailing on the
transaction dates, in which case income and expenses are translated at the dates of the transactions);
and
c) all resulting exchange differences are recognised in the consolidated statement of comprehensive
income.
On consolidation, exchange differences arising from the translation of the net investment in foreign
operations, and of borrowings and other currency instruments designated as hedges of such investments,
are taken to the consolidated statement of changes in equity. When a foreign operation is sold, exchange
differences that were recorded in equity are recognised in the consolidated income statement as part of
the gain or loss on sale.
Goodwill and fair value adjustments arising on the acquisition of a foreign entity are included in assets
and liabilities of the foreign entity and translated at the closing rate.
e Property, plant and equipment
Property, plant and equipment including land and buildings are stated at historical cost less depreciation.
Historical cost includes expenditure that is directly attributable to the acquisition of the items.
Subsequent costs are included in the asset’s carrying amount or recognised as a separate asset, as appropriate,
only when it is probable that future economic benefits associated with the item will flow to the Group and
the cost of the item can be measured reliably. The carrying amount of the replaced part is de-recognised. All
other repairs and maintenance are charged to the consolidated income statement during the financial period
in which they are incurred.
Interest costs on borrowings to finance the construction of property, plant and equipment are capitalised
during the period of time that is required to complete and prepare the asset for its intended use. Other
borrowing costs are expensed.
Land is not depreciated.
2 SUMMARY OF SIGNIFICANT ACCOUNTING POLICIES (continued)
e Property, plant and equipment (continued)
Depreciation is provided on the straight-line basis at rates estimated to write-off the cost of each asset
over its expected useful life. In the case of motor vehicles, depreciation is based on cost less an estimated
residual value. The estimated useful lives of assets are reviewed periodically, taking account of commercial
and technological obsolescence as well as normal wear and tear, and depreciation rates are adjusted if
appropriate.
Current rates of depreciation are:
Freehold property - 2%
Leasehold property and improvements - 2% to 20%
Plant and equipment - 5% to 33.3%
Rental assets - 25%
Furniture and fixtures - 10% to 25%
Motor vehicles - 10% to 25%
The assets’ residual values and useful lives are reviewed, and adjusted if appropriate, at each statement of
financial position date.
An asset’s carrying amount is written down immediately to its recoverable amount if the asset’s carrying
amount is greater than its estimated recoverable amount.
Gains and losses on disposals are determined by comparing the proceeds with the carrying amount and are
included in the consolidated income statement.
f Investment properties
Investment and development properties are owned or leased by the Group and held for long-term rental
income and capital appreciation and exclude properties occupied by the Group.
Investment properties are stated at amortised cost, less impairment. Transaction costs are included on
initial measurement. The fair values of investment properties are disclosed in Note 7. These are assessed
using internationally accepted valuation methods, such as taking comparable properties as a guide to
current market prices or by applying the discounted cash flow method. Like property, plant and equipment,
investment properties are depreciated using the straight-line method.
The current rate of depreciation is 2%.
30 September 2015. Expressed in Thousands of Trinidad and Tobago dollars
Notes to the Consolidated Financial Statements
107106
2 SUMMARY OF SIGNIFICANT ACCOUNTING POLICIES (continued)
f Investment properties (continued)
Investment properties cease recognition as investment property either when they have been disposed of
or when they are permanently withdrawn from use and no future economic benefit is expected from their
disposal. Gains or losses arising from the retirement or disposal of investment property are determined as the
difference between the net disposal proceeds and the carrying amount of the asset and are recognised in the
consolidated income statement in the period of the retirement or disposal.
g Intangible assets
i) Goodwill
Goodwill represents the excess of the cost of an acquisition over the fair value of the Group’s share of the
net identifiable assets of the acquired subsidiary/associate at the date of acquisition. Goodwill represents
the goodwill acquired on acquisition of subsidiaries. Goodwill on acquisition of associates is included in
‘Investments in Associates’. Separately recognised goodwill is tested annually for impairment and carried
at cost less accumulated impairment losses. Impairment losses on goodwill are not reversed. Gains and
losses on the disposal of an entity include the carrying amount of goodwill relating to the entity sold.
Goodwill is allocated to cash-generating units for the purpose of impairment testing. The allocation is
made to those cash-generating units or groups of cash-generating units that are expected to benefit from
the business combination in which the goodwill arose. Massy Holdings Ltd. allocates goodwill to each
business segment in each country in which it operates (Note 8).
ii) Computer software
Costs associated with the maintenance of existing computer software programmes are expensed as
incurred. Development costs that are directly attributable to the design and testing of identifiable and
unique software products controlled by the Group are recognised as intangible assets when the following
criteria are met:
• it is technically feasible to complete the software product so that it will be available for use;
• management intends to complete the software product and use or sell it;
• there is an ability to use or sell the software product;
• it can be demonstrated how the software product will generate probable future economic benefits;
• adequate technical, financial and other resources to complete the development and to use or sell the
software product are available; and
• the expenditure attributable to the software product during its development can be reliably measured.
Directly attributable costs that are capitalised as part of the software product include the software
development employee costs and an appropriate portion of relevant overheads.
2 SUMMARY OF SIGNIFICANT ACCOUNTING POLICIES (continued)
g Intangible assets (continued)
ii) Computer software (continued)
Other development expenditures that do not meet these criteria are recognised as an expense as incurred.
Development costs previously recognised as an expense are not recognised as an asset in a subsequent
period.
Computer software development costs recognised as assets are amortised over their estimated useful lives,
which do not exceed three years.
iii) Brands
Brands acquired in a business combination are recognised at fair value at the acquisition date, and are
amortised over seven to twenty years.
h Impairment of non-financial assets
Assets that have an indefinite useful life are not subject to amortisation and are tested annually for
impairment. Assets that are subject to amortisation are reviewed for impairment whenever events or changes
in circumstances indicate that the carrying amount may not be recoverable. An impairment loss is recognised
for the amount by which the asset’s carrying amount exceeds its recoverable amount. The recoverable
amount is the higher of an asset’s fair value less costs to sell and value in use. For the purposes of assessing
impairment, assets are grouped at the lowest levels for which there are separately identifiable cash flows
(cash-generating units). Non-financial assets other than goodwill that suffered an impairment are reviewed
for possible reversal of the impairment at each reporting date.
i Financial assets
Classification
The Group classifies its financial assets in the following categories: financial assets at fair value through
profit or loss, loans and receivables, held-to-maturity and available-for-sale. The classification depends on
the purpose for which the financial assets were acquired. Management determines the classification of its
financial assets at initial recognition.
i) Financial assets at fair value through profit or loss
This category has two sub-categories: financial assets held for trading, and those designated at fair value
through profit or loss at inception. A financial asset is classified in this category if acquired principally
for the purpose of selling in the short term or if so designated by management. Derivatives are also
categorised as held for trading unless they are designated as hedges. Assets in this category are classified
as current assets if they are either held for trading or are expected to be realised within 12 months of the
statement of financial position date.
30 September 2015. Expressed in Thousands of Trinidad and Tobago dollars
Notes to the Consolidated Financial Statements
109108
2 SUMMARY OF SIGNIFICANT ACCOUNTING POLICIES (continued)
i Financial assets (continued)
Classification (continued)
ii) Loans and receivables
Loans and receivables are non-derivative financial assets with fixed or determinable payments that are
not quoted in an active market. They are included in current assets, except for maturities greater than 12
months after the statement of financial position date. These are classified as non-current assets. Loans and
receivables are classified as ‘trade and other receivables’ and ‘instalment credit and other loans’ in the
consolidated statement of financial position.
Instalment credit and other loans are stated at principal outstanding net of unearned finance charges and
specific allowance for loan losses.
Interest from instalment credit is recognised as it accrues on the reducing balance amount at the annual
percentage rate. Interest earned on other forms of financing is calculated as is appropriate to individual
transactions.
iii) Held-to-maturity financial assets
Held-to-maturity financial assets are non-derivative financial assets with fixed or determinable payments
and fixed maturities that the Group’s management has the positive intention and ability to hold to
maturity. Held-to-maturity financial assets are included in non-current assets.
iv) Available-for-sale financial assets
Available-for-sale financial assets are non-derivatives that are either designated in this category or not
classified in any of the other categories. They are included in non-current assets unless management
intends to dispose of the investment within 12 months of the statement of financial position date.
j Recognition and measurement
Regular purchases and sales of financial assets are recognised on the trade-date, the date on which the
Group commits to purchase or sell the asset. Investments are initially recognised at fair value plus transaction
costs for all financial assets not carried at fair value through profit or loss. Financial assets carried at fair
value through profit or loss are initially recognised at fair value and transaction costs are expensed in the
consolidated income statement.
Available-for-sale financial assets and financial assets at fair value through profit or loss are subsequently
carried at fair value. Unlisted equity securities for which fair values cannot be reliably measured have been
recognised at cost less impairment. Loans and receivables and held-to-maturity investments are carried at
amortised cost using the effective interest method.
2 SUMMARY OF SIGNIFICANT ACCOUNTING POLICIES (continued)
j Recognition and measurement (continued)
Financial assets are de-recognised when the rights to receive cash flows from the investments have expired or
have been transferred and the Group has transferred substantially all risks and rewards of ownership.
Gains or losses arising from changes in the fair value of the ‘financial assets at fair value through profit or
loss’ category are presented in the income statement within ‘other (losses)/gains – net’ in the period in which
they arise. Dividend income from financial assets at fair value through profit or loss is recognised in the
income statement as part of other income when the Group’s right to receive payments is established.
Changes in the fair value of monetary and non-monetary securities classified as available for sale are
recognised in other comprehensive income.
When securities classified as available-for-sale are sold or impaired, the accumulated fair value adjustments
recognised in equity are included in the consolidated income statement as ‘gains and losses from investment
securities’. Interest on available-for-sale securities calculated using the effective interest method is recognised
in the consolidated income statement. Dividends on available-for-sale equity instruments are recognised in
the consolidated income statement when the Group’s right to receive payments is established.
k Impairment of financial assets
i) Assets carried at amortised cost
The Group assesses at the end of each reporting period whether there is objective evidence that a
financial asset or group of financial assets is impaired. A financial asset or a group of financial assets is
impaired and impairment losses are incurred only if there is objective evidence of impairment, as a result
of one or more events that occurred after the initial recognition of the asset (a ‘loss event’), and that
loss event (or events) has an impact on the estimated future cash flows of the financial asset or group of
financial assets that can be estimated reliably.
The criteria that the Group uses to determine that there is objective evidence of an impairment loss
include:
• significant financial difficulty of the issuer or obligor;
• a breach of contract, such as a default or delinquency in interest or principal payments;
• the Group, for economic or legal reasons relating to the borrower’s financial difficulty, granting to the
borrower a concession that the lender would not otherwise consider;
• it becomes probable that the borrower will enter bankruptcy or other financial reorganisation;
• the disappearance of an active market for that financial asset because of financial difficulties; or
• observable data indicating that there is a measurable decrease in the estimated future cash flows from
a portfolio of financial assets since the initial recognition of those assets, although the decrease cannot
yet be identified with the individual financial assets in the portfolio, including:
30 September 2015. Expressed in Thousands of Trinidad and Tobago dollars
Notes to the Consolidated Financial Statements
111110
2 SUMMARY OF SIGNIFICANT ACCOUNTING POLICIES (continued)
k Impairment of financial assets (continued)
i) Assets carried at amortised cost (continued)
a) adverse changes in the payment status of borrowers in the portfolio; and
b) national or local economic conditions that correlate with defaults on the assets in the portfolio.
The Group first assesses whether objective evidence of impairment exists.
For the loans and receivables category, the amount of the loss is measured as the difference between
the asset’s carrying amount and the present value of estimated future cash flows (excluding future credit
losses that have not been incurred) discounted at the financial asset’s original effective interest rate. The
carrying amount of the asset is reduced and the amount of the loss is recognised in the consolidated
income statement. If a loan or held-to-maturity investment has a variable interest rate, the discount rate
for measuring any impairment loss is the current effective interest rate determined under the contract.
The Group may measure impairment on the basis of an instrument’s fair value using an observable market
price.
If, in a subsequent period, the amount of the impairment loss decreases and the decrease can be related
objectively to an event occurring after the impairment was recognised (such as an improvement in the
debtor’s credit rating), the reversal of the previously recognised impairment loss is recognised in the
consolidated income statement.
ii) Assets classified as available-for-sale
The Group assesses at the end of each reporting period whether there is objective evidence that a
financial asset or a group of financial assets is impaired. For debt securities, the Group uses the criteria
referred to above. In the case of equity investments classified as available-for-sale, a significant or
prolonged decline in the fair value of the security below its cost is also evidence that the assets are
impaired. If any such evidence exists for available-for-sale financial assets, the cumulative loss – measured
as the difference between the acquisition cost and the current fair value, less any impairment loss on
that financial asset previously recognised in profit or loss – is removed from equity and recognised in
the consolidated income statement. Impairment losses recognised in the consolidated income statement
on equity instruments are not reversed through the consolidated income statement. If, in a subsequent
period, the fair value of a debt instrument classified as available for sale increases and the increase can
be objectively related to an event occurring after the impairment loss was recognised in profit or loss, the
impairment loss is reversed through the consolidated income statement.
l Derivative financial instruments
Derivatives are initially recognised at fair value on the date a derivative contract is entered into and are
subsequently re-measured at their fair value. The method of recognising the resulting gain or loss depends on
whether the derivative is designated as a hedging instrument, and if so, the nature of the item being hedged.
2 SUMMARY OF SIGNIFICANT ACCOUNTING POLICIES (continued)
m Inventories
Inventories are stated at the lower of cost or net realisable value. Cost is determined using the weighted
average cost method. The cost of finished goods and work in progress comprise raw materials, direct labour,
other direct costs and related production overheads, but excludes interest expense. Net realisable value is
the estimate of the selling price in the ordinary course of business, less the costs of completion and selling
expenses.
n Trade receivables
Trade receivables are recognised initially at fair value and subsequently measured at amortised cost using the
effective interest method, less provision for impairment.
Trade receivables are amounts due from customers for merchandise sold or services performed in the ordinary
course of business. If collection is expected in one year or less (or in the normal operating cycle of the
business if longer), they are classified as current assets. If not, they are presented as non-current assets.
o Cash and cash equivalents
In the consolidated statement of cash flows, cash and cash equivalents include cash in hand, deposits held at
call with banks, other short-term highly liquid investments with original maturities of three months or less
and bank overdrafts. In the consolidated statement of financial position, bank overdrafts are shown within
borrowings in current liabilities.
p Share capital
Ordinary shares with discretionary dividends are classified as equity.
Incremental costs directly attributable to the issue of new shares or options are shown in equity as a
deduction, net of tax, from the proceeds.
Where any Group company purchases the company’s equity share capital (treasury shares), the consideration
paid, including any directly attributable incremental costs (net of income taxes) is deducted from equity
attributable to the company’s equity holders until the shares are cancelled or reissued. Where such ordinary
shares are subsequently reissued, any consideration received, net of any directly attributable incremental
transaction costs and the related income tax effects, is included in equity attributable to the company’s equity
holders.
q Trade payables
Trade payables are obligations to pay for goods or services that have been acquired in the ordinary course of
business from suppliers. Accounts payable are classified as current liabilities if payment is due within one year
or less (or in the normal operating cycle of the business if longer). If not, they are presented as non-current
liabilities.
30 September 2015. Expressed in Thousands of Trinidad and Tobago dollars
Notes to the Consolidated Financial Statements
113112
2 SUMMARY OF SIGNIFICANT ACCOUNTING POLICIES (continued)
q Trade payables (continued)
Trade payables are recognised initially at fair value and subsequently measured at amortised cost using the
effective interest method.
r Insurance
i) Insurance and reinsurance contracts
Insurance and reinsurance contracts are defined as those containing significant insurance risk at the
inception of the contract, or those where at the inception of the contract there is a scenario with
commercial substance where the level of insurance risk may be significant.
The significance of insurance risk is dependent on both the probability of an insured event and the
magnitude of its potential effect. Once a contract has been classified as an insurance contract, it remains
an insurance contract for the remainder of its lifetime, even if the insurance risk reduces significantly
during the period.
In the normal course of business, the Group seeks to reduce the losses to which it is exposed that may
cause unfavourable underwriting results by re-insuring a certain level of risk with reinsurance companies.
Reinsurance premiums are accounted for on a basis consistent with that used in accounting for the
original policies issued and the terms of the reinsurance contracts.
Reinsurance contracts ceded do not relieve the Group from its obligations to policyholders. The Group
remains liable to its policyholders for the portion re-insured, to the extent that the reinsurers do not meet
the obligations assumed under the reinsurance agreements.
ii) Amounts receivable from reinsurance companies
Included in accounts receivable on the statement of financial position, are amounts receivable from
reinsurance companies, which consist primarily of amounts due in respect of ceded insurance liabilities.
Recoverable amounts are estimated in a manner consistent with the outstanding claims reserve or settled
claims associated with the re-insured policies and in accordance with the relevant reinsurance contract.
If amounts receivable from reinsurance companies are impaired, the Group reduces the carrying amount
accordingly and recognises an impairment loss in the consolidated income statement. A reinsurance asset
is impaired if there is objective evidence that the Group may not receive all, or part, of the amounts due
to it under the terms of the reinsurance contract.
2 SUMMARY OF SIGNIFICANT ACCOUNTING POLICIES (continued)
s Borrowings
Borrowings are recognised initially at fair value, net of transaction costs incurred. Borrowings are
subsequently stated at amortised cost; any difference between the proceeds (net of transaction costs) and
the redemption value is recognised in the consolidated income statement over the period of the borrowings
using the effective interest method.
Borrowings are classified as current liabilities unless the Group has an unconditional right to defer settlement
of the liability for at least 12 months after the statement of financial position date.
t Current and deferred income tax
The tax expense for the period comprises current and deferred tax. Tax is recognised in the consolidated income
statement, except to the extent that it relates to items recognised in other comprehensive income or directly in
equity. In this case, the tax is also recognised in other comprehensive income or directly in equity, respectively.
The current income tax charge is calculated on the basis of the tax laws enacted or substantively enacted
at the statement of financial position date in the countries where the Group’s subsidiaries, associates and
joint ventures operate and generate taxable income. Management periodically evaluates positions taken in
tax returns with respect to situations in which applicable tax regulations are subject to interpretation and
establishes provisions where appropriate on the basis of amounts expected to be paid to the tax authorities.
Deferred income tax is provided in full, using the liability method, on temporary differences arising between
the tax bases of assets and liabilities and their carrying amounts in the consolidated financial statements.
However, the deferred income tax is not accounted for if it arises from initial recognition of an asset or
liability in a transaction other than a business combination that at the time of the transaction affects neither
accounting nor taxable profit or loss. Deferred income tax is determined using tax rates (and laws) that have
been enacted or substantially enacted by the statement of financial position date and are expected to apply
when the related deferred income tax asset is realised or the deferred income tax liability is settled.
Deferred income tax assets are recognised only to the extent that it is probable that future taxable profit will
be available against which the temporary differences can be utilised.
Deferred income tax is provided on temporary differences arising on investments in subsidiaries and associates
and joint ventures, except where the timing of the reversal of the temporary difference is controlled by the
Group and it is probable that the temporary difference will not reverse in the foreseeable future.
Deferred income tax assets and liabilities are offset when there is a legally enforceable right to offset current
tax assets against current tax liabilities and when the deferred income tax assets and liabilities relate to
income taxes levied by the same taxation authority on either the same taxable entity or different taxable
entities where there is an intention to settle the balances on a net basis.
30 September 2015. Expressed in Thousands of Trinidad and Tobago dollars
Notes to the Consolidated Financial Statements
115114
2 SUMMARY OF SIGNIFICANT ACCOUNTING POLICIES (continued)
t Current and deferred income tax (continued)
The principal temporary differences arise from depreciation on property, plant and equipment, retirement
benefits and tax losses carried forward. Deferred tax assets relating to the carrying forward of unused tax
losses are recognised to the extent that it is probable that future taxable profit will be earned against which
the unused tax losses can be utilised.
u Employee benefits
i) Pension obligations
Group companies operate various pension plans. The majority of the Trinidad and Tobago resident
employees are members of either the Neal & Massy Group Pension Fund Plan, the Retirement Income
Security Plan or the T. Geddes Grant Limited Pension Fund Plan.
The Neal & Massy Group Pension Fund Plan, contributions to which were frozen on 31 January,1990, is a
defined contribution plan whose assets are held separately from those of the Group in an independently
administered fund. The most recent actuarial valuation, at 31 March, 2014, revealed that the plan is
adequately funded. There are certain benefits payable by the Neal & Massy Group Pension Fund Plan
which fall within the scope of IAS 19 (revised) – Employee Benefits.
The Retirement Income Security Plan incorporates an employee stock ownership plan which is funded
by contributions made by the employer, and is funded by the employees. Contributions to the Plan
are accounted for on the accrual basis and the assets are held separately from those of the Group in
independently administered funds.
T. Geddes Grant Limited Pension Fund Plan is a defined contribution plan whose assets are held separately
from those of the Group in an independently administered fund. Contributions to the plan are accounted
for on the accrual basis and are reviewed by independent actuaries on the basis of triennial valuations.
The majority of the employees of the overseas companies participate in either defined contribution or
defined benefit pension plans which are separate from the Trinidad and Tobago plans.
A defined benefit plan is a pension plan that defines an amount of pension benefit to be provided,
usually as a function of one or more factors such as age, years of service or compensation. A defined
contribution plan is a pension plan under which the Group pays fixed contributions into a separate entity
(a fund) and will have no legal or constructive obligations to pay further contributions if the fund does
not hold sufficient assets to pay all employees benefits relating to employee service in the current and
prior periods.
2 SUMMARY OF SIGNIFICANT ACCOUNTING POLICIES (continued)
u Employee benefits (continued)
i) Pension obligations (continued)
The asset and liability recognised in the consolidated statement of financial position in respect of defined
benefit pension plans is the present value of the defined benefit obligation at the statement of financial
position date less the fair value of plan assets. The defined benefit obligation is calculated annually by
independent actuaries using the projected unit credit method. The present value of the defined benefit
obligation is determined by discounting the estimated future cash outflows using interest rates of
government bonds that are denominated in the currency in which the benefits will be paid, and that have
terms to maturity approximating to the terms of the related pension obligation.
Actuarial gains and losses arising from experience adjustments, changes in actuarial assumptions and
amendments to pension plans are charged or credited to equity in other comprehensive income in the
period in which they arise.
Past-service costs are recognised immediately in income, unless the changes to the pension plan are
conditional on the employees remaining in service for a specified period of time (the vesting period). In
this case, the past-service costs are amortised on a straight-line basis over the vesting period.
For defined contribution plans, the Group pays contributions to publicly or privately administered pension
insurance plans on a mandatory, contractual or voluntary basis. The Group has no further payment
obligations once the contributions have been paid. The contributions are recognised as employee benefit
expense when they are due. Prepaid contributions are recognised as an asset to the extent that a cash
refund or a reduction in the future payments is available.
ii) Other post-employment obligations
Certain Group companies provide post-retirement healthcare benefits to their retirees. The entitlement
to these benefits is usually conditional on the employee remaining in service up to retirement age and
the completion of a minimum service period. The expected costs of these benefits are accrued over the
period of employment using the same accounting methodology as used for defined benefit pension plans.
Actuarial gains and losses arising from experience adjustments, and changes in actuarial assumptions
are charged or credited to equity in other comprehensive income in the period in which it arises. These
obligations are valued annually by independent qualified actuaries.
30 September 2015. Expressed in Thousands of Trinidad and Tobago dollars
Notes to the Consolidated Financial Statements
117116
2 SUMMARY OF SIGNIFICANT ACCOUNTING POLICIES (continued)
u Employee benefits (continued)
iii) Termination benefits
Termination benefits are payable when employment is terminated by the Group before the normal
retirement date, or whenever an employee accepts voluntary redundancy in exchange for these benefits.
The Group recognises termination benefits when it is demonstrably committed to a termination
and when the entity has a detailed formal plan to terminate the employment of current employees
without possibility of withdrawal. In the case of an offer made to encourage voluntary redundancy, the
termination benefits are measured based on the number of employees expected to accept the offer.
Benefits falling due more than 12 months after the end of the reporting period are discounted to their
present value.
iv) Bonus plans
A liability for employee benefits in the form of bonus plans is recognised in other provisions when there is
no realistic alternative but to settle the liability and at least one of the following conditions are met:
• there is a formal plan and the amounts to be paid are determined before the time of issuing the
financial statements; or
• past practice has created a valid expectation by employees that they will receive a bonus/profit sharing
and the amount can be determined before the time of issuing the financial statements.
Liabilities for bonus plans are expected to be settled within 12 months and are measured at the amounts
expected to be paid when they are settled.
v Share-based payments
The Group operates equity-settled, share-based compensation plans, under which the entity receives services
from employees as consideration for equity instruments of the Group. The fair value of the employee services
received in exchange for the allocation or grant of the shares is recognised as an expense under both the
Employee Share Ownership Plan (“ESOP”) and the Performance Share Plan (“PSP”) for Executives only.
The total amount to be expensed for shares allocated under the ESOP is determined by reference to the
market value and purchase price of the shares on the market at the point of purchase.
The total amount to be expensed, under the PSP, is determined by reference to the fair value of the shares
granted:
• including any market performance conditions (for example, an entity’s share price); and
• excluding the impact of any service and non-market performance vesting conditions (for example,
profitability, sales growth targets and remaining an employee of the entity over a specified time period).
2 SUMMARY OF SIGNIFICANT ACCOUNTING POLICIES (continued)
v Share-based payments (continued)
Non-market vesting conditions are included in assumptions about the number of shares that are expected to
be granted and then vested. The total expense is recognised over the vesting period, which is the period over
which all of the specified performance criterion and vesting conditions are to be satisfied. At the end of each
reporting period, the entity revises its estimates of the number of shares that are expected to vest based on
the performance criterion and any applicable non-market vesting conditions. It recognises the impact of the
revision to original estimates, if any, in the consolidated income statement, with a corresponding adjustment
to equity.
When the share grants are due to be vested, the company issues new shares.
The grant by the company of shares to the Executives of subsidiary undertakings in the Group is treated as a
capital contribution. The fair value of Executive services received, is measured by reference to the grant date
fair value and, is recognised over the vesting period.
w Provisions
Provisions for dismantlement costs, restructuring costs, legal claims and all other provisions are recognised
when: the Group has a present legal or constructive obligation as a result of past events; it is more likely than
not that an outflow of resources will be required to settle the obligation; and the amount has been reliably
estimated. Provisions are not recognised for future operating losses.
Where there are a number of similar obligations, the likelihood that an outflow will be required in
settlement is determined by considering the class of obligations as a whole. A provision is recognised even if
the likelihood of an outflow with respect to any one item included in the same class of obligations may be
small.
Provisions are measured at the present value of the expenditures expected to be required to settle the
obligation using a pre-tax rate that reflects current market assessments of the time value of money and the
risks specific to the obligation. The increase in the provision due to passage of time is recognised as interest
expense.
x Revenue recognition
Revenue comprises the fair value of the consideration received or receivable for the sale of goods and services
in the ordinary course of the Group’s activities. Revenue is shown net of value-added tax, returns, rebates
and discounts and after eliminating sales within the Group. The Group recognises revenue when the amount
of revenue can be reliably measured, it is probable that future economic benefits will flow to the entity and
when specific criteria have been met for each of the Group’s activities as described below. The Group bases its
estimates on historical results, taking into consideration the type of customer, the type of transaction and the
specifics of each arrangement.
30 September 2015. Expressed in Thousands of Trinidad and Tobago dollars
Notes to the Consolidated Financial Statements
119118
2 SUMMARY OF SIGNIFICANT ACCOUNTING POLICIES (continued)
x Revenue recognition (continued)
• Sale of goods – wholesale
The Group manufactures and sells a range of products in the wholesale market. Sales of goods are
recognised when a Group entity has delivered products to the wholesaler, the wholesaler has full
discretion over the channel and price to sell the products, and there is no unfulfilled obligation that
could affect the wholesaler’s acceptance of the products. Delivery does not occur until the products
have been shipped to the specified location, the risks of obsolescence and loss have been transferred
to the wholesaler, and either the wholesaler has accepted the products in accordance with the sales
contract, the acceptance provisions have lapsed, or the Group has objective evidence that all criteria for
acceptance have been satisfied.
Sales are recorded based on the price specified in the sales contracts, net of the estimated volume
discounts and returns at the time of sale. Accumulated experience is used to estimate and provide for
the discounts and returns. The volume discounts are assessed based on anticipated annual purchases.
No element of financing is deemed present as the sales are made with credit terms as specified for
entities within the Group, which is consistent with the market practice.
• Sale of goods – retail
The Group operates retail outlets for selling a range of products. Sales of goods are recognised when a
Group entity sells a product to the customer. Retail sales are usually in cash or by credit card.
It is the Group’s policy to sell its products to the retail customer with a right to return within a
stipulated number of days as required by the entities in the Group. Accumulated experience is used to
estimate and provide for such returns at the time of sale.
• Sale of services
The Group is engaged in providing a number of services. These services are provided on a time and
material basis or as a fixed-price contract, with contract terms generally ranging from less than one
year to three years.
Revenue from time and material contracts, typically from delivering design services, is recognised
under the percentage-of-completion method. Revenue is generally recognised at the contractual rates.
For time contracts, the stage of completion is measured on the basis of labour hours delivered as a
percentage of total hours to be delivered. For material contracts, the stage of completion is measured
on the basis of direct expenses incurred as a percentage of the total expenses to be incurred.
Revenue from fixed-price contracts for delivering design services is also recognised under the
percentage-of-completion method. Revenue is generally recognised based on the services performed to
date as a percentage of the total services to be performed.
2 SUMMARY OF SIGNIFICANT ACCOUNTING POLICIES (continued)
x Revenue recognition (continued)
• Sale of services (continued)
Revenue from fixed-price contracts is generally recognised in the period the services are provided, using
a straight-line basis over the term of the contract.
If circumstances arise that may change the original estimates of revenues, costs or extent of progress
toward completion, estimates are revised. These revisions may result in increases or decreases in
estimated revenues or costs and are reflected in income in the period in which the circumstances that
give rise to the revision become known by management.
• Premium income
Premiums written are recognised on policy inception and earned on a pro-rata basis over the term of
the related policy coverage. Estimates of premiums written as at the statement of financial position
date but not yet received, are assessed based on estimates from underwriting or past experience and
are included in premiums earned. Premiums ceded are expensed on a pro-rata basis over the term of
the respective policy.
• Rental income
Rental income from investment property leased out under an operating lease is recognised in the
consolidated income statement on a straight-line basis over the lease term.
Contingent rents, such as turnover rents, rent reviews and indexation, are recorded as income in the
periods in which they are earned. Rent reviews are recognised when such reviews have been agreed
with tenants.
• Interest income
Interest income is recognised using the effective interest method. When a loan and receivable is
impaired, the Group reduces the carrying amount to its recoverable amount, being the estimated
future cash flow discounted at the original effective interest rate of the instrument, and continues
unwinding the discount as interest income. Interest income on impaired loans and receivables is
recognised using the original effective interest rate.
• Dividend income
Dividend income is recognised when the shareholder’s right to receive payment is established.
30 September 2015. Expressed in Thousands of Trinidad and Tobago dollars
Notes to the Consolidated Financial Statements
121120
2 SUMMARY OF SIGNIFICANT ACCOUNTING POLICIES (continued)
y Leases
Group is the lessee
Leases in which a significant portion of the risks and rewards of ownership are retained by the lessor are
classified as operating leases. Payments made under operating leases (net of any incentives received from the
lessor) are charged to the consolidated income statement on a straight-line basis over the period of the lease.
The Group leases certain property, plant and equipment. Leases of property, plant and equipment where, the
Group has substantially all the risks and rewards of ownership, are classified as finance leases. Finance leases
are capitalised at the lease’s commencement at the lower of the fair value of the leased property and the
present value of the minimum lease payments.
Each lease payment is allocated between the liability and finance charges. The corresponding rental
obligations, net of finance charges, are included in other long-term payables. The interest element of the
finance cost is charged to the consolidated income statement over the lease period so as to produce a
constant periodic rate of interest on the remaining balance of the liability for each period. The property,
plant and equipment acquired under finance leases is depreciated over the shorter of the useful life of the
asset and the lease term.
Group is the lessor
When assets are leased out under a finance lease, the present value of the lease payments is recognised as a
receivable. The difference between the gross receivable and the present value of the receivable is recognised
as unearned finance income. Lease income is recognised over the term of the lease using the net investment
method, which reflects a constant periodic rate of return. Assets leased out under operating leases are
included in property, plant and equipment in the consolidated statement of financial position. They are
depreciated over their expected useful lives on a basis consistent with similarly owned property, plant and
equipment. Rental income (net of any incentives given to lessees) is recognised on a pattern reflecting a
constant periodic rate of return on the lessor’s net investment.
z Dividend distribution
Dividend distribution to the company’s shareholders is recognised as a liability in the Group’s financial
statements in the period in which the dividends are approved by the company’s directors.
3 FINANCIAL RISK MANAGEMENT
a Financial risk factors
The Group’s activities expose it to a variety of financial risks. The Group’s aim therefore is to achieve an
appropriate balance between risk and return and minimise potentially adverse effects on the Group’s
financial performance. This is achieved by the analysis, evaluation, acceptance and management of the
Group’s risk exposure.
3 FINANCIAL RISK MANAGEMENT (continued)
a Financial risk factors (continued)
The Board of Directors is ultimately responsible for the establishment and oversight of the Group’s risk
management framework. The main financial risks of the Group relate to the availability of funds to meet
business needs, the risk of default by counterparties to financial transactions, and fluctuations in interest and
foreign exchange rates. The treasury function manages the financial risks that arise in relation to underlying
business needs and operates within clear policies and stringent parameters. The function does not operate as
a profit centre and the undertaking of speculative transactions is not permitted.
The Group’s principal financial liabilities comprise bank loans, operating overdrafts and trade payables, which
are used to finance Group operations. There are various financial assets such as trade receivables, investments,
loans receivable, cash and short term deposits which emanate from its operations. The main risks arising from
the Group’s financial instruments are credit risk, liquidity risk, foreign currency risk and interest rate risk.
The following contains information relative to the Group’s exposure to each of the above risks, including
quantitative disclosures.
i) Market risk
The Group operates internationally and is exposed to foreign exchange risk arising from various currency
exposures. Foreign exchange risk arises from future commercial transactions, recognised assets and
liabilities and net investments in foreign operations.
a) Currency risk
The Group is exposed to foreign exchange risk arising from various currency exposures. The Group
manages its foreign exchange risk by ensuring that the net exposure in foreign assets and liabilities
is kept to an acceptable level by monitoring currency positions as well as holding foreign currency
balances.
The values of debt, investments and other financial liabilities, denominated in currencies other than
the functional currency of the entities holding them, are subject to exchange rate movements. The US
$19,000 loan outstanding as at 30 September 2014 was repaid during the year and the USD foreign
exchange position as at 30 September 2015 is not significant. A 2% change in USD rates would lead to
a TT$43 (2014: TT$2,417) loss/gain in the consolidated income statement.
The assets and liabilities of the Colombian subsidiaries are denominated in Colombian Pesos and are
translated into Trinidad and Tobago dollars at exchange rates prevailing at the date of the consolidated
statement of financial position. Exchange differences arising are recognised in the consolidated
statement of comprehensive income and are included in the consolidated translation reserve. A 10%
devaluation in the Colombian Peso to the US dollar would result in TT$7,673 loss to the statement of
comprehensive income.
30 September 2015. Expressed in Thousands of Trinidad and Tobago dollars
Notes to the Consolidated Financial Statements
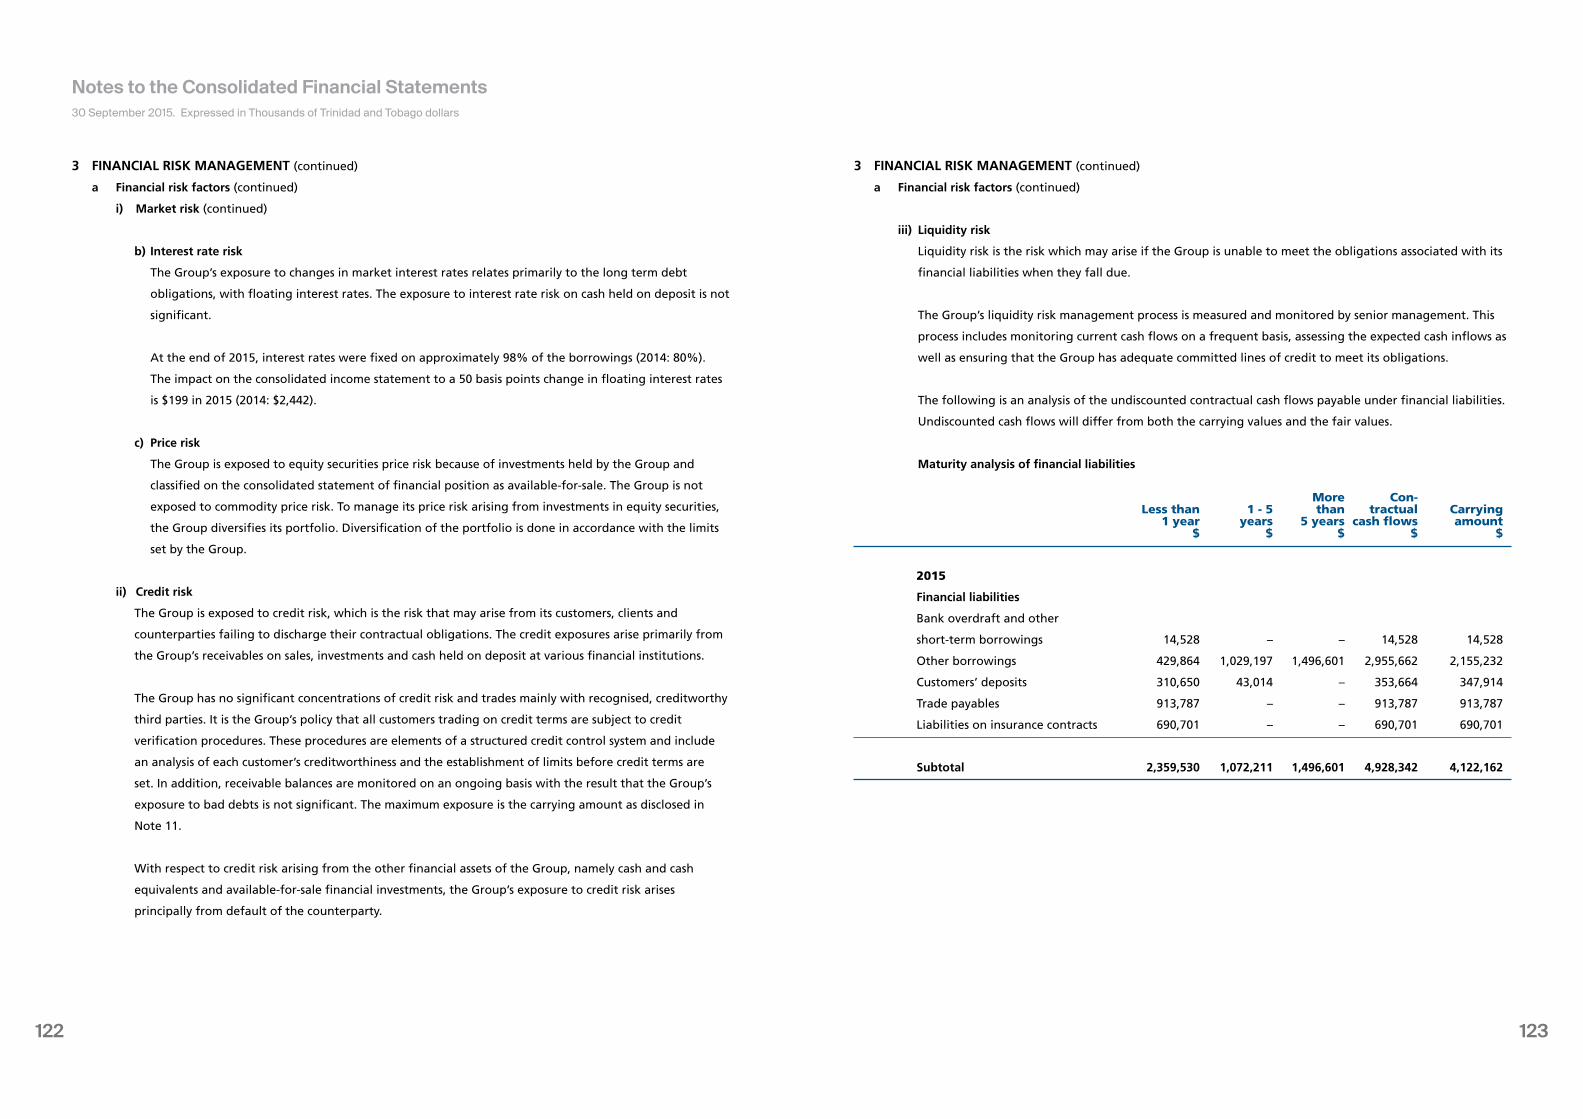
123122
3 FINANCIAL RISK MANAGEMENT (continued)
a Financial risk factors (continued)
i) Market risk (continued)
b) Interest rate risk
The Group’s exposure to changes in market interest rates relates primarily to the long term debt
obligations, with floating interest rates. The exposure to interest rate risk on cash held on deposit is not
significant.
At the end of 2015, interest rates were fixed on approximately 98% of the borrowings (2014: 80%).
The impact on the consolidated income statement to a 50 basis points change in floating interest rates
is $199 in 2015 (2014: $2,442).
c) Price risk
The Group is exposed to equity securities price risk because of investments held by the Group and
classified on the consolidated statement of financial position as available-for-sale. The Group is not
exposed to commodity price risk. To manage its price risk arising from investments in equity securities,
the Group diversifies its portfolio. Diversification of the portfolio is done in accordance with the limits
set by the Group.
ii) Credit risk
The Group is exposed to credit risk, which is the risk that may arise from its customers, clients and
counterparties failing to discharge their contractual obligations. The credit exposures arise primarily from
the Group’s receivables on sales, investments and cash held on deposit at various financial institutions.
The Group has no significant concentrations of credit risk and trades mainly with recognised, creditworthy
third parties. It is the Group’s policy that all customers trading on credit terms are subject to credit
verification procedures. These procedures are elements of a structured credit control system and include
an analysis of each customer’s creditworthiness and the establishment of limits before credit terms are
set. In addition, receivable balances are monitored on an ongoing basis with the result that the Group’s
exposure to bad debts is not significant. The maximum exposure is the carrying amount as disclosed in
Note 11.
With respect to credit risk arising from the other financial assets of the Group, namely cash and cash
equivalents and available-for-sale financial investments, the Group’s exposure to credit risk arises
principally from default of the counterparty.
3 FINANCIAL RISK MANAGEMENT (continued)
a Financial risk factors (continued)
iii) Liquidity risk
Liquidity risk is the risk which may arise if the Group is unable to meet the obligations associated with its
financial liabilities when they fall due.
The Group’s liquidity risk management process is measured and monitored by senior management. This
process includes monitoring current cash flows on a frequent basis, assessing the expected cash inflows as
well as ensuring that the Group has adequate committed lines of credit to meet its obligations.
The following is an analysis of the undiscounted contractual cash flows payable under financial liabilities.
Undiscounted cash flows will differ from both the carrying values and the fair values.
Maturity analysis of financial liabilities
More Con- Less than 1 - 5 than tractual Carrying 1 year years 5 years cash flows amount $ $ $ $ $
2015
Financial liabilities
Bank overdraft and other
short-term borrowings 14,528 – – 14,528 14,528
Other borrowings 429,864 1,029,197 1,496,601 2,955,662 2,155,232
Customers’ deposits 310,650 43,014 – 353,664 347,914
Trade payables 913,787 – – 913,787 913,787
Liabilities on insurance contracts 690,701 – – 690,701 690,701
Subtotal 2,359,530 1,072,211 1,496,601 4,928,342 4,122,162
30 September 2015. Expressed in Thousands of Trinidad and Tobago dollars
Notes to the Consolidated Financial Statements
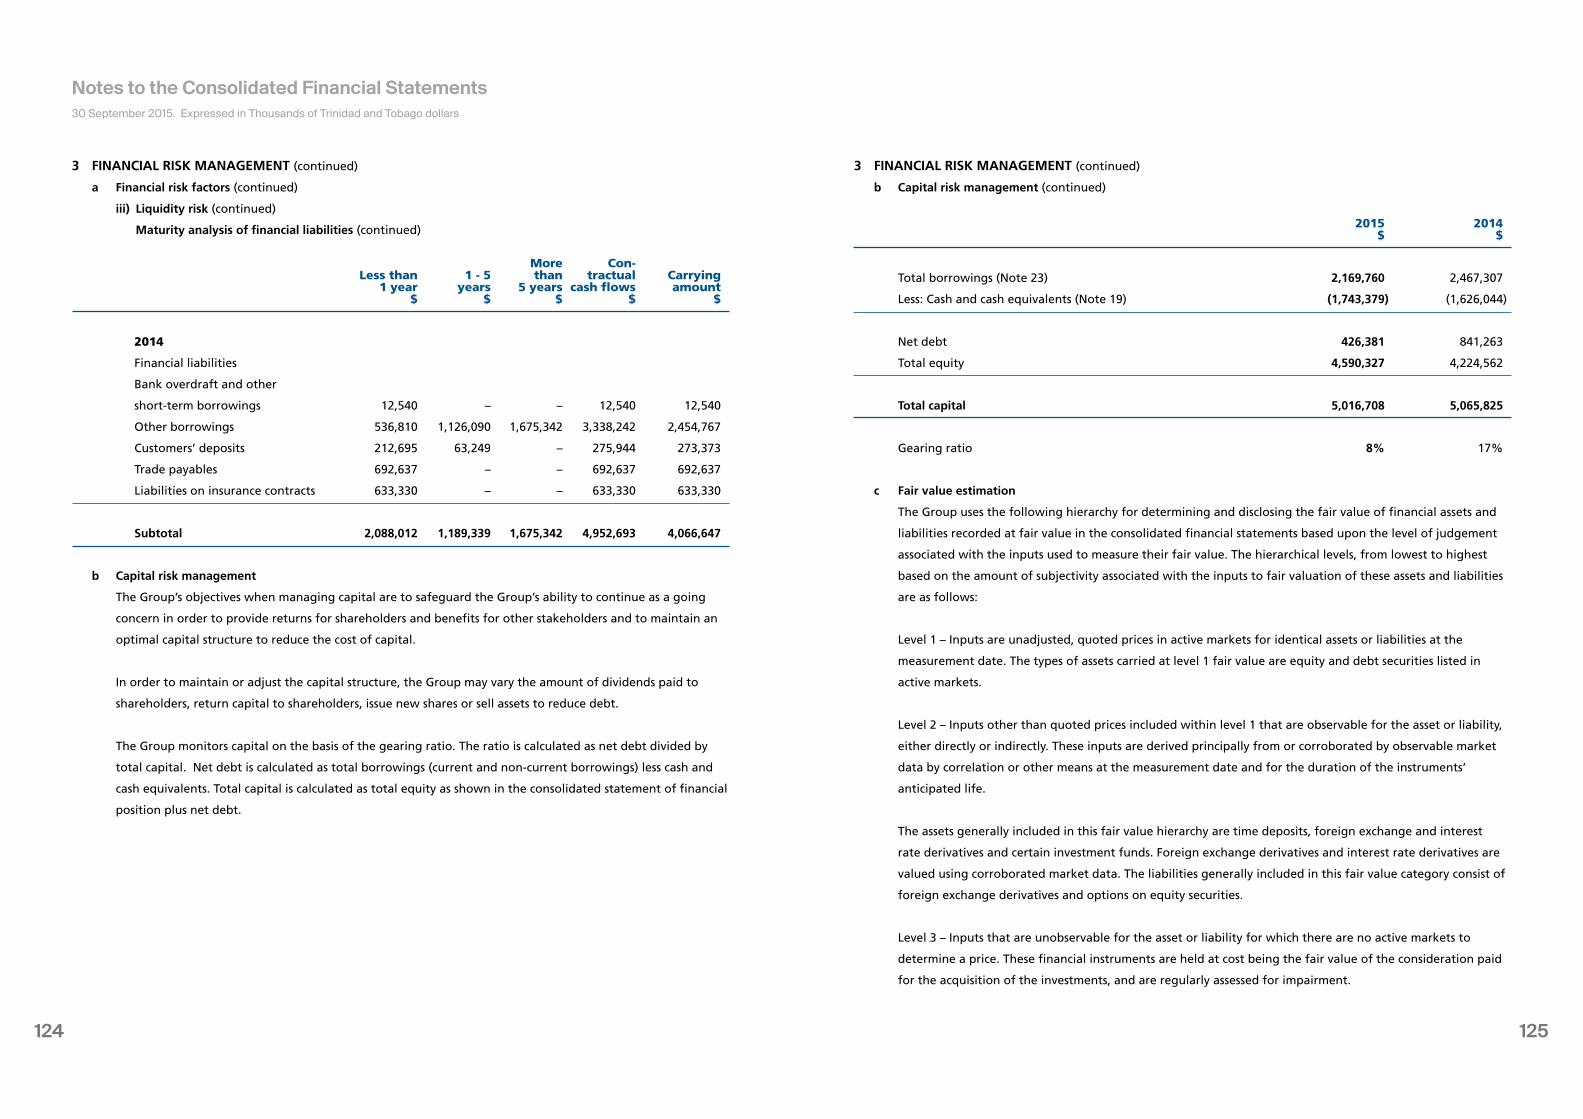
125124
3 FINANCIAL RISK MANAGEMENT (continued)
a Financial risk factors (continued)
iii) Liquidity risk (continued)
Maturity analysis of financial liabilities (continued)
More Con- Less than 1 - 5 than tractual Carrying 1 year years 5 years cash flows amount $ $ $ $ $
2014
Financial liabilities
Bank overdraft and other
short-term borrowings 12,540 – – 12,540 12,540
Other borrowings 536,810 1,126,090 1,675,342 3,338,242 2,454,767
Customers’ deposits 212,695 63,249 – 275,944 273,373
Trade payables 692,637 – – 692,637 692,637
Liabilities on insurance contracts 633,330 – – 633,330 633,330
Subtotal 2,088,012 1,189,339 1,675,342 4,952,693 4,066,647
b Capital risk management
The Group’s objectives when managing capital are to safeguard the Group’s ability to continue as a going
concern in order to provide returns for shareholders and benefits for other stakeholders and to maintain an
optimal capital structure to reduce the cost of capital.
In order to maintain or adjust the capital structure, the Group may vary the amount of dividends paid to
shareholders, return capital to shareholders, issue new shares or sell assets to reduce debt.
The Group monitors capital on the basis of the gearing ratio. The ratio is calculated as net debt divided by
total capital. Net debt is calculated as total borrowings (current and non-current borrowings) less cash and
cash equivalents. Total capital is calculated as total equity as shown in the consolidated statement of financial
position plus net debt.
3 FINANCIAL RISK MANAGEMENT (continued)
b Capital risk management (continued)
2015 2014 $ $
Total borrowings (Note 23) 2,169,760 2,467,307
Less: Cash and cash equivalents (Note 19) (1,743,379) (1,626,044)
Net debt 426,381 841,263
Total equity 4,590,327 4,224,562
Total capital 5,016,708 5,065,825
Gearing ratio 8% 17%
c Fair value estimation
The Group uses the following hierarchy for determining and disclosing the fair value of financial assets and
liabilities recorded at fair value in the consolidated financial statements based upon the level of judgement
associated with the inputs used to measure their fair value. The hierarchical levels, from lowest to highest
based on the amount of subjectivity associated with the inputs to fair valuation of these assets and liabilities
are as follows:
Level 1 – Inputs are unadjusted, quoted prices in active markets for identical assets or liabilities at the
measurement date. The types of assets carried at level 1 fair value are equity and debt securities listed in
active markets.
Level 2 – Inputs other than quoted prices included within level 1 that are observable for the asset or liability,
either directly or indirectly. These inputs are derived principally from or corroborated by observable market
data by correlation or other means at the measurement date and for the duration of the instruments’
anticipated life.
The assets generally included in this fair value hierarchy are time deposits, foreign exchange and interest
rate derivatives and certain investment funds. Foreign exchange derivatives and interest rate derivatives are
valued using corroborated market data. The liabilities generally included in this fair value category consist of
foreign exchange derivatives and options on equity securities.
Level 3 – Inputs that are unobservable for the asset or liability for which there are no active markets to
determine a price. These financial instruments are held at cost being the fair value of the consideration paid
for the acquisition of the investments, and are regularly assessed for impairment.
30 September 2015. Expressed in Thousands of Trinidad and Tobago dollars
Notes to the Consolidated Financial Statements
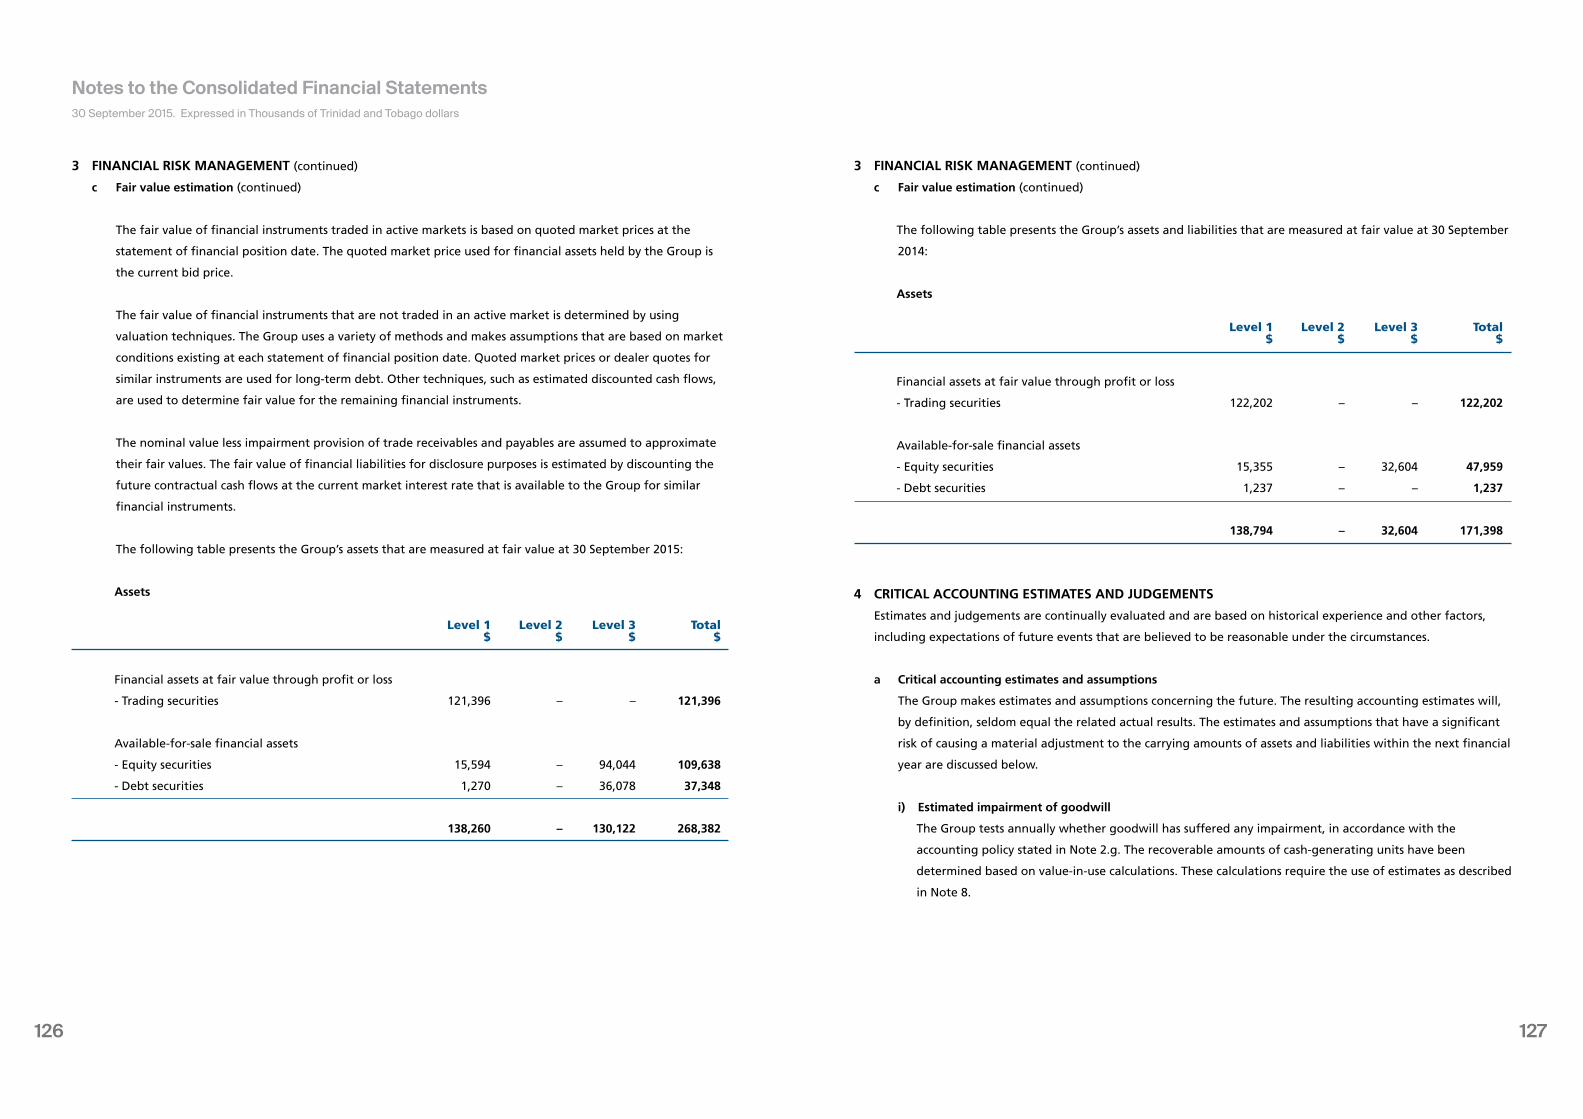
127126
3 FINANCIAL RISK MANAGEMENT (continued)
c Fair value estimation (continued)
The fair value of financial instruments traded in active markets is based on quoted market prices at the
statement of financial position date. The quoted market price used for financial assets held by the Group is
the current bid price.
The fair value of financial instruments that are not traded in an active market is determined by using
valuation techniques. The Group uses a variety of methods and makes assumptions that are based on market
conditions existing at each statement of financial position date. Quoted market prices or dealer quotes for
similar instruments are used for long-term debt. Other techniques, such as estimated discounted cash flows,
are used to determine fair value for the remaining financial instruments.
The nominal value less impairment provision of trade receivables and payables are assumed to approximate
their fair values. The fair value of financial liabilities for disclosure purposes is estimated by discounting the
future contractual cash flows at the current market interest rate that is available to the Group for similar
financial instruments.
The following table presents the Group’s assets that are measured at fair value at 30 September 2015:
Assets
Level 1 Level 2 Level 3 Total $ $ $ $
Financial assets at fair value through profit or loss
- Trading securities 121,396 – – 121,396
Available-for-sale financial assets
- Equity securities 15,594 – 94,044 109,638
- Debt securities 1,270 – 36,078 37,348
138,260 – 130,122 268,382
3 FINANCIAL RISK MANAGEMENT (continued)
c Fair value estimation (continued)
The following table presents the Group’s assets and liabilities that are measured at fair value at 30 September
2014:
Assets
Level 1 Level 2 Level 3 Total $ $ $ $
Financial assets at fair value through profit or loss
- Trading securities 122,202 – – 122,202
Available-for-sale financial assets
- Equity securities 15,355 – 32,604 47,959
- Debt securities 1,237 – – 1,237
138,794 – 32,604 171,398
4 CRITICAL ACCOUNTING ESTIMATES AND JUDGEMENTS
Estimates and judgements are continually evaluated and are based on historical experience and other factors,
including expectations of future events that are believed to be reasonable under the circumstances.
a Critical accounting estimates and assumptions
The Group makes estimates and assumptions concerning the future. The resulting accounting estimates will,
by definition, seldom equal the related actual results. The estimates and assumptions that have a significant
risk of causing a material adjustment to the carrying amounts of assets and liabilities within the next financial
year are discussed below.
i) Estimated impairment of goodwill
The Group tests annually whether goodwill has suffered any impairment, in accordance with the
accounting policy stated in Note 2.g. The recoverable amounts of cash-generating units have been
determined based on value-in-use calculations. These calculations require the use of estimates as described
in Note 8.
30 September 2015. Expressed in Thousands of Trinidad and Tobago dollars
Notes to the Consolidated Financial Statements
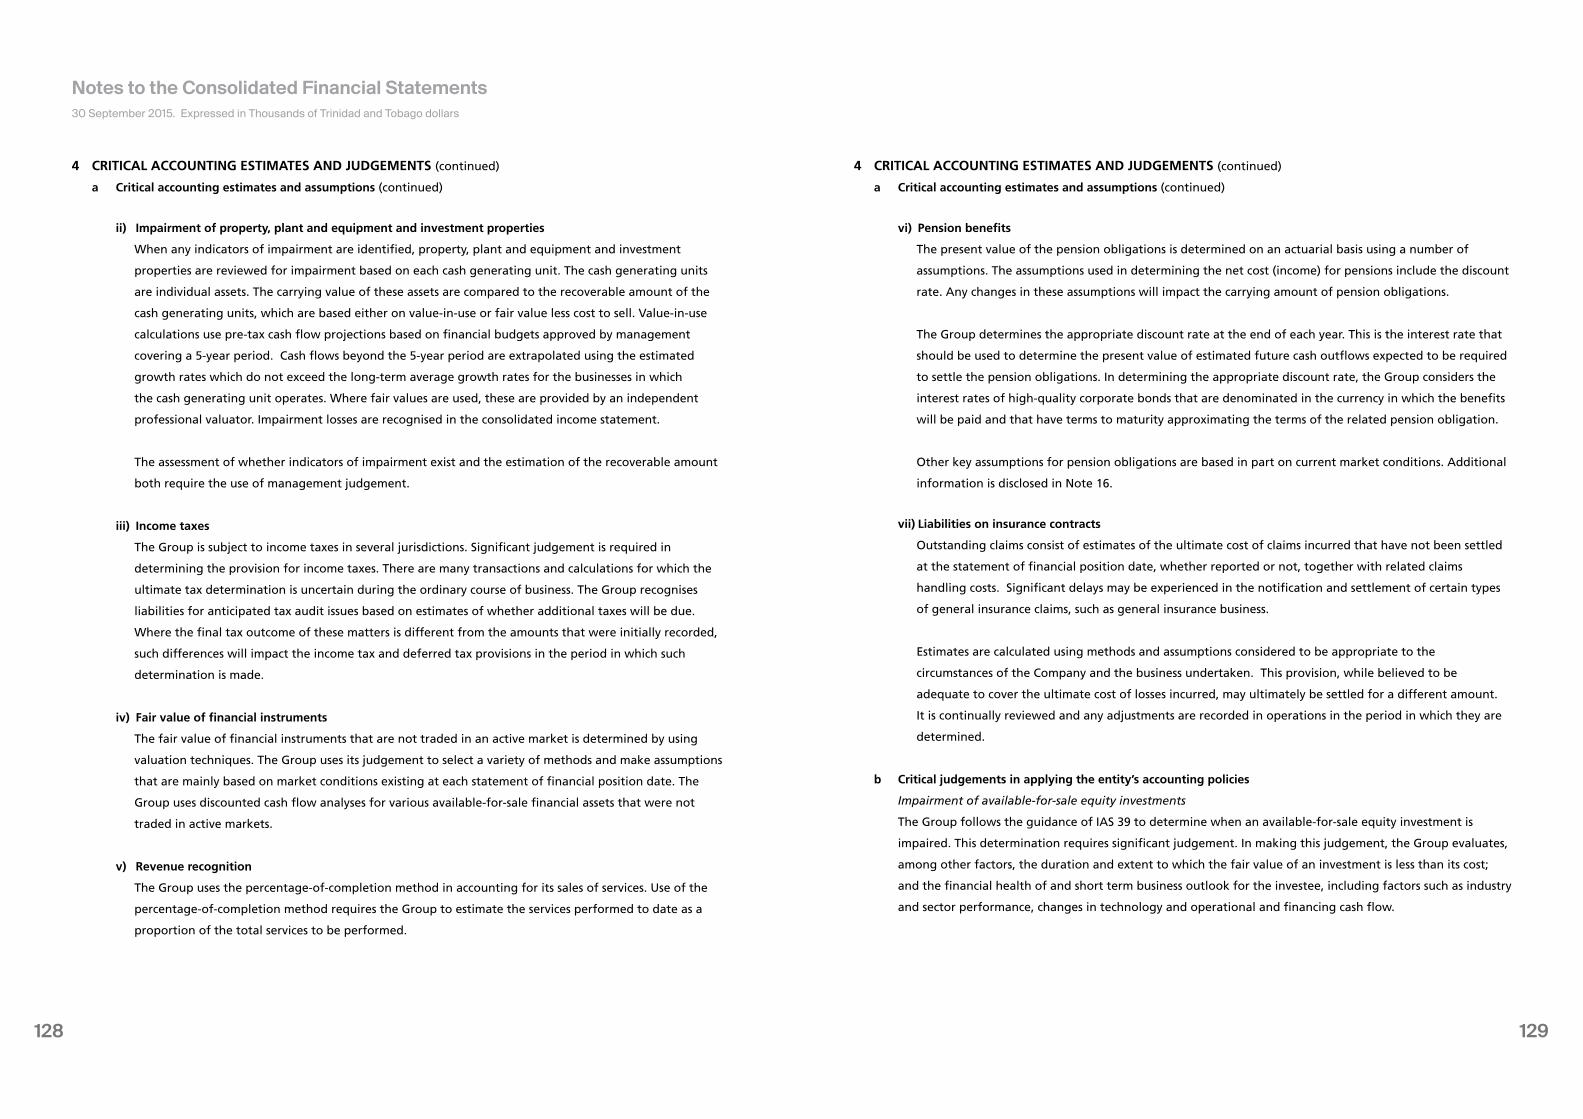
129128
4 CRITICAL ACCOUNTING ESTIMATES AND JUDGEMENTS (continued)
a Critical accounting estimates and assumptions (continued)
ii) Impairment of property, plant and equipment and investment properties
When any indicators of impairment are identified, property, plant and equipment and investment
properties are reviewed for impairment based on each cash generating unit. The cash generating units
are individual assets. The carrying value of these assets are compared to the recoverable amount of the
cash generating units, which are based either on value-in-use or fair value less cost to sell. Value-in-use
calculations use pre-tax cash flow projections based on financial budgets approved by management
covering a 5-year period. Cash flows beyond the 5-year period are extrapolated using the estimated
growth rates which do not exceed the long-term average growth rates for the businesses in which
the cash generating unit operates. Where fair values are used, these are provided by an independent
professional valuator. Impairment losses are recognised in the consolidated income statement.
The assessment of whether indicators of impairment exist and the estimation of the recoverable amount
both require the use of management judgement.
iii) Income taxes
The Group is subject to income taxes in several jurisdictions. Significant judgement is required in
determining the provision for income taxes. There are many transactions and calculations for which the
ultimate tax determination is uncertain during the ordinary course of business. The Group recognises
liabilities for anticipated tax audit issues based on estimates of whether additional taxes will be due.
Where the final tax outcome of these matters is different from the amounts that were initially recorded,
such differences will impact the income tax and deferred tax provisions in the period in which such
determination is made.
iv) Fair value of financial instruments
The fair value of financial instruments that are not traded in an active market is determined by using
valuation techniques. The Group uses its judgement to select a variety of methods and make assumptions
that are mainly based on market conditions existing at each statement of financial position date. The
Group uses discounted cash flow analyses for various available-for-sale financial assets that were not
traded in active markets.
v) Revenue recognition
The Group uses the percentage-of-completion method in accounting for its sales of services. Use of the
percentage-of-completion method requires the Group to estimate the services performed to date as a
proportion of the total services to be performed.
4 CRITICAL ACCOUNTING ESTIMATES AND JUDGEMENTS (continued)
a Critical accounting estimates and assumptions (continued)
vi) Pension benefits
The present value of the pension obligations is determined on an actuarial basis using a number of
assumptions. The assumptions used in determining the net cost (income) for pensions include the discount
rate. Any changes in these assumptions will impact the carrying amount of pension obligations.
The Group determines the appropriate discount rate at the end of each year. This is the interest rate that
should be used to determine the present value of estimated future cash outflows expected to be required
to settle the pension obligations. In determining the appropriate discount rate, the Group considers the
interest rates of high-quality corporate bonds that are denominated in the currency in which the benefits
will be paid and that have terms to maturity approximating the terms of the related pension obligation.
Other key assumptions for pension obligations are based in part on current market conditions. Additional
information is disclosed in Note 16.
vii) Liabilities on insurance contracts
Outstanding claims consist of estimates of the ultimate cost of claims incurred that have not been settled
at the statement of financial position date, whether reported or not, together with related claims
handling costs. Significant delays may be experienced in the notification and settlement of certain types
of general insurance claims, such as general insurance business.
Estimates are calculated using methods and assumptions considered to be appropriate to the
circumstances of the Company and the business undertaken. This provision, while believed to be
adequate to cover the ultimate cost of losses incurred, may ultimately be settled for a different amount.
It is continually reviewed and any adjustments are recorded in operations in the period in which they are
determined.
b Critical judgements in applying the entity’s accounting policies
Impairment of available-for-sale equity investments
The Group follows the guidance of IAS 39 to determine when an available-for-sale equity investment is
impaired. This determination requires significant judgement. In making this judgement, the Group evaluates,
among other factors, the duration and extent to which the fair value of an investment is less than its cost;
and the financial health of and short term business outlook for the investee, including factors such as industry
and sector performance, changes in technology and operational and financing cash flow.
30 September 2015. Expressed in Thousands of Trinidad and Tobago dollars
Notes to the Consolidated Financial Statements
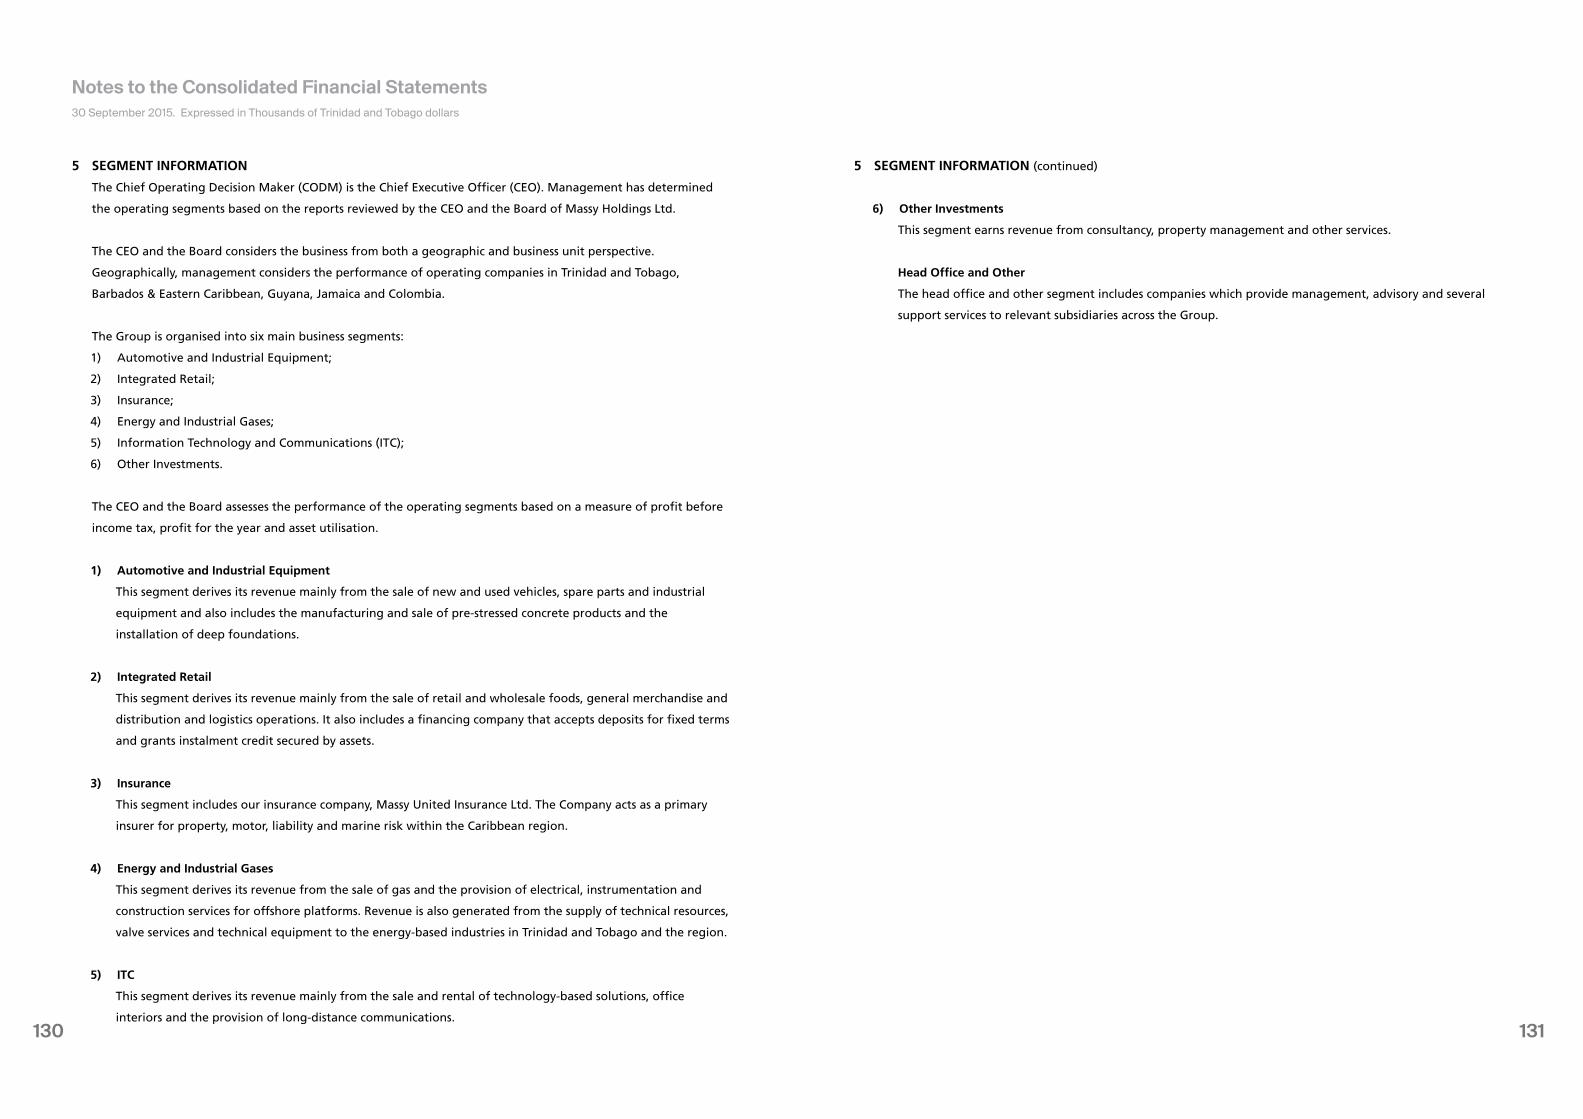
131130
5 SEGMENT INFORMATION
The Chief Operating Decision Maker (CODM) is the Chief Executive Officer (CEO). Management has determined
the operating segments based on the reports reviewed by the CEO and the Board of Massy Holdings Ltd.
The CEO and the Board considers the business from both a geographic and business unit perspective.
Geographically, management considers the performance of operating companies in Trinidad and Tobago,
Barbados & Eastern Caribbean, Guyana, Jamaica and Colombia.
The Group is organised into six main business segments:
1) Automotive and Industrial Equipment;
2) Integrated Retail;
3) Insurance;
4) Energy and Industrial Gases;
5) Information Technology and Communications (ITC);
6) Other Investments.
The CEO and the Board assesses the performance of the operating segments based on a measure of profit before
income tax, profit for the year and asset utilisation.
1) Automotive and Industrial Equipment
This segment derives its revenue mainly from the sale of new and used vehicles, spare parts and industrial
equipment and also includes the manufacturing and sale of pre-stressed concrete products and the
installation of deep foundations.
2) Integrated Retail
This segment derives its revenue mainly from the sale of retail and wholesale foods, general merchandise and
distribution and logistics operations. It also includes a financing company that accepts deposits for fixed terms
and grants instalment credit secured by assets.
3) Insurance
This segment includes our insurance company, Massy United Insurance Ltd. The Company acts as a primary
insurer for property, motor, liability and marine risk within the Caribbean region.
4) Energy and Industrial Gases
This segment derives its revenue from the sale of gas and the provision of electrical, instrumentation and
construction services for offshore platforms. Revenue is also generated from the supply of technical resources,
valve services and technical equipment to the energy-based industries in Trinidad and Tobago and the region.
5) ITC
This segment derives its revenue mainly from the sale and rental of technology-based solutions, office
interiors and the provision of long-distance communications.
5 SEGMENT INFORMATION (continued)
6) Other Investments
This segment earns revenue from consultancy, property management and other services.
Head Office and Other
The head office and other segment includes companies which provide management, advisory and several
support services to relevant subsidiaries across the Group.
30 September 2015. Expressed in Thousands of Trinidad and Tobago dollars
Notes to the Consolidated Financial Statements
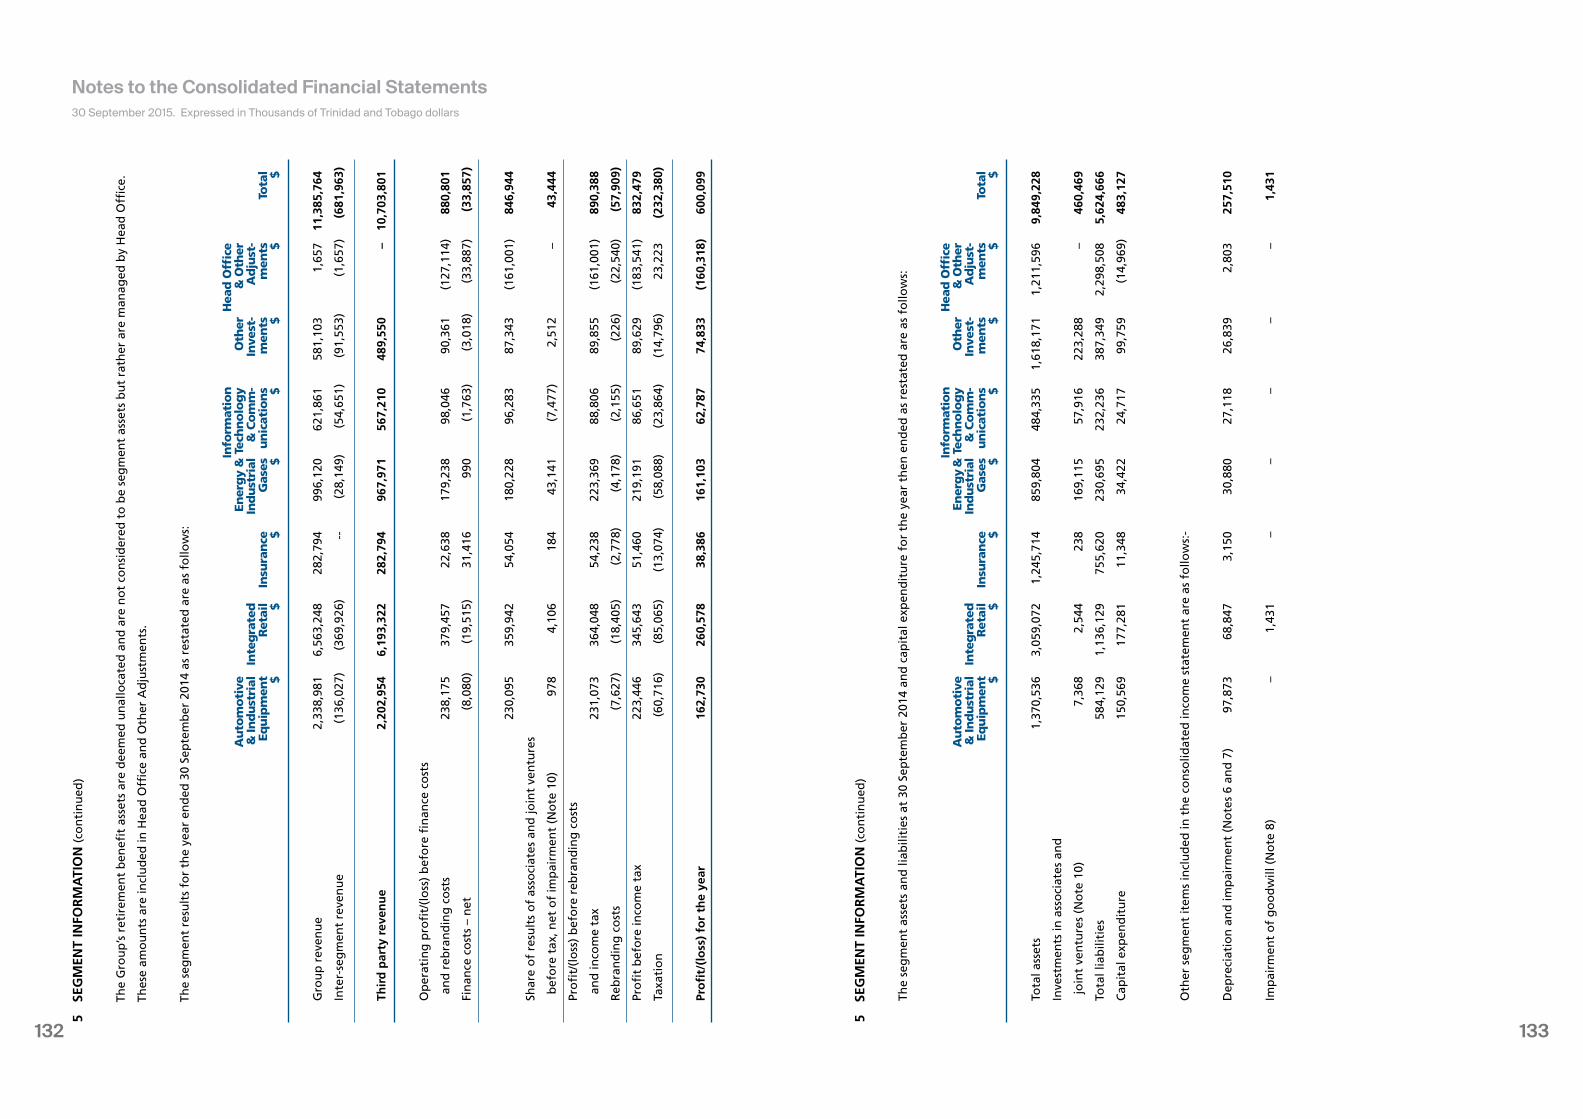
133132
5 SE
GM
ENT
INFO
RM
ATI
ON
(co
nti
nu
ed)
Th
e G
rou
p’s
ret
irem
ent
ben
efit
asse
ts a
re d
eem
ed u
nal
loca
ted
an
d a
re n
ot
con
sid
ered
to
be
seg
men
t as
sets
bu
t ra
ther
are
man
aged
by
Hea
d O
ffice
.
Thes
e am
ou
nts
are
incl
ud
ed in
Hea
d O
ffice
an
d O
ther
Ad
just
men
ts.
Th
e se
gm
ent
resu
lts
for
the
year
en
ded
30
Sep
tem
ber
201
4 as
res
tate
d a
re a
s fo
llow
s:
Info
rmat
ion
H
ead
Offi
ce
Au
tom
oti
ve
Ener
gy
& T
ech
no
log
y O
ther
&
Oth
er
& In
du
stri
al
Inte
gra
ted
Ind
ust
rial
&
Co
mm
- In
vest
- A
dju
st-
Eq
uip
men
t R
etai
l In
sura
nce
G
ases
u
nic
atio
ns
men
ts
men
ts
Tota
l
$ $
$ $
$ $
$ $
Gro
up
rev
enu
e 2,
338,
981
6,56
3,24
8 28
2,79
4 99
6,12
0 62
1,86
1 58
1,10
3 1,
657
11,3
85,7
64
Inte
r-se
gm
ent
reve
nu
e (1
36,0
27)
(369
,926
) --
(2
8,14
9)
(54,
651)
(9
1,55
3)
(1,6
57)
(681
,963
)
Thir
d p
arty
rev
enu
e 2,
202,
954
6,19
3,32
2 28
2,79
4 96
7,97
1 56
7,21
0 48
9,55
0 –
10,7
03,8
01
Op
erat
ing
pro
fit/
(lo
ss)
bef
ore
fin
ance
co
sts
an
d r
ebra
nd
ing
co
sts
238,
175
379,
457
22,6
38
179,
238
98,0
46
90,3
61
(127
,114
) 88
0,80
1
Fin
ance
co
sts
– n
et
(8,0
80)
(19,
515)
31
,416
99
0 (1
,763
) (3
,018
) (3
3,88
7)
(33,
857)
230,
095
359,
942
54,0
54
180,
228
96,2
83
87,3
43
(161
,001
) 84
6,94
4
Shar
e o
f re
sult
s o
f as
soci
ates
an
d jo
int
ven
ture
s
bef
ore
tax
, net
of
imp
airm
ent
(No
te 1
0)
978
4,10
6 18
4 43
,141
(7
,477
) 2,
512
– 43
,444
Pro
fit/
(lo
ss)
bef
ore
reb
ran
din
g c
ost
s
an
d in
com
e ta
x 23
1,07
3 36
4,04
8 54
,238
22
3,36
9 88
,806
89
,855
(1
61,0
01)
890,
388
Reb
ran
din
g c
ost
s (7
,627
) (1
8,40
5)
(2,7
78)
(4,1
78)
(2,1
55)
(226
) (2
2,54
0)
(57,
909)
Pro
fit
bef
ore
inco
me
tax
223,
446
345,
643
51,4
60
219,
191
86,6
51
89,6
29
(183
,541
) 83
2,47
9
Taxa
tio
n
(60,
716)
(8
5,06
5)
(13,
074)
(5
8,08
8)
(23,
864)
(1
4,79
6)
23,2
23
(232
,380
)
Pro
fit/
(lo
ss)
for
the
year
16
2,73
0 26
0,57
8 38
,386
16
1,10
3 62
,787
74
,833
(1
60,3
18)
600,
099
30 September 2015. Expressed in Thousands of Trinidad and Tobago dollars
Notes to the Consolidated Financial Statements
5 SE
GM
ENT
INFO
RM
ATI
ON
(co
nti
nu
ed)
The
seg
men
t as
sets
an
d li
abili
ties
at
30 S
epte
mb
er 2
014
and
cap
ital
exp
end
itu
re f
or
the
year
th
en e
nd
ed a
s re
stat
ed a
re a
s fo
llow
s:
Info
rmat
ion
H
ead
Offi
ce
Au
tom
oti
ve
Ener
gy
& T
ech
no
log
y O
ther
&
Oth
er
& In
du
stri
al
Inte
gra
ted
Ind
ust
rial
&
Co
mm
- In
vest
- A
dju
st-
Eq
uip
men
t R
etai
l In
sura
nce
G
ases
u
nic
atio
ns
men
ts
men
ts
Tota
l
$ $
$ $
$ $
$ $
Tota
l ass
ets
1,37
0,53
6 3,
059,
072
1,24
5,71
4 85
9,80
4 48
4,33
5 1,
618,
171
1,21
1,59
6 9,
849,
228
Inve
stm
ents
in a
sso
ciat
es a
nd
jo
int
ven
ture
s (N
ote
10)
7,
368
2,54
4 23
8 16
9,11
5 57
,916
22
3,28
8 –
460,
469
Tota
l lia
bili
ties
58
4,12
9 1,
136,
129
755,
620
230,
695
232,
236
387,
349
2,29
8,50
8 5,
624,
666
Cap
ital
exp
end
itu
re
150,
569
177,
281
11,3
48
34,4
22
24,7
17
99,7
59
(14,
969)
48
3,12
7
Oth
er s
egm
ent
item
s in
clu
ded
in t
he
con
solid
ated
inco
me
stat
emen
t ar
e as
fo
llow
s:-
Dep
reci
atio
n a
nd
imp
airm
ent
(No
tes
6 an
d 7
) 97
,873
68
,847
3,
150
30,8
80
27,1
18
26,8
39
2,80
3 25
7,51
0
Imp
airm
ent
of
go
od
will
(N
ote
8)
– 1,
431
– –
– –
– 1,
431
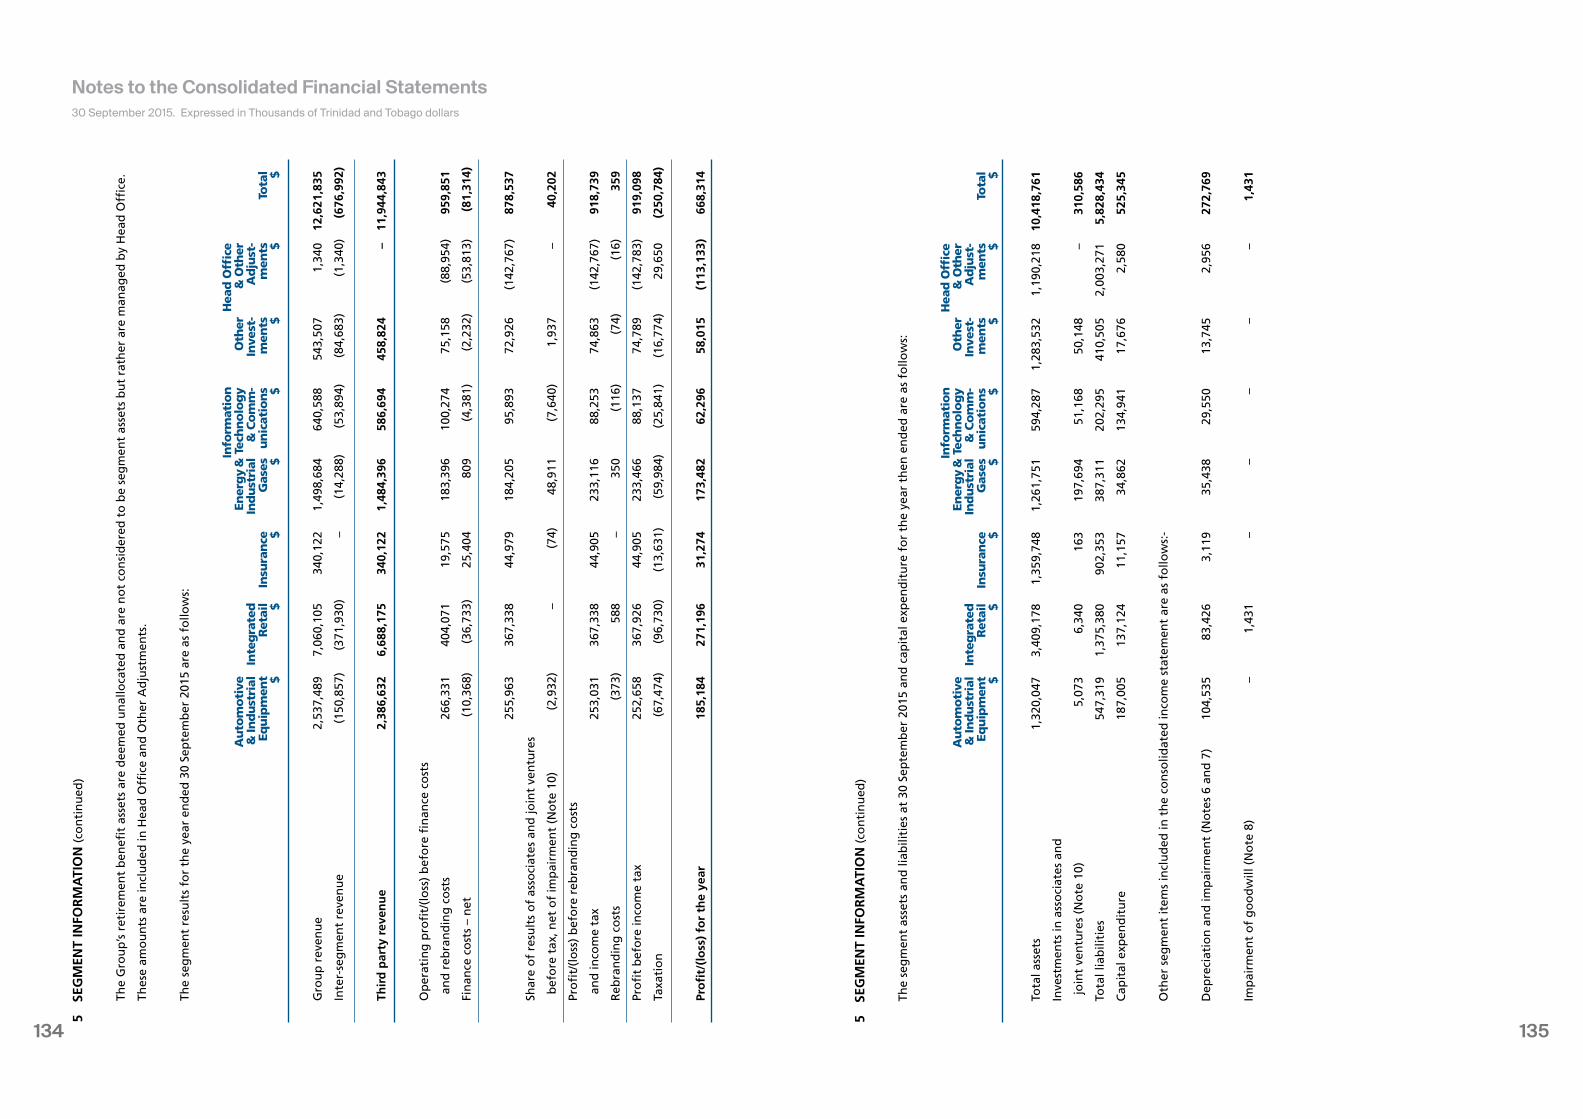
135134
30 September 2015. Expressed in Thousands of Trinidad and Tobago dollars
Notes to the Consolidated Financial Statements5
SEG
MEN
T IN
FOR
MA
TIO
N (c
on
tin
ued
)
The
Gro
up
’s r
etir
emen
t b
enefi
t as
sets
are
dee
med
un
allo
cate
d a
nd
are
no
t co
nsi
der
ed t
o b
e se
gm
ent
asse
ts b
ut
rath
er a
re m
anag
ed b
y H
ead
Offi
ce.
Thes
e am
ou
nts
are
incl
ud
ed in
Hea
d O
ffice
an
d O
ther
Ad
just
men
ts.
The
seg
men
t re
sult
s fo
r th
e ye
ar e
nd
ed 3
0 Se
pte
mb
er 2
015
are
as f
ollo
ws:
Info
rmat
ion
H
ead
Offi
ce
Au
tom
oti
ve
Ener
gy
& T
ech
no
log
y O
ther
&
Oth
er
& In
du
stri
al
Inte
gra
ted
Ind
ust
rial
&
Co
mm
- In
vest
- A
dju
st-
Eq
uip
men
t R
etai
l In
sura
nce
G
ases
u
nic
atio
ns
men
ts
men
ts
Tota
l
$ $
$ $
$ $
$ $
Gro
up
rev
enu
e 2,
537,
489
7,06
0,10
5 34
0,12
2 1,
498,
684
640,
588
543,
507
1,34
0 12
,621
,835
Inte
r-se
gm
ent
reve
nu
e
(150
,857
) (3
71,9
30)
– (1
4,28
8)
(53,
894)
(8
4,68
3)
(1,3
40)
(676
,992
)
Thir
d p
arty
rev
enu
e 2,
386,
632
6,68
8,17
5 34
0,12
2 1,
484,
396
586,
694
458,
824
– 11
,944
,843
Op
erat
ing
pro
fit/
(lo
ss)
bef
ore
fin
ance
co
sts
an
d r
ebra
nd
ing
co
sts
266,
331
404,
071
19,5
75
183,
396
100,
274
75,1
58
(88,
954)
95
9,85
1
Fin
ance
co
sts
– n
et
(10,
368)
(3
6,73
3)
25,4
04
809
(4,3
81)
(2,2
32)
(53,
813)
(8
1,31
4)
255,
963
367,
338
44,9
79
184,
205
95,8
93
72,9
26
(142
,767
) 87
8,53
7
Shar
e o
f re
sult
s o
f as
soci
ates
an
d jo
int
ven
ture
s
bef
ore
tax
, net
of
imp
airm
ent
(No
te 1
0)
(2,9
32)
– (7
4)
48,9
11
(7,6
40)
1,93
7 –
40,2
02
Pro
fit/
(lo
ss)
bef
ore
reb
ran
din
g c
ost
s
an
d in
com
e ta
x 25
3,03
1 36
7,33
8 44
,905
23
3,11
6 88
,253
74
,863
(1
42,7
67)
918,
739
Reb
ran
din
g c
ost
s (3
73)
588
– 35
0 (1
16)
(74)
(1
6)
359
Pro
fit
bef
ore
inco
me
tax
252,
658
367,
926
44,9
05
233,
466
88,1
37
74,7
89
(142
,783
) 91
9,09
8
Taxa
tio
n
(67,
474)
(9
6,73
0)
(13,
631)
(5
9,98
4)
(25,
841)
(1
6,77
4)
29,6
50
(250
,784
)
Pro
fit/
(lo
ss)
for
the
year
18
5,18
4 27
1,19
6 31
,274
17
3,48
2 62
,296
58
,015
(1
13,1
33)
668,
314
5 SE
GM
ENT
INFO
RM
ATI
ON
(co
nti
nu
ed)
The
seg
men
t as
sets
an
d li
abili
ties
at
30 S
epte
mb
er 2
015
and
cap
ital
exp
end
itu
re f
or
the
year
th
en e
nd
ed a
re a
s fo
llow
s:
Info
rmat
ion
H
ead
Offi
ce
Au
tom
oti
ve
Ener
gy
& T
ech
no
log
y O
ther
&
Oth
er
& In
du
stri
al
Inte
gra
ted
Ind
ust
rial
&
Co
mm
- In
vest
- A
dju
st-
Eq
uip
men
t R
etai
l In
sura
nce
G
ases
u
nic
atio
ns
men
ts
men
ts
Tota
l
$
$ $
$ $
$ $
$
Tota
l ass
ets
1,32
0,04
7 3,
409,
178
1,35
9,74
8 1,
261,
751
594,
287
1,28
3,53
2 1,
190,
218
10,4
18,7
61
Inve
stm
ents
in a
sso
ciat
es a
nd
jo
int
ven
ture
s (N
ote
10)
5,
073
6,34
0 16
3 19
7,69
4 51
,168
50
,148
–
310,
586
Tota
l lia
bili
ties
54
7,31
9 1,
375,
380
902,
353
387,
311
202,
295
410,
505
2,00
3,27
1 5,
828,
434
Cap
ital
exp
end
itu
re
187,
005
137,
124
11,1
57
34,8
62
134,
941
17,6
76
2,58
0 52
5,34
5
Oth
er s
egm
ent
item
s in
clu
ded
in t
he
con
solid
ated
inco
me
stat
emen
t ar
e as
fo
llow
s:-
Dep
reci
atio
n a
nd
imp
airm
ent
(No
tes
6 an
d 7
) 10
4,53
5 83
,426
3,
119
35,4
38
29,5
50
13,7
45
2,95
6 27
2,76
9
Imp
airm
ent
of
go
od
will
(N
ote
8)
– 1,
431
– –
– –
– 1,
431
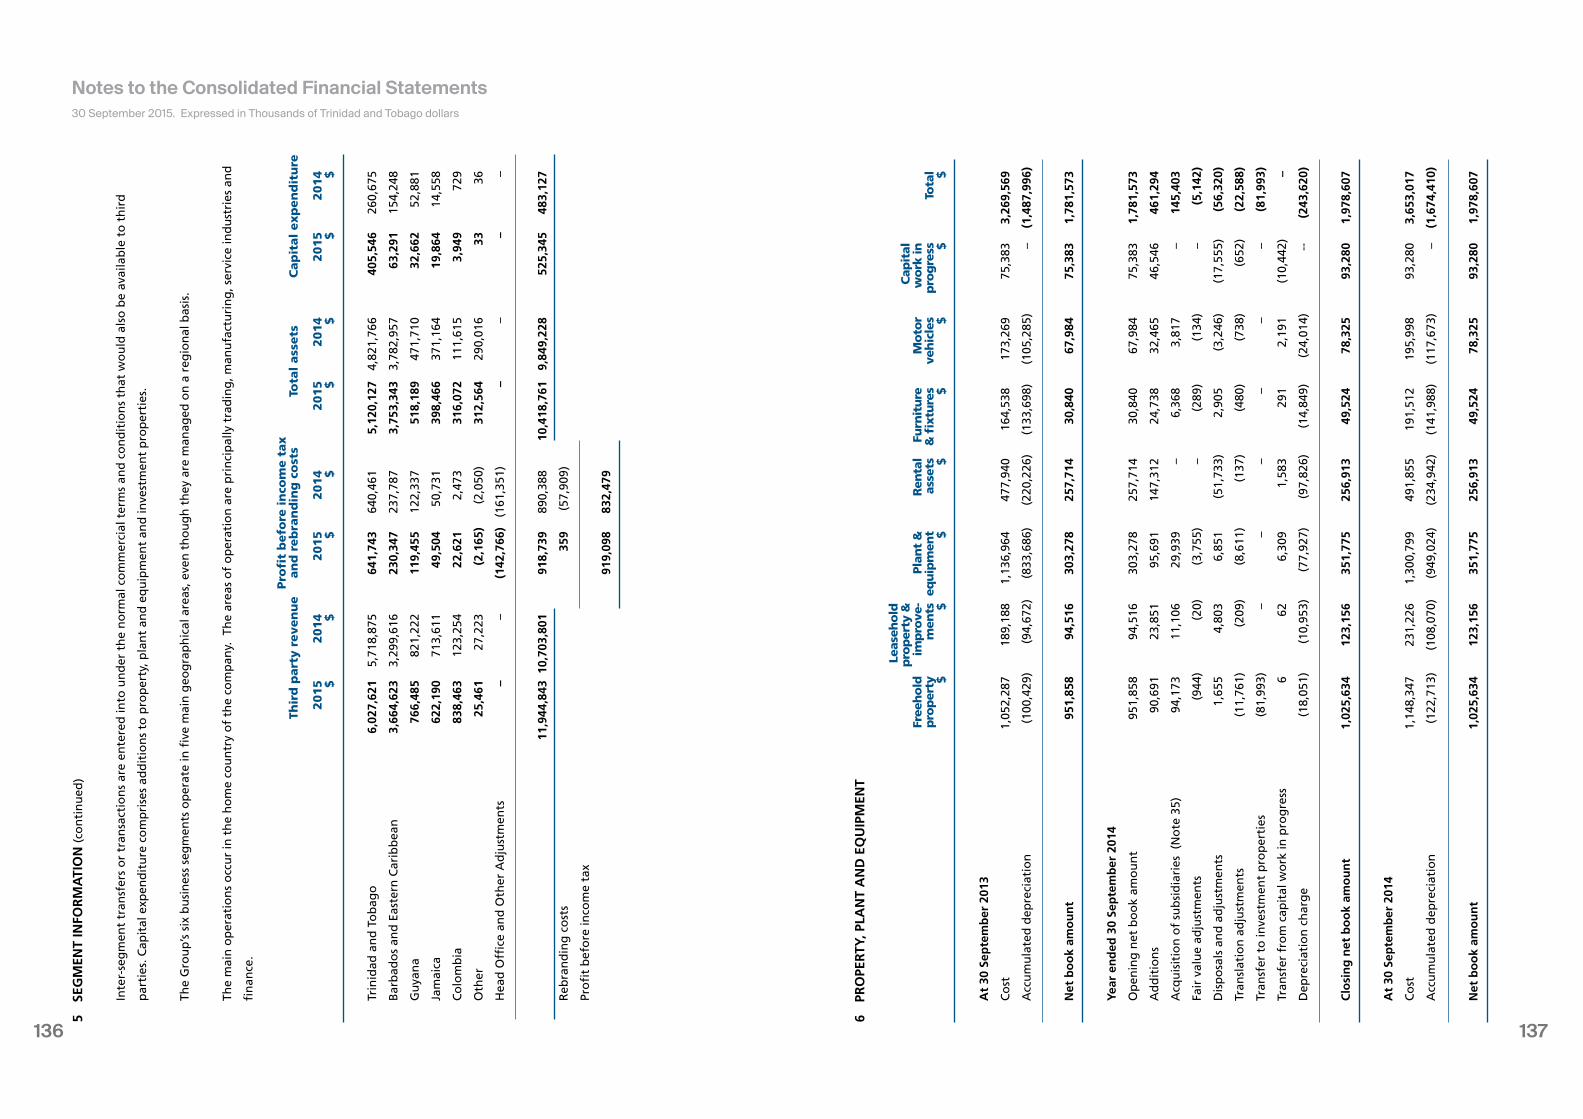
137136
5 SE
GM
ENT
INFO
RM
ATI
ON
(co
nti
nu
ed)
Inte
r-se
gm
ent
tran
sfer
s o
r tr
ansa
ctio
ns
are
ente
red
into
un
der
th
e n
orm
al c
om
mer
cial
ter
ms
and
co
nd
itio
ns
that
wo
uld
als
o b
e av
aila
ble
to
th
ird
par
ties
. Cap
ital
exp
end
itu
re c
om
pri
ses
add
itio
ns
to p
rop
erty
, pla
nt
and
eq
uip
men
t an
d in
vest
men
t p
rop
erti
es.
The
Gro
up
’s s
ix b
usi
nes
s se
gm
ents
op
erat
e in
five
mai
n g
eog
rap
hic
al a
reas
, eve
n t
ho
ug
h t
hey
are
man
aged
on
a r
egio
nal
bas
is.
The
mai
n o
per
atio
ns
occ
ur
in t
he
ho
me
cou
ntr
y o
f th
e co
mp
any.
Th
e ar
eas
of
op
erat
ion
are
pri
nci
pal
ly t
rad
ing
, man
ufa
ctu
rin
g, s
ervi
ce in
du
stri
es a
nd
fin
ance
.
Pro
fit
befo
re i
nco
me t
ax
Thir
d p
art
y r
even
ue
an
d r
eb
ran
din
g c
ost
s To
tal
ass
ets
C
ap
ital
exp
en
dit
ure
2015
2014
2015
2014
2015
2014
2015
2014
$
$
$
$
$
$
$
$
Trin
idad
an
d T
ob
ago
6,
027,
621
5,71
8,87
5 64
1,74
3 64
0,46
1 5,
120,
127
4,82
1,76
6 40
5,54
6 26
0,67
5
Bar
bad
os
and
Eas
tern
Car
ibb
ean
3,
664,
623
3,29
9,61
6 23
0,34
7 23
7,78
7 3,
753,
343
3,78
2,95
7 63
,291
15
4,24
8
Gu
yan
a 76
6,48
5 82
1,22
2 11
9,45
5 12
2,33
7 51
8,18
9 47
1,71
0 32
,662
52
,881
Jam
aica
62
2,19
0 71
3,61
1 49
,504
50
,731
39
8,46
6 37
1,16
4 19
,864
14
,558
Co
lom
bia
83
8,46
3 12
3,25
4 22
,621
2,
473
316,
072
111,
615
3,94
9 72
9
Oth
er
25,4
61
27,2
23
(2,1
65)
(2,0
50)
312,
564
290,
016
33
36
Hea
d O
ffice
an
d O
ther
Ad
just
men
ts
– –
(142
,766
) (1
61,3
51)
– –
– –
11,9
44,8
43 1
0,70
3,80
1 91
8,73
9 89
0,38
8 10
,418
,761
9,
849,
228
525,
345
483,
127
Reb
ran
din
g c
ost
s
35
9 (5
7,90
9)
Pro
fit
bef
ore
inco
me
tax
919,
098
832,
479
30 September 2015. Expressed in Thousands of Trinidad and Tobago dollars
Notes to the Consolidated Financial Statements
6 PR
OPE
RTY
, PLA
NT
AN
D E
QU
IPM
ENT
Le
aseh
old
pro
per
ty &
C
apit
al
Free
ho
ld
imp
rove
- Pl
ant
&
Ren
tal
Furn
itu
re
Mo
tor
w
ork
in
pro
per
ty
men
ts eq
uip
men
t as
sets
&
fixt
ure
s ve
hic
les
pro
gre
ss
Tota
l
$ $
$ $
$ $
$ $
At
30 S
epte
mb
er 2
013
Co
st
1,05
2,28
7 18
9,18
8 1,
136,
964
477,
940
164,
538
173,
269
75,3
83
3,26
9,56
9
Acc
um
ula
ted
dep
reci
atio
n
(100
,429
) (9
4,67
2)
(833
,686
) (2
20,2
26)
(133
,698
) (1
05,2
85)
– (1
,487
,996
)
Net
bo
ok
amo
un
t 95
1,85
8 94
,516
30
3,27
8 25
7,71
4 30
,840
67
,984
75
,383
1,
781,
573
Year
en
ded
30
Sep
tem
ber
201
4
Op
enin
g n
et b
oo
k am
ou
nt
951,
858
94,5
16
303,
278
257,
714
30,8
40
67,9
84
75,3
83
1,78
1,57
3
Ad
dit
ion
s 90
,691
23
,851
95
,691
14
7,31
2 24
,738
32
,465
46
,546
46
1,29
4
Acq
uis
itio
n o
f su
bsi
dia
ries
(N
ote
35)
94
,173
11
,106
29
,939
–
6,36
8 3,
817
– 14
5,40
3
Fair
val
ue
adju
stm
ents
(9
44)
(20)
(3
,755
) –
(289
) (1
34)
– (5
,142
)
Dis
po
sals
an
d a
dju
stm
ents
1,
655
4,80
3 6,
851
(5
1,73
3)
2,90
5 (3
,246
) (1
7,55
5)
(56,
320)
Tran
slat
ion
ad
just
men
ts
(11,
761)
(2
09)
(8,6
11)
(137
) (4
80)
(738
) (6
52)
(22,
588)
Tran
sfer
to
inve
stm
ent
pro
per
ties
(8
1,99
3)
– –
– –
– –
(81,
993)
Tran
sfer
fro
m c
apit
al w
ork
in p
rog
ress
6
62
6,30
9 1,
583
291
2,19
1 (1
0,44
2)
–
Dep
reci
atio
n c
har
ge
(18,
051)
(1
0,95
3)
(77,
927)
(9
7,82
6)
(14,
849)
(2
4,01
4)
--
(243
,620
)
Clo
sin
g n
et b
oo
k am
ou
nt
1,02
5,63
4 12
3,15
6 35
1,77
5 25
6,91
3 49
,524
78
,325
93
,280
1,
978,
607
At
30 S
epte
mb
er 2
014
Co
st
1,14
8,34
7 23
1,22
6 1,
300,
799
491,
855
191,
512
195,
998
93,2
80
3,65
3,01
7
Acc
um
ula
ted
dep
reci
atio
n
(122
,713
) (1
08,0
70)
(949
,024
) (2
34,9
42)
(141
,988
) (1
17,6
73)
– (1
,674
,410
)
Net
bo
ok
amo
un
t 1,
025,
634
123,
156
351,
775
256,
913
49,5
24
78,3
25
93,2
80
1,97
8,60
7
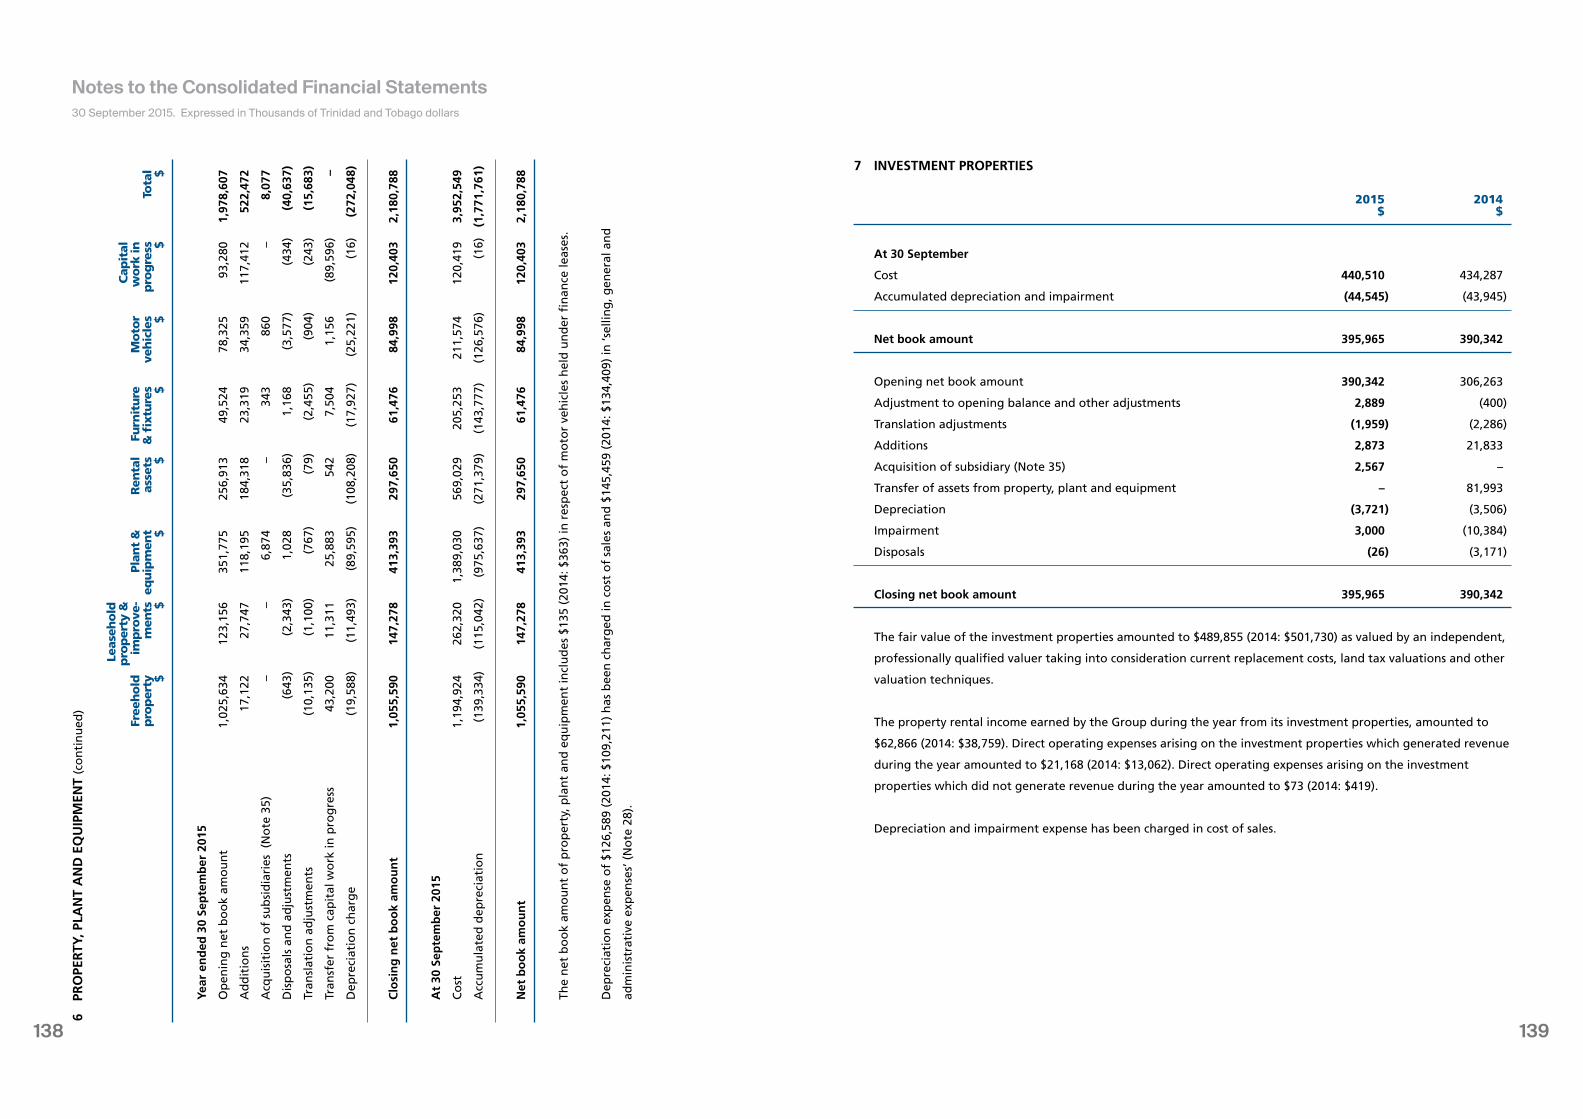
139138
7 INVESTMENT PROPERTIES
2015 2014 $ $
At 30 September
Cost 440,510 434,287
Accumulated depreciation and impairment (44,545) (43,945)
Net book amount 395,965 390,342
Opening net book amount 390,342 306,263
Adjustment to opening balance and other adjustments 2,889 (400)
Translation adjustments (1,959) (2,286)
Additions 2,873 21,833
Acquisition of subsidiary (Note 35) 2,567 –
Transfer of assets from property, plant and equipment – 81,993
Depreciation (3,721) (3,506)
Impairment 3,000 (10,384)
Disposals (26) (3,171)
Closing net book amount 395,965 390,342
The fair value of the investment properties amounted to $489,855 (2014: $501,730) as valued by an independent,
professionally qualified valuer taking into consideration current replacement costs, land tax valuations and other
valuation techniques.
The property rental income earned by the Group during the year from its investment properties, amounted to
$62,866 (2014: $38,759). Direct operating expenses arising on the investment properties which generated revenue
during the year amounted to $21,168 (2014: $13,062). Direct operating expenses arising on the investment
properties which did not generate revenue during the year amounted to $73 (2014: $419).
Depreciation and impairment expense has been charged in cost of sales.
30 September 2015. Expressed in Thousands of Trinidad and Tobago dollars
Notes to the Consolidated Financial Statements6
PRO
PER
TY, P
LAN
T A
ND
EQ
UIP
MEN
T (c
on
tin
ued
)
Le
aseh
old
pro
per
ty &
C
apit
al
Free
ho
ld
imp
rove
- Pl
ant
&
Ren
tal
Furn
itu
re
Mo
tor
w
ork
in
pro
per
ty
men
ts eq
uip
men
t as
sets
&
fixt
ure
s ve
hic
les
pro
gre
ss
Tota
l
$ $
$ $
$ $
$ $
Year
en
ded
30
Sep
tem
ber
201
5
Op
enin
g n
et b
oo
k am
ou
nt
1,02
5,63
4 12
3,15
6 35
1,77
5 25
6,91
3 49
,524
78
,325
93
,280
1,
978,
607
Ad
dit
ion
s 17
,122
27
,747
11
8,19
5 18
4,31
8 23
,319
34
,359
11
7,41
2 52
2,47
2
Acq
uis
itio
n o
f su
bsi
dia
ries
(N
ote
35)
–
– 6,
874
– 34
3 86
0 –
8,07
7
Dis
po
sals
an
d a
dju
stm
ents
(6
43)
(2,3
43)
1,02
8 (3
5,83
6)
1,16
8 (3
,577
) (4
34)
(40,
637)
Tran
slat
ion
ad
just
men
ts
(10,
135)
(1
,100
) (7
67)
(79)
(2
,455
) (9
04)
(243
) (1
5,68
3)
Tran
sfer
fro
m c
apit
al w
ork
in p
rog
ress
43
,200
11
,311
25
,883
54
2 7,
504
1,15
6 (8
9,59
6)
–
Dep
reci
atio
n c
har
ge
(19,
588)
(1
1,49
3)
(89,
595)
(1
08,2
08)
(17,
927)
(2
5,22
1)
(16)
(2
72,0
48)
Clo
sin
g n
et b
oo
k am
ou
nt
1,05
5,59
0 14
7,27
8 41
3,39
3 29
7,65
0 61
,476
84
,998
12
0,40
3 2,
180,
788
At
30 S
epte
mb
er 2
015
Co
st
1,19
4,92
4 26
2,32
0 1,
389,
030
569,
029
205,
253
211,
574
120,
419
3,95
2,54
9
Acc
um
ula
ted
dep
reci
atio
n
(139
,334
) (1
15,0
42)
(975
,637
) (2
71,3
79)
(143
,777
) (1
26,5
76)
(16)
(1
,771
,761
)
Net
bo
ok
amo
un
t 1,
055,
590
147,
278
413,
393
297,
650
61,4
76
84,9
98
120,
403
2,18
0,78
8
The
net
bo
ok
amo
un
t o
f p
rop
erty
, pla
nt
and
eq
uip
men
t in
clu
des
$13
5 (2
014:
$36
3) in
res
pec
t o
f m
oto
r ve
hic
les
hel
d u
nd
er fi
nan
ce le
ases
.
Dep
reci
atio
n e
xpen
se o
f $1
26,5
89 (
2014
: $10
9,21
1) h
as b
een
ch
arg
ed in
co
st o
f sa
les
and
$14
5,45
9 (2
014:
$13
4,40
9) in
‘sel
ling
, gen
eral
an
d
adm
inis
trat
ive
exp
ense
s’ (
No
te 2
8).
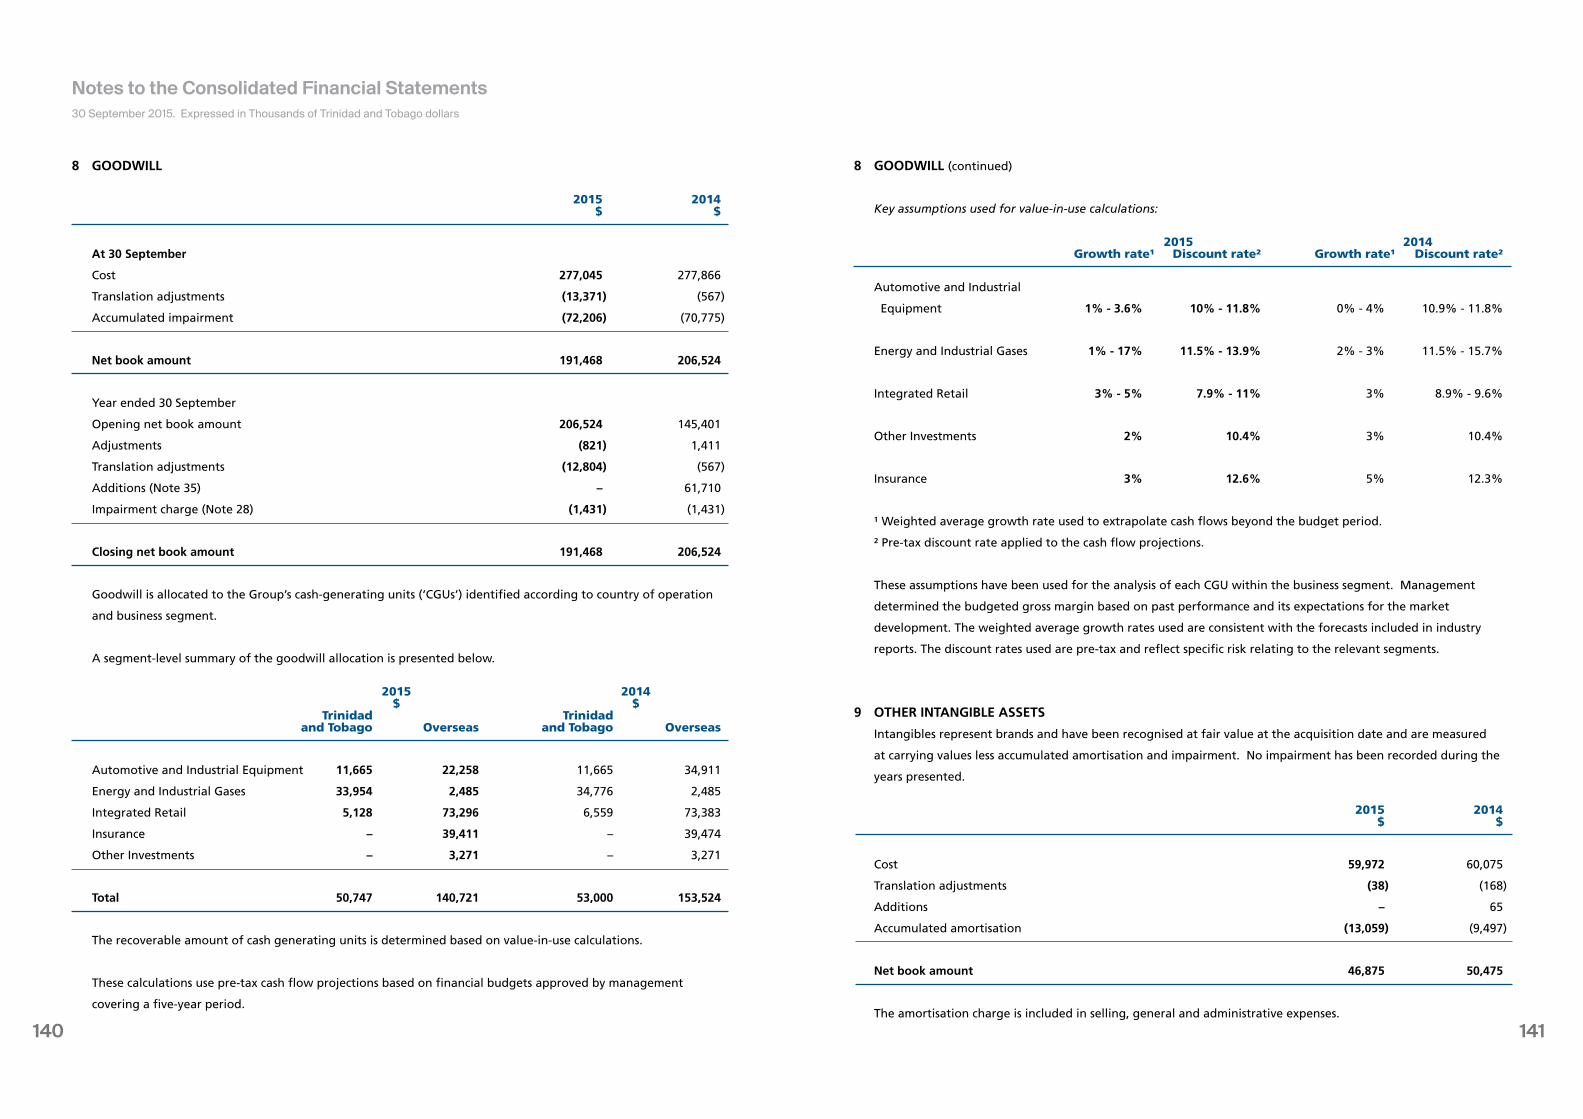
141140
8 GOODWILL
2015 2014 $ $
At 30 September
Cost 277,045 277,866
Translation adjustments (13,371) (567)
Accumulated impairment (72,206) (70,775)
Net book amount 191,468 206,524
Year ended 30 September
Opening net book amount 206,524 145,401
Adjustments (821) 1,411
Translation adjustments (12,804) (567)
Additions (Note 35) – 61,710
Impairment charge (Note 28) (1,431) (1,431)
Closing net book amount 191,468 206,524
Goodwill is allocated to the Group’s cash-generating units (‘CGUs’) identified according to country of operation
and business segment.
A segment-level summary of the goodwill allocation is presented below.
2015 2014 $ $ Trinidad Trinidad and Tobago Overseas and Tobago Overseas
Automotive and Industrial Equipment 11,665 22,258 11,665 34,911
Energy and Industrial Gases 33,954 2,485 34,776 2,485
Integrated Retail 5,128 73,296 6,559 73,383
Insurance – 39,411 – 39,474
Other Investments – 3,271 – 3,271
Total 50,747 140,721 53,000 153,524
The recoverable amount of cash generating units is determined based on value-in-use calculations.
These calculations use pre-tax cash flow projections based on financial budgets approved by management
covering a five-year period.
8 GOODWILL (continued)
Key assumptions used for value-in-use calculations:
2015 2014 Growth rate¹ Discount rate² Growth rate¹ Discount rate²
Automotive and Industrial
Equipment 1% - 3.6% 10% - 11.8% 0% - 4% 10.9% - 11.8%
Energy and Industrial Gases 1% - 17% 11.5% - 13.9% 2% - 3% 11.5% - 15.7%
Integrated Retail 3% - 5% 7.9% - 11% 3% 8.9% - 9.6%
Other Investments 2% 10.4% 3% 10.4%
Insurance 3% 12.6% 5% 12.3%
¹ Weighted average growth rate used to extrapolate cash flows beyond the budget period.
² Pre-tax discount rate applied to the cash flow projections.
These assumptions have been used for the analysis of each CGU within the business segment. Management
determined the budgeted gross margin based on past performance and its expectations for the market
development. The weighted average growth rates used are consistent with the forecasts included in industry
reports. The discount rates used are pre-tax and reflect specific risk relating to the relevant segments.
9 OTHER INTANGIBLE ASSETS
Intangibles represent brands and have been recognised at fair value at the acquisition date and are measured
at carrying values less accumulated amortisation and impairment. No impairment has been recorded during the
years presented.
2015 2014 $ $
Cost 59,972 60,075
Translation adjustments (38) (168)
Additions – 65
Accumulated amortisation (13,059) (9,497)
Net book amount 46,875 50,475
The amortisation charge is included in selling, general and administrative expenses.
30 September 2015. Expressed in Thousands of Trinidad and Tobago dollars
Notes to the Consolidated Financial Statements
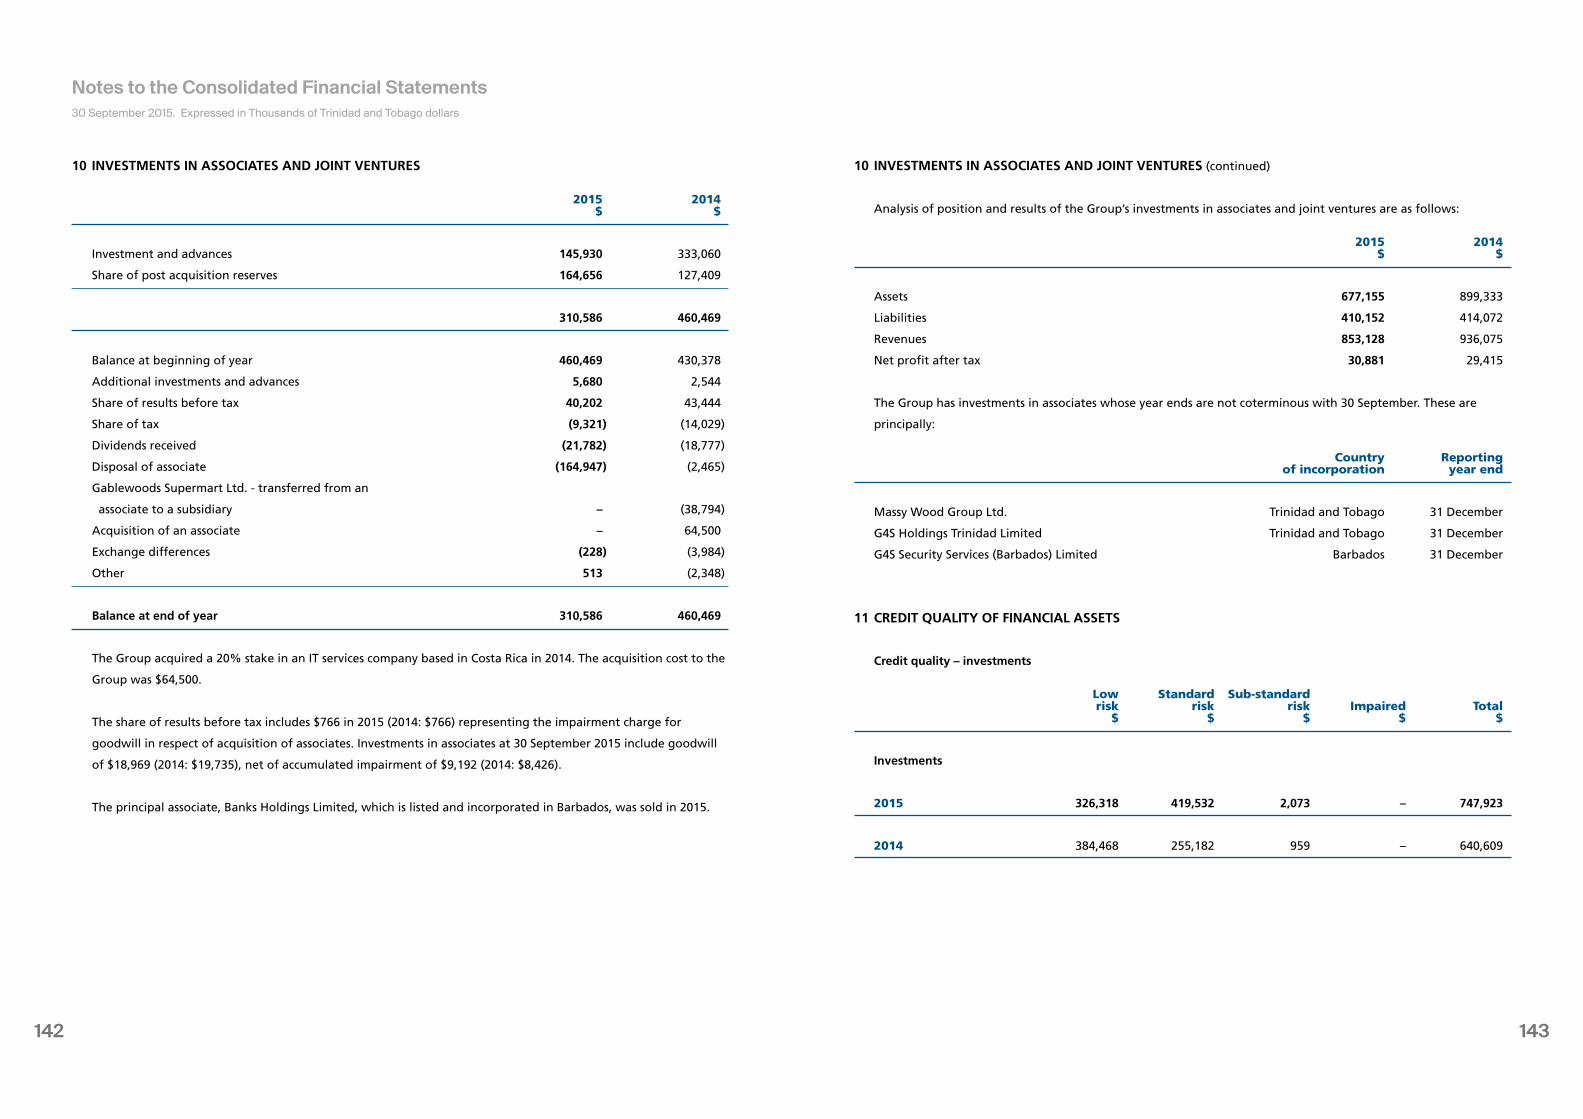
143142
10 INVESTMENTS IN ASSOCIATES AND JOINT VENTURES
2015 2014 $ $
Investment and advances 145,930 333,060
Share of post acquisition reserves 164,656 127,409
310,586 460,469
Balance at beginning of year 460,469 430,378
Additional investments and advances 5,680 2,544
Share of results before tax 40,202 43,444
Share of tax (9,321) (14,029)
Dividends received (21,782) (18,777)
Disposal of associate (164,947) (2,465)
Gablewoods Supermart Ltd. - transferred from an
associate to a subsidiary – (38,794)
Acquisition of an associate – 64,500
Exchange differences (228) (3,984)
Other 513 (2,348)
Balance at end of year 310,586 460,469
The Group acquired a 20% stake in an IT services company based in Costa Rica in 2014. The acquisition cost to the
Group was $64,500.
The share of results before tax includes $766 in 2015 (2014: $766) representing the impairment charge for
goodwill in respect of acquisition of associates. Investments in associates at 30 September 2015 include goodwill
of $18,969 (2014: $19,735), net of accumulated impairment of $9,192 (2014: $8,426).
The principal associate, Banks Holdings Limited, which is listed and incorporated in Barbados, was sold in 2015.
10 INVESTMENTS IN ASSOCIATES AND JOINT VENTURES (continued)
Analysis of position and results of the Group’s investments in associates and joint ventures are as follows:
2015 2014 $ $
Assets 677,155 899,333
Liabilities 410,152 414,072
Revenues 853,128 936,075
Net profit after tax 30,881 29,415
The Group has investments in associates whose year ends are not coterminous with 30 September. These are
principally:
Country Reporting of incorporation year end
Massy Wood Group Ltd. Trinidad and Tobago 31 December
G4S Holdings Trinidad Limited Trinidad and Tobago 31 December
G4S Security Services (Barbados) Limited Barbados 31 December
11 CREDIT QUALITY OF FINANCIAL ASSETS
Credit quality – investments
Low Standard Sub-standard risk risk risk Impaired Total $ $ $ $ $
Investments
2015 326,318 419,532 2,073 – 747,923
2014 384,468 255,182 959 – 640,609
30 September 2015. Expressed in Thousands of Trinidad and Tobago dollars
Notes to the Consolidated Financial Statements
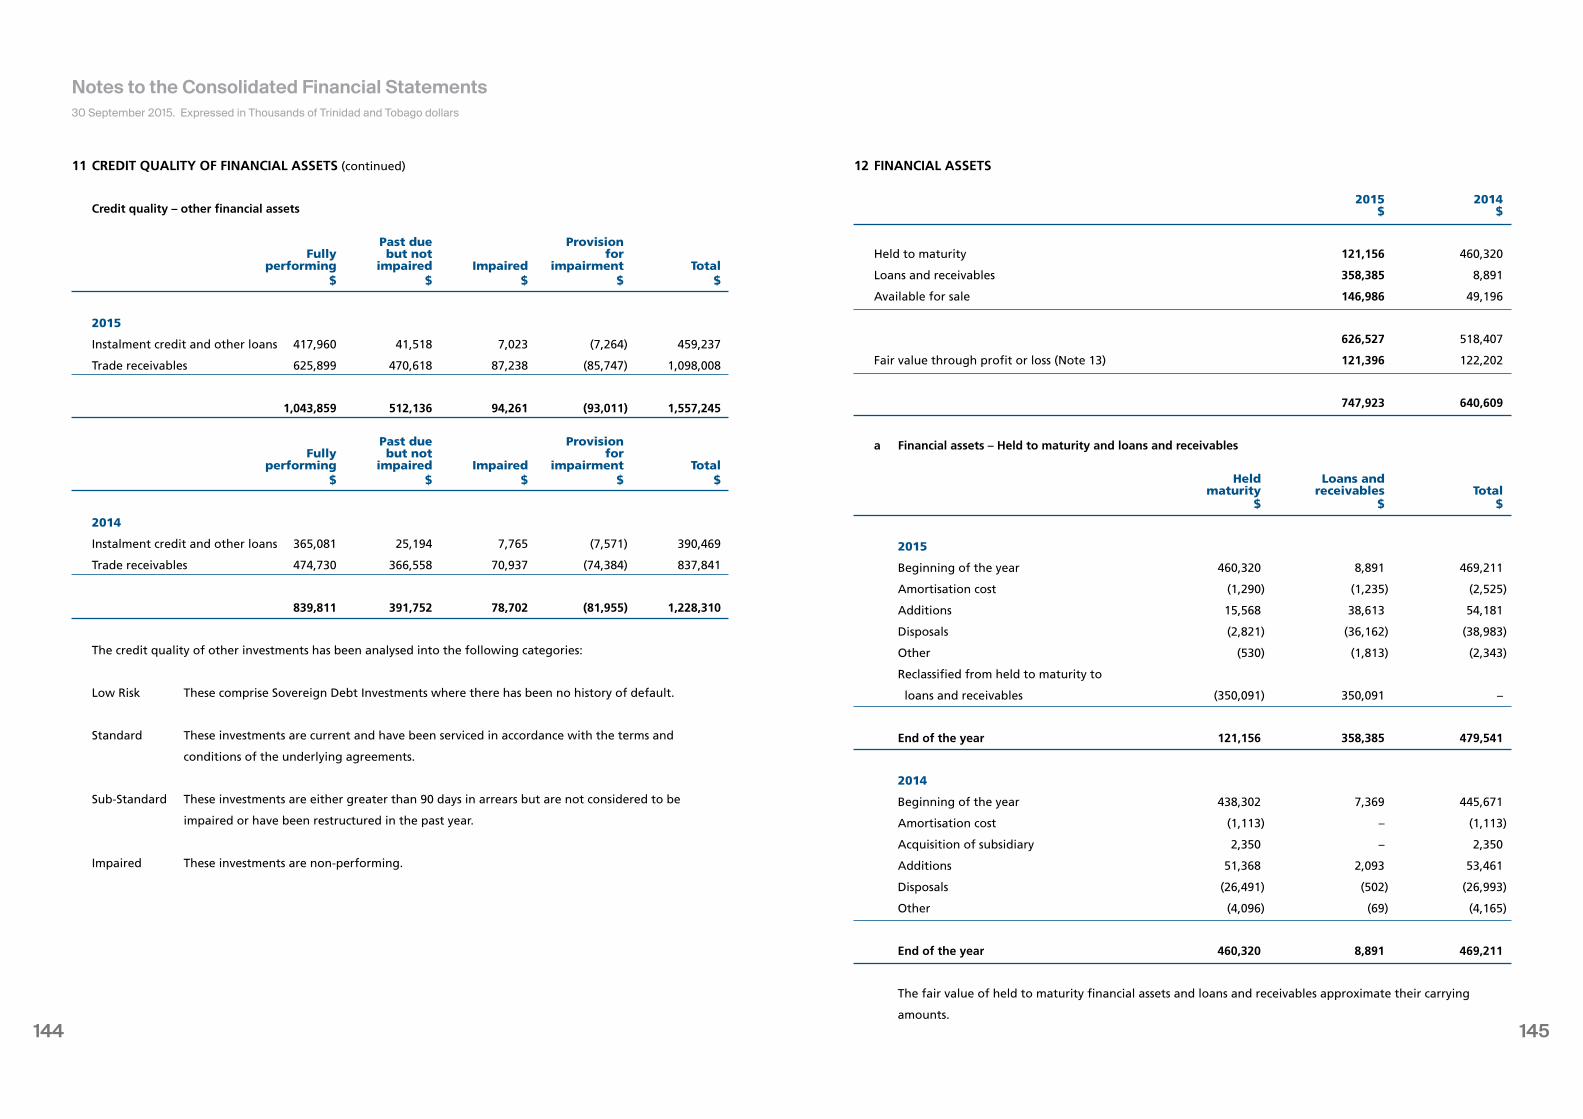
145144
11 CREDIT QUALITY OF FINANCIAL ASSETS (continued)
Credit quality – other financial assets
Past due Provision Fully but not for performing impaired Impaired impairment Total $ $ $ $ $
2015
Instalment credit and other loans 417,960 41,518 7,023 (7,264) 459,237
Trade receivables 625,899 470,618 87,238 (85,747) 1,098,008
1,043,859 512,136 94,261 (93,011) 1,557,245
Past due Provision Fully but not for performing impaired Impaired impairment Total $ $ $ $ $
2014
Instalment credit and other loans 365,081 25,194 7,765 (7,571) 390,469
Trade receivables 474,730 366,558 70,937 (74,384) 837,841
839,811 391,752 78,702 (81,955) 1,228,310
The credit quality of other investments has been analysed into the following categories:
Low Risk These comprise Sovereign Debt Investments where there has been no history of default.
Standard These investments are current and have been serviced in accordance with the terms and
conditions of the underlying agreements.
Sub-Standard These investments are either greater than 90 days in arrears but are not considered to be
impaired or have been restructured in the past year.
Impaired These investments are non-performing.
12 FINANCIAL ASSETS
2015 2014 $ $
Held to maturity 121,156 460,320
Loans and receivables 358,385 8,891
Available for sale 146,986 49,196
626,527 518,407
Fair value through profit or loss (Note 13) 121,396 122,202
747,923 640,609
a Financial assets – Held to maturity and loans and receivables
Held Loans and maturity receivables Total $ $ $
2015
Beginning of the year 460,320 8,891 469,211
Amortisation cost (1,290) (1,235) (2,525)
Additions 15,568 38,613 54,181
Disposals (2,821) (36,162) (38,983)
Other (530) (1,813) (2,343)
Reclassified from held to maturity to
loans and receivables (350,091) 350,091 –
End of the year 121,156 358,385 479,541
2014
Beginning of the year 438,302 7,369 445,671
Amortisation cost (1,113) – (1,113)
Acquisition of subsidiary 2,350 – 2,350
Additions 51,368 2,093 53,461
Disposals (26,491) (502) (26,993)
Other (4,096) (69) (4,165)
End of the year 460,320 8,891 469,211
The fair value of held to maturity financial assets and loans and receivables approximate their carrying
amounts.
30 September 2015. Expressed in Thousands of Trinidad and Tobago dollars
Notes to the Consolidated Financial Statements
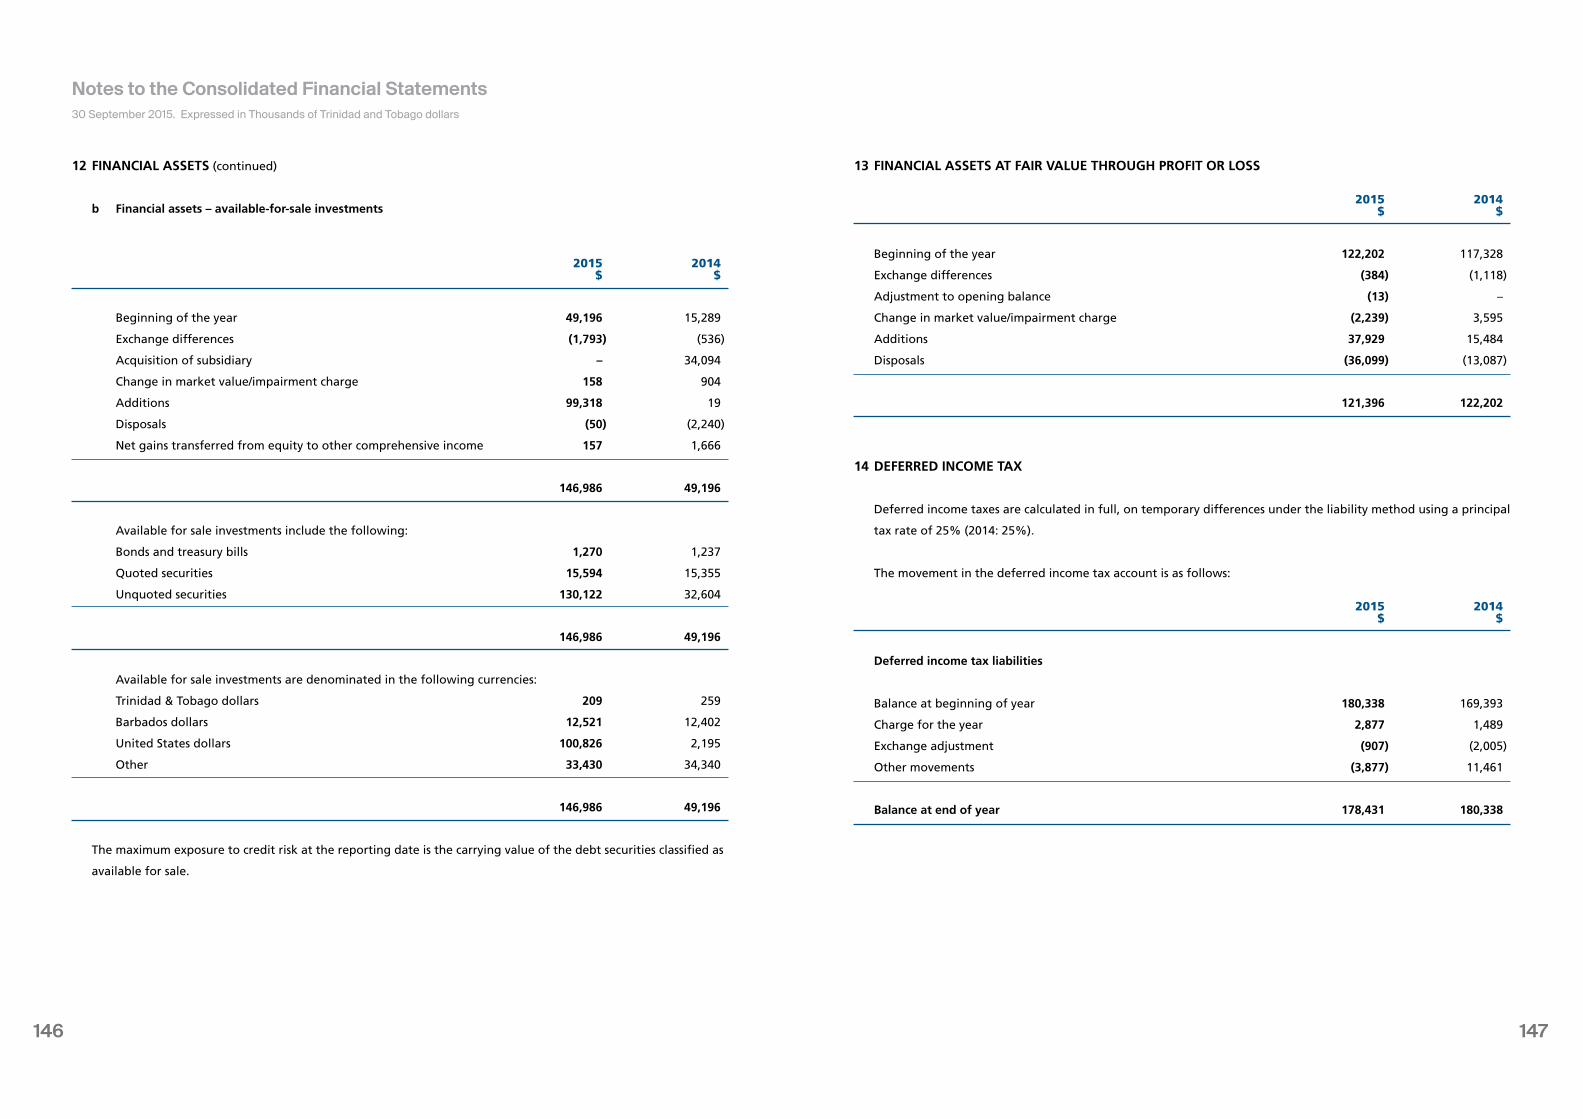
147146
12 FINANCIAL ASSETS (continued)
b Financial assets – available-for-sale investments
2015 2014 $ $
Beginning of the year 49,196 15,289
Exchange differences (1,793) (536)
Acquisition of subsidiary – 34,094
Change in market value/impairment charge 158 904
Additions 99,318 19
Disposals (50) (2,240)
Net gains transferred from equity to other comprehensive income 157 1,666
146,986 49,196
Available for sale investments include the following:
Bonds and treasury bills 1,270 1,237
Quoted securities 15,594 15,355
Unquoted securities 130,122 32,604
146,986 49,196
Available for sale investments are denominated in the following currencies:
Trinidad & Tobago dollars 209 259
Barbados dollars 12,521 12,402
United States dollars 100,826 2,195
Other 33,430 34,340
146,986 49,196
The maximum exposure to credit risk at the reporting date is the carrying value of the debt securities classified as
available for sale.
13 FINANCIAL ASSETS AT FAIR VALUE THROUGH PROFIT OR LOSS
2015 2014 $ $
Beginning of the year 122,202 117,328
Exchange differences (384) (1,118)
Adjustment to opening balance (13) –
Change in market value/impairment charge (2,239) 3,595
Additions 37,929 15,484
Disposals (36,099) (13,087)
121,396 122,202
14 DEFERRED INCOME TAX
Deferred income taxes are calculated in full, on temporary differences under the liability method using a principal
tax rate of 25% (2014: 25%).
The movement in the deferred income tax account is as follows:
2015 2014 $ $
Deferred income tax liabilities
Balance at beginning of year 180,338 169,393
Charge for the year 2,877 1,489
Exchange adjustment (907) (2,005)
Other movements (3,877) 11,461
Balance at end of year 178,431 180,338
30 September 2015. Expressed in Thousands of Trinidad and Tobago dollars
Notes to the Consolidated Financial Statements
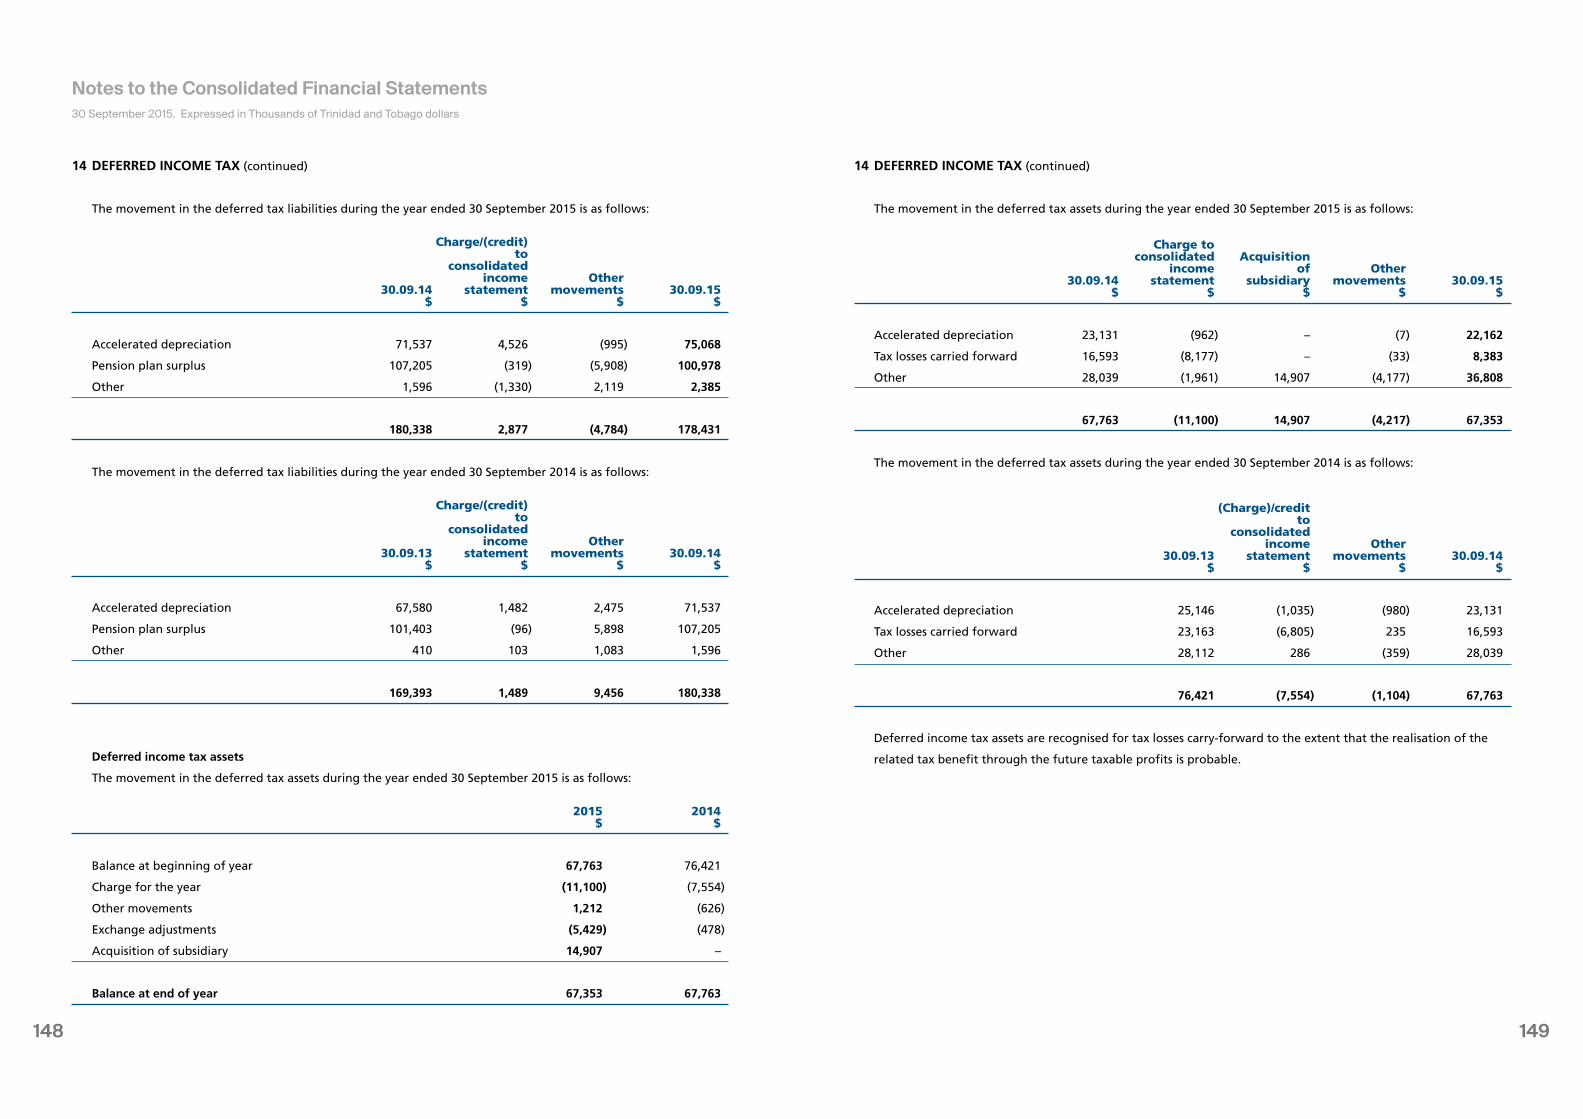
149148
14 DEFERRED INCOME TAX (continued)
The movement in the deferred tax liabilities during the year ended 30 September 2015 is as follows:
Charge/(credit) to consolidated income Other 30.09.14 statement movements 30.09.15 $ $ $ $
Accelerated depreciation 71,537 4,526 (995) 75,068
Pension plan surplus 107,205 (319) (5,908) 100,978
Other 1,596 (1,330) 2,119 2,385
180,338 2,877 (4,784) 178,431
The movement in the deferred tax liabilities during the year ended 30 September 2014 is as follows:
Charge/(credit) to consolidated income Other 30.09.13 statement movements 30.09.14 $ $ $ $
Accelerated depreciation 67,580 1,482 2,475 71,537
Pension plan surplus 101,403 (96) 5,898 107,205
Other 410 103 1,083 1,596
169,393 1,489 9,456 180,338
Deferred income tax assets
The movement in the deferred tax assets during the year ended 30 September 2015 is as follows:
2015 2014 $ $
Balance at beginning of year 67,763 76,421
Charge for the year (11,100) (7,554)
Other movements 1,212 (626)
Exchange adjustments (5,429) (478)
Acquisition of subsidiary 14,907 –
Balance at end of year 67,353 67,763
14 DEFERRED INCOME TAX (continued)
The movement in the deferred tax assets during the year ended 30 September 2015 is as follows:
Charge to consolidated Acquisition income of Other 30.09.14 statement subsidiary movements 30.09.15 $ $ $ $ $
Accelerated depreciation 23,131 (962) – (7) 22,162
Tax losses carried forward 16,593 (8,177) – (33) 8,383
Other 28,039 (1,961) 14,907 (4,177) 36,808
67,763 (11,100) 14,907 (4,217) 67,353
The movement in the deferred tax assets during the year ended 30 September 2014 is as follows:
(Charge)/credit to consolidated income Other 30.09.13 statement movements 30.09.14 $ $ $ $
Accelerated depreciation 25,146 (1,035) (980) 23,131
Tax losses carried forward 23,163 (6,805) 235 16,593
Other 28,112 286 (359) 28,039
76,421 (7,554) (1,104) 67,763
Deferred income tax assets are recognised for tax losses carry-forward to the extent that the realisation of the
related tax benefit through the future taxable profits is probable.
30 September 2015. Expressed in Thousands of Trinidad and Tobago dollars
Notes to the Consolidated Financial Statements
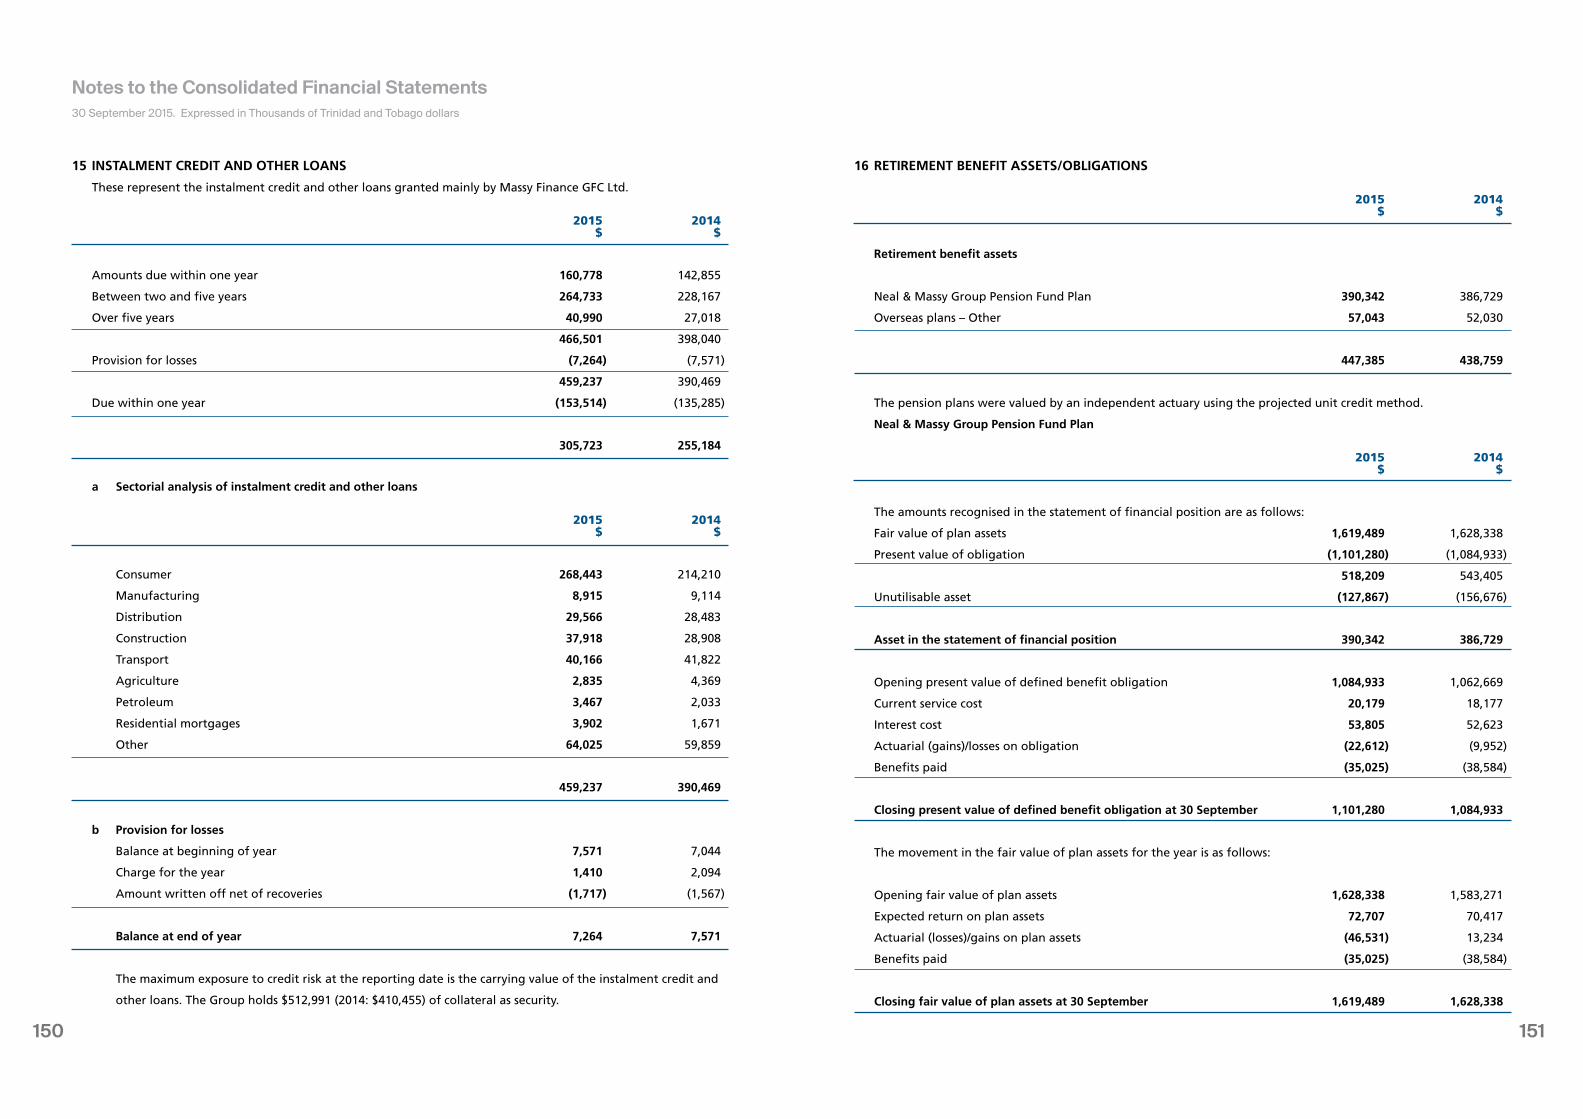
151150
15 INSTALMENT CREDIT AND OTHER LOANS
These represent the instalment credit and other loans granted mainly by Massy Finance GFC Ltd.
2015 2014 $ $
Amounts due within one year 160,778 142,855
Between two and five years 264,733 228,167
Over five years 40,990 27,018
466,501 398,040
Provision for losses (7,264) (7,571)
459,237 390,469
Due within one year (153,514) (135,285)
305,723 255,184
a Sectorial analysis of instalment credit and other loans
2015 2014 $ $
Consumer 268,443 214,210
Manufacturing 8,915 9,114
Distribution 29,566 28,483
Construction 37,918 28,908
Transport 40,166 41,822
Agriculture 2,835 4,369
Petroleum 3,467 2,033
Residential mortgages 3,902 1,671
Other 64,025 59,859
459,237 390,469
b Provision for losses
Balance at beginning of year 7,571 7,044
Charge for the year 1,410 2,094
Amount written off net of recoveries (1,717) (1,567)
Balance at end of year 7,264 7,571
The maximum exposure to credit risk at the reporting date is the carrying value of the instalment credit and
other loans. The Group holds $512,991 (2014: $410,455) of collateral as security.
16 RETIREMENT BENEFIT ASSETS/OBLIGATIONS
2015 2014 $ $
Retirement benefit assets
Neal & Massy Group Pension Fund Plan 390,342 386,729
Overseas plans – Other 57,043 52,030
447,385 438,759
The pension plans were valued by an independent actuary using the projected unit credit method.
Neal & Massy Group Pension Fund Plan
2015 2014 $ $
The amounts recognised in the statement of financial position are as follows:
Fair value of plan assets 1,619,489 1,628,338
Present value of obligation (1,101,280) (1,084,933)
518,209 543,405
Unutilisable asset (127,867) (156,676)
Asset in the statement of financial position 390,342 386,729
Opening present value of defined benefit obligation 1,084,933 1,062,669
Current service cost 20,179 18,177
Interest cost 53,805 52,623
Actuarial (gains)/losses on obligation (22,612) (9,952)
Benefits paid (35,025) (38,584)
Closing present value of defined benefit obligation at 30 September 1,101,280 1,084,933
The movement in the fair value of plan assets for the year is as follows:
Opening fair value of plan assets 1,628,338 1,583,271
Expected return on plan assets 72,707 70,417
Actuarial (losses)/gains on plan assets (46,531) 13,234
Benefits paid (35,025) (38,584)
Closing fair value of plan assets at 30 September 1,619,489 1,628,338
30 September 2015. Expressed in Thousands of Trinidad and Tobago dollars
Notes to the Consolidated Financial Statements
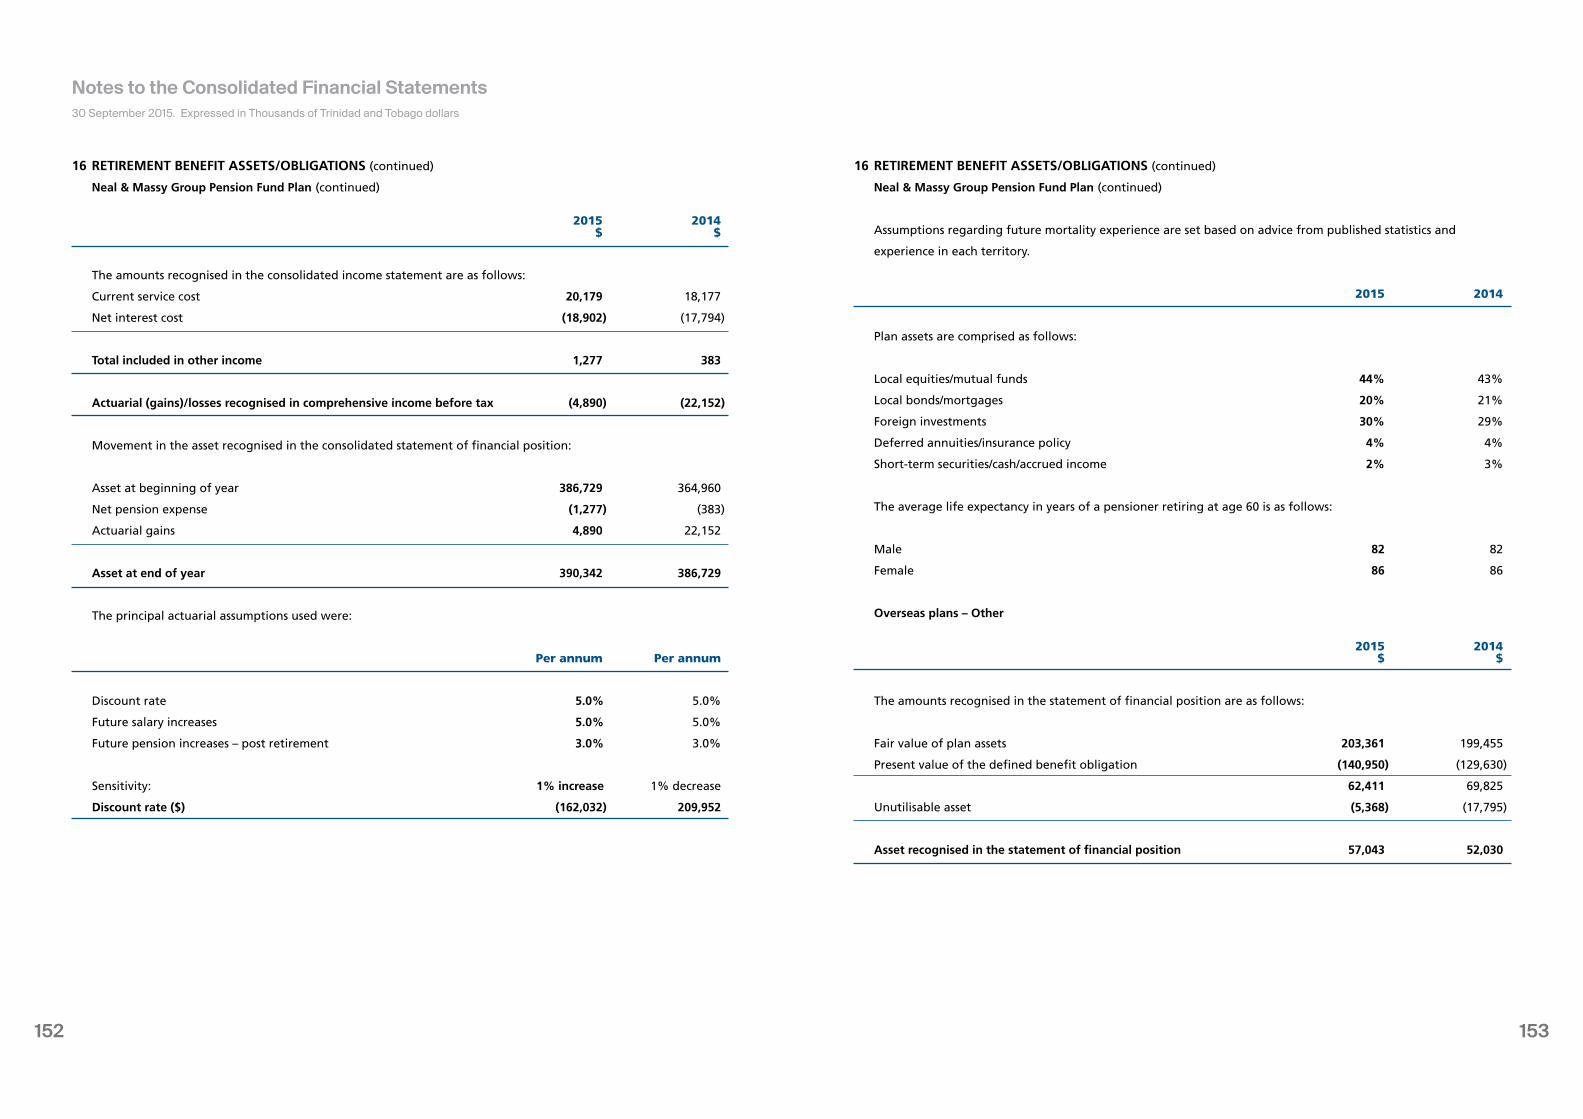
153152
16 RETIREMENT BENEFIT ASSETS/OBLIGATIONS (continued)
Neal & Massy Group Pension Fund Plan (continued)
2015 2014 $ $
The amounts recognised in the consolidated income statement are as follows:
Current service cost 20,179 18,177
Net interest cost (18,902) (17,794)
Total included in other income 1,277 383
Actuarial (gains)/losses recognised in comprehensive income before tax (4,890) (22,152)
Movement in the asset recognised in the consolidated statement of financial position:
Asset at beginning of year 386,729 364,960
Net pension expense (1,277) (383)
Actuarial gains 4,890 22,152
Asset at end of year 390,342 386,729
The principal actuarial assumptions used were:
Per annum Per annum
Discount rate 5.0% 5.0%
Future salary increases 5.0% 5.0%
Future pension increases – post retirement 3.0% 3.0%
Sensitivity: 1% increase 1% decrease
Discount rate ($) (162,032) 209,952
16 RETIREMENT BENEFIT ASSETS/OBLIGATIONS (continued)
Neal & Massy Group Pension Fund Plan (continued)
Assumptions regarding future mortality experience are set based on advice from published statistics and
experience in each territory.
2015 2014
Plan assets are comprised as follows:
Local equities/mutual funds 44% 43%
Local bonds/mortgages 20% 21%
Foreign investments 30% 29%
Deferred annuities/insurance policy 4% 4%
Short-term securities/cash/accrued income 2% 3%
The average life expectancy in years of a pensioner retiring at age 60 is as follows:
Male 82 82
Female 86 86
Overseas plans – Other
2015 2014 $ $
The amounts recognised in the statement of financial position are as follows:
Fair value of plan assets 203,361 199,455
Present value of the defined benefit obligation (140,950) (129,630)
62,411 69,825
Unutilisable asset (5,368) (17,795)
Asset recognised in the statement of financial position 57,043 52,030
30 September 2015. Expressed in Thousands of Trinidad and Tobago dollars
Notes to the Consolidated Financial Statements
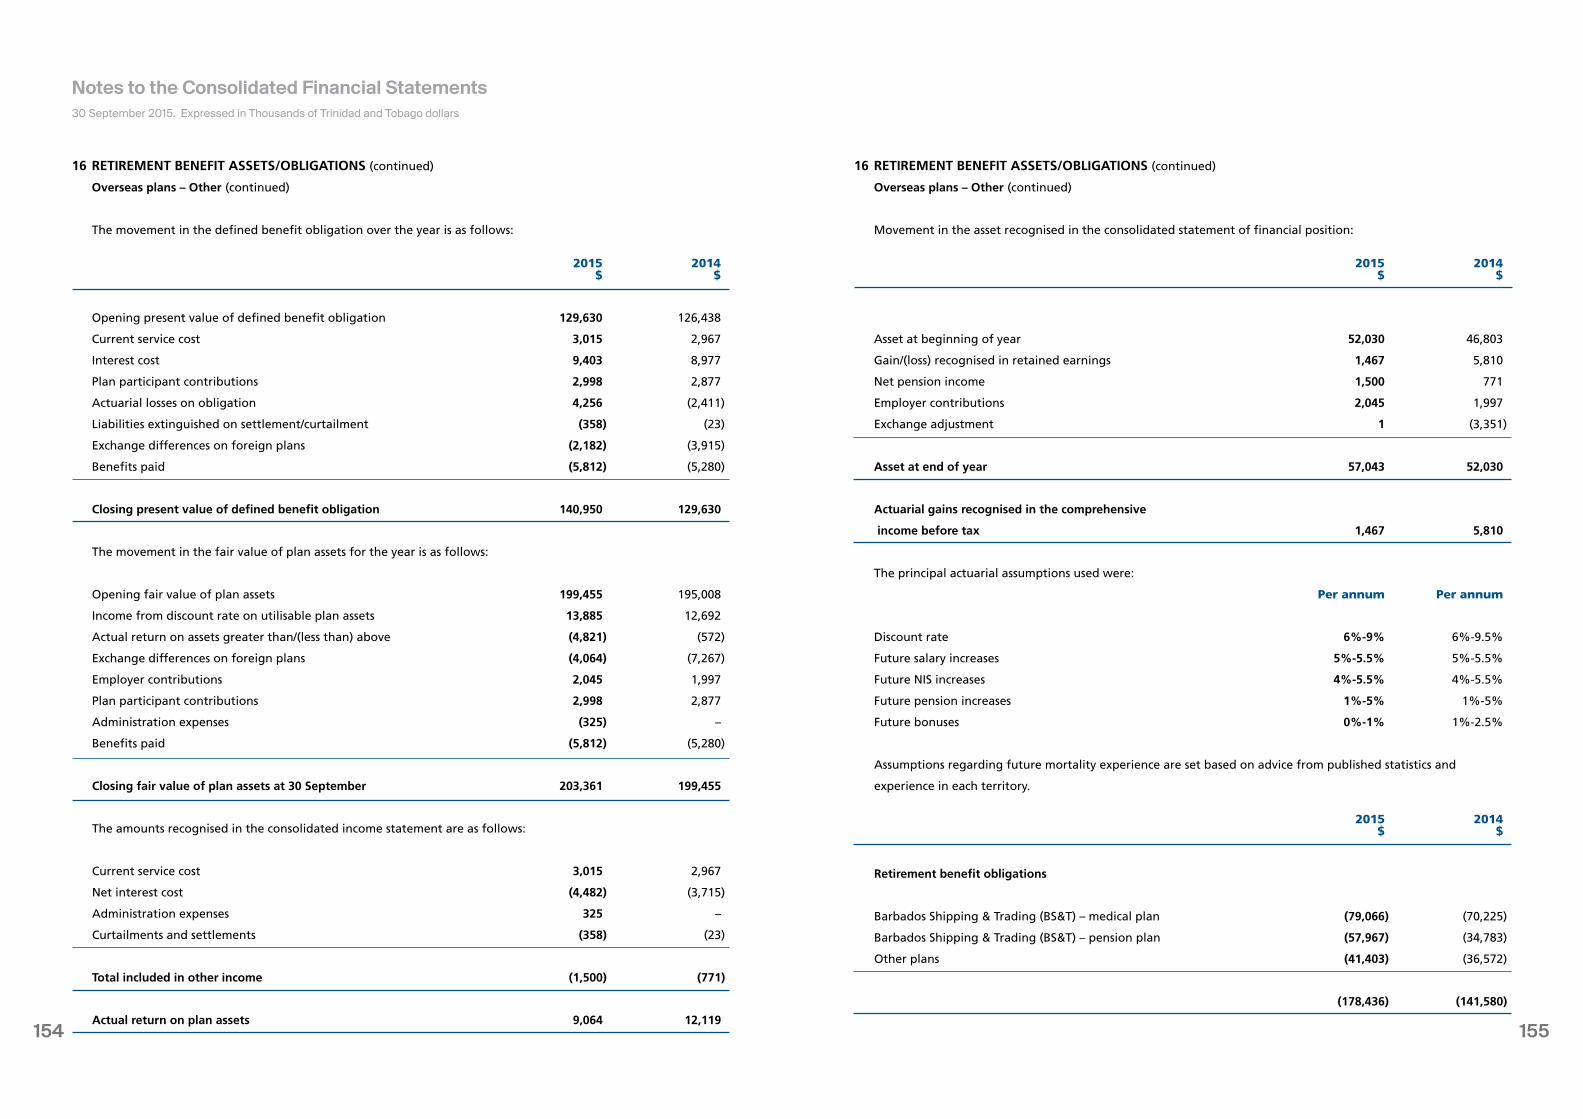
155154
16 RETIREMENT BENEFIT ASSETS/OBLIGATIONS (continued)
Overseas plans – Other (continued)
The movement in the defined benefit obligation over the year is as follows:
2015 2014 $ $
Opening present value of defined benefit obligation 129,630 126,438
Current service cost 3,015 2,967
Interest cost 9,403 8,977
Plan participant contributions 2,998 2,877
Actuarial losses on obligation 4,256 (2,411)
Liabilities extinguished on settlement/curtailment (358) (23)
Exchange differences on foreign plans (2,182) (3,915)
Benefits paid (5,812) (5,280)
Closing present value of defined benefit obligation 140,950 129,630
The movement in the fair value of plan assets for the year is as follows:
Opening fair value of plan assets 199,455 195,008
Income from discount rate on utilisable plan assets 13,885 12,692
Actual return on assets greater than/(less than) above (4,821) (572)
Exchange differences on foreign plans (4,064) (7,267)
Employer contributions 2,045 1,997
Plan participant contributions 2,998 2,877
Administration expenses (325) –
Benefits paid (5,812) (5,280)
Closing fair value of plan assets at 30 September 203,361 199,455
The amounts recognised in the consolidated income statement are as follows:
Current service cost 3,015 2,967
Net interest cost (4,482) (3,715)
Administration expenses 325 –
Curtailments and settlements (358) (23)
Total included in other income (1,500) (771)
Actual return on plan assets 9,064 12,119
16 RETIREMENT BENEFIT ASSETS/OBLIGATIONS (continued)
Overseas plans – Other (continued)
Movement in the asset recognised in the consolidated statement of financial position:
2015 2014 $ $
Asset at beginning of year 52,030 46,803
Gain/(loss) recognised in retained earnings 1,467 5,810
Net pension income 1,500 771
Employer contributions 2,045 1,997
Exchange adjustment 1 (3,351)
Asset at end of year 57,043 52,030
Actuarial gains recognised in the comprehensive
income before tax 1,467 5,810
The principal actuarial assumptions used were:
Per annum Per annum
Discount rate 6%-9% 6%-9.5%
Future salary increases 5%-5.5% 5%-5.5%
Future NIS increases 4%-5.5% 4%-5.5%
Future pension increases 1%-5% 1%-5%
Future bonuses 0%-1% 1%-2.5%
Assumptions regarding future mortality experience are set based on advice from published statistics and
experience in each territory.
2015 2014 $ $
Retirement benefit obligations
Barbados Shipping & Trading (BS&T) – medical plan (79,066) (70,225)
Barbados Shipping & Trading (BS&T) – pension plan (57,967) (34,783)
Other plans (41,403) (36,572)
(178,436) (141,580)
30 September 2015. Expressed in Thousands of Trinidad and Tobago dollars
Notes to the Consolidated Financial Statements
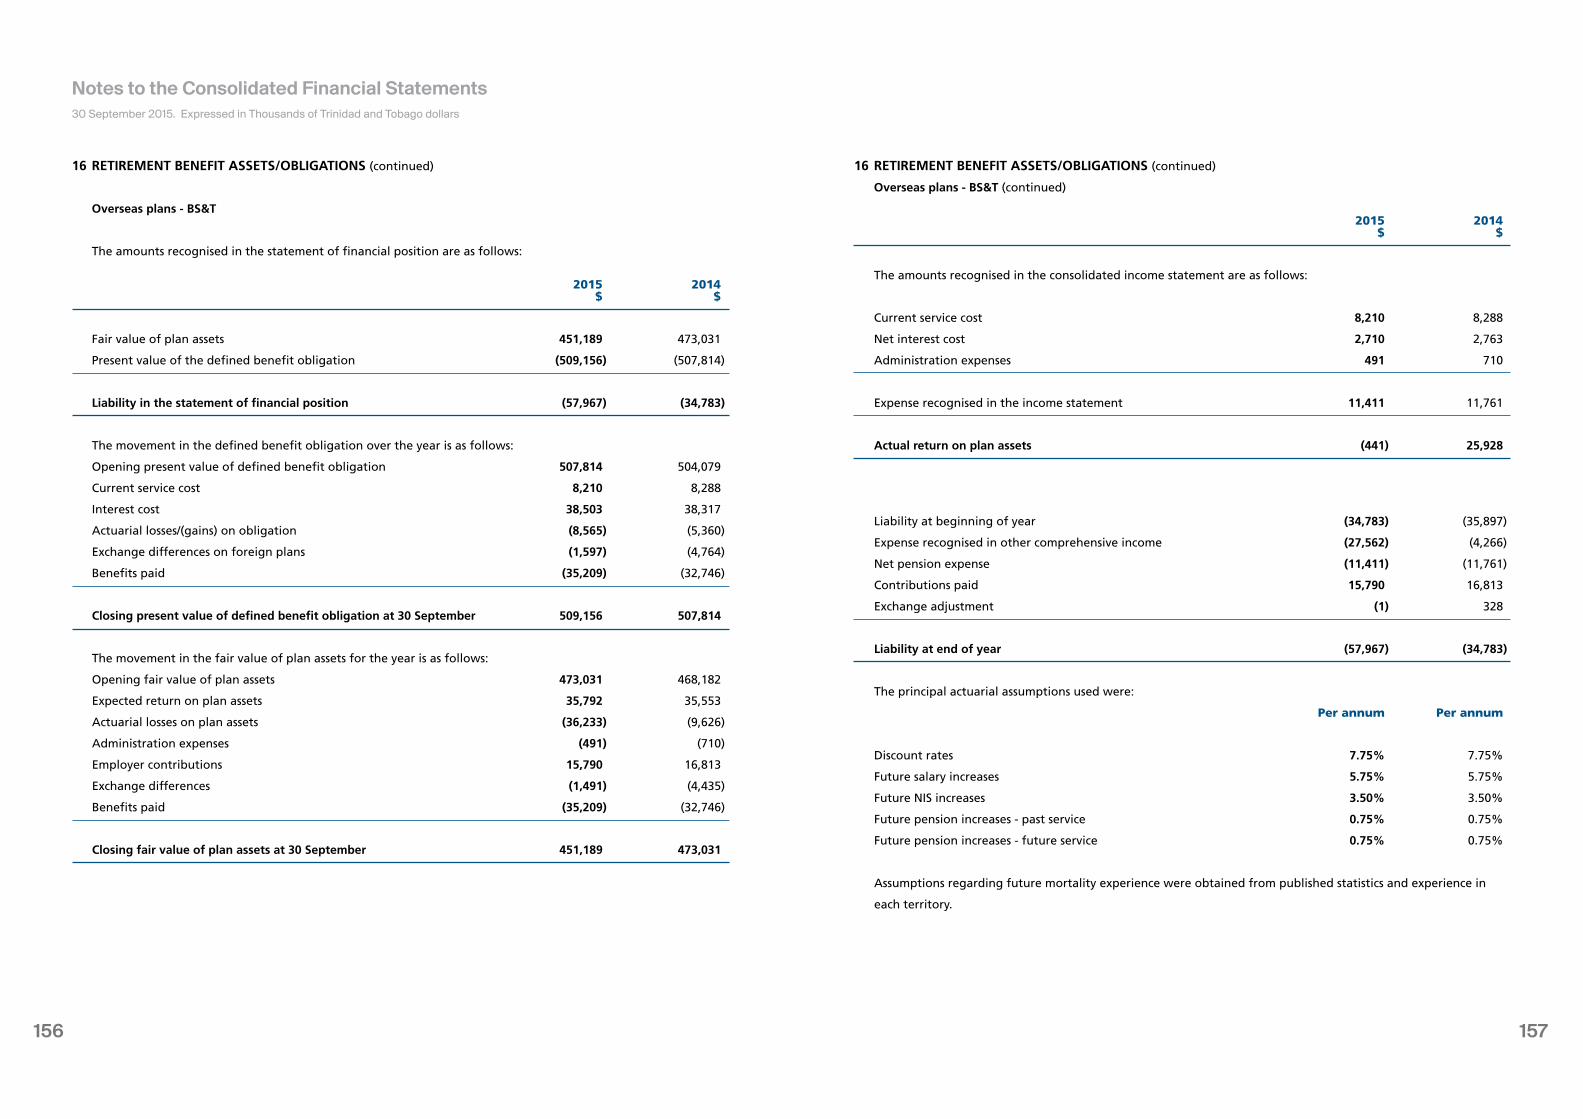
157156
16 RETIREMENT BENEFIT ASSETS/OBLIGATIONS (continued)
Overseas plans - BS&T
The amounts recognised in the statement of financial position are as follows:
2015 2014 $ $
Fair value of plan assets 451,189 473,031
Present value of the defined benefit obligation (509,156) (507,814)
Liability in the statement of financial position (57,967) (34,783)
The movement in the defined benefit obligation over the year is as follows:
Opening present value of defined benefit obligation 507,814 504,079
Current service cost 8,210 8,288
Interest cost 38,503 38,317
Actuarial losses/(gains) on obligation (8,565) (5,360)
Exchange differences on foreign plans (1,597) (4,764)
Benefits paid (35,209) (32,746)
Closing present value of defined benefit obligation at 30 September 509,156 507,814
The movement in the fair value of plan assets for the year is as follows:
Opening fair value of plan assets 473,031 468,182
Expected return on plan assets 35,792 35,553
Actuarial losses on plan assets (36,233) (9,626)
Administration expenses (491) (710)
Employer contributions 15,790 16,813
Exchange differences (1,491) (4,435)
Benefits paid (35,209) (32,746)
Closing fair value of plan assets at 30 September 451,189 473,031
16 RETIREMENT BENEFIT ASSETS/OBLIGATIONS (continued)
Overseas plans - BS&T (continued)
2015 2014 $ $
The amounts recognised in the consolidated income statement are as follows:
Current service cost 8,210 8,288
Net interest cost 2,710 2,763
Administration expenses 491 710
Expense recognised in the income statement 11,411 11,761
Actual return on plan assets (441) 25,928
Liability at beginning of year (34,783) (35,897)
Expense recognised in other comprehensive income (27,562) (4,266)
Net pension expense (11,411) (11,761)
Contributions paid 15,790 16,813
Exchange adjustment (1) 328
Liability at end of year (57,967) (34,783)
The principal actuarial assumptions used were:
Per annum Per annum
Discount rates 7.75% 7.75%
Future salary increases 5.75% 5.75%
Future NIS increases 3.50% 3.50%
Future pension increases - past service 0.75% 0.75%
Future pension increases - future service 0.75% 0.75%
Assumptions regarding future mortality experience were obtained from published statistics and experience in
each territory.
30 September 2015. Expressed in Thousands of Trinidad and Tobago dollars
Notes to the Consolidated Financial Statements
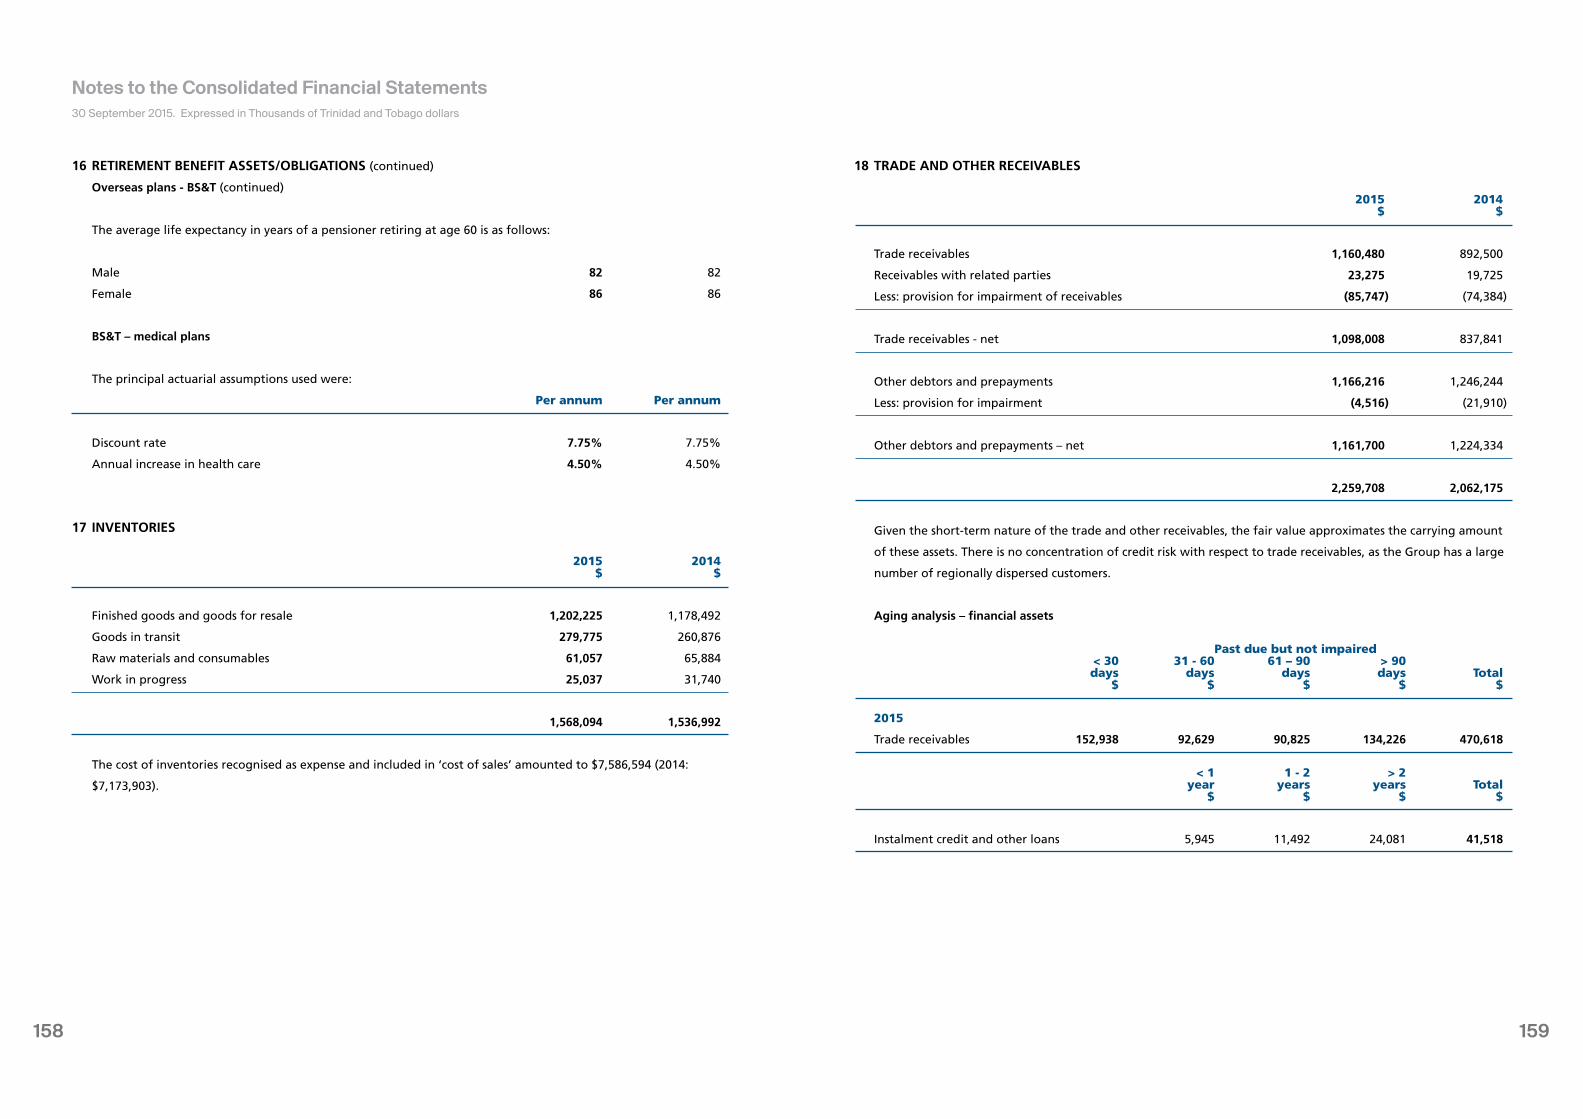
159158
16 RETIREMENT BENEFIT ASSETS/OBLIGATIONS (continued)
Overseas plans - BS&T (continued)
The average life expectancy in years of a pensioner retiring at age 60 is as follows:
Male 82 82
Female 86 86
BS&T – medical plans
The principal actuarial assumptions used were:
Per annum Per annum
Discount rate 7.75% 7.75%
Annual increase in health care 4.50% 4.50%
17 INVENTORIES
2015 2014 $ $
Finished goods and goods for resale 1,202,225 1,178,492
Goods in transit 279,775 260,876
Raw materials and consumables 61,057 65,884
Work in progress 25,037 31,740
1,568,094 1,536,992
The cost of inventories recognised as expense and included in ‘cost of sales’ amounted to $7,586,594 (2014:
$7,173,903).
18 TRADE AND OTHER RECEIVABLES
2015 2014 $ $
Trade receivables 1,160,480 892,500
Receivables with related parties 23,275 19,725
Less: provision for impairment of receivables (85,747) (74,384)
Trade receivables - net 1,098,008 837,841
Other debtors and prepayments 1,166,216 1,246,244
Less: provision for impairment (4,516) (21,910)
Other debtors and prepayments – net 1,161,700 1,224,334
2,259,708 2,062,175
Given the short-term nature of the trade and other receivables, the fair value approximates the carrying amount
of these assets. There is no concentration of credit risk with respect to trade receivables, as the Group has a large
number of regionally dispersed customers.
Aging analysis – financial assets
Past due but not impaired < 30 31 - 60 61 – 90 > 90 days days days days Total $ $ $ $ $
2015
Trade receivables 152,938 92,629 90,825 134,226 470,618
< 1 1 - 2 > 2 year years years Total $ $ $ $
Instalment credit and other loans 5,945 11,492 24,081 41,518
30 September 2015. Expressed in Thousands of Trinidad and Tobago dollars
Notes to the Consolidated Financial Statements
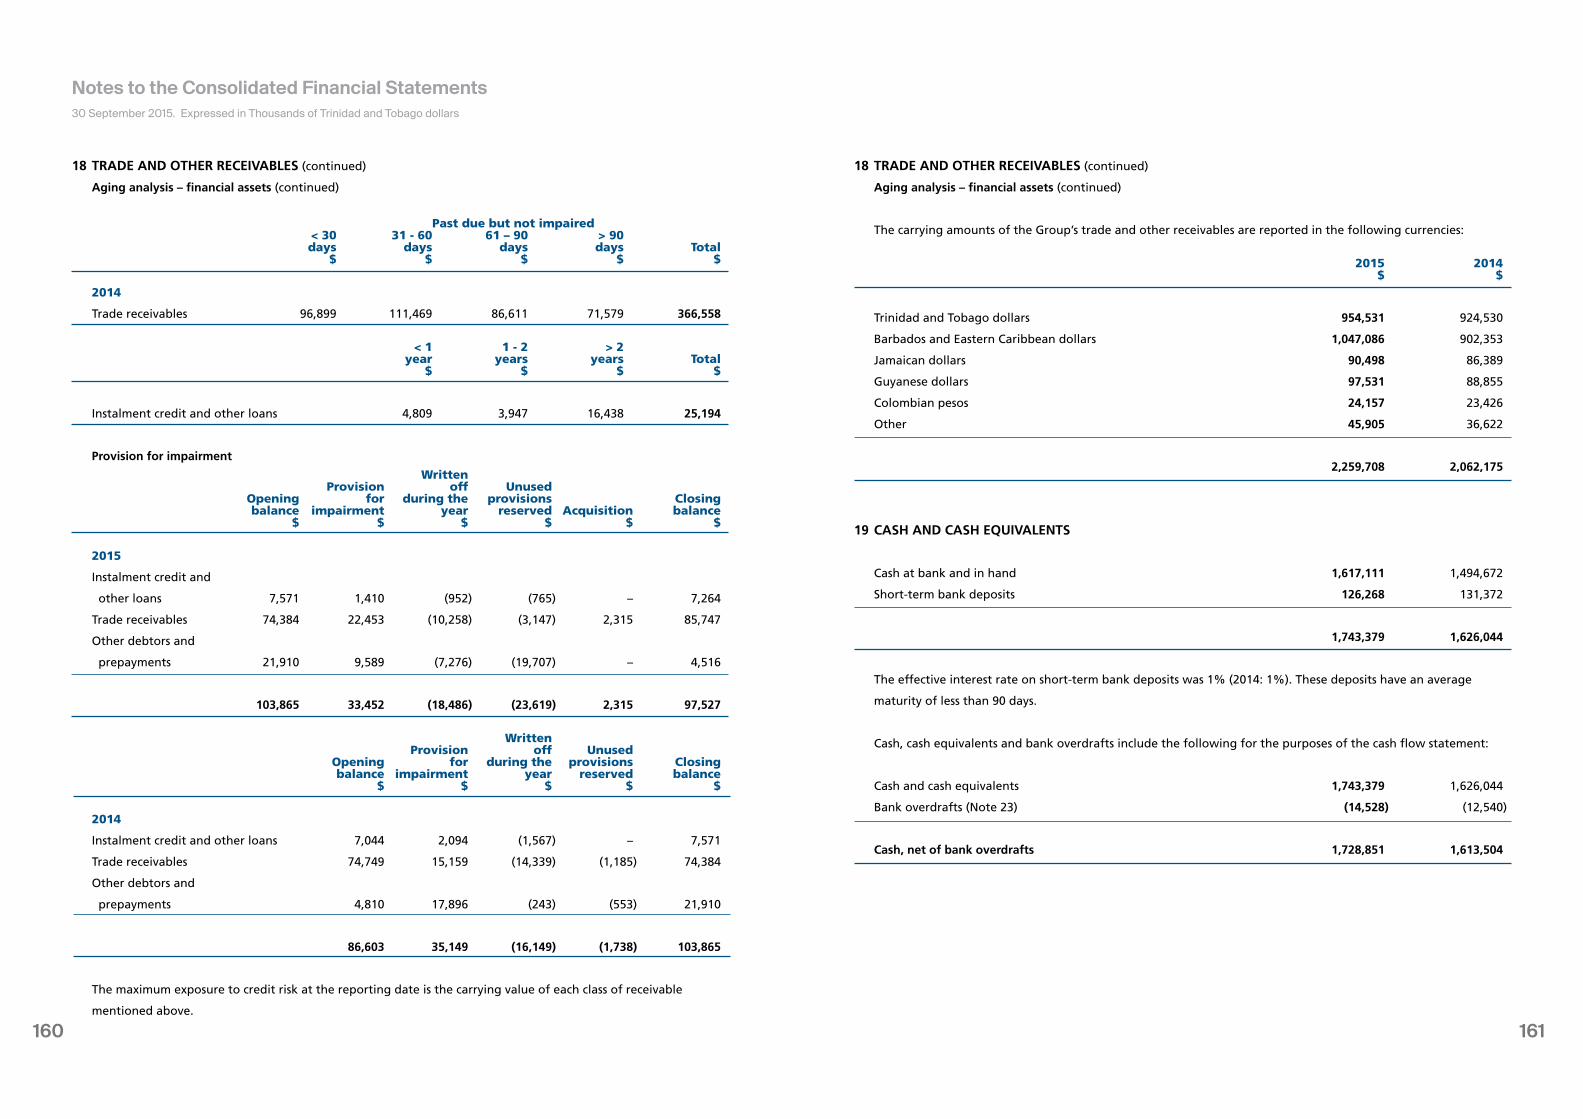
161160
18 TRADE AND OTHER RECEIVABLES (continued)
Aging analysis – financial assets (continued)
Past due but not impaired < 30 31 - 60 61 – 90 > 90 days days days days Total $ $ $ $ $
2014
Trade receivables 96,899 111,469 86,611 71,579 366,558
< 1 1 - 2 > 2 year years years Total $ $ $ $
Instalment credit and other loans 4,809 3,947 16,438 25,194
Provision for impairment
Written Provision off Unused Opening for during the provisions Closing balance impairment year reserved Acquisition balance $ $ $ $ $ $
2015
Instalment credit and
other loans 7,571 1,410 (952) (765) – 7,264
Trade receivables 74,384 22,453 (10,258) (3,147) 2,315 85,747
Other debtors and
prepayments 21,910 9,589 (7,276) (19,707) – 4,516
103,865 33,452 (18,486) (23,619) 2,315 97,527
Written Provision off Unused Opening for during the provisions Closing balance impairment year reserved balance $ $ $ $ $
2014
Instalment credit and other loans 7,044 2,094 (1,567) – 7,571
Trade receivables 74,749 15,159 (14,339) (1,185) 74,384
Other debtors and
prepayments 4,810 17,896 (243) (553) 21,910
86,603 35,149 (16,149) (1,738) 103,865
The maximum exposure to credit risk at the reporting date is the carrying value of each class of receivable
mentioned above.
18 TRADE AND OTHER RECEIVABLES (continued)
Aging analysis – financial assets (continued)
The carrying amounts of the Group’s trade and other receivables are reported in the following currencies:
2015 2014 $ $
Trinidad and Tobago dollars 954,531 924,530
Barbados and Eastern Caribbean dollars 1,047,086 902,353
Jamaican dollars 90,498 86,389
Guyanese dollars 97,531 88,855
Colombian pesos 24,157 23,426
Other 45,905 36,622
2,259,708 2,062,175
19 CASH AND CASH EQUIVALENTS
Cash at bank and in hand 1,617,111 1,494,672
Short-term bank deposits 126,268 131,372
1,743,379 1,626,044
The effective interest rate on short-term bank deposits was 1% (2014: 1%). These deposits have an average
maturity of less than 90 days.
Cash, cash equivalents and bank overdrafts include the following for the purposes of the cash flow statement:
Cash and cash equivalents 1,743,379 1,626,044
Bank overdrafts (Note 23) (14,528) (12,540)
Cash, net of bank overdrafts 1,728,851 1,613,504
30 September 2015. Expressed in Thousands of Trinidad and Tobago dollars
Notes to the Consolidated Financial Statements
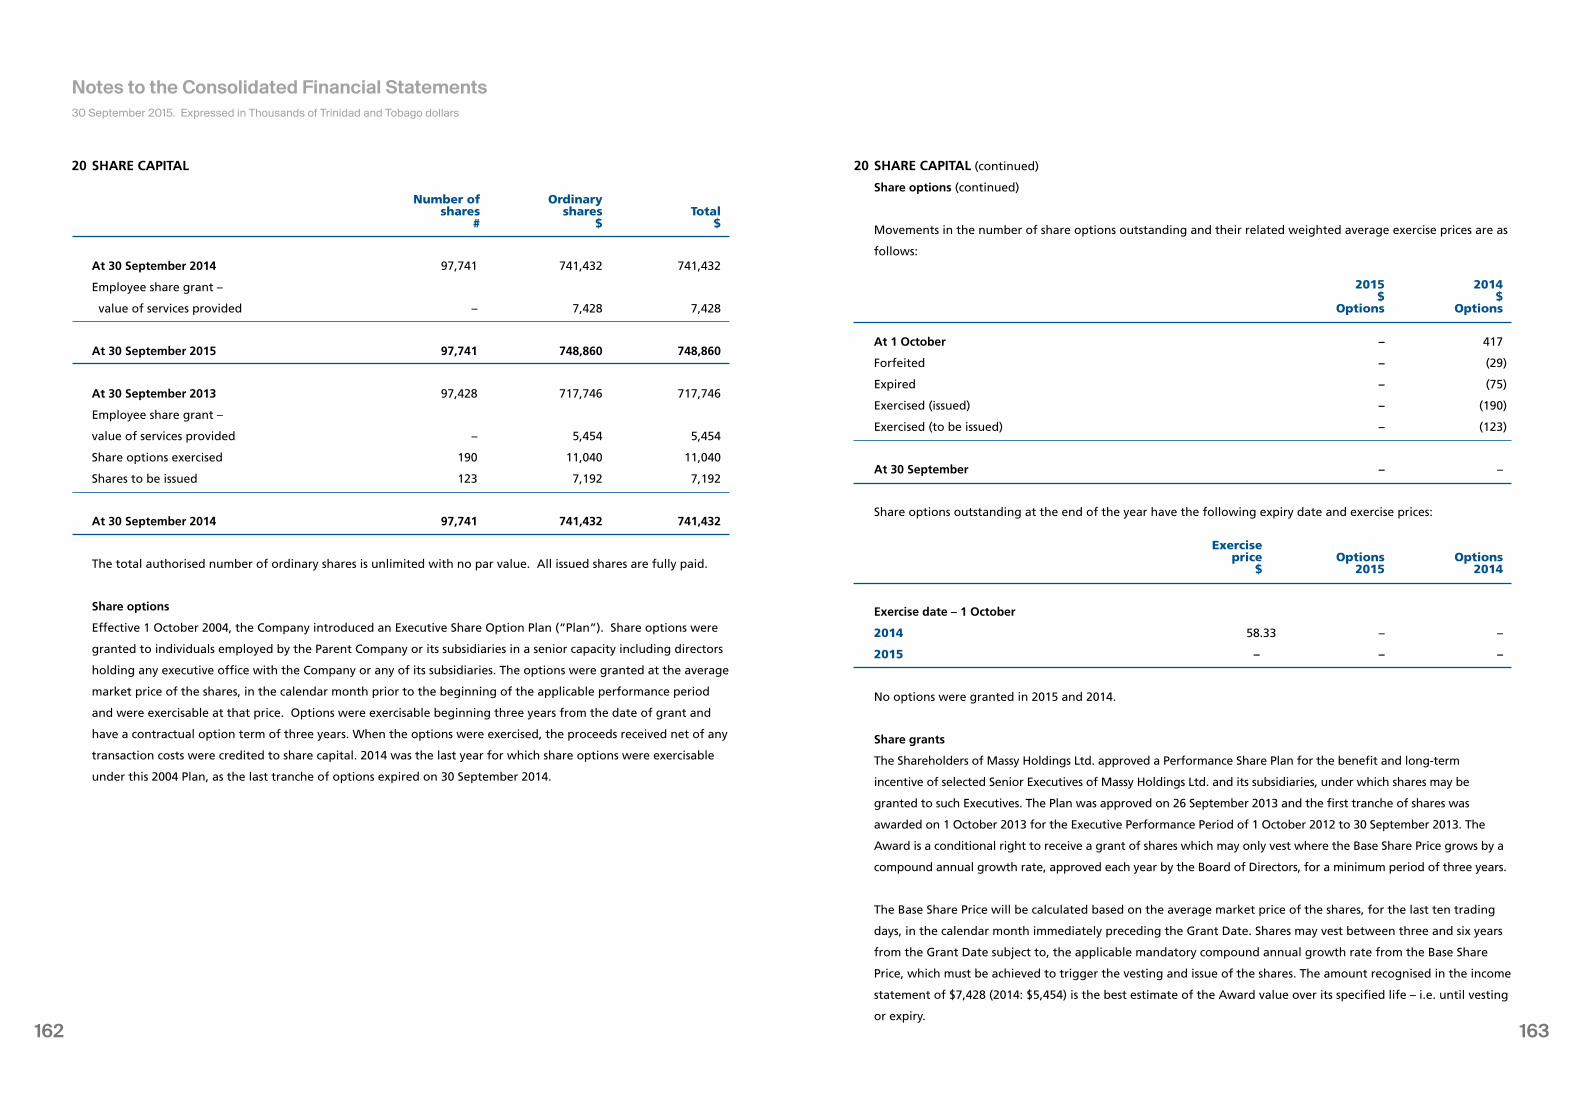
163162
20 SHARE CAPITAL
Number of Ordinary shares shares Total # $ $
At 30 September 2014 97,741 741,432 741,432
Employee share grant –
value of services provided – 7,428 7,428
At 30 September 2015 97,741 748,860 748,860
At 30 September 2013 97,428 717,746 717,746
Employee share grant –
value of services provided – 5,454 5,454
Share options exercised 190 11,040 11,040
Shares to be issued 123 7,192 7,192
At 30 September 2014 97,741 741,432 741,432
The total authorised number of ordinary shares is unlimited with no par value. All issued shares are fully paid.
Share options
Effective 1 October 2004, the Company introduced an Executive Share Option Plan (“Plan”). Share options were
granted to individuals employed by the Parent Company or its subsidiaries in a senior capacity including directors
holding any executive office with the Company or any of its subsidiaries. The options were granted at the average
market price of the shares, in the calendar month prior to the beginning of the applicable performance period
and were exercisable at that price. Options were exercisable beginning three years from the date of grant and
have a contractual option term of three years. When the options were exercised, the proceeds received net of any
transaction costs were credited to share capital. 2014 was the last year for which share options were exercisable
under this 2004 Plan, as the last tranche of options expired on 30 September 2014.
20 SHARE CAPITAL (continued)
Share options (continued)
Movements in the number of share options outstanding and their related weighted average exercise prices are as
follows:
2015 2014 $ $ Options Options
At 1 October – 417
Forfeited – (29)
Expired – (75)
Exercised (issued) – (190)
Exercised (to be issued) – (123)
At 30 September – –
Share options outstanding at the end of the year have the following expiry date and exercise prices:
Exercise price Options Options $ 2015 2014
Exercise date – 1 October
2014 58.33 – –
2015 – – –
No options were granted in 2015 and 2014.
Share grants
The Shareholders of Massy Holdings Ltd. approved a Performance Share Plan for the benefit and long-term
incentive of selected Senior Executives of Massy Holdings Ltd. and its subsidiaries, under which shares may be
granted to such Executives. The Plan was approved on 26 September 2013 and the first tranche of shares was
awarded on 1 October 2013 for the Executive Performance Period of 1 October 2012 to 30 September 2013. The
Award is a conditional right to receive a grant of shares which may only vest where the Base Share Price grows by a
compound annual growth rate, approved each year by the Board of Directors, for a minimum period of three years.
The Base Share Price will be calculated based on the average market price of the shares, for the last ten trading
days, in the calendar month immediately preceding the Grant Date. Shares may vest between three and six years
from the Grant Date subject to, the applicable mandatory compound annual growth rate from the Base Share
Price, which must be achieved to trigger the vesting and issue of the shares. The amount recognised in the income
statement of $7,428 (2014: $5,454) is the best estimate of the Award value over its specified life – i.e. until vesting
or expiry.
30 September 2015. Expressed in Thousands of Trinidad and Tobago dollars
Notes to the Consolidated Financial Statements
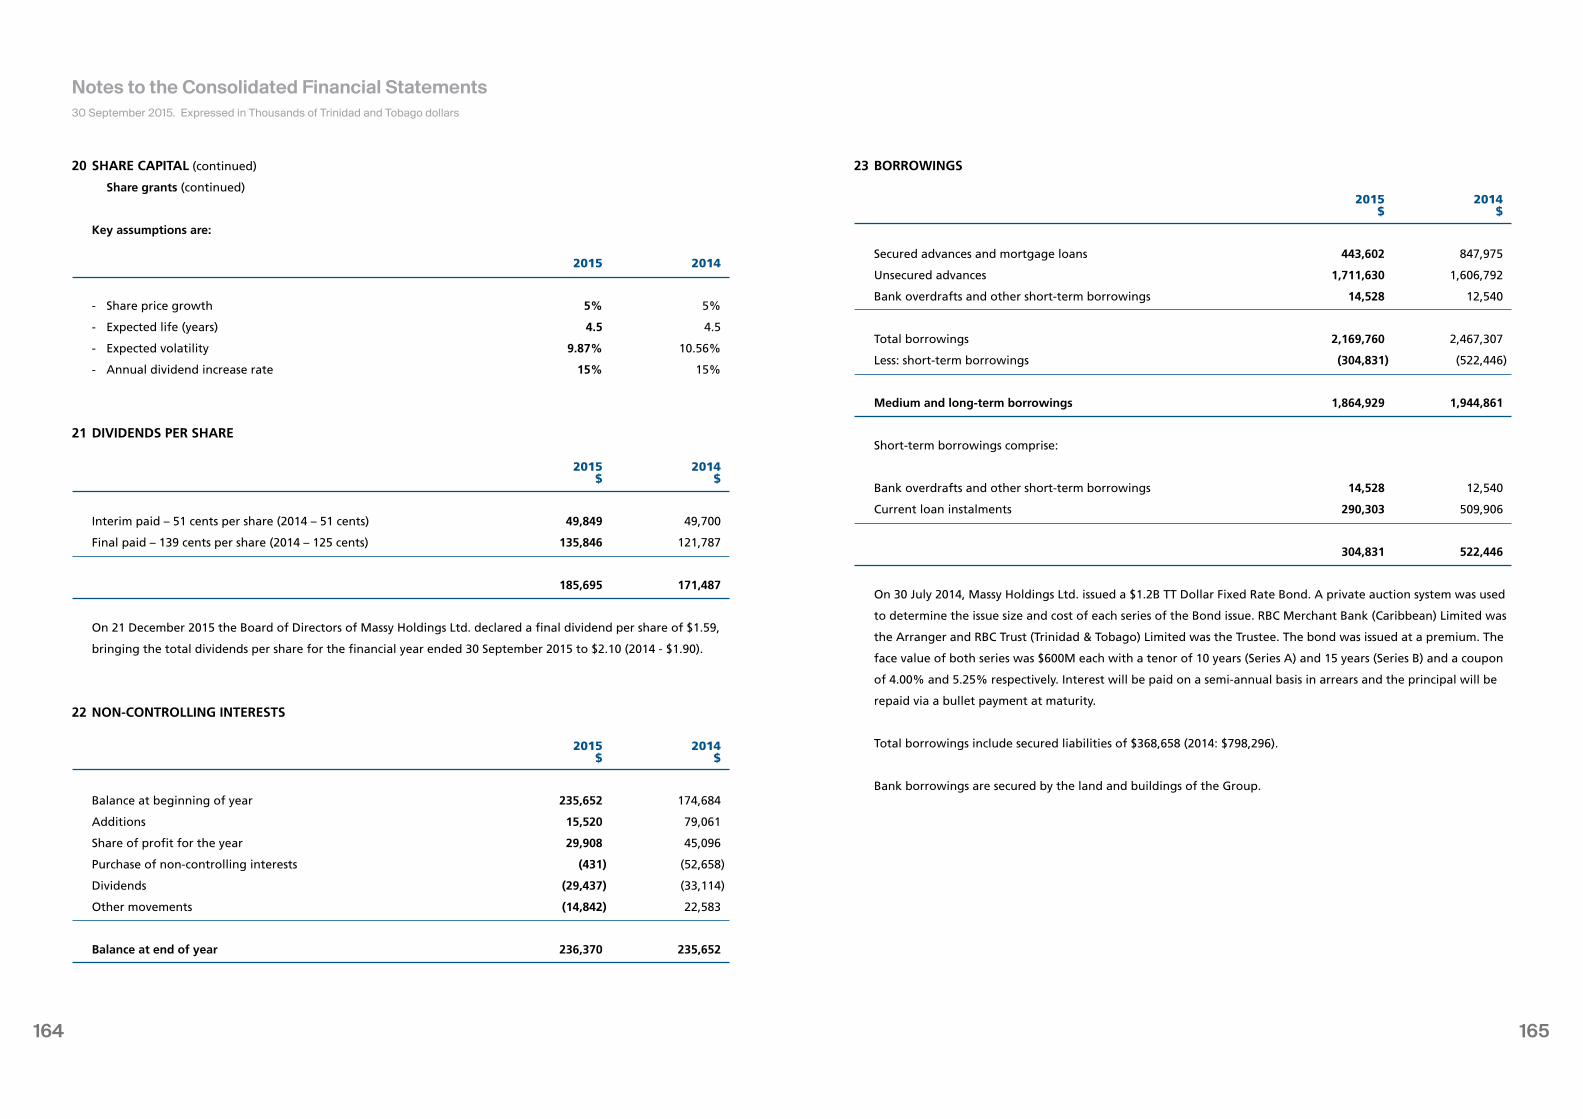
165164
20 SHARE CAPITAL (continued)
Share grants (continued)
Key assumptions are:
2015 2014
- Share price growth 5% 5%
- Expected life (years) 4.5 4.5
- Expected volatility 9.87% 10.56%
- Annual dividend increase rate 15% 15%
21 DIVIDENDS PER SHARE
2015 2014 $ $
Interim paid – 51 cents per share (2014 – 51 cents) 49,849 49,700
Final paid – 139 cents per share (2014 – 125 cents) 135,846 121,787
185,695 171,487
On 21 December 2015 the Board of Directors of Massy Holdings Ltd. declared a final dividend per share of $1.59,
bringing the total dividends per share for the financial year ended 30 September 2015 to $2.10 (2014 - $1.90).
22 NON-CONTROLLING INTERESTS
2015 2014 $ $
Balance at beginning of year 235,652 174,684
Additions 15,520 79,061
Share of profit for the year 29,908 45,096
Purchase of non-controlling interests (431) (52,658)
Dividends (29,437) (33,114)
Other movements (14,842) 22,583
Balance at end of year 236,370 235,652
23 BORROWINGS
2015 2014 $ $
Secured advances and mortgage loans 443,602 847,975
Unsecured advances 1,711,630 1,606,792
Bank overdrafts and other short-term borrowings 14,528 12,540
Total borrowings 2,169,760 2,467,307
Less: short-term borrowings (304,831) (522,446)
Medium and long-term borrowings 1,864,929 1,944,861
Short-term borrowings comprise:
Bank overdrafts and other short-term borrowings 14,528 12,540
Current loan instalments 290,303 509,906
304,831 522,446
On 30 July 2014, Massy Holdings Ltd. issued a $1.2B TT Dollar Fixed Rate Bond. A private auction system was used
to determine the issue size and cost of each series of the Bond issue. RBC Merchant Bank (Caribbean) Limited was
the Arranger and RBC Trust (Trinidad & Tobago) Limited was the Trustee. The bond was issued at a premium. The
face value of both series was $600M each with a tenor of 10 years (Series A) and 15 years (Series B) and a coupon
of 4.00% and 5.25% respectively. Interest will be paid on a semi-annual basis in arrears and the principal will be
repaid via a bullet payment at maturity.
Total borrowings include secured liabilities of $368,658 (2014: $798,296).
Bank borrowings are secured by the land and buildings of the Group.
30 September 2015. Expressed in Thousands of Trinidad and Tobago dollars
Notes to the Consolidated Financial Statements
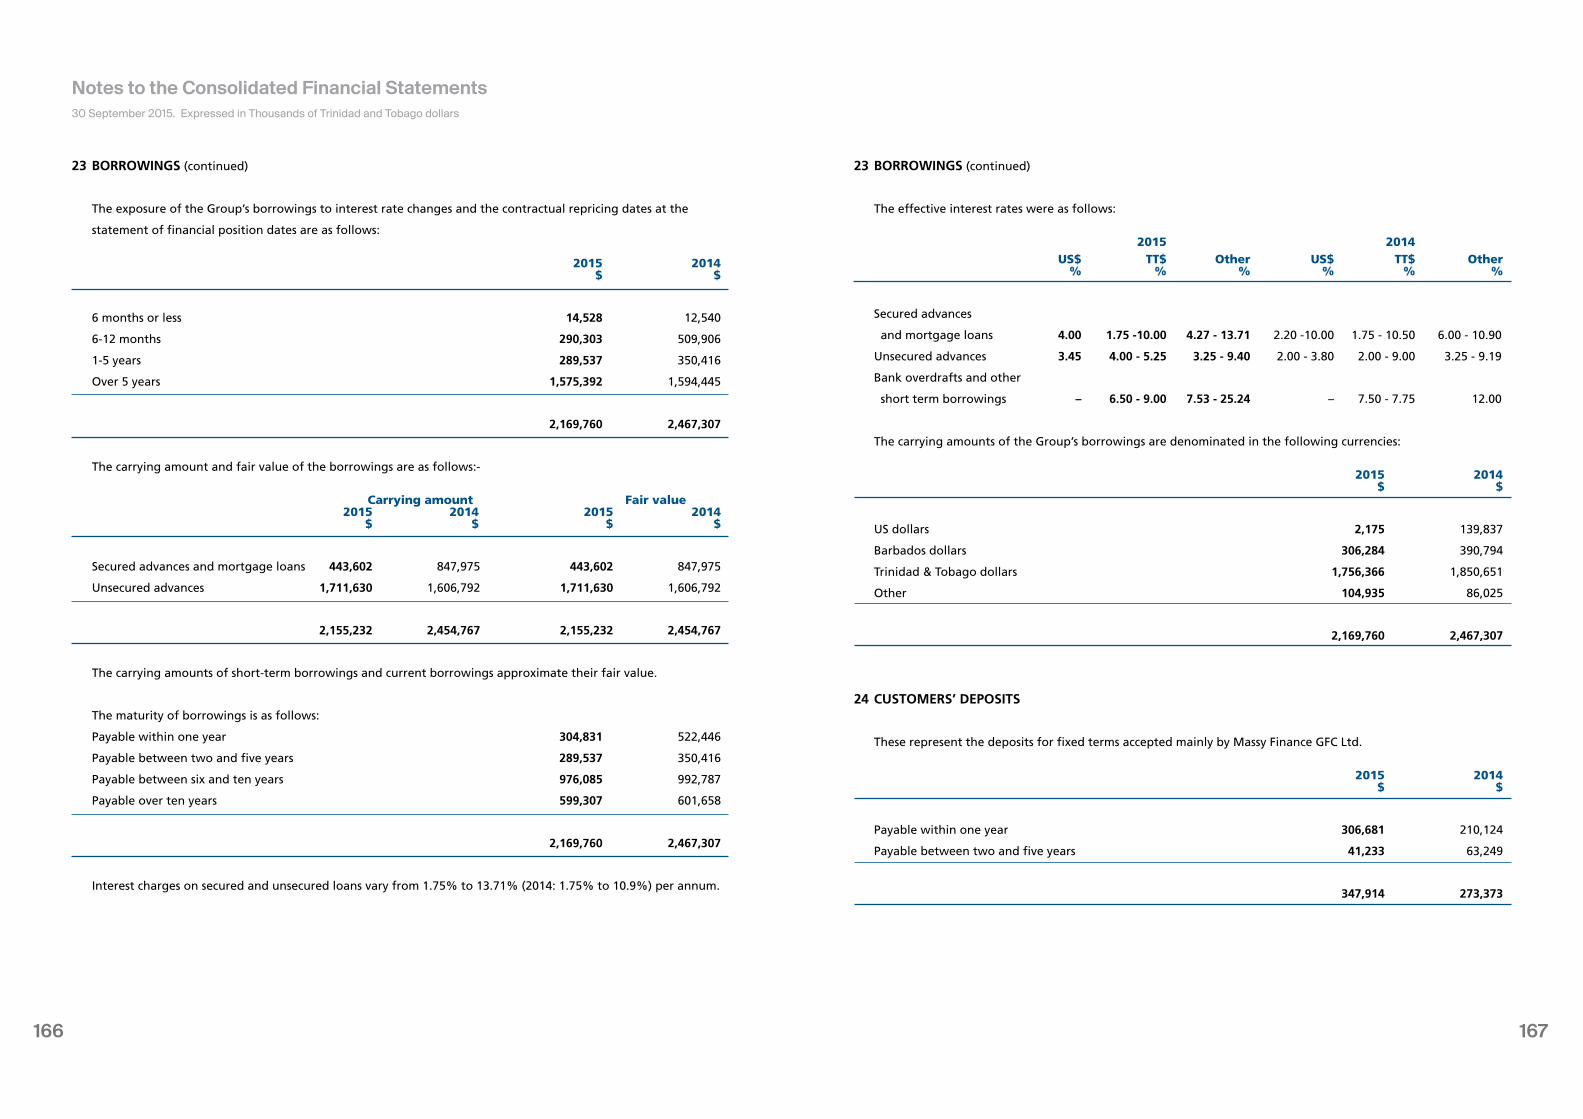
167166
23 BORROWINGS (continued)
The exposure of the Group’s borrowings to interest rate changes and the contractual repricing dates at the
statement of financial position dates are as follows:
2015 2014 $ $
6 months or less 14,528 12,540
6-12 months 290,303 509,906
1-5 years 289,537 350,416
Over 5 years 1,575,392 1,594,445
2,169,760 2,467,307
The carrying amount and fair value of the borrowings are as follows:-
Carrying amount Fair value 2015 2014 2015 2014 $ $ $ $
Secured advances and mortgage loans 443,602 847,975 443,602 847,975
Unsecured advances 1,711,630 1,606,792 1,711,630 1,606,792
2,155,232 2,454,767 2,155,232 2,454,767
The carrying amounts of short-term borrowings and current borrowings approximate their fair value.
The maturity of borrowings is as follows:
Payable within one year 304,831 522,446
Payable between two and five years 289,537 350,416
Payable between six and ten years 976,085 992,787
Payable over ten years 599,307 601,658
2,169,760 2,467,307
Interest charges on secured and unsecured loans vary from 1.75% to 13.71% (2014: 1.75% to 10.9%) per annum.
23 BORROWINGS (continued)
The effective interest rates were as follows:
2015 2014 US$ TT$ Other US$ TT$ Other % % % % % %
Secured advances
and mortgage loans 4.00 1.75 -10.00 4.27 - 13.71 2.20 -10.00 1.75 - 10.50 6.00 - 10.90
Unsecured advances 3.45 4.00 - 5.25 3.25 - 9.40 2.00 - 3.80 2.00 - 9.00 3.25 - 9.19
Bank overdrafts and other
short term borrowings – 6.50 - 9.00 7.53 - 25.24 – 7.50 - 7.75 12.00
The carrying amounts of the Group’s borrowings are denominated in the following currencies:
2015 2014 $ $
US dollars 2,175 139,837
Barbados dollars 306,284 390,794
Trinidad & Tobago dollars 1,756,366 1,850,651
Other 104,935 86,025
2,169,760 2,467,307
24 CUSTOMERS’ DEPOSITS
These represent the deposits for fixed terms accepted mainly by Massy Finance GFC Ltd.
2015 2014 $ $
Payable within one year 306,681 210,124
Payable between two and five years 41,233 63,249
347,914 273,373
30 September 2015. Expressed in Thousands of Trinidad and Tobago dollars
Notes to the Consolidated Financial Statements

169168
24 CUSTOMERS’ DEPOSITS (continued)
Sectorial analysis of deposit balances
2015 2014 $ $
Private sector 89,593 49,644
Consumers 258,321 223,729
347,914 273,373
25 PROVISIONS FOR OTHER LIABILITIES AND CHARGES
The Company maintains a self-insured program covering portions of Group life and consequential loss insurance.
The amounts in excess of the self-insured levels are fully insured; subject to certain limitations and exclusions. The
Company accrues its estimated liability for these self insured programs, including estimates for insured but not
reported claims, based on known claims and past claims history. The remaining balance for provisions for other
liabilities and charges stem from accruals for outstanding tax claims or assessments.
26 TRADE AND OTHER PAYABLES
2015 2014 $ $
Trade creditors 913,787 692,637
Other payables 926,362 879,798
1,840,149 1,572,435
27 LIABILITIES ON INSURANCE CONTRACTS
The major classes of general insurance written by the Group’s insurance operations include motor, property, and
other miscellaneous types of general insurance. Risks under these policies usually cover a twelve month duration.
Liabilities comprise:
Outstanding claims 313,436 318,477
Unearned premiums 377,265 314,853
690,701 633,330
27 LIABILITIES ON INSURANCE CONTRACTS (continued)
Movement in outstanding claims reserve may be analysed as follows:
Insurance Reinsurers’ Insurance Reinsurers’ liabilities share liabilities share 2015 2015 2014 2014 $ $ $ $
Beginning of the year 318,477 107,935 314,235 93,910
Exchange adjustment (1,003) (339) (2,937) (878)
Claims incurred 179,451 37,859 178,792 83,635
Claims paid (183,489) (111,094) (171,613) (68,732)
313,436 34,361 318,477 107,935
Movement in the unearned premium reserve may be analysed as follows:
Insurance Reinsurers’ Insurance Reinsurers’ liabilities share liabilities share 2015 2015 2014 2014 $ $ $ $
Beginning of the year 314,853 229,200 345,946 223,504
Exchange adjustment (989) (721) (3,234) (2,088)
Premiums written in the year 826,813 525,069 711,463 502,878
Premiums earned in the year (763,412) (503,721) (739,322) (495,094)
377,265 249,827 314,853 229,200
The reinsurers’ share of outstanding claims and unearned premium reserves are included in accounts receivable.
Claims reserves comprise provisions for claims reported by policyholders and claims incurred but not yet reported
and are established to cover the ultimate cost of settling the liabilities in respect of claims that have occurred and
are estimated based on known facts at the statement of financial position date. Outstanding claims reserves are
not discounted for the time value of money.
The principal assumption underlying the estimates is past claims development experience. This includes
assumptions in respect of average claims costs and claims numbers for each accident year. In addition, larger
claims are separately assessed by loss adjusters. Judgement is used to assess the extent to which external factors
such as judicial decisions and government legislation affect the estimates. The ultimate liabilities will vary as
a result of subsequent developments. Differences resulting from reassessment of the ultimate liabilities are
recognised in subsequent periods.
30 September 2015. Expressed in Thousands of Trinidad and Tobago dollars
Notes to the Consolidated Financial Statements
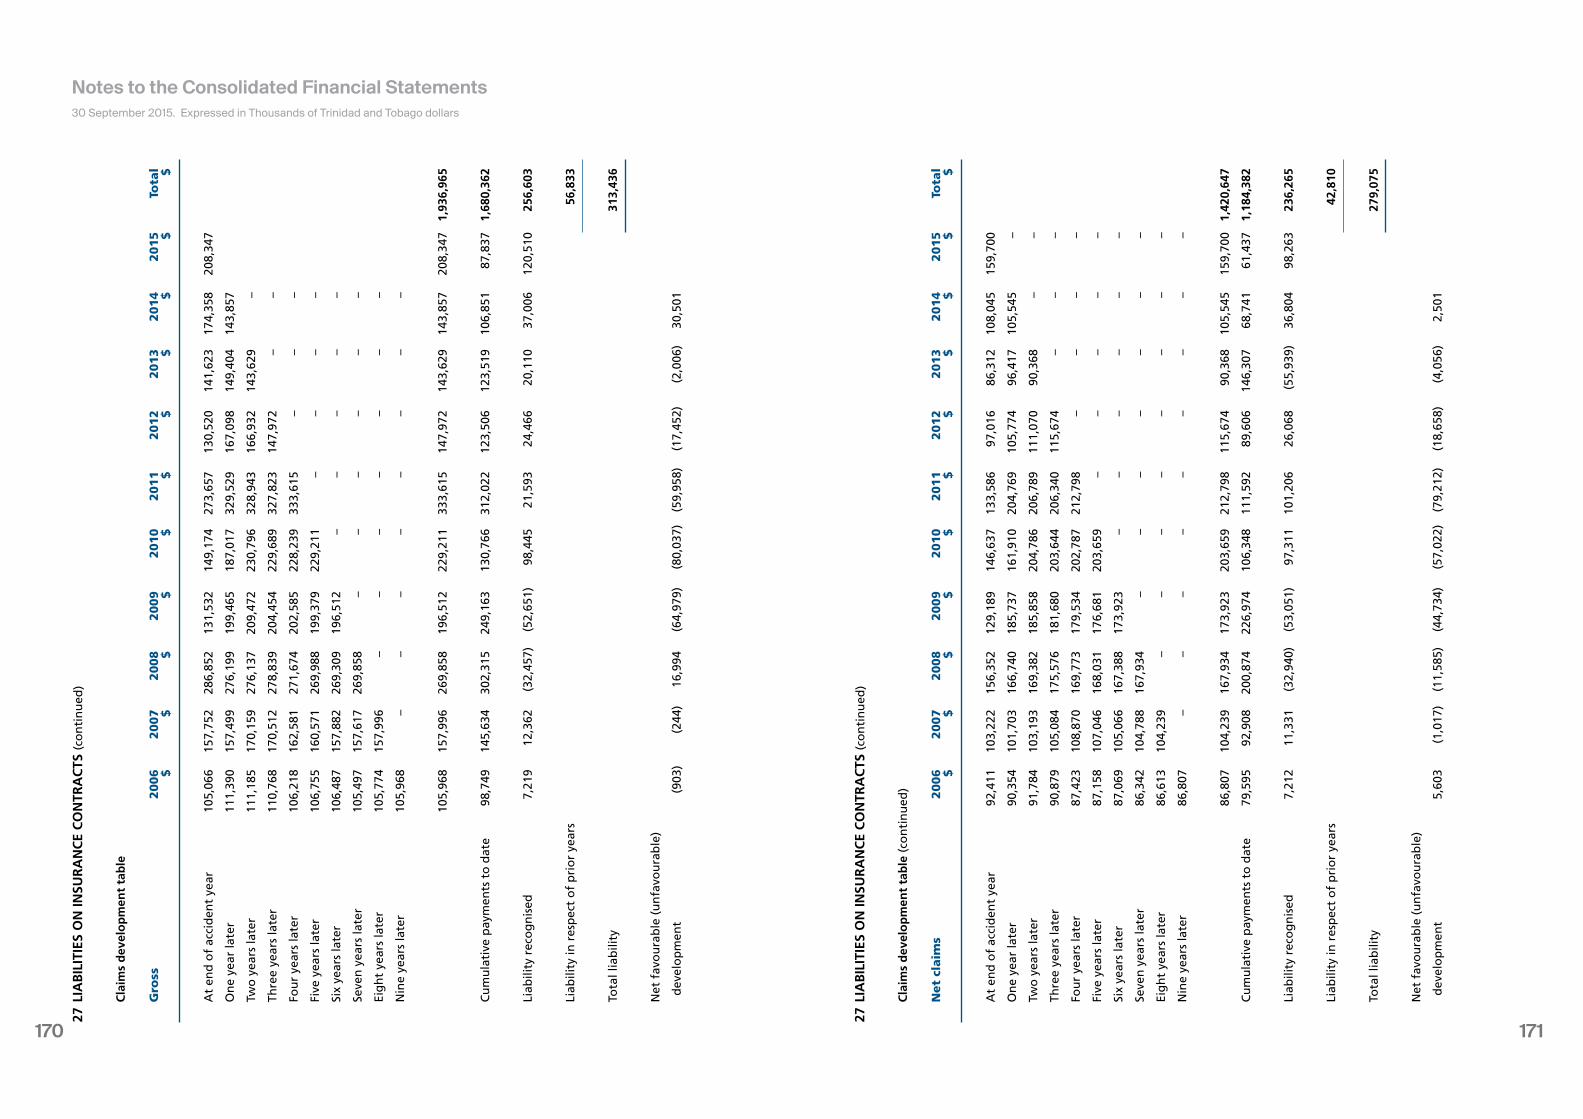
171170
27 L
IAB
ILIT
IES
ON
INSU
RA
NC
E C
ON
TRA
CTS
(co
nti
nu
ed)
C
laim
s d
evel
op
men
t ta
ble
G
ross
2006
2007
2008
2009
2010
2011
2012
2013
2014
2015
Tota
l
$
$
$
$
$
$
$
$
$
$
$
A
t en
d o
f ac
cid
ent
year
10
5,06
6 15
7,75
2 28
6,85
2 13
1,53
2 14
9,17
4 27
3,65
7 13
0,52
0 14
1,62
3 17
4,35
8 20
8,34
7
O
ne
year
late
r 11
1,39
0 15
7,49
9 27
6,19
9 19
9,46
5 18
7,01
7 32
9,52
9 16
7,09
8 14
9,40
4 14
3,85
7
Tw
o y
ears
late
r 11
1,18
5 17
0,15
9 27
6,13
7 20
9,47
2 23
0,79
6 32
8,94
3 16
6,93
2 14
3,62
9 –
Th
ree
year
s la
ter
110,
768
170,
512
278,
839
204,
454
229,
689
327,
823
147,
972
– –
Fo
ur
year
s la
ter
106,
218
162,
581
271,
674
202,
585
228,
239
333,
615
– –
–
Fi
ve y
ears
late
r 10
6,75
5 16
0,57
1 26
9,98
8 19
9,37
9 22
9,21
1 –
– –
–
Si
x ye
ars
late
r 10
6,48
7 15
7,88
2 26
9,30
9 19
6,51
2 –
– –
– –
Se
ven
yea
rs la
ter
105,
497
157,
617
269,
858
– –
– –
– –
Ei
gh
t ye
ars
late
r 10
5,77
4 15
7,99
6 –
– –
– –
– –
N
ine
year
s la
ter
105,
968
– –
– –
– –
– –
10
5,96
8 15
7,99
6 26
9,85
8 19
6,51
2 22
9,21
1 33
3,61
5 14
7,97
2 14
3,62
9 14
3,85
7 20
8,34
7 1,
936,
965
C
um
ula
tive
pay
men
ts t
o d
ate
98
,749
14
5,63
4 30
2,31
5 24
9,16
3 13
0,76
6 31
2,02
2 12
3,50
6 12
3,51
9 10
6,85
1 87
,837
1,
680,
362
Li
abili
ty r
eco
gn
ised
7,
219
12,3
62
(32,
457)
(5
2,65
1)
98,4
45
21,5
93
24,4
66
20,1
10
37,0
06
120,
510
256,
603
Li
abili
ty in
res
pec
t o
f p
rio
r ye
ars
56,8
33
To
tal l
iab
ility
31
3,43
6
N
et f
avo
ura
ble
(u
nfa
vou
rab
le)
d
evel
op
men
t (9
03)
(244
) 16
,994
(6
4,97
9)
(80,
037)
(5
9,95
8)
(17,
452)
(2
,006
) 30
,501
27 L
IAB
ILIT
IES
ON
INSU
RA
NC
E C
ON
TRA
CTS
(co
nti
nu
ed)
C
laim
s d
evel
op
men
t ta
ble
(co
nti
nu
ed)
N
et
claim
s 2006
2007
2008
2009
2010
2011
2012
2013
2014
2015
Tota
l
$
$
$
$
$
$
$
$
$
$
$
A
t en
d o
f ac
cid
ent
year
92
,411
10
3,22
2 15
6,35
2 12
9,18
9 14
6,63
7 13
3,58
6 97
,016
86
,312
10
8,04
5 15
9,70
0
O
ne
year
late
r 90
,354
10
1,70
3 16
6,74
0 18
5,73
7 16
1,91
0 20
4,76
9 10
5,77
4 96
,417
10
5,54
5 –
Tw
o y
ears
late
r 91
,784
10
3,19
3 16
9,38
2 18
5,85
8 20
4,78
6 20
6,78
9 11
1,07
0 90
,368
–
–
Th
ree
year
s la
ter
90,8
79
105,
084
175,
576
181,
680
203,
644
206,
340
115,
674
– –
–
Fo
ur
year
s la
ter
87,4
23
108,
870
169,
773
179,
534
202,
787
212,
798
– –
– –
Fi
ve y
ears
late
r 87
,158
10
7,04
6 16
8,03
1 17
6,68
1 20
3,65
9 –
– –
– –
Si
x ye
ars
late
r 87
,069
10
5,06
6 16
7,38
8 17
3,92
3 –
– –
– –
–
Se
ven
yea
rs la
ter
86,3
42
104,
788
167,
934
– –
– –
– –
–
Ei
gh
t ye
ars
late
r 86
,613
10
4,23
9 –
– –
– –
– –
–
N
ine
year
s la
ter
86,8
07
– –
– –
– –
– –
–
86
,807
10
4,23
9 16
7,93
4 17
3,92
3 20
3,65
9 21
2,79
8 11
5,67
4 90
,368
10
5,54
5 15
9,70
0 1,
420,
647
C
um
ula
tive
pay
men
ts t
o d
ate
79
,595
92
,908
20
0,87
4 22
6,97
4 10
6,34
8 11
1,59
2 89
,606
14
6,30
7 68
,741
61
,437
1,
184,
382
Li
abili
ty r
eco
gn
ised
7,
212
11
,331
(3
2,94
0)
(53,
051)
97
,311
10
1,20
6 26
,068
(5
5,93
9)
36,8
04
98,2
63
236,
265
Li
abili
ty in
res
pec
t o
f p
rio
r ye
ars
42,8
10
To
tal l
iab
ility
27
9,07
5
N
et f
avo
ura
ble
(u
nfa
vou
rab
le)
d
evel
op
men
t 5,
603
(1
,017
) (1
1,58
5)
(44,
734)
(5
7,02
2)
(79,
212)
(1
8,65
8)
(4,0
56)
2,50
1
30 September 2015. Expressed in Thousands of Trinidad and Tobago dollars
Notes to the Consolidated Financial Statements
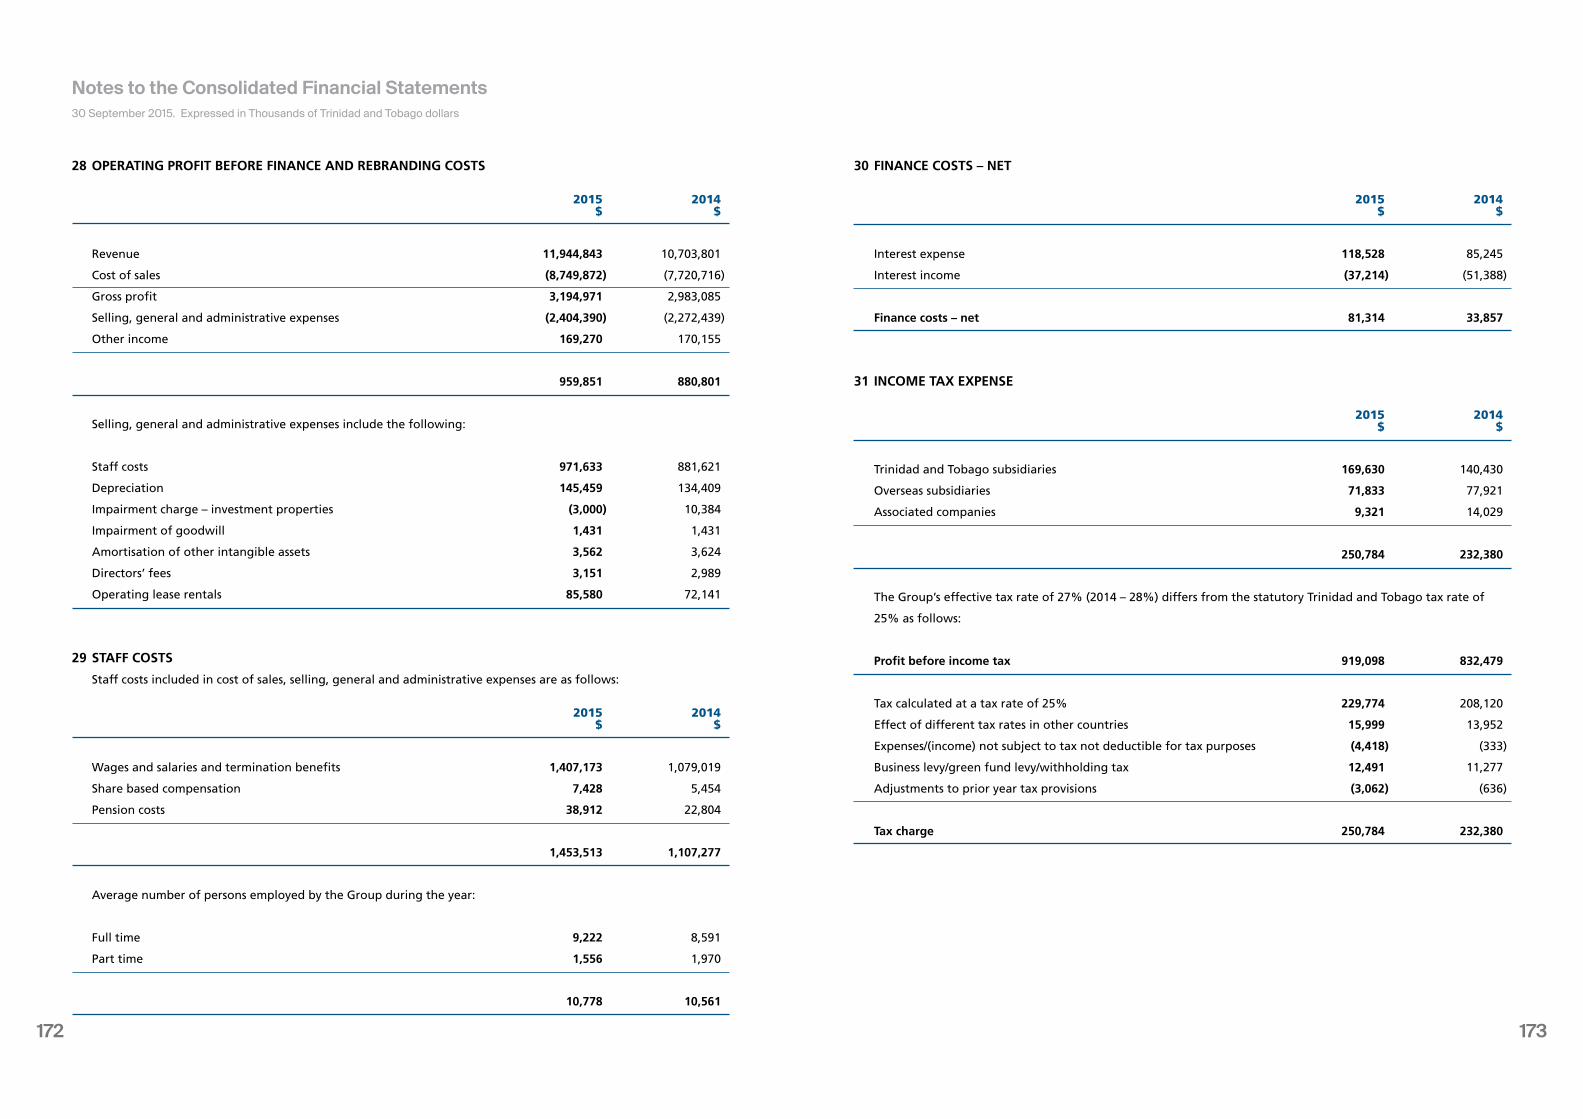
173172
28 OPERATING PROFIT BEFORE FINANCE AND REBRANDING COSTS
2015 2014 $ $
Revenue 11,944,843 10,703,801
Cost of sales (8,749,872) (7,720,716)
Gross profit 3,194,971 2,983,085
Selling, general and administrative expenses (2,404,390) (2,272,439)
Other income 169,270 170,155
959,851 880,801
Selling, general and administrative expenses include the following:
Staff costs 971,633 881,621
Depreciation 145,459 134,409
Impairment charge – investment properties (3,000) 10,384
Impairment of goodwill 1,431 1,431
Amortisation of other intangible assets 3,562 3,624
Directors’ fees 3,151 2,989
Operating lease rentals 85,580 72,141
29 STAFF COSTS
Staff costs included in cost of sales, selling, general and administrative expenses are as follows:
2015 2014 $ $
Wages and salaries and termination benefits 1,407,173 1,079,019
Share based compensation 7,428 5,454
Pension costs 38,912 22,804
1,453,513 1,107,277
Average number of persons employed by the Group during the year:
Full time 9,222 8,591
Part time 1,556 1,970
10,778 10,561
30 FINANCE COSTS – NET
2015 2014 $ $
Interest expense 118,528 85,245
Interest income (37,214) (51,388)
Finance costs – net 81,314 33,857
31 INCOME TAX EXPENSE
2015 2014 $ $
Trinidad and Tobago subsidiaries 169,630 140,430
Overseas subsidiaries 71,833 77,921
Associated companies 9,321 14,029
250,784 232,380
The Group’s effective tax rate of 27% (2014 – 28%) differs from the statutory Trinidad and Tobago tax rate of
25% as follows:
Profit before income tax 919,098 832,479
Tax calculated at a tax rate of 25% 229,774 208,120
Effect of different tax rates in other countries 15,999 13,952
Expenses/(income) not subject to tax not deductible for tax purposes (4,418) (333)
Business levy/green fund levy/withholding tax 12,491 11,277
Adjustments to prior year tax provisions (3,062) (636)
Tax charge 250,784 232,380
30 September 2015. Expressed in Thousands of Trinidad and Tobago dollars
Notes to the Consolidated Financial Statements
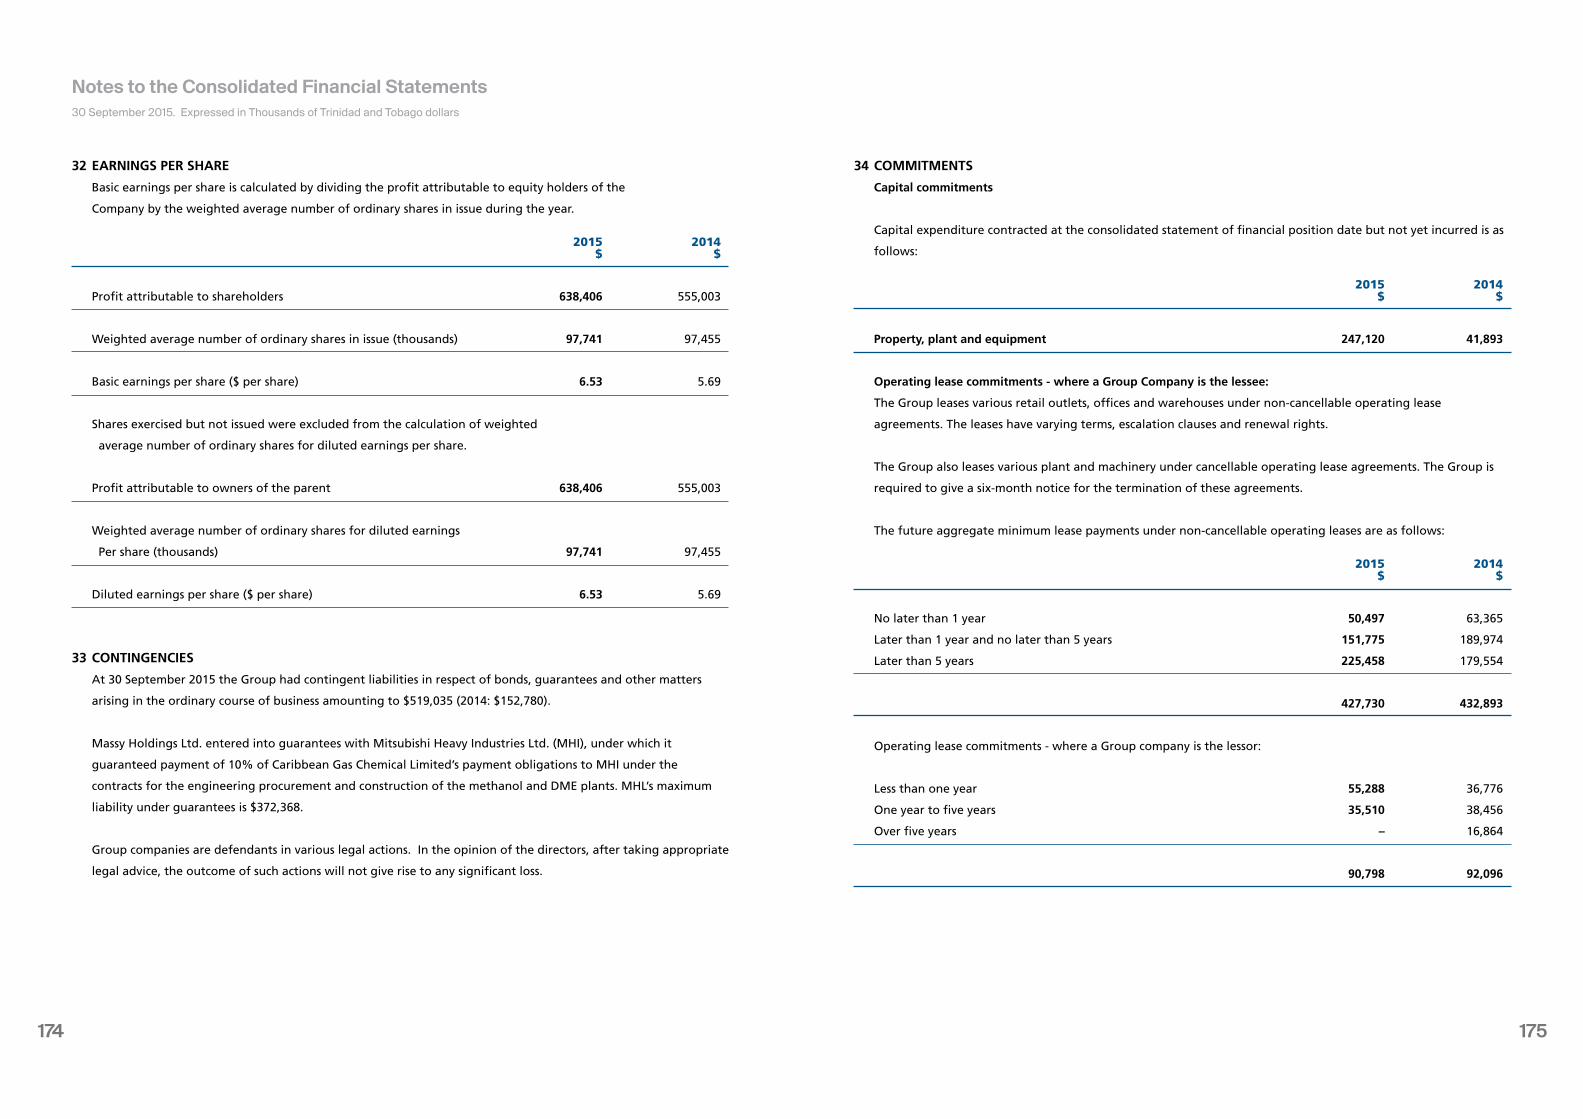
175174
32 EARNINGS PER SHARE
Basic earnings per share is calculated by dividing the profit attributable to equity holders of the
Company by the weighted average number of ordinary shares in issue during the year.
2015 2014 $ $
Profit attributable to shareholders 638,406 555,003
Weighted average number of ordinary shares in issue (thousands) 97,741 97,455
Basic earnings per share ($ per share) 6.53 5.69
Shares exercised but not issued were excluded from the calculation of weighted
average number of ordinary shares for diluted earnings per share.
Profit attributable to owners of the parent 638,406 555,003
Weighted average number of ordinary shares for diluted earnings
Per share (thousands) 97,741 97,455
Diluted earnings per share ($ per share) 6.53 5.69
33 CONTINGENCIES
At 30 September 2015 the Group had contingent liabilities in respect of bonds, guarantees and other matters
arising in the ordinary course of business amounting to $519,035 (2014: $152,780).
Massy Holdings Ltd. entered into guarantees with Mitsubishi Heavy Industries Ltd. (MHI), under which it
guaranteed payment of 10% of Caribbean Gas Chemical Limited’s payment obligations to MHI under the
contracts for the engineering procurement and construction of the methanol and DME plants. MHL’s maximum
liability under guarantees is $372,368.
Group companies are defendants in various legal actions. In the opinion of the directors, after taking appropriate
legal advice, the outcome of such actions will not give rise to any significant loss.
34 COMMITMENTS
Capital commitments
Capital expenditure contracted at the consolidated statement of financial position date but not yet incurred is as
follows:
2015 2014 $ $
Property, plant and equipment 247,120 41,893
Operating lease commitments - where a Group Company is the lessee:
The Group leases various retail outlets, offices and warehouses under non-cancellable operating lease
agreements. The leases have varying terms, escalation clauses and renewal rights.
The Group also leases various plant and machinery under cancellable operating lease agreements. The Group is
required to give a six-month notice for the termination of these agreements.
The future aggregate minimum lease payments under non-cancellable operating leases are as follows:
2015 2014 $ $
No later than 1 year 50,497 63,365
Later than 1 year and no later than 5 years 151,775 189,974
Later than 5 years 225,458 179,554
427,730 432,893
Operating lease commitments - where a Group company is the lessor:
Less than one year 55,288 36,776
One year to five years 35,510 38,456
Over five years – 16,864
90,798 92,096
30 September 2015. Expressed in Thousands of Trinidad and Tobago dollars
Notes to the Consolidated Financial Statements
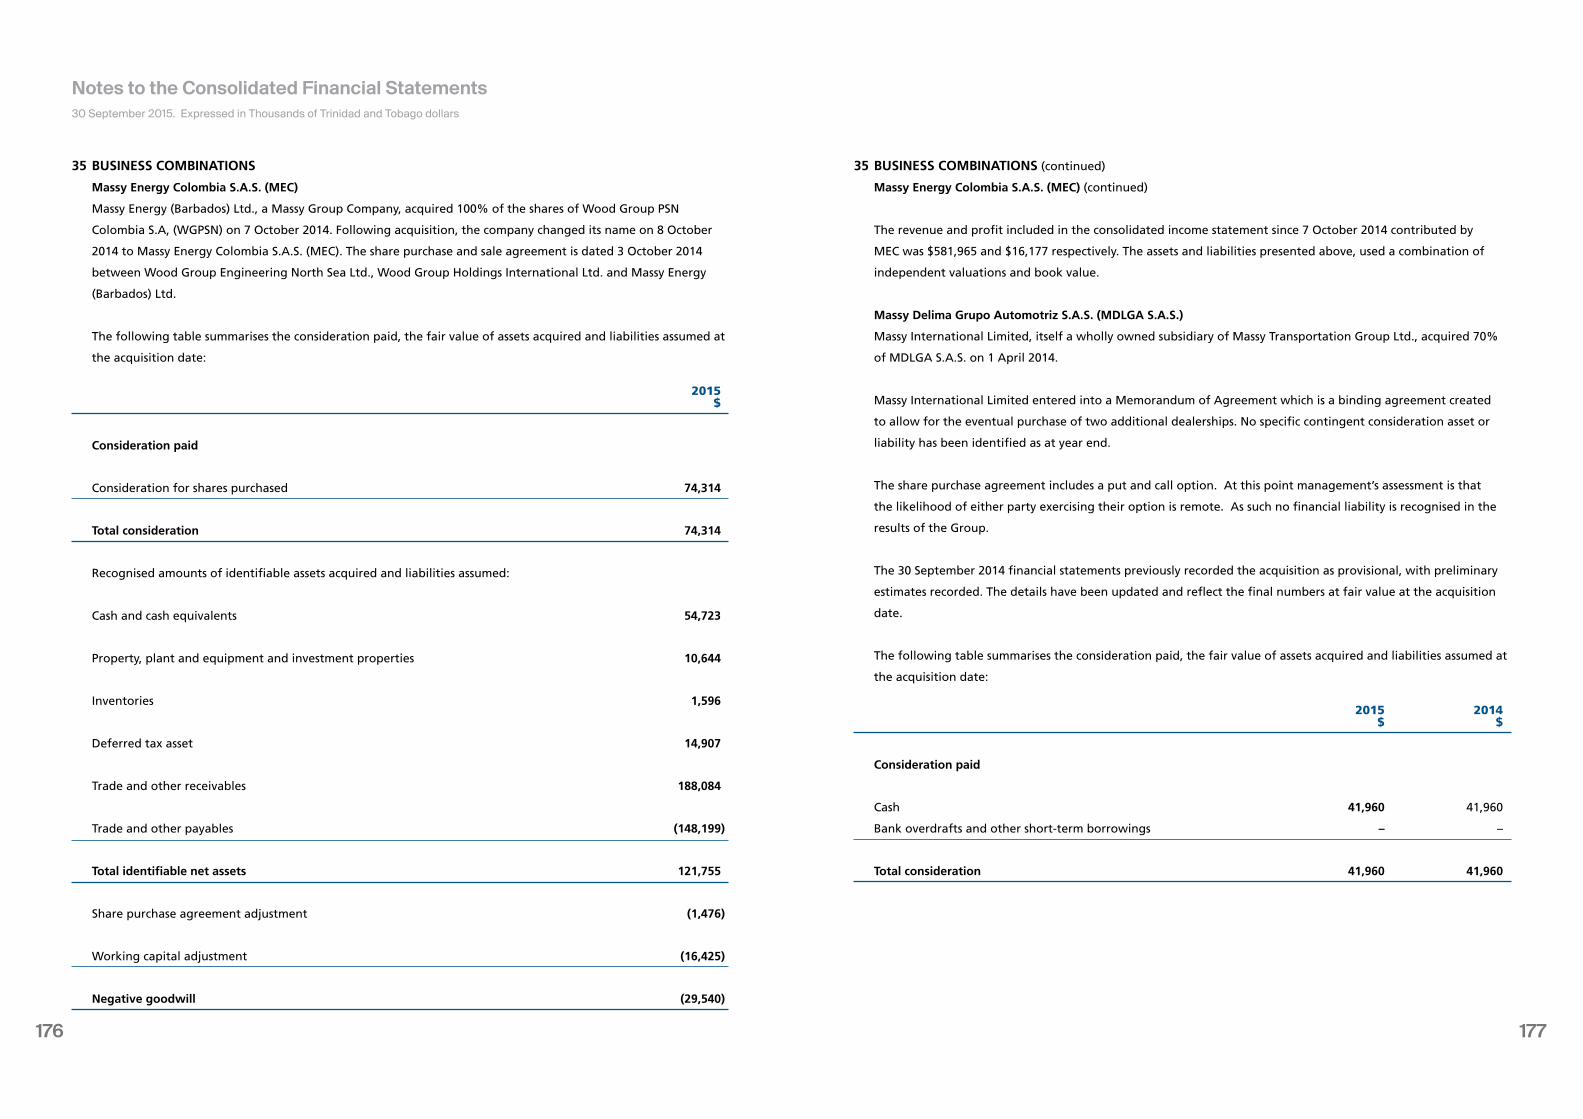
177176
30 September 2015. Expressed in Thousands of Trinidad and Tobago dollars
Notes to the Consolidated Financial Statements
35 BUSINESS COMBINATIONS
Massy Energy Colombia S.A.S. (MEC)
Massy Energy (Barbados) Ltd., a Massy Group Company, acquired 100% of the shares of Wood Group PSN
Colombia S.A, (WGPSN) on 7 October 2014. Following acquisition, the company changed its name on 8 October
2014 to Massy Energy Colombia S.A.S. (MEC). The share purchase and sale agreement is dated 3 October 2014
between Wood Group Engineering North Sea Ltd., Wood Group Holdings International Ltd. and Massy Energy
(Barbados) Ltd.
The following table summarises the consideration paid, the fair value of assets acquired and liabilities assumed at
the acquisition date:
2015 $
Consideration paid
Consideration for shares purchased 74,314
Total consideration 74,314
Recognised amounts of identifiable assets acquired and liabilities assumed:
Cash and cash equivalents 54,723
Property, plant and equipment and investment properties 10,644
Inventories 1,596
Deferred tax asset 14,907
Trade and other receivables 188,084
Trade and other payables (148,199)
Total identifiable net assets 121,755
Share purchase agreement adjustment (1,476)
Working capital adjustment (16,425)
Negative goodwill (29,540)
35 BUSINESS COMBINATIONS (continued)
Massy Energy Colombia S.A.S. (MEC) (continued)
The revenue and profit included in the consolidated income statement since 7 October 2014 contributed by
MEC was $581,965 and $16,177 respectively. The assets and liabilities presented above, used a combination of
independent valuations and book value.
Massy Delima Grupo Automotriz S.A.S. (MDLGA S.A.S.)
Massy International Limited, itself a wholly owned subsidiary of Massy Transportation Group Ltd., acquired 70%
of MDLGA S.A.S. on 1 April 2014.
Massy International Limited entered into a Memorandum of Agreement which is a binding agreement created
to allow for the eventual purchase of two additional dealerships. No specific contingent consideration asset or
liability has been identified as at year end.
The share purchase agreement includes a put and call option. At this point management’s assessment is that
the likelihood of either party exercising their option is remote. As such no financial liability is recognised in the
results of the Group.
The 30 September 2014 financial statements previously recorded the acquisition as provisional, with preliminary
estimates recorded. The details have been updated and reflect the final numbers at fair value at the acquisition
date.
The following table summarises the consideration paid, the fair value of assets acquired and liabilities assumed at
the acquisition date:
2015 2014 $ $
Consideration paid
Cash 41,960 41,960
Bank overdrafts and other short-term borrowings – –
Total consideration 41,960 41,960
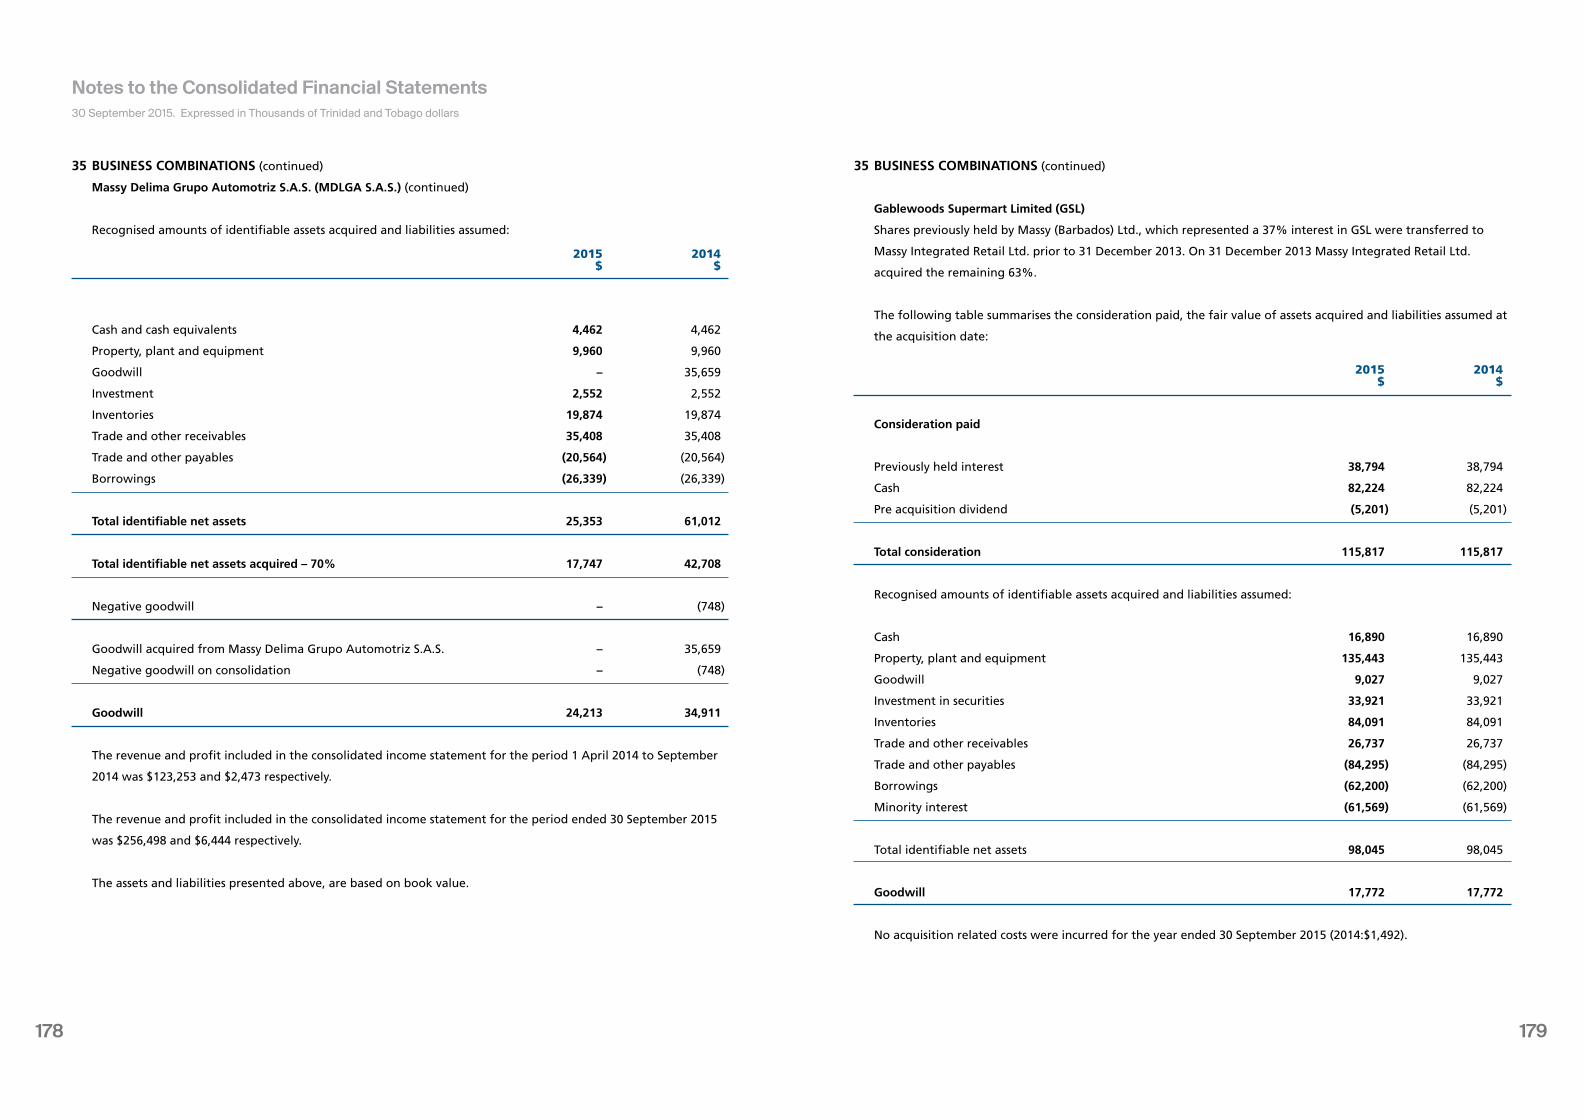
179178
30 September 2015. Expressed in Thousands of Trinidad and Tobago dollars
Notes to the Consolidated Financial Statements
35 BUSINESS COMBINATIONS (continued)
Massy Delima Grupo Automotriz S.A.S. (MDLGA S.A.S.) (continued)
Recognised amounts of identifiable assets acquired and liabilities assumed: 2015 2014 $ $
Cash and cash equivalents 4,462 4,462
Property, plant and equipment 9,960 9,960
Goodwill – 35,659
Investment 2,552 2,552
Inventories 19,874 19,874
Trade and other receivables 35,408 35,408
Trade and other payables (20,564) (20,564)
Borrowings (26,339) (26,339)
Total identifiable net assets 25,353 61,012
Total identifiable net assets acquired – 70% 17,747 42,708
Negative goodwill – (748)
Goodwill acquired from Massy Delima Grupo Automotriz S.A.S. – 35,659
Negative goodwill on consolidation – (748)
Goodwill 24,213 34,911
The revenue and profit included in the consolidated income statement for the period 1 April 2014 to September
2014 was $123,253 and $2,473 respectively.
The revenue and profit included in the consolidated income statement for the period ended 30 September 2015
was $256,498 and $6,444 respectively.
The assets and liabilities presented above, are based on book value.
35 BUSINESS COMBINATIONS (continued)
Gablewoods Supermart Limited (GSL)
Shares previously held by Massy (Barbados) Ltd., which represented a 37% interest in GSL were transferred to
Massy Integrated Retail Ltd. prior to 31 December 2013. On 31 December 2013 Massy Integrated Retail Ltd.
acquired the remaining 63%.
The following table summarises the consideration paid, the fair value of assets acquired and liabilities assumed at
the acquisition date:
2015 2014 $ $
Consideration paid
Previously held interest 38,794 38,794
Cash 82,224 82,224
Pre acquisition dividend (5,201) (5,201)
Total consideration 115,817 115,817
Recognised amounts of identifiable assets acquired and liabilities assumed:
Cash 16,890 16,890
Property, plant and equipment 135,443 135,443
Goodwill 9,027 9,027
Investment in securities 33,921 33,921
Inventories 84,091 84,091
Trade and other receivables 26,737 26,737
Trade and other payables (84,295) (84,295)
Borrowings (62,200) (62,200)
Minority interest (61,569) (61,569)
Total identifiable net assets 98,045 98,045
Goodwill 17,772 17,772
No acquisition related costs were incurred for the year ended 30 September 2015 (2014:$1,492).
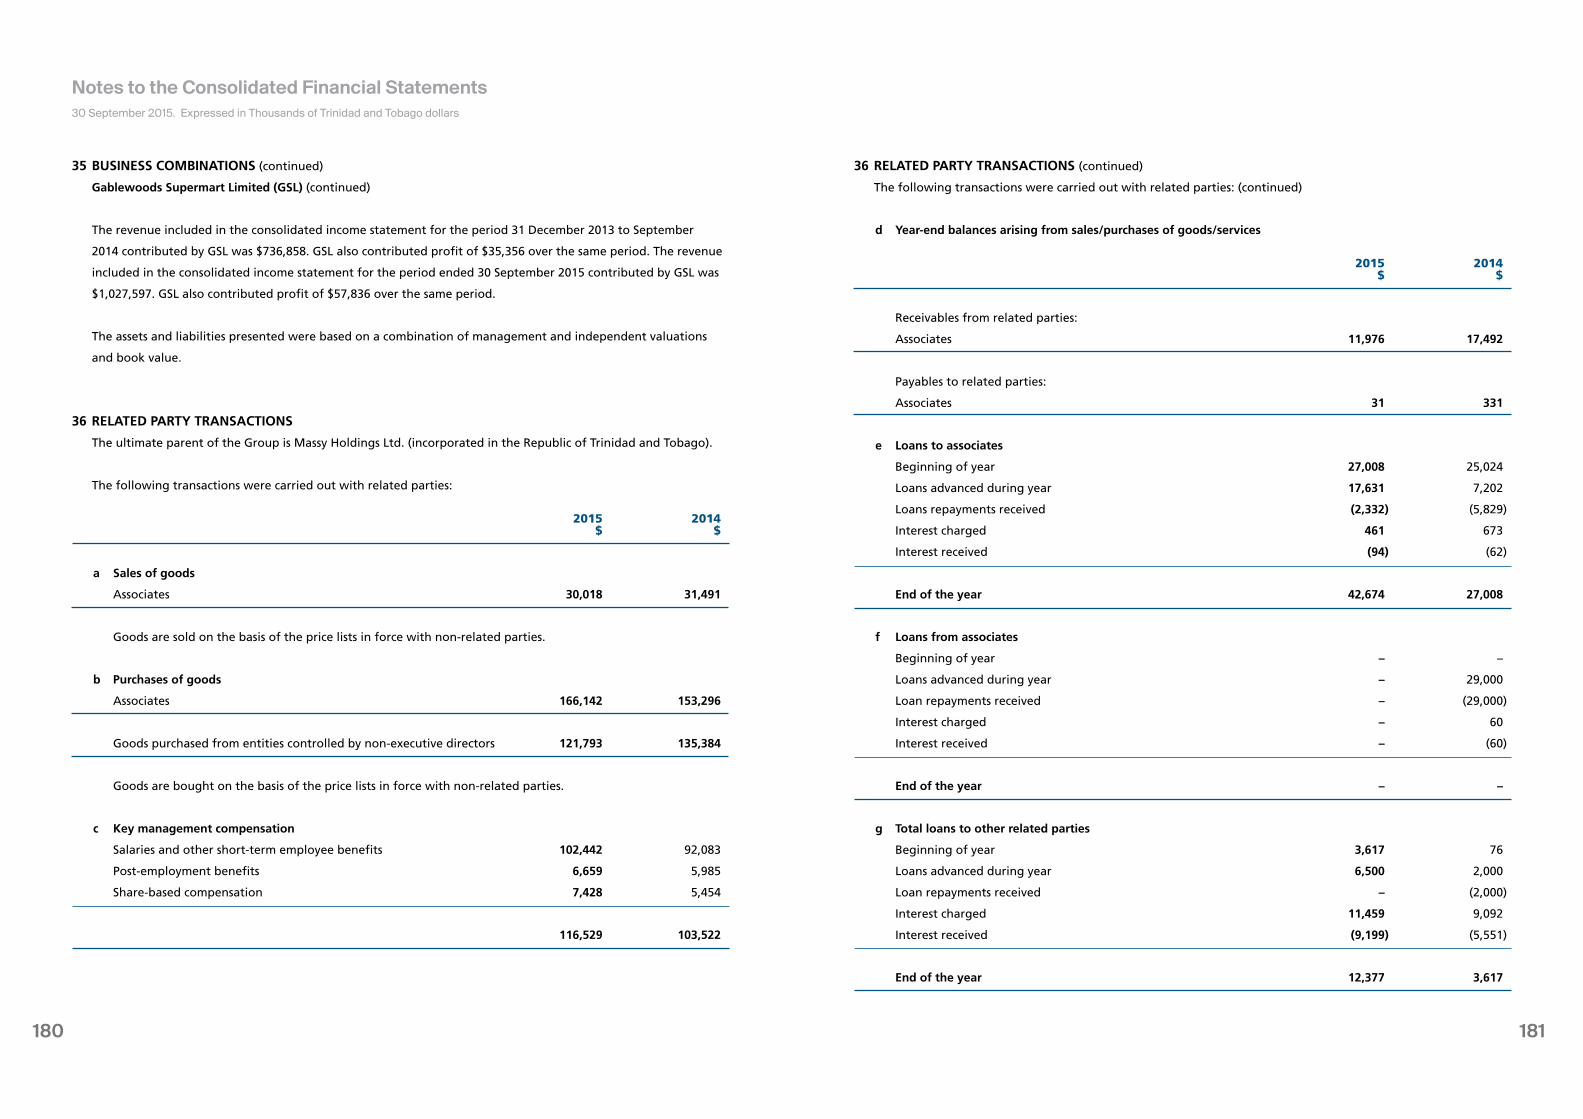
181180
30 September 2015. Expressed in Thousands of Trinidad and Tobago dollars
Notes to the Consolidated Financial Statements
35 BUSINESS COMBINATIONS (continued)
Gablewoods Supermart Limited (GSL) (continued)
The revenue included in the consolidated income statement for the period 31 December 2013 to September
2014 contributed by GSL was $736,858. GSL also contributed profit of $35,356 over the same period. The revenue
included in the consolidated income statement for the period ended 30 September 2015 contributed by GSL was
$1,027,597. GSL also contributed profit of $57,836 over the same period.
The assets and liabilities presented were based on a combination of management and independent valuations
and book value.
36 RELATED PARTY TRANSACTIONS
The ultimate parent of the Group is Massy Holdings Ltd. (incorporated in the Republic of Trinidad and Tobago).
The following transactions were carried out with related parties:
2015 2014 $ $
a Sales of goods
Associates 30,018 31,491
Goods are sold on the basis of the price lists in force with non-related parties.
b Purchases of goods
Associates 166,142 153,296
Goods purchased from entities controlled by non-executive directors 121,793 135,384
Goods are bought on the basis of the price lists in force with non-related parties.
c Key management compensation
Salaries and other short-term employee benefits 102,442 92,083
Post-employment benefits 6,659 5,985
Share-based compensation 7,428 5,454
116,529 103,522
36 RELATED PARTY TRANSACTIONS (continued)
The following transactions were carried out with related parties: (continued)
d Year-end balances arising from sales/purchases of goods/services
2015 2014 $ $
Receivables from related parties:
Associates 11,976 17,492
Payables to related parties:
Associates 31 331
e Loans to associates
Beginning of year 27,008 25,024
Loans advanced during year 17,631 7,202
Loans repayments received (2,332) (5,829)
Interest charged 461 673
Interest received (94) (62)
End of the year 42,674 27,008
f Loans from associates
Beginning of year – –
Loans advanced during year – 29,000
Loan repayments received – (29,000)
Interest charged – 60
Interest received – (60)
End of the year – –
g Total loans to other related parties
Beginning of year 3,617 76
Loans advanced during year 6,500 2,000
Loan repayments received – (2,000)
Interest charged 11,459 9,092
Interest received (9,199) (5,551)
End of the year 12,377 3,617
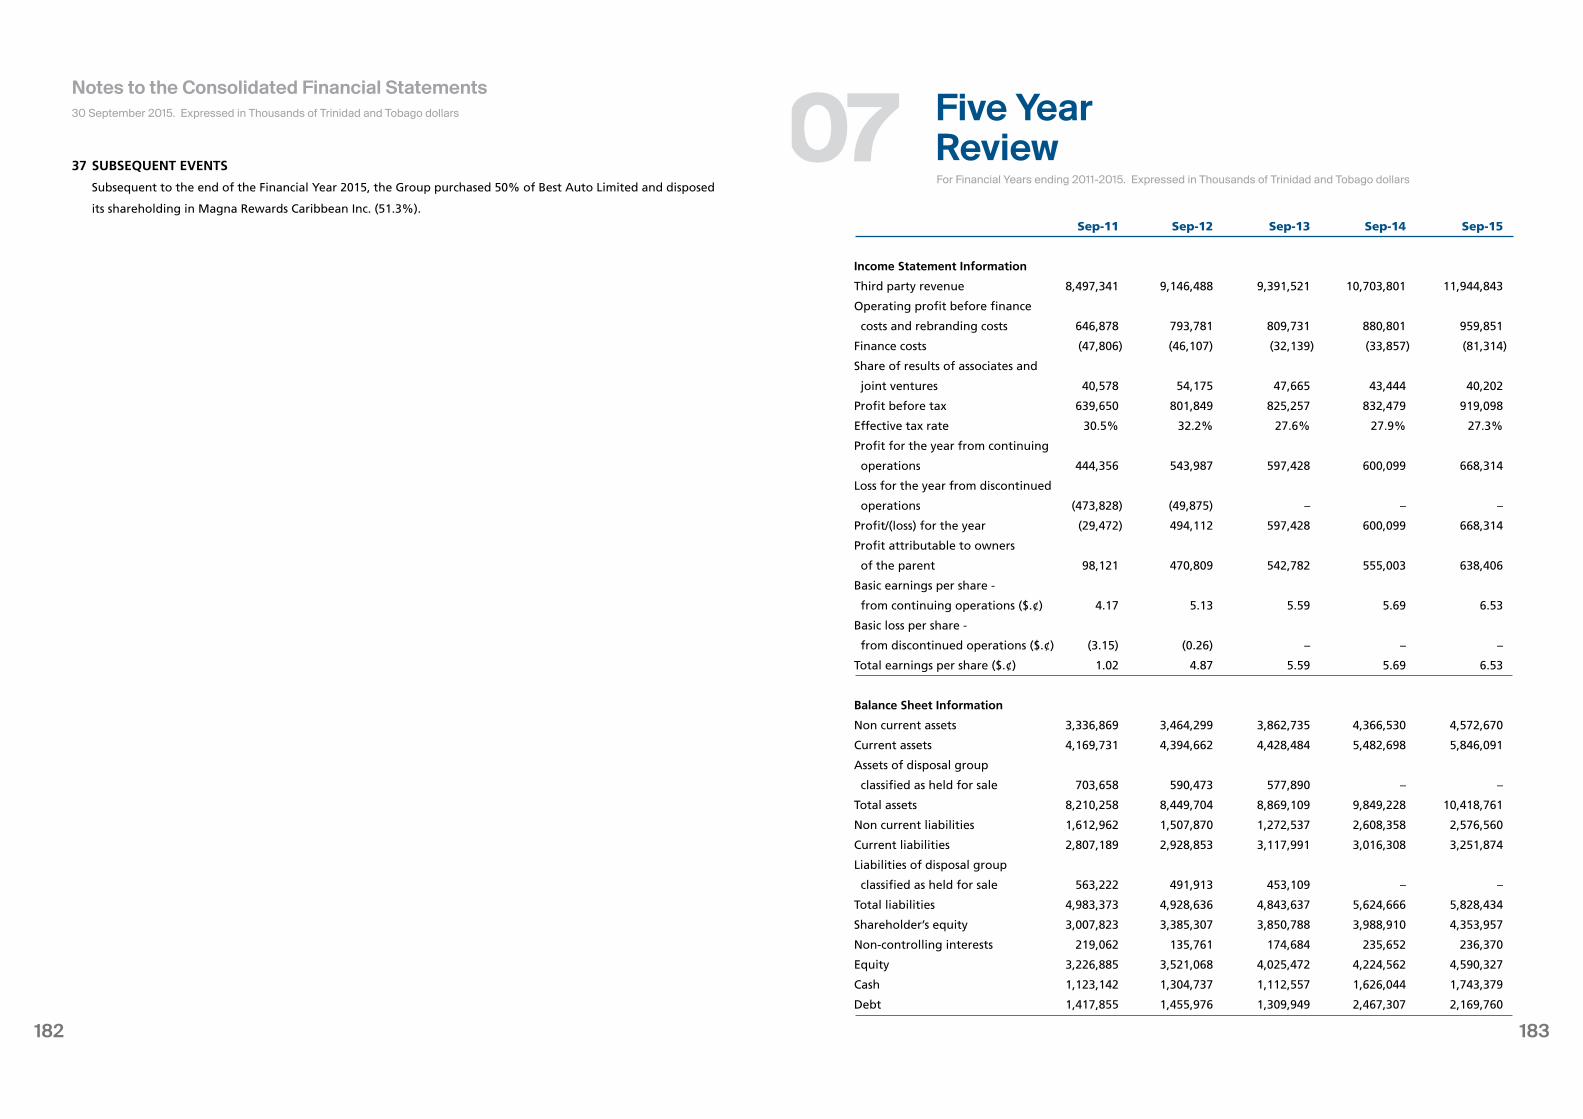
183182
37 SUBSEQUENT EVENTS
Subsequent to the end of the Financial Year 2015, the Group purchased 50% of Best Auto Limited and disposed
its shareholding in Magna Rewards Caribbean Inc. (51.3%).
30 September 2015. Expressed in Thousands of Trinidad and Tobago dollars
Notes to the Consolidated Financial Statements
Sep-11 Sep-12 Sep-13 Sep-14 Sep-15
Income Statement Information
Third party revenue 8,497,341 9,146,488 9,391,521 10,703,801 11,944,843
Operating profit before finance
costs and rebranding costs 646,878 793,781 809,731 880,801 959,851
Finance costs (47,806) (46,107) (32,139) (33,857) (81,314)
Share of results of associates and
joint ventures 40,578 54,175 47,665 43,444 40,202
Profit before tax 639,650 801,849 825,257 832,479 919,098
Effective tax rate 30.5% 32.2% 27.6% 27.9% 27.3%
Profit for the year from continuing
operations 444,356 543,987 597,428 600,099 668,314
Loss for the year from discontinued
operations (473,828) (49,875) – – –
Profit/(loss) for the year (29,472) 494,112 597,428 600,099 668,314
Profit attributable to owners
of the parent 98,121 470,809 542,782 555,003 638,406
Basic earnings per share -
from continuing operations ($.¢) 4.17 5.13 5.59 5.69 6.53
Basic loss per share -
from discontinued operations ($.¢) (3.15) (0.26) – – –
Total earnings per share ($.¢) 1.02 4.87 5.59 5.69 6.53
Balance Sheet Information
Non current assets 3,336,869 3,464,299 3,862,735 4,366,530 4,572,670
Current assets 4,169,731 4,394,662 4,428,484 5,482,698 5,846,091
Assets of disposal group
classified as held for sale 703,658 590,473 577,890 – –
Total assets 8,210,258 8,449,704 8,869,109 9,849,228 10,418,761
Non current liabilities 1,612,962 1,507,870 1,272,537 2,608,358 2,576,560
Current liabilities 2,807,189 2,928,853 3,117,991 3,016,308 3,251,874
Liabilities of disposal group
classified as held for sale 563,222 491,913 453,109 – –
Total liabilities 4,983,373 4,928,636 4,843,637 5,624,666 5,828,434
Shareholder’s equity 3,007,823 3,385,307 3,850,788 3,988,910 4,353,957
Non-controlling interests 219,062 135,761 174,684 235,652 236,370
Equity 3,226,885 3,521,068 4,025,472 4,224,562 4,590,327
Cash 1,123,142 1,304,737 1,112,557 1,626,044 1,743,379
Debt 1,417,855 1,455,976 1,309,949 2,467,307 2,169,760
For Financial Years ending 2011-2015. Expressed in Thousands of Trinidad and Tobago dollars
Five YearReview07
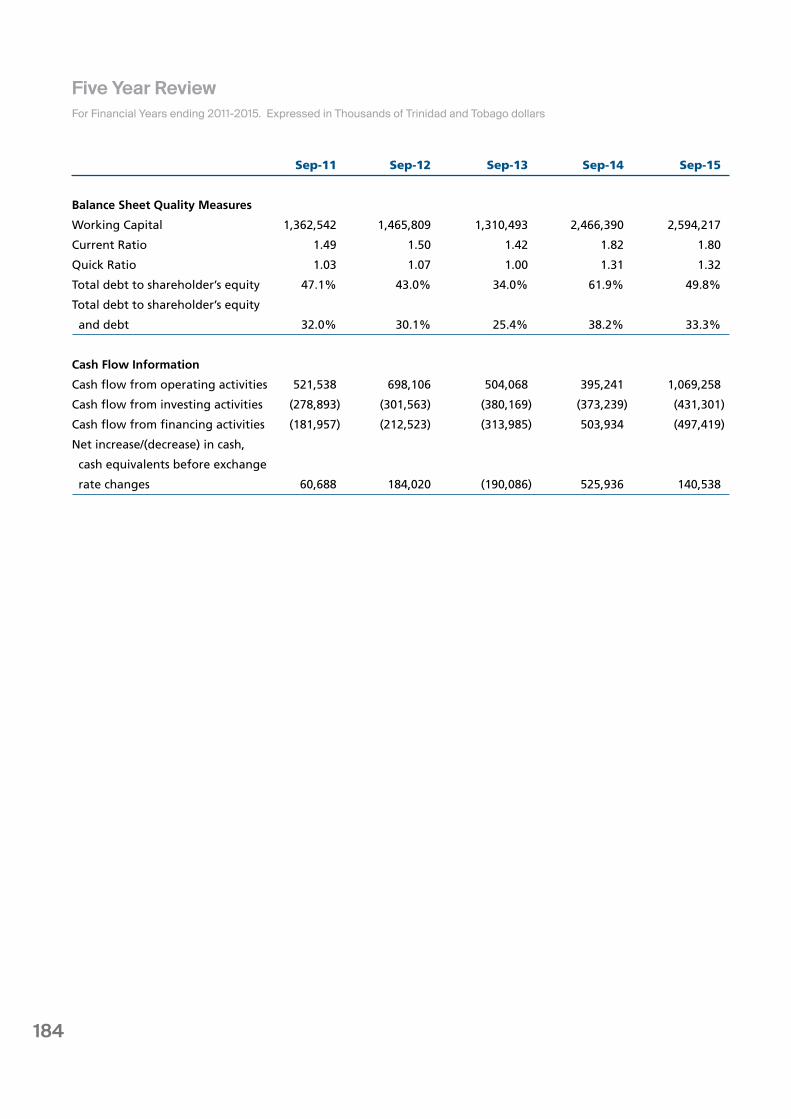
184
For Financial Years ending 2011-2015. Expressed in Thousands of Trinidad and Tobago dollars
Five Year Review
Sep-11 Sep-12 Sep-13 Sep-14 Sep-15
Balance Sheet Quality Measures
Working Capital 1,362,542 1,465,809 1,310,493 2,466,390 2,594,217
Current Ratio 1.49 1.50 1.42 1.82 1.80
Quick Ratio 1.03 1.07 1.00 1.31 1.32
Total debt to shareholder’s equity 47.1% 43.0% 34.0% 61.9% 49.8%
Total debt to shareholder’s equity
and debt 32.0% 30.1% 25.4% 38.2% 33.3%
Cash Flow Information
Cash flow from operating activities 521,538 698,106 504,068 395,241 1,069,258
Cash flow from investing activities (278,893) (301,563) (380,169) (373,239) (431,301)
Cash flow from financing activities (181,957) (212,523) (313,985) 503,934 (497,419)
Net increase/(decrease) in cash,
cash equivalents before exchange
rate changes 60,688 184,020 (190,086) 525,936 140,538