Embed Size (px)
Citation preview

Virtual DBS Penetration Analysis
Example B2C V-Profiler

Waterfall Report
Geofootprint Consumer Universe Count: 2,992,494 Total Client Count: 6,823
Deliverable Addresses: 6,623
Unique Client Records: 5,135
Unique Appends: 3,669
Unique Match Rate: 71% Matching to Demographics: A waterfall report in this context is a summary of what occurs with customer records as they go through the enhancement process (match and append demographics from out multi-source data files). Only matched records can be included in the profiling. For this project, we loaded all customer records and succeeded in matching-and-appending demographics to a statistically significant amount of records, producing strong statistical reliability within the profile.
Sample Comparison: The defined universe is based on a GeoFootprint, dynamically created from your customer base. This GeoFootprint is based on statistically significant SCFs with at least 5 populated records.
Interpreting the Report: In the following charts Green Bars are a "Go" and indicate significant over-penetration of customers (index values > 115). Yellow bars are "Cautionary" as they represent slight over-penetration (index values 85-115) yet may be very important predictors when they are combined with other demographics. Red bars are a "Stop" (index values <85) as they represent areas of under-penetration within the market and do not discriminate customer characteristics from a Consumer Universe.
vProfiler version 1.8.9

Distribution:
This map depicts the geographical representation of your customers based on their geo-footprint provided in the processed file.
Heat Map Report

Targeted Heat Map Report
This map depicts the geographical representation of your customers based on their geo-footprint provided in the processed file.
Distribution:

Region
East North Central: IL, IN, OH, MI, & WI East South Central: AL, KY, MS, & TN Middle Atlantic: NJ, NY, & PA Mountain: AZ, CO, ID, MT, NV, NM, UT, & WY New England: CT, ME, MA, NH, RI, & VT Pacific: AK, CA, HI, OR, & WA South Atlantic: DE, FL, GA, MD, NC, SC, VA, DC, & WV West North Central: IA, KS, MN, MO, NE, ND, & SD West South Central: AR, LA, OK, & TX

County

Age Description

Household Type

Gender
Marital Status

Ethnicity

Household Income
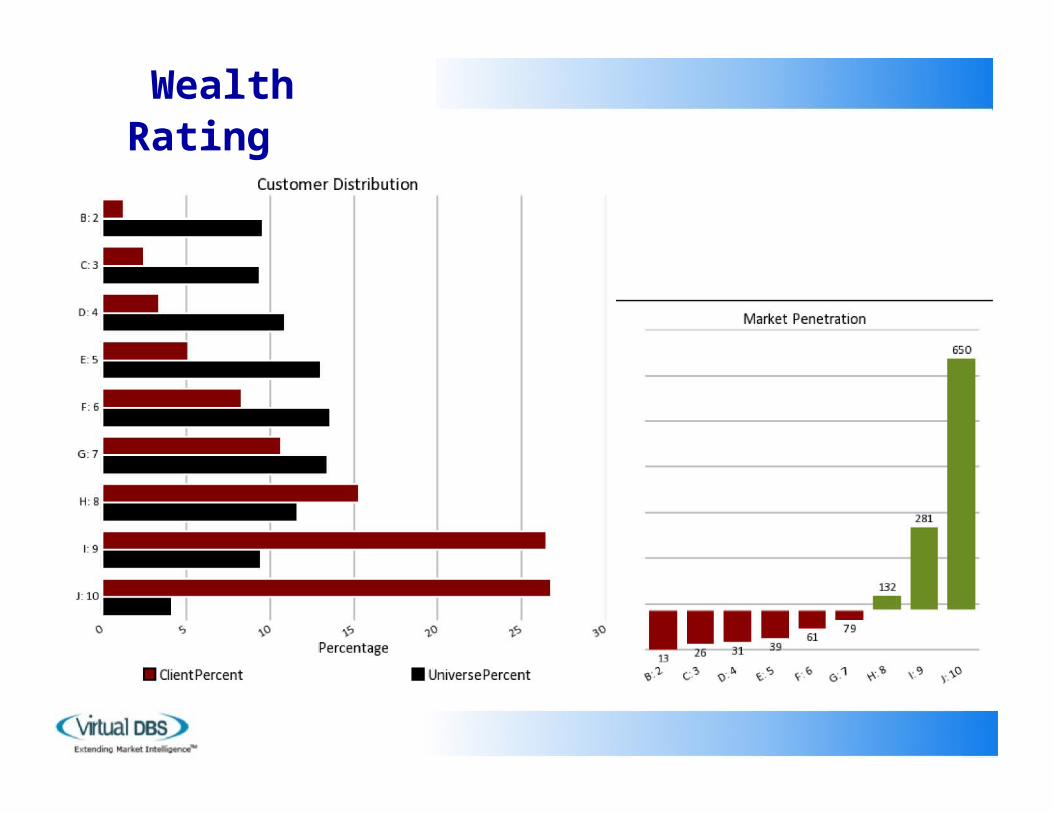
Wealth Rating
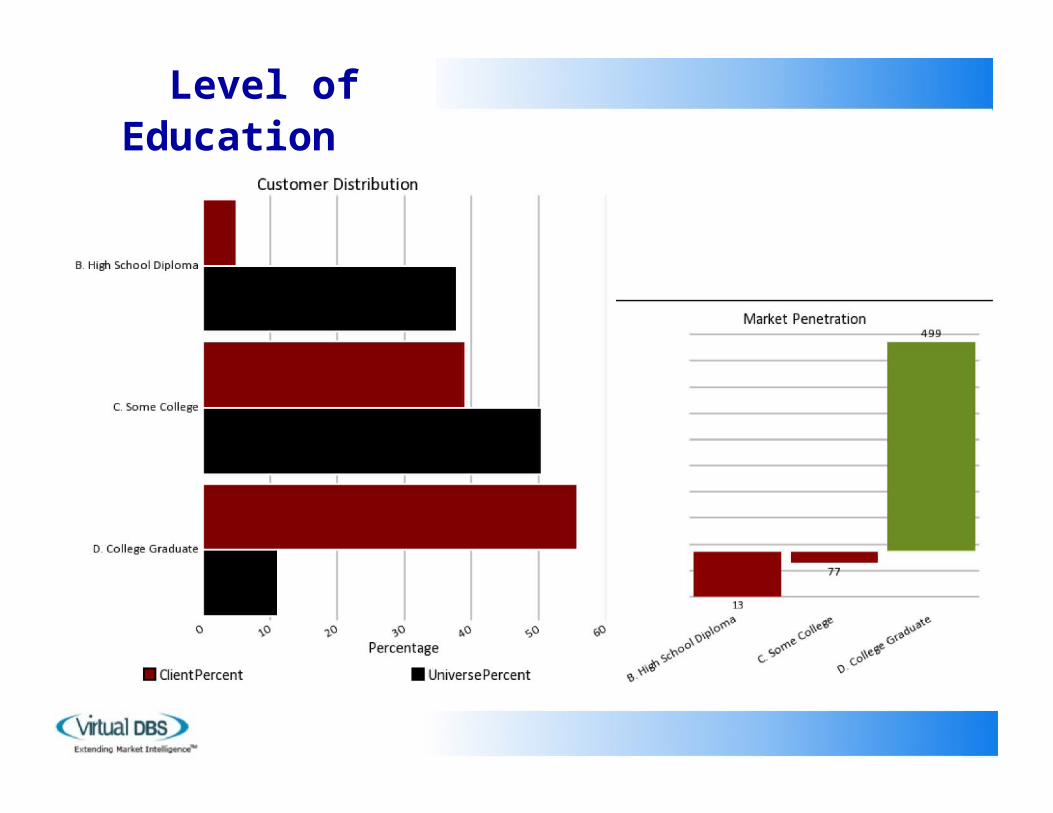
Level of Education

Presence of Children

Number of Children (When Present)
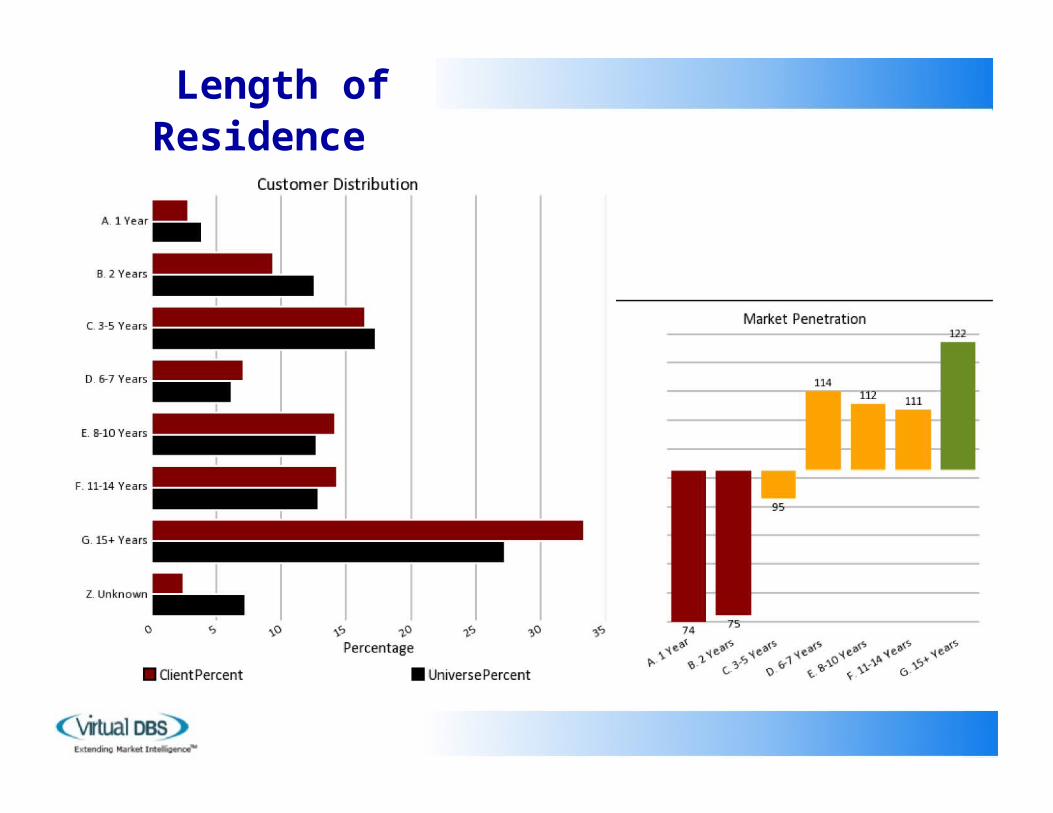
Length of Residence
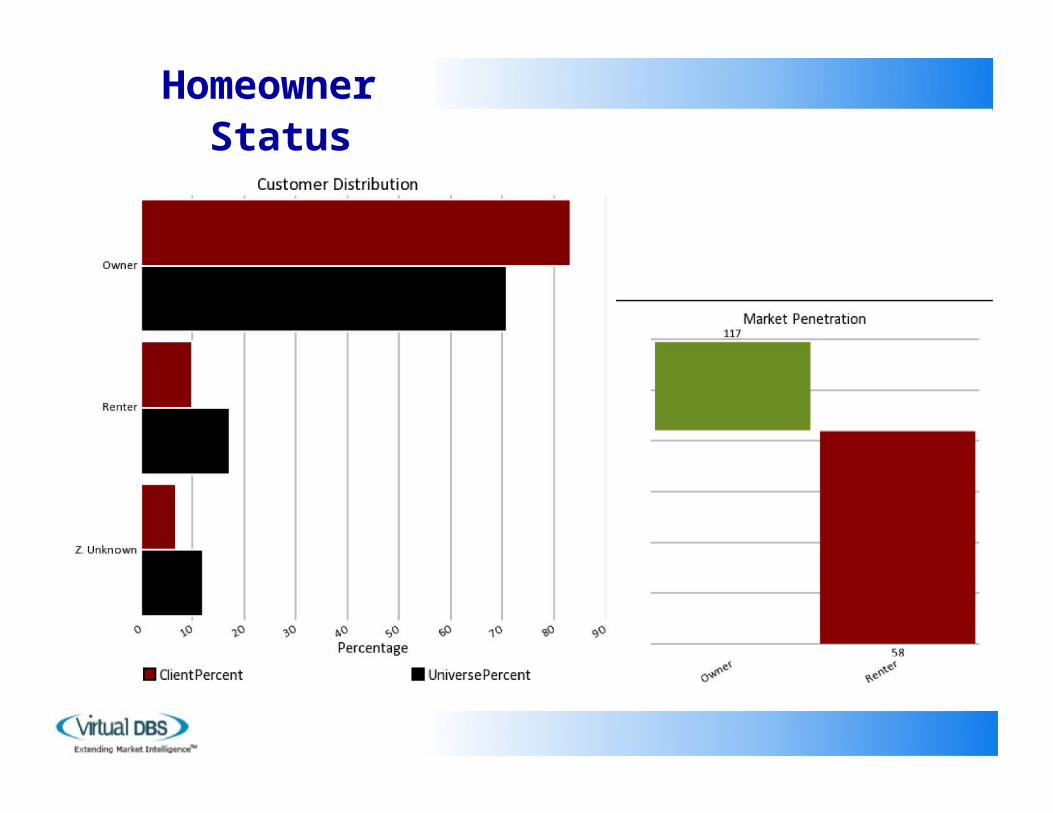
Homeowner Status

Dwelling Type
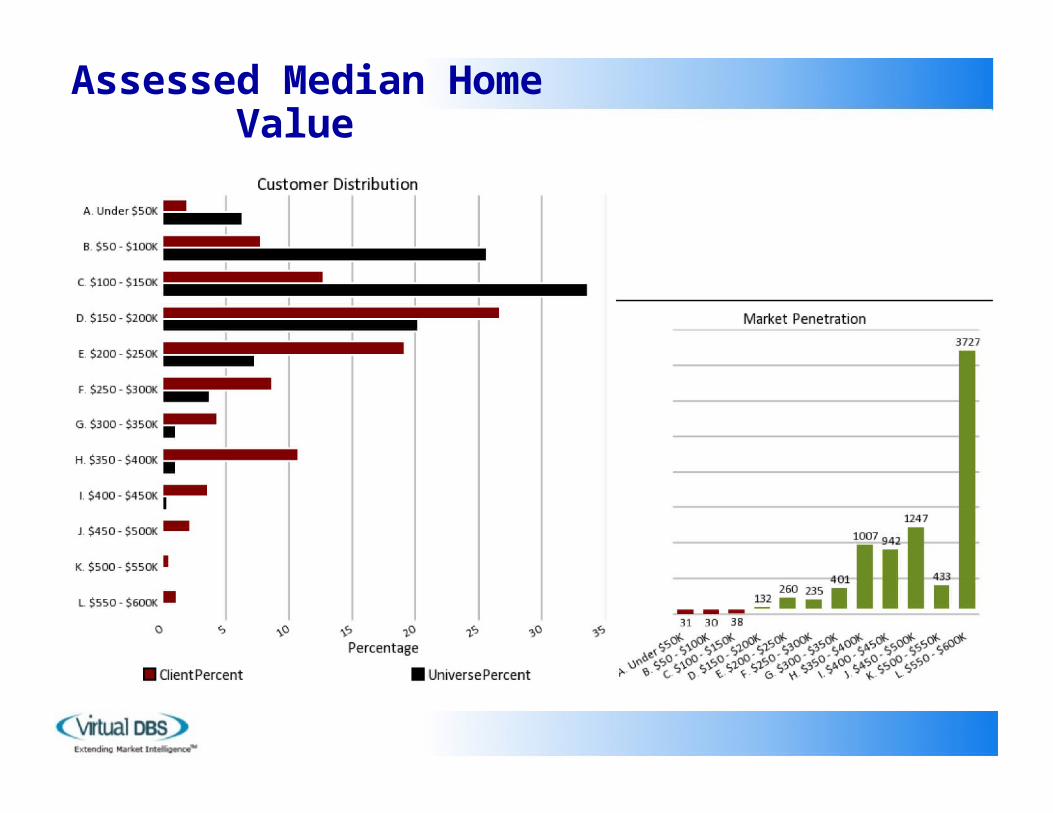
Assessed Median Home Value

Mail Responder
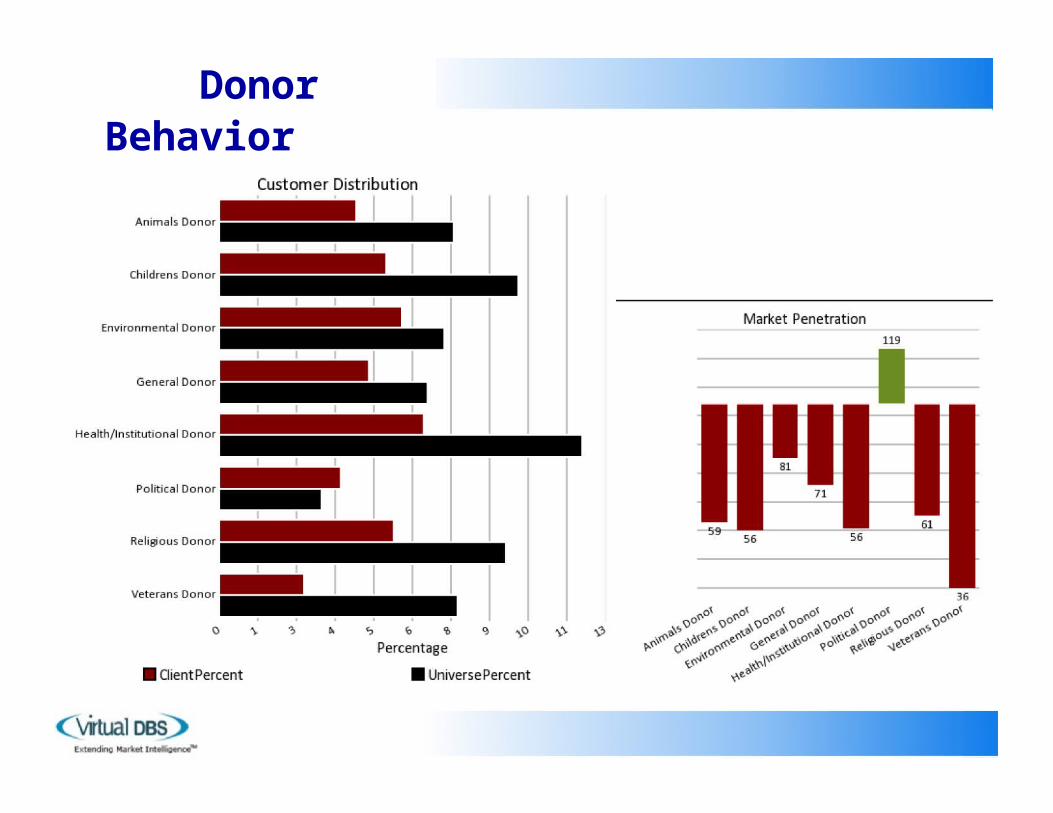
Donor Behavior

Interests
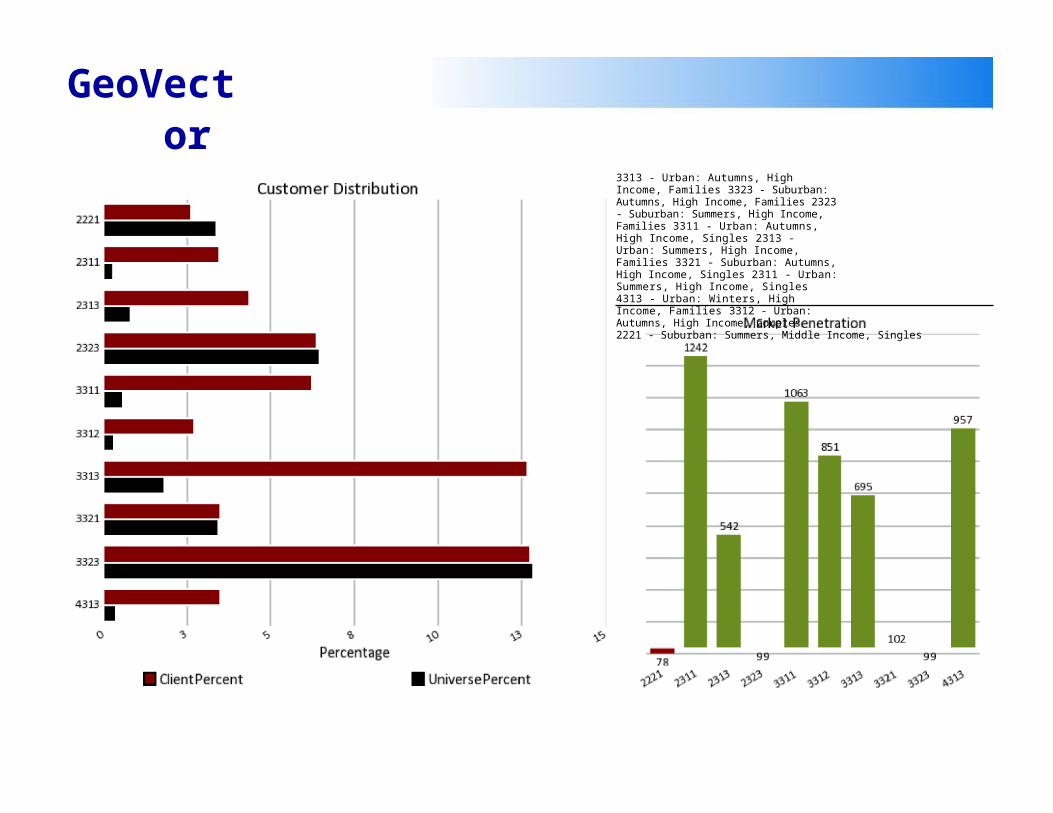
GeoVector
3313 - Urban: Autumns, High Income, Families 3323 - Suburban: Autumns, High Income, Families 2323 - Suburban: Summers, High Income, Families 3311 - Urban: Autumns, High Income, Singles 2313 - Urban: Summers, High Income, Families 3321 - Suburban: Autumns, High Income, Singles 2311 - Urban: Summers, High Income, Singles 4313 - Urban: Winters, High Income, Families 3312 - Urban: Autumns, High Income, Couples 2221 - Suburban: Summers, Middle Income, Singles

GeoVector
Descriptions Springs Urban Springs are made up of younger 18 - 24 year olds who reside in Urban areas with lower levels of annual income under $40,000, or mid level income levels in the range of $40,000 - $74,999, or higher levels of annual income in the $75,000+ range and are comprised of singles, couples and families.
Suburban Springs are made up of younger 18 - 24 year olds who reside in suburban areas with lower levels of annual income under $40,000, or mid level income levels in the range of $40,000 - $74,999, or higher levels of annual income in the $75,000+ range and are comprised of singles, couples and families.
Rural Springs are made up of younger 18 - 24 year olds who reside in rural areas with lower levels of annual income under $40,000, or mid level income levels in the range of $40,000 - $74,999, or higher levels of annual income in the $75,000+ range and are comprised of singles, couples and families.
Summers Urban Summers are made up of prime age 25 - 44 year olds who reside in Urban areas with lower levels of annual income under $40,000, or mid level income levels in the range of $40,000 - $74,999, or higher levels of annual income in the $75,000+ range and are comprised of singles, couples and families.
Suburban Summers are made up of prime age 25 - 44 year olds who reside in suburban areas with lower levels of annual income under $40,000, or mid level income levels in the range of $40,000 - $74,999, or higher levels of annual income in the $75,000+ range and are comprised of singles, couples and families.
Rural Summers are made up of prime age 25 - 44 year olds who reside in rural areas with lower levels of annual income under $40,000, or mid level income levels in the range of $40,000 - $74,999, or higher levels of annual income in the $75,000+ range and are comprised of singles, couples and families.
Autumns Urban Autumns are made up of middle age 45 - 64 year olds who reside in Urban areas with lower levels of annual income under $40,000, or mid level income levels in the range of $40,000 - $74,999, or higher levels of annual income in the $75,000+ range and are comprised of singles, couples and families.
Suburban Autumns are made up of middle age 45 - 64 year olds who reside in suburban areas with lower levels of annual income under $40,000, or mid level income levels in the range of $40,000 - $74,999, or higher levels of annual income in the $75,000+ range and are comprised of singles, couples and families.
Rural Autumns are made up of midde age 45 - 64 year olds who reside in rural areas with lower levels of annual income under $40,000, or mid level income levels in the range of $40,000 - $74,999, or higher levels of annual income in the $75,000+ range and are comprised of singles, couples and families.
Winters Urban Winters are made up of mature age 65+ year olds who reside in Urban areas with lower levels of annual income under $40,000, or mid level income levels in the range of $40,000 - $74,999, or higher levels of annual income in the $75,000+ range and are comprised of singles, couples and families.
Suburban Winters are made up of mature age 65+ year olds who reside in suburban areas with lower levels of annual income under $40,000, or mid level income levels in the range of $40,000 - $74,999, or higher levels of annual income in the $75,000+ range and are comprised of singles, couples and families.
Rural Winters are made up of mature age 65+ year olds who reside in rural areas with lower levels of annual income under $40,000, or mid level income levels in the range of $40,000 - $74,999, or higher levels of annual income in the $75,000+ range and are comprised of singles, couples and families.

Example: B2C VProfiler Plus
Next Steps... Scoring and VProfiler Plus
Example VProfiler Deliverable Included Below
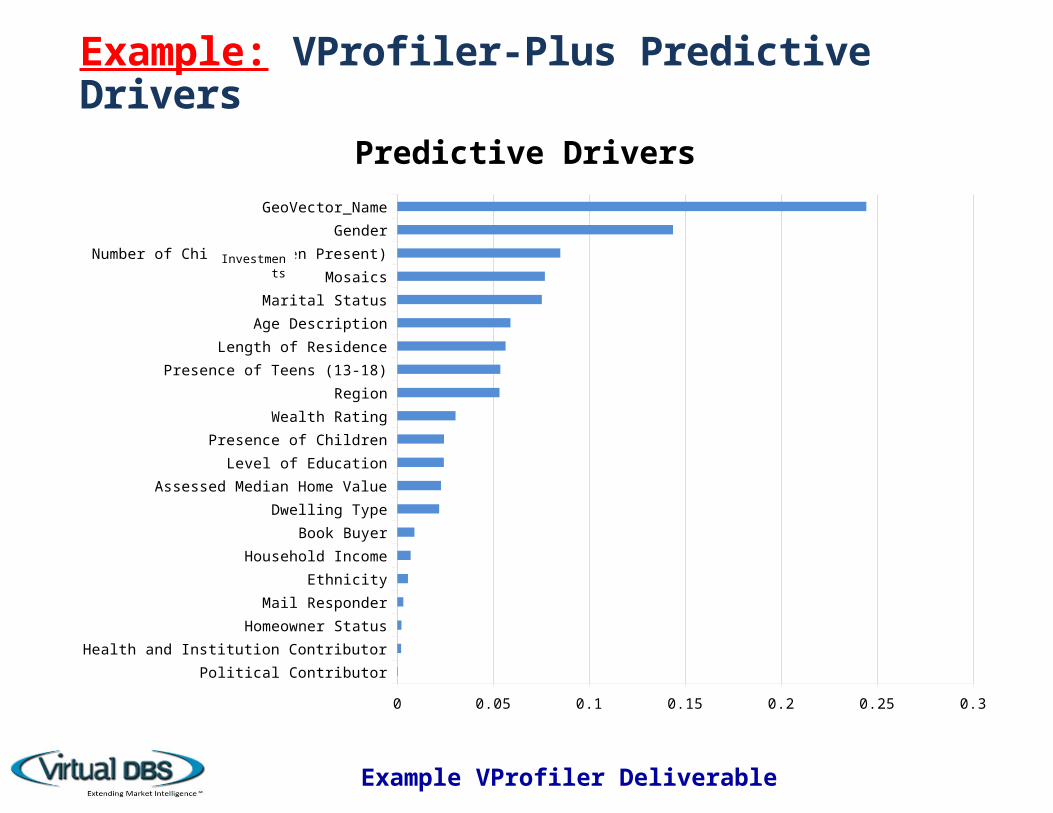
Example: VProfiler-Plus Predictive Drivers
Political Contributor
Health and Institution Contributor
Homeowner Status
Mail Responder
Ethnicity
Household Income
Book Buyer
Dwelling Type
Assessed Median Home Value
Level of Education
Presence of Children
Wealth Rating
Region
Presence of Teens (13-18)
Length of Residence
Age Description
Marital Status
Mosaics
Number of Children (When Present)
Gender
GeoVector_Name
0 0.05 0.1 0.15 0.2 0.25 0.3
Predictive Drivers
Example VProfiler Deliverable
Investments

Example: VProfiler-Plus Model Performance and Validation
Model performance indicates that deciles 1-4 have the greatest lift. Detection of seeds suggests that mailing to 20% of the top scoring records would yield a probability of capturing 60% of responders, while mailing to 30% of the list would yield a probability of capturing nearly 70% of responders in top 2 probability tiers
Model Scoring Validation Gains TableDemi -Decile Random
Validation Lift
Prospect Selection
5% 1 5.21
Deciles 1-4
10% 1 4.5115% 1 3.8320% 1 3.3725% 1 2.9830% 1 2.6735% 1 2.4240% 1 2.2245% 1 2.05
Deciles 5-8
50% 1 1.9055% 1 1.7760% 1 1.6565% 1 1.5470% 1 1.4575% 1 1.3680% 1 1.2985% 1 1.22
Deciles 9-1090% 1 1.1695% 1 1.11
100% 1 1.05
5% 10% 15% 20% 25% 30% 35% 40% 45% 50% 55% 60% 65% 70% 75% 80% 85% 90% 95% 100%
0
1
2
3
4
5
6
Model Performance Gains Chart
Random Perfect Model Model Validation
Example VProfiler Deliverable
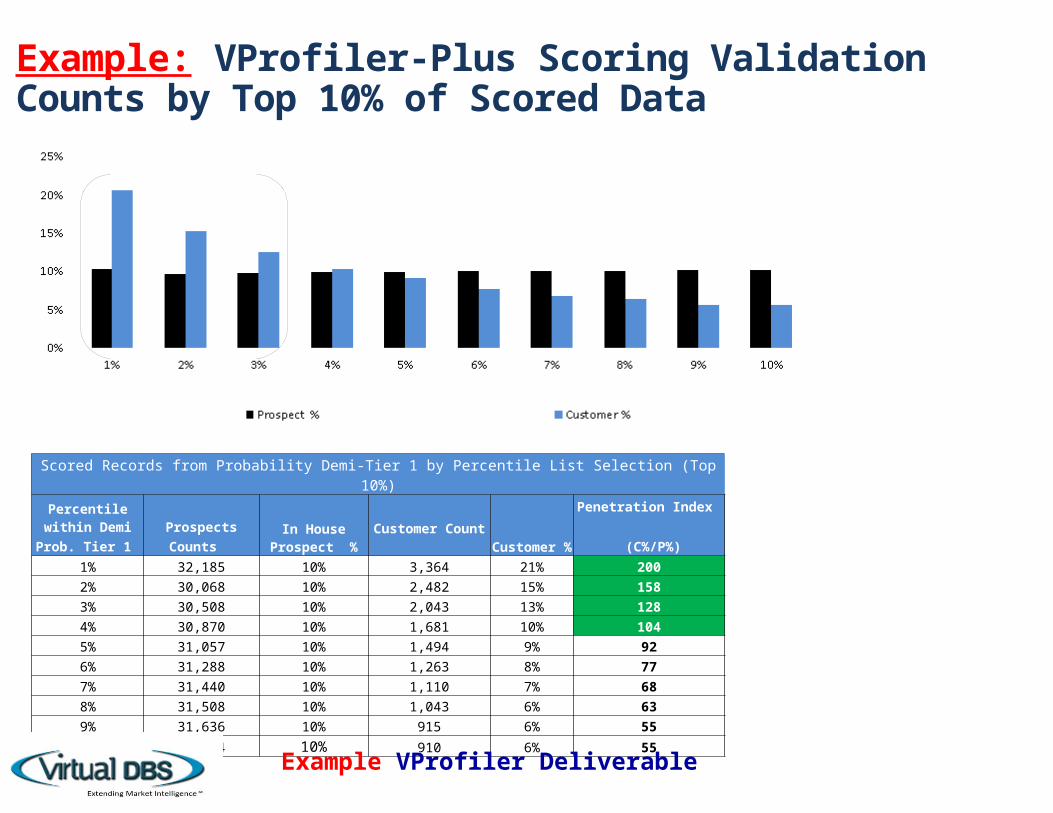
Scored Records from Probability Demi-Tier 1 by Percentile List Selection (Top 10%)
Percentile within Demi Prob. Tier 1 Prospects Counts
In House Prospect % Customer Count Customer %
Penetration Index (C%/P%)
1% 32,185 10% 3,364 21% 2002% 30,068 10% 2,482 15% 1583% 30,508 10% 2,043 13% 1284% 30,870 10% 1,681 10% 1045% 31,057 10% 1,494 9% 926% 31,288 10% 1,263 8% 777% 31,440 10% 1,110 7% 688% 31,508 10% 1,043 6% 639% 31,636 10% 915 6% 55
10% 31,644 10% 910 6% 55
Example: VProfiler-Plus Scoring Validation Counts by Top 10% of Scored Data
Example VProfiler Deliverable

Example: VProfiler-Plus Model and VDBS Scored Prospects Random Sample Bottom 10% Sample Data (Probability Tier 10 Least Likely)
First Age Description Household Income Gender Marital
StatusLength of Residence
Presence of Children Ethnicity GeoVector Top
10 Percent
Lucia B: 25-34 $125,000 - $149,999 Female Married C. 3-5 Years Yes C. CaucasianSuburban: Summers, High
Income, Families 10%
Shelly C: 35-44 $100,000 - $124,999 Female Married C. 3-5 Years Yes C. CaucasianSuburban: Summers, Middle
Income, Families 10%
Christy B: 25-34H: $100,000 -
$124,999 Female Married E. 8-10 Years Yes Z. UnknownSuburban: Summers, High
Income, Families 10%
Gwen C: 35-44 $50,000 - $74,999 Female Single C. 3-5 Years Yes C. CaucasianSuburban: Summers, Middle
Income, Families 10%
Melissa C: 35-44 $150,000 and over Female Married C. 3-5 Years Yes Z. UnknownSuburban: Summers, High
Income, Families 10%
Lindsay B: 25-34 $75,000 - $99,999 Female Single D. 6-7 Years Yes C. CaucasianSuburban: Summers, High
Income, Families 10%
First Age Description Houshold Income Gender Marital Status
Length of Residence
Presence of Children Ethnicity GeoVector Bottom
10 Percent
Nagwa D: 45-54 $29,000 - $39,999 Male Married E. 8-10 Years Unknown Z. UnknownUrban: Autumns, High Income,
Couples 10%
Benson E: 55-64 $50,000 - $74,999 Male Single Z. Unknown Unknown Z. UnknownSuburban: Autumns, High
Income, Singles10%
David E: 55-64 $75,000 - $99,999 Male Single E. 8-10 Years Unknown C. CaucasianUrban: Autumns, High Income,
Singles 10%
Bennieruth F: 65-74 $75,000 - $99,999 Male Single E. 8-10 Years Unknown Z. UnknownSuburban: Winters, High
Income, Singles10%
Fidel D: 45-54 $50,000 - $74,999 Male Single Z. Unknown Unknown Z. UnknownSuburban: Autumns, Middle
Income, Singles 10%
Charles E: 55-64 $39,000 - $49,999 Male Single F. 11-14 Years Unknown Z. UnknownUrban: Autumns, Middle
Income, Singles10%
Example: VProfiler-Plus Model and VDBS Scored Prospect Random Sample Top 10% Sample Data (Probability Tier 1 Most Likely)
Example VProfiler Scoring Deliverable

End Example Virtual DBS B2C VProfiler-Plus Scoring Report
Next Steps: Score Universe of Prospects Select Top Scoring RecordsDevelop Campaign StrategiesTrack and Evaluate