Embed Size (px)
Citation preview
VIRTUAL CONNECTION TREE OVER MULTIPLE ACCESS
TECHNIQUES FOR 3G WIRELESS COMMUNICATION SYSTEMS
A. Heath and R.A. Carrasco
School of Engineering and Advanced Technology, Staffordshire University
PO BOX 333, Beaconside, Stafford ST18 0DF, Staffordshire, U.K.
Emails: [email protected], [email protected]
Abstract: This paper evaluates a Virtual Connection Tree (VCT) algorithm for mobile Asynchronous
Transfer Mode (ATM) handoff that offers service adaptability and efficient allocation of wired resources is
applied to different multiple access techniques. This creates a more distributed system where decisions about
traffic conditions in different areas can be evaluated at the Base Station (BS) level and not the Master
Switching Centre (MSC) level.
Keywords: 3G, VCT, ATM, Mobile Communications
1 Introduction
In future third generation (3G) systems it is anticipated that wireless, wired and satellite communications will
be integrated in one system where multimedia data will be transferred at bit rates up to 2Mbits/sec [1]. Data
traffic is growing at a much faster rate than voice, so new and efficient mediums are required to transport this
information [2]. A medium that can be used to integrate multimedia traffic is ATM technology, which is a
wired infrastructure that provides excellent QoS [3-5]. This paper presents a way in which Mobile ATM can
be used to improve the QoS for many users in a network.
Extensive research has been conducted to determine the best multiple access technique for future mobile
communication systems where CDMA, TDMA, PRMA, FDMA and combinations of these are employed [6-
8]. This paper considers the advantages of applying the VCT algorithm developed in [9,10] to each of the
aforementioned technologies. In the future it is thought that the MSC will be removed from the system model,
as in ad-hoc networks and that Internet Protocol (IP) traffic may be transmitted over an ATM backbone [11],
due to the QoS guarantees.
It has been demonstrated in [12] that the service adaptable handoff algorithm can be applied to data rates of
up to 2Mbits/sec and above without significant degradation of service. A solution to the mobile handoff
problem was illustrated in [13] in which the MSC is not involved with the handoff but wired resources are
wasted unlike the proposal in [12]. Using the Call Admission Control Algorithm which is presented in [9, 10,
12] and developed in this paper a more distributed system is created.
Section 2 examines how the VCT can be applied to various multiple access techniques, while section 3
presents call/carrier communication algorithm. Section 4 details the simulations and a discussion of the
results and finally section 5 is used to draw conclusions and suggestions of future work.
2 Virtual Connection Tree
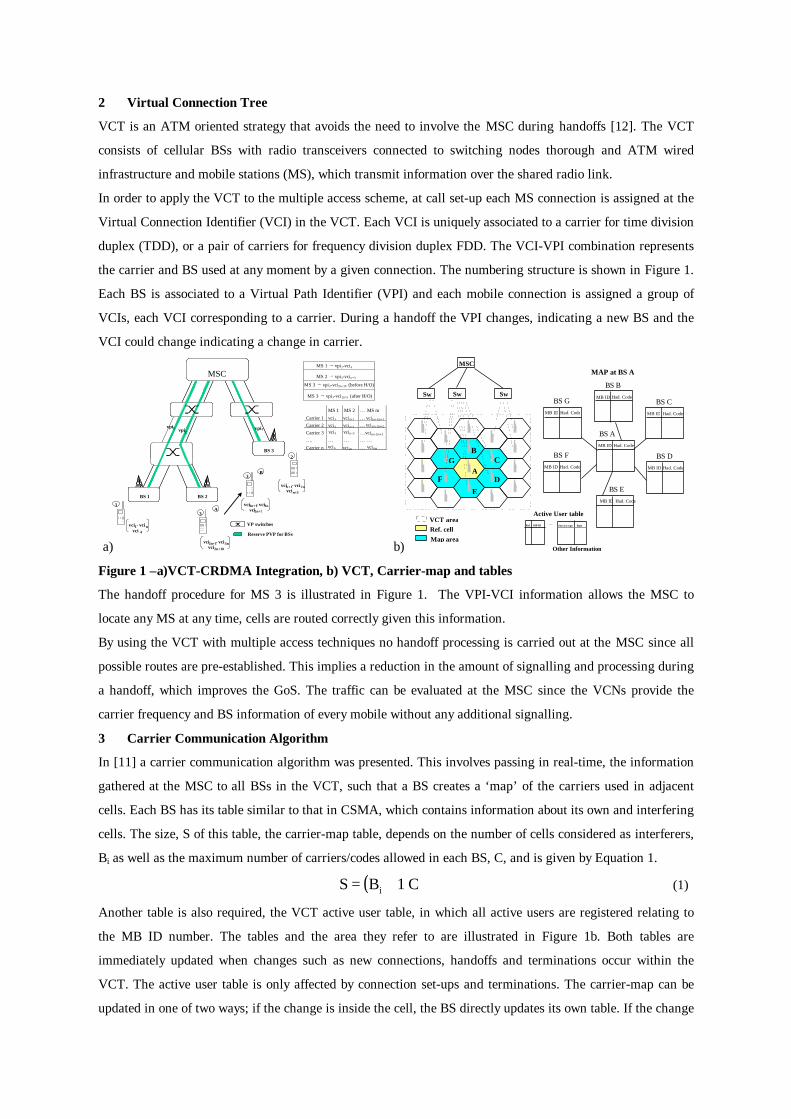
VCT is an ATM oriented strategy that avoids the need to involve the MSC during handoffs [12]. The VCT
consists of cellular BSs with radio transceivers connected to switching nodes thorough and ATM wired
infrastructure and mobile stations (MS), which transmit information over the shared radio link.
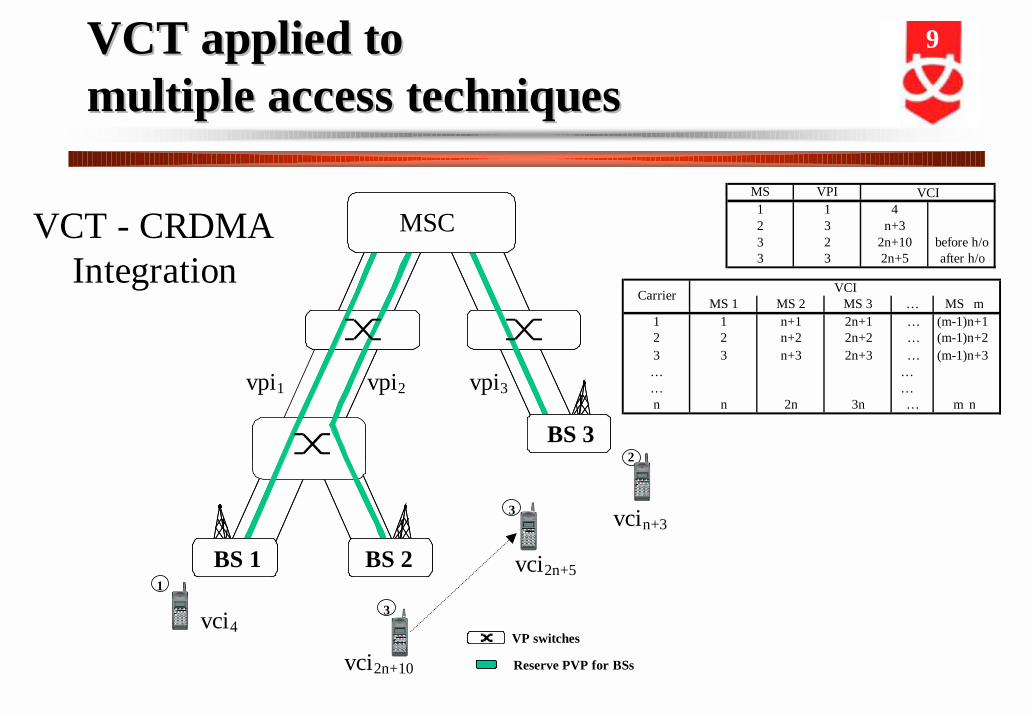
In order to apply the VCT to the multiple access scheme, at call set-up each MS connection is assigned at the
Virtual Connection Identifier (VCI) in the VCT. Each VCI is uniquely associated to a carrier for time division
duplex (TDD), or a pair of carriers for frequency division duplex FDD. The VCI-VPI combination represents
the carrier and BS used at any moment by a given connection. The numbering structure is shown in Figure 1.
Each BS is associated to a Virtual Path Identifier (VPI) and each mobile connection is assigned a group of
VCIs, each VCI corresponding to a carrier. During a handoff the VPI changes, indicating a new BS and the
VCI could change indicating a change in carrier.
a)
BS 3
BS 2BS 1
MSC
BS 3
BS 2BS 1
MSC
vpi1 vpi2vpi3
1
2
3
VP switches
Reserve PVP for BSsvci 4
vci1- vci n
vci2n+10
vci2n+1- vci3n
vcin+3
vcin+1- vci2n
A
3
vci2n+5
vci2n+1- vci3n
B
MS 1 MS 2 … MS mCarrier 1 vci 1 …Carrier 2 …Carrier 3 …… . … … … …Carrier n …
MS 1 → vpi1-vci4
MS 2 → vpi3-vcin+3
MS 3 → vpi2-vci2n+10 (before H/O)
MS 3 → vpi3-vci 2n+5 (after H/O)
vci 2
vci3
vcin
vci n+1
vci n+2
vcin+3
vci2n
vci(m-1)n+1
vci (m-1)n+2
vci(m-1)n+3
vcimn
b)
MSC
Sw
A
E
G
F D
CB
VCT areaRef. cellMap area
MAP at BS A
BS BMB ID Had. Code
MB IDRef.
Active User tableService type Rate
Other Information
Sw SwBS C
MB ID Had. Code
BS AMB ID Had. Code
BS EMB ID Had. Code
BS GMB ID Had. Code
BS DMB ID Had. Code
BS FMB ID Had. Code
Figure 1 –a)VCT-CRDMA Integration, b) VCT, Carrier-map and tables
The handoff procedure for MS 3 is illustrated in Figure 1. The VPI-VCI information allows the MSC to
locate any MS at any time, cells are routed correctly given this information.
By using the VCT with multiple access techniques no handoff processing is carried out at the MSC since all
possible routes are pre-established. This implies a reduction in the amount of signalling and processing during
a handoff, which improves the GoS. The traffic can be evaluated at the MSC since the VCNs provide the
carrier frequency and BS information of every mobile without any additional signalling.
3 Carrier Communication Algorithm
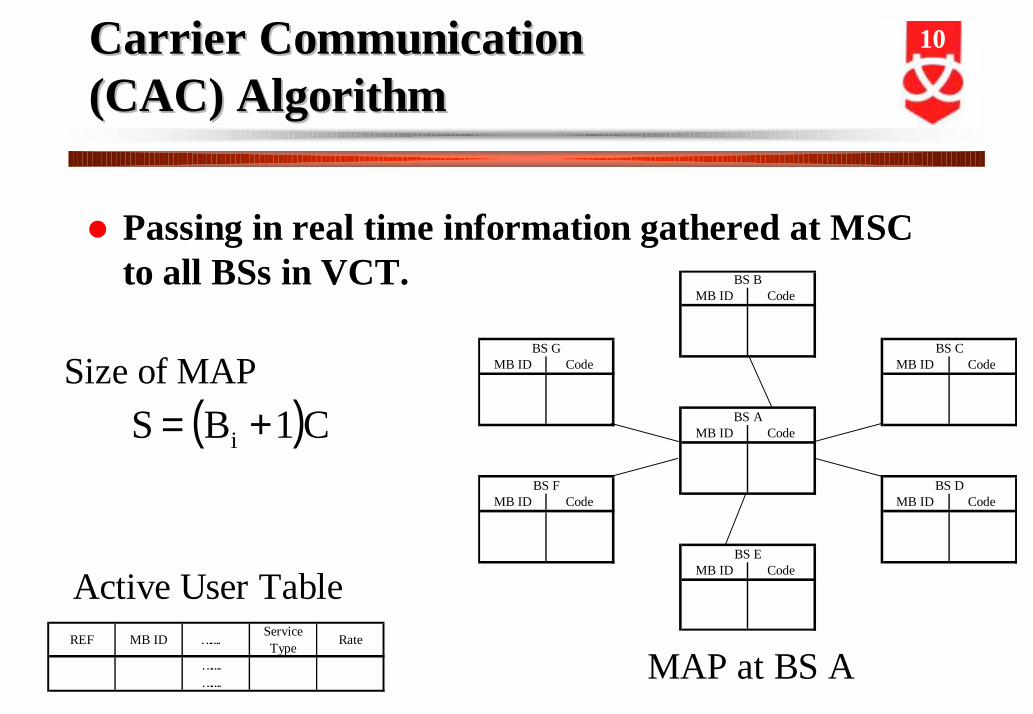
In [11] a carrier communication algorithm was presented. This involves passing in real-time, the information
gathered at the MSC to all BSs in the VCT, such that a BS creates a ‘map’ of the carriers used in adjacent
cells. Each BS has its table similar to that in CSMA, which contains information about its own and interfering
cells. The size, S of this table, the carrier-map table, depends on the number of cells considered as interferers,
Bi as well as the maximum number of carriers/codes allowed in each BS, C, and is given by Equation 1.
( )C1BS i += (1)
Another table is also required, the VCT active user table, in which all active users are registered relating to
the MB ID number. The tables and the area they refer to are illustrated in Figure 1b. Both tables are
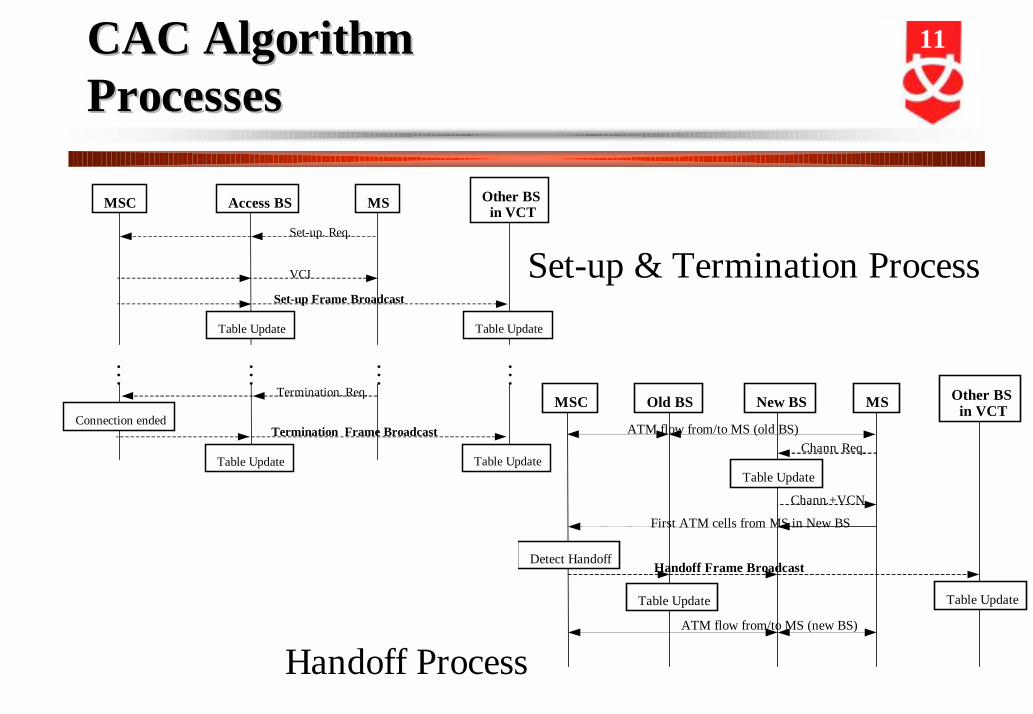
immediately updated when changes such as new connections, handoffs and terminations occur within the
VCT. The active user table is only affected by connection set-ups and terminations. The carrier-map can be
updated in one of two ways; if the change is inside the cell, the BS directly updates its own table. If the change
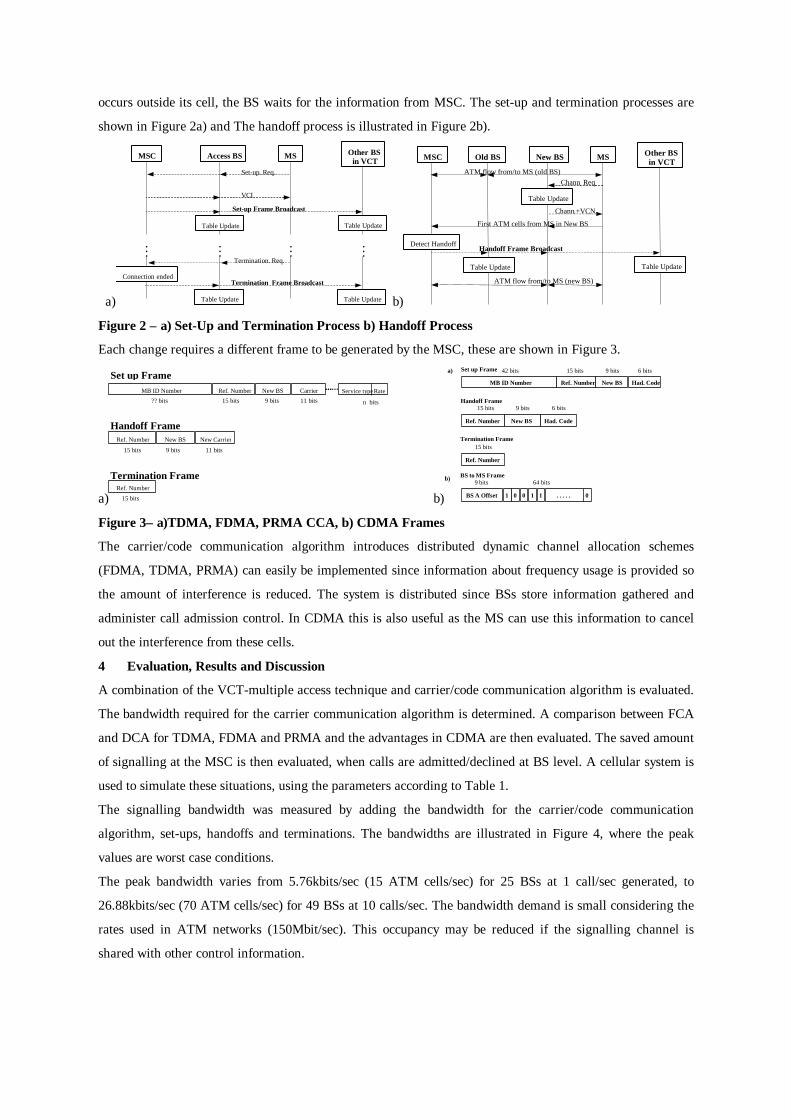
occurs outside its cell, the BS waits for the information from MSC. The set-up and termination processes are
shown in Figure 2a) and The handoff process is illustrated in Figure 2b).
a)
Set-up. Req.
VCI
Set-up Frame Broadcast
MSC Access BS MS Other BS in VCT
Table Update Table Update
Termination. Req.
Connection endedTermination Frame Broadcast
Table Update Table Update
M M M M
b)
Chann. Req.
Chann.+VCN
Detect Handoff
Table Update Table Update
Table Update
ATM flow from/to MS (old BS)
First ATM cells from MS in New BS
Handoff Frame Broadcast
ATM flow from/to MS (new BS)
MSC Old BS New BS MS Other BS in VCT
Figure 2 – a) Set-Up and Termination Process b) Handoff Process
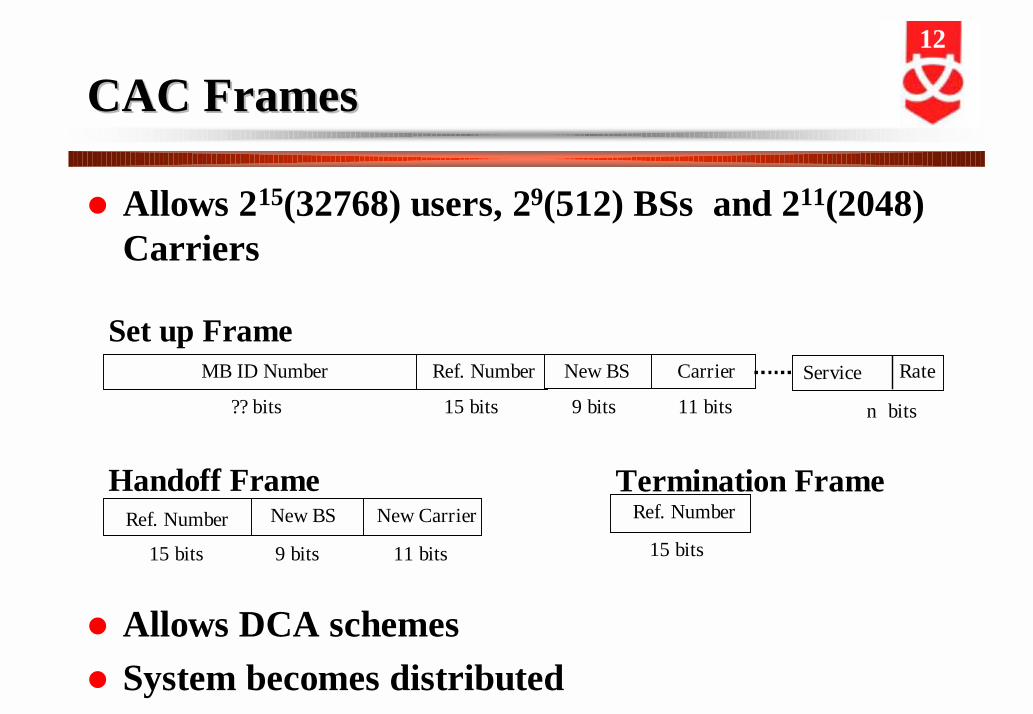
Each change requires a different frame to be generated by the MSC, these are shown in Figure 3.
a)
Set up FrameMB ID Number Ref. Number New BS Carrier
?? bits 15 bits 9 bits 11 bits
Handoff FrameNew BSRef. Number New Carrier
9 bits15 bits 11 bits
Termination Frame
15 bits
Ref. Number
Service typeRate
n bits
b)
Set up Frame
Handoff Frame
Termination Frame
MB ID Number Ref. Number
42 bits 15 bits 9 bits
New BS Had. Code
6 bits
9 bits15 bits
New BSRef. Number Had. Code
6 bits
15 bits
Ref. Number
BS to MS Frame64 bits9 bits
BS A Offset 1 0 1 10 0. . . . .
a)
b)
Figure 3– a)TDMA, FDMA, PRMA CCA, b) CDMA Frames
The carrier/code communication algorithm introduces distributed dynamic channel allocation schemes
(FDMA, TDMA, PRMA) can easily be implemented since information about frequency usage is provided so
the amount of interference is reduced. The system is distributed since BSs store information gathered and
administer call admission control. In CDMA this is also useful as the MS can use this information to cancel
out the interference from these cells.
4 Evaluation, Results and Discussion
A combination of the VCT-multiple access technique and carrier/code communication algorithm is evaluated.
The bandwidth required for the carrier communication algorithm is determined. A comparison between FCA
and DCA for TDMA, FDMA and PRMA and the advantages in CDMA are then evaluated. The saved amount
of signalling at the MSC is then evaluated, when calls are admitted/declined at BS level. A cellular system is
used to simulate these situations, using the parameters according to Table 1.
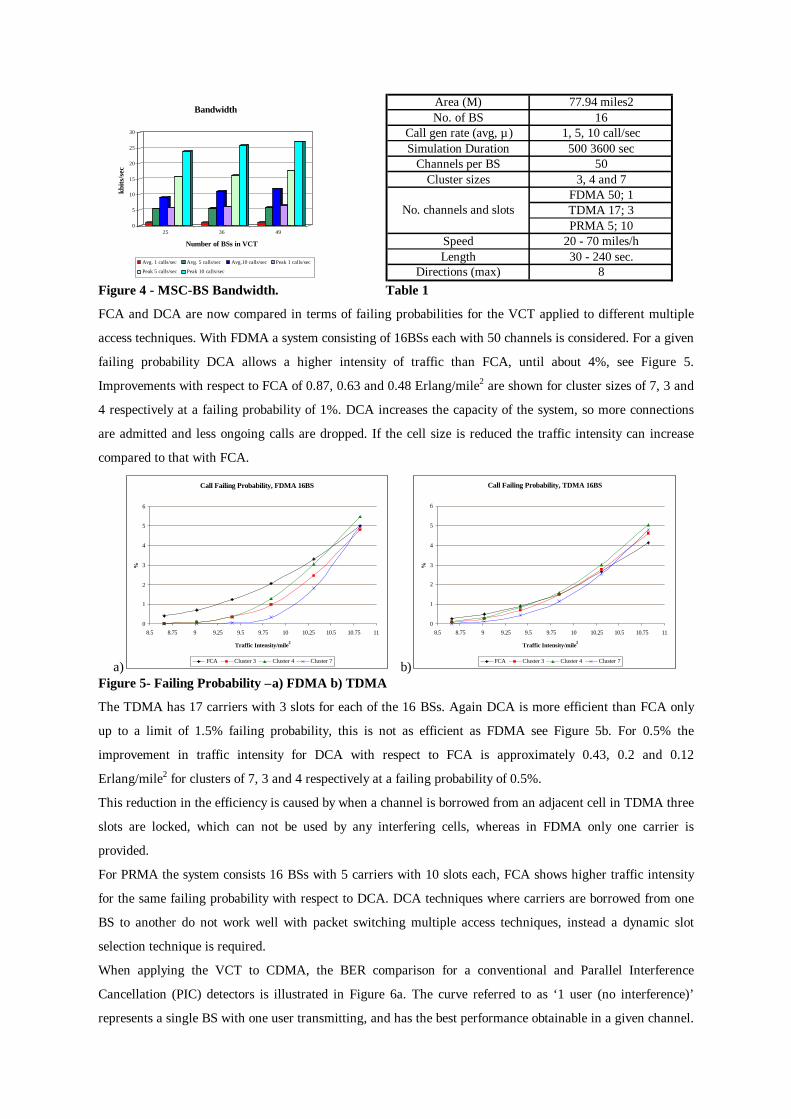
The signalling bandwidth was measured by adding the bandwidth for the carrier/code communication
algorithm, set-ups, handoffs and terminations. The bandwidths are illustrated in Figure 4, where the peak
values are worst case conditions.
The peak bandwidth varies from 5.76kbits/sec (15 ATM cells/sec) for 25 BSs at 1 call/sec generated, to
26.88kbits/sec (70 ATM cells/sec) for 49 BSs at 10 calls/sec. The bandwidth demand is small considering the
rates used in ATM networks (150Mbit/sec). This occupancy may be reduced if the signalling channel is
shared with other control information.
0
5
10
15
20
25
30
kbits
/sec
25 36 49
Number of BSs in VCT
Bandwidth
Avg. 1 calls/sec Avg. 5 calls/sec Avg.10 calls/sec Peak 1 calls/sec
Peak 5 calls/sec Peak 10 calls/sec
Area (M) 77.94 miles2No. of BS 16
Call gen rate (avg, µ ) 1, 5, 10 call/secSimulation Duration 500 3600 sec
Channels per BS 50Cluster sizes 3, 4 and 7
FDMA 50; 1TDMA 17; 3PRMA 5; 10
Speed 20 - 70 miles/hLength 30 - 240 sec.
Directions (max) 8
No. channels and slots
Figure 4 - MSC-BS Bandwidth. Table 1
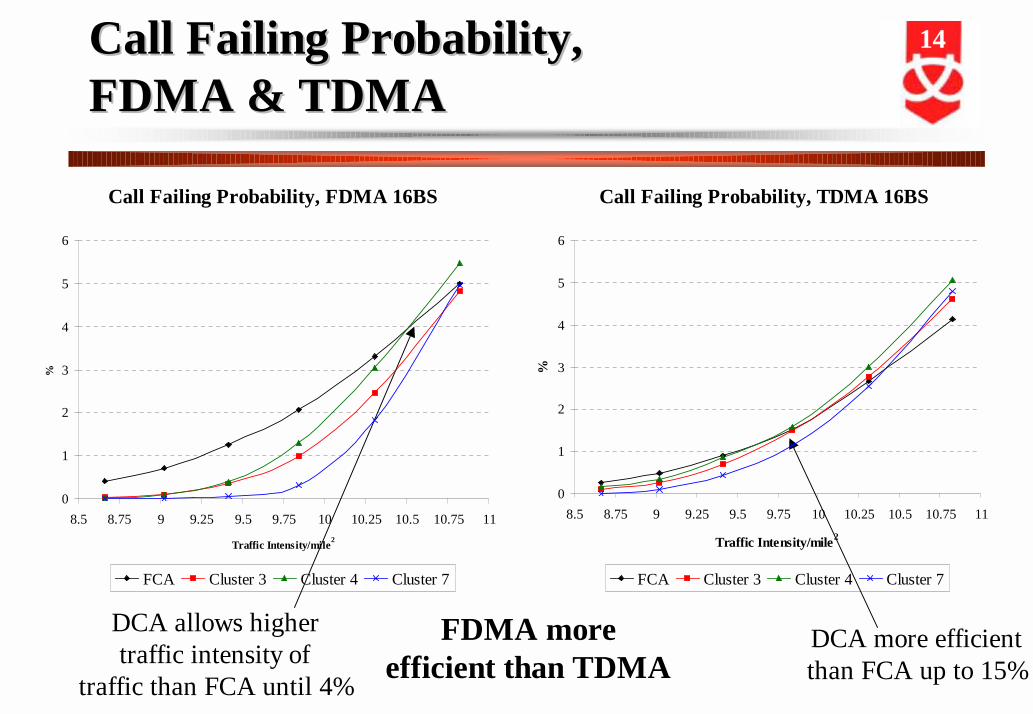
FCA and DCA are now compared in terms of failing probabilities for the VCT applied to different multiple
access techniques. With FDMA a system consisting of 16BSs each with 50 channels is considered. For a given
failing probability DCA allows a higher intensity of traffic than FCA, until about 4%, see Figure 5.
Improvements with respect to FCA of 0.87, 0.63 and 0.48 Erlang/mile2 are shown for cluster sizes of 7, 3 and
4 respectively at a failing probability of 1%. DCA increases the capacity of the system, so more connections
are admitted and less ongoing calls are dropped. If the cell size is reduced the traffic intensity can increase
compared to that with FCA.
a)
Call Failing Probability, FDMA 16BS
0
1
2
3
4
5
6
8.5 8.75 9 9.25 9.5 9.75 10 10.25 10.5 10.75 11
Traffic Intensity/mile2
%
FCA Cluster 3 Cluster 4 Cluster 7 b)
Call Failing Probability, TDMA 16BS
0
1
2
3
4
5
6
8.5 8.75 9 9.25 9.5 9.75 10 10.25 10.5 10.75 11
Traffic Intensity/mile2
%
FCA Cluster 3 Cluster 4 Cluster 7
Figure 5- Failing Probability –a) FDMA b) TDMA
The TDMA has 17 carriers with 3 slots for each of the 16 BSs. Again DCA is more efficient than FCA only
up to a limit of 1.5% failing probability, this is not as efficient as FDMA see Figure 5b. For 0.5% the
improvement in traffic intensity for DCA with respect to FCA is approximately 0.43, 0.2 and 0.12
Erlang/mile2 for clusters of 7, 3 and 4 respectively at a failing probability of 0.5%.
This reduction in the efficiency is caused by when a channel is borrowed from an adjacent cell in TDMA three
slots are locked, which can not be used by any interfering cells, whereas in FDMA only one carrier is
provided.
For PRMA the system consists 16 BSs with 5 carriers with 10 slots each, FCA shows higher traffic intensity
for the same failing probability with respect to DCA. DCA techniques where carriers are borrowed from one
BS to another do not work well with packet switching multiple access techniques, instead a dynamic slot
selection technique is required.
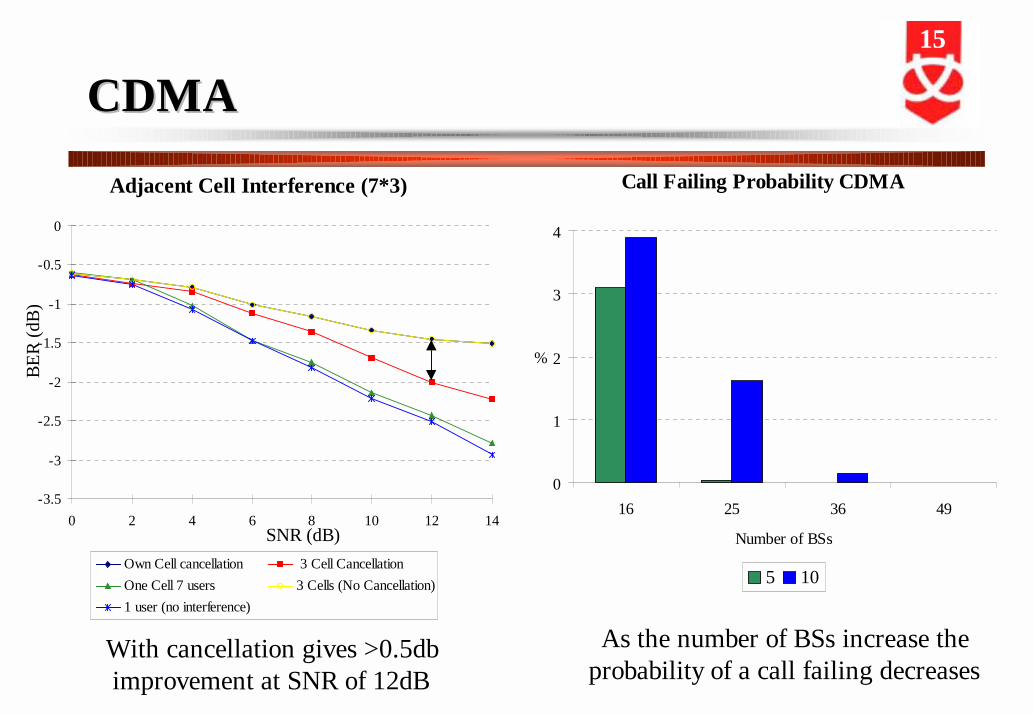
When applying the VCT to CDMA, the BER comparison for a conventional and Parallel Interference
Cancellation (PIC) detectors is illustrated in Figure 6a. The curve referred to as ‘1 user (no interference)’
represents a single BS with one user transmitting, and has the best performance obtainable in a given channel.
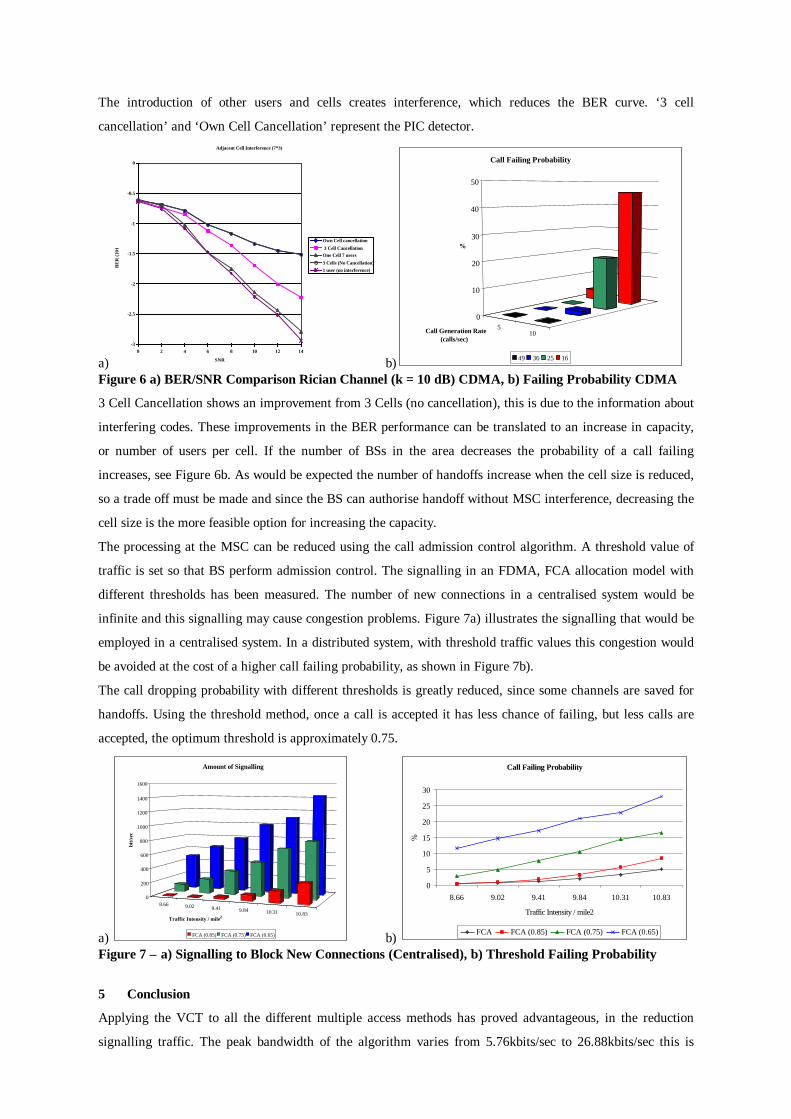
The introduction of other users and cells creates interference, which reduces the BER curve. ‘3 cell
cancellation’ and ‘Own Cell Cancellation’ represent the PIC detector.
a)
Adjacent Cell Interference (7*3)
-3
-2.5
-2
-1.5
-1
-0.5
0
0 2 4 6 8 10 12 14
SNR
BE
R (1
0y )
Own Cell cancellation 3 Cell CancellationOne Cell 7 users3 Cells (No Cancellation)1 user (no interference)
b)
510
0
10
20
30
40
50
%
Call Generation Rate(calls/sec)
Call Failing ProbabilityCDMA
49 36 25 16
Figure 6 a) BER/SNR Comparison Rician Channel (k = 10 dB) CDMA, b) Failing Probability CDMA
3 Cell Cancellation shows an improvement from 3 Cells (no cancellation), this is due to the information about
interfering codes. These improvements in the BER performance can be translated to an increase in capacity,
or number of users per cell. If the number of BSs in the area decreases the probability of a call failing
increases, see Figure 6b. As would be expected the number of handoffs increase when the cell size is reduced,
so a trade off must be made and since the BS can authorise handoff without MSC interference, decreasing the
cell size is the more feasible option for increasing the capacity.
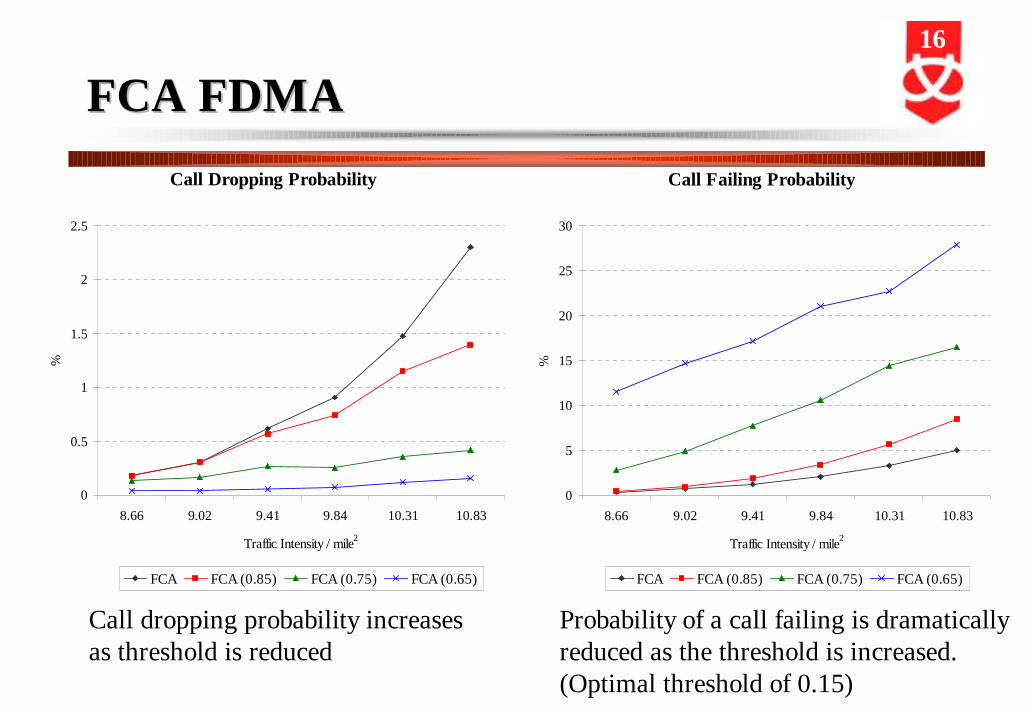
The processing at the MSC can be reduced using the call admission control algorithm. A threshold value of
traffic is set so that BS perform admission control. The signalling in an FDMA, FCA allocation model with
different thresholds has been measured. The number of new connections in a centralised system would be
infinite and this signalling may cause congestion problems. Figure 7a) illustrates the signalling that would be
employed in a centralised system. In a distributed system, with threshold traffic values this congestion would
be avoided at the cost of a higher call failing probability, as shown in Figure 7b).
The call dropping probability with different thresholds is greatly reduced, since some channels are saved for
handoffs. Using the threshold method, once a call is accepted it has less chance of failing, but less calls are
accepted, the optimum threshold is approximately 0.75.
a)
8.66 9.02 9.41 9.84 10.31 10.83
0
200
400
600
800
1000
1200
1400
1600
bit/s
ec
Traffic Intensity / mile2
Amount of Signalling
FCA (0.85) FCA (0.75) FCA (0.65) b)
Call Failing Probability
0
5
10
15
20
25
30
8.66 9.02 9.41 9.84 10.31 10.83
Traffic Intensity / mile2
%
FCA FCA (0.85) FCA (0.75) FCA (0.65)
Figure 7 – a) Signalling to Block New Connections (Centralised), b) Threshold Failing Probability
5 Conclusion
Applying the VCT to all the different multiple access methods has proved advantageous, in the reduction
signalling traffic. The peak bandwidth of the algorithm varies from 5.76kbits/sec to 26.88kbits/sec this is
small considering the rates used in ATM networks (150Mbit/sec). DCA for FDMA provided improvements of
0.87, 0.63 and 0.48 Erlang/mile2 are shown for cluster sizes of 7, 3 and 4 respectively at a failing probability
of 1%. Next was TDMA with 0.43, 0.2 and 0.12 Erlang/mile2 for clusters of 7, 3 and 4 respectively at a
failing probability of 0.5%. In CDMA interference was removed from signals, improving the BER curve.
There is more work required for the packet switched applications and IP transport protocols The references
[14-16] are a starting point for future work in this area, in which the system will be operated through an IP
interface using the ATM technology. For all multiple access methods are more distributed system has been
created, for FDMA the signalling saved was shown, this is similar for all the multiple access schemes.
6 References
[1] Godara, L.C.; Ryan, M.J.; Padovan, N. ‘Third generation mobile communication systems:Overview and modelling considerations’ Annales des Telecomms/Annals of Telecomms v 54, n 1,1999, p 114-136
[2] ITU Documentation on IMT-2000, available at http://www.itu.int/imt/.
[3] Singh M., ‘3G Wireless with respect to IMT-2000 and beyond’, Telecom 99, Inter@ctive 99.
[4] Cuthbert, L.G., Sapanello, G.C., ‘ATM: the broadband telecommunication solution’, IEE London.UK. 1993.
[5] Yuan, R., Biswass, S.K. and Raychaudhuri, D., ‘A Signalling and Control Architecture forMobility Support in Wireless ATM Networks’ ACM/Baltzer Mobile Networks and Applications,Vol. 1, No 3, December 1996.
[6] Lee, W.C., ‘Overview of Cellular CDMA’, IEEE Transactions on Vehicular Technology, Vol. 40,No. 2, May 1991.
[7] Gilhousen, K.S., Jacobs, I.M., Padovani, R., Viterbi, A.J., Weaver, L. A. and Wheatley III, C. E.,‘On the capacity of a Cellular CDMA System’, IEEE Transactions on Vehicular Technology, Vol.40, No. 2, May 1991.
[8] Sourour, E. ‘Time Slot Assignment Techniques for TDMA Digital Cellular Systems’, IEEETransactions on Vehicular Technology, Vol. 43, No. 1, February 1994.
[9] Larrinaga, F. and Carrasco, R.A., ‘Virtual Connection Tree Concept Application over CDMABased Cellular Systems’ IEE Coll on ATM Traffic in the Personal Mobile CommunicationsEnvironment, Savoy Place, London 11 Feb. 1997.
[10] Larrinaga, F. and Carrasco, R.A., ‘Application of the VCT over Multiple Access Techniques usingFrequency Division’, submitted to IEEE Transactions. 2000.
[11] Karim S.A., Hovell P., ‘Everything over IP - an overview of the strategic change in voice and datanetworks’, BT Technology Journal v 17, n 2, (1999), p 24-30.
[12] Heath, A. and Carrasco, R. A., ‘Virtual Connection Tree Based Algorithms For 3G MobileCommunication Systems’ PREP2000, University of Nottingham, 11-13 April 2000.
[13] Acampora, A.S., Naghshineh, M., ‘An architecture and methodology for mobile-executed hand-offin cellular ATM networks’, IEEE Journal on Selected Areas in Communications, Vol: 12, Iss: 8,p. 1365-75, Oct. 1994, ISSN: 0733-8716.
[14] Caceres R., Padmanabhan, V. N., ‘Fast and scalable wireless handoffs in support of mobile Internetaudio’, Mobile Networks and Applications v 3, n 4, (Jan 1999), p 351-363.
[15] Balakrishnan H., Seshan S., Amir E., Katz R. H., ‘Improving reliable transport and handoff(TCP/IP) performance over wireless networks’, Proceedings of the Annual International Conferenceon Mobile Computing and Networking, MOBICOM, , (1995), p 2-11.
[16] Balakrishnan H., Padmanabhan V. N., Seshan S., Katz, R. H., ‘Comparison of mechanisms forimproving TCP performance over wireless links’, IEEE/ACM Transactions on Networking, v 5, n6, (Dec 1997), p 756-769.
18-20 July 2000
Alison HeathMEng, [email protected]
andProfessor Rolando CarrascoBSc(Hons), PhD, CEng, [email protected]://www.staffs.ac.uk/personal/engineering_and_technology/alh2/
School of Engineering& Advanced Technology
VIRTUAL CONNECTION TREE OVERVIRTUAL CONNECTION TREE OVERMULTIPLE ACCESS TECHNIQUES FOR 3GMULTIPLE ACCESS TECHNIQUES FOR 3GWIRELESS COMMUNICATION SYSTEMSWIRELESS COMMUNICATION SYSTEMS
2
ContentsContents
� Introduction, to 3G communication systems� Background Theory
– Multiple Access Techniques, ATM Model
� VCT Service Adaptable Handoff Algorithm� VCT applied to multiple access techniques� CAC Algorithm
– Fixed Channel Allocation/Dynamic Channel Allocation
� Simulation Model and Results– Signalling BW, Failing Probability for FCA & DCA– BER for CDMA when PIC cancellation used
� Conclusions and Future Work
3
Research ObjectivesResearch Objectives
� Investigate the issues affecting the access to mobileATM networks
� Accommodate mixed types of information– Voice, data, images - Multimedia, and Mobility
� Reduce the amount of signalling, increase systemcapacity
� Produce a more distributed system
� Simplify re-routing of information (handoffs)

4
BackgroundBackground
� Accommodate mixedinformation types– with different QoS contracts
� Allow Mobility and high BitRates with a finite BandWidth
� Simplify the routing ofinformation (handoffs)
3GSystems
VoiceData
M3
IMT-2000/UMTScdma2000 WCDMA
5
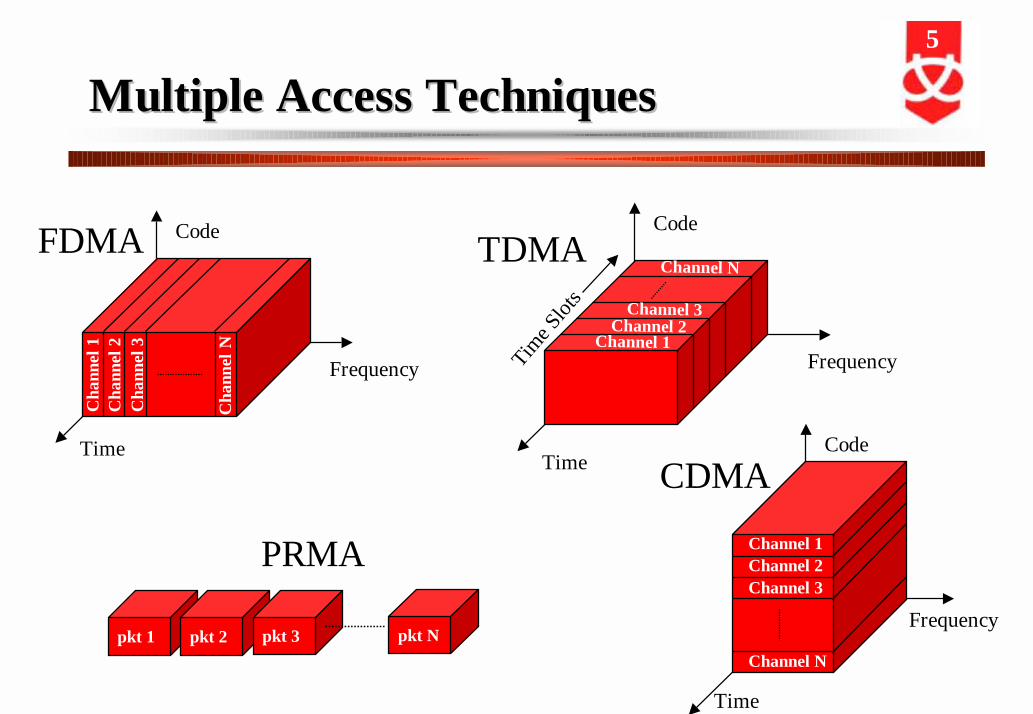
Multiple Access TechniquesMultiple Access Techniques
Code
Frequency
Time
Cha
nnel
1C
hann
el 2
Cha
nnel
3
Cha
nnel
NFDMA Code
Frequency
Time
Channel 1Channel 2
Channel 3
Channel N
Time S
lots
TDMA
Code
Frequency
Time
Channel 1Channel 2Channel 3
Channel N
CDMA
PRMA
pkt Npkt 1 pkt 2 pkt 3
6
Asynchronous Transfer Mode (ATM)Asynchronous Transfer Mode (ATM)
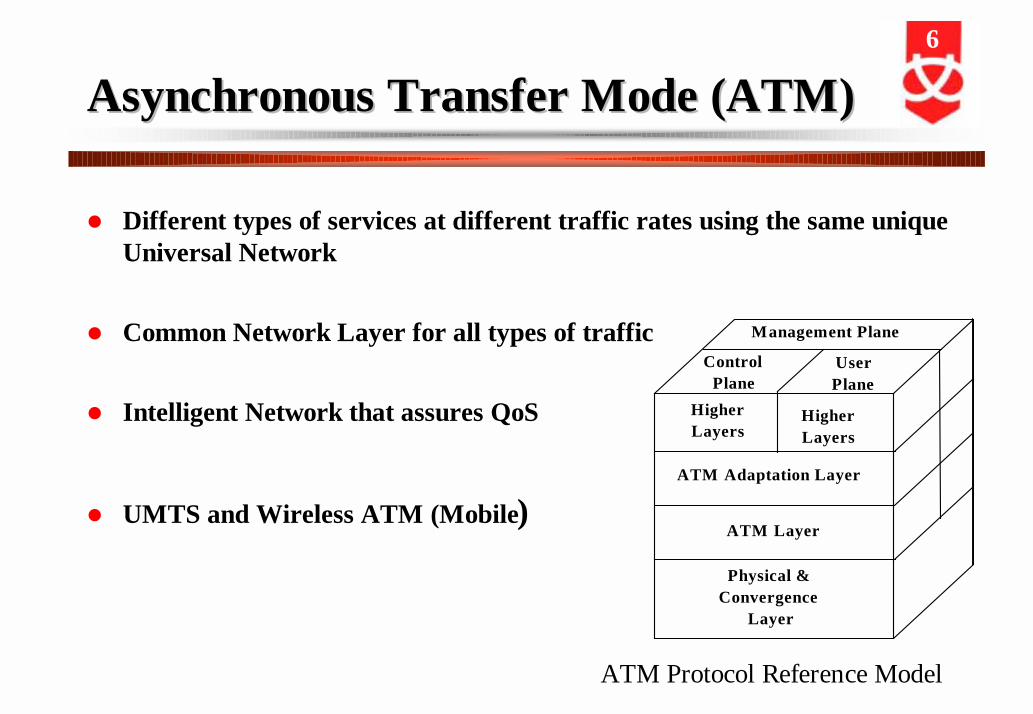
� Different types of services at different traffic rates using the same uniqueUniversal Network
� Common Network Layer for all types of traffic
� Intelligent Network that assures QoS
� UMTS and Wireless ATM (Mobile)
Physical &Convergence
Layer
ATM Layer
ATM Adaptation Layer
HigherLayers
HigherLayers
ControlPlane
UserPlane
Management Plane
ATM Protocol Reference Model
7
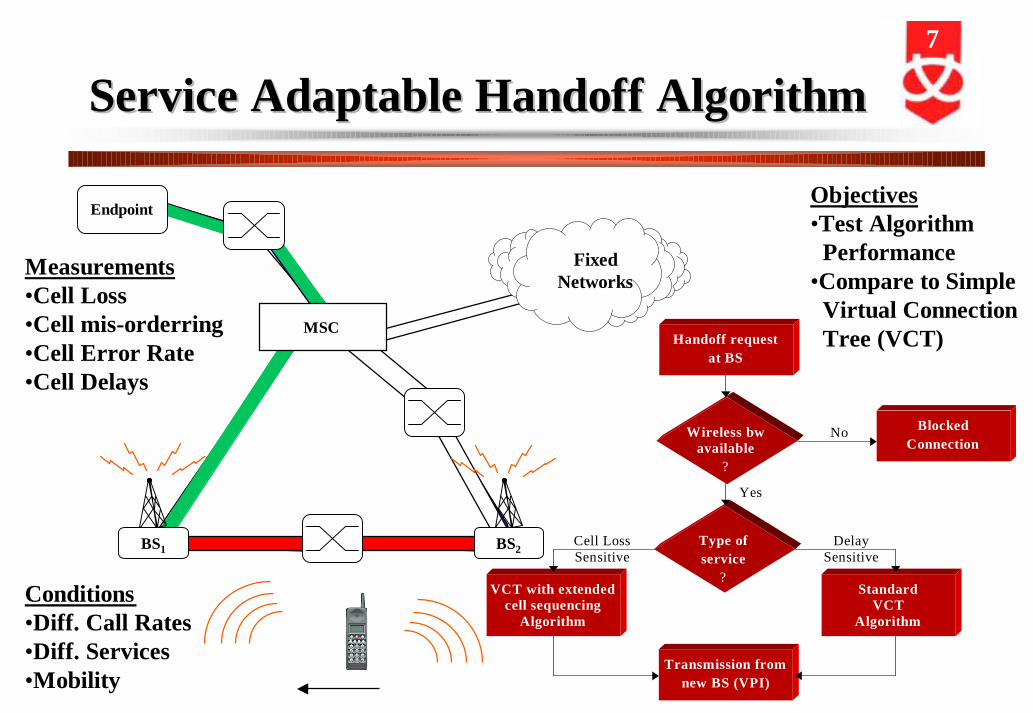
Service Adaptable Handoff AlgorithmService Adaptable Handoff Algorithm
Handoff requestat BS
Wireless bwavailable
?
Type ofservice
?VCT with extended
cell sequencingAlgorithm
BlockedConnection
StandardVCT
Algorithm
Transmission fromnew BS (VPI)
DelaySensitive
Cell LossSensitive
No
Yes
BS2BS1
MSC
FixedNetworks
EndpointObjectives•Test Algorithm Performance•Compare to Simple Virtual Connection Tree (VCT)
Conditions•Diff. Call Rates•Diff. Services •Mobility
Measurements•Cell Loss•Cell mis-orderring•Cell Error Rate•Cell Delays
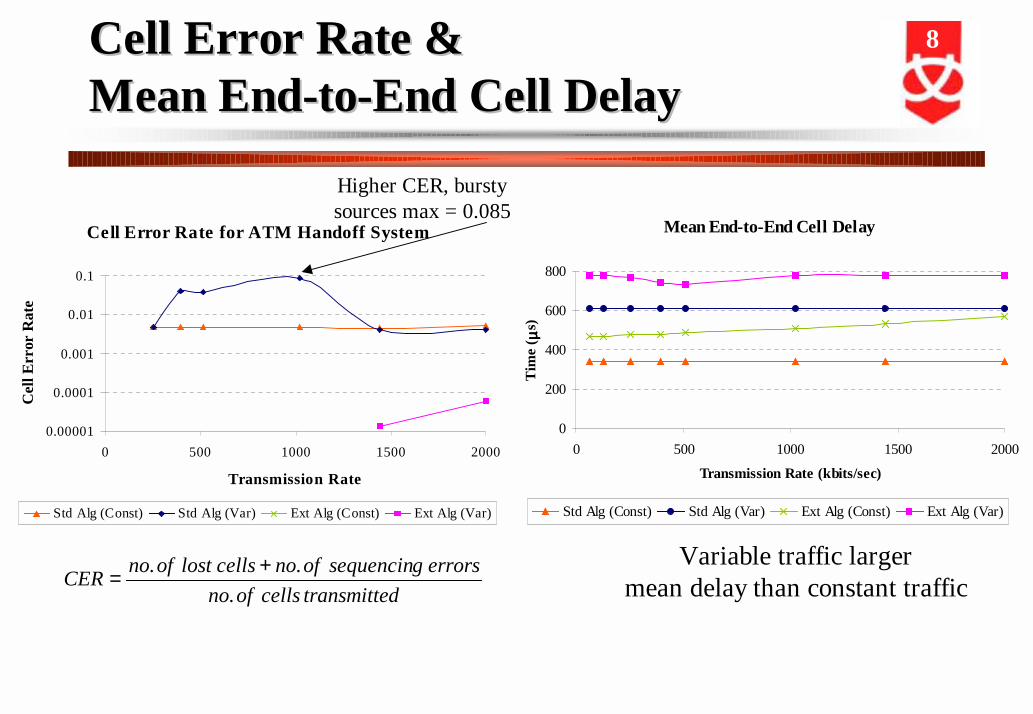
8Cell Error Rate &Cell Error Rate &Mean End-to-End Cell DelayMean End-to-End Cell Delay
Cell Error Rate for ATM Handoff System
0.00001
0.0001
0.001
0.01
0.1
0 500 1000 1500 2000
Transmission Rate
Cel
l Err
or R
ate
Std Alg (Const) Std Alg (Var) Ext Alg (Const) Ext Alg (Var)
Mean End-to-End Cell Delay
0
200
400
600
800
0 500 1000 1500 2000
Transmission Rate (kbits/sec)
Tim
e ( µµ µµ
s)Std Alg (Const) Std Alg (Var) Ext Alg (Const) Ext Alg (Var)
Variable traffic largermean delay than constant traffic
Higher CER, burstysources max = 0.085
dtransmitte cells of no.errors g sequencinof no. cells lost of no.
CER +=
9VCT applied toVCT applied tomultiple access techniquesmultiple access techniques
VCT - CRDMAIntegration
BS 3
BS 2BS 1
MSC
BS 1
MSC
1
2
3
VP switches
Reserve PVP for BSs
3
vpi1
vci4
vci2n+10
vcin+3
vci2n+5
vpi2 vpi3
BS 2
BS 3
MS VPI1 1 42 3 n+33 2 2n+10 before h/o3 3 2n+5 after h/o
VCI
MS 1 MS 2 MS 3 … MS m1 1 n+1 2n+1 … (m-1)n+12 2 n+2 2n+2 … (m-1)n+23 3 n+3 2n+3 … (m-1)n+3… …… …n n 2n 3n … m n
VCICarrier
10Carrier CommunicationCarrier Communication(CAC) Algorithm(CAC) Algorithm
� Passing in real time information gathered at MSCto all BSs in VCT.
( )C1BS i +=
MB ID Code
MB ID Code MB ID Code
MB ID Code
MB ID Code MB ID Code
MB ID CodeBS E
BS C
BS D
BS G
BS F
BS A
BS B
REF MB ID …….Service Type
Rate
…….……. MAP at BS A
Active User Table
Size of MAP
11CAC AlgorithmCAC AlgorithmProcessesProcesses
Set-up. Req.
VCI
Set-up Frame Broadcast
MSC Access BS MS Other BS in VCT
Table Update Table Update
Termination. Req.
Connection endedTermination Frame Broadcast
Table Update Table Update
� � � �
Set-up & Termination Process
Chann. Req.
Chann.+VCN
Detect Handoff
Table Update Table Update
Table Update
ATM flow from/to MS (old BS)
First ATM cells from MS in New BS
Handoff Frame Broadcast
ATM flow from/to MS (new BS)
MSC Old BS New BS MS Other BS in VCT
Handoff Process
12
CAC FramesCAC Frames
� Allows 215(32768) users, 29(512) BSs and 211(2048)Carriers
� Allows DCA schemes� System becomes distributed
Set up FrameMB ID Number Ref. Number New BS Carrier
?? bits 15 bits 9 bits 11 bits
Handoff FrameNew BSRef. Number New Carrier
9 bits15 bits 11 bits
Termination Frame
15 bits
Ref. Number
Service Rate
n bits

13
0
5
10
15
20
25
30
kbits
/sec
25 36 49
Number of BSs in VCT
Bandwidth
Avg. 1 calls/sec Avg. 5 calls/sec Avg.10 calls/sec Peak 1 calls/sec
Peak 5 calls/sec Peak 10 calls/secBW Saved with CAC
Simulation ModelSimulation Model
� Band Width and Signalling in fixed network for CAC Algorithm� Comparison between FCA & DCA for TDMA, FDMA and PRMA� CAC at BS level
Area (M) 77.94 miles2No. of BS 16
Call gen rate (avg, µ ) 1, 5, 10 call/secSimulation Duration 500 3600 sec
Channels per BS 50Cluster sizes 3, 4 and 7
FDMA 50; 1TDMA 17; 3PRMA 5; 10
Speed 20 - 70 miles/hLength 30 - 240 sec.
Directions (max) 8
No. channels and slots
14Call Failing Probability,Call Failing Probability,FDMA & TDMAFDMA & TDMA
DCA allows highertraffic intensity of
traffic than FCA until 4%
DCA more efficientthan FCA up to 15%
Call Failing Probability, TDMA 16BS
0
1
2
3
4
5
6
8.5 8.75 9 9.25 9.5 9.75 10 10.25 10.5 10.75 11
Traffic Intensity/mile2%
FCA Cluster 3 Cluster 4 Cluster 7
Call Failing Probability, FDMA 16BS
0
1
2
3
4
5
6
8.5 8.75 9 9.25 9.5 9.75 10 10.25 10.5 10.75 11
Traffic Intensity/mile2
%
FCA Cluster 3 Cluster 4 Cluster 7
FDMA moreefficient than TDMA
15
CDMACDMA
Call Failing Probability CDMA
0
1
2
3
4
16 25 36 49
Number of BSs
%
5 10
Adjacent Cell Interference (7*3)
-3.5
-3
-2.5
-2
-1.5
-1
-0.5
0
0 2 4 6 8 10 12 14
Own Cell cancellation 3 Cell CancellationOne Cell 7 users 3 Cells (No Cancellation)1 user (no interference)
As the number of BSs increase theprobability of a call failing decreases
With cancellation gives >0.5dbimprovement at SNR of 12dB
SNR (dB)
BER
(dB
)
16
FCA FDMAFCA FDMACall Failing Probability
0
5
10
15
20
25
30
8.66 9.02 9.41 9.84 10.31 10.83
Traffic Intensity / mile2%
FCA FCA (0.85) FCA (0.75) FCA (0.65)
Call Dropping Probability
0
0.5
1
1.5
2
2.5
8.66 9.02 9.41 9.84 10.31 10.83
Traffic Intensity / mile2
%
FCA FCA (0.85) FCA (0.75) FCA (0.65)
Call dropping probability increasesas threshold is reduced
Probability of a call failing is dramaticallyreduced as the threshold is increased.(Optimal threshold of 0.15)

17
DCA FDMADCA FDMACall Failing Probability (DCA)
0
5
10
15
20
25
30
35
8.66 9.02 9.41 9.84 10.31 10.83
Traffic Intensity / mile2
%Cluster 7 DCA Cluster 7 (0.85)
DCA Cluster 7 (0.75) DCA Cluster 7 (0.65)
Call Dropping Probability (DCA)
0
0.5
1
1.5
2
2.5
8.66 9.02 9.41 9.84 10.31 10.83
Traffic Intensity / mile2
%
Cluster 7 DCA Cluster 7 (0.85)
DCA Cluster 7 (0.75) DCA Cluster 7 (0.65)
• Call dropping probability reduces to very small value at thresholds of 0.25, 0.35 for DCA
• Call failing probability less for DCA than FCA.• Optimal threshold value of 0.15
18
Signalling SavedSignalling SavedAmount of Signalling (FCA)
0
200
400
600
800
1000
1200
1400
1600
8.66 9.02 9.41 9.84 10.31 10.83
Traffic Intensity / mile2
bit/s
ec
FCA (0.85) FCA (0.75) FCA (0.65)
Amount of Signalling (DCA cluster 7)
0
200
400
600
800
1000
1200
1400
1600
8.66 9.02 9.41 9.84 10.31 10.83
Traffic Intensity / mile2bi
t/sec
DCA Cluster 7 (0.85) DCA Cluster 7 (0.75) DCA Cluster 7 (0.65)
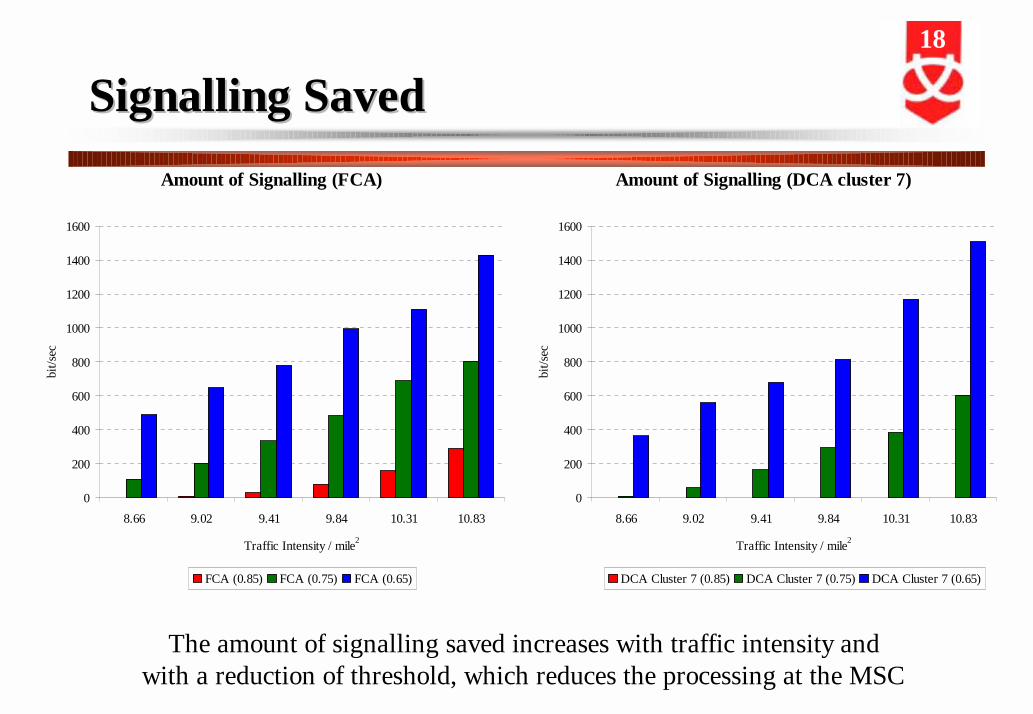
The amount of signalling saved increases with traffic intensity andwith a reduction of threshold, which reduces the processing at the MSC
19
ConclusionsConclusions
� Applying the VCT to all the different multiple access methods has provedadvantageous, in the reduction signalling traffic.
� The peak bandwidth of the algorithm varies from 5.76kbits/sec to 26.88kbits/sec thisis small considering the rates used in ATM networks (150Mbit/sec).
� DCA for FDMA provided improvements of 0.87, 0.63 and 0.48 Erlang/mile2 areshown for cluster sizes of 7, 3 and 4 respectively at a failing probability of 1%. Nextwas TDMA with 0.43, 0.2 and 0.12 Erlang/mile2 for clusters of 7, 3 and 4respectively at a failing probability of 0.5%.
� In CDMA interference was removed from signals, improving the BER curve.
� There is more work required for the packet switched applications and IP transportprotocols
� For all multiple access methods are more distributed system has been created, forFDMA the signalling saved for FCA & DCA was illustrated, this is similar for all themultiple access schemes.
20
Future WorkFuture Work
� Investigate reasons for cell sequence errors at high speeds
� Implement similar Algorithm for TCP
� Implement a packet switched B-ISDN system to run on topof IP
� Investigate multiple access schemes such as cdma2000,WCDMA, TDMA, FDMA