Embed Size (px)
Citation preview

Virginia Namiotko, Tomas Baležentis ISSN 2071-789X
RECENT ISSUES IN ECONOMIC DEVELOPMENT
Economics & Sociology, Vol. 10, No. 2, 2017
33
Virginia Namiotko, Lithuanian Institute of Agrarian Economics, Vilnius, Lithuania, E-mail: [email protected]
DYNAMIC EFFICIENCY UNDER INVESTMENT SPIKES
IN LITHUANIAN CEREAL AND DAIRY FARMS
Tomas Baležentis, Lithuanian Institute of Agrarian Economics, Vilnius, Lithuania, E-mail: [email protected]
ABSTRACT. Lithuanian agriculture has been receiving investment support under the Common Agricultural policy since 2004. Indeed, the most profitable farming types – cereal and dairy farms – saw a particularly strong increase in the investment amounts. The measure of dynamic efficiency allows one analyze the performance of businesses in regards of inter-temporal optimization of the investment behavior. This paper, therefore, looks into the trends of dynamic efficiency in Lithuanian cereal and dairy farms. The research is based on the data from the Farm Accountancy Data Network covering the period of 2004-2014. The analysis carried out for different farm sizes indicates that scale inefficiency is the main source of technical inefficiency for smaller farms, whether cereal, or dairy ones. Farms experienced investment spikes showed slightly lower inefficiency. These technical efficiency gains are due to improved pure technical efficiency and scale efficiency. However, the latter source appeared as a more important one for the smallest farms (less than 30 ha).
Received: December, 2016 1st Revision: April, 2017 Accepted: June, 2017 DOI: 10.14254/2071-789X.2017/10-2/3
JEL Classification: C44, Q12 Keywords: dynamic efficiency, investment spikes, Lithuania, cereal farms, dairy farms, data envelopment analysis.
Introduction
After Lithuania’s accession to the European Union (EU) in 2004, Lithuanian farmers
have been exploiting the advantages of the EU support under the Common Agricultural
Policy (CAP). This support has somehow altered the trends in investments and input use. The
empirical evidence on the link between investments and productivity is unclear. For instance,
Power (1998) found no significant relationship between labor productivity and investments.
This implies that investments might not necessarily yield the desirable impacts. Contrarily,
Huggett and Ospina (2001) and Sakellaris (2004) revealed that productivity growth initially
fall and then later rise after the adoption of a new technology. Bessen (1999) or Janda et al.
(2013), Bilan & Strielkowski (2015) also found that productivity improves as a result of
learning-by-doing. Geylani and Stefanou (2013), Simionescu (2016) showed that the link
between investments and productivity depends on investment type. Accordingly, there is a
need to explore the effects of investments in Lithuanian family farms where investments have
been boosted thanks to the investment support under the measures defined in the CAP
Namiotko, V., Baležentis, T. (2017), Dynamic Efficiency under Investment Spikes in Lithuanian Cereal and Dairy Farms, Economics and Sociology, Vol. 10, No. 2, pp. 33-46. DOI 10.14254/2071-789X.2017/10-2/3
Virginia Namiotko, Tomas Baležentis ISSN 2071-789X
RECENT ISSUES IN ECONOMIC DEVELOPMENT
Economics & Sociology, Vol. 10, No. 2, 2017
34
schemes. This paper addresses the following question: what are the key trends in cereal and
dairy farming efficiency in Lithuania in the context of investment spikes?
Traditionally, productivity and efficiency are studied from a static perspective. This
paper, however, relies on the dynamic approach which seeks to link the decisions on input
adjustment made within different time periods. The patterns of dynamic efficiency have been
widely studied across different countries and sectors (Serra et al., 2011; Rungsuriyawiboon,
Hockmann, 2015; Kapelko et al., 2016a, 2016b; Kapelko, Oude Lansink, 2017; Mikócziová,
2010; Krylovas et al., 2016). However, the analysis of dynamic efficiency in Lithuanian
agriculture has received much less attention in the literature (Baležentis, 2016). Therefore, the
present paper attempts to address the latter gap in the literature. In this paper, we follow the
non-parametric approach for estimation of the dynamic efficiency. Specifically, data
envelopment analysis (DEA) is employed to construct the production frontiers and obtain the
values of the distance functions. The non-parametric approach allows constructing the
production frontiers without assumptions on the functional form thereof.
This paper aims to evaluate the underlying trends in cereal and dairy farming
efficiency in Lithuania in the context of investment spikes. The following tasks are therefore
set: 1) to present the framework for analysis of the dynamic efficiency; 2) to identify the main
trends in cereal and dairy farm performance in Lithuania and selected EU countries; 3) to
estimate the measures of the dynamic efficiency for a sample of Lithuanian family farms. The
research is based on data from the Farm Accountancy Data Network (FADN) covering the
period of 2004-2014.
This paper is organized as follows. Section 1 presents the Data Envelopment Analysis
model for analysis of the dynamic efficiency. Section 2 discusses the results. Finally,
concludes.
1. Methods and data
The research seeks to identify the effects of investments on dynamic efficiency.
therefore, the research framework comprises the two main components. First, the DEA model
is implemented to obtain the measures of the dynamic efficiency. These measures reflect farm
performance in terms of both output production and investment behaviour. Second,
investment spikes were identified in order to classify farms into those experiencing serious
changes in the fixed asset stocks.
The models for analysis of the dynamic efficiency involve the establishment of certain
specific variables along with the conventional vectors of input and output quantities. More
specifically, the input vector is divided into the two sub-vectors each comprising variable and
quasi-fixed inputs (i.e., capital) respectively. In addition, the quantities of fixed inputs can be
considered. The dynamic technology for period t can be represented by an input requirement
set in the following manner (Silva et al., 2015):
( | ) ( , ) : ( , can produce given ) t t t t t t t tV y K x I x I y K, (1)
where Mty
represents a 1 M vector of outputs, Ntx
stands for a 1×N vector of
variable inputs, FtK
denotes a 1 F vector of quasi-fixed inputs, and the dynamic
factor is captured by a 1 F vector of gross investments, FtI
. The inefficiency is
measured by means of the directional input distance function which, indeed, corresponds to
the scaling factor β defining a movement towards an efficient frontier by reducing the level of
Virginia Namiotko, Tomas Baležentis ISSN 2071-789X
RECENT ISSUES IN ECONOMIC DEVELOPMENT
Economics & Sociology, Vol. 10, No. 2, 2017
35
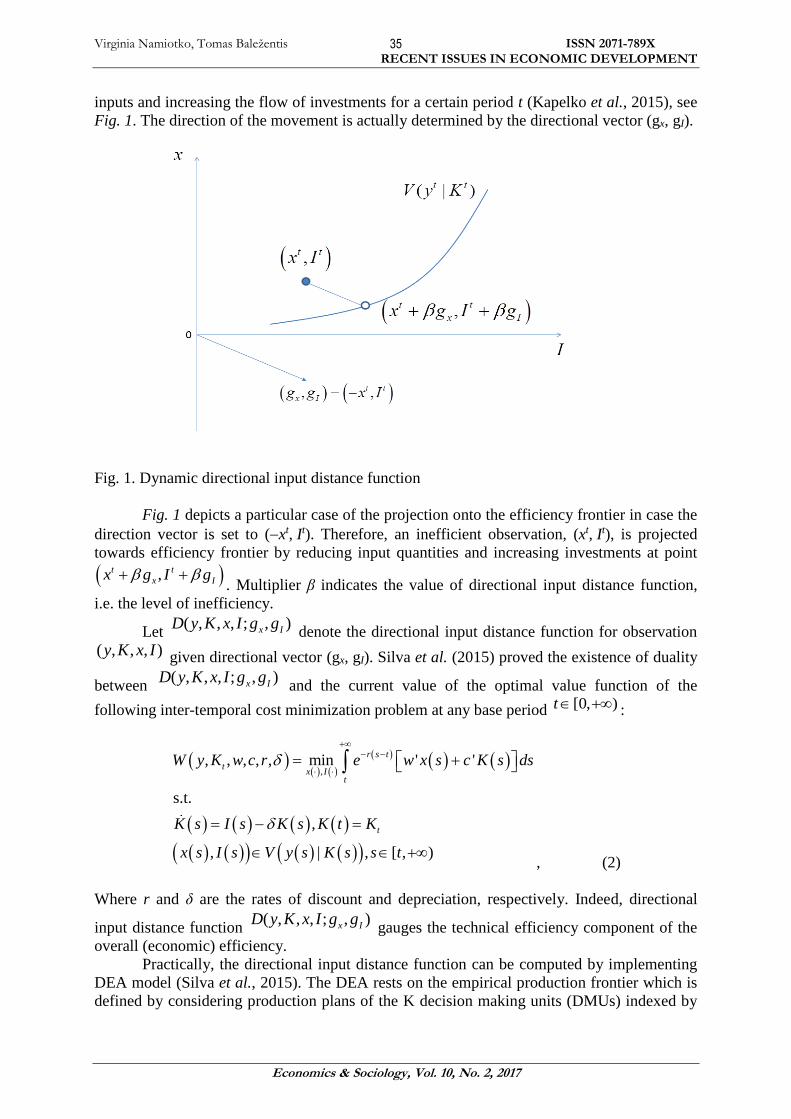
inputs and increasing the flow of investments for a certain period t (Kapelko et al., 2015), see
Fig. 1. The direction of the movement is actually determined by the directional vector (gx, gI).
Fig. 1. Dynamic directional input distance function
Fig. 1 depicts a particular case of the projection onto the efficiency frontier in case the
direction vector is set to (xt, It). Therefore, an inefficient observation, (xt, It), is projected
towards efficiency frontier by reducing input quantities and increasing investments at point
,t t
x Ix g I g . Multiplier β indicates the value of directional input distance function,
i.e. the level of inefficiency.
Let ( , , , ; , )x ID y K x I g g
denote the directional input distance function for observation
( , , , )y K x I given directional vector (gx, gI). Silva et al. (2015) proved the existence of duality
between ( , , , ; , )x ID y K x I g g
and the current value of the optimal value function of the
following inter-temporal cost minimization problem at any base period [0, )t :
,
s.t.
,
, | , [ , )
, , , , , min ' 'r s t
tx I
t
t
W y K w c r e w x s c
K s I s K s K t K
x s I s V y s K s s t
K s ds
, (2)
Where r and δ are the rates of discount and depreciation, respectively. Indeed, directional
input distance function ( , , , ; , )x ID y K x I g g
gauges the technical efficiency component of the
overall (economic) efficiency.
Practically, the directional input distance function can be computed by implementing
DEA model (Silva et al., 2015). The DEA rests on the empirical production frontier which is
defined by considering production plans of the K decision making units (DMUs) indexed by
Virginia Namiotko, Tomas Baležentis ISSN 2071-789X
RECENT ISSUES IN ECONOMIC DEVELOPMENT
Economics & Sociology, Vol. 10, No. 2, 2017
36
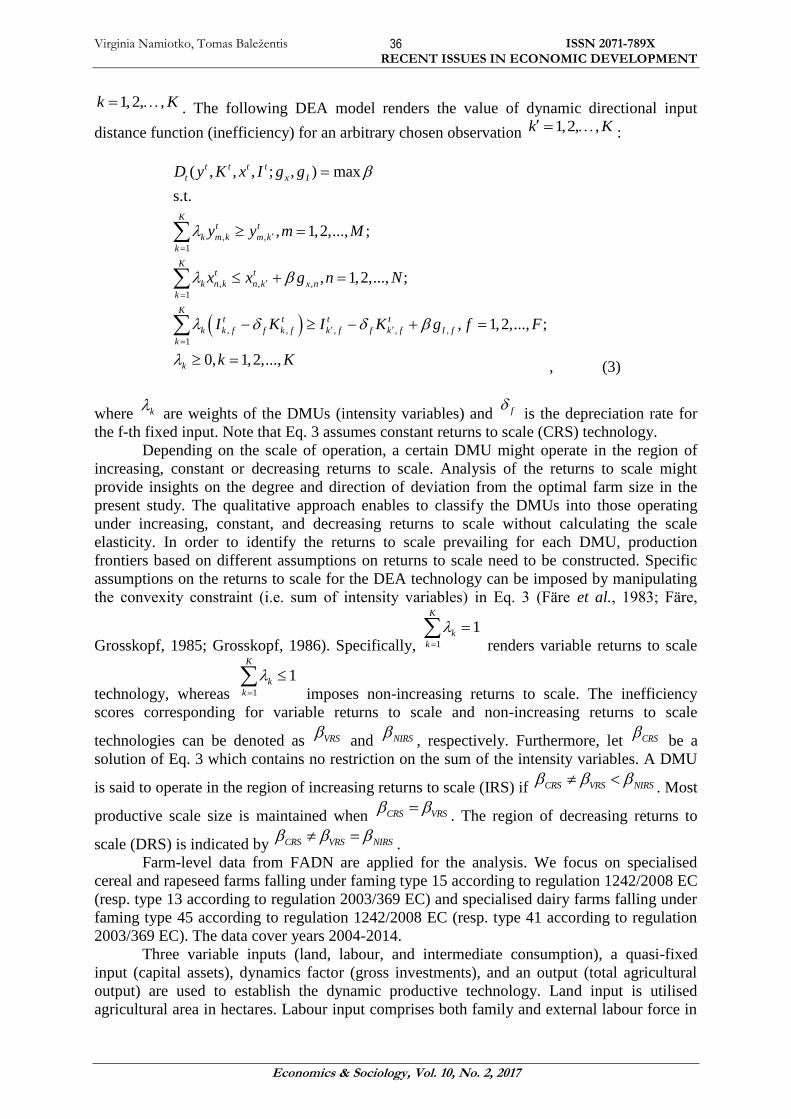
1,2, ,k K . The following DEA model renders the value of dynamic directional input
distance function (inefficiency) for an arbitrary chosen observation 1,2, ,k K :
, ,
1
, , ,
1
, , , , ,
1
( , ) max
s.t.
, 1,2,..., ;
, 1,2,..., ;
, 1,2,..., ;
, , ;
0, 1,2,..
,
.,
t t t t
t
Kt t
k m k m k
k
Kt t
k n k n k x n
k
Kt t t t
k k f f k f k f f k f I f
k
k
x ID y K x I
y y m M
x x g n N
I K I K g f
g
k
g
F
K
, (3)
where k are weights of the DMUs (intensity variables) and f is the depreciation rate for
the f-th fixed input. Note that Eq. 3 assumes constant returns to scale (CRS) technology.
Depending on the scale of operation, a certain DMU might operate in the region of
increasing, constant or decreasing returns to scale. Analysis of the returns to scale might
provide insights on the degree and direction of deviation from the optimal farm size in the
present study. The qualitative approach enables to classify the DMUs into those operating
under increasing, constant, and decreasing returns to scale without calculating the scale
elasticity. In order to identify the returns to scale prevailing for each DMU, production
frontiers based on different assumptions on returns to scale need to be constructed. Specific
assumptions on the returns to scale for the DEA technology can be imposed by manipulating
the convexity constraint (i.e. sum of intensity variables) in Eq. 3 (Färe et al., 1983; Färe,
Grosskopf, 1985; Grosskopf, 1986). Specifically, 1
1K
k
k
renders variable returns to scale
technology, whereas 1
1K
k
k
imposes non-increasing returns to scale. The inefficiency
scores corresponding for variable returns to scale and non-increasing returns to scale
technologies can be denoted as VRS and NIRS
, respectively. Furthermore, let CRS be a
solution of Eq. 3 which contains no restriction on the sum of the intensity variables. A DMU
is said to operate in the region of increasing returns to scale (IRS) if CRS VRS NIRS . Most
productive scale size is maintained when CRS VRS . The region of decreasing returns to
scale (DRS) is indicated by CRS VRS NIRS .
Farm-level data from FADN are applied for the analysis. We focus on specialised
cereal and rapeseed farms falling under faming type 15 according to regulation 1242/2008 EC
(resp. type 13 according to regulation 2003/369 EC) and specialised dairy farms falling under
faming type 45 according to regulation 1242/2008 EC (resp. type 41 according to regulation
2003/369 EC). The data cover years 2004-2014.
Three variable inputs (land, labour, and intermediate consumption), a quasi-fixed
input (capital assets), dynamics factor (gross investments), and an output (total agricultural
output) are used to establish the dynamic productive technology. Land input is utilised
agricultural area in hectares. Labour input comprises both family and external labour force in

Virginia Namiotko, Tomas Baležentis ISSN 2071-789X
RECENT ISSUES IN ECONOMIC DEVELOPMENT
Economics & Sociology, Vol. 10, No. 2, 2017
37
annual work units. Intermediate consumption encompasses specific production costs along
with overheads (in Lithuanian Litas1). Capital assets include the book value of machinery and
buildings at the beginning of the year (in LTL). Gross investments represent the flow of
investments during the respective year (in LTL). Total agricultural output captures crop,
livestock, and other agricultural outputs (in LTL). Törnqvist price indices were applied to
derive implicit quantities of capital assets, investments and agricultural output.
The outliers were identified following Geylani and Stefanou (2013). Also,
observations with negative gross investments were omitted. As a result, 3671 cereal farm and
2782 dairy farm observations are considered.
Investment spikes were identified following Geylani and Stefanou (2013). Investments
exceeding the 2.5 median values of the investment-to-asset ratio for the whole sample are
regarded as spike investments.
2. Results
Lithuania has seen a transition in the structure of the agricultural output. More
specifically, analysis of changes in gross agricultural output structure in 2004-2014 shows
that shares of the livestock output and crop output were virtually the same at the beginning of
the period under analysis. Later on, the share of the livestock output started to decrease. In
2014, as compared to 2004, the share of cereals and industrial crops increased to the highest
extent in the gross agricultural output structure, while the shares of cattle, poultry, and milk
decreased most considerably (Melnikienė, 2016; Statistics Lithuania, 2016).
To illustrate the dynamics in the scale and scope of the crop farming, Fig. 2 presents
the trends in areas sown under the main cereal crops, namely wheat, barely, and rape. Over
the period of 2004-2014, the areas sown under wheat and rape had increased, whereas the area
sown under barley had decreased. These changes to a great extent were influenced by the
grain purchase prices. The purchase price for wheat was by 55% higher in 2014 than in 2004,
whereas the corresponding figure for rape was 53%. The selling price for barley showed the
lowest increase among these crops.
Fig. 2. Crop area of major cereal crops in Lithuania in 2004-2014 (Statistics Lithuania, 2016)
1 1 Lithuanian Litas (LTL) equaled 0.2896 EUR until 2015.
0
100
200
300
400
500
600
700
800
2004 2005 2006 2007 2008 2009 2010 2011 2012 2013 2014
tho
u.
ha
Wheat Barley Rape
Virginia Namiotko, Tomas Baležentis ISSN 2071-789X
RECENT ISSUES IN ECONOMIC DEVELOPMENT
Economics & Sociology, Vol. 10, No. 2, 2017
38
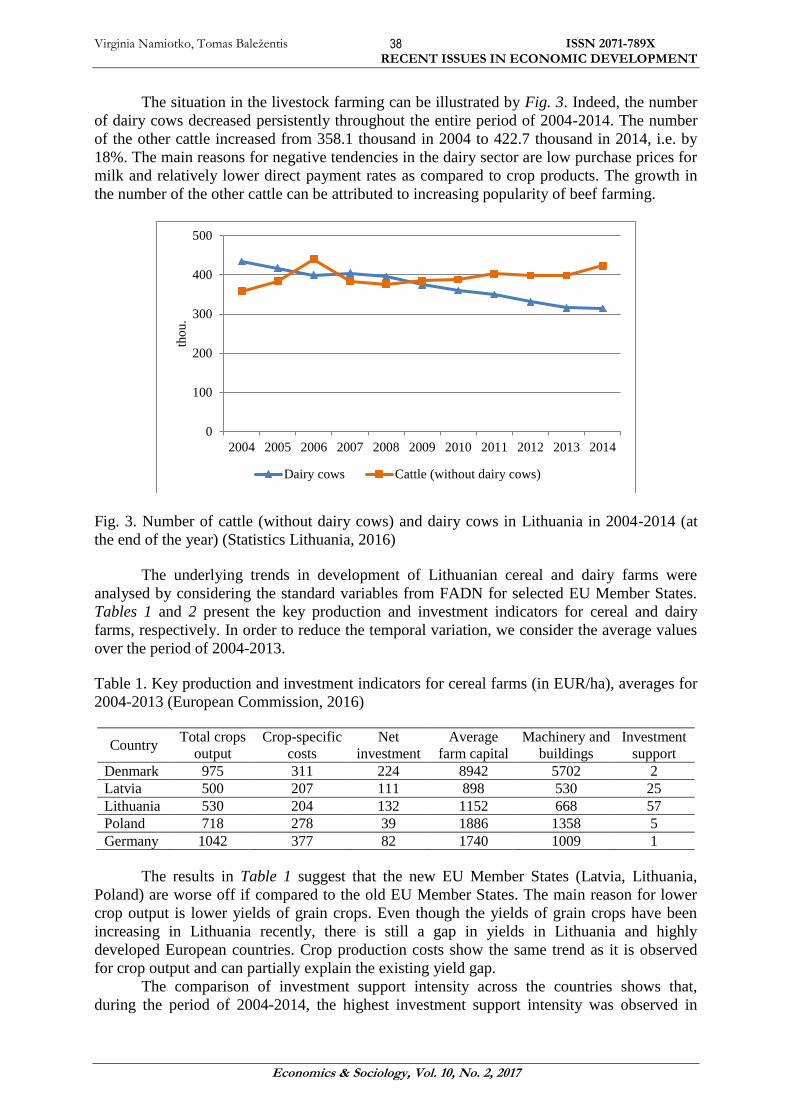
The situation in the livestock farming can be illustrated by Fig. 3. Indeed, the number
of dairy cows decreased persistently throughout the entire period of 2004-2014. The number
of the other cattle increased from 358.1 thousand in 2004 to 422.7 thousand in 2014, i.e. by
18%. The main reasons for negative tendencies in the dairy sector are low purchase prices for
milk and relatively lower direct payment rates as compared to crop products. The growth in
the number of the other cattle can be attributed to increasing popularity of beef farming.
Fig. 3. Number of cattle (without dairy cows) and dairy cows in Lithuania in 2004-2014 (at
the end of the year) (Statistics Lithuania, 2016)
The underlying trends in development of Lithuanian cereal and dairy farms were
analysed by considering the standard variables from FADN for selected EU Member States.
Tables 1 and 2 present the key production and investment indicators for cereal and dairy
farms, respectively. In order to reduce the temporal variation, we consider the average values
over the period of 2004-2013.
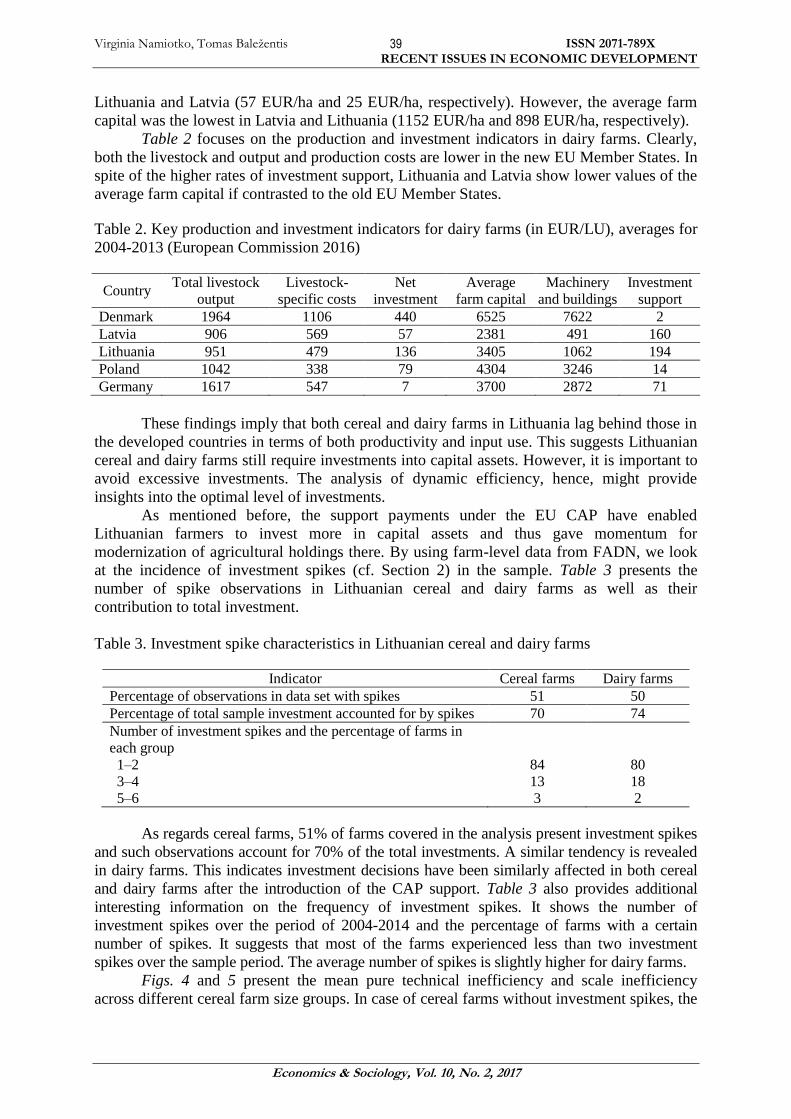
Table 1. Key production and investment indicators for cereal farms (in EUR/ha), averages for
2004-2013 (European Commission, 2016)
Country Total crops
output
Crop-specific
costs
Net
investment
Average
farm capital
Machinery and
buildings
Investment
support
Denmark 975 311 224 8942 5702 2
Latvia 500 207 111 898 530 25
Lithuania 530 204 132 1152 668 57
Poland 718 278 39 1886 1358 5
Germany 1042 377 82 1740 1009 1
The results in Table 1 suggest that the new EU Member States (Latvia, Lithuania,
Poland) are worse off if compared to the old EU Member States. The main reason for lower
crop output is lower yields of grain crops. Even though the yields of grain crops have been
increasing in Lithuania recently, there is still a gap in yields in Lithuania and highly
developed European countries. Crop production costs show the same trend as it is observed
for crop output and can partially explain the existing yield gap.
The comparison of investment support intensity across the countries shows that,
during the period of 2004-2014, the highest investment support intensity was observed in
0
100
200
300
400
500
2004 2005 2006 2007 2008 2009 2010 2011 2012 2013 2014
tho
u.
Dairy cows Cattle (without dairy cows)
Virginia Namiotko, Tomas Baležentis ISSN 2071-789X
RECENT ISSUES IN ECONOMIC DEVELOPMENT
Economics & Sociology, Vol. 10, No. 2, 2017
39
Lithuania and Latvia (57 EUR/ha and 25 EUR/ha, respectively). However, the average farm
capital was the lowest in Latvia and Lithuania (1152 EUR/ha and 898 EUR/ha, respectively).
Table 2 focuses on the production and investment indicators in dairy farms. Clearly,
both the livestock and output and production costs are lower in the new EU Member States. In
spite of the higher rates of investment support, Lithuania and Latvia show lower values of the
average farm capital if contrasted to the old EU Member States.
Table 2. Key production and investment indicators for dairy farms (in EUR/LU), averages for
2004-2013 (European Commission 2016)
Country Total livestock
output
Livestock-
specific costs
Net
investment
Average
farm capital
Machinery
and buildings
Investment
support
Denmark 1964 1106 440 6525 7622 2
Latvia 906 569 57 2381 491 160
Lithuania 951 479 136 3405 1062 194
Poland 1042 338 79 4304 3246 14
Germany 1617 547 7 3700 2872 71
These findings imply that both cereal and dairy farms in Lithuania lag behind those in
the developed countries in terms of both productivity and input use. This suggests Lithuanian
cereal and dairy farms still require investments into capital assets. However, it is important to
avoid excessive investments. The analysis of dynamic efficiency, hence, might provide
insights into the optimal level of investments.
As mentioned before, the support payments under the EU CAP have enabled
Lithuanian farmers to invest more in capital assets and thus gave momentum for
modernization of agricultural holdings there. By using farm-level data from FADN, we look
at the incidence of investment spikes (cf. Section 2) in the sample. Table 3 presents the
number of spike observations in Lithuanian cereal and dairy farms as well as their
contribution to total investment.
Table 3. Investment spike characteristics in Lithuanian cereal and dairy farms
Indicator Cereal farms Dairy farms
Percentage of observations in data set with spikes 51 50
Percentage of total sample investment accounted for by spikes 70 74
Number of investment spikes and the percentage of farms in
each group
1–2
3–4
5–6
84
13
3
80
18
2
As regards cereal farms, 51% of farms covered in the analysis present investment spikes
and such observations account for 70% of the total investments. A similar tendency is revealed
in dairy farms. This indicates investment decisions have been similarly affected in both cereal
and dairy farms after the introduction of the CAP support. Table 3 also provides additional
interesting information on the frequency of investment spikes. It shows the number of
investment spikes over the period of 2004-2014 and the percentage of farms with a certain
number of spikes. It suggests that most of the farms experienced less than two investment
spikes over the sample period. The average number of spikes is slightly higher for dairy farms.
Figs. 4 and 5 present the mean pure technical inefficiency and scale inefficiency
across different cereal farm size groups. In case of cereal farms without investment spikes, the
Virginia Namiotko, Tomas Baležentis ISSN 2071-789X
RECENT ISSUES IN ECONOMIC DEVELOPMENT
Economics & Sociology, Vol. 10, No. 2, 2017
40
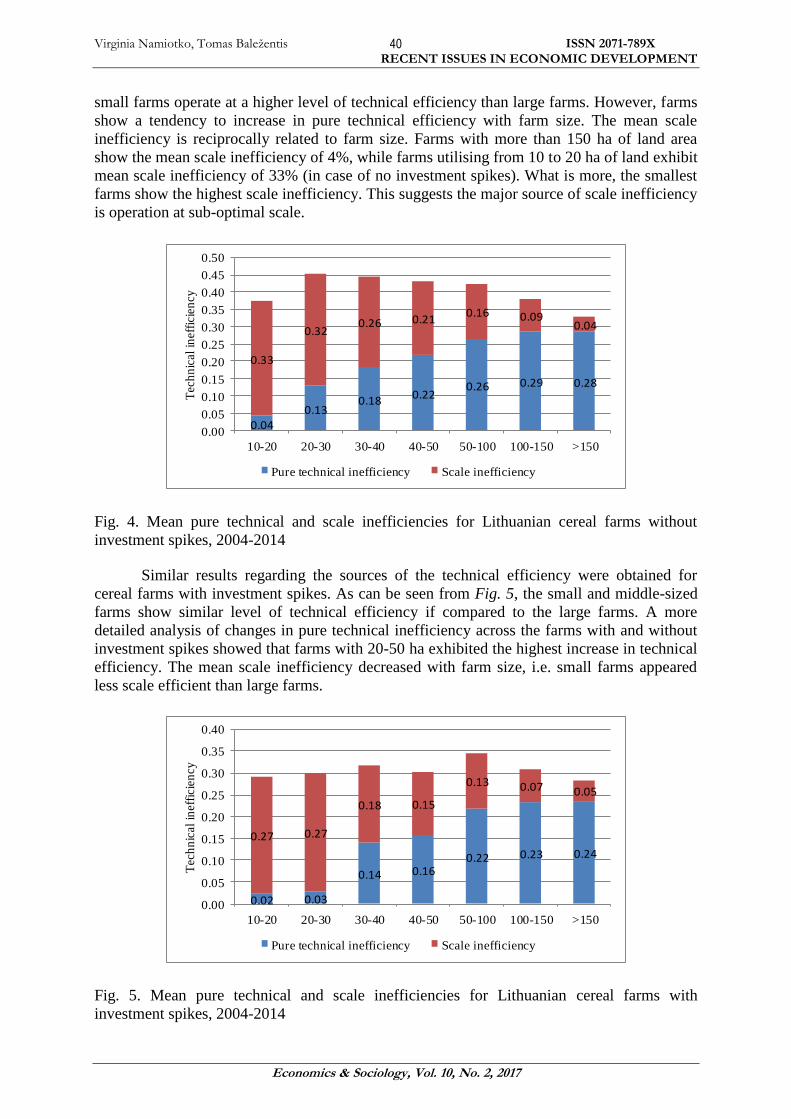
small farms operate at a higher level of technical efficiency than large farms. However, farms
show a tendency to increase in pure technical efficiency with farm size. The mean scale
inefficiency is reciprocally related to farm size. Farms with more than 150 ha of land area
show the mean scale inefficiency of 4%, while farms utilising from 10 to 20 ha of land exhibit
mean scale inefficiency of 33% (in case of no investment spikes). What is more, the smallest
farms show the highest scale inefficiency. This suggests the major source of scale inefficiency
is operation at sub-optimal scale.
0.33
0.320.26 0.21
0.16 0.090.04
0.040.13
0.180.22
0.26 0.29 0.28
0.00
0.05
0.10
0.15
0.20
0.25
0.30
0.35
0.40
0.45
0.50
10-20 20-30 30-40 40-50 50-100 100-150 >150
Tec
hn
ical
in
effi
cien
cy
Pure technical inefficiency Scale inefficiency
Fig. 4. Mean pure technical and scale inefficiencies for Lithuanian cereal farms without
investment spikes, 2004-2014
Similar results regarding the sources of the technical efficiency were obtained for
cereal farms with investment spikes. As can be seen from Fig. 5, the small and middle-sized
farms show similar level of technical efficiency if compared to the large farms. A more
detailed analysis of changes in pure technical inefficiency across the farms with and without
investment spikes showed that farms with 20-50 ha exhibited the highest increase in technical
efficiency. The mean scale inefficiency decreased with farm size, i.e. small farms appeared
less scale efficient than large farms.
0.27 0.27
0.18 0.15
0.13 0.07 0.05
0.02 0.03
0.14 0.160.22 0.23 0.24
0.00
0.05
0.10
0.15
0.20
0.25
0.30
0.35
0.40
10-20 20-30 30-40 40-50 50-100 100-150 >150
Tec
hn
ical
in
effi
cien
cy
Pure technical inefficiency Scale inefficiency
Fig. 5. Mean pure technical and scale inefficiencies for Lithuanian cereal farms with
investment spikes, 2004-2014
Virginia Namiotko, Tomas Baležentis ISSN 2071-789X
RECENT ISSUES IN ECONOMIC DEVELOPMENT
Economics & Sociology, Vol. 10, No. 2, 2017
41
All in all, it can be observed that the highest differences in mean scale efficiency
across the cereal farms with and without investment spikes are observed for the smallest
farms (less than 30 ha). For this farm size, farms with investment spikes showed 5 p.p. to
8 p.p. lower mean scale inefficiency if opposed to respective farms without investment spikes
depending on the farm size group. However, larger farms enjoyed higher reduction in the pure
technical inefficiency. Specifically, the smallest farms (less than 30 ha) showed the highest
difference in the mean pure technical inefficiency across farms with and without investment
spikes of 4 p.p., while these differences where 4 p.p. to 6 p.p. for larger farms depending on
the farm size group. Note that positive numbers indicate lower inefficiency for farms with
investment spikes if opposed to those without spikes in this case.
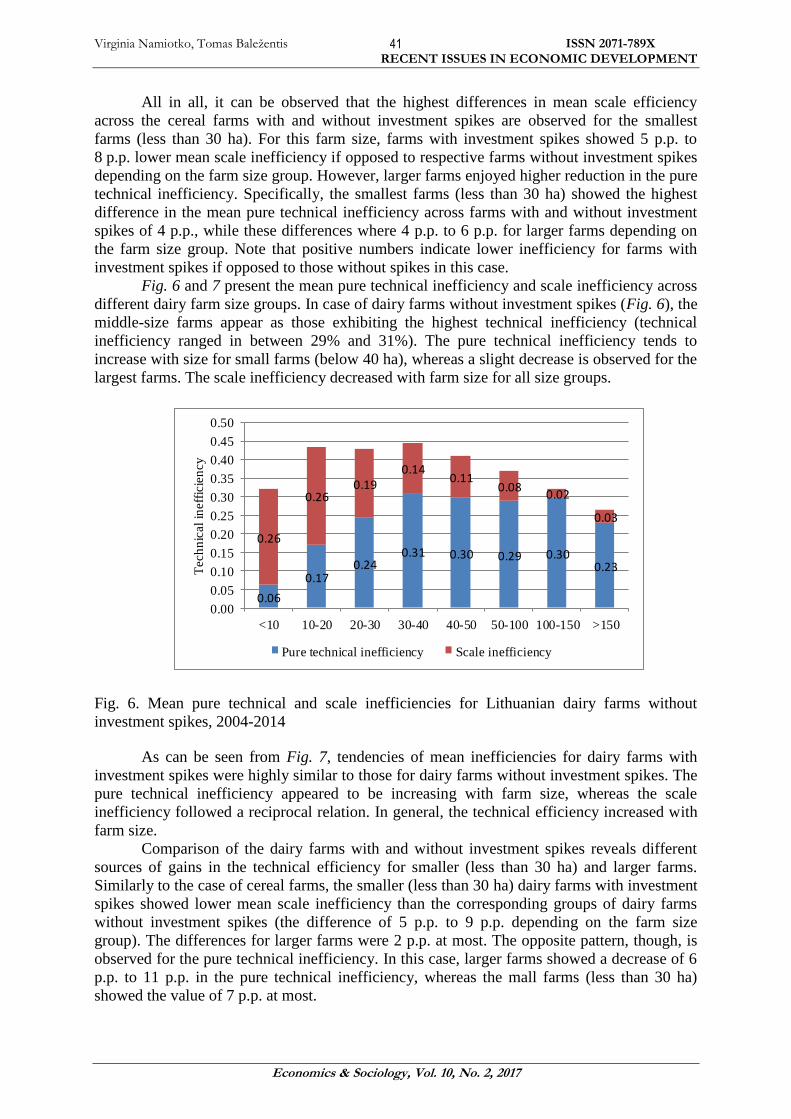
Fig. 6 and 7 present the mean pure technical inefficiency and scale inefficiency across
different dairy farm size groups. In case of dairy farms without investment spikes (Fig. 6), the
middle-size farms appear as those exhibiting the highest technical inefficiency (technical
inefficiency ranged in between 29% and 31%). The pure technical inefficiency tends to
increase with size for small farms (below 40 ha), whereas a slight decrease is observed for the
largest farms. The scale inefficiency decreased with farm size for all size groups.
0.26
0.260.19
0.140.11
0.080.02
0.03
0.06
0.170.24
0.31 0.30 0.29 0.300.23
0.00
0.05
0.10
0.15
0.20
0.25
0.30
0.35
0.40
0.45
0.50
<10 10-20 20-30 30-40 40-50 50-100 100-150 >150
Tech
nic
al
ineff
icie
ncy
Pure technical inefficiency Scale inefficiency
Fig. 6. Mean pure technical and scale inefficiencies for Lithuanian dairy farms without
investment spikes, 2004-2014
As can be seen from Fig. 7, tendencies of mean inefficiencies for dairy farms with
investment spikes were highly similar to those for dairy farms without investment spikes. The
pure technical inefficiency appeared to be increasing with farm size, whereas the scale
inefficiency followed a reciprocal relation. In general, the technical efficiency increased with
farm size.
Comparison of the dairy farms with and without investment spikes reveals different
sources of gains in the technical efficiency for smaller (less than 30 ha) and larger farms.
Similarly to the case of cereal farms, the smaller (less than 30 ha) dairy farms with investment
spikes showed lower mean scale inefficiency than the corresponding groups of dairy farms
without investment spikes (the difference of 5 p.p. to 9 p.p. depending on the farm size
group). The differences for larger farms were 2 p.p. at most. The opposite pattern, though, is
observed for the pure technical inefficiency. In this case, larger farms showed a decrease of 6
p.p. to 11 p.p. in the pure technical inefficiency, whereas the mall farms (less than 30 ha)
showed the value of 7 p.p. at most.

Virginia Namiotko, Tomas Baležentis ISSN 2071-789X
RECENT ISSUES IN ECONOMIC DEVELOPMENT
Economics & Sociology, Vol. 10, No. 2, 2017
42
0.35 0.19 0.14
0.12
0.12 0.060.02
0.05
0.060.14
0.170.23
0.190.23 0.23
0.17
0.00
0.05
0.10
0.15
0.20
0.25
0.30
0.35
0.40
0.45
<10 10-20 20-30 30-40 40-50 50-100 100-150 >150
Tech
nic
al
ineff
icie
ncy
Pure technical inefficiency Scale inefficiency
Fig. 7. Mean pure technical and scale inefficiencies for Lithuanian dairy farms with
investment spikes, 2004-2014
Compared to the cereal farms, larger dairy farms remained more efficient in spite of
the presence of the investment spikes. Therefore, investment spikes in cereal farms are
associated with farm homogeneity in terms of technical efficiency, whereas the latter
relationship is not that evident in the case of dairy farms. What is more, the smallest dairy
farms showed even higher technical inefficiency in the presence of investment spikes, which
indicates that excessive investments might be a more topical issue there.
Further on, we specified three different types of scale behavior. As it was already said,
according to R. Färe et al. (1983), R. Färe and S. Grosskopf (1985), and S. Grosskopf (1986),
these are increasing returns to scale (i.e., sub-optimal scale), constant returns to scale (optimal
scale), and decreasing returns to scale (supra-optimal scale). The following figures present the
results.
80 70 84 70 78 73 5975 64 68
67 72
312 8 12 9 15 20
7 10 12 17 11
16 197
18 13 1220 19 25 20 16 17
0
20
40
60
80
100
Sh
are
of
farm
s,
%
CRS IRS DRS
Fig. 8. The structure of Lithuanian cereal farms without investment spikes in terms of RTS,
2004-2014

Virginia Namiotko, Tomas Baležentis ISSN 2071-789X
RECENT ISSUES IN ECONOMIC DEVELOPMENT
Economics & Sociology, Vol. 10, No. 2, 2017
43
As can be seen from Fig. 8, most of cereal farms without investment spikes operate
under IRS (the share of IRS observations ranged in between 59% and 84% during the period
of 2004-2014). This suggests these farms may be able to increase the productivity of their
inputs by increasing farm size. The results also indicate that there are a smaller number of
farms that could increase their productivity by reducing their size (the share of DRS
observations amounted to 3-20% during 2004-2014). The share of CRS observations
fluctuated in between 7% and 25% during the research period.
However, different farm structure can be observed for the sub-periods of 2004-2010
and 2010-2014. The mean share of IRS observations was 74% during 2004-2010, whereas it
dropped to 69% during the second sub-period. The mean shares of CRS observations for the
two sub-periods were 15% and 20%, respectively. However, the mean shares of DRS were
the same across the two sub-periods.
9 11 17 16 14 9
3312 16
2918 17
68 6370
55 66 7946
66
30
42 64 59
23 2613
2920
1121 22
55
2918 24
0
20
40
60
80
100
Sh
are
of
farm
s,
%
CRS IRS DRS
Fig. 9. The structure of Lithuanian cereal farms with investment spikes in terms of RTS,
2004-2014
In case of cereal farms with investment spikes, the mean share of CRS observations
was 24% during the period of 2004-2014. This indicates that these farms operate at their
optimum size and hence that the productivity of inputs cannot be improved by either
increasing or decreasing the size of the farm. The mean shares of IRS observations and DRS
observations were 59% and 17%, respectively, for the whole research period.
As one can note, the farm structure became more similar to the optimal one after 2010.
Specifically, the mean share of IRS observations was 64% during 2004-2010, while it
decreased to 50% in 2010-2014. The mean share of CRS observations was 20% during the
first sub-period, but it increased up to 31% in the second one. The mean shares of IRS
observations for the two sub-periods were 16% and 19%, respectively.
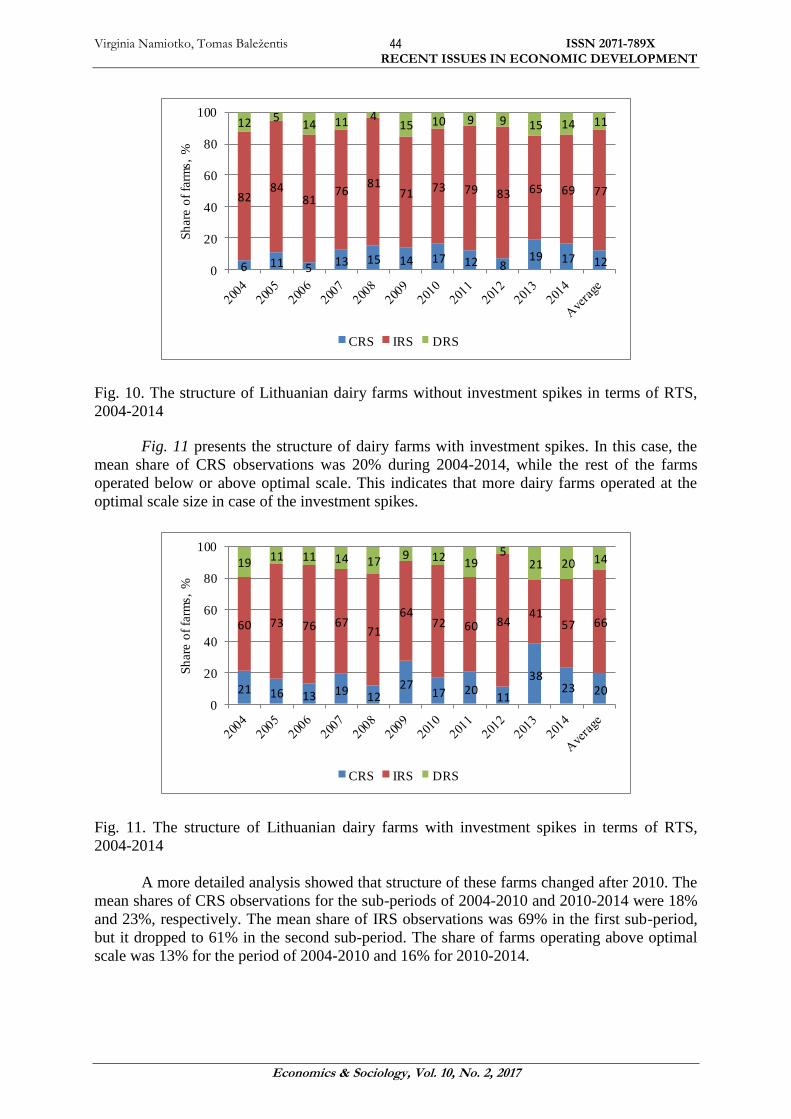
Dairy farms without investment spikes showed lower shares of CRS observations if
opposed to the cereal farms (Fig. 10). This share ranged in between 5% and 19% during
2004-2014. The share of farms operating below their optimal scale fluctuated in between 65%
and 84% during the research period. The share of DRS observations was the lowest one if
compared to other regions of RTS and amounted to 4-15%. However, it should be noted that
the share of IRS observations decreased during the period of 2004-2014, whereas the shares
of CRS observations and DRS observations showed an increasing trend during the said
period.
Virginia Namiotko, Tomas Baležentis ISSN 2071-789X
RECENT ISSUES IN ECONOMIC DEVELOPMENT
Economics & Sociology, Vol. 10, No. 2, 2017
44
12 514 11 4
15 10 9 9 15 14 11
8284
8176
8171 73 79 83 65 69 77
6 11 5 13 15 14 17 12 819 17 12
0
20
40
60
80
100
Sh
are
of
farm
s,
%
CRS IRS DRS
Fig. 10. The structure of Lithuanian dairy farms without investment spikes in terms of RTS,
2004-2014
Fig. 11 presents the structure of dairy farms with investment spikes. In this case, the
mean share of CRS observations was 20% during 2004-2014, while the rest of the farms
operated below or above optimal scale. This indicates that more dairy farms operated at the
optimal scale size in case of the investment spikes.
19 11 11 14 179 12 19
521 20 14
60 73 76 6771
6472 60 84
4157 66
21 16 13 19 1227
17 2011
3823 20
0
20
40
60
80
100
Sh
are
of
farm
s,
%
CRS IRS DRS
Fig. 11. The structure of Lithuanian dairy farms with investment spikes in terms of RTS,
2004-2014
A more detailed analysis showed that structure of these farms changed after 2010. The
mean shares of CRS observations for the sub-periods of 2004-2010 and 2010-2014 were 18%
and 23%, respectively. The mean share of IRS observations was 69% in the first sub-period,
but it dropped to 61% in the second sub-period. The share of farms operating above optimal
scale was 13% for the period of 2004-2010 and 16% for 2010-2014.
Virginia Namiotko, Tomas Baležentis ISSN 2071-789X
RECENT ISSUES IN ECONOMIC DEVELOPMENT
Economics & Sociology, Vol. 10, No. 2, 2017
45
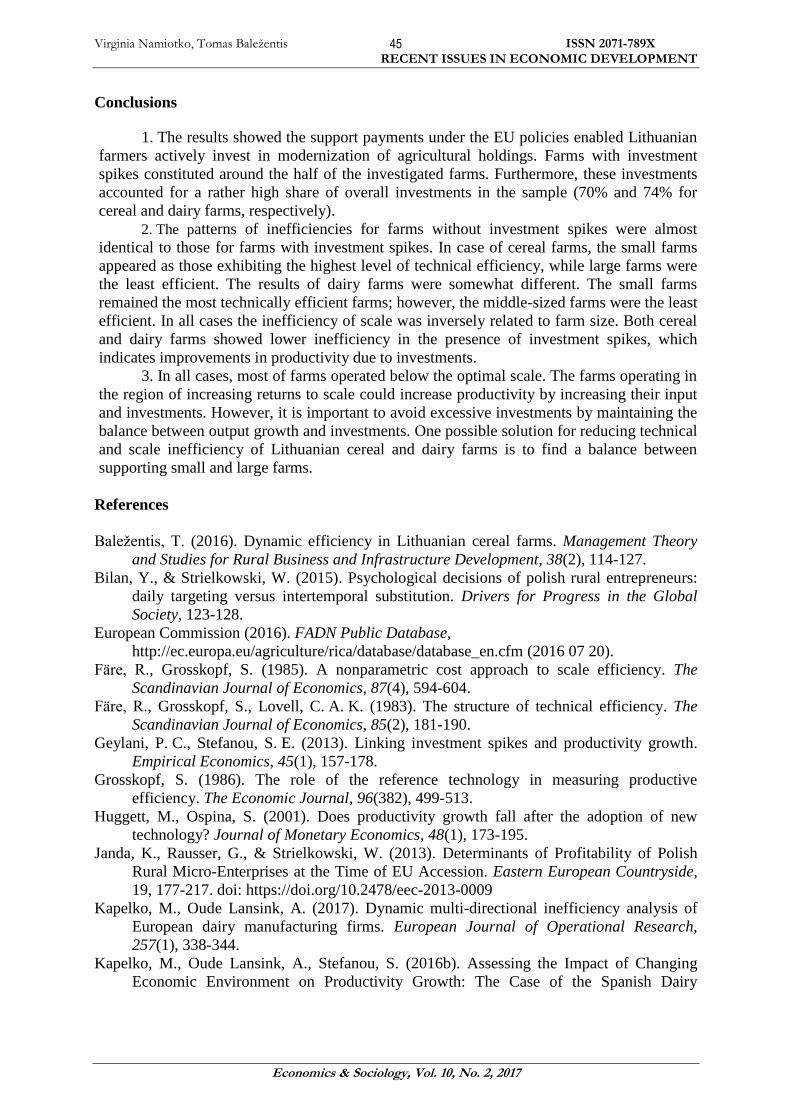
Conclusions
1. The results showed the support payments under the EU policies enabled Lithuanian
farmers actively invest in modernization of agricultural holdings. Farms with investment
spikes constituted around the half of the investigated farms. Furthermore, these investments
accounted for a rather high share of overall investments in the sample (70% and 74% for
cereal and dairy farms, respectively).
2. The patterns of inefficiencies for farms without investment spikes were almost
identical to those for farms with investment spikes. In case of cereal farms, the small farms
appeared as those exhibiting the highest level of technical efficiency, while large farms were
the least efficient. The results of dairy farms were somewhat different. The small farms
remained the most technically efficient farms; however, the middle-sized farms were the least
efficient. In all cases the inefficiency of scale was inversely related to farm size. Both cereal
and dairy farms showed lower inefficiency in the presence of investment spikes, which
indicates improvements in productivity due to investments.
3. In all cases, most of farms operated below the optimal scale. The farms operating in
the region of increasing returns to scale could increase productivity by increasing their input
and investments. However, it is important to avoid excessive investments by maintaining the
balance between output growth and investments. One possible solution for reducing technical
and scale inefficiency of Lithuanian cereal and dairy farms is to find a balance between
supporting small and large farms.
References
Baležentis, T. (2016). Dynamic efficiency in Lithuanian cereal farms. Management Theory
and Studies for Rural Business and Infrastructure Development, 38(2), 114-127.
Bilan, Y., & Strielkowski, W. (2015). Psychological decisions of polish rural entrepreneurs:
daily targeting versus intertemporal substitution. Drivers for Progress in the Global
Society, 123-128.
European Commission (2016). FADN Public Database,
http://ec.europa.eu/agriculture/rica/database/database_en.cfm (2016 07 20).
Färe, R., Grosskopf, S. (1985). A nonparametric cost approach to scale efficiency. The
Scandinavian Journal of Economics, 87(4), 594-604.
Färe, R., Grosskopf, S., Lovell, C. A. K. (1983). The structure of technical efficiency. The
Scandinavian Journal of Economics, 85(2), 181-190.
Geylani, P. C., Stefanou, S. E. (2013). Linking investment spikes and productivity growth.
Empirical Economics, 45(1), 157-178.
Grosskopf, S. (1986). The role of the reference technology in measuring productive
efficiency. The Economic Journal, 96(382), 499-513.
Huggett, M., Ospina, S. (2001). Does productivity growth fall after the adoption of new
technology? Journal of Monetary Economics, 48(1), 173-195.
Janda, K., Rausser, G., & Strielkowski, W. (2013). Determinants of Profitability of Polish
Rural Micro-Enterprises at the Time of EU Accession. Eastern European Countryside,
19, 177-217. doi: https://doi.org/10.2478/eec-2013-0009
Kapelko, M., Oude Lansink, A. (2017). Dynamic multi-directional inefficiency analysis of
European dairy manufacturing firms. European Journal of Operational Research,
257(1), 338-344.
Kapelko, M., Oude Lansink, A., Stefanou, S. (2016b). Assessing the Impact of Changing
Economic Environment on Productivity Growth: The Case of the Spanish Dairy

Virginia Namiotko, Tomas Baležentis ISSN 2071-789X
RECENT ISSUES IN ECONOMIC DEVELOPMENT
Economics & Sociology, Vol. 10, No. 2, 2017
46
Processing Industry. Journal of Food Products Marketing, 1-14.
DOI:10.1080/10454446.2014.1000448
Kapelko, M., Oude Lansink, A., Stefanou, S. E. (2016a). Input‐Specific Dynamic
Productivity Change: Measurement and Application to European Dairy Manufacturing
Firms. Journal of Agricultural Economics. DOI: 10.1111/1477-9552.12188
Kapelko, M., Oude Lansink, A., Stefanou, S. E. (2015). Analyzing the impact of investment
spikes on dynamic productivity growth, Omega, 54, 116-124.
Krylovas, A., Zavadskas, E. K., & Kosareva, N. (2016). Multiple criteria decision-making
KEMIRA-M method for solution of location alternatives. Economic research –
Ekonomska istraživanja, 29(1), 50-65.
Melnikienė, R. (ed.) (2016). Lietuvos žemės ir maisto ūkis 2015 = Agriculture and food sector
in Lithuania 2015. Lietuvos agrarinės ekonomikos institutas.
Mikócziová, J. (2010). Sources of investment finance in firms in Slovakia. Journal of
Competitiveness, 2(1), 67-73.
Power, L. (1998). The missing link: technology, investment, and productivity. Review of
Economics and Statistics, 80(2), 300-313.
Rungsuriyawiboon, S., Hockmann, H. (2015). Adjustment costs and efficiency in Polish
agriculture: a dynamic efficiency approach. Journal of Productivity Analysis, 44(1), 51-
68.
Sakellaris, P. (2004). Patterns of plant adjustment. Journal of Monetary Economics, 51(2),
425-450.
Serra, T., Lansink, A. O., Stefanou, S. E. (2011). Measurement of dynamic efficiency: A
directional distance function parametric approach. American Journal of Agricultural
Economics, 93(3), 752-763.
Silva, E., Lansink, A. O., Stefanou, S. E. (2015). The adjustment-cost model of the firm:
Duality and productive efficiency. International Journal of Production Economics, 168,
245-256.
Simionescu, M. (2016). The relation between economic growth and foreign direct investment
during the economic crisis in the European Union. Zbornik radova Ekonomskog
fakulteta u Rijeci: časopis za ekonomsku teoriju i praksu, 34(1), 187-213.
Statistics Lithuania (2016). Official Statistics Portal, http://osp.stat.gov.lt/ (2016 08).