Embed Size (px)
Citation preview
THE FEASIBILITY OF IMPLEMENTING THE DATA ANALYSIS AND REPORTING TECHNIQUES (DART) PACKAGE
IN VIRGINIA
by
William E. Kelsh Research Scientist
(The opinions, findings, and conclusions expressed in this report are those of the author and not necessarily those of
the sponsoring agencies.)
Virginia Highway & Transportation Research Council (A Cooperative Organization Sponsored Jointly by the Virginia
Department of Highways & Transportation and the University of Virginia)
Char!ottesvil!e, Virginia
December 1980 VHTRC 81-R28

SAFETY RESEARCH ADVISORY COMMITTEE
MR. R. W. DUVAL, Chairman, Deputy Director, Virginia Department of Transportation
MR. FRANK D. ALTOBELLI,
MAJOR C. M. BOLD IN,
MR. V. M. BURGESS,
MR. R. E. CAMPBELL,
MR. WALTER E.
MR. R. W.
MR. C. P.
Regional National
MR. B. G.
Administrator, Highway Traffic
Planning 0fficer, Virginia Department
Safety
Safety Admini stratYon
of State Police
VASAP Administrator, Virginia Department of Transportation Management Information Office of Secretary of
Safety Systems Director, Transportation
DOUGLAS, Programs Director, Virginia Department
FAHY, Assistant Attorney General, Division of Motor Vehicles
HEITZLER, JR., Program Manager, Division of Management Analysis and Systems
JOHNSON, Supervisor, Driver Education,
MR. HIRAM R.
MR. DAVID 0.
MR. R. F.
MR. W. F.
MR. R. M. MCDONALD,
of Transportation Safety
Development
State Department of Education JOHNSON, Director, Department of Computer Services
MCALLISTER, Traffic Engineer, Virginia Department of Transportation Safety
MCCARTY, Safety Program Coordinator, Federal Highway Administration
MCCORMICK, Assistant District Engineer, Virginia Department of Highways
Project Director, Highway Administration of Justice
MS. SUSAN D. MCHENRY,
MR. C. B. STOKE,
MR. A. L. THOMAS,
MR. G. L. WHITE,
and Transportation Safety Training Center and Public Safety, VCU
Director, Bureau of Emergency Medical Serivces
Research Scientist, Virginia Highway and Transportation Research Council Assistant Traffic and Safety Engineer, Virginia Department of Highways and Transportation
JR., Driver Serivces Administrator, Division of Motor Vehicles
ii

ABSTRACT
This pmoject was undertaken fo• the Virginia Depamtment of Tmanspomtation Safety to assess the feasibility of implementing the Data Analysis and Repo•ting Techniques (DART) computem soft- wame system in Virginia. Following a meview of available litema- <ume, discussion of system implementation and use with fedema! and state pemsonnel, and a sumvey of 2• states in which DART has been installed it was concluded that although the system has its shomf- comings DART can be successfully employed as a too! fore the analysis of accident data. Howevem, DART must be ins•alled at a site wheme •hmee key ingmedients fore successful system use concummently meside" adequate technical mesoumces, usem intemest, and management suppom<.
Vimginia lacks the capabilities of the DART system and could benefit by i•s installation and application to accident data analy- sis fore highway safety planning pumposes. Although theme is no pemfect site fore installation of the DART system in Virginia, the Depamtmen• of Highways and Transpomtation (VDHgT) appeams to be the most p•omising candidate.
It is recommended that the Virginia Department of Transporta- tion Safety should solicit a proposal for implementation of the DART system from the VDH&T, support installation of DART by underwriting its cost with federal §402 safety funds, and organize a coordinating committee of traffic safety data users and technical personnel to assist in the implementation of the system and promote, monitor, and evaluate DART once installed.
iii


PREFACE
The Data Analysis and Reporting Techniques (DART) computer software package was developed by the National Highway Traffic Safety Administration (NHTSA) for use in identifying highway safety problems at the state level. First introduced in several pilot states in 1977, the DART system has been both wi•dely praised and roundly criticized. THe NHTSA has made overtures to install the DART system in Virginia. The conflicting opinions of the traffic safety community on the worthiness of the system indicated a need to carefully consider the NHTSA's offer. This report has been prepared for the Virginia Department of Transportation Safety to assist management in making an informed decision on the appro- priateness of implementing and using DART in Virginia.
It should be pointed out that since the preparation of this report the NHTSA has modified some of the features of the DART system in response to criticism from the states. Therefore, some of the passages describing the system in this report are somewhat incomplete. Further, some of the criticisms of DART revealed in the author's survey of the s•ates do not apply to the new version of the system. Regardles•s, the conclusions and recommendations offered im the report remain pertinent.
The author thanks Clayton Hatch of the NHTSA; John W. Larmer, Peter Kolgen, and Ross Carter of the Genasys Corporation; Capt. W. R. Wagner, Lt. Paul C. Hollandsworth, and Thomas 0'Steen of the Department of State Police; F. F. Small, C. D. Hall, Walter Mitterer, Graham Raiford, and J. T. Kozlowski of the Virginia Department of Highways and Transportation; Lori Russell of the Virginia Department of Transportation Safety; and J. L. Korf and P. S. Harris of the Virginia Highway and Transportation Research Council for their valuable assistance in obtaining information on the DART package and assessing the feasibility of the implementation of the system in V ir g ini a.
Also, the author thanks all of the respondents •o the survey of the states for their significant contribution to the author's understanding of the operational advantages and disadvantages of the DART system.
Special thanks go to Cheryl Lynn, Wayne Ferguson, and C lint Simpson of the Research Council for reviewing the draft of the re- port, to Toni Thompson and Jean Vanderberry for typing the draft and final manuscripts, and to Harry Craft for his editorial assistance.

THE FEASIBILITY OF IMPLEMENTING THE DATA ANALYSIS AND REPORTING TECHNIQUES (DART) PACKAGE
IN VIRGINIA
by
William E. Kelsh Research Scientist
INTRODUCTION
Since 1976, the National Highway Traffic. Safety Administration (NHTSA) has been promoting a new approach to state highway safety program management, shifting away from the standards implementation format of the Annual Highway Safety Work Program and the Comprehen- sive Plan to a management process based on the preparation and submission of appeal in that on the states ir• the Highway full authority priorities has
an Annual Highway Safety Plan.* The new process has it eliminates rigid requirements previously imposed
to meet federally set criteria such as those contained Safety Program Standards.** Within certain guidelines, for making management decisions and setting program been returned to the states.
However, the implementation of the new highway safety planning process is heavily dependent upon a state's capability to perform problem identification analysis, a technique whereby a state's man- agement staff is expected to analyze crash data contained in the state's automated files to statistically isolate and document sigr•ifi- cant highway safety problem areas. Theoretically, once specific safe- ty problems can be pinpointed, appropriate remedial countermeasures can be formulated and implemented to address them. The NHTSA has observed that most states have neither the staff expertise nor the statistical tools to do an adequate job of problem identification analysis. In response to this nationwide deficiency, the NHTSA has undertaken a variety of programs designed to bolster the problem identification capabilities of the states. In addition to developing a "how-to" manual on problem identification analysis, providing educational workshops for state data analysts, and preparing accident
*See NHTSA/FHWA Order 960-2/7510.3, Highway Safety Volume 102.
Pro gr am Man ual,
**23 U.S.C. 402(a).
data improvement plans for each state, the NHTSA has developed a computer software statistical package called the Data Analysis and Reporting Techniques (DART) system. The DART system is a set of computer programs that can be utilized to access and statistically analyze data contained in a state's automated acci- dent file.. While in a few instances other statistical software packages have been adapted for use in accident analysis, DART is the only computer software system designed specifically for this purpose.
The NHTSA advertises that, given virtually any accident data base, the DART system (under user control) can produce the follow- ing"
i. Simple counts of specific classes of accidents; e.g., number of motorcycle accidents, number of truck accidents, etc., and perform simple arithmetic operations.
2. Frequency distributions of every variable in the accident file (number of times each element and its coded values appear in the file, sort of a snapshot of the entire file). These are provided to the state as a by-product of the installation, and of itself provides ready answers to questions that previously took weeks of a programmer's time to extract. (These are called "Univariates".)
3. Cross tabulations of any combination of two variables; for example, accidents by type of vehicle and age of driver. These bivariate analyses are used to identify where the simultaneous existence of two factors presents a high probability of accident occurrence, such as motor- cycle drivers under 18, or pickup truck drivers on secondary roads.
4. Arrays of statistical indicators and tests of significance such as standard deviation, regression from the mean, tests for nonrandomness, etc.
5. Outputs in tabular form or as pictorial illustrations, such as histograms, plots, and graphs.
These user oriented accident data selection, retrieval, analyt- ical, and reporting features, heretofore unavailable to most states, conceptually make DART a considerable enhancement to any state's accident data analysis capability.

THE NHTSA'S DART OFFER
Through a contract let to the Genasys Corporation, the devel- oper of the DART system, the NHTSA is making the DART package available to the states at relatively low cost. The software is free of charge to any state that wishes to acquire the system. Further, the NHTSA will bear the required costs of the contractor's t•me and expenses to implement DART at a computer installation of the state's choosing. The candidate state must, however, furnish the computer and staff time necessary for installation, use, and maintenance of DART.
Prior to formally offering the DART package to a state, the NHTSA conducts a preliminary feasibility study that includes an assessment of the state's need for DART, a review of the attributes of the state's accident file, and an assessment of the state's ability to use and maintain the software. If the feasibility study indicates that the state has the necessary resources to successfully use the DART system, the NHTSA requests that a sample of about 5,000 records from the state's accident file be sent to Genasys Corporation offices for testing purposes. The contractor reports the results of the testing to the state, indicating any problems encountered and how they were resolved.
At this point the state determines whether or not it wishes to accept the DART system. If it does, arrangements are made for Genasys personnel to install the system at a suitable computer installation and conduct a one-week training course. Once the installation team has left the site, maintenance of the DART system is left to the state; however, the contractor is available for troubleshooting advice if any problems arise. Serious difficulties may require a return visit by the installation team.
PURPOSE
Initial reactions to the DART system in the 23 states in which installation attempts had been made through June 1979 were mixed. Some states had used DART with considerable success while others had not used the system. Clearly, the wide variation in the states' experience with DART indicated the need to carefully consider the NHTSA's DART offer prior to accepting it. While, in concept, DART would appear to be a very valuable enhancement to any state's accident data analysis capability, in practice it may be quite a different thing.
When, in 1979, the NHTSA was considering Virginia as a potential recipient of DART, the Virginia Department of Transportation Safety
asked the Virginia Highway and Transportation Research Council to conduct a pre-installation evaluation of the system. The major objectives of this research were
I. to determine if the capabilities of the DART system were appropriate for use in Virginia•
2. to identify in advance potential pitfalls in DART implementation and use in order that they could be avoided if the sys.tem were installed;
3. to identify the operational, technical, and economic advantages and disadvantages of DART implementation and use at potential installation sites in the Commonwealth; and
4. to make recommendations to the Virginia Department of Transportation Safety based on the results of items i, 2, and 3.
METHODOLOGY
For this project, all available literature on the DART system was assembled and reviewed. A survey of the 23 states in which the DART package had been installed was conducted in an effort to directly determine how DART had been received in different parts of the country. Interviews and discussions were held with technical, planning, engineering, administrative, and research personnel in each of the following agencies"
Virginia Department of Highways and Transportation, Virginia Department of State Police Virginia Department of Transportation Safety Virginia Highway and Transportation Research Council
Additionally, extensive discussions were had with NHTSA and Genasys Corporation personnel regarding the implementation, operation, and application of the DART system.
In the remainder of this report a number of topics are addressed. First, the DART package and its operation are briefly described to familiarize the reader with its various components. Secondly, the results of the survey of the states in which DART had been installed prior to the initiation of this project are presented and synthesized. Third, Virginia's problem identification capabilities are summarize• and assessed. Fourth, the advantages and disadvantages of the DART
system are reviewed. Finally, the feasibility of implementing the DART system at each of four of Virginia's traffic safety agencies is discussed.
THE DART PACKAGE
The DART system is composed of three distinct sets of com- puter programs, each of which implements a different facet of DART usage. These three facets are known as the conversion phase, edit/selection phase, and statistical analysis phase.
In the conversion phase, the state's accident file is read by the DART programs, manipulated, and transformed into a format consonant with the data input requirements of the edit/selection phase. This altered crash file, known as the DART Model file, differs from the source file not only in structure but also in content. In particular, the DART Model File contains no elements of personal identification, nor any alphabetic codes. Further, the Model File consists only of the data elements deemed neces-
sary by the state for problem identification analysis. The NHTSA recommends that conversion of the state accident file should be done annually, although more frequent conversions can be made depending on the needs of the DART users.
Apart from the creation of the Model File, two other end products spring from the conversion process" a Data Dictionary, which is a listing of all elements contained in the Model File, in- cluding their associated codes and the meanings of each; and a Full File Univariate Report, which lists every data element and the frequency of its occurrence in the Model File for every coded value. These documents are useful reference materials for DART users in formulating efficient and useful data selection and analysis programs.
In the edit/selection phase, the DART user writes and executes a series of short programs specifying which elements or combinations of elements in the DART Model File he wishes to analyze. These programs, or data selection requests, are written as a sequence of commands in an English-like DART Query Languag which are then executed by the DART system. In this phase DART operates in two modes. In the edit mode, the user's program is read and analyzed for errors in syntax or logic. If an error is found, it is noted,
*The interested reader is referred to the DART User's Manual for a full discussion of the syntax and function of DART system commands.

and the user must correct and resubmit his data request. If no
error is found, the command sequence is executed i• the selection mode and the instructions are carried out. Although the syntax of the DART Query Language is quite simple, the allowable commands can be ordered to accomplish sophisticated searches for and manipula- tions of Model File data An important feature of this phase of DART usage is the capability to select and store for later use up to five distinct subsets of crash data (i.e., fatal, motorcycle, or pedes- trian accidents) for each pass of the full Model File. The DART u•Dr can employ this feature to efficiently and inexpensively extract and store needed information for subsequent accident studies.
Data sets chosen from the DART Model File in the edit/selection phase are statistically analyzed in the third phase of DART usage through execution of a computer software package called OMNITAB 77• a package developed and maintained by the Statistical Engineering Laboratories of the National Bureau of Standards. This package pro- vides the user with virtually every statistical routine in use and an extensive array of output options. A complete statistical array can be produc.ed with a single command, full plotting capability is avail- able, and it can operate either interactive!y or in batch mode.* •(9 in the selection phase, the DART user employs an English-like language (0MNITAB Command language) to write programs that specify which sta- tistical tests should be made on the data set of interest and how the results should be reported.
In summary, DART is a system of three sets of programs that m•.t be executed in sequence. First, the state's accident file is con- verted to a format acceptable for subsequent execution of the programs utilized in the selection phase. Secondly, in the selection phase, the DART user specifies and selects which data sets contained in the crash file he wishes to.analyze. Thirdly, the chosen data are sta- tistically analyzed by the OMNITAB 77 software package. The resul• are reported to the user in a suitable format.
THE STATES' EXPERIENCE WITH DART
The Q•estionnaire Survey
At the time of the initiation of this project the NHTSA had made offers to install the DART package in 22 states and the Commonwealth of Puerto Rico (hereafter collectively referred to as "the states"). It was obvious that the states could be a valuable source of informa- tion on the technical and operational details of DART implementatio}• and usage. A survey of the states was conducted in the form of a
two-part questionnaire (see Appendix A) mailed to the principal DART analyst (according to the NHTSA records) in each state in June 1979.
"*Additionally, OMNITAB 77 can be used for analysis of any data set and is by no means tied directly to the contents of the state accl dent file as are the conversion and selection routines.

Part I of the questionnaire focused on the technical aspects of DART, and was designed to be completed by someone familiar with how the system was implemented on the host computer in that state. Part II concentrated on the details of how the system had been used as a data analysis tool in that state, and was designed to be com- pleted by an accident data analyst familiar with DART.
Both parts of the questionnaire were completed and returned by 20 of the 23 states. Although the questionnaire was divided into two parts to be completed by different people, in most cases (16 out of 20) both survey forms were completed by the same individual, usu- ally the principal DART analyst for that state. Respondents to the survey (see Appendix B) had had an average of 18 months' experience with the DART system. All but 4 respondents to Part I and all but 5 respondents to Part II had had one year or more experience. Thus, the respondents were well qualified to comment on DART.
S u ,•,ve, y_ Re s_.u..it s
Part I of Questionnaire
The first DART implementations were attempted in early 1977 in seven of the original Highway Safety Plan pilot states. In 1978, installation attempts were made in seven additional states, and in the first six months of 1979 six attempts at implementation were made. Additionally, by June 1979 Genasys Corporation person- nel had had to return to a number of states to reinstall or make modifications to the DART system to make it fully operational.
The. bulk of the host machines selected for DART installation are IBM 360 or 370 series computers (ii states) Other machines on which DART has been implemented are the Burroughs B6700 (2 states), Univac ii00 (3 states), Honeywell 600 (i state) and the Honeywell Multics (I state).*
*Answer totals may not always add to the total number of completed questionnaires returned (20) because of incomplete responses to some questions.

The installation period for the DART package averaged two weeks over all respondents, with 6 states reporting installation periods of one week or less. Another 6 states reported installa- tion periods of four or more weeks. It is interesting to note that in all but one case* implementation of DART on IBM hardware took two weeks or less, while installation on other than IBM hard- ware generally took longer (up to four weeks). This probably indicates that the contractor is more familiar with IBM hardware and software than with non-IBM products and that the DART system was designed with an IBM orientation.
In 1979, DART was maintained at computer installations in all but 3 of the surveyed states. In 2 of these states, DART was never satisfactorily implemented while in the other the package was imple- mented but dropped because it was never used.
Most states (14) convert their master accident file to the DART Model File format once each year, although i state does it monthly and 2 do it Semiannually. Also, most states (13) initially converted 2 years of data or less to the DART Model File format upon installation of the DART package.
The states were asked to rate the DART system from the data processing standpoint on a poor to excellent scale. Six states indicated that DART was a good system ("could use some fine tuning"), 5 responded that it was an adequate system ("needs improvement"), 3 felt that it was a so-so system ("needs considerable improvement"), and i described DART as a poor system ("a headache"). No state indicated that DART was an excellent system.
*One IBM state had a very sophisticated accident records data base system that caused numerous installation problems for the contractor. In fact, despite four implementation attempts, DART is still not operational in this state.

Comments submitted by respondents pertaining to the difficulties they experienced with the DART package related to a wide variety of topics. Some of the more commonly mentioned difficulties are cited below.
i. Conversion errors and/or misinterpretation of master •ccident•-file codes during_th e generatio• o-f the DA•T Model File. In some states, test runs o• the•DART •-odel•'i• compared against separate compilations of the source file pointed out discrepancies between the two files. Further, apparent co•ununication problems between the contractor and a few states resulted in a failure to convert some fields of source data desired by the states. Also, in some instances the contractor misinterpreted source file documentation provided by the states and this resulte• in the improper conversion of state codes to DART Model File codes for some data elements.
2. Difficulties with the implementation of DART software, particularly on non-IBM h•rdware. The in-•t•il•t•n•f the DART package always took longer on Burroughs, Univac, and Honeywell computers than on IBM systems. Eventually, most problems were worked out, although in some states certain DART and OMNITAB commands do not perform their full function as described in the DART and OMNITAB user's manuals.
3. Cost of DART imp!em..e.ntation. NHTSA and Genasys Corpora- tion personnel are reluctant to estimate the computer costs required to implement the DART package, because of the wide variability in methods and rates used through- out the states to calculate comnuter costs. Instead the NHTSA estimates that installation of the DART package will require 5-6 CPU hours of computer time. In some states the installation costs incurred were deemed excessively high relative to the benefits received from having the DART package.

The states were asked to comment on the strengths and weak- nesses of the DART system. While few strengths were noted, a number of weaknesses were listed by the respondents. The weak- nesses of DART basically fell into two categories those re- sulting from the inherent limitations in the design of the DART system, and those resulting from the implementation of DART on a particular machine in a particular state.
The design weaknesses noted were as follows"
i. Only three bivariate tables can be produced on a single DART selection and analysis run.
2. Labeling of tables is time consuming and laborious.
3. Data element identification is restricted to 2 digits in the DART Model File. As a result, the construction of data selection statements in the DART Query Language can become unnecessarily com- plicated.
The implementation-dependent limitations mentioned included the following.
I. In some states only one bivariate table can be pro- duced in a single DART run.
2. The production of bivariate tables required too much computer memory space, which resulted in poor turn- around and undesirably high costs.-
3. Similarly, selection runs from an entire year's accident file were found to require a prohibitive amount of computer time, particularly in those states having a large annual number of accidents (over 200,000).
Part II of Questionnaire
In most of the states (14), the state highway safety office has been the primary user of the DART package. Generally, the size• of the data analysis staffs in these agencies is small (two or fewer full-time analysts). Other agencies reported to have made use of DART have been transportation departments (5 states), motor vehicle divisions (3 states), state police departments (4 states), health departments (i state), education departments (I state), universities (I state), and centralized data processing agencies (i state). Like those of the state highway safety offices, the analytical staffs of these agencies are small (two or fewer full- time analysts).
i0

By far the most common application of the Dart system has bee• for the identification of problem areas as part of the highway safety p!a•ning process (15 state•). Other common uses have been the analysis •f accident data for evaluating specific accident countermeasures (7 states); special project research (5 states); and everyday operations, including responding to special requests from localities (6 states). Six states used DART solely for problem identification purposes.
Ten or fewer users were initially trained in the operation of the DART system in 16 of the responding states. Three other states sent between ii and 20 people to the training session, while in i state between 21 and 30 trainees attended the course.
When asked to rate the quality of the user training provided by the contractor during the installation period, I state described the course as excellent, 4 rated it as good, 4 rated it as adequate, and 7 rated the course as poor. Three other states did not specif- ically answer this question but were critical of the training re- ceived.
DART user's were asked to evaluate the DART system as imple- mented in their states in several important dimensions. Table i presents the responses to this question.
Table i
User Evaluation of DART
DART Feature No. of Users Responding
Excellent Good Fair Poor Unable to Evaluate
Ease of use of OMNITAB commands
Ease of use of DART Query Language
Quality of DART output (format, clarity, etc.)
DART analytical capabilities
Job turnaround time
Cost to DART users
4 7 3 2 4
5 5 0 3 6
2 7 3 3 4
4 4 3 i 8
3 9 3 i 4
2 4 i 3 i0
ii

Ignoring the responses of those users who were unable to make a judgement, the states generally gave DART good marks on the ease of use of both the Query Language and 0MNITAB commands and the turnaround time for jobs submitted at their installation. The users were less pleased with the quality of DART output and the system's analytical capabilities, although more rated the system "excellent" or "good" than "fair" or "poor" in these di- mensions. Finally, in regard to system costs, only about one- half of the respondents gave DART an "excellent" or "good" grade, which indicated some dissatisfaction with this aspect of DART usage.
Users were asked to rate the responsiveness of both NHTSA and Genasys Corporation personnel to the problems they had ex- perienced with the DART system. Three respondents rated the Genasys Corporation as having been extremely responsive to their needs for assistance, 9 states felt it had been adequately re- sponsive, and 4 respondents felt that the contractor had responded poorly to the difficulties they had experienced. Three states re- sponded that they had experienced no problems requiring the Genasys Corporation's attention. On the other hand, 5 users rated the NHTSA people as having been extremely responsive to their needs for assistance, 7 felt that they had been adequately responsive, and 4 states reported that they had been poorly responsive. Three statea had experienced no user problems requiring the NHTSA's attention.
Users were asked to evaluate their overall experience with DART installation and use including their dealings with NHTSA and Genasys Corporation personnel. Three states rated their overall experience with DART as pleasant ("smooth sailing for the most part"), 12 described their experience with DART as OK ("some difficulties encountered"), while 3 states felt their experience with DART was bad ("a nuisance").
The problems DART user's were experiencing with the system were many and varied. Their criticisms included the following.
i. The bivariate tabling procedures were time consuming.
2. The table output was poorly formatted.
3. The training sessions were inadequate.
4. Error messages returned on unsuccessful DART runs were not always clear and did not indicate the true error.
5. There were inaccuracies in the DART user's manual.
12
6. The system was overly sophisticated, having many unnecessary features.
7. There was no DART system maintenance manual.
Ana!•sis and S•nthesis of Results
Based on the results of the survey, the states' reactions to the DART package were mixed. In 9 of the states surveyed, DART was not being used at all; I0 out of 20 respondents were critical of the training received• 15 of 20 indicated that they had ex- perienced at least some difficulties with DART• and 9 respondents to the technical portion of the survey felt that DART was in need of improvement from the data processing standpoint. Also, the transferability of DART to all makes and models of computers was
unproven, since the full range of DART functions had not been implemented in all modes on all machines, in short, almost every aspect of DART from conversion of the state accident file through implementation and use of the system was criticized by at least one respondent.
On the other hand, DART was being or had been used for problem identification purposes (as intended) in 15 states. It had success- fully been implemented and used on IBM systems. The states that were using DART were generally satisfied with .the system although none thought it was perfect. And the states generally were pleased with the effort, if not the level of performanc.e, of the NHTSA and Genasys personnel with respect to responding to the difficulties they had encountered with the DART system.
What factors could explain such a wide divergence of opinion on DART? In the NHTSA's view the following three key ingredients must be present concurrently at a single installation site if DART is to be successfully implemented and used.
I. Technical Support DART should be installed at a •ite •it• adequate computer facilities, acceptable service levels, and knowledgeable and experienced technical staff.
2. U.se.r .Suppor..t The candidate state should employ a sufficient number of interested and able potential users so that the demand for DART's capabilities will be robust.
13

3. Management Support State safety program management should support DART by allocating sufficient time, money, and manpower resources to the implementation and use of the system. Further, management should promote the use of DART by calling for and relying upon the results of DART analyses for making program decisi•ons.
When any of these critical factors is lacking or deficient then difficulties with the DART system will surely be encountered.
The survey results corrobora.te the NHTSA's observation. Thos• respondents which were most dissatisfied with the DART system usu- ally indicated, explicitly or implicitly, that one of the above factors was lacking or deficient in their state. On the other hand, states that had attained success with DART usually indicated high levels of technical, user, and management support.
It can be concluded that although the DART system has some design deficiencies (duly pointed out by the states), the success or failure of the implementation of the system in any state is principally determined by the choice of installation site and its operational characteristics, the level of sophistication of potential users, and the level of commitment of the state's safety program management to the project.
Suggestions Drawn from Survey Results
Following are some specific suggestions for the successful implementation and use of the DART system that have been extracted from the responses to the questionnaire survey.
system .!.mple..mentation/Initial Conversion of Source Fil 9
i. Select an installation site having IBM hardware. If this is not possible, select an installation site having Univac, Burroughs, or Honeywell systems.
2. Assign one experienced, knowledgeable programmer to the DART project full-time in the implementa- tion phase. Ideally, this individual should be completely familiar with the computer system on which DART will be installed.
3. Early in the project, involve someone intimately familiar with the source crash file. This indi- vidual_ should be responsible for ensuring tha •
14

the contractor receives current and accurate file documentation prior to system implementa- tion and that the initial conversion of the source file to DART Model File format is complete and error- free.
4. Be sure to consider the operational characteristics of the data processing center chosen for DART imple- mentation. Many computing centers have job sched- uling policies that relegate the execution of large programs like DART to small blocks of time or to off-peak hours. This could inhibit usage of the DART system later on.
Training
I. Training classes should be small (i0 or fewer participants) and should include the programJner assigned to the DART project.
2. Training should not be accepted until the DART system has been implemented satisfactorily. It is vital that trainees get hands-on experience with the fully operational system.
3. All trainees should have at least rudimentary knowledge of data processing principles and practices so that they will be familiar with the capabilities a•d limitations of the computer.
4. For training purposes, DART should be implemented in the interactive mode. (This would be convenient, although not essential.) In this way individual attention could be given to course participants while they work directly with the system.
DART Selection Runs
i. Costs for DART selection runs against the full Model File can be minimized by taking advantage of low billing rates available by submitting batch jobs for overnight execution.
2. The efficiency of selection runs can be minimized by combining multiple data requests from various users into one job. This is possible because up to five subfiles of interest can be generated by a single job and a single pass of the Model File.
15
3. Preplanning data requests by consulting the Data Dictionary and Full File Univariate Report prior to a selection run helps reduce the possibility of creating subfiles with little or no useful information.
4. Multiple selection runs for often requested data can be minimized by creating a standard set of subfiles in areas of continuing interest (i.e., pedestrian, fatal, or motorcycle accidents) at the beginning of each year.
D6RT Statistic,a!• Ana!•,sis
i. Implementing the OMNITAB portion of the system in the interactive mode maximizes DART's usefulness by allowing the skilled user to explore the data in. a variety of ways during a single terminal session.
2. Developing standard OMNITAB routines to produce tables, plots, histograms, and other standard statistical outputs and storing them in a common OMNITAB utility library to be summoned by the users as needed eliminates duplicative coding and lengthy terminal sessions, and facilitates usage of frequently employed statistical techniques.
VIRGINIA'S PROBLEM IDENTIFICATION CAPABILITIES
In establishing the Commonwealth of Virginia's need for DART's capabilities it was thought useful to review the practices employed by the state in its analyses of accident data.
While a large number of state agencies have an interest in traffic safety in the Commonwealth, the four most active users of crash data are the Virginia Department of State Police, Virginia Department of Transportation Safety, Virginia Highway and Trans- portation Research Council, and the Virginia Department of High- ways and Transportation.
The Virginia Department of State Police (DSP) is legislatively mandated to collect, compile, store, and publish accident data ex- tracted from the state's FR-300P police accident report form. In accordance with that mandate the DSP's Records and Statistics Division annually publishes Virginia Crash Facts which is a com- pendium of accident statistics for the preceding calendar year.
16

Crash Facts is a useful document for looking at the statewide accld•nt•plcture but lacks sufficient detail and flexibility for use in in-depth accident studies. The Records and Statistics Division is also responsible for preparing and distributing monthly and annual DSP crash tapes that are used by other agencies for computer production and reduction of accident data to suit their information needs.
The DSP has no in-house data analysis unit charged with responsibility for interpreting accident statistics. Instead, this function is left to the users of the crash information; namely, the Department of Highways and Transportation, the Department of Transportation Safety, and the Highway and Transportation Research Council.
The Virginia Department of Transportation Safety employs one part-time statistician to work with accident statistics. Daily, monthly, quarterly, and annual reports are manually prepared for selected categories of fatal accidents for use by the Department's management in monitoring the state's fatal accident experience or in replying to special requests from public and private organiza- tions, but this information is not used as part of a statewide problem identification effort.
The Safety Group of the Virginia Highway and Transportation Research Council generates a number of statistical reports in- tended for use in problem identification analyses for distribution to state and local traffic safety organizations. Mini-Crash Fact• reports are prepared annually for each of Virginia's 144 localities showing locality-specific accident statistics in selected areas of interest (total crashes, motorcycle accidents, pedestrian involve- ment, etc.). Problem identification packets are distributed in the fall of each year for each of the state's 142 local transportation safety conzmissions and 8 state traffic safety agencies. These packets contain a wide variety of information on the status o.f traffic safety resources in each jurisdiction, including limited crash statistics. The data contained in these packets are intended for use by local and state agencies in the preparation of their annual Highway Safety Plan submissions. Additionally, the Research Council publishes and distributes locality-specific annual statis- tics for accidents involving drivers 19 and under, and prepares an annual Virginia Alcohol Safety Action Project report of selected statistics for alcohol-related accidents in each jurisdiction. While all of these reports furnish Virginia's state and local traf- fic safety agencies with a wealth of information, far more than has heretofore been available, little evidence exists that these data are being used by the recipients in any more sophisticated way than visual inspection and manual analysis, if that.
17

In each of the past three years the Research Council has prepared the overall statewide problem analysis section for the Commonwealth's Highway Safety Plan. Using the least squares regression technique, projections for a number of critical acci- dent categories and exposure measures have been plotted and analyzed; however, data deficiencies and severe time constraints have rendered many parts of these analyses inconclusive.
Additionally, the Research Council conducts studies of spec- ific types of accidents (i.e., truck, motorcycle, alcohol-related, or pedestrian crashes) that often involve in-depth analysis of available crash data. However, these projects are undertaken on an ad hoc basis as dictated by the needs of the Department of TranS- portation Safety.
The Virginia Department of Highways and Transportation is probably the Commonwealth's most active user of crash data. The Department's Data Processing Division receives, edits, and process• crash data for the Traffic and Safety Division from monthly and annual crash tapes furnished by the Department of State Police. A variety of automated reports are produced from this information for review and analysis by Traffic and Safety Division engineers for site-specific safety studies. (See Appendix C for a listing of these reports. ) The accident-summary-report-producing capabilitie.• of the Department are impressive but, at present, only crash data for accidents occurring on state maintained highways (about one- half of the accidents occurring on all roadways) are tabulated in these documents. As a result, though these reports are detailed, they are of limited value in attempts to conduct a comprehensive statewide problem analysis.
It should be clear from the preceding discussion that at the present time no single state traffic safety agency conducts a compr•ehensive, conclusive, accurate, timely, and complete highway safety problem identification analysis in Virginia. Some of the reasons for this are as follows"
i. The NHTSA/FHWA approach to highway safety program management based on problem identification analysis is still ill-defined and unfamiliar.
2. There is no clear agreement at the state or federal level on which accident attributes contained in state files should be analyzed.
3. There is no clear understanding of what statistical tests should be applied to the various accident data collected by the state and how the results should be interpreted.
18
4. Insufficient time, money, and manpower have been directed toward problem identification analysis in Virginia.
5. The usefulness of the crash data maintained in state files is limited by their content and format and by time delays associated with their retrieval.
6. The present division of responsibility for the planning and administration of the statewide traffic safety program among several state and many local organizations has resulted in the fragmentation of problem identification analysis efforts.
If the Commonwealth is going to fully adopt the mandates of the NHTSA regarding implementation of the highway safety program management process, a significant commitment of resources must be directed toward developing the tools, staff, expertise, and infor- mation systems necessary to permit at least one agency to properly analyze crash data. The implementation of the DART system is one
way in which Virginia could make progress in this area.
ADVANTAGES AND DISADVANTAGES OF THE DART SYSTEM
The DART system potentially offers its users the following direct and indirect benefits.
io A complete, fully edited automated crash file (viz. the DART Model File) containing only those data elements vital for problem identification analysis will be created and made accessible to all users.
2. Any subset of crash data contained in the DART Model File can be instantly selected, retrieved, and statistically analyzed.
3. Data deficiencies found in the course of statistical analysis can b-e identified and eventually corrected.
4. Manual statistical analyses of crash data will be virtually eliminated.
5. Responses to traffic-safety-related questions can be obtained rapidly and inexpensively.
19

6. The results of statistical analyses can be reported in •an easy-to-interpret format suitable for pre- sentation to management and nontechnical personnel.
7. Data requests can be handled without requiring programming staff time.
8. Safety program decision making, priority setting, and evaluation can be based on scientific analyses of crash data.
However, use of the DART system also has the following dis- advantages.
i. The DART system is designed so that only the data from one year's Model File can be r-etrieved and analyzed at
one time. Thus, cross-year comparisons and trend analysis for specific accident types cannot easily be done.
2. The system is more sophisticated than it needs to be. The present state of the art of problem identification analysis is fairly primitive. It entails chiefly the use of two statistical techniques" Bivariate analysis and time series (or trend) analysis. The DART system can perform these and many more sophisticated analyses. As a result, a measure of complexity, and associated overhead that may be unnecessary, has been introduced into the DART system.
3. The efficient use of the DART system requires a fairly sophisticated user. DART is not a push-button system. Rather, the DART user must learn how to correctly formu- late the-traffic safety questions he needs to answer, write, debug, and execute small programs, and to properly interpret and communicate the results of his analysis to others.
4. Computer analysis of thousands of accident records is expensive and consumes a substantial amount of computer resources. Great care must be taken to minimize the expense of DART analysis through careful preparation of user jobs and prudent administration of the DART system at the installation site.
2O
FEASIBILITY OF IMPLEMENTING DART IN VIRGINIA
It is clear that the Commonwealth has a need for the DART system. None of the state's traffic safety agencies have an automated system that can efficiently select, retrieve, and analyze data from state crash files on demand. This capability is a prerequisite for making a serious effort to analyze traffic safety problems and incorporate the results of analyses in the state's highway safety program management process. However, the mere fact that Virginia lacks the capabilities of DART is not sufficient justification for the implementation of the system. This research has shown that many variables must be considered before accepting the NHTSA's DART offer.
Assuming that the state's safety program management is willing to accept the DART system along with its shortcomings, one of the most important decisions to be made involves the selection of an optimal installation site. In Virginia there are four agencies that potentially or actually are the most active users of crash data{ thus, logically there are four potential installation sites for the DART system" the Virginia Department of State Police, the Virginia Department of Transportation Safety, the Virginia High- way and Transportation Research Council, and the Virginia Depart- ment of Highways. and Transportation. The analysis of the survey of the states revealed that successful implementation and use of the DART system required the support of technical, user, and manage- ment resources at a single installation site. In the ensuing dis- cussion, each of these three determinants of success (or failure) will be examined and synthesized in an assessment of the feasibility of implementing DART in each of the potential installation sites.
Virginia Department of State Police
Technical Resources
The Department of State Police (DSP) employs a data processing unit of eleven systems and applications programmers in addition to the necessary support staff.
All data processing work related to accident record keeping is done on the UNIVAC I!00/i0 under the EXEC DMS II00 operating system located at State Police Headquarters in Richmond. The DSP Univac is capable of executing jobs in both batch and interactive modes.
User Supnort
Although the DSP records and disseminates a large volume of accident statistics for the Commonwealth, it has only an intermittent need for the results of accident data analyses. At present those internal data needs are being handled on an ad hoc basis by the

DSP's Records and Statistics Division. No specific user group and no steady aggmegate useF demand fo• Zhe capabiliZies of the DART system can be discemned at the DSP at this time.
Man,a, gemen,t Support
Officials at the DSP believe thaZ the DART system could be of some benefit to rheim pmogram; however, it would be difficult Zo justify implementation of the package based solely on the DSP use.
Feasibility_ of Implementing DART at the DSP
Th• DSP's hardware configuration is compatible with the require- ments of the DART system. In particular, the UNIVAC's batch, inter- active and telecommunications capabilities, make the DSP a promising candidate for DART implementation. However, DSP officials have in•- cated that the present work load on the DSP computer is quite heavy. As a result, the implementation of the.DART system will require an upgrade of the central processor and the purchase of additional disk space for external storage of DART programs and files.* Also, the DSP UNIVAC services many high priority data processing needs (such as maintenance of on-line criminal files) DART if implemented a•_ the DSP, will probably be assigned a
relaiively low priority, whic• will hinder system use. Finally, telecommunications facilities at the DSP are dedicated to maintaining automated crime information networks and would not be available to non-police agency personnel. As a result remote access to the DART system if implemented at the DSP would not be possible without a substantial system reconfigura•ion.
Given these technical problems and considering the DSP's pres- ent low level of need for the capabilities of the DART system, it can be concluded that implementation at the DSP is probably infeasible.
*DSP officials estimate that the required hardware upgrade entails a one-time cost of $600 for the purchase of one disk pack and a continuing cost of $1,650/month for the purchase/lease of an addi- tional disk drive and a central processor performance enhancement.
22
Virginia Department of Transportation •Safe•ty
Technical Resources
The Virginia Department of Transportation Safety (VDTS) office has no direct access to any data processing facilities that could be used for accident data analysis.
_User •_Supp_or•
At present, the VDTS principally relies on other agencies and published reports for detailed statistical analyses of crash data. Even though the VDTS management will be the primary beneficiary of the implementation of the DART system, in the short run it appears that the VDTS will continue to employ outside resources for problem identification studies. As a result, no substantial in-house user support for the capabilities of the DART system can be discerned.
M.{nagement. Support
The VDTS management recognizes their need for the capabilities of the DART system. However, economic restrictions and practical considerations dictate that the DART system would best be installed at a site with a greater degree of technical and staff resources.
F..•e!s•ibi•!.•ty•. of.__l.mple, menting DART•. •_t the•VDTS Implementation of the DART system at the VDTS is clearly in-
feasible. The VDTS has neither the staff nor-the technical resources to assume administrative responsibility for DART.
Virginia Highway and Transportation Research Council
Technical Resources
The Virginia Highway and Transportation Research Council (VHTRC) employs one research scientist, one full-time and one part-time com-
puter programmer, and one ADP technician, who form the Data Section. The Data Section is an in-house service unit with responsibility for providing data processing services for all research activities at the VHTRC.
The VHTRC's Data Section has remote batch and interactive termi- nal access to the CDC CYBER 172 under the NOS operating system located
23

at the Umiversity of Virginia's Computing Center in Charlottes- ville. Interactive access is also available to the University's two HP-2000 time-sharing computer systems. Finally, the VHTRC has remote batch access to the IBM 370/148 under the 0S/VSI oper- ating system located at the Virginia Department of Highways and Transportation's Central Office in Richmond.
User SuppoF•,t
The VHTRC's Safety Group consists of one administrator, four full-time research scientists, one faculty research engineer, one
•_ technician, and a variable number of part-time research assistants. Depending on the mix, nature, and scope of safety research projects under way, some
intermittent need for the capabilities of the DART system is anticipated; however, it is difficult to project with certainty exactly how often and when DART will be used at the VHTRC.
Management Support•
The VHTRC management is neutral on whether DART or some alter- native system is needed for accident analysis in Virginia, but the enhancement of present capabilities is important for continued growth in the safety research program. However, it is unclear whether enough use could be made of the DART system at the VHTRC to justify its installation in Charlottesville.
Fe@sib.,i!ity 9f,Imp.!ementin$ DART at.,,the_:_V_HT.RC
Implementation of the DART system at the VHTRC is probably infeasible. The primary difficulty lies in the fact that the installation of DART would have to be accomplished on the CDC CYBER 172, a machine on which DART has yet to be implemented. NHTSA and Genasys personnel have indicated that the CDC's hardware idiosyncracies could present some difficulties during the installa- tion of DART. Further, data processing staff resources at the VHTRC are limited and could not be fully dedicated to the DART project without substantial justification. Finally, given the present direction of the Safety Group research program, demand for DART's capabilities is limited at the VHTRC.
Virginia Department of Highways and Transpor.ta$i0n
Technical Resources
The Virginia Department of Highways and Transportation (VDH&T) employs a staff of 27 systems and applications programmers and related support staff.
24

Accident data processing is done in the batch mode only on the IBM 370/148 under the OS/VSI operating system located at the VDH&T Central Office in Richmond. Remote batch access to the VDH&T's IBM is available •to each of the eight VDH&T district officers and the VHTRC.
User SuPpor,• The VDH&T's Traffic and Safety Division employs a staff of
18 highway engineers who have responsibility for analyzing data for accidents occurring on state maintained roads and recommending safety improvements. For their accident studies, Traffic and Safety Division staff members rely on computer listings of crash data sup- plied by the VDH&T's Data Processing Division and manual analysis of the data contained on copies of FR-300P police accident report forms. Traffic and Safety engineers could use DART to examine accident characteristics at a specific location in a greater level of detail than is presently possible, but it is difficult to quan- tify the level of demand.
Man...ag.ement Sup.p9rt Installation of the DART system at the VDH&T has yet to draw
full management support pending further study of the implications of DART implementation by the Traffic and Safety and Data Processing Divisions' staffs.
Fegsibility of Impl. ementin• DART at the VDH&T
Implementation of DART at the VDH&T is conditionally feasible. DART is best suited for installation on IBM hardware and the acces- sibility of the IBM to both Traffic and Safety Division engineers and Safety Group researchers at the VHTRC permits a large number of potential users to take advantage of the DART system's features. Also the potential applications of DART's capabilities are directly linked to the mission of both the VDH&T and the VHTRC. Thus, it is con- ceivable that sufficient demand for DART could be generated to justify the comitment of resources to its implementation.
However, two following important conditions associated with the installation of DART at the VDH&T must be met.
i. The DSP generated crash tapes will have to be modified prior to conversion to DART Model File format. In particular, edited location data must be appended to accident records for all crashes occurring on state maintained
25

roadways, and some state police codes for certain variables may have to be altered to suit the data needs of Traffic and Safety Division engineers.
2. Conversion of the modified crash tape will have to be accomplished monthly, instead of annually as recom- mended by the NHTSA, to accommodate the VDH&T's need for the most currently available crash data.
Table 2 summarizes the salient points of the preceding discussion of the feasibility of implementing DART in each of four Virginia traffic safety agencies.
Table 2
Summary of Analysis of Feasibility of Implementing DART in Virginia
VDH•T VHTRC VDTS DSP
Technical Resources IBM 370/148 CDC CYBER 172 None ii Programmers 27 Prog•:ammers IBN 370/148 UNIVAC ii00/I0
3 Programmers
User Support 18 Traffic S Safety 4 Research 1 Part-time VarJ.ed but Engineers Scientists Statistician Limited
4 Research Scien- tists (VHTRC)
Management Support Pending Furt•,er Study
Neutral Prefer DART Unable to Justify Elsewhere DART
Feasibility Conditionally Probably Infeasible Probably Feasible Infeasible Infeasible
26
SUMMARY AND CONCLUSIONS
The DART software system has been developed by the NHTSA to fill a void in the states' accident data analysis capability; namely, the inability of most states to efficiently select, re- trieve, and statistically analyze any subset of the crash data stored in their own files. The intent of the DART project is to bolster the states' capability to do problem identification, the foundation of the NHTSA/FHWA espoused highway safety program management process. The federal philosophy is that bestowing the states with the capabilities of DART will eventually lead to im- proved effectiveness and efficiency in state safety program management and thus to a reduction in fatalities, injuries, and economic loss resulting from traffic acc£dents. It is clear that the DART system can offer the states a flexible, powerful, and efficient means for analyzing accident data, although there is room for improvement in the system. It is up to safety program management in the states to utilize the DART system to best ad- vantage to effect crash reductions.
The DART system is not without its design flaws. The survey of the states indicated that bivariate tables were cumbersome to generate, DART is difficult to implement on non-IBM systems, the costs of DART implementation and use could be substantial, and DART training courses were often inadequate. But the survey also indicated that ultimately the success or failure of DART implementa- tion and use is principally determined by the administrative and operational environment in which the system is installed. Specifi- cally, successful use of the DART system requires the concurrent support of user and management staff and the dedication of sufficient technical resources at a carefully selected site.
In Virginia, attempts at problem identification have been severely hampered by the lack of a means to fully analyze available accident statistics. Neither the VDH&T, VDTS, VHTRC, nor the DSP maintain software systems that possess the data retrieval, analysis, and reporting features of the DART package, although all four agen- cies could benefit by having the system. Through the years the agencies have neglected to develop the capabilities of DART, be- cause the demand for accident analysis was not high enough to justi- fy the commitment of the required staff and technical resources. Ironically, in the aggregate, the demand for DART's capabilities is substantial in Virginia, yet significant organizational and ad- ministrative problems must be solved in advance of accepting the NHTSA's DART offer.
The implementation of the DART system is infeasible at the VDTS, probably infeasible at the DSP and the VHTRC, and conditionally
27

feasible at the VDH&T. The VDH&T holds the most promise for successful implementation of DART because it has compatible hard- ware, a large and experienced technical staff, a large number of potential users, facilities for limited remote access to DART, and a clear, yet unquantifiable, need for DART's capabilities.
RECOMMENDATIONS
I. The VDTS should initiate discussion with the VDH&T on the feasibility of implementing the DART package on the latter's IBM 370/148.
2. The VDH&T, with VHTRC assistance if necessary, should under- take a detailed study of DART implementation and prepare a proposal for DART installation at the VDH&T for submission to the VDTS. At a minimum, the proposal should cover the following topics.
(a) Statement of VDHgT management support for DART.
(b) Justification of the VDH&T (and the VHTRC) need for the DART system.
(c) Identification of the full estimated cost of implementing DART at the VDH&T.
(d) Statement of constraints and limitations on implementing and using DART at the VDHgT.
(e) Proposal and discussion of alternative ad- ministrative and operational scenarios under which DART will be made available to the VDH&T, VHTRC, and outside users.
(f) Full statement of the manpower and machine re-
sources that should be committed to the DART project.
(g) A timetable for DART implementation.
(h) An estimate of the financial assistance required by the VDH&T (presumably to be obtained from federal §402 funds administered by the VDTS) to implement the DART package. (That is, what share of the cost of DART implementation is the VDH&T willing to bear?)
28

3. The VDTS should be willing to allocate federal §402 dollars to defray part or all of the implementation costs of DART and to underwrite its usage in the early stages.
4. The VDTS should organize a small committee-consisting of one or two technical and/or user staff members from the VDH&T, VHTRC, DSP, and VDTS to guide and coordinate the DART project from its initial stages. In particular, this committee should be charged with responsibility for serving as technical liaison between NHTSA and Genasys personnel and the state during the pre-implementation phases of the DART project (assuring that the contractor receives complete file documentation, for example) and later for monitoring, promoting, and evaluating the use of the system once implemented.
29


DEPARTMENT 'FRAN.•;•)RTATION HAROLD KING. C•MMI•IONER
•USSER, •EPUTY C•MMI•iON£R
ENGINEER
OF
C,OMMON>VEALTH of VIRQINiA HIGHWAY & TRANSPORTATION RESEARCH COUNCIL
JACK DILI•RO. HEA0 VIRGINIA HIGHWAY TRANSPORTATION RESEARCH COUNCIL.
UNIVEF•SITY OF VIRGINIA OR HEREFOR0. JR.. PREStOENT
SCHOOL ENGINEERING & APPLIED SCIENCE JOHN E. GIBSON, OE•N
OR. LE•ER •OEL. CHAIRMAN OEPARTMENT OF CIVIl. ENGINEERING
BOX 3817 UNIVERSITY •I"ATION CHARLOTTESViLL.E. VIRGINIA 22¢J03
REPLY' PLEASE REFER TO FILE NO.
The Virginia Highway and Transportation Research Council is conducting a pre-installation evaluation of the NHTSA's Data Anal- ysis and Reporting Technique (DART) system for the Virginia Depart- ment of Transportation Safety. The major objective of the study is to determine in which Virginia transportation safety agency DART should be installed so as to provide maximum benefit to the Common- wealth. While we are anxious to have the analytical capabilities of the DART system at our disposal, we believe that a cautious approach to implementing DART will help to ensure successful use of the system.
An important sub-objective of our study is to determine what the o•her states' experiences have been with the DART system. We would like to learn about both the positive and negative aspects of DART in hopes of forming realistic expectations of the system.
To accomplish this we have developed a two-part questionnaire (attached) that we have sent to each of the twenty-three states in which DART has been installed. SecTion I of the questionnaire deals chiefly with The data processing aspects of DART and might be com- pleted by someone familiar with the technical side of its implementa- tion in your state. SecTion II deals more with the user side of the DART system and might best be completed by someone familiar with the system as ir has been applied to accident data analysis in your state.
TRANSPORTATION AMERICA'S LIFELINES
We would greatly appreciate it if you could take the time to have these forms completed and returned in the enclosed pre-addressed envelopes. Ideally, we would like to have the completed question- naires in our hands by the second week of July. If there are any questions or problems please contact me at"
Virginia Highway and Transportation Research Council P. O. Box 3817 University Station Charlottesville, VA 22903 Phone: 804-977-0290 Ext. 308
Thank you for your assistance in this matter.
WEK/j mv Attachment
W. E. Kelsh Research Analyst

VIRGINIA HIGHWAY AND TRANSPORTATION RESEARCH COUNCIL
Section I.
DART SURVEY
io In what month and year was the DART system installed in your state?
Installation completed -Year
Approximately how long did it take to install the DART system?
(Spicif• Num•e6) Weeks
Is the DART system still maintained at some computer installa- tion in your state? (By "maintained" ±s meant that DART is being updated as modifications are meceived from the NHTSA and as upgrades and/or changes are made to your computer system.)
Yes
No
(If your answer to this question is "No", please state briefly why the package has been dropped. Include the approximate date this was done.)
On what computer in your state is DART currently implemented?
Make
Model
Memory size words/bytes / characters (Circle) Agency where computer is located
(Agency Name) Not Applicable

In what execution mode is DART currently being run in your state? (Check One)
Batch mode only
Interactive mode only
Batch and interactive modes
Other
Not Applicable
What state agency has primary res.ponsibility for the development and maintenance of your state's master accident file? (By "master accident file" it is meant that f'ile containing the data • • •.o_ all accidents reported to the state from,wuh•c.h the D4•T•input__f.il • is created. )
(Agency Name
Approximately how many accidents were reported to the state ir• calendar year 1978?
(•umber)
How often is your state's master accident file updated? (Check. One)
Daily
Weekly
Biweekly
Monthly
Bimonthly
Quarterly
Other (Explain)
How often do you convert your state's master accident file to DART input format? (Check 0ne)
Monthly Quarterly Semiannually Annually Other

How many years (months) of accident data did your state convert to DART input format when the package was initially installed? (Check One)
Months (Specify Number
i-Year
2 Years
3 Years
4 Or More Years
Don't Know
What specific data processing problems, if any, were encountered with the DART system du.r.i•g the installation, p_e.riod? Please indicate which problems, m• any, pSrsist. (List)
What specific data processing problems, if any, have been en- countered with the DART system since insta!lation has been com- pleted? Please indicate which problems, if any, persist. (List)

How responsive have NHTSA and Genasys personnel been to your problem with the DART package?
NHTSA Personnel Genasys Personnel
Extremely Adequately Poorly Other (Expl•i•) No Problems Experienced
Extremely Adequately Poorly Other (Explain) No Problems Experienced
From the dat• processing standpoint, what is your overall assess- ment of the DART system as currently implemented and used in your state? (Check 0ne)
Excellent system Good system, could use some fine tuning Adequate, but needs improvement System is so-so, needs considerable improvement Poor system, is a headache. Why? Other (Explain)
Overall how would you describe your experience with the DART system' Be sure to consider all phases of its installation and use in which you have been involved, including your involvement with NHTSA and Genasys Corporation personnel. (Check One)
Pleasant experience, smooth sailing for the most part OK experience, some difficulties encountered
Bad experience, it was a nuisance
Other (Explain)'
Your Name
Title
Agency Address
Phone
How long have you been involved with DART Months/Years (Circle)
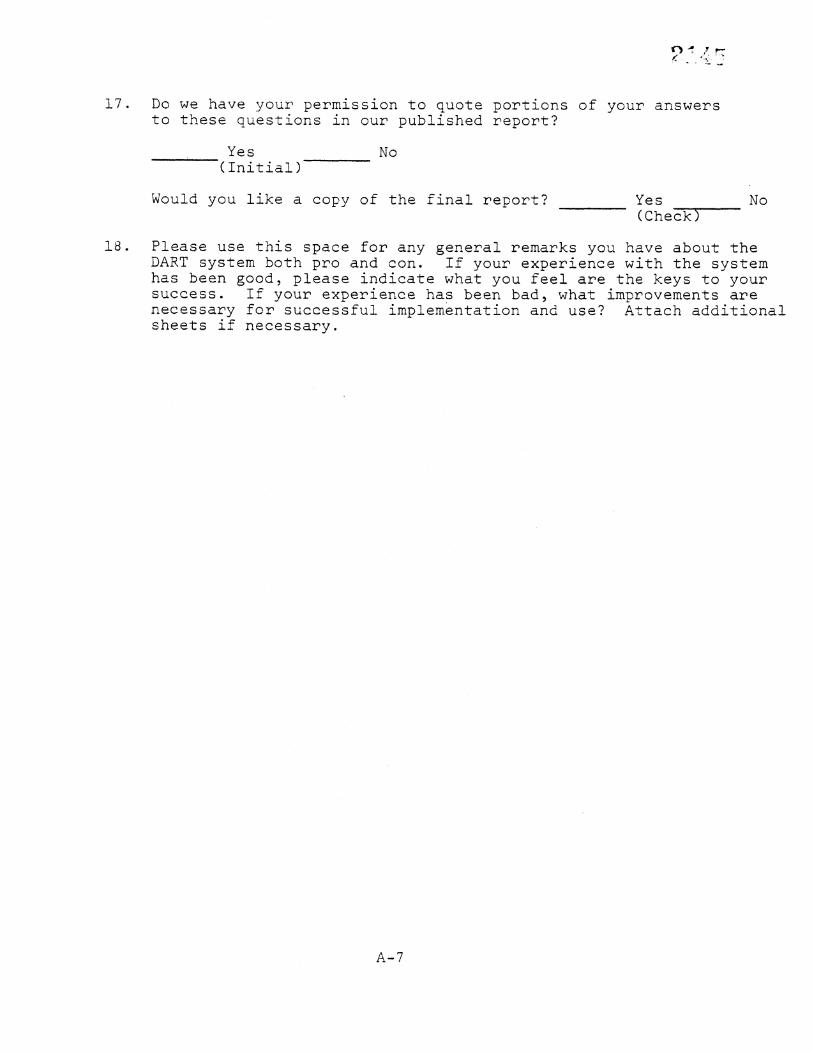
17. Do we have your permission to quote portions of your answers to these questions in our published report?
Yes No (Initial)
Would you like a copy of the final report? Yes No (Check)
18. Please use this space for any general remarks you have about the DART system both pro and con. If your experience with the system has been good, please indicate what you feel are the keys to your success. If your experience has been bad, what improvements are necessary for successful implementation and use? Attach additional sheets if necessary.
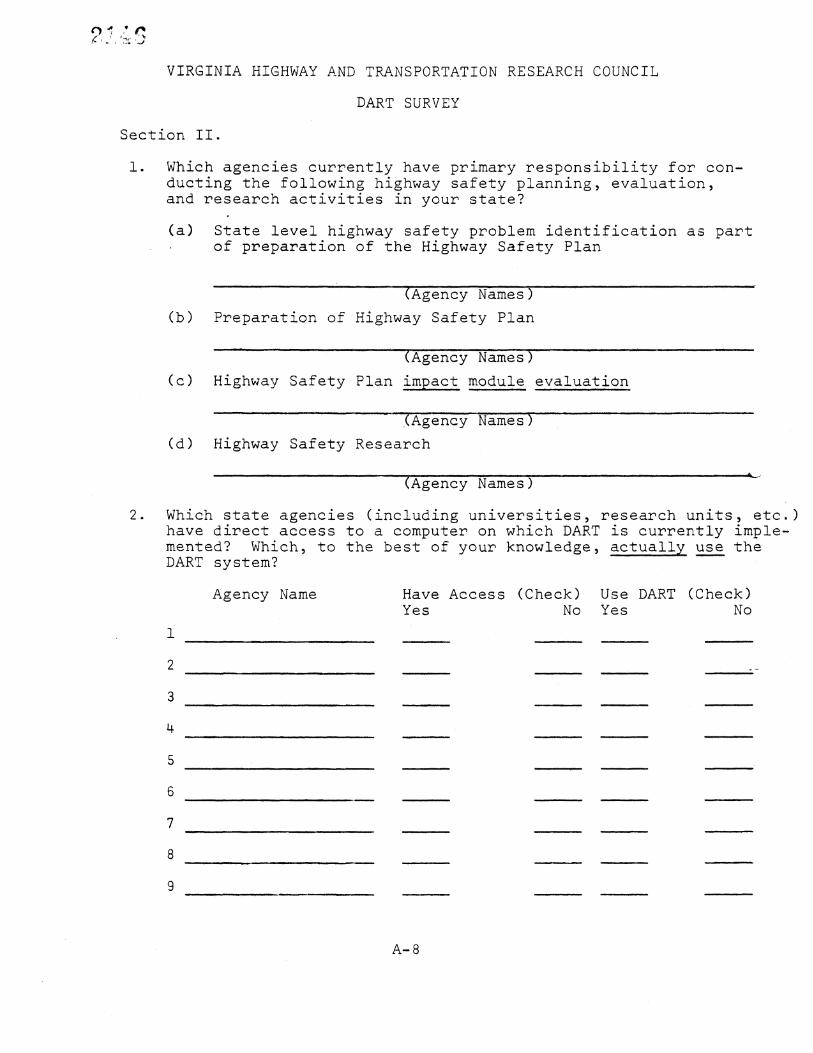
VIRGINIA HIGHWAY AND TRANSPORTATION RESEARCH COUNCIL
DART SURVEY
Section II.
i Which agencies currently have primary responsibility for con- ducting the following highway safety planning, evaluation, and research activities in your state?
(a) State level highway safety problem identification as part of •preparation of the Highway Safety Plan
(b) (Agency Names
Preparation of Highway Safety Plan
(c)
(Agency Names) Highway Safety Plan impac t module ey•,u@•ion
(d) Highway Safety Research
(Agency Names
Which state agencies (including universities, research units, etc.) have direct access to a computer on which DART is currently imple- mented? Which, to the best of your knowledge, actually use the DART system?
Agency Name Have Access (Check) Use DART (Check) Yes No Yes No
2

For the agencies that curr•ently use DART (regardless of the extent of usage, please •indicate '•He approximate size of their accident data analys•s, staffs.
Number of Analysts* Don't 0-2 3-5 6-10 i0 or more Know
*Full-time professional staff members (including university faculty• whose time is devoted primarily to highway safety planning, evaluation, and research activities. (Exclude technicans, student help, clerical staff, etc.)
What are the most common applications of DART in the agencies that have access to it? (Check all applicable)
Special project research
Problem identification for highway safety planning Countermeasure evaluation
Everyday operations Other
( Spe6
Approximately how many analysts, programmers, engineers, data processing managers, etc., were trained in DART usage by the NHTSA/Genasys instruction team during the DART installation phase? (Check one)
0-i0
11-20
21-30
31-40
Don' t know

What was your overall impression of the quality of the DART training course? (Check one)
Excellent
Good
Fair
Poor
No opinion Other (Explain)'
From the user's standpoint, how would you evaluate the DART system as currently implemented in your state in each of the following areas. (Check one for each)
Excellent Good Fair Poor Unable < Evaluate
(a) Ease of use of the DART query language:
(b) Ease of use of OMNITAB commands:
(c) Job turnaround time*
(d) Quality of output (format clarity, etc. ):
(e) DART analytical capabilities
(f) Cost to users of DART system:
*Time elapsed from time of DART job submission until output is received
How responsive have NHTSA and Genasys Corporation personnel been to your problems with the DART package?
(Check One)
NHTSA Per.sonnel Genasys Personnel
Extremely Adequately Poorly No problems experienced Other
Extremely Adequately Poorly No problems experienced Other
A-10
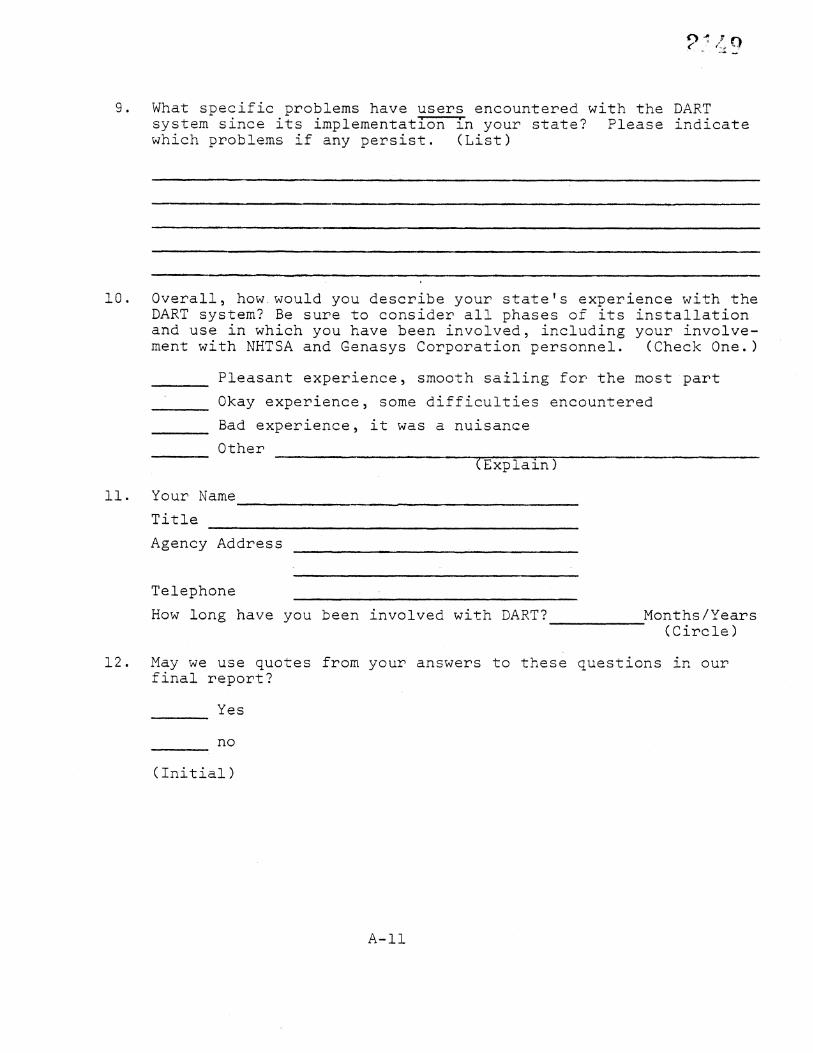
What specific problems have users encountered with the DART system since its implementation in your state? Please indicate which problems if any persist. (List)
Overall, how. would you describe your state's experience with the DART system? Be sure to consider all phases of its installation and use in which you have been involved, including your i•volve- ment with NHTSA and Genasys Corporation personnel. (Check 0ne.)
Pleasant experience, smooth sailing for the most part Okay experience, some difficulties encountered
Bad experience, it was a nuisance
Other (•xp•.•i•
Your Name
Title
Agency Address
Telephone How long have you been involved with DART? Months/Years
(Circle)
May we use quotes from your answers to these questions in our final report?
Yes
no
(Initial)
A-II

13. Would you like a copy of the final report? (Check)
Yes
No
14 Please use this space for any general remarks you have about the DART system both pro •nd con. If your experience with the system has been good, please indicate what you feel are the keys to your success. If your experience has been bad, what i•mprovements do you feel are necessary for successful implementa- tion and use? Attach additional sheets if necessary.
A-12

APPEND IX B
RESPONDENTS TO THE DART SURVEY
Arizona
J. P. Gregg EDP Systems Project Leader Arizona Department of Transportation Phoenix, Arizona 85026
Ralph S. Hunt Federal Highway Specialist Governor's Office of Highway 1655 W. Jackson St. Phoenix, Arizona 85007
Safety
California
William Epperson Research Manager California Office of Traffic 7000 Franklin Blvd. Sacramento, California 95813
Safety
Connecticut
Paul Silversmith Associate Transportation Drawer A Wethersfield, Conn. 06109
Engineer
Delaware
Thomas E. Pritchett Planner I 9 E. Loockerman St. Treadway Towers Dover, Delaware 19901
Florida
Elsie Ray Clary Research Assistant Bureau of Highway Safety Dept. of Community Affairs Room 530 Carlton Bldg. Tallahassee, Florida 32301
Georgia
Howard C. Schneider, PhD. Associate Professor of Quantitative Georgia State University University Plaza Atlanta, Georgia 30303
Idaho
Methods
Lynn Anderson Research Analyst P. O. Box 7129 Idaho Transportation Boise, Idaho 83707
Dept.
Kansas
Russell J. Willbourn Safety Specialist II Accident Records Kansas Dept. of Transportation Topeka, Kansas 66603
Maryland
Ronald D. Lipps Deputy Director Transportation Safety Division Maryland Dept. of Transportation P. 0. Box 8755 Baltimore-Washington Airport, Maryland
Minnesota
21240
John F. Leeper Research Analyst 207 Transportation Bldg. Dept. of Public Safety St. Paul, Minn. 55101
Missouri
Marty Carso Traffic Analyst Dept. of Public Safety Missouri Division of Highway Safety P. O. Box 1220 Jefferson City, Missouri 65102

Nebraska
Dennis Oelsch!ager Administrator Nebraska Office of Highway Statehouse Station 94612 Lincoln, Nebraska 68509
Safety
New Hampshire
Peter R. Klein Systems Analyst Department of Safety Concord, N. H. 03301
New Jersey
Robert T. Chorba Principal Highway Safery CN-048 Stuyvesant Ave. Trenton, N. J. 08626
Specialist
New York
Kenneth Carpenter Research Associate Governor's Traffic Swan Street Bldg. Empire State Plaza Albany, N. Y. 12228
Safety Commission
Ohio
Edward W. Smith Planning Engineer Ohio Dept. of Highway 1600 W. Broad St. Columbus, Ohio 43216
Safety
Oklahoma
Ray Bays, J. D. Statistical Research G-80 Jim Thorpe Bldg. Oklahoma City, Okla.
Supervisor
73105
Oregon
Robert Ayres Programmer Analyst Highway Data Processing Room 43! Transportation Salem, Oregon 97310
Bldg.
Norman K. Solomon Research Analyst Oregon Traffic Safety Salem, Oregon 97310
Commission
Puerto Rico
Eduardo F. Carlo Chief, Planning P. O. Box 41289 Santurce, P. R.
and Operations Division
00940
South Dakota
Rene Liegl Program Manager State and Community 200 W. Pleasant Dr. Pierre, S. D. 57501
Programs
• 8XaS
AI St. Louis Systems Analyst State Dept. of Highways and Office of Traffic Safety Austin, Texas 78701
Public Transportation
Vermont
Gerald R. Gringras Chief of Computer Management Vermont Agency of Transportation 133 State St. Montpelier, Vt. 05602
U. J. Sartorelli Highway Safety Planner Vermont Agency of Transportation 133 State St. Montpelier, Vt. 05602
Washington
Kenneth J. Thompson Traffic Records Analyst Washington Traffic Safety •Commission P. 0. Box 1399 Olympia, Washington 98504

APPEND IX C
VIRGINIA DEPARTMENT OF HIGHWAYS AND TRANSPORTATION DATA PROCESSING DIVISION
OUTPUT LISTING, FREQUENCY OF DISTRIBUTION
Name of Report Frequency of Run
Individual Accident Report Annually
Summary of Accidents by Milepost Quarterly
Accident Data- Final Report Monthly
Accident Data District Accident Inventory Monthly
Accident Summary by Location Annually
Accident Summary by Surface Condition Annually
Accident Summary by Type of Collision Annually
Accident Summary by Fixed Object Annually
Accident Summary by Type of Surface Annually
Accident Sun•ary by Light Conditions Annually
Accident by Sections, Primary and Interstate Annually
Accident Summary by Residencies, Counties, and Cities Annually
Accident Summary by Traffic Volume Annually
Accident Summary by Districts Annually
Accident Summary by Years Annually
Accident Summary by Routes Annually
Accident Summary by Type of Highway Annually
Critical Section List Annually
Critical Spot List Annually