Embed Size (px)
Citation preview

VIOLA HOUSING AND
WORKFORCE STUDY APRIL 2019
APPENDIX

2 Viola Housing and Workforce Study Appendix
Table of Contents Appendix A – Demographics
7 | Population
8 | Age
11 | Households and Families
14 | Race
16 | Educational Attainment
18 | Income
Appendix B – Housing
20 | Housing Stock
21 | Tenure
22| Housing Characteristics & Age
26 | Housing Value & Tennant Capital
33 | Housing Demand
Appendix C – Workforce
34 | Maps
35 | Wages & Housing Affordability
36 | County & State Employment
Appendix D – Stakeholder Responses
38 | Lenders
46 | Realtors
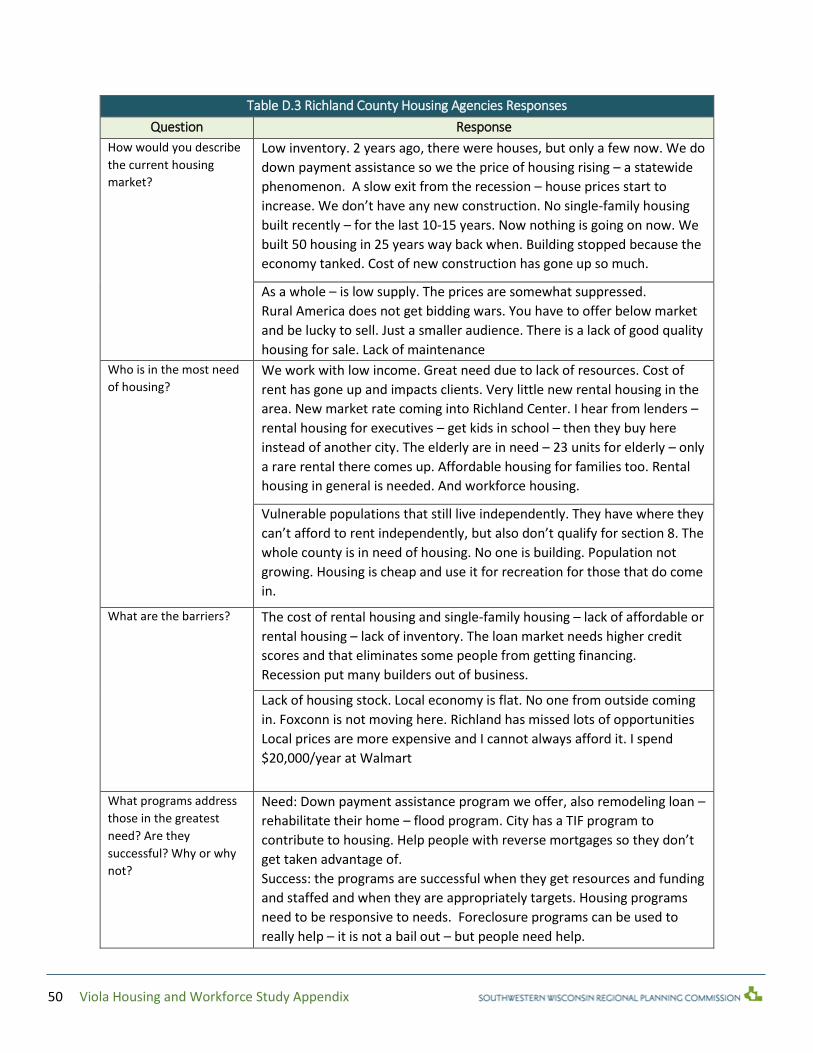
50 | Housing Agencies
53 | Employers
Appendix E – Developer Responses
56 | Developers
Appendix F – Local, State, and Federal Housing
Financial Incentives, Programs, and Tools.
64 |Local, State, and Federal Housing Financial
Incentives, Programs, and Tools.

3 Viola Housing and Workforce Study Appendix
Appendix A List of Tables and Figures Population Figure A.1 Total Population Table A.1 Total Population
Age Figure A.2a Age Groups (Absolute) Figure A.2b Age Groups (Proportion) Table A.2 Age Groups Figure A.3 Median Age Table A.3 Median Age Figure A.4a People 65+ Years Old Living Alone (with percent of people 65+) Table A.4 People 65+ Years Old Living Alone
Households & Families Figure A.5 Total Households
Table A.5 Total Households
Figure A.6 Average Household Size
Table A.6 Average Household Size
Figure A.7 Percent Families with Children by Family Type
Table A.7 Percent Families with Children by Family Type
Figure A.8 Average Family Size
Table A.8 Average Family Size
Figure A.9 Households with One or More People Over 65
Table A.9 Households with One or More People Over 65
Figure A.4b People 65+ Years Old Living Alone (with percent of total households)
Race Figure A.10 Population by Race
Table A.10 Population by Race
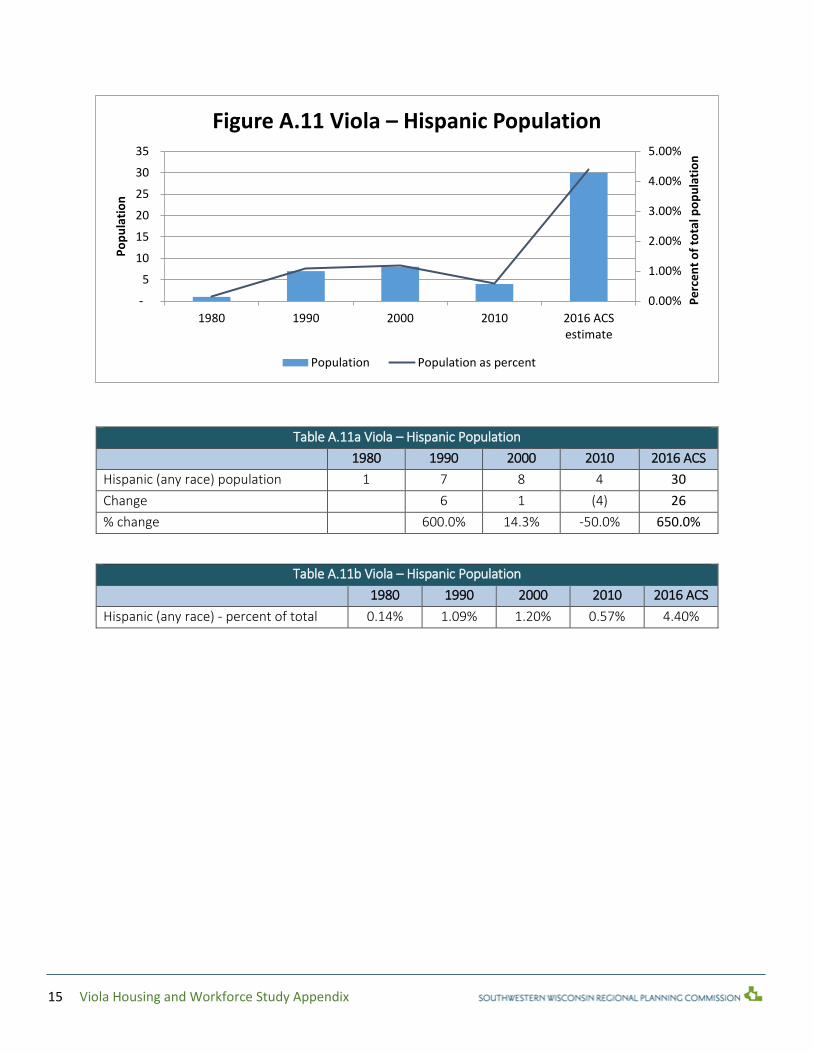
Figure A.11 Hispanic Population
Table A.11a Hispanic Population (Absolute)
Table A.11b Hispanic Population (Percentage)
Educational Attainment
Figure A.12a Educational Attainment (Proportionate)
Figure A.12b Educational Attainment (Regression)
Table A.12a Educational Attainment (Absolute)
Table A.12b Educational Attainment (Percentage)
Figure A.13 Educational Attainment (High School and Colligate)
Table A.13 Educational Attainment (High School and Colligate)

4 Viola Housing and Workforce Study Appendix
Income Figure A.14 Income in 2016 Dollars Table A.14 Income in 2016 Dollars Figure A.15 Percent Families Below Poverty Level Table A.15 Percent Families Below Poverty Level
Appendix B List of Tables and Figures Housing Stock Figure B.1 Total Housing Units and Households Table B.1a Total Housing Units Table B.1b Total Households and Estimates
Tenure Figure B.2 Owner and Renter Occupied Housing Units Table B.2 Owner and Renter Occupied Housing Units
Housing Characteristics & Age Figure B.3 Number of Units in Structure Table B.3 Number of Units in Structure Figure B.4a Year Housing Units Were Built Figure B.4b Housing Units Built Before 1979 Figure B.4c Housing Units Built Before 1939 Table B.4 Year Housing Units Were Built Figure B.5 Number of Bedrooms Per Housing Unit Table B.5 Number of Bedrooms Per Housing Unit Figure B.6 Number of Vehicles Available Per Housing Unit: 2016 Table B.6 Number of Vehicles Available Per Housing Unit: 2016
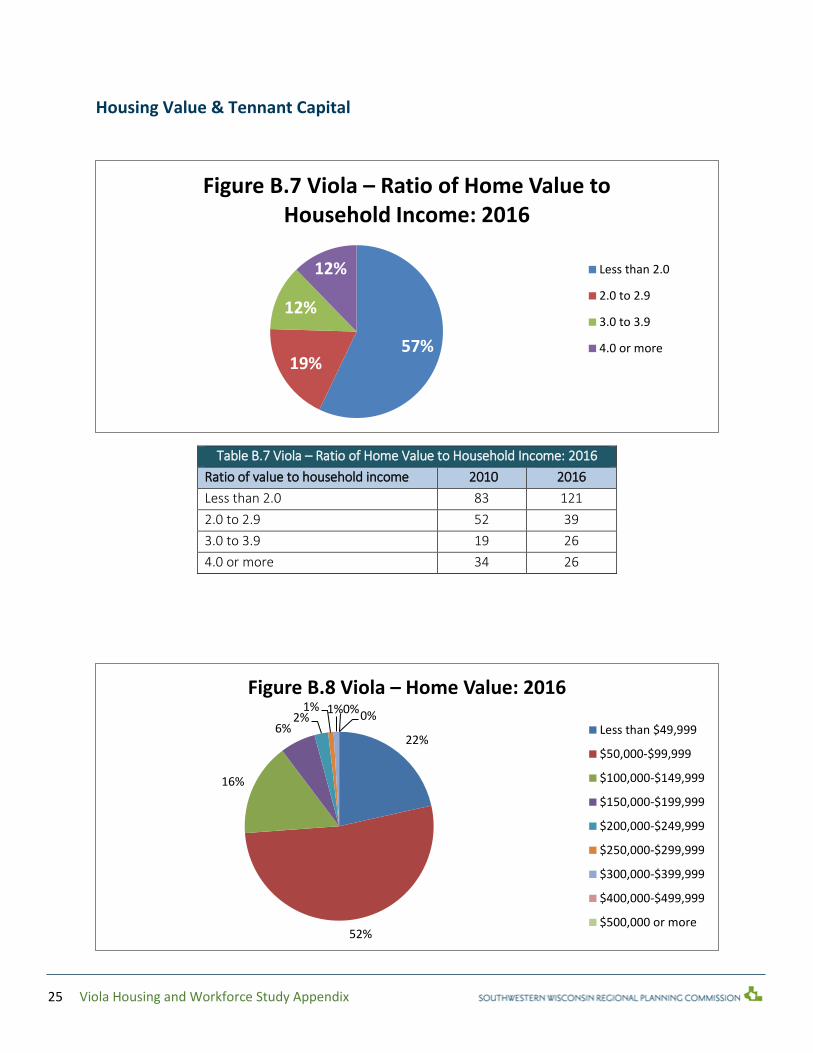
Housing Value & Tennant Capital Figure B.7 Ratio of Home Value to Household Income: 2016 Table B.7 Ratio of Home Value to Household Income: 2016 Figure B.8 Home Value: 2016 Table B.8 Home Value: 2016 Figure B.9 Owner and Renter Occupied Units by Household Income: 2016 Table B.9 Owner and Renter Occupied Units by Household Income: 2016 Figure B.10 Housing Units by Mortgage Status Table B.10 Housing Units by Mortgage Status Figure B.11a Selected Monthly Owner Costs as Percent of Household Income Figure B.11b Selected Monthly Owner Costs as Percent of Household Income Table B.11a Selected Monthly Owner Costs as Percent of Household Income Figure B.11c Selected Monthly Owner Costs as Percent of Household Income Table B.11b Selected Monthly Owner Costs as Percent of Household Income
5 Viola Housing and Workforce Study Appendix
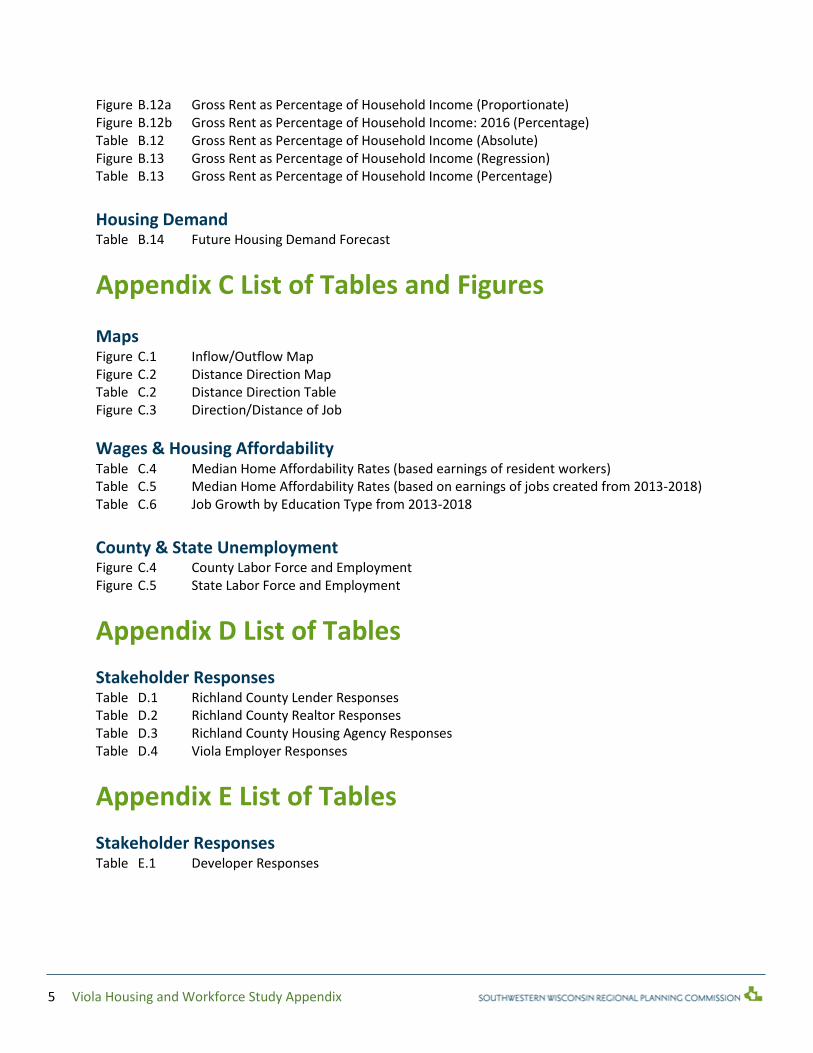
Figure B.12a Gross Rent as Percentage of Household Income (Proportionate) Figure B.12b Gross Rent as Percentage of Household Income: 2016 (Percentage) Table B.12 Gross Rent as Percentage of Household Income (Absolute) Figure B.13 Gross Rent as Percentage of Household Income (Regression) Table B.13 Gross Rent as Percentage of Household Income (Percentage)
Housing Demand Table B.14 Future Housing Demand Forecast
Appendix C List of Tables and Figures Maps Figure C.1 Inflow/Outflow Map Figure C.2 Distance Direction Map Table C.2 Distance Direction Table Figure C.3 Direction/Distance of Job
Wages & Housing Affordability Table C.4 Median Home Affordability Rates (based earnings of resident workers) Table C.5 Median Home Affordability Rates (based on earnings of jobs created from 2013-2018) Table C.6 Job Growth by Education Type from 2013-2018 County & State Unemployment Figure C.4 County Labor Force and Employment Figure C.5 State Labor Force and Employment
Appendix D List of Tables
Stakeholder Responses Table D.1 Richland County Lender Responses Table D.2 Richland County Realtor Responses Table D.3 Richland County Housing Agency Responses Table D.4 Viola Employer Responses
Appendix E List of Tables
Stakeholder Responses Table E.1 Developer Responses

6 Viola Housing and Workforce Study Appendix
Appendix F List of Tables
List of local, state, and Federal Housing Financial Incentives, Programs and Tools. Table F.1 List of Local State, and Federal Housing Financial Incentives, Programs, and Tools.
References Except where stated otherwise, data used in appendix A and B for years 1980 through 2016 are sourced from the U.S. Census Bureau via the decennial census or ACS report where applicable. Projected data in appendix A and B are sourced from the Wisconsin Department of Administration. Maps and figures in appendix C were sourced from the U.S. Census Bureau via “OnTheMap” online service.

7 Viola Housing and Workforce Study Appendix
A. Demographic Data
Population
Table A.1 Viola – Total Population
1980
1990
2000
2010
2016
ACS
estimate
2020
DOA
projectio
n
2030
DOA
projectio
n
2040
DOA
projectio
n
Total
population
696
644
667
699
682
730
770
775 Change
(52)
23
32
(17)
48
40
5 % change
-7.5%
3.6%
4.8%
-2.4%
7.0%
5.5%
0.6%
-
100
200
300
400
500
600
700
800
900
1980 1990 2000 2010 2016 ACSestimate
2020 DOAprojection
2030 DOAprojection
2040 DOAprojection
Po
pu
lati
on
Figure A.1 Viola – Total Population

8 Viola Housing and Workforce Study Appendix
Age
-
50
100
150
200
250
300
350
400
1980 1990 2000 2010 2016 ACSestimate
Po
pu
lati
on
Figure A.2a Viola – Age Groups
15-19
20-64
65+
0.00%
10.00%
20.00%
30.00%
40.00%
50.00%
60.00%
1980 1990 2000 2010 2016 ACSestimate
Pe
rce
nt
of
tota
l po
pu
lati
on
Figure A.2b Viola – Age Groups
15-19
20-64
65+

9 Viola Housing and Workforce Study Appendix
Table A.2 Viola – Age Groups
Age
groups
1980
1990
2000
2010
2016 ACS
estimate
15-19
57
52
45
52
60 Change
(5)
(7)
7
8 % change
-8.8%
-13.5%
15.6%
15.4%
20-64
334
301
360
370
363
Change
(33)
59
10
(7) % change
-9.9%
19.6%
2.8%
-1.9%
65+
161
152
146
118
111
Change
(9)
(6)
(28)
(7) % change
-5.6%
-3.9%
-19.2%
-5.9%
Table A.3 Viola – Median Age
1980
2000
2010
2016 ACS
estimate
Median age
36.5
42.8
37.8
38.2 Change
6.3
(5.0)
0.4 % change
17.3%
-11.7%
1.1%
33.0
34.0
35.0
36.0
37.0
38.0
39.0
40.0
41.0
42.0
43.0
44.0
1980 2000 2010 2016 ACS estimate
Age
Figure A.3 Viola – Median Age

10 Viola Housing and Workforce Study Appendix
Table A.4a Viola – People 65+ Years Old Living Alone
1980
1990
2000
2010
2016 ACS
estimate
65+ living alone
52
58
49
37
34 Change
6
(9)
(12)
(3) % change
11.5%
-15.5%
-24.5%
-8.1%
% of households that are a 65+ person
alone
18.1%
21.2%
16.9%
13.3%
11.8% % 65+ people living alone
32.3%
38.2%
33.6%
31.4%
30.6%
0.0%
5.0%
10.0%
15.0%
20.0%
25.0%
30.0%
35.0%
40.0%
45.0%
-
10
20
30
40
50
60
70
1980 1990 2000 2010 2016 ACSestimate
Pe
rce
nt
of
pe
op
le 6
5+
Nu
mb
er
of
pe
op
le
Figure A.4a Viola – People 65+ Years Old Living Alone
65+ living alone 65+ living alone as percent of all people 65+

11 Viola Housing and Workforce Study Appendix
Households & Families
Table A.5 Viola – Total Households
1980
1990
2000
2010
2016
ACS
estimate
2020
DOA
projectio
n
2030
DOA
projectio
n
2040
DOA
projectio
n
Total
households
288
273
290
279
289
298
320
328 Change
(15)
17
(11)
10
9
22
8 % change
-5.2%
6.2%
-3.8%
3.6%
3.1%
7.4%
2.5%
Table A.6 Viola – Average Household Size
1990
2000
2010
2016 ACS
estimate
2020
DOA
projectio
n
2030
DOA
projectio
n
2040
DOA
projectio
n
Average household
size
2.36
2.30
2.51
2.36
2.45
2.41 2.36
-
50
100
150
200
250
300
350
1980 1990 2000 2010 2016 ACSestimate
2020 DOAprojection
2030 DOAprojection
2040 DOAprojection
Nu
mb
er
of
ho
use
ho
lds
Figure A.5 Viola – Total Households
1.50
1.70
1.90
2.10
2.30
2.50
2.70
1990 2000 2010 2016 ACSestimate
2020 DOAprojection
2030 DOAprojection
2040 DOAprojection
Ho
use
ho
ld s
ize
Figure A.6 Viola – Average Household Size

12 Viola Housing and Workforce Study Appendix
Table A.7 Viola – Percent Families with Children by Family Type
Percent of families with children by family type
1990
2000
2010
2016
Married couple
With own children under 18
75.6%
70.8%
65.4%
56.5%
Male householder, no wife present
With own children under 18
4.7%
11.1%
12.3%
11.8%
Female householder, no husband present
With own children under 18
19.8%
18.1%
22.2%
31.8%
Table A.8 Viola – Average Family Size
1980
1990
2000
2010
2016
ACS
estimate Average family size
2.96
3.06
2.88
3.06
2.96
0.0%
20.0%
40.0%
60.0%
80.0%
1990 2000 2010 2016 ACS estimate
Pe
rce
nt
of
tota
l fam
ilie
s w
ith
ch
ildre
n
Figure A.7 Viola – Percent Families with Children by Family Type
Male householder Female householder Married couple
2.75
2.80
2.85
2.90
2.95
3.00
3.05
3.10
1980 1990 2000 2010 2016 ACS estimate
Fam
ily s
ize
Figure A.8 Viola – Average Family Size

13 Viola Housing and Workforce Study Appendix
Table A.9 Viola – Households with One or More People Over 65
1980
1990
2000
2010
2016 ACS
estimate
Households with 1+ person over 65
120
114
108
90
82 Change
(6)
(6)
(18)
(8) % change
-5.0%
-5.3%
-16.7%
-8.9%
% Households with 1+ person over
65
41.7%
41.8%
37.2%
32.3%
28.4%
1
1 For data, see table A.4 in previous section
0.0%
10.0%
20.0%
30.0%
40.0%
50.0%
0
20
40
60
80
100
120
140
1980 1990 2000 2010 2016 ACSestimate P
erc
en
t o
f to
tal h
ou
seh
old
s
Ho
use
ho
lds
Figure A.9 Viola – Households with One or More People Over 65
Households Percent of total households
0.0%
5.0%
10.0%
15.0%
20.0%
25.0%
-
10
20
30
40
50
60
70
1980 1990 2000 2010 2016 ACSestimate P
erc
en
t o
f to
tal h
ou
seh
old
s
Nu
mb
er
of
pe
op
le
Figure A.4b Viola – People 65+ Years Old Living Alone
65+ living alone 65+ living alone as percent of households

14 Viola Housing and Workforce Study Appendix
Race
Table A.10 Viola – Population by Race
Race
1980
1990
2000
2010
2016 ACS
estimate
White alone
695
643
660
689
664 Black or African American alone
-
-
-
4
- American Indian or Alaska Native alone
1
1
1
-
- Asian alone
-
-
2
-
- Native Hawaiian/other Pacific Islander
alone
-
-
-
-
- Some other race alone
-
-
1
2
16 Two or more races
3
4
2
96% 97% 98% 99% 100%
1980
1990
2000
2010
2016 ACS estimate
Figure A.10 Viola – Population by Race
White alone
Black or African American alone
American Indian or Alaska NativealoneAsian alone
Native Hawaiian/other PacificIslander aloneSome other race alone
Two or more races
15 Viola Housing and Workforce Study Appendix
Table A.11a Viola – Hispanic Population
1980
1990
2000
2010
2016 ACS
estimate Hispanic (any race) population
1
7
8
4
30
Change
6
1
(4)
26
% change
600.0%
14.3%
-50.0%
650.0%
Table A.11b Viola – Hispanic Population
1980
1990
2000
2010
2016 ACS
estimate
Hispanic (any race) - percent of total
pop.
0.14%
1.09%
1.20%
0.57%
4.40%
0.00%
1.00%
2.00%
3.00%
4.00%
5.00%
-
5
10
15
20
25
30
35
1980 1990 2000 2010 2016 ACSestimate
Pe
rce
nt
of
tota
l po
pu
lati
on
Po
pu
lati
on
Figure A.11 Viola – Hispanic Population
Population Population as percent

16 Viola Housing and Workforce Study Appendix
Educational Attainment
Table A.12a Viola – Educational Attainment
2000 Census estimate
2010 ACS estimate
2016 ACS estimate Less than 9th grade
54
16
15
9th to 12th grade, no diploma
71
23
22 High school diploma or equivalent
205
194
230
Some college, no degree
105
79
82 Associates degree
15
42
35
Bachelor’s degree
31
19
45 Graduate or professional degree
18
11
13
Sum
499
384
442
0% 20% 40% 60% 80% 100%
2000 Census estimate
2010 ACS estimate
2016 ACS estimate
Figure A.12a Viola – Educational Attainment
Less than 9th grade
9th to 12th grade, no diploma
High school diploma or equivalent
Some college, no degree
Associates degree
Bachelors degree
Graduate or professional degree
0.0%
10.0%
20.0%
30.0%
40.0%
50.0%
60.0%
2000 Censusestimate
2010 ACS estimate 2016 ACS estimate
Pe
rce
nt
of
25
+ p
op
ula
tio
n
Figure A.12b Viola – Educational Attainment
Less than 9th grade
9th to 12th grade, no diploma
High school diploma orequivalent
Some college, no degree
Associates degree

17 Viola Housing and Workforce Study Appendix
Table A.12a Viola – Educational Attainment
2000 Census Estimate 2010 ACS estimate
2016 ACS estimate Less than 9th grade
10.8%
4.2%
3.4%
9th to 12th grade, no diploma
14.2%
6.0%
5.0% High school diploma or equivalent
41.1%
50.5%
52.0%
Some college, no degree
21.0%
20.6%
18.6% Associates degree
3.0%
10.9%
7.9%
Bachelor’s degree
6.2%
4.9%
10.2% Graduate or professional degree
3.6%
2.9%
2.9%
Table A.13 Viola – Educational Attainment
2000 Census
estimate
2010 ACS
estimate
2016 ACS
estimate
Percent high school graduate or
higher
74.9%
89.9%
91.6%
Percent bachelor's degree or higher
9.8%
7.8%
13.1%
0.0%
20.0%
40.0%
60.0%
80.0%
100.0%
2000 Census estimate 2010 ACS estimate 2016 ACS estimate
Pe
rce
nt
of
tota
l po
pu
lati
on
Figure A.13 Viola – Educational Attainment
High School Graduate Bachelor's Degree or Higher

18 Viola Housing and Workforce Study Appendix
Income
Table A.14 Viola – Income in 2016 Dollars
In 2016 dollars 1980 Census
estimate
2000 Census
estimate
2010 ACS
estimate
2016 ACS
estimate Median household
income
$ 28,605.69 $ 40,435.27 $ 39,537.05 $ 36,827.00
Per capita income $ 14,403.33 $ 24,872.27 $ 21,139.41 $ 17,858.00
Table A.15 Viola – Families Below Poverty Level
Percent families (by type)
below poverty level
1980 Census
estimate
1990 Census
estimate
2000 Census
estimate
2010 ACS
estimate
2016 ACS
estimate All families 7.9% 12.9% 3.2% 12.5%
Families with children 20.0% 4.1% 19.5%
Families with female
householder
30.3% 0.0% 34.1%
Families with female
householder with children
25.0% 0.0% 44.4%
$-
$5,000.00
$10,000.00
$15,000.00
$20,000.00
$25,000.00
$30,000.00
$35,000.00
$40,000.00
$45,000.00
1980 Censusestimate
2000 Censusestimate
2010 ACS estimate 2016 ACS estimate
Inco
me
Figure A.14 Viola – Income in 2016 Dollars
Median household income Per capita income

19 Viola Housing and Workforce Study Appendix
B. Housing
Housing Stock
Table B.1a Viola – Total Housing Units
Viola
1980
1990
2000
2010
Census
2016 Total housing units
320
306
319
331
317
Occupied housing units
288
273
290
279
289 Vacant housing units
30
33
29
52
28
Table B.1b Viola – Total Households and Estimates
1980
1990
2000
2010
2016 ACS
estimate
2020
DOA
projectio
n
2030
DOA
projectio
n
2040
DOA
projectio
n
Total
household
s
288
273
290
279
289
298
320
328
-
50
100
150
200
250
300
350
1980 1990 2000 2010 2016 ACSestimate
2020 DOAprojection
2030 DOAprojection
2040 DOAprojection
Figure B.1 Viola – Total Housing Units and Households
Housing units Households

20 Viola Housing and Workforce Study Appendix
Tenure
Table B.2 Viola – Owner and Renter Occupied Housing Units
1980
1990
2000
2010
2016 Owner occupied housing units 215 202 210 211 214
Renter occupied housing units 73 71 80 68 75
-
50
100
150
200
250
1980 1990 2000 2010 Census 2016
Nu
mb
er
of
ho
usi
ng
un
its
Figure B.2 Viola – Owner and Renter Occupied Housing Units
Owner occupied housing units Renter occupied housing units

21 Viola Housing and Workforce Study Appendix
Housing Characteristics & Age
Table B.3 Viola – Number of Units in Structure
1990
2000
2010 ACS
2016 1 unit
238
247
225
231
2 units
16
25
23
33 3-4 units
9
8
-
- 5-9 units
-
-
-
3 10+ units
11
10
13
9 Mobile homes
23
45
14
41
-
50
100
150
200
250
300
1990 2000 2010 ACS 2016
Nu
mb
er
of
stru
ctu
res
Figure B.3 Viola – Number of Units in Structure
1 unit 2 units 3-4 units 5-9 units 10+ units Mobile homes

22 Viola Housing and Workforce Study Appendix
0% 0%9%
9%
11%
8%
5%
8%6%
44%
Figure B.4a Viola – Year Housing Units Were Built: 2016
Built 2014 or later
Built 2010 to 2013
Built 2000 to 2009
Built 1990 to 1999
Built 1980 to 1989
Built 1970 to 1979
Built 1960 to 1969
Built 1950 to 1959
Built 1940 to 1949
Built 1939 or earlier
71%
29%
Figure B.4b Viola – Housing Units Built Before 1979: 2016
Built 1979 or earlier
Built 1980 or later

23 Viola Housing and Workforce Study Appendix
Table B.4 Viola – Year Housing Units Built: 2016
Built 2014 or later
- Built 2010 to 2013
1 Built 2000 to 2009
27
Built 1990 to 1999
29 Built 1980 to 1989
35
Built 1970 to 1979
25 Built 1960 to 1969
15
Built 1950 to 1959
26 Built 1940 to 1949
18
Built 1939 or earlier
141
44%
56%
Figure B.4c Viola – Housing Units Built Before 1939: 2016
Built 1939 or earlier
Built 1940 or later
-
50
100
150
200
1980 1990 2000 2010 ACS 2016
Nu
mb
er
of
ho
usi
ng
un
its
Figure B.5 Viola – Number of Bedrooms Per Housing Unit
No bedroom 1 bedroom 2 bedrooms
3 bedrooms 4 bedrooms 5 or more bedrooms

24 Viola Housing and Workforce Study Appendix
Table B.5 Viola – Number of Bedrooms Per Housing Unit
Bedrooms:
1980
1990
2000
2010
2016 No bedroom
-
-
-
-
8 1 bedroom
25
29
23
45
33
2 bedrooms
106
90
97
77
80 3 bedrooms
118
129
164
108
146
4 bedrooms
45
59
37
38
39 5 or more bedrooms
7
8
14
7
11
Table B.6 Viola – Number of Vehicles Available Per Housing Unit: 2016
Vehicles available at occupied housing units
1980
1990
2000
2010
2016 No vehicles available
51
40
31
8
13 1 vehicle available
109
116
116
60
83
2 vehicles available
91
86
123
105
130 3 or more vehicles available
31
36
35
55
63
4%
29%
45%
22%
Figure B.6 Viola – Number of Vehicles Available Per Housing Unit: 2016
No vehicles available
1 vehicle available
2 vehicles available
3 or more vehicles available
25 Viola Housing and Workforce Study Appendix
Housing Value & Tennant Capital
Table B.7 Viola – Ratio of Home Value to Household Income: 2016
Ratio of value to household income
2010
2016 Less than 2.0
83
121
2.0 to 2.9
52
39
3.0 to 3.9
19
26
4.0 or more
34
26
57%19%
12%
12%
Figure B.7 Viola – Ratio of Home Value to Household Income: 2016
Less than 2.0
2.0 to 2.9
3.0 to 3.9
4.0 or more
22%
52%
16%
6%2%
1% 1%0%0%
Figure B.8 Viola – Home Value: 2016
Less than $49,999
$50,000-$99,999
$100,000-$149,999
$150,000-$199,999
$200,000-$249,999
$250,000-$299,999
$300,000-$399,999
$400,000-$499,999
$500,000 or more

26 Viola Housing and Workforce Study Appendix
Table B.8 Viola – Home Value: 2016
Home value
2016 Less than $49,999
46
$50,000-$99,999
112 $100,000-$149,999
34
$150,000-$199,999
13 $200,000-$249,999
5 $250,000-$299,999
2 $300,000-$399,999
2 $400,000-$499,999
- $500,000 or more
-
-
10
20
30
40
50
60
70
Nu
mb
er
of
ho
use
ho
lds
Household income
Figure B.9 Viola – Owner and Renter Occupied Units by Household Income: 2016
Owner-occupied units Renter-occupied units

27 Viola Housing and Workforce Study Appendix
Table B.9 Viola – Owner and Renter Occupied Units by Household Income:
2016 2016
Owner-occupied units
Renter-occupied units Less than $5,000
2
5 $5,000 to $9,999
3
18 $10,000 to $14,999
20
9 $15,000 to $19,999
16
13
$20,000 to $24,999
10
- $25,000 to $34,999
26
13
$35,000 to $49,999
37
10 $50,000 to $74,999
65
5 $75,000 to $99,999
24
2 $100,000 to $149,999
9
- $150,000 or more
2
-
Table B.10 Viola – Housing Units by Mortgage Status
Mortgage status (estimate):
1980
1990
2000
2010
2016 Owned with a mortgage or loan
57
65
74
97
112
Owned without a mortgage or loan (free and
clear)
121
116
104
91
102
-
20
40
60
80
100
120
140
1980 1990 2000 2010 ACS 2016
Nu
mb
er
of
ho
usi
ng
un
its
Figure B.10 Viola – Housing Units by Mortgage Status
Owned with a mortgage or loan Owned without a mortgage or loan (free and clear)

28 Viola Housing and Workforce Study Appendix
Table B.11a Viola – Selected Monthly Owner Costs as Percent of Household Income
1980
1990
2000
2010
2016 Less than 20 percent
-
-
92
65
86 20-24 percent
99
120
29
27
26
25-34 percent
27
42
36
38
56 35 percent or more
28
2
17
47
24
0% 20% 40% 60% 80% 100%
1980
1990
2000
2010
2016
Figure B.11a Viola – Selected Monthly Owner Costs as Percent of Household Income
Less than 20 percent
20-24 percent
25-34 percent
35 percent or more
45%
14%
29%
12%
Figure B.11b Viola – Selected Monthly Owner Costs as Percent of Household Income: 2016
Less than 20 percent
20-24 percent
25-34 percent
35 percent or more

29 Viola Housing and Workforce Study Appendix
Table B.11b Viola – Selected Monthly Owner Costs as Percent of Household Income
1980
1990
2000
2010
ACS est.
2016 Less than 20 percent
0.0%
0.0%
52.9%
36.7%
44.8%
20-24 percent
64.3%
73.2%
16.7%
15.3%
13.5% 25-34 percent
17.5%
25.6%
20.7%
21.5%
29.2%
35 percent or more
18.2%
1.2%
9.8%
26.6%
12.5%
0.0%
20.0%
40.0%
60.0%
80.0%
1980 1990 2000 2010 ACS est. 2016
Pe
rce
nt
of
tota
l ho
use
ho
lds
Figure B.11c Viola – Selected Monthly Owner Costs as Percent of Household Income
Less than 20 percent 20-24 percent 25-34 percent 35 percent or more
0% 20% 40% 60% 80% 100%
1990
2000
2010
2016
Figure B.12a Viola – Gross Rent as Percentage of Household Income
Less than 20 percent
20-24 percent
25-34 percent
35 percent or more

30 Viola Housing and Workforce Study Appendix
Table B.12 Viola – Gross Rent as Percentage of Household Income
1980
1990
2000
2010
2016 Less than 20 percent
-
29
21
12
- 20-24 percent
-
3
14
-
16 25-34 percent
-
10
14
5
17 35 percent or more
-
19
24
17
12
0%
35%
38%
27%
Figure B.12b Viola – Gross Rent as Percentage of Household Income: 2016
Less than 20 percent
20-24 percent
25-34 percent
35 percent or more
0.0%
10.0%
20.0%
30.0%
40.0%
50.0%
60.0%
70.0%
1990 2000 2010 2016
Pe
rce
ntr
of
tota
l ho
use
ho
lds
Figure B.13 Viola – Gross Rent as Percentage of Household Income
Less than 20 percent 20-24 percent 25-34 percent 35 percent or more

31 Viola Housing and Workforce Study Appendix
Table B.13 Viola – Gross Rent as Percentage of Household Income
1990
2000
2010 ACS
est.
2016 Less than 20 percent
47.5%
28.8%
35.3%
0.0%
20-24 percent
4.9%
19.2%
0.0%
35.6% 25-34 percent
16.4%
19.2%
14.7%
37.8%
35 percent or more
31.1%
32.9%
50.0%
26.7%

32 Viola Housing and Workforce Study Appendix
Housing Demand
Table B.14 Future Housing Demand Forecast
2030 projected number of households 320
+ desired vacancy rate of 5% 16
+ replacement housing* 2
= required number of new housing units 338
- available number of units (2010 census) 331
- units built 2010-2017 0
= total housing units to be built for 2030 7

33 Viola Housing and Workforce Study Appendix
C. Workforce
Maps Figure C.1 Inflow/Outflow Map

34 Viola Housing and Workforce Study Appendix
Figure C.2 Distance Map
Legend

35 Viola Housing and Workforce Study Appendix
Figure C.3 Direction/Distance of Job

36 Viola Housing and Workforce Study Appendix
Wages & Housing Affordability
Table C.4 Median Home Affordability Rates based on Occupation Median Earnings of Resident Workers
2017 ACS Median Home Value $134,400
Annual Income Needed to buy MHV home $53,760
# of Resident Workers in Occupations Paying enough to buy MHV home 495
… as % of Total Resident Workers 7.73%
# of Resident Workers in occupations needing 2 times its median income to buy MHV home 3491.96
… as % of Total Resident Workers 54.54%
# of Resident Workers in occupations needing 3 times its median income to buy MHV home 2415.47
… as % of Total Resident Workers 37.73%
Table C.5 Median Home Affordability Rates based on Occupation Median Earnings of Jobs Created from
2013-2018
2017 ACS Median Home Value $134,400
Annual Income Needed to buy MHV home $53,760
Jobs Created in County from 2013-2018 367
# of Jobs Created Paying enough to buy MHV Home 12
… as % of Total Jobs Created 3.27%
# of Jobs Created that require 2 earners to buy MHV Home 109
… as % of Total Jobs Created 29.70%
# of Jobs Created that require 3 earners or more to purchase MHV Home 246
… as % of Total Jobs Created 67.03%
Table C.6 Job Growth by Education Type from 2013-2018
Education Type # of jobs % of total
No Formal Educational Credential 89 24.25%
High School Diploma or Equivalent 248 67.57%
Postsecondary Nondegree award 8 2.18%
Associate's Degree 0 0.00%
Some college, no degree 2 0.54%
Bachelor's Degree 19 5.18%
24.25%
67.57%
2.18%
0.00%
0.54%5.18% 0.27% 0.00%

37 Viola Housing and Workforce Study Appendix
County & State Employment Figure C.7 County Labor Force and Employment
Figure C.8 State Labor Force and Employment
0
1
2
3
4
5
6
7
8
9
10
8000
8500
9000
9500
10000
10500
20
00
20
01
20
02
20
03
20
04
20
05
20
06
20
07
20
08
20
09
20
10
20
11
20
12
20
13
20
14
20
15
20
16
20
17
Un
emp
loym
ent
Rat
e
Lab
or
Forc
e an
d E
mp
loym
ent
Richland County Labor Force and Employment
Labor Force Employment Unemployment Rate
0
2
4
6
8
10
2600000
2700000
2800000
2900000
3000000
3100000
3200000
20
00
20
01
20
02
20
03
20
04
20
05
20
06
20
07
20
08
20
09
20
10
20
11
20
12
20
13
20
14
20
15
20
16
20
17
Un
em
plo
yme
nt
Rat
e
Lab
or
Forc
e a
nd
Em
plo
yme
nt
Wisconsin Labor Force and Employment
Labor Force Employment Unemployment Rate

38 Viola Housing and Workforce Study Appendix
D. Stakeholder Response
Table D.1 Richland County Lenders Responses
Question Response
1. How would you
describe the
current housing
market?
Slowdown in last couple of years. More buyers than what is available. Nothing to
buy. People are preapproved and just waiting. They sometimes buy under what
they can afford and then do some improvements. Owner residents planning to
stay.
Tight – not a lot for sale – it goes quickly unless there is significant work
Higher price - $250,000 and up sits a little bit, the higher the price the longer the
wait.
Some newer homes in Viola, Caz – newer homes on the hill, Ithaca – some open
lots, up on the hill, Lone Rock – has open lots in the pines, some older homes
that need refurbishment
Need for improvement and opportunity for building – lots of land.
Was a seller’s market – but changing – starting to plateau. Not much on the
market that people want to buy. Old fixer uppers are sitting. Gen X want new
modern home. And move in ready.
Programs for first time home buyers, grants, little money down – good options.
Housing availability in both rent and purchase – housing shortage. 2008 –
housing stopped, no spec houses, no turnover. Some building starting to pick up.
Lots available here if someone wants to build. Lots out by old school and in the
pines
Picked up. Houses are moving and selling – good thing. Building sites available –
have undeveloped lots.
Poor – not much inventory. Not many options. Needs new single family, multi-
family, needs land.
No place to downsize to
Limited higher quality rental properties
Existing housing stock – lacking upgrades
Within the city – not much land to put up a housing subdivision
River and hills – hem us in
Land behind Walmart – not appealing to me – too commercial, near livestock
Lone Rock – has Cardinal Glass and able to support easier commute to Madison
(Caz can get to Reedsburg).
Others – can’t get into Richland Center – so end up in these cities.
Ithaca is more vibrant – school is better supported and people feel education is
stronger than others in the area
2. Is there
currently a strong
demand for
housing?
Yes. $125,00 to $300,000 market price. We could place 15 residents today if we
had residences. Housing is selling word of mouth. Teachers, executives, hospital
staff.
Yes.
Not as much – lacks services and shopping nearby. Workers at Cardinal Glass like
to live closer – drives demand in SE corner. Some interest in rural area – larger
lots – appeal across all the towns.
Some demand. Not being met.

39 Viola Housing and Workforce Study Appendix
Yes and no. The GenX and Millennials are ok with renting. May live a couple of
years in one space and move on. No settling down. Those that are settling down
– want open concept and ready to move in.
From the rental side – yes, and Buyers that want a home
Has picked up. Houses being sold. In the turn down – the economy tanked –
nothing was moving – a year or more on the market. Now selling – in 3 to 4
months.
Could sell more if there was quality stuff to sell. Wedgewood housing
subdivision – built 10 years ago – freed up some other houses. The costs to build
a new home has increased – do people have the income to support it. The
services of city water etc. is valuable.
Not strong, some transactions. Ithaca – has the strongest appeal.
3. What type of
housing is there a
demand for?
Single family. 3-4-bedroom, ranch style. Some near to city center, some outside
town on a couple of acres. Need a garage.
Single family residence – 3br 2 bath. Not a lot of nice rental properties.
Single family – 3 bdrm. Plus 3 car garages. Basement with storage, finished
preferred.
Single family housing – varies by community. Ithaca - 3 bd 3 bath. Caz – 2 bd 2
bath.
Open concept, love it or list it tv show style, ready to move in. 3 bed room and 2
baths.
Single family – 3+ bedroom – Finding something at $150,000 or under is hard to
find. The $200 – $300,000 is available
Residential – singles – 1 to 4 bedrooms.
New quality single family. Demand for higher quality rental or owner occupied,
multifamily – duplex or condo. Panorama - $800 plus rent – not a fit for
everyone to be in a big 40 unit (new development on 14 near the college).
Buying a single unit might be the same price per month. Panorama may be noisy
– might be a fit for some – not sure who it might be a fit for.
All single family.
4. What do you
predict for the
next 10 years in
the housing
market?
Much depends on the economy. There is demand for rentals as well. Dream of
home ownership not as great as it once was. Jobs are more mobile and people
of move. We have a rental problem in Richland Center. People have low end
housing, charging high rent, houses are run down, People in low income
brackets, can’t find rental property, has troublesome rentals. Some tenants have
housing subsidies and the landlord charges $600 and $500 is paid by state – that
is an issue. The tenants are troublesome – lower income people that prefer not
to work. Not an asset to the community. Mgmnt at Rockwell – has to stay at a
room at Ramada and they stay months.

40 Viola Housing and Workforce Study Appendix
More rental properties – millennials are not as driven to have an owned home.
Affordable rental property - $600 for two. Panorama (new build in town) will
come. One level – townhouse – retired people – has garage – close to town –
that would fill up. Transitional housing – sold bigger home – but not ready for
assisted living.
Some demand, dependent on where jobs are. Viola – go macro, S&S, all up in
the area, if they grow, jobs grow.
They are going to grow – have land to build. Can get cheaper home cost in the
outlying area. Can get outside of town for peace and quiet.
We hope it stays strong for good banking business – but it could fall. But reverse
mortgages and other 2008 tactics are creeping back in – could initiate the fall.
Cash out over what the home was worth – but it can lead to default or
bankruptcy.
In Madison multi units are booming. Single family trend needs will continue
Richland County taxes are lower but close enough to big cities like Madison. A
few spec houses being built in region
In the next 5 years – continued building increase. Interest rates higher but still
good. Savings and loans percentage rates balanced.
What is going to happen to population. Needs some turnover in housing to get
them updated or scrapped and start again. Many marginal rentals could be
rehabbed if it can be bought at a good price.
People may have a choice and the lowest tier might get eliminated
Nice quality rental properties – never have vacancies.
No demand in Caz or Viola. Some demand in Ithaca and Lone Rock – has industry
or proximity to industry.
5. How do you
define a strong
market?
Properties move quickly off the market.
Buyers and sellers, property moving, growth.
Same as Center. Willing buyers and sellers and good jobs and good economy.
Same as the City answer.
Steady. Homes are selling. Rates are low, but moving up, so buying frenzy
slowing down. Houses are being built. In 2-3 years, people will be passing on,
and new stock will come open.
A strong economy, employment options. 15 job postings in paper every week.
Interest rate still historically low over 20 years. What is available – limited.
Houses are moving faster to sold.
More buyers than sellers. If there was high quality – people would consider
upgrading or downsizing, but right now no options, so they stay where they are.
More buyers than sellers.

41 Viola Housing and Workforce Study Appendix
6. Can people
afford new
housing? Who?
Some people can afford the price range, but don’t want to build. When you build
a home, you have to start with more equity – to support cost overruns. They can
afford the payments – but you can’t build it with just 5% down – you need more.
Who – hospital, upper management, doctors, retirement people and they can
flip out equity. Families with grade school kids or older. At NHS – they are
renovating a home. Houses do not appraise for what they put into it. People
need significant equity.
Yes, as long as they have the income – the income debt ratio that is reasonable.
Programs without needing 20% down with good credit. The more we see are
little bit older and working and in 30s 40s, more settled, are able to afford.
They get more house for the money. Yes. Some need improvements in the
houses. Can drive out to work in larger cities.
Yes. They have to set a budget and live by a budget. Being cost efficient with
spending.
New construction is harder – not getting 100% out of your expense – so
borrowers need funds. Existing housing – WHEDA, VA loans can help with little
money down. Those with reasonable debt can get into new housing. Everyone
that wants a home should be able to get to one with work. Grants available to
help.
Yes. Two income families.
If I work at Rockwell - $20/hr – can only afford $1000/month. Two income might
be able to make it, single parent. $100,000 house - $850/mo. Blue collar jobs –
can support it – but it is hard to move up the scale. How do we get higher paying
jobs to support higher housing?
Marginal, not really. Only people that have higher income. Ithaca might have
pull
People what want outbuildings or recreation. Zoning can be challenging – need
to look at rezoning to some Ag residential.
7. What are the
current
generational
issues affecting
home ownership?
Variety – see a bit of everything. Early 20s – see some buying, some are well
qualified and buying. Older generations – lower income – homes not
accommodating them – also hits more affluent. Lack main floor bathroom –
issue – may not have money to buy something else.
Millennials not inclined to own home, not committed to monthly house
payment right away.
Same – fresh out of school, lack of broadband in some areas. Drawn to big cities
for jobs
Kids leave. They feel stuck there. The towns are not keeping them.
Electronics and TV are an issue. TV tells you have to have lots of material things,
buy this entertainment item and spend instead of save.

42 Viola Housing and Workforce Study Appendix
The younger generation wants to rent not buy. Late 20s early 30s – then buy
Multi units are rentable. Someone else does all the upkeep. Financially to rent or
buy – the monthly payment is the same. Until the 50-60s – wanting to rent – no
upkeep
Younger people struggle with down payment and have to look for option for
them. Programs to let them have lower down payment lower rates. $80-100,000
price tag
Aging population that wants to downsize, less maintenance, not options to
move to so have to workers to do that. Lack of down payment for first time
home buyers – there are some programs they get. The middle group in a small
house, want to move up, nothing they can move to.
8. What are the
greatest barriers
to first-time
homeownership?
Buyers understanding, they need down payment. Needs skin in the game.
No credit or poor credit. Lack of own funding. Understanding of how credit
impacts ability.
Credit issues, lack of down payment, job stability.
Afraid of being stuck and not seeing the work.
Mindset – overcome that they CAN own a home and get to that step. To be able
to manage the maintenance and budgeting. Once you get over that, you can put
a little away and be prepared. And to have the insurance to cover it. Scary to be
on own and not have safety net.
Uneducated on options – need to understand the process or the options on
down payment. There are misconceptions. Online classes available for free.
Down payment.
Down payment, wages, education – knowing the options of what apartment or
single-family homes bring. Maintenance of a home may bust the budget. Newer
homes have less maintenance.
9. What are the
barriers to new
home
construction and
development?
Cost. Desire to endure the process. Many challenging decisions. Cost of land,
building, it gets to $300 – 400,000 – it cuts out a lot of the local population who
cannot afford.
Land availability in the city and surrounding area. Farmland might not be
available for housing. The price of land.
Cost of land, expense of well and septic, roads, adds to cost before materials for
the building. Surveys and zoning constraints.
Lacking Money.
Stigma that it will take forever and always something goes wrong and costs
more. Hear horror stories.
Labor and Material costs – not recouping what you put it. Having that 20% down
can be a block. Spec home construction – risky. Natural disasters – prices will
continue to increase.
Down payment – even higher - $200,000 and up – hard to come up with.

43 Viola Housing and Workforce Study Appendix
Lots – where is the land?? May not be able to make money for developers.
Contractors are too few. Skilled trades are limited.
May be less barriers with more buildable places. Sextonville/Ithaca might be
developable – if the they have water etc., they have flat land.
10. What do you
feel are the
current housing
opportunities in
the region? For
developers? For
new owners?
Developers – most of the builders are so busy do not need to do spec homes –
that is risk. New Owners – Money is available for decent debt ratio, no houses.
Don’t see a lot for sale. For developers – need to find buildable lots.
The transitional housing types. Can be for rental.
Land is there, cheaper to build, useable land.
Lots of ops. Lots of land available. Could be gorgeous views. Lots of plants and
factories – demand for new houses. Employment so low, so lots of jobs
available. People will come to work and need a home to stay, get bonus to move
here. Hard to find a place now.
Interest rates are low. Fixed financing for 30 years. Down payment program
assistance. Some are selling homes and building locally. Spec builders – plenty of
people to buy so lowers risk. Those that want to build – seller’s market and quick
to sell. Winter is coming – that will slow it down. School in session – people are
settled in.
People want to build outside of town – a few acres needed. Does not want
developers inside town. Need business – low cost housing. Senior Units. New
owners could take on new lots.
Spec houses could have a home and could withstand 6 new spec homes. Could
be a demand for higher quality for duplex, tri-, or four-plexes – one level for
older generation with basement storage. Need quality
Single family with smaller acreage – affordable but livable. Need higher paying
jobs.
11. What types of
housing are most
needed?
Single family ranch. 3-4 bedroom, 2 bathrooms.
Single family. Multiunit rentals – one story, private front door – could be a mix of
ages. Good for those prior to first home buy and those that are selling larger
home
Transitional housing – small footprint – good for starters and enders.
Single family homes.
Apartments – fill up easily and fast. Down the line – houses – developments, cul
du sacs – will help grow the town.
Single family with 3+ bedrooms, 1200 sq. ft., 2 baths. Older kids need more
bathroom. 2 bedrooms apt are available. Garage nice but not required.
1-4 bedroom. In econ downturn – young people leave for job. When econ is
good, young people stay. Affordable housing – Senior housing – low income

44 Viola Housing and Workforce Study Appendix
Single family to 4plexes. Wedgewood – most were downsizing and moving to
ranches.
Single family
12. What
incentives are
there for new
homebuyers?
New home
builders?
New home buyers – none. Builders – none. Demand for new homes exists. For
builders – comes back to money. The city I know in MN, the city gives the land,
tax incentives, etc. Saves huge money and safe place for the family. Motivated
and rewarded to live there. Schools benefit, 40-50 new homes in last 10 years.
The benefit of the small town.
Last subdivision was 10 years ago here in Richland Center. People want to live
outside city for lower taxes. Lot is $25-30,000 – give it for 10,000 and give
restrictions like it has to be owner resident, etc.
People build outside of town – no room in town.
Need to cut through city red tape
Buyers – NHS programs, WHEDA, Home Ready via Associated, VA loans.
Builder – don’t have an answer.
USDA funding
New home – Neighborhood Housing Services – down payment assistance, first
time home owners’ loans available, lower down payment, can just get to paying
closing costs up front. Saving.
o New Home builders – developers – have commercial options to help with
funding.
Lower to moderate income – grants available. Rate rising environment – still
available low rates for 30 years. New home builders – get to build custom, so no
reworking. Skilled laborers available – able to hire your neighbors. Electricians,
concrete, finish carpenters.
NHS has down payment assistance. We have 1st time buyers’ program – we
make it work.
Buyers – variety of lending programs – Neighborhood Housing Services has some
Many are tied to low to moderate income and if they make too much money –
do not qualify. Builders – no skilled workers make it challenging. No incentives
except to make money and that is stretched thin.
13. What can
others do to
encourage new
housing?
Someone needs to find the space. Create the plan. It has to be easier for new
buyers to come in. Create a streamlined process with the city – all parties need
to move quickly and get to the goal.
We had a local group looking into new housing – we need to see what the need
is and stay informed.
Financial sense to own a home – they have some equity to sell – encourage
young people to buy. Encourage young people to save to be able to make a
commitment
Be able to have a cash reserve to fall back on.
Become informed as to programs available, understand how to improve credit
score to be eligible. And to overcome fear of being a home owner.

45 Viola Housing and Workforce Study Appendix
To speak up and to inform the city and representative that it is needed. To scout
locations for it. Takes a village to build a village. For everyone to buy in. It is not
a one-person job – it is everyone.
As a community we need to make our city appealing. We need to build the sense
of community after losing the school. The community is taking on movie nights
and holiday parties to give kids something to do at affordable prices. Property
conditions need to kept clean and maintained – that is something that the
village. If your lawn is not mowed – it needs addressed to maintain
neighborhood value.
Advertising. Left to the individual buyer and seller and bank helps come up a
solution.
Someone has to make money without excessive risk. The city should buy some
land, put in infrastructure, and have a range of small lots/houses to duplexes to
higher single-family homes – needs planning to make it work and be appealing
to all levels. City has to create standards and stick to them. City gives the land,
people will complain. City invested $500K in Wedgewood – creates long term
taxes.
Proactive communities – they have to invest in the future.
14. What kind of
person is in most
need of
affordable
housing?
Affordable – those that have lower paying jobs, don’t have great credit. Can’t
buy a house at $12/hour - $27,000 a year. It does not support an expensive
house. The NHS houses help, but not enough. Some employers might be able to
support housing initiatives. At our last election – what they ran on – we need to
do something about housing – we are not any closer to getting that.
Younger families, Single parent working. Mother is staying home to care for kids.
Individuals going into retirement that can’t afford to make a move.
Younger professionals, those that are not able to afford own home. Younger
families with one parent working.
Everyone.
Everyone is – not just the poor. It has to be affordable based on your income so
it is a fit and not a strain to afford.
Elderly on fixed incomes.
Young families with 3-4 kids
Both need help
See Jessica for help to get ready to buy a house
Property taxes vary – mil rates – historically River Valley mil rate was lower, but
Ithaca has higher taxes – good school
School families don’t mind property taxes, but property taxes can steer people
away.
Sauk County is higher.
Seniors.
Young people to have a home is a dream – they have to save awhile – they have
other payments and hard to get a mortgage
Blue collar - $15 – 20/hour. Need better-quality options.
Blue collar younger looking for suitable housing, a small upgrade.

46 Viola Housing and Workforce Study Appendix
Table D.2 Richland County Realtors Responses
Question Response
How would you
describe the current
housing market?
Seller’s Market
Lacking inventory – good for sellers – values are up as much as 10% in last
2 years.
Like Ithaca – good school district – nice country home
Caz taxes are high and town is in debt
Not a lot on the market – selling face
Not much available. Lone Rock is a lower housing priced market
Ithaca has fabulous school and has decent home, nice growth on the west
side of town
Sellers’ market – shortage of decent houses to sell. We have had a 10-year
lack of building.
Is there currently a
strong demand for
housing?
Yes (x3).
Is a demand – but the sellers then price too high – and that slows the sales
market down.
No.
Yes – not much available. Lone Rock – for cheaper prices. Ithaca for the
School and nicer home.
What type of housing
is there a demand for?
For both Richland Center and outlying. For single family – both rental and
home ownership. $75,000 - $150,000. 3 bedrooms.
Raised ranch. $300K not in demand – those buyers coming in from out of
town.
Country houses in Ithaca. Lone Rock – if you like flat.
Under $150,000 sells quick.
Rural areas and city homes. $100- $150,000 – 3 bedroom – 1-2 bath,
sometimes a garage on an ½ acre or acre.
New style – ranch homes. $125 - $300,000. Less demand for more
expensive. Lower than $125,000 need too many repairs to get finance. 15
houses on the market, 10 are not financeable due to repairs.
What do you predict
for the next 10 years in
the housing market?
Strong – follow the economy. Bringing jobs in – so need homes.
Values will maintain or get stronger.
Little towns not likely to grow – do not see promotion of those towns.
Locals will stay local.
According to history – it tanks every 10-20 years – likely downturn
Interest is not too high now.
Staying medium to strong if the economy stays strong. Interest rates will
have an impact on that as well.

47 Viola Housing and Workforce Study Appendix
Look at history – length of recovery for foreclosure period. If we don’t get
some building going on – as long as the economy stays good and no major
conflicts – it will continue to go up.
How do you evaluate a
strong housing
demand?
Phone calls and interest.
How quick properties do sell. Listed one Saturday – and buyers made an
offer on Monday.
How quick properties do sell. Listed one Saturday – and buyers made an
offer on Monday.
Things sell quickly – within 30 days.
Buyers looking and having to spread search area to find price or housing
type. Not that many listings.
Law of supply and demand. We have strong demand and short supply and
will drive market higher.
Is there an adequate
supply of housing?
No (x2)
No
No, lacking adequate selection, forced to buying what they don’t want.
Sometimes selling over asking.
No – need more country homes.
Need more.
Is there an adequate
supply of affordable
housing?
No (x4
Build new is $150 – 200,000 – over that most can’t afford.
No – gets snapped up instantly.
What kind of person is
in most need of
affordable housing?
Young People.
Young couples upgrading from starter home.
First timers and older generation.
Families, 1-3 kids. Middle- and low-income families.
First time buyers, younger buyers, elderly. The cost of construction is high.
What are the greatest
barriers to first-time
homeownership?
Finance.
Finding a house that will pass inspection that they can afford. Appraisals
don’t match offer. Condition of home is an issue.
Down payment.
Financing, down payment.
Some programs will not finance homes in poor condition
Nothing to buy – need something to qualify for financing. The house has to
qualify for loans.

48 Viola Housing and Workforce Study Appendix
What is the overall
condition of the
community housing
stock?
Low – poor.
Average, some are nice, some are in need of repair.
Average – both good and bad.
Fairly good, don’t know Viola, Ithaca has nice housing. Center has variety –
some are substandard and need fixed up.
40% need fixed up. In Lone Rock there are some that are in disrepair.
¾ of houses got new roofs this year. Economy is strong and people are
improving. Not enough carpenters for the work. Lack of new construction
here – lack of land to build New construction out of the reach of new
buyers.
What are some
reasons people new to
the area move here?
Jobs – big need, dairy, foundry.
Job brings them here. Some come home after living away.
Chicago, MKE, moving to the scenery.
Don’t know – employment. Escape from big cities.
Relocation for work. Some are downsizing or less expense, less tax.
Mostly due to relocated to work here. We are not growing, but shifting.
What amenities makes
a house desirable?
Everyone is different, Close to schools – young families will pick based on
schools, Safe neighborhood.
One level, full basement, 2 cars, location, country living is another good
option close to town. Laundry, main floor master, attached garage.
3-4 bed, 3-4 bath, attached garage, location, condition.
Youngers – want affordability, lawn. Updated houses, AC, Windows, roof, siding, garage, Nice kitchen –
stainless steel, 1.5 bath min.
Kitchens and bathrooms. Condition and location.
How important is
proximity of
employment?
Childcare? Schools?
Employment – not huge. Childcare – nice to be close, can drive to get to
good care. School – most important.
Employment does not need to be close. Childcare needs to be close – near
grandma or childcare. School district can sway some, but not a big deal,
everybody has a car.
Work not important, close to childcare.
Employment – driving is not an issue. Closer to childcare and schools
important.
They drive out to work. Childcare – several services in the area. Lone Rock
– lost their school as did Arena – not as big of an impact – 20% impacted.
We need workers. Closeness is not an issue.

49 Viola Housing and Workforce Study Appendix
What makes someone
choose not to
purchase a house after
they view it?
People look at a home, out of pocket immediate expense on replacing
mechanicals, might defer because they just spent all the money.
Price, vibe, Wishlist is not met.
Not a fit, like it or not, just a feel for it, price could impact it.
Price, condition, size.
It is smaller than it is, Dander, Smell, more work than estimated, pictures
looked better, neighborhood not so nice.
Condition .
location
What percentage
estimate of your
clients are first time
homebuyers?
35%
20-25% are first time. I also sell repeatedly. People move around.
50%
25% (x2)
Who is selling houses?
Why?
Elderly selling. Don’t want maintenance.
Retirement. People upgrading to larger property.
Downsizing, upsizing. Youngers upsizing.
Lone Rock – older people downsizing. Estates sales – due to nursing home
or death.
Move to nursing homes/pass away. People that want to upgrade. Those
relocating out.
What can the
community do to
attract new housing
developments?
Needs to have programs and tax abatements to get new building. Being in
Richland County – needs a tax break for anyone investing in Richland
County – for home buy or business buy – 3-5 years.
Industry job. Natural habitat is a plus.
Bring in good paying jobs so they can afford a good house.
Helps with financing. Available land.
Taxes reduced for the developer. They need more businesses in town or
nearby. Chamber of Commerce – might be a benefit, a way to promote the
community, kids and amenities for kids, more events.
Need to have the land available. Help someone – TIF support or other
Utilities, streets put in, need to get $45,000 to $50,000 profit out of a lot –
hard to get that.
50 Viola Housing and Workforce Study Appendix
Table D.3 Richland County Housing Agencies Responses
Question Response
How would you describe
the current housing
market?
Low inventory. 2 years ago, there were houses, but only a few now. We do
down payment assistance so we the price of housing rising – a statewide
phenomenon. A slow exit from the recession – house prices start to
increase. We don’t have any new construction. No single-family housing
built recently – for the last 10-15 years. Now nothing is going on now. We
built 50 housing in 25 years way back when. Building stopped because the
economy tanked. Cost of new construction has gone up so much.
As a whole – is low supply. The prices are somewhat suppressed.
Rural America does not get bidding wars. You have to offer below market
and be lucky to sell. Just a smaller audience. There is a lack of good quality
housing for sale. Lack of maintenance
Who is in the most need
of housing? We work with low income. Great need due to lack of resources. Cost of
rent has gone up and impacts clients. Very little new rental housing in the
area. New market rate coming into Richland Center. I hear from lenders –
rental housing for executives – get kids in school – then they buy here
instead of another city. The elderly are in need – 23 units for elderly – only
a rare rental there comes up. Affordable housing for families too. Rental
housing in general is needed. And workforce housing.
Vulnerable populations that still live independently. They have where they
can’t afford to rent independently, but also don’t qualify for section 8. The
whole county is in need of housing. No one is building. Population not
growing. Housing is cheap and use it for recreation for those that do come
in.
What are the barriers? The cost of rental housing and single-family housing – lack of affordable or
rental housing – lack of inventory. The loan market needs higher credit
scores and that eliminates some people from getting financing.
Recession put many builders out of business.
Lack of housing stock. Local economy is flat. No one from outside coming
in. Foxconn is not moving here. Richland has missed lots of opportunities
Local prices are more expensive and I cannot always afford it. I spend
$20,000/year at Walmart
What programs address
those in the greatest
need? Are they
successful? Why or why
not?
Need: Down payment assistance program we offer, also remodeling loan –
rehabilitate their home – flood program. City has a TIF program to
contribute to housing. Help people with reverse mortgages so they don’t
get taken advantage of.
Success: the programs are successful when they get resources and funding
and staffed and when they are appropriately targets. Housing programs
need to be responsive to needs. Foreclosure programs can be used to
really help – it is not a bail out – but people need help.

51 Viola Housing and Workforce Study Appendix
Residential Assisted Living – local MCO (managed care organizations),
Local Care Wisconsin helps, Health and Human Resources, Public Housing
– Richland Hills, limited to number of units they have and they are full –
50-60 units. Ridgeview Commons – has housing as well for low income
Richland County Housing Authority – section 8 housing – needs private
landlord cooperation and participation. Section 8 housing- lacking places
to go.
Is there a gap between
those receiving housing
assistance/programs and
those who need it or on
the verge of needing it?
Yes. There are not enough resources for the people that need it. Even
those that get it, are still in need. On the TIF extension – we changed the
definition of low income – so it can support more people. The gap is due
mainly to funding and eligibility requirements. In housing there are
ongoing changing needs – foreclosures are down, and the cycle of what is
need will continue to change.
Yes, there is a gap. Some that do need it resist due to a sense of pride – no
handouts. Everyone on the program does not need it. They tie up money
that could be used. Able bodies are participants that could work would
give us funds for housing those in real need. Some are just over the
income requirements – less than $1000 over - they are still in great need
HAP – housing assistance program can fill some gaps.
What type of housing
would you like to see
built?
Newer single-family construction to take some. More rental housing built
for seniors and family. Lack of new construction for so long – housing
stock wearing out. More rehabilitation on current houses need done.
Absentee investors owning rental housing and let it deteriorate.
Like to see more rehab. Housing rehab requires extensive gutting and
investment in purchase in rehab will allow for very little profits to flip.
Manufactured the same as stick built so not a solution
Some single family – 3-4 bedroom. Multifamily. A little of everything to
make it work
Is there an adequate
supply of affordable
housing in our
community?
No. need senior and affordable family housing and rental properties
There is for someone that is working. The avg income is $59K – but that
does not buy much. Can a single mom make it work – I don’t know
Childcare with 2-3 kids – one parent stays home because of daycare
expense

52 Viola Housing and Workforce Study Appendix
What concerns do you
have about the existing
or future housing
demand or supply in the
area?
Unless you start to meet the demand, you will lose population. They can
work locally but they will be forced to live elsewhere. The housing stock
will continue to deteriorate. We work in fringe neighborhoods and can
save them. Some other areas will be unrecoverable and will increase
health issues related to mold and other issues. There will continue to be a
demand and there is a lack of new construction – both affordable and
market. There is a lack of inventory and I think the supply will continue to
dissipate. Having a rental code to ensure base standards. This could
prevent some and require some update. Mold is a big issue. Structural
issues need to be addressed. What looks good on the outside can still be
in great need of refurbishment on the inside.
The lack of upkeep/maintenance concerns. Affordable housing – for public
rent – the property owners neglect a lot. For affordable rent – we will see
a decline in available. The County needs the City to be booming to draw
more people in. A mixture of new housing needs demand from new
industry to be successful
What kind of person is in
most need of affordable
housing?
Families and seniors. Workforce housing for employees. The whole
spectrum.
A vulnerable adult still living independently

53 Viola Housing and Workforce Study Appendix
Table D.4 Viola Employer Responses
Question Response
How would you
describe the current
housing market?
In need of improvement – need availability and proper pricing – priced too
high for what you get. Biggest is entry level workers, just entering the
workforce - $25-35,000/year, non-skilled employee. We have 37 employees
– only 2 at the moment are entry level.
Brutal, sellers’ market, driving up costs, hard to find an affordable and
livable without major reworking. Very expensive house or $35,000 with
needing $100,000 of rework.
Lacking – not enough and not quality. Short on housing before flood.
Houses sell within a week.
Is there currently a
strong demand for
housing?
My employees are settled, but when I want interns, there are housing
issues there. Young professionals in general such as teachers and new
engineers – wages too high for subsidy and not high enough for something
nice. Live in ghetto-like situation. 30 somethings moving back have no place
to move to. Low income is nicer than market rate. Affordable needs lots of
work or in smaller lot or in city when that is not preferred.
Yes (x2)
What type of housing
is there a demand for?
1-2-bedroom house or apartments – will take either. Could own or rent.
Hard to own due price of 2-acre house in country. End up in cities.
Single family homes and apartment.
Family single – 2 bedroom + 2 baths. Need low to moderate. $400- 500.
Some owned some rental.
What do you predict
for the next 10 years in
the housing market?
It will be stationary. Unless big businesses move to town, will not see
growth.
La Crosse and Platteville – entry level housing is unreasonable – demand for
young professional – single family. No need for large single-family home.
20/30 somethings may be living longer at their parents’ home and moving
to “second home” size instead of starter. Second home – like on the home
shows – smaller footprint but great finishes and open concept, etc. Needs
to be pet friendly.
Investigated building a fourplex – banker said was not able to be profitable
if rented at entry level employee rates – not enough profit to take the risk.
And the hassle of being a landlord. Did not want to build low income
housing – wanted market rate. Most teachers at Kickapoo to live in Prairie
and Viroqua
Starting out want to rent – have high student debt – not sure how long it
will last so want flexibility in home.
It will be tight and need more. Westby and Viroqua will also be tight. OV
and Macro will grow and need more.

54 Viola Housing and Workforce Study Appendix
If we are proactive about the downtown it will grow, do nothing it will tank.
What evidence do you
have of the current
housing demand?
No stock.
It took 9 months to move to the area. Had to move to Reedsburg.
Displaced from flood. More houses needed than we have – demand.
Schools refer families. Strong school. Strong business.
What % of your
employees rent?
40%.
Rent – 20%. Own – 80%.
What relationship do
you see between
housing availability and
your ability to expand
or grow your
business?
Direct relationship, but no significant need presently.
It is a hurdle to bring in new talent – if no houses.
More houses more potential for business. More demand.
Is there adequate
housing for all levels of
employees in the
region?
No (x2)
No – teachers live out of town and employees live out of town.
How has housing
played a role in
recruiting new
employees?
No, but it could because of lack of entry level starter homes and
professional level homes.
It is a hurdle. Most everybody has a 15 to 35-minute commute – and prefer
to ride bike so closer is better.
Not an issue.
What percent of your
employees live in the
same community as
your business? Why do
others live elsewhere?
Within 10 minutes – 50%. Many in LaFarge and Reedstown – adds 25%.
Lives close.
What types of housing
would you like to see
built?
Single family – 1-2 bedroom.
Single family homes and apt.
Apartment complex like La Farge. Assisted living or Reedstown – 55+ space
If you were an
investor/developer,
what would you build?
Single family.
New build in Reedsburg – 4 apartments to a building - $800/mo. $600
better – fourplex would be better.
Entry level.
Majority of the single people. Close knit community. Youngers still living at
home – can’t strike out on their own. Needs a grocery store.

55 Viola Housing and Workforce Study Appendix
What kind of person is
in most need of
affordable housing?
Most of the town.
How often is your
workforce affected due
to employee
transportation issues?
Most everyone has a car. Some are of marginal quality. There are
breakdowns.
Not an issue.
How often is your
workforce affected due
to employee child care
issues?
Greatly. We are struggling to open a childcare center, required trainings,
and profit margins too tight. Lean on family members. Co-founders
daughter running with it
Big issue. Sometimes kids come to work – is no childcare.
Does your business
foresee changes in the
existing workforce or
changes in your
workforce demand?
Yes.
The potential is if we grow into a grocery store.

56 Viola Housing and Workforce Study Appendix
E. Developer Response
Table E.1 Developer Responses
Question Response
How would you
describe the current
housing market?
Senior Assisted Living – not full. Middle Range will fill up. $150 to $180,000 can move
up to next house if were available. Older folks to move off the farm. 2 bedroom -
$700. 3 bedroom - $850. Assisted living housing - $550/mo.
Strong – Occupancy rates and rental are high.
It depends on who. The market differs on who is looking to buy. Demand for
workforce housing is very large at the moment.
From a building standpoint = Tough. (Fed made a massive rate hike. It was around
5.2% now I’m getting 5.7% and climbing.) Money is getting expensive. We keep an
eye on interest rates. From a getting residents standpoint = extremely healthy. If you
need residents you will get them in.
Active.
People are looking at the cost of a used house vs. new house. Appears there is a
significant demand, but banks are tightening up lending and there could be a
shortage of labor. Still a fair number of houses being built but does not know if there
is a shortage of housing. Skilled labor and trades worker shortages.
Biggest challenge from apartment focus is a tie to the old dream of homeownership.
But there are not a lot of great comparable for high quality apartments in the area.
This creates a stigma.
The thing about SW Wisconsin area is that there are very low rents and the
construction costs are high because there are not a lot of contractors in the
immediate area. Two forces that work against each other. Different than at the state
level. Does not a see a lot of high employee employers. Not a lot of large employers
to bring people into the area. Not a lot of huge demand in the SW region. There was
no confidence in an investment that demand would supply. Why update or build new
if there is no demand and people. Perception is that the demand is not real.
Very Good in Kieler area.
Poor.
In the last 3 years, a lot of need. My employees needed housing. There is a long
waiting list for housing.
What types of housing
do you build? Why?
Single family, stick residential.
Market rate and affordable. Multifamily.
High-end multifamily and some section 42 housing. Multi-family market has been
strong in the Madison market in the recent past.
Everything. Specialize in tax credit housing, senior housing, and adaptive reuse on
historic properties.
Why? It’s the opportunities that came about. Now we have a model. We do a lot in
Iowa. They allow residential TIFs or set asides for housing development. In Wisconsin,
now we can do workforce housing TIFs. We ask the community what they need. We
need to know we have a partner.
Build upscale/quality single family but will build other demands. Also work on some
small commercial stuff.

57 Viola Housing and Workforce Study Appendix
We have a big focus on Affordable Housing. Section 42 and bond transactions. We do
all types of design. Historic preservation/adaptive reuse, ground-up new
construction, single story cottage, 2-3 story townhouses, family and senior, new, and
preservation housing.
This allows us to serve a broader population. We can serve a variety of communities
We build two types of housing. Affordable with WHEDA program. Focus is because
the equity that comes in is based on fee. Challenged areas that are low income with
a demand to upgrade housing, construction cost is subsidized with the tax credits.
Most places lease up within 6 months. Not sure if properties would lease up.
Single family and duplex homes, that is what people are looking for.
Family
Multi-family – 4 unit to 6 unit – up to 120 units.
Is there currently a
strong demand for
housing?
Yes (x5)
“I believe so.” Yes, but can you get the math to work? Can you avoid outpricing yourself
and avoid cannibalizing your community?
$100K - $200K single and duplexes.
Medium demand for single family houses. Enough to keep busy but not enough to
expand operations.
Strong demand everywhere we go. There just aren’t great high-quality affordable
housing options and very few comparable.
State level, yes there is a strong demand because employment is high, areas with big
employer’s drive workforce housing demand. Not a lot of high workforce demand in
SW Wisconsin.
Yes, very few single family and duplex lots available in the area.
What type of housing is
there a demand for?
$150 – 225 range, single family, 3+ bedrooms, Young families with 3+ kids.
Affordable, market rate, and high end.
There is a strong demand for affordable, low maintenance, single family housing.
The need for workforce housing is the need for affordable single-family homes. From
the prospective of a business, Workers need to be able to have ownership.
Ownership helps people stay grounded, be better neighbors, workers, and helps
build wealth both individually and as a community.
All. There is a shortage of senior specific housing. Another big piece is multifamily
that is missing. Not enough. And, each community decides if it needs/wants
multifamily.
Location, 3 bedrooms, 2 baths.
Commercial “rental” has a strong demand but not sure about continuing demand.
Believe it is likely a 50/50 demand single family/ multi-family demand.
There is a disconnect in our region. There is a demand for single family in our region,
but this doesn’t line up with the economics. The narrative of apartments needs to
change.
Single family and apartments, apartments are a greater demand because people
have less expectations of staying in a job for a long period of time.
Single family homes and duplex.
Family.
I have lived here since 2003, I think multi and single family, but more multi.

58 Viola Housing and Workforce Study Appendix
What do you predict
for the next 10 years in
the housing market?
An uptick.
Increasing demand for quality housing – rentals.
Multi-family boom will end as it is overbuilt. Lenders will be burnt on multi-family
units and things might get worse. I would expect to see more multi-generational
households unless wages begin to rise.
Might be slow to go, but it sorts itself out. Not sorted now. Communities can be
creative to make a difference. It will stabilize and housing is always needed.
Stays the same.
A steady incline over the next 10 year, no foreseeable booms or busts. People tend to
move away from the area as they grow older. If new businesses came in there could
be a boom.
Speaking to apartments, demand will continue to grow. The economy is shifting
strong to rental. Single family home ownership may tick up but not at pre-recession
levels.
The state of Wisconsin – the construction costs are out of control due to demand for
materials and labors as well as rising interest rates. He expects that rents will drop.
The whole process will come in the next two years, followed by a two – three years of
WHEDA-only deals. Apartments are being overbuilt. Supply of housing will go up for
the next 2 years, drop/crash and be stagnant for 5 – 7 years.
Existing development has 83 single family home lots for sale and 20 duplex lots, I
would like to see all lots sold in the next 10 years.
Slow.
I have built for 20 years, we cannot keep up with demand, we are behind.
What determines a
strong market?
Seeing median home prices inflating by 25-30% now.
Strong occupancy. Increasing rental rates.
Supply. Lack of Supply. It is a seller’s market.
Job stability is the biggest. What you don’t want right now is 40% of the population
working for 1 employer. Got to have strong small business in rural. Need
entertainment.
Not many houses for sale.
If cost of materials went down, people could afford new homes. If there were more
jobs or higher paying jobs.
Occupancy, jobs/workforce levels, and commuting patterns.
Single Family Homes - Cost, individual buyer financing, millennials see it as a huge
leap to buy a suburban home. Generational Shift feels like it at the moment.
Multi-Family Homes - Financing challenge will come up. Construction costs will
outpace rents as they drop. Banks will get burned when apartments are overbuilt.
Low Cost Homes - Buyer Financing is to reach the customer with financing. The lower
cost of the home the harder for the customer to get financing.
Jobs.
Building.
More demand than supply.

59 Viola Housing and Workforce Study Appendix
What are the top
obstacles to
development.
Single Family Homes? Finding an affordable lot. Multi-Family Homes? Space to build.
Low Cost Homes? Materials and labor, interior finishing, and exterior finishing.
Multi-Family Homes and Low-Cost Homes? Apartments – construction costs are high,
rental rates are too low, lack of subsidy to support the housing.
Affordability.
Single family is easy. They just don’t do spec here, so it’s slow. Multi Family - Rates,
costs, and labor are outpacing rents. How far can that bend? The pool of funds is
getting smaller. Only builders and cities can make up the gap. The gap is the obstacle.
Recognize in this new world we need to meet in the middle. Low Cost - That house
does not exist to do it currently. The city would have to subsidize and ask for proof
that this is the price you will sell it. So, the city would offer the gap if builder builds
spec home with proof of occupancy.
Permits, Financing.
Single Family - What banks are willing to loan out compared to what new homes
actually cost. (cost of building a house for $400K could be appraised at $380K). Low -
Cost - Cost of materials. $150 - $160, 10 years ago it would have been $100- $110.
Drywall prices are increasing by 20% per year for the past 7 years.
Single Family Homes: Cost. It is not economically feasible. The size of homes people
are building. It’s too hard to build smaller homes on a smaller lot. Maintenance of a
single-family home is large. Multi-Family Homes: Rising construction costs. Lack of
labor force. Challenge of getting sites rezoned for apartments, but this is getting
better. Low Cost Homes: City codes don’t let you build because of lot size restrictions,
building material standards, being able to build affordably. The only ones building
low cost homes now is Habitat for Humanity.
Rent burdened individual, rent is over 30%. These can also be the most stable person
but they cannot make ends meet.
Must be managed and a lot of time put into develop good covenants that will allow
all size home built that enhance the development.
Single Family and Multifamily Homes: Small communities - Painting a vision and then
having the buy-in. Helping governments to move faster. The need is there. Low Cost
Homes: We build for other owners, we don't own them. Many people ask for them,
we have to tailor the right way so local government and public accept them.
What kind of person is
in most need of
affordable housing?
Everybody that qualifies, seniors, Veterans, young families.
Working Class, and on down. Families that struggle.
Persons with income averaging 30, 40, 50, and 60% of what an average person
makes. This is a moving target. Senior communities are the type of people.
Single Parent – Family.
Starter homes. Younger Families.
Those at risk: Veterans, People with Disabilities, minimum wage workers, seniors on
fixed incomes, single parent families, the Mainstreet workforce, and administrative
and support staff.

60 Viola Housing and Workforce Study Appendix
Empty nesters are interested leaving their homes and not buying condos. People hate
condos. They want upscale apartment with no ownership commitment. Millennials
want smaller lower cost apartments in an amenity rich community. Also loving the
flexibility of not buying a home. Debt burdened families that would love to not spend
time upkeeping their home would rather have an affordable apartment with a family
friendly amenity that is secure. 3-bedroom apartments are secure, no taxes,
amenities, and limited maintenance. The 3-bedroom apartment is the flip from
homes. School are suffering, no employers.
Young families just getting started.
Low income.
We had 150 people some to our open house. Seniors most need affordable.
What generational
issues do you take into
account in
development?
If we are on workforce housing, we try to incorporate millennial like features: High
speed WIFI, great building design, amenities – business and fitness centers. Senior
Housing – programming space for pot luck, community rooms, exercise classes.
Opinion is that there should be more family housing built – that families should be
taking care of their family more often in the same house. Building more “senior
facilities” may cause problems in the future
.
We’ve put senior buildings next to multifamily buildings. This isn’t really a discussion.
Does this community have a long-term growth plan? I want turnover with families
though. Churn is good here.
Younger people and older people do not want as large of a yard and issues for
maintenance.
a) We build a lot of single-family cottage style to be able to get seniors into
apartment living. It gets seniors out of homes that they can’t maintain.
b) Certain generations were taught to OWN a home, the younger generation is much
more open to renting.
Long term.
We try to cater to multi-general. Hard to please everyone. Gen X want WIFI, but so
does older gen – so we built it in to new building.
What incentives are
there for developers?
What more could be
done?
Incentives – do not know. It would be nice – loan the money to flippers – and pay
back – everyone wins. Building a spec house – you still need 20% to front – need
$100,000.
Affordable housing tax credit, state affordable tax credit, WI historic credits, Fed
historic credits, Brownfield grants, SAT grants, Idle fund grants, CDI grant, home
funds, TIF, TID, Municipal support such as free land or rent subsidy funds, private
foundation money. MORE Could be done: More incentives to market rate
development.

61 Viola Housing and Workforce Study Appendix
Cities need to open TIFs. Cities need to cut bureaucracy for developers, developers
don’t want to deal with it. If a city bought the land, installed utilities, and allowed the
developer to build the houses, projects would be more attractive to developers.
Cities could even deed restrict the land and work with the developer to set a price for
the cost of a home. The home would need to be purchased by an owner-occupied.
The Pay-Go version of TIF is not worth it for developers due to the costs of capital
and because the developer is taxed at 40% on the increment. Cities need to make the
investment in their future and the businesses, if they want additional workforce
housing, need to put pressure on the local politicians. Businesses are key, if they do
not offer buy-in then there is something missing from the equation. If businesses
want it, they need to invest.
a) If there is no cash in budget, see if you can use sewer or other funds where
developers need to put in infrastructure like lift stations.
b) TIF
c) Work money into a set aside to be ready to offer.
d) City owned land, for two reasons. 1) I don’t have to worry about control. 2) Speed.
e) The old-fashioned waving of some fees. This one doesn’t work anymore.
f) Brainstorming with the community.
g) Trust. Trust that your developer is your partner.
TIF money usually gets taken care of through business. There is not a lot of land
development. Owners in the past have developed in a subdivision, but the slow rate
of sales causes the rate of return to diminish. We are able to make up for it by
building the homes. The current owner paid for the development. Better rates of
return can be found in other places. The lot development is not lucrative unless the
Company is also building the homes.
Community – TIF is a huge tool. Land banking. Home CDBG funds. Waiver of impact
fees. State/Fed – Historic Tax Credits. Affordable Housing Tax Credits. There are other
specific Fed and State programs. What more? – Be friendly to developers. Talk
through what the city can do. The city needs to lay out what the city needs.
TIF. Historic Tax Credits and LIHTC. Free land. Which will bring rents down. LITECH
deal. The Library in Platteville was a big deal by WHEDA. Get buy-in from the local
growth industries. This is a big deal.
Our incentives have always been trying to move my home town forward with good
jobs and affordable housing.
None.
What can government do to help retirees get a good home – help is needed to bridge
the gap. More incentives would be welcomed.
Is the free enterprise
system solving the
need?
No.
No. Rental rates are too low to build quality housing. Only works in large metro areas
and higher income communities.
No, because of wage depreciation, land costs, and the costs of bureaucracy.
No, this takes a group effort.
There is a profit, but the rate of return is not as high. We have bought discount
developments from others that have failed. Have not used gov. programs.

62 Viola Housing and Workforce Study Appendix
“Definitely not.” There is such a lack of affordable housing. 50% of the population is
paying more than ½ their income on housing. This is not sustainable. There is such a
separation between the haves and the have-nots and it’s continuing to grow.
Not in SW Wisconsin, “Not even close.”
Yes.
None.
Need incentives to bridge gap.
Do government
programs help?
No, don't know about them.
Yes. No affordable housing without gov. support.
Yes, but not enough and not always worth it. Compliance is tough to maintain for
some programs. Once you take the money compliance needs to be maintained.
Yes, 100%. I am a staunch supporter of Tax Credit and WEDC.
Help develop more properties but tend to hurt other local developers. Developers
that come into a town to build LI housing do not tend to use local labor or local
materials. Drive down housing value in the area. Also allows people to utilize
government funds rather than do manual labor.
Yes, but there needs to be more. HUD related items just push to keep the status quo.
Hud funding is 1/10th of what is necessary for the population in need.
Yes, WHEDA.
Some people yes, I never use them.
Yes.
Are infill/
redevelopment/
rehabilitation projects
attractive? Why or why
not? What can make
them more attractive?
They would be. The market is inflated, so too expensive now. Low interest loans
would make them more attractive. Streamline red tape.
Yes – if they are historic buildings – and large enough – 70-unit infill. More attractive
– rental rate subsidy, more incentive, higher rental rates, great locations.
Again, free land and sustainable programs.
It depends. (I have $40 million of infill redevelopment.) Lots of uncertainty. New or
other funding sources, soften or solve the unknown that arises, and partner. Don’t
make me fight.
Renovate or Rehab projects are valuable to the community but the return on the
investment is not high enough for most to do it. If there were more funds available
for Historic Preservation or rehabilitation funds. Not much infill options available but
would be attractive.
Definitely. We focus a lot on these. It’s a great way to promote affordable housing in
those areas. Redevelopment can be a community catalyst. Make sure these are in TIF
districts or have resources lined up like Brownfield grants. Then, we can make more
educated development decisions. Also, work with environmental consultants to get
environmental cleanup grants.
They are, especially if they are historic. Will be done in Dodgeville, Monroe,
Platteville.
Not to me but there are groups who like this type of development.
Yes.

63 Viola Housing and Workforce Study Appendix
What housing
characteristics are in
demand from the
general population?
Open concept, less carpet, more synthetic wood, cooler design, downtown
developments.
Affordability and low maintenance. Efficient. Nearby amenities and work.
This is a question between what is wanted vs. what is profitable. The wants are:
counters & cabinets, aesthetics, something to do other than just live, a place to hang
out with neighbors, and the location being close to access the “stuff” in and around
town.
Location, 3 bedrooms, 2 baths.
Medium price range and lower price range homes are in demand. A spec house in the
1600 ft range is attractive to an older couple and younger family. Around $300 -
$325K is the cost, 10 years ago it was around $200K. Wages have not kept up to the
increase in housing costs.
In Wisconsin, there is a lot of demand for attached or underground parking. Big focus
on storage. In unit washers and dryers. Gardens for residents. Pet Friendly.
Affordability. Open Concept. Connected Kitchen.
Affordable.
Any kind.
What can be done to
incentivize new home
construction?
Lower tax rates on apt. to lower operational costs. Downtown development – mixed
use commercial/retail does not work, better to have all residential. Retail is hard to
fill. Rental rates are too low.
City offers the land and the infrastructure up front.
Do the math for the developers. Find the net cost. Find the willingness to pay. Fill the
gap. If the city’s desired price of the home is $185,000 for the end user, manufacture
the deal to get the builder to that number because the cost isn’t there. Subsidize.
Banks need to lower the barriers to lending. Building materials need to drop in costs.
TIF incentives – up front money to the developer.
1) It Starts at Planning – Zone Sites for apartments.
2) Brownfield grants – go for them.
3) Set aside CDBG resources for new homes.
4) Get employers to the table to talk about workforce attraction. Make the
community attractive.
5) TIF targeted areas.
6) Make it clear that housing is part of Economic Development.
Need a government sponsored risk share. Where a home is less affordable than 3-
bedroom apartment.

64 Viola Housing and Workforce Study Appendix
F. Local, State, and Federal Housing Financial Incentives, Programs, and Tools.
Table F.1 Local, State, and Federal Housing Programs and Tools
Agency/Tool Program
WHEDA (Wisconsin
Housing and Economic
Development Authority)
WHEDA administers a variety of programs designed to assist moderate and low-
income homeowners and renters. Additionally, WHEDA works with local, state, and
national developers to encourage affordable and workforce housing projects. This
is done by providing developers with income tax credits when they invest in these
types of housing developments. Tax credits are allocated to housing projects on a
competitive basis. Local government support is an important fact in the award of
tax credits.
WHEDA also provides loans to low- and moderate- income elderly homeowners to
help pay local property taxes, so that the elderly can afford homeownership. The
WHEDA website contains up-to-date information on available programs.
www.wheda.com
USDA Rural Development
Agency Programs
USDA Rural Development offers several programs to assisting in home purchase,
rehabilitation, and development.
Individuals and families are eligible for direct loans and loan guarantees for
purchasing, rehabilitating, and/or weatherizing a home.
Direct loans and loan guarantees are available to individuals, non-profit and for-
profit organizations, and public bodies for the development of affordable rental
housing.
Community development assistance grants are also available for private or public
non-profit organizations.
HUD Home Consortium -
US Department of
Housing and Urban
Development (HUD).
The US Department of Housing and Urban Development (HUD) offers a variety of
housing assistance funding and/or programs that can be utilized by local
governments. Many of these funds/programs are administered at the state or
regional level through local community based and/or housing organizations such as
SWCAP, Couleecap and NHSSW. An alternate approach that could be considered
by counties and communities of southwest Wisconsin is creation of a HUD HOME
Consortium. A consortium may enhance access to and create local efficiencies in
administering HOME funding. It is likely that Crawford, Grant, Green, Iowa,
Lafayette, and Richland could be included in a consortium model with the addition
of Sauk County.

65 Viola Housing and Workforce Study Appendix
Affordable Housing
Extension (AHE) for
existing TIF Districts.
Added to TIF law in 2009, this provision allows TIF districts to stay open for an
additional year if the municipality adopts a resolution extending the TIF district for
a specified number of months (up to a year) and specifies how the municipality will
improve its housing stock, and informs the Department of Revenue of the
resolution. The municipality must use 75% of the tax increment to “benefit
affordable housing.” Affordable housing is housing that costs no more than 30% of
household income.
Housing Cost Reduction
Initiative (HCRI)
The WI Department of Administration’s Dept of Housing and Community Resources
(DEHCR) awards funding to local public and non-profit housing agencies
throughout Wisconsin to reduce housing costs for low- and moderate- income
households. Funds are awarded to agencies through a competitive application
process. Eligible activities may include: down payment/closing cost assistance,
foreclosure prevention measures, emergency rental aid, and related housing
initiatives. In southwest Wisconsin, the HCRI program is administered by
SWCAP, www.swcap.org, Couleecap www.couleecap.org , and
NHSSW www.nhssw.org.
Community Development
Block Grat (CDBG) –
Housing Programs.
The CDBG Housing program provides funding using a regional funding
approach. There are 7 identified Housing Regions in WI, each receive funding
through the State of WI to support single family housing rehabilitation, home
purchase and limited rental property rehabilitation benefiting low- and moderate-
income households. Southwest WI Region CDBG Housing Programs are
administered by Couleecap www.couleecap.org and SWCAP www.swcap.org.
Community Development
Block Grants (CDBG) –
Public Facility Programs.
CDBG Public Facility Program funds small neighborhood public facility
projects. Any Wisconsin county, city, village, or town with a population less than
50,000 is eligible to apply for CDBG public facility grants/funds.
HOME: Single Family
Housing Programs.
The WI Department of Administration’s Dept of Housing and Community Resources
(DEHCR) awards HOME Funding to local units of government and housing
agencies. HOME Single Family Housing funds are typically used to provide down
payment and closing cost assistance for home buyers as well as single family home
rehabilitation. Agencies administering HOME Single Family Housing funds in
Southwest Wisconsin include: SWCAP (www.swcap.org), Coulee CAP
(www.couleecap.org) and NHSSW www.nhssw.org
HOME Rental Housing
Development (RHD).
The RHD program seeks to expand the rental housing market available to low and
moderate-income individuals. Grants are available for acquisition, rehabilitation,
and new construction of rental housing units. The RHD program is a State
administered program utilizing federal funds.
Wisconsin’s
Weatherization
Assistance Program.
The WX Program provides funding for energy saving improvements to homes
occupied by low- and moderate-income families with priority for households with
elderly, handicapped and children under age 6. Owner occupied, rental, and multi-
family housing may be assisted. Energy audits are completed to determine what
weatherization services are needed, the identified improvements are then
completed by agency crews and subcontractors typically at no cost to the
family/owner. SWCAP www.swcap.org , operates WX Programming in most
Southwest WI Counties. Additional programs may be available at the local county
or community planning and zoning office.

66 Viola Housing and Workforce Study Appendix
U.S. Veterans
Administration Programs.
(VA)
The VA provides low-cost loans and other housing assistance to veterans.
http://dva.wi.gov .
203K Loans (Federal
Housing Administration,
FHA)
203K Loans are utilized to borrow money, in a single loan, for both home
improvements and home purchases. 203K loans allow for funding of significant
repairs to properties. The FHA guarantees these loans, creating less risk for local
lenders who may not be inclined to provide loans for a property above the current
assessed value. Local lenders are the point of contact on these programs. Loans
require certified contractors and a third party to approve the improvement costs.
Brownfield
Redevelopment Grants
(Wisconsin Economic
Development
Corporation, WEDC)
Wisconsin’s Brownfields Grant Program provides assistance for assessment and
remediate of environmental contamination of abandoned, idle or underused
industrial or commercial facilities or sites. The program assists in converting sites
into productive properties. Grants require a 50 percent match. Additional details
can be found at www.wedc.org .
Historic Preservation
Grants (Wisconsin
Historical Society)
Federal and State historic tax credits are available for the rehabilitation and
preservation of historic structures. The Federal Historic Tax credit program offers a
20 percent tax credit on qualifying income producing properties. The Wisconsin
Historic Tax Credit also offers a 20 percent tax credit for qualifying properties.