Embed Size (px)
Citation preview

Vinayagamoorthy, M. "Maintenence Inspection and Rating." Bridge Engineering Handbook. Ed. Wai-Fah Chen and Lian Duan Boca Raton: CRC Press, 2000
49Maintenance Inspection
and Rating
49.1 Introduction
49.2 Maintenance Documentation
49.3 Fundamentals of Bridge InspectionQualifications and Responsibilities of Bridge Inspectors • Frequency of Inspection • Tools for Inspection • Safety during Inspection •Reports of Inspection
49.4 Inspection GuidelinesTimber Members • Concrete Members • Steel and Iron Members • Fracture-Critical Members • Scour-Critical Bridges • Underwater Components • Decks • Joint Seals • Bearings
49.5 Fundamentals of Bridge RatingIntroduction • Rating Principles • Rating Philosophies • Level of Ratings • Structural Failure Modes
49.6 Superstructure Rating ExamplesSimply Supported Timber Bridge • Simply Supported T-Beam Concrete Bridge • Two-Span Continuous Steel Girder Bridge • Two-Span Continuous Prestressed, Precast Box Beam Bridge • Bridges without Plans
49.7 Posting of Bridges
49.1 Introduction
Before the 1960s, little emphasis was given to inspection and maintenance of bridges in the UnitedStates. After the 1967 tragic collapse of the Silver Bridge at Point Pleasant in West Virginia, nationalinterest in the inspection and maintenance rose considerably. The U.S. Congress passed the FederalHighway Act of 1968 which resulted in the establishment of the National Bridge Inspection Standard(NBIS). The NBIS sets the national policy regarding bridge inspection procedure, inspection fre-quency, inspector qualifications, reporting format, and rating procedures. In addition to the estab-lishment of NBIS, three manuals — FHWA Bridge Inspector’s Training Manual 70 [1], AASHOManual for Maintenance Inspection of Bridges [2], and FHWA Recording and Coding Guide forthe Structure Inventory and Appraisal of the Nation’s Bridges [3] — have been developed and
Murugesu VinayagamoorthyCalifornia Department
of Transportation
© 2000 by CRC Press LLC

updated [4–10] since the 1970s. These manuals along with the NBIS provide definitive guidelinesfor bridge inspection. Over the past three decades, the bridge inspection program evolved into oneof the most-sophisticated bridge management systems. This chapter will focus only on the basic,fundamental requirements for maintenance inspection and rating.
49.2 Maintenance Documentation
Each bridge document needs to have items such as structure information, structural data and history,description on and below the structure, traffic information, load rating, condition and appraisalratings, and inspection findings. The inspection findings should have the signature of the inspectionteam leader.
All states in the United States are encouraged, but not mandated, to use the codes and instructionsgiven in the Recording and Coding Guide [8,9] while documenting the bridge inventory. In orderto maintain the nation’s bridge inventory, FHWA requests all state agencies to submit data on theStructure Inventory and Appraisal (SI&A) Sheet. The SI&A sheet is a tabulation of pertinentinformation about an individual bridge. The information on SI&A sheet is a valuable aid to establishmaintenance and replacement priorities and to determine the maintenance cost of the nation’sbridges.
49.3 Fundamentals of Bridge Inspection
49.3.1 Qualifications and Responsibilities of Bridge Inspectors
The primary purpose of bridge inspection is to maintain the public safety, confidence, and invest-ment in bridges. Ensuring public safety and investment decision requires a comprehensive bridgeinspection. To this end, a bridge inspector should be knowledgeable in material and structuralbehavior, bridge design, and typical construction practices. In addition, inspectors should be phys-ically strong because the inspection sometimes requires climbing on rough, steep, and slipperyterrain, working at heights, or working for days.
Some of the major responsibilities of a bridge inspector are as follows:
• Identifying minor problems that can be corrected before they develop into major repairs;
• Identifying bridge components that require repairs in order to avoid total replacement;
• Identifying unsafe conditions;
• Preparing accurate inspection records, documents, and recommendation of correctiveactions; and
• Providing bridge inspection program support.
In the United States, NBIS requires a field leader for highway bridge inspection teams. The fieldteam leader should be either a professional engineer or a state certified bridge inspector, or a LevelIII bridge inspector certified through the National Institute for Certification of Engineering Tech-nologies. It is the responsibility of the inspection team leader to decide the capability of individualteam members and delegate their responsibilities accordingly. In addition, the team leader is respon-sible for the safety of the inspection team and establishing the frequency of bridge inspections.
49.3.2 Frequency of Inspection
NBIS requires that each bridge that is opened to public be inspected at regular intervals not exceeding2 years. The underwater components that cannot be visually evaluated during periods of low flowor examined by feel for their physical conditions should be inspected at an interval not exceeding5 years.
© 2000 by CRC Press LLC

The frequency, scope, and depth of the inspection of bridges generally depend on several param-eters such as age, traffic characteristics, state of maintenance, fatigue-prone details, weight limitposting level, and known deficiencies. Bridge owners may establish the specific frequency of inspec-tion based on the above factors.
49.3.3 Tools for Inspection
In order to perform an accurate and comprehensive inspection, proper tools must be available. Asa minimum, an inspector needs to have a 2-m (6-ft) pocket tape, a 30-m (100-ft) tape, a chippinghammer, scrapers, flat-bladed screwdriver, pocketknife, wire brush, field marking crayon, flashlight,plumb bob, binoculars, thermometer, tool belt with tool pouch, and a carrying bag. Other usefultools are a shovel, vernier or jaw-type calipers, lighted magnifying glass, inspection mirrors, dyepenetrant, 1-m (4-ft) carpenter’s level, optical crack gauge, paint film gauge, and first-aid kits.Additional special inspection tools are survey, nondestructive testing, and underwater inspectionequipment.
Inspection of a bridge prompts several unique challenges to bridge inspectors. One of the chal-lenges to inspectors is the accessibility of bridge components. Most smaller bridges can be accessedfrom below without great effort, but larger bridges need the assistance of accessing equipment andvehicles. Common access equipment are ladders, rigging, boats or barges, floats, and scaffolds.Common access vehicles are manlifts, snoopers, aerial buckets, and traffic protection devices.Whenever possible, it is recommended to access the bridge from below since this eliminates theneed for traffic control on the bridge. Setting up traffic control may create several problems, suchas inconvenience to the public, inspection cost, and safety of the public and inspectors.
49.3.4 Safety during Inspection
During the bridge inspection, the safety of inspectors and of the public using the bridge or passingbeneath the bridge should be given utmost importance. Any accident can cause pain, suffering,permanent disability, family hardship, and even death. Thus, during the inspection, inspectors areencouraged to follow the standard safety guidelines strictly.
The inspection team leader is responsible for creating a safe environment for inspectors and thepublic. Inspectors are always encouraged to work in pairs. As a minimum, inspectors must wearsafety vests, hard hats, work gloves, steel-toed boots, long-sleeved shirts, and long pants to ensuretheir personal safety. Other safety equipment are safety goggles, life jackets, respirator, gloves, andsafety belt. A few other miscellaneous safety items include walkie-talkies, carbon monoxide detec-tors, and handheld radios.
Field clothes should be appropriate for the climate and the surroundings of the inspectionlocation. When working in a wooded area, appropriate clothing should be worn to protect againstpoisonous plants, snakes, and disease-carrying ticks. Inspectors should also keep a watchful eye forpotential hazardous environments around the inspection location. When entering a closed bridgebox cells, air needs to be checked for the presence of oxygen and toxic or explosive gases. In addition,care should be taken when using existing access ladders and walkways since the ladder rungs maybe rusted or broken. When access vehicles such as snoopers, booms, or rigging are used, the safeuse of this equipment should be reviewed before the start of work.
49.3.5 Reports of Inspection
Inspection reports are required to establish and maintain a bridge history file. These reports areuseful in identifying and assessing the repair requirements and maintenance needs of bridges. NBISrequires that the findings and results of a bridge inspection be recorded on standard inspectionforms. Actual field notes and numerical conditions and appraisal ratings should be included in the
© 2000 by CRC Press LLC
standard inspection form. It is also important to recognize that these inspection reports are legaldocuments and could be used in future litigation.
Descriptions in the inspection reports should be specific, detailed, quantitative, and complete.Narrative descriptions of all signs of distress, failure, or defects with sufficient accuracy should benoted so that another inspector can make a comparison of condition or rate of disintegration inthe future. One example of a poor description is, “Deck is in poor condition.” A better descriptionwould be, “Deck is in poor condition with several medium to large cracks and numerous spalls.”The seriousness and the amount of all deficiencies must be clearly stated in an inspection report.
In addition to inspection findings about the various bridge components, other important itemsto be included in the report are any load, speed, or traffic restrictions on the bridge; unusual loadings;high water marks; clearance diagram; channel profile; and work or repairs done to the bridge sincethe last inspection.
When some improvement or maintenance work alters the dimensions of the structure, newdimensions should be obtained and reported. When the structure plans are not in the history file,it may be necessary to prepare plans using field measurements. These measurements will later beused to perform the rating analysis of the structure.
Photographs and sketches are the most effective ways of describing a defect or the condition ofstructural elements. It is therefore recommended to include sketches and/or photographs to describeor illustrate a defect in a structural element. At least two photographs for each bridge for the recordare recommended.
Other tips on photographs are
• Place some recognizable items that will allow the reviewer to visualize the scale of the detail;
• Include plumb bob to show the vertical line; and
• Include surrounding details so one could relate other details with the specific detail.
After inspecting a bridge, the inspector should come to a reasonable conclusion. When theinspector cannot interpret the inspection findings and determine the cause of a specific finding(defect), the advice of more-experienced personnel should be sought. Based on the conclusion, theinspector may need to make a practical recommendation to correct or preclude bridge defects ordeficiencies. All instructions for maintenance work, stress analysis, posting, further inspection, andrepairs should be included in the recommendation. Whenever recommendations call for bridgerepairs, the inspector must carefully describe the type of repairs, the scope of the work, and anestimate of the quantity of materials.
49.4 Inspection Guidelines
49.4.1 Timber Members
Common damage in timber members is caused by fungi, parasites, and chemical attack. Deterio-ration of timber can also be caused by fire, impact or collisions, abrasion or mechanical wear,overstress, and weathering or warping.
Timber members can be inspected by both visual and physical examination. Visual examinationcan detect the following: fungus decay, damage by parasites, excessive deflection, checks, splits,shakes, and loose connections. Once the damages are detected visually, the inspector should inves-tigate the extent of each damage and properly document them in the inspection report. Deteriora-tion of timber can also be detected using sounding methods — a nondestructive testing method.Tapping on the outside surface of the member with a hammer detects hollow areas, indicatinginternal decay. There are a few advanced nondestructive and destructive techniques available. Twoof the commonly used destructive tests are boring or drilling and probing. And, two of the nonde-structive tests are Pol-Tek and ultrasonic testing. The Pol-Tek method is used to detect low-densityregions and ultrasonic testing is used to measure crack and flaw size.
© 2000 by CRC Press LLC

49.4.2 Concrete Members
Common concrete member defects include cracking, scaling, delamination, spalling, efflorescence,popouts, wear or abrasion, collision damage, scour, and overload. Brief descriptions of commondamages are given in this section.
Cracking in concrete is usually large enough to be seen with the naked eye, but it is recommendedto use a crack gauge to measure and classify the cracks. Cracks are classified as hairline, medium,or wide cracks. Hairline cracks cannot be measured by simple means such as pocket ruler, butsimple means can be used for the medium and wide cracks. Hairline cracks are usually insignificantto the capacity of the structure, but it is advisable to document them. Medium and wide cracks aresignificant to the structural capacity and should be recorded and monitored in the inspectionreports. Cracks can also be grouped into two types: structural cracks and nonstructural cracks.Structural cracks are caused by the dead- and live-load stresses. Structural cracks need immediateattention, since they affect the safety of the bridge. Nonstructural cracks are usually caused bythermal expansion and shrinkage of the concrete. These cracks are insignificant to the capacity, butthese cracks may lead to serious maintenance problems. For example, thermal cracks in a decksurface may allow water to enter the deck concrete and corrode the reinforcing steel.
Scaling is the gradual and continuing loss of surface mortar and aggregate over an area. Scalingis classified into four categories: light, medium, heavy, and severe.
Delamination occurs when layers of concrete separate at or near the level of the top oroutermost layer of reinforcing steel. The major cause of delamination is the expansion or thecorrosion of reinforcing steel due to the intrusion of chlorides or salts. Delaminated areas giveoff a hollow sound when tapped with a hammer. When a delaminated area completely separatesfrom the member, a roughly circular or oval depression, which is termed as spall, will be formedin the concrete.
The inspection of concrete should include both visual and physical examination. Two of theprimary deteriorations noted by visual inspections are cracks and rust stains. An inspector shouldrecognize the fact that not all cracks are of equal importance. For example, a crack in a prestressedconcrete girder beam, which allows water to enter the beam, is much more serious than a verticalcrack in the backwall. A rust stain on the concrete members is one of the signs of corrodingreinforcing steel in the concrete member. Corroded reinforcing steel produces loss of strength withinconcrete due to reduced reinforced steel section, and loss of bond between concrete and reinforcingsteel. The length, direction, location, and extent of the cracks and rust stains should be measuredand reported in the inspection notes.
Some common types of physical examination are hammer sounding and chain drag. Hammersounding is used to detect areas of unsound concrete and usually used to detect delaminations.Tapping the surfaces of a concrete member with a hammer produces a resonant sound that canbe used to indicate concrete integrity. Areas of delamination can be determined by listening forhollow sounds. The hammer sounding method is impractical for the evaluation of larger surfaceareas. For larger surface areas, chain drag can be used to evaluate the integrity of the concretewith reasonable accuracy. Chain drag surveys of decks are not totally accurate, but they are quickand inexpensive.
There are other advanced techniques — destructive and nondestructive — available for concreteinspection. Core sampling is one of the destructive techniques of concrete inspection. Some of thenondestructive inspection techniques are
• Delamination detection machinery to identify the delaminated deck surface;
• Copper sulfate electrode, nuclear methods to determine corrosion activity;
• Ground-penetrating radar, infrared thermography to detect deck deterioration;
• Pachometer to determine the position of reinforcement; and
• Rebound and penetration method to predict concrete strength.
© 2000 by CRC Press LLC

49.4.3 Steel and Iron Members
Common steel and iron member defects include corrosion, cracks, collision damage, and overstress.Cracks usually initiate at the connection detail, at the termination end of a weld, or at a corrodedlocation of a member and then propagate across the section until the member fractures. Since allof the cracks may lead to failure, bridge inspectors need to look at each and every one of thesepotential crack locations carefully. Dirt and debris usually form on the steel surface and shield thedefects on the steel surface from the naked eye. Thus, the inspector should remove all dirt anddebris from the metal surface, especially from the surface of fracture-critical details, during theinspection of defects.
The most recognizable type of steel deterioration is corrosion. The cause, location, and extent ofthe corrosion need to be recorded. This information can be used for rating analysis of the memberand for taking preventive measures to minimize further deterioration. Section loss due to corrosioncan be reported as a percentage of the original cross section of a component. The corrosion sectionloss is calculated by multiplying the width of the member and the depth of the defect. The depthof the defect can be measured using a straightedge ruler or caliper.
One of the important types of damage in steel members is fatigue cracking. Fatigue cracks developin bridge structures due to repeated loadings. Since this type of cracking can lead to sudden andcatastrophic failure, the bridge inspector should identify fatigue-prone details and should performa thorough inspection of these details. For painted structures, breaks in the paint accompanied byrust staining indicate the possible existence of a fatigue crack. If a crack is suspected, the area shouldbe cleaned and given a close-up visual inspection. Additionally, further testing such as dye penetrantcan be done to identify the crack and to determine its extent. If fatigue cracks are discovered,inspection of all similar fatigue details is recommended.
Other types of damage may occur due to overstress, vehicular collision, and fire. Symptoms ofdamage due to overstress are inelastic elongation (yielding) or decrease in cross section (necking)in tension members, and buckling in compression members. The causes of the overstress shouldbe investigated. The overstress of a member could be the result of several factors such as loss ofcomposite action, loss of bracing, loss of proper load-carrying path, and failure or settlement ofbearing details.
Damage due to vehicular collision includes section loss, cracking, and shape distortion. Thesetypes of damage should be carefully documented and repair work process should be initiated. Untilthe repair work is completed, restriction of vehicular traffic based on the rating analysis results isrecommended.
Similar to timber and concrete members, there are advanced destructive and nondestructive tech-niques available for steel inspection. Some of the nondestructive techniques used in steel bridges are
• Acoustic emissions testing to identify growing cracks;
• Computer tomography to render the interior defects;
• Dye penetrant to define the size of the surface flaws; and
• Ultrasonic testing to detect cracks in flat and smooth members.
49.4.4 Fracture-Critical Members
Fracture-critical members (FCM) or member components are defined as tension components ofmembers whose failure would be expected to result in collapse of a portion of a bridge or an entirebridge [7,8]. A redundant steel bridge that has multiple load-carrying mechanisms is seldomcategorized as a fracture-critical bridge.
Since the failure to locate defects on FCMs in a timely manner may lead to catastrophic failureof a bridge, it is important to ensure that FCMs are inspected thoroughly. Hands-on involvementof the team leader is necessary to maintain the proper level of inspection and to make independent
© 2000 by CRC Press LLC
checks of condition appraisals. In addition, adequate time to conduct a thorough inspection shouldbe allocated by the team leader. Serious problems in FCMs must be addressed immediately byrestricting traffic on the bridge and repairing the defects under an emergency contract. Less seriousproblems requiring repairs or retrofit should be placed on the programmed repair work so thatthey will be incorporated into the maintenance schedule.
Bridge inspectors need to identify the FCMs using the guidelines provided in the Inspection ofFracture Critical Bridge Members [7,8]. There are several vulnerable fracture-critical locations in abridge. Some of the obvious locations are field welds, nonuniform welds, welds with unusual profile,and intermittent welds along the girder. Other possible locations are insert plate termination points,floor beam to girder connections, diaphragm connection plates, web stiffeners, areas that arevulnerable to corrosion, intersecting weld location, sudden change in cross section, and copedsections. Detailed descriptions of each of these fracture-critical details are listed in the Inspectionof Fracture Critical Bridge Members [7,8]. Once the FCM is identified in a bridge structure,information such as location, member components, likelihood to have fatigue- or corrosion relateddamage, needs to be gathered. The information gathered on the member should become a perma-nent record and the condition of the member should be updated on every subsequent inspection.
FCMs can be inspected by both visual and physical examination. During the visual inspection,the inspector performs a close-up, hands-on inspection using standard, readily available tools.During the physical examination, the inspector uses the most-sophisticated nondestructive testingmethods. Some of the FCMs may have details that are susceptible to fatigue cracking and othersmay be in poor condition due to corrosion. The inspection procedures of corrosion- and fatigue-prone members are described in Section 49.4.3.
49.4.5 Scour-Critical Bridges
Bridges spanning over waterways, especially rivers and streams, sometimes provide major mainte-nance challenges. These bridges are susceptible to scour of the riverbed. When the scoured riverbedelevation falls below the top of the footing, the bridge is referred to as scour critical.
The rivers, whether small or large, could significantly change their size over the period of thelifetime of a bridge. A riverbed could be altered in several ways and thereby jeopardize the stabilityof the bridges. A few of the possible types of riverbed alterations are scour, hydraulic opening,channel misalignment, and bank erosion. Scour around the bridge substructures poses potentialstructural stability concerns. Scour at bridges depends on the hydraulic features upstream anddownstream, riverbed sediments, substructure section profile, shoreline vegetation, flow velocities,and potential debris. The estimation of the overall scour depth will be used to identify scour-proneand scour-critical bridges. Guidance for the scour evaluation process is provided in Evaluating Scourat Bridges [11].
A typical scour evaluation process falls into two phases: inventory phase and evaluation phase.The main goal of the inventory phase is to identify those bridges that are vulnerable to scour (scour-prone bridges). Evaluation during this phase is made using the available bridge records, inspectionrecords, history of the bridge, original stream location, evidence of scour, deposition of debris,geology, and general stability of the streambed. Once the scour-prone bridges are identified, theevaluation phase needs to be performed. The scour evaluation phase requires in-depth field reviewto generate data for estimation of the hydraulics and scour depth. The procedure of scour estimationis outlined in Evaluating Scour at Bridges [11]. The scour depths are then compared with the existingfoundation condition. When the scour depth is above the top of the footing, the bridge wouldrequire no action. However, when the scour depth is within the limits of the footing or piles, astructural stability analysis is needed. If the scour depth is below the pile tips or spread footing base,monitoring of the bridge is required. These results obtained from the scour evaluation process areentered into the bridge inventory.
© 2000 by CRC Press LLC

49.4.6 Underwater Components
Underwater components are mostly substructure members. Since the accessibility of these membersis difficult, special equipment is necessary to inspect these underwater components. Also, visibilityduring the underwater inspection is generally poor, and therefore a thorough inspection of themembers will not be possible. Underwater inspection is classified as visual (Level 1), detailed(Level 2), and comprehensive (Level 3) to specify the level of effort of inspection. Details of thesevarious levels of inspection are discussed in the Manual for Maintenance Inspection of Bridges [2]and Evaluating Scour at Bridges [11].
Underwater steel structure components are susceptible to corrosion, especially in the low to highwater zone. Some of the defects observed in underwater timber piles are splitting, decay or rot,marine borers, decay of timber at connections, and corrosion of connectors. It is important torecognize that the timber piles may appear sound on the outside shell but be severely damagedinside. Some of the most common defects in underwater concrete piles are cracking, spalls, exposedreinforcing, sulfate attack, honeycombing, and scaling. When cracking, spalls, and exposed rein-forcing are detected, structural analysis may be required to ensure the safety of the bridge.
49.4.7 Decks
The materials typically used in the bridge structures are concrete, timber, and steel. Sections 49.4.1to 49.4.3 discuss some of the defects associated with each of these materials. In this section, thedamage most likely to occur in bridge decks is discussed.
Common defects in steel decks are cracked welds, broken fasteners, corrosion, and broken con-nections. In a corrugated steel flooring system, section loss due to corrosion may affect the load-carrying capacity of the deck and thus the actual amount of remaining materials needs to beevaluated and documented.
Common defects in timber decks are crushing of the timber deck at the supporting floor system,flexure damages such as splitting, sagging, and cracks in tension areas, and decay of the deck dueto biological organisms, especially in the areas exposed to drainage.
Common defects in concrete decks are wear, scaling, delamination, spalls, longitudinal flexurecracks, transverse flexure cracks in the negative moment regions, corrosion of the deck rebars, cracksdue to reactive aggregates, and damage due to chemical contamination. The importance of a crackvaries with the type of concrete deck. A large to medium crack in a noncomposite deck may notaffect the load-carrying capacity of the main load-carrying member. On the other hand, severalcracks in a composite deck will affect the structural capacity. Thus, an inspector must be able toidentify the functions of the deck while inspecting it.
Sometimes a layer of asphalt concrete (AC) overlay will be placed to provide a smooth drivingand wearing surface. Extra care is needed during the inspection, because AC overlay prevents theinspector’s ability to inspect the top surface of the deck visually for damage.
49.4.8 Joint Seals
Damage to the joint seals is caused by vehicle impact, extreme temperature, and accumulation ofdirt and debris. Damage from debris and vehicles such as snowplows could cause the joint seals tobe torn, pulled out of anchorage, or removed altogether. Damage from extreme temperature couldbreak the bond between the joint seal and deck and consequently result in pulling out the joint sealaltogether.
The primary function of deck joints is to accommodate the expansion and contraction of thebridge superstructure. These deck joints also provide a smooth transition from the approachroadway to the bridge deck. Deck joints are placed at hinges between two decks of adjacent structures,
© 2000 by CRC Press LLC
and between the deck sections and abutment backwall. The joint seals used in the bridge industrycan be divided into two groups: open joints and closed joints. Open joints allow water and debristo pass through the joints. Dripping water through open joints usually damages the bearing details.Closed joints do not allow water and debris to pass through them. A few of the closed joints arecompression seal, poured joint seal, sliding plate joint, plank seal, sheet seal, and strip seal.
In the case of closed joints, damage to the joint seal material will cause the water to drip on thebearing seats and consequently damage the bearing. Accumulation of dirt and debris may preventnormal thermal expansion and contraction, which may in turn cause cracking in the deck, backwall,or both. Cracking in the deck may affect the ride quality of the bridge, may produce larger impactload from vehicles, and may reduce the live-load-carrying capacity of the bridge.
49.4.9 Bearings
Bearings used in bridge structures could be categorized into two groups: metal and elastomeric.Metal bearings sometimes become inoperable (sometimes referred as “frozen”) due to corrosion,mechanical bindings, buildup of debris, or other interference. Frozen bearings may result in bending,buckling, and improper alignment of members. Other types of damage are missing fasteners, crackedwelds, corrosion on the sliding surface, sole plate rests only on a portion of the masonry plate, andbinding of lateral shear keys.
Damage in elastomeric bearing pads is excessive bulging, splitting or tearing, shearing, and failureof bond between sole and masonry plate. Excessive bulging indicates that the bearing might be tootall. When the pad is under excessive strain for a long period, the pad will experience shearing failure.
Inspectors need to assess the exact condition of the bearing details and to recommend correctivemeasures that allow the bearing details to function properly. Since the damage to the bearings willaffect the other structural members as time passes, repair of bearing damage needs to be consideredas a preventive measure.
49.5 Fundamentals of Bridge Rating
49.5.1 Introduction
Once a bridge is constructed, it becomes the property of the owner or agency. The evaluation orrating of existing bridges is a continuous activity of the agency to ensure the safety of the public.The evaluation provides necessary information to repair, rehabilitate, post, close, or replace theexisting bridge.
In the United States, since highway bridges are designed for the AASHTO design vehicles, mostU.S. engineers tend to believe that the bridge will have adequate capacity to handle the actual presenttraffic. This belief is generally true if the bridge was constructed and maintained as shown in thedesign plan. However, changes in a few details during the construction phase, failure to attain therecommended concrete strength, unexpected settlements of the foundation after construction, andunforeseen damage to a member could influence the capacity of the bridge. In addition, old bridgesmight have been designed for a lighter vehicle than is used at present, or a different design code.Also, the live-load-carrying capacity of the bridge structure may have altered as a result of deteri-oration, damage to its members, aging, added dead loads, settlement of bents, or modification tothe structural member.
Sometimes, an industry would like to transport their heavy machinery from one location to anotherlocation. These vehicles would weigh much more than the design vehicles and thus the bridge ownermay need to determine the current live-load-carrying capacity of the bridge. In the following sections,establishing the live load-carrying capacity and the bridge rating will be discussed.
© 2000 by CRC Press LLC

49.5.2 Rating Principles
In general, the resistance of a structural member (R) should be greater than the demand (Q) asfollows:
(49.1)
where Qd is the effect of dead load, Ql is the effect of live load, and Qi is the effect of load i.Eq. (49.1) applies to design as well as evaluation. In the bridge evaluation process, maximum
allowable live load needs to be determined. After rearranging the above equation, the maximumallowable live load will become
(49.2)
Maintenance engineers always question whether a fully loaded vehicle (rating vehicle) can beallowed on the bridge and, if not, what portion of the rating vehicle could be allowed on a bridge.The portion of the rating vehicle will be given by the ratio between the available capacity for live-load effect and the effect of the rating vehicle. This ratio is called the rating factor (RF).
(49.3)
When the rating factor equals or exceeds unity, the bridge is capable of carrying the rating vehicle.On the other hand, when the rating factor is less than unity the bridge may be overstressed whilecarrying the rating vehicle.
The capacity of a member is usually independent of the live-load demand. Thus, Eq. (49.3) is generallya linear expression. However, there are cases where the capacity of a member dependent on the live-load forces. For example, available moment capacity depends on the total axial load in biaxial bendingmembers. In a biaxially loaded member, the Eq. (49.3) will be a second-order expression.
Thermal, wind, and hydraulic loads may be neglected in the evaluation process because the likelihoodof occurrence of extreme values during the relatively short live-load loading is small. Thus, the effectsof the dead and live loads are the only two loads considered in the evaluation process.
49.5.3 Rating Philosophies
During the structural evaluation process, the location and type of critical failure modes are firstidentified; Eq. (49.3) is then solved for each of these potential failures. Although the concept ofevaluation is the same, the mathematical relationship of this basic equation for allowable stressdesign (ASD), load factor design (LFD), and Load and resistance factor design (LRFD) differs. Sincethe resistance and load effect can never be established with certainty, engineers use safety factorsto give adequate assurance against failure. ASD includes safety factors in the form of allowablestresses of the material. LFD considers the safety factors in the form of load factors to account forthe uncertainty of the loadings and resistance factors to account for the uncertainty of structuralresponse. LRFD treats safety factors in the form of load and resistance factors that are based on theprobability of the loadings and resistances.
R Q Q Qd l i
i
≥ + + ∑
Q R Q Ql d i
i
≤ − +
∑
RFAvailable capacity for the live-load effect
Rating vehicle load demand= =
− +
∑R Q Q
Q
d i
i
l
© 2000 by CRC Press LLC
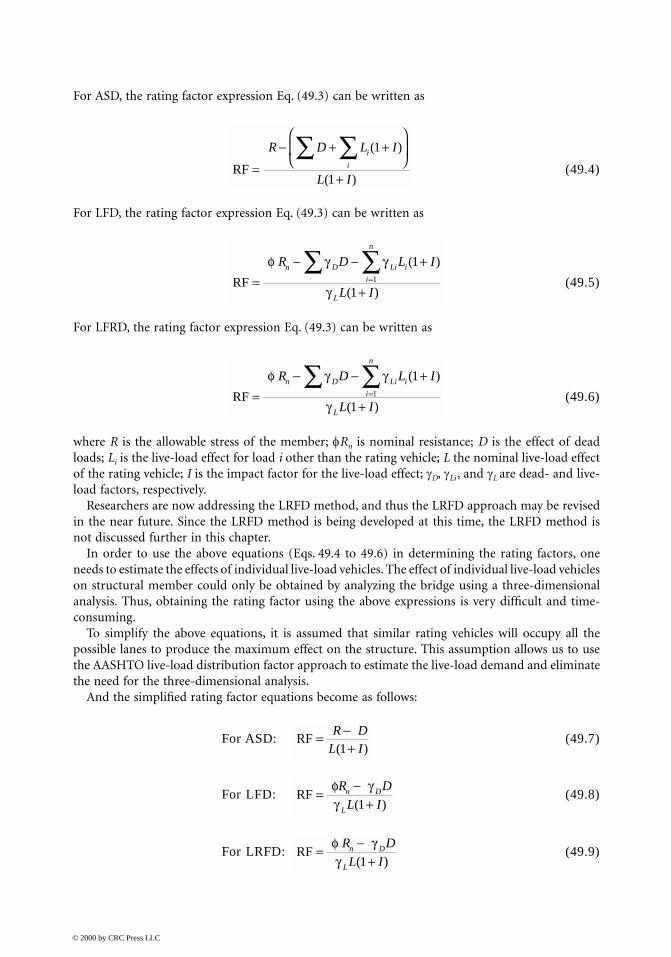
For ASD, the rating factor expression Eq. (49.3) can be written as
(49.4)
For LFD, the rating factor expression Eq. (49.3) can be written as
(49.5)
For LFRD, the rating factor expression Eq. (49.3) can be written as
(49.6)
where R is the allowable stress of the member; φRn is nominal resistance; D is the effect of deadloads; Li is the live-load effect for load i other than the rating vehicle; L the nominal live-load effectof the rating vehicle; I is the impact factor for the live-load effect; γD, γLi , and γL are dead- and live-load factors, respectively.
Researchers are now addressing the LRFD method, and thus the LRFD approach may be revisedin the near future. Since the LRFD method is being developed at this time, the LRFD method isnot discussed further in this chapter.
In order to use the above equations (Eqs. 49.4 to 49.6) in determining the rating factors, oneneeds to estimate the effects of individual live-load vehicles. The effect of individual live-load vehicleson structural member could only be obtained by analyzing the bridge using a three-dimensionalanalysis. Thus, obtaining the rating factor using the above expressions is very difficult and time-consuming.
To simplify the above equations, it is assumed that similar rating vehicles will occupy all thepossible lanes to produce the maximum effect on the structure. This assumption allows us to usethe AASHTO live-load distribution factor approach to estimate the live-load demand and eliminatethe need for the three-dimensional analysis.
And the simplified rating factor equations become as follows:
For ASD: (49.7)
For LFD: (49.8)
For LRFD: (49.9)
RF =
− + +
+
∑ ∑R D L I
L I
i
i
( )
( )
1
1
RF =− − +
+
∑ ∑=
φ γ γ
γ
R D L I
L I
n D Li i
i
n
L
( )
( )
1
11
RF =− − +
+
∑ ∑=
φ γ γ
γ
R D L I
L I
n D Li i
i
n
L
( )
( )
1
11
RF = −+
R DL I( )1
RF = −+
φ γγR D
L In D
L ( )1
RF = −+
φ γγ
R D
L In D
L ( )1
© 2000 by CRC Press LLC
In the derivation of the above equations (Eqs. 49.7 to 49.9), it is assumed that the resistance ofthe member is independent of the loads. A few exceptions to this assumption are beam–columnmembers and beams with high moment and shear. In a beam–column member, axial capacity ormoment capacity depends on the applied moment or applied axial load on the member. Thus, asthe live-load forces in the member increase, the capacity of the member would decrease. In otherwords, the numerator of the above equations (available live-load capacity) will drop as the live loadincreases. Thus, the rating factor will no longer be a constant value, and will be a function of live load.
49.5.4 Level of RatingsThere are two levels of rating for bridges: inventory and operating. The rating that reflects the absolutemaximum permissible load that can be safely carried by the bridge is called an operating rating. Theload that can be safely carried by a bridge for indefinite period is called an inventory rating.
The life of a bridge depends on the fatigue life or serviceability limits of bridge materials. Higherfrequent loading and unloading may affect the fatigue life or serviceability of a bridge componentand thereby the life of the bridge. Thus, in order to maintain a bridge for an indefinite period, live-load-carrying capacity available for frequently passing vehicles needs to be estimated at service. Thisprocess is referred to as inventory rating.
Less frequent vehicles may not affect the fatigue life or serviceability of a bridge, and thus live-load-carrying capacity available for less frequent vehicles need not be estimated using serviceabilitycriteria. In addition, since less frequent vehicles do not damage the bridge structure, bridge struc-tures could be allowed to carry higher loads. This process is referred to as operating rating.
49.5.5 Structural Failure ModesIn the ASD approach, when a portion of a structural member is stressed beyond the allowable stress,the structure is considered failed. In addition, since any portion of the structural member materialnever reaches its yield, the deflections or vibrations will always be satisfied. Thus, the serviceabilityof a bridge is assured when the allowable stress method is used to check a bridge member. In otherwords, in the ASD approach, serviceability and strength criteria are satisfied automatically. Theinventory and operating allowable stresses for various types of failure modes are given in theAASHTO Manual for Condition Evaluation of Bridges 1994 [12] (Rating Manual).
In the LFD approach, failure could occur at two different limit states: serviceability and strength.When the load on a member reaches the ultimate capacity of the member, the structure is consideredfailed at its ultimate strength limit state. When the structure reaches its maximum allowable ser-viceability limits, the structure is considered failed at its serviceability limit state. In LFD approach,satisfying one of the limit states will not automatically guarantee the satisfaction of the other limitstate. Thus, both serviceability and strength criteria need to be checked in the LFD method. However,when the operating rating is estimated, the serviceability limits need not be checked.
49.6 Superstructure Rating Examples
In this section, several problems are illustrated to show the bridge rating procedures. In the followingexamples, AASHTO Standard Specification for Highway Bridges, 16th ed.[13] is referred to as DesignSpecifications and AASHTO Manual for Condition Evaluation of Bridges 1994 [12] is referred to asRating Manual. All the notations used in these examples are defined in either the Design Specifi-cations or the Rating Manual.
49.6.1 Simply Supported Timber Bridge
GivenTypical cross section of a 16-ft (4.88-m) long simple-span timber bridge is shown in Figure 49.1.13.4 × 16 in. (101.6 × 406.4 mm) timber stringers are placed at 18 in. (457 mm) spacing. 4 × 12 in.
© 2000 by CRC Press LLC

(101.6 × 305 mm) timber planks are used as decking. 8 × 8 in. (203 × 203 mm) timber is used aswheel guard. Barrier rails (10 lb/ft or 0.1 N/mm) are placed at either side of the bridge. The trafficlane width of the bridge is 16 ft (4.88 m). Assume that the allowable stresses at operating level areas follows: Fb for stringer as 1600 psi (11 MPa) and Fv of stringer level as 115 psi (0.79 MPa).
RequirementDetermine the critical rating factors for interior stinger for HS20 vehicle using the ASD approach.
SolutionFor this simply supported bridge, the critical locations for ratings will be the locations where shearand moments are higher.
According to Design Specifications Section 13.6.5.2, shear needs to be checked at a distance (s)3d or 0.25L from the bearing location for vehicle live loads; thus,
s = 3d = 3 × 16 in./12 = 4.0 ft or
= 0.25L = 0.25 × 16 ft = 4.0 ft. Thus, s is taken as 4.0 ft (1.22 m).
Maximum dead- and live-load shear will occur at this point and thus in the following calculations,shear is estimated at this critical location.
1. Dead Load Calculations
Self-weight of the stringer =
Weight of deck (using tributary area) =
Weight of 1.5 in. AC on the deck =
Barrier rail and curb =
Total uniform dead load on the stringer = 0.022 + 0.025 + 0.027 + 0.004
=
Maximum dead load moment at midspan = kip-ft (3390 N-m)
FIGURE 49.1 Typical cross section detail of simply supported timber bridge example.
0 05 4 161
1440 022. .× × × = kips ft
1 5 4 121
1440 05 0 025. . .× × × × = kips ft
1 51 512
0 144 0 027..
. .× × = kips ft
10 508 8144
213 1000
0 004+ × ×
×
×= . kips ft
0 078. kips ft
wl2 2
80 078 16
82 5= × =..
© 2000 by CRC Press LLC

Maximum dead load shear at this critical point = w × (0.5L – s)
= 0.078 × (0.5 × 16 – 4)
= 0.31 kips (1.38 kN)
2. Live-Load Calculations The travel width is less than 18 ft. Thus, according to Section 6.7.2.2 of the Rating Manual,this bridge needs to be rated for one traffic lane. From Designs Specifications Table 3.23.1,
Number of wheels on the stringer =
Maximum moment due to HS20 loading (Appendix A3, Rating Manual)
= (64) (0.38) = 24.32 kip-ft (33,000 N-m)
In order to estimate the live-load shear, we need to estimate the shear due to undistributedand distributed HS20 loadings. (See Design Specifications 13.6.5.2 for definition of VLU and VLD)
Shear due to undistributed HS20 loadings = VLU = 16 × 12/16 = 12 kips (53.4 kN)
Shear due to distributed HS20 loading = VLD = 16 × 12/16 × (0.38)
= 4.56 kips (20.3 kN)
Thus, shear due to HS20 live load = 0.5(0.6VLU + VLD ) = 5.88 kips (26.1 kN)
3. Capacity Calculations a. Moment capacity at midspan:
Moment capacity of the timber stringer at Operating level =
Fb Sx = (30,900 N-m)
According to Section 6.6.2.7 of Rating Manual, the operating level stress of a timberstringer can be taken as 1.33 times the inventory level stress.
Thus, moment capacity of the timber stringer at Inventory level
= 22.8/1.33 = 17.1 kip-ft (23,200 N-m)
b. Shear capacity at support:Shear capacity of the timber section (controlled by horizontal shear) = (⅔)bdfv:
Vc at operating level = (2/3) × 4 × 16 × 115 psi × 1/1000 = 4.91 kips (21.8 kN)
Vc at inventory level = 14.91/1.33 = 3.69 kips (16.4 kN)
4. Rating Calculations
Rating factor based on ASD method =
S4
1 54
0 38= =..
160016
4 161
12 00022 82× × × × =
,. kip-ft
RF = −+
R DL I( )1
© 2000 by CRC Press LLC

By substituting appropriate values, the rating factor can be determined.a. Based on moment at midspan:
Inventory rating factor RFINV-MOM =
Operating rating factor RFOPR-MOM =
b. Based on shear at the support:
Inventory rating factor RFINV-SHE =
Operating rating factor RFOPR-SHE =
5. Summary It is found that the critical rating factor is controlled by shear in the stringers. The criticalinventory and operating rating of the bridge will be 0.575 and 0.782, respectively.
49.6.2 Simply Supported T-Beam Concrete Bridge
GivenA bridge, which was built in 1929, consists of three simple-span reinforced concrete T-beams onconcrete bents and abutments. The span lengths are 16 ft (4.88 m), 50 ft (15.24 m), and 10 ft (3.05m). Typical cross section and girder details are shown in Figure 49.2. General notes given in theplan indicate that fc = 1000 psi (6.9 MPa) and fs = 18,000 psi (124.1 MPa). Assume the weight ofeach barrier rail as 250 lb/ft (3.6 N/mm).
RequirementDetermine the critical rating factor of the interior girder of the second span (50 ft. or 15.24 m) forHS20 vehicles assuming no deterioration of materials occurred.
Solution1. Dead-Load Calculations
Self-weight of the girder = (3.5) (1.333) (0.15) = 0.700 kips/ft
(4 × 4 in.) Fillets between girder and slab = 2(1/2) (4/12) (4/12) (0.15) = 0.017 kips/ft
Slab weight (based on tributary area) = (6.667)(8/12) (0.15) = 0.667 kips/ft
Contribution from barrier rail (equally distributed among girders) = 2 (0.25/3) = 0.167 kips/ft
Thus, total uniform load on the interior girder =
Dead-load moment at midspan =
Dead load shear at a distance d from support =
17 1 2 524 32
0 600. .
..
− =
22 8 2 524 32
0 835. .
..
− =
3 69 0 315 88
0 575. .
..
− =
4 91 0 315 88
0 782. .
..
− =
1 551 22 6. .kips ft N mm( )
4 kips ft 0.657 MN m84 6. ( )
32.31 kips 143.7 kN( )
© 2000 by CRC Press LLC

2. Live-Load Calculations The traffic lane width of this bridge is 18.5 ft. According to Design Specifications, any bridgewith a minimum traffic lane width of 18 ft needs to carry two lanes. Hence, the number oflive-load wheels will be based on two traffic lanes. From Table 3.23.1A of Design Specificationsfor two traffic lanes for T-beams is given by S/6.0
Number of live-load wheel line = 6.667/6.0 =
AASHTO standard impact factor for moment = 50/(125 + 50) =
AASHTO standard impact factor for shear at support = 50/(125 + 50) =
The live-load moments and shear tables listed in the Rating Manual are used to determinethe live-load demand.
Maximum HS20 moment for 50 ft span without impact/wheel line = 298.0 kips-ft
Thus, HS20 moment with impact at midspan = (1.286) (1.111) (298.0)
=
Maximum HS20 shear at a distance d from the support/wheel line = 28.32 kips
Thus, maximum HS20 shear = (1.286) (1.111) (28.32) =
FIGURE 49.2 Details of simply supported T-beam concrete bridge example. (a) Typical cross section; (b) reinforce-ment locations; (c) T-beam girder details.
1.111
0.286
0.286
425.7 kips-ft 0.58 MN-m( )
40.46 kips 180.0 kN( )
© 2000 by CRC Press LLC

3. Capacity Calculations Strengths of concrete and rebars are first determined (see Rating Manual Section 6.6.2.3):
thus = 2500 psi
and fs = 18,000 psi and thus fy = 33,000 psi.
a. Moment capacity at midspan:
Total area of the steel (note these bars are 1¼ square bars) = (8) (1.25) (1.25) = 12.5 in.2
Centroid of the rebars from top deck = 42 + 8 – 3.75 = 46.250 in.
Effective width of the deck beff = minimum of 12ts + bw = 112 in.
Span/4 = 150 in.
Spacing = (Controls)
Uniform stress block depth = < ts= 8 in.
Mu = = 1393.3 kips-ft (1.88 MN-m)
b. Shear capacity at support:According to AASHTO specification, shear at a distance d (50 in.) from the support needsto be designed. Thus, the girder is rated at a distance d from the support. From the girderdetails, it is estimated that ½ in. φ stirrups were placed at a spacing of 12 in. and two 1¼
square bars were bent up. The effects of these bent-up bars are ignored in the shear capacitycalculations.
Shear capacity due to concrete section:
Vc = (329 kN)
Shear capacity due to shear reinforcement:
Vs = (226 kN)
Total shear capacity:
Vu = (472 kN)
4. Rating Calculations
′ =ff
cc
0 4.′fc
80 in.
aA f
f bs y
c
=′
=0 85
2 426.
.eff
in.
φ A f da
s y −
= × × −
×
2
0 9 12 5 33 46 252 426
21
12. . .
.
2 2 2500 16 46 251
100074′ = × × ×
=f b dc w . kips
2 2 0 2033 46 25
1250 88A
F d
Svy s = × × × =.
.. kips
( ) 0.85 (74.0 50.88) 106.2 kipsφ V Vs c+ = + =
Rating factor = −+
φ γγ β
R D
L In D
L L ( )1
© 2000 by CRC Press LLC

According to Rating Manual, is 1.3, is 1.3, and is 1.67 and 1.0 for inventory andoperating factors, respectively. By substituting these values and appropriate load effect values,the moment and shear rating could be estimated. The calculations and results are given inTable 49.1.
5. Summary Critical rating of the interior girder will then be 0.731 at inventory level and 1.22 at operatingrating level for HS20 vehicle.
49.6.3 Two-Span Continuous Steel Girder Bridge
GivenTypical section of a two-span continuous steel girder bridge, which was built in 1967, is shown inFigure 49.3a. Steel girder profile is given in Figure 49.3b. The general plan states that fs = 20,000 psi(137.9 MPa) and fc = 1200 psi (8.28 MPa). Assume that (a) each barrier rail weighs 250 lb/ft (3.6N/mm); (b) girders were not temporarily supported during the concrete pour; (c) girder is com-posite for live loads; (d) girder is braced every 15 ft and the weight of bracing per girder is 330 lb.
RequirementDetermine the rating factors of interior girders using ASD method.
Solution
1. Dead Load Calculations
Deck weight (tributary area approach) = (6.625/12) (6.625) (0.15) = 0.549 kips/ft
Average uniform self-weight for the analysis = 1431 kips/90 ft = 0.159 kips/ft
Average diaphragm load (uniformly distributed) = (0.33) (4/90) = 0.015 kips/ft
Thus, total uniform dead load on the girder =
Barrier rail load (equally distributed among all girders) = (2)(250)/14 = 0.0358 kips/ft
Thus, total additional dead load on the girder =
2. Live Load Calculations
Number of wheels per girder (for two or more lanes) = S/5.5 = 6.625/5.5 =
Analysis Results: Analysis is done using two-dimensional program and the moments andshears at critical locations are listed in the Table 49.2.
Section properties at 0.4th and 1.0th points are estimated and the results are given inTable 49.3.
TABLE 49.1 Rating Calculations of Simply Supported T-Beam Concrete Bridge Example
Location Description Inventory Rating Operating Rating
Midspan Moment = 0.825 = 1.38
At support Shear = 0.731 = 1.22
1393 3 1 3 484 61 3 1 67 425 7
. . .. . .
− ×× ×
1393 3 1 3 484 61 3 425 7. . .. .
− ××
106 2 1 3 32 311 3 1 67 40 46
. . .. . .
− ×× ×
106 2 1 3 32 311 3 40 46. . .. .− ××
γ D γ L βL
0 723. kips ft 10.5 N mm( )
0 0358 0 56. . kips ft N mm( )
1 206.
© 2000 by CRC Press LLC
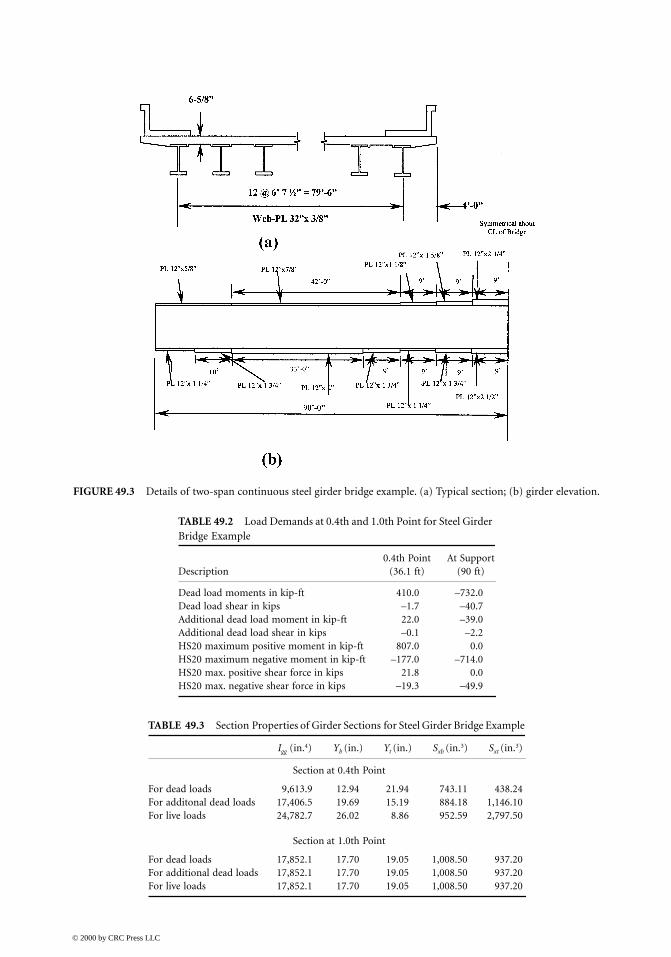
FIGURE 49.3 Details of two-span continuous steel girder bridge example. (a) Typical section; (b) girder elevation.
TABLE 49.2 Load Demands at 0.4th and 1.0th Point for Steel Girder Bridge Example
0.4th Point At SupportDescription (36.1 ft) (90 ft)
Dead load moments in kip-ft 410.0 –732.0Dead load shear in kips –1.7 –40.7Additional dead load moment in kip-ft 22.0 –39.0Additional dead load shear in kips –0.1 –2.2HS20 maximum positive moment in kip-ft 807.0 0.0HS20 maximum negative moment in kip-ft –177.0 –714.0HS20 max. positive shear force in kips 21.8 0.0HS20 max. negative shear force in kips –19.3 –49.9
TABLE 49.3 Section Properties of Girder Sections for Steel Girder Bridge Example
Igg (in.4) Yb (in.) Yt (in.) Sxb (in.3) Sxt (in.3)
Section at 0.4th Point
For dead loads 9,613.9 12.94 21.94 743.11 438.24For additonal dead loads 17,406.5 19.69 15.19 884.18 1,146.10For live loads 24,782.7 26.02 8.86 952.59 2,797.50
Section at 1.0th Point
For dead loads 17,852.1 17.70 19.05 1,008.50 937.20For additional dead loads 17,852.1 17.70 19.05 1,008.50 937.20For live loads 17,852.1 17.70 19.05 1,008.50 937.20
© 2000 by CRC Press LLC

3. Allowable Stress Calculations Strengths of concrete and rebars are first determined (see Rating Manual Section 6.6.2.3):
and, thus = 3000 psi
and fs = 20,000 psi and thus Fy = 36,000 psi.
a. Compression and tensile stresses at 0.4th point:Note that the section is fully braced at this location.i. Allowable compressive stress at inventory level = 0.55 Fy = 20 ksi (137.9 MPa)ii. Allowable compressive stress at operating level = 0.75 Fy = 27 ksi (186.2 MPa)iii. Allowable tensile stress at inventory level = 0.55 Fy = 20 ksi (137.9 MPa)
b. Compression and tensile stresses at 1.0th point:i. allowable tensile stress at inventory level = 0.55 Fy = 20 ksi (137.9 MPa)ii. allowable compressive stress at inventory level: Girder is braced 15 ft away from the
support and thus Lb = 15 × 12 = 180 in. It can be shown that Sxc = 1008.3 in3; d = 36.75in.; J = 108.63 in.4; Iyc = 360 in.4 Then allowable stress at inventory level (Table 6.6.2.1-1 of Rating Manual):
Fb =
=
= 79.5 > 0.55Fy = 20 ksi (Note that Cb is conservatively assumed as 1.0.)
Thus, Fb = 20 ksi (137.9 MPa)iii. Allowable compressive stress at operating level: The allowable stress at operating level
is given:
Fb =
(Table 6.6.2.1-2, Rating Manual)
= 108.0 > 0.75 Fy = 27 ksi
Thus, Fb = 27 ksi (186.2 MPa)
c. Allowable inventory shear stresses at 0.4th and 1.0th point:
D/tw = 32/0.375 = 85.33
Girder is unstiffened and thus k = 5;
= 70.71 < D/tw < = 88.3
′ =ff
cc
0 4.′fc
91 10
1 820 772 9 87
6 2×
×
+
C
S
I
LJI
dL
b
xc
yc
b yc b.. .
91 10 1 001 82 1008 3
360180
0 772108 63
3609 87
36 75180
11000
6 2××
+
( . ). .
..
..
91 10
1 340 772 9 87
6 2×
×
+
C
S
I
LJI
dL
b
xc
yc
b yc b.. .
6000 kFy
7500 kFy
© 2000 by CRC Press LLC

Thus,
C = = 0.828
Fv = = 11.76 ksi (81.1 MPa)
d. Allowable operating shear stresses at 0.4th and 1.0th point:
Fv = = 15.88 ksi (109.5 MPa)
4. Load Stress Calculations Bending stress calculations are made using appropriate section modulus and moments.Results are reported in Table 49.4. The sign convention used in Table 49.4 is as follows:compressive stress is positive and tensile stress is negative. Also, estimated shear stresses aregiven in Table 49.4.
5. Rating Calculations The rating factor in ASD approach is given by
and the rating calculations are made and given in Table 49.5.
6. Summary The critical rating factor of the girder is controlled by tensile stress on the top fiber at the1.0th point. The critical inventory and operating rating factors are 1.11 and 1.87, respectively.
TABLE 49.4 Estimated Stress Demands for Steel Girder Bridge Example
Load Description At 0.4th Point At 1.0th Point Fiber Location
DL moment –6.62 8.71 At bottom fiberADL moment –0.30 0.463 At bottom fiberLL + I moment –10.16 8.49 At bottom fiberDL moment 11.23 –9.37 At top fiberADL moment 0.23 –0.49 At top fiberLL + I moment 3.46 –9.14 At top fiberDL shear 0.129 2.95 Shear stressADL shear 0.007 0.15 Shear stressLL + I shear 1.667 3.62 Shear stress
6000 k
Dt
Fw
y
FC
C
d
D
y
o3
0 87 1
12
+−( )
+
.
0 450 87 1
12
..
F CC
d
D
y
o
+−( )
+
R DL I
−+( )1
© 2000 by CRC Press LLC
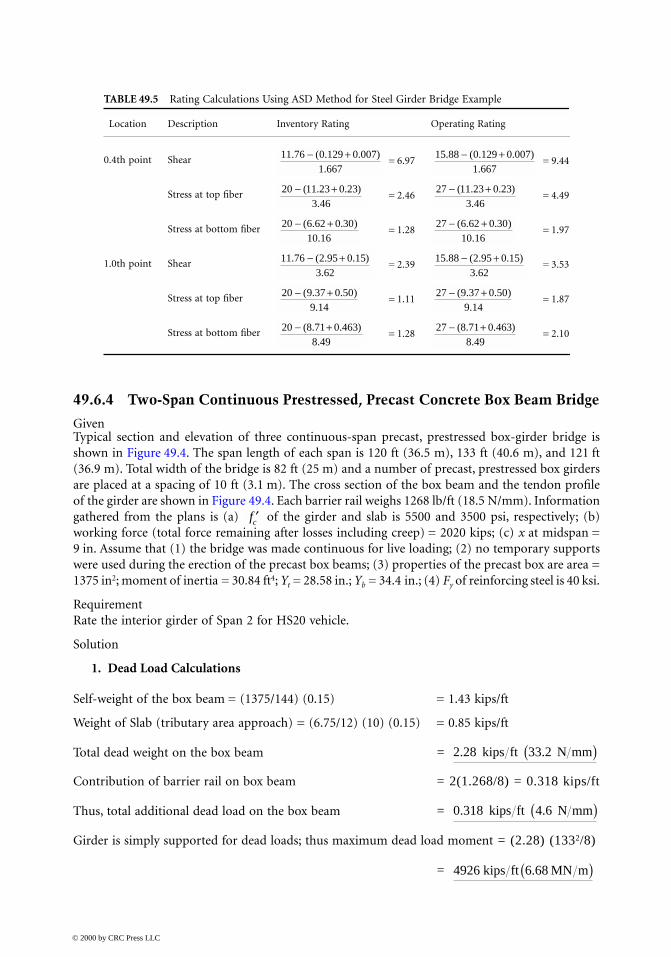
49.6.4 Two-Span Continuous Prestressed, Precast Concrete Box Beam Bridge
GivenTypical section and elevation of three continuous-span precast, prestressed box-girder bridge isshown in Figure 49.4. The span length of each span is 120 ft (36.5 m), 133 ft (40.6 m), and 121 ft(36.9 m). Total width of the bridge is 82 ft (25 m) and a number of precast, prestressed box girdersare placed at a spacing of 10 ft (3.1 m). The cross section of the box beam and the tendon profileof the girder are shown in Figure 49.4. Each barrier rail weighs 1268 lb/ft (18.5 N/mm). Informationgathered from the plans is (a) of the girder and slab is 5500 and 3500 psi, respectively; (b)working force (total force remaining after losses including creep) = 2020 kips; (c) x at midspan =9 in. Assume that (1) the bridge was made continuous for live loading; (2) no temporary supportswere used during the erection of the precast box beams; (3) properties of the precast box are area =1375 in2; moment of inertia = 30.84 ft4; Yt = 28.58 in.; Yb = 34.4 in.; (4) Fy of reinforcing steel is 40 ksi.
RequirementRate the interior girder of Span 2 for HS20 vehicle.
Solution
1. Dead Load Calculations
Self-weight of the box beam = (1375/144) (0.15) = 1.43 kips/ft
Weight of Slab (tributary area approach) = (6.75/12) (10) (0.15) = 0.85 kips/ft
Total dead weight on the box beam =
Contribution of barrier rail on box beam = 2(1.268/8) = 0.318 kips/ft
Thus, total additional dead load on the box beam =
Girder is simply supported for dead loads; thus maximum dead load moment = (2.28) (1332/8)
=
TABLE 49.5 Rating Calculations Using ASD Method for Steel Girder Bridge Example
Location Description Inventory Rating Operating Rating
0.4th point Shear = 6.97 = 9.44
Stress at top fiber = 2.46 = 4.49
Stress at bottom fiber = 1.28 = 1.97
1.0th point Shear = 2.39 = 3.53
Stress at top fiber = 1.11 = 1.87
Stress at bottom fiber = 1.28 = 2.10
11 76 0 129 0 0071 667
. ( . . ).
− + 15 88 0 129 0 0071 667
. ( . . ).
− +
20 11 23 0 233 46
− +( . . ).
27 11 23 0 233 46
− +( . . ).
20 6 62 0 3010 16
− +( . . ).
27 6 62 0 3010 16
− +( . . ).
11 76 2 95 0 153 62
. ( . . ).
− + 15 88 2 95 0 153 62
. ( . . ).
− +
20 9 37 0 509 14
− +( . . ).
27 9 37 0 509 14
− +( . . ).
20 8 71 0 4638 49
− +( . . ).
27 8 71 0 4638 49
− +( . . ).
′fc
2 28. kips ft 33.2 N mm( )
0 318. kips ft 4.6 N mm( )
4926 6 68kips ft MN m.( )
© 2000 by CRC Press LLC

2. Live Load Calculations According to Article 3.28 of Design Specifications, distribution factor (DF) for interior spreadbox beam is given by
where NL = number of traffic lanes = 64/12 = 5 (no fractions); NB = Number of beams = 8;S = girder spacing = 8 ft; L = span length = 133 ft; W = roadway width = 64 ft
k = 0.07 W – NL (0.10 NL – 0.26) – 0.2 NB – 0.12 = 1.56
Thus, DF = = 1.37 wheels
3. Demands on the Girder Load demands are estimated using a two-dimensional analysis, and a summary is given inTable 49.6.
4. Section Property Calculations In order to estimate the stresses on the prestress box beam, the section properties for com-posite girder need to be estimated. Calculations of the composite girder properties are doneseparately and the final results are listed here in Table 49.7.
FIGURE 49.4 Details of two-span continuous prestressed box beam bridge example. (a) Typical section; (b) beamsection details; (c) prestressing tendon profile.
DF =
+
2 N
Nk
SL
L
B
2 58
1 5610133
×
+
.
© 2000 by CRC Press LLC

5. Stress Calculations Stresses at different fiber locations are calculated using
expression. The summary of the results at midspan and at Bent 2 locations is given inTables 49.8 and Table 49.9, respectively.
TABLE 49.6 Load Demands for Prestressed Precast Box Beam Bridge Example
Description 0.5L At Bent 2 At Bent 3
Dead load moment (kip/ft) 4224 0 0Additional dead load moment (kip/ft) 194 –506 –513HS20 moment with impact (kip/ft) 1142 –1313 –1322Dead load shear (kips) 0.0 153.6 –153.6Additional dead load shear (kips) 0.0 21.1 –21.2HS20 positive shear (moment)a (kips) 24.8 [1104] 61.1 [–974] 7.1 [127]
HS20 negative shear (moment)a (kips) –24.8 [1104] –7.1 [131] –61.2 [–980]
a Values within brackets indicate the moment corresponds to the reported shear.
TABLE 49.7 Section Properties for Prestressed, Precast Box Beam Bridge Example
DescriptionArea (in.2)
Moment of Inertia (ft4)
Y Bottom of Girder (in.)
Y Top of Girder (in.)
Y Top of Slab (in.)
For dead loads 1375 30.84 34.42 28.58 NAFor additional dead loads 1578 39.22 38.55 24.45 30.45For live loads 1984 50.75 44.23 18.77 24.77
TABLE 49.8 Stresses at Midspan for Prestressed, Precast Box Beam Bridge Example
Location = Midspan Stresses in the Box Beam (psi)
Load DescriptionAt Top
Concrete FiberAt Bottom
Concrete FiberAt Centroid of Composite Box Beam Concrete Fiber
At Prestress Tendon
Dead load (self + slab) 2265 –2728 777 20.15Prestress Peff = 2020 kips e = 25.42 in. –1615 3443 –108 147.1
Additional dead (barrier) 70 –110 16 0.845Live load 244 –575 0 4.59Live load moment for shear 236 –556 0 4.43
TABLE 49.9 Stresses at Bent 2 for Prestressed, Precast Box Beam Bridge Example
Location = Bent 2 Stresses in the Box Beam (psi)
Load DescriptionAt Top
Concrete FiberAt Bottom
Concrete FiberAt Centroid of Composite Box Beam Concrete Fiber
At Top of Slab Fiber
At Prestress Tendon
Dead load (self + slab) 0 0 0 0 0Prestress Peff = 2020 kips e = 12 in. 680 680 680 0 167.5
Additional dead (barrier) –183 288 –4 –228 –0.3Live load –281 662 0 –371 –1.47Live load moment for positive shear –208 491 0 –274 –1.08
PA
M cI
+
© 2000 by CRC Press LLC

6. Capacity Calculations a. Moment capacity at midspan:
The actual area of steel could only be obtained from the shop plans. Since the shop plansare not readily available, the following approach is used. Assume the total loss includingthe creep loss = 35 ksi (241.3 MPa).
Thus, the area of prestressing steel = (7781 mm2)
beff = 120 in.; ts = 6.75 in.; dp = (5.75)(12) – 9 in. = 60 in.; bw = 14 in.
= 0.001675
(1785 MPa)
Neutral axis location =
Since the neutral axis falls within the slab, this girder can be treated as a rectangular sectionfor moment capacity calculations.
R = φ Mn = and φ = 1.00
=
b. Moment capacity at the face of the support:15 #11 bars are used at top of the bent; thus, the total area of steel = (15)(1.56) = 23.4 in.2
Depth of the reinforcing steel from the top of compression fiber = 69 – 1.5 – 1.41/2 =66.795 in. (1696.6 mm). Fy = 60 ksi. Resistance reduction factor φ = 0.90. Then, themoment capacity
φ Mn = (based on T section)
c. Shear capacity at midspan:Design Specification’s Section 9.20 addresses the shear capacity of a section. Shear capacitydepends on the cracking moment of the section. When the live load causes tension atbottom fiber, cracking moment is to be calculated based on the bottom fiber stress. Onthe other hand, when the live load causes tension at the top fiber of the beam, crackingmoment is to be calculated based on the top fiber stress.
At midspan location, the moment reported with the maximum live-load shear is pos-itive. Positive moments will induce tension at the bottom fiber and thus cracking momentis to be based on the stress at bottom fiber.
Working force0.75 270 35
in.2× −
= =2020167 5
12 06.
.
ρ ** .= =
×A
bds 12 06
120 60
f ff
fsu ss
c
*'
. * . ..
.= − ′
= − × ×
=1
0 5270 1
0 5 0 001675 2705 5
258 9ρ
ksi
1 4 1 4 60 0 001675258 9
5 56 62 6 75. . .
..
. .**
df
ftsu
csρ
′= × × × = < =in. in.
φ ρA f df
fs susu
c
* **
.1 0 6−′
14873 1. kips ft 20.17 MN m( )
6547 2. kip ft 8.88 MN m( )
© 2000 by CRC Press LLC

= 5500 psi and from Table 49.10; fpe at midspan bottom fiber = 3443 psi
fd at bottom fiber = –2728 – 110 = –2838 psi; fpc at centroid = 777 – 108 + 16 = 685 psi
Mcr = = = 2081 kips/ft
Factored total moment:
M max = 1.3 M D + (1.3)(1.67) M LL+I
= 1.3 (4224 + 194) + 2.167 (1104) = 8136 kips-ft
Factored total shear:
Vi = 1.3 (0 + 0) + 2.167 (24.8) = 53.7 kips
Vd = 0 kips; bw = 14 in.; d = 60 in.; fpc = 685 psi
Vci = =
= 51.2 kips (227.7 kN) (Controls — since smaller than Vcw)
Vcw = =
= 390 kips (1734 kN)
Vc = 51.2 kips (227.7 kN) (smaller of Vci and Vcw)
Vs = (711.7 kN)
Shear capacity at midspan:
V u = φ (V c+ V s) = 0.85 (51.2 + 160) = 179 kips (796.1 kN)
TABLE 49.10 Rating Calculations Prestressed, Precast Box Beam Bridge Example
Location Description Inventory Rating Operating Rating
Midspan Maximum moment = 3.69 = 6.16
Maximum shear = 3.33 = 5.56
Bent 2 Maximum moment = 2.06 = 3.45
Maximum shear = 4.07 = 6.80
14873 1 1 3 4224 1941 3 1 67 1142. . ( ). .
− × +× ×
14873 1 1 3 4224 1941 3 1142
. . ( ).
− × +×
179 1 3 0 01 3 1 67 24 8
− × +× ×
. ( ). . .
179 1 3 0 01 3 24 8− × +
×. ( )
. .
6544 2 1 3 0 5061 3 1 67 1313
. . ( ). .
− × +× ×
6544 2 1 3 0 5061 3 1313
. . ( ).− × +
×
766 1 3 153 6 21 11 3 1 67 61 1− × +
× ×. ( . . )
. . .766 1 3 153 6 21 1
1 3 61 1− × +
×. ( . . )
. .
′fc
IY
f f ft
c pe d6 ′ + −( ) 50 75 1244 23
6 5500 3443 28381
12 000
4.. ,× + −( )
0 6.max
′ + +f b d VV M
Mc w di cr 0 6 5500 14 60
11000
053 7 2081
8136.
.× × ×
+ + ×
3 5 0 3. .′ +( ) +f f b d Vc pc w p 3 5 5500 0 3 685 14 601
10000. .+ ×( ) × ×
+
2 4 0 2040 60
12160A
F d
Svy s = × × × =. kips
© 2000 by CRC Press LLC

d Shear capacity at the face of support at Bent 2:Negative shear reported at this location is so small and thus rating will not be controlledby the negative shear at Bent 2. Moment reported with the positive shear is negative, andthus, the following calculations are based on the stress at top fiber. From the Table 49.11,fd at top of slab fiber = –228 psi, and fpe at support top of slab fiber (slab poured afterprestressing) = 0 psi.
Mcr = = = 252 kips/ft
Vd = 153.6 + 21.1 = 174.7 kips; bw = 14 in.; d = 69 – 1.5 – 1.41/2 = 66.795 in.; fpc = 676 psi
Factored total moment:
M max = 1.3 M D + (1.3)(1.67) M LL+I
= 1.3(0 + –506) + 2.167(–974) = –2769 kips-ft
Factored total shear:
Vi = 1.3 × (153.6 + 21.1) + 2.167 × (61.1) = 360 kips
Vci = = 74.3 kips
Vcw = = = 432 kips
Vc = 74.3 kips (330.4 kN) (smaller of the Vcw and Vci)
Vs = (3678.5 kN)
Shear capacity at Bent 2:
Vu = φ (Vc + Vs) = 0.85 (74.3 + 827) = 766 kips (3408 kN)
7. Rating Calculations As discussed in Section 49.5.4, the rating calculations for load factor method need to be doneusing strength and serviceability limit states. Serviceability level rating needs not be done atthe operating level.a. Rating calculations based on serviceability limit state:
Serviceability conditions are listed in AASHTO Design Specification Sections 9.15.1 and9.15.2.2. These conditions are duplicated in the Rating Manual.i. Using the compressive stress under all load combination:
The general expression will be RFINV-COMALL =
At midspan RF INV-COMALL = = 10.57
IY
f f ft
c pe d6 ′ + −( ) 50 75 1244 23
6 3500 0 2284.
.× + −( )
0 6 5500 14 66 7951
10000
360 251 72769
. ..× ×
+ + ×
3 5 0 3. .'f f b d Vc pc w p+( ) + 3 5 5500 0 3 676 14 66 7951
10000. . .+ ×( ) ×
+
2 4 0 3160 66 695
6827A
F d
Svy s = × × × =.
.kips
0 6. ′− − +f f f f
fc d p s
l
0 6 5500 2265 70 1615 0244
. ( ) ( )× − + − − +
© 2000 by CRC Press LLC

At Bent 2 support RFINV-COMALL = = 3.52
ii. Using the compressive stress of live load, half the prestressing and permanent dead load:
The general expression will be RFINV-COMLIVE =
At midspan RFINV-COMLIVE = = 2.76
At Bent 2 support RFINV-COMLIVE = = 2.37
iii. Using the allowable tension in concrete:
The general expression will be RFINV-CONTEN =
At midspan RFINV-CONTEN = = 1.826
At Bent 2 support RFINV-CONTEN = = 3.352
iv. Using the allowable prestressing steel tension at service level:
The general expression will be RFINV-PRETEN =
At midspan RFINV-PRETEN = = 10.43
At Bent 2 support RFINV-PRETEN = = 30.94
b. Rating calculations based on strength limit state:
The general expression for
According to AASHTO Rating Manual, γD is 1.3, γL is 1.3, and βL is 1.67 and 1.0 forinventory and operating factor, respectively. Rating calculations are made and given inTable 49.10.
0 6 5500 0 288 680 0662
. ( )× − + − +
0 4 0 5 0 5. . .′− − +f f f f
fc d p s
l
0 4 5500 2265 70 0 5 1615 0 5 0244
. ( ) . ( ) . ( )× − + − − +
0 4 5500 0 288 0 5 680 0 5 0662
. ( ) . ( ) . ( )× − + − +
6 ′ − − −f f f f
fc d p s
l
6 5500 2728 110 3443 0575
− + − − −( ) ( )
6 5500 0 183 680 0281
− + − − −( ) ( )
0 8. *f f f f
fy d p s
l
− − −
0 8 270 20 99 147 1 04 59
. . ( . ).
× − − −
0 8 270 3 08 167 5 01 468
. ( . ) ..
× − − − −
Rating factor = −+
φ γγ β
R D
L In D
L L ( )1
© 2000 by CRC Press LLC
8. Summary The critical inventory rating of the interior girder is controlled by the tensile stress on concreteat midspan location. The critical operating rating of the girder is controlled by moment atBent 2 location.
49.6.5 Bridges without Plans
There are some old bridges in service without plans. Establishing safe live-load-carrying capacityis essential to have a complete bridge document. When an inspector comes across a bridge withoutplans, sufficient field physical dimensions of each member and overall bridge geometry should betaken and recorded. In addition, information such as design year, design vehicle, designer, live-loadhistory, and field condition of the bridge needs to be collected and recorded. This information willbe very helpful to determine the safe live-load-carrying capacity. Also, bridge inspectors need toestablish the material strength either using the design year or coupon testing.
Design vehicle information could be established based on the designer (state or local agency) andthe design year. For example, all state bridges have been designed using the HS20 vehicle since 1944and all local agency bridges have been designed using the H15 vehicle since 1950.
In steel girder bridges, section properties of the members could be determined based on the fielddimensions. During the estimation of the moment capacity, it is recommended to assume that thesteel girders are noncomposite with the slab unless substantial evidence is gathered to prove oth-erwise.
In concrete girder bridges, field dimensions help to estimate the dead loads on the girders. Sincethe area of reinforcing steels is not known or is difficult to establish, determining the safe live loadposes challenges to bridge owners. The live-load history and field condition of a bridge could beused to establish the safe load capacity of the bridge. For example, if a particular bridge has beencarrying several heavy vehicles for years without damaging the bridge, this bridge could be left openfor all legal vehicles.
49.7 Posting of Bridges
Bridge inspection and the strength evaluation process are two integral parts of bridge posting. Thepurpose of bridge inspection is to obtain the information that is necessary to evaluate the bridgecapacity and the adequacy of the bridge properly. When a bridge is found to have inadequate capacityfor legal vehicles, engineers need to look at several alternatives prior to closing the bridge to thepublic. Some of the possible alternatives are imposing speed limits, reducing vehicular traffic,limiting or posting for vehicle weight, restricting the vehicles to certain lanes, recommendingpossible small repairs to alleviate the problem. In addition, when the evaluations show that thestructure is marginally inadequate, frequent inspections to monitor the physical condition of thebridge and traffic flow may be recommended.
Standard evaluation methods described in the Section 49.5 may be overly conservative. When amore accurate answer is required, a more-detailed analysis, such as three-dimensional analysis orphysical load testing can be performed.
The weight and axle configuration of vehicles allowed to use highways without special permitsis governed by the statutory law. Thus, the traffic live loads used for posting purposes should berepresentative of the actual vehicles using the bridge. The representative vehicles vary with eachstate in the United States. Several states use the three hypothetical legal vehicle configurations givenin the Rating Manual [12]. Whereas a few states use their own specially developed legal truckconfigurations, AASHTO H or HS design trucks, or some combination of truck types. NBIS requiresthat posting of a bridge must be done when the operating rating for three hypothetical legal vehicles
© 2000 by CRC Press LLC

listed in the Rating Manual [12] is less than unity. Furthermore, the NBIS requirement allows thebridge owner to post a bridge for weight limits between inventory and operating level. Because ofthis flexible NBIS requirement, there is a considerable variation in posting practices among variousstate and local jurisdictions.
Although engineers may recommend one or a combination of the alternatives described above,it is the owner, not the engineer, who ultimately makes the decision. Many times, bridges are postedfor reasons other than structural evaluation, such as posting at a lower weight level to limit vehicularor truck traffic, posting at a higher weight level when the owner believes a lower posting would notbe prudent and is willing to accept a higher level of risk. Weight limit posting may cause inconve-nience and hardship to the public. In order to reduce inconvenience to the public, the owner needsto look at the weight limit posting as a last resort. In addition, it is sometimes in the public interestto allow certain overweight vehicles such as firefighting equipment and snow removal equipmenton a posted bridge. This is usually done through the use of special permits.
References
1. FHWA, Bridge Inspector’s Training Manual 70, U.S. Department of Transportation, Washington,D.C., 1970.
2. AASHO, Manual for Maintenance Inspection of Bridges, American Association of State HighwayOfficials, Washington, D.C., 1970.
3. FHWA, Recording and Coding Guide for the Structure Inventory and Appraisal of the Nation’sBridges, U.S. Department of Transportation, Washington, D.C., 1972.
4. FHWA, Bridge Inspector’s Manual for Movable Bridges, (Supplement to Manual 70), U.S. Depart-ment of Transportation, Washington, D.C., 1970.
5. FHWA, Culvert Inspection Manual, (Supplement to Manual 70), U.S. Department of Transporta-tion, Washington, D.C., 1970.
6. FHWA, Inspection of Fracture Critical Bridge Members, U.S. Department of Transportation,Washington, D.C., 1970.
7. FHWA, Inspection of Fracture Critical Bridge Members, U.S. Department of Transportation,Washington, D.C., 1986.
8. FHWA, Recording and Coding Guide for the Structure Inventory and Appraisal of the Nation’sBridges, U.S. Department of Transportation, Washington, D.C., 1979.
9. FHWA, Recording and Coding Guide for the Structure Inventory and Appraisal of the Nation’sBridges, U.S. Department of Transportation, Washington, D.C., 1988.
10. FHWA, Bridge Inspector’s Training Manual 90, U.S. Department of Transportation, Washington,D.C., 1991.
11. FHWA, Hydraulic Engineering Circular (HEC) No.18, Evaluating Scour at Bridges, U.S. Depart-ment of Transportation, Washington, D.C., 1990.
12. AASHTO, Manual for Condition Evaluation of Bridges 1994, American Association of State Highwayand Transportation Officials, Washington, D.C., 1994.
13. AASHTO, Standard Specification for Highway Bridges, 16th ed., American Association of StateHighway and Transportation Officials, Washington, D.C., 1996.
© 2000 by CRC Press LLC


![INDEX []IJAR)/recent...8 A Growth of Rural Postal Life Insurance in India [ A Study with special Reference to Dharmapuri District] Dr. A. Vinayagamoorthy K. Senthilkumar Commerce 27-28](https://img.pdfslide.us/doc/110x75/5e838b14038c46282c38b307/index-ijarrecent-8-a-growth-of-rural-postal-life-insurance-in-india-a.jpg)


![INDEX [] .P. Parmar Commerce 24-26 8 A Growth of Rural Postal Life Insurance in India [ A Study with special Reference to Dharmapuri District] Dr. A. Vinayagamoorthy K. Senthilkumar](https://img.pdfslide.us/doc/110x75/5aad68c87f8b9a9c2e8e3158/index-p-parmar-commerce-24-26-8-a-growth-of-rural-postal-life-insurance-in.jpg)