Embed Size (px)
Citation preview
Census of India 2011
MADHYA PRADESH
SERIES-24 PART XII-B
DISTRICT CENSUS HANDBOOK
DATIA
VILLAGE AND TOWN WISE
PRIMARY CENSUS ABSTRACT (PCA)
DIRECTORATE OF CENSUS OPERATIONS MADHYA PRADESH

Some of the village boundaries and their locations are shown in C.D. Block maps notionally. Physical features (R.F. etc.) shown in C.D. Block maps are replication of 2001 census maps. Jurisdictional changes occurred during 2001-11 have been updated on 2001 census maps. C.D. Block maps included in this publication have been prepared, carving out the boundaries from tahsil maps.
© Government of India copyright 2015

CENSUS OF INDIA 2011 MADHYA PRADESH
SERIES-24 PART XII - B
DISTRICT CENSUS HANDBOOK
DATIA
VILLAGE AND TOWN WISE PRIMARY CENSUS ABSTRACT (PCA)
Directorate of Census Operations,
Madhya Pradesh
MOTIF
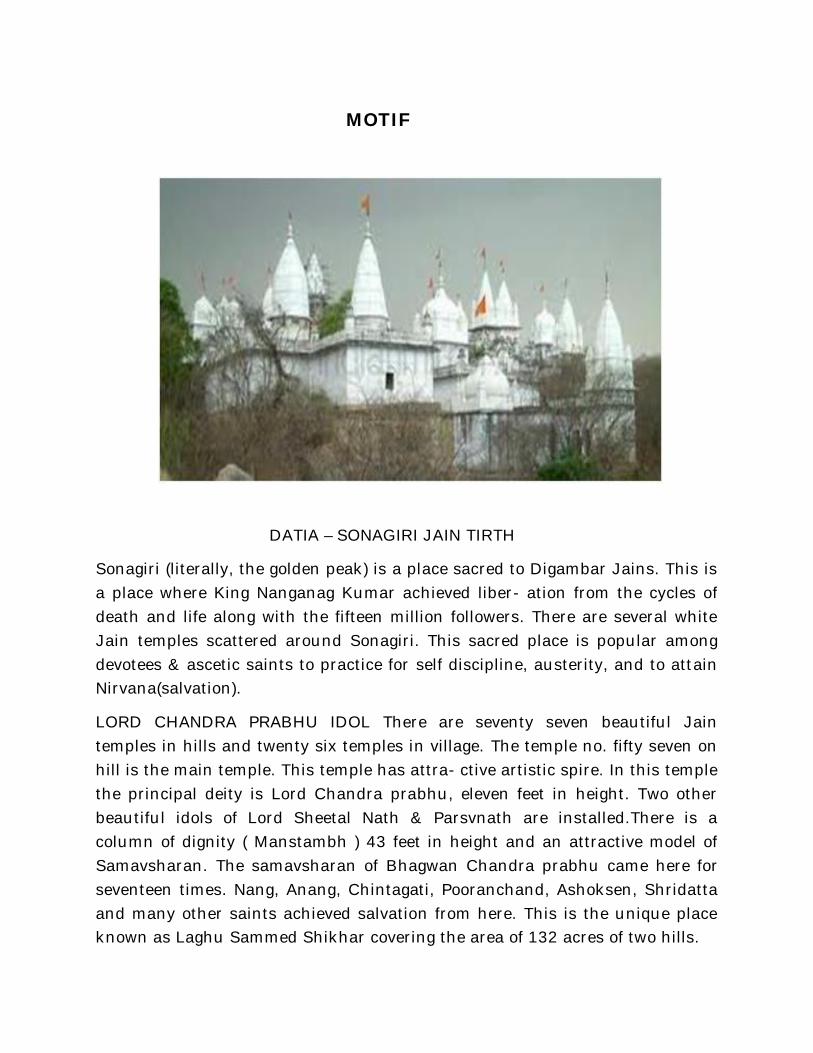
DATIA – SONAGIRI JAIN TIRTH
Sonagiri (literally, the golden peak) is a place sacred to Digambar Jains. This is a place where King Nanganag Kumar achieved liber- ation from the cycles of death and life along with the fifteen million followers. There are several white Jain temples scattered around Sonagiri. This sacred place is popular among devotees & ascetic saints to practice for self discipline, austerity, and to attain Nirvana(salvation).
LORD CHANDRA PRABHU IDOL There are seventy seven beautiful Jain temples in hills and twenty six temples in village. The temple no. fifty seven on hill is the main temple. This temple has attra- ctive artistic spire. In this temple the principal deity is Lord Chandra prabhu, eleven feet in height. Two other beautiful idols of Lord Sheetal Nath & Parsvnath are installed.There is a column of dignity ( Manstambh ) 43 feet in height and an attractive model of Samavsharan. The samavsharan of Bhagwan Chandra prabhu came here for seventeen times. Nang, Anang, Chintagati, Pooranchand, Ashoksen, Shridatta and many other saints achieved salvation from here. This is the unique place known as Laghu Sammed Shikhar covering the area of 132 acres of two hills.
Pages
1 1
2 3
3 5
4 7
5 9
6 11
7 12
8 13
9
(i) 16
(ii) 21
(iii) 29
(iv) 37
(v) 45
(vi) 53
(vii) 139
10 Section –II Tables based on Households Amenities and Assets (Rural/Urban) at District and Sub-District level.
(i) Table -1: Households by Ownership status and by Number of Dwellingrooms occupied in the District, 2011 143
Urban PCA-Town wise Primary Census Abstract
Section - I Primary Census Abstract (PCA)
Brief note on Primary Census Abstract
District Primary Census Abstract
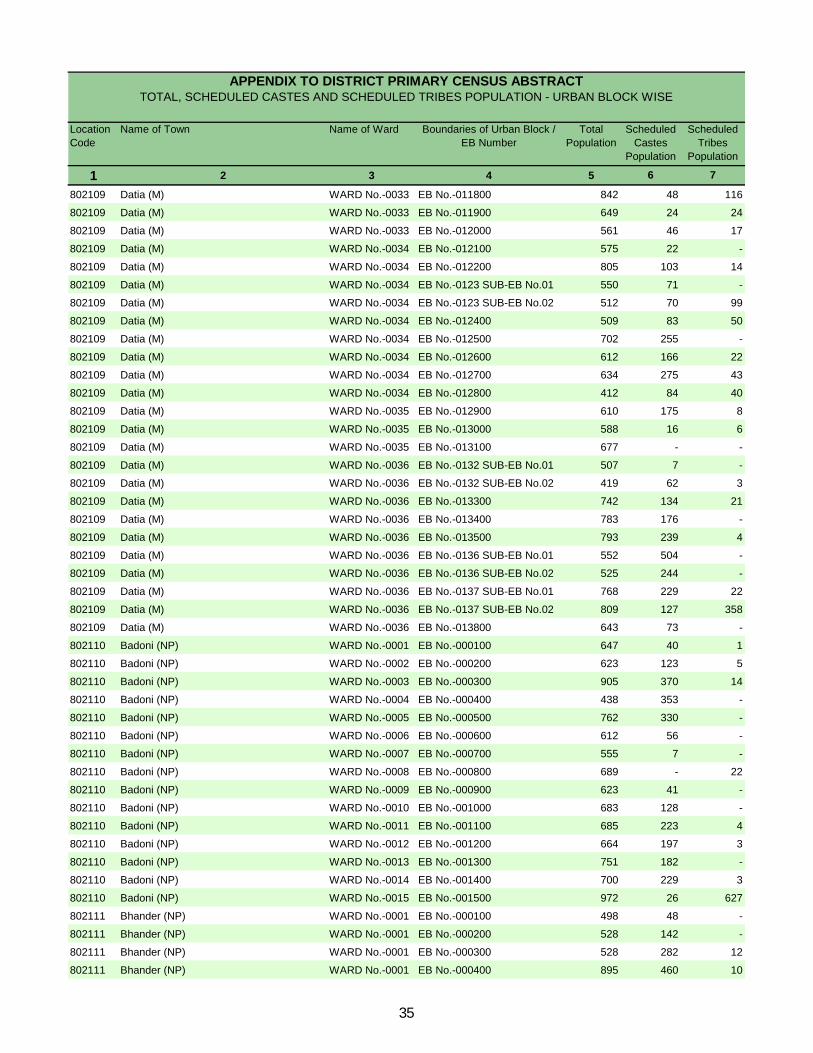
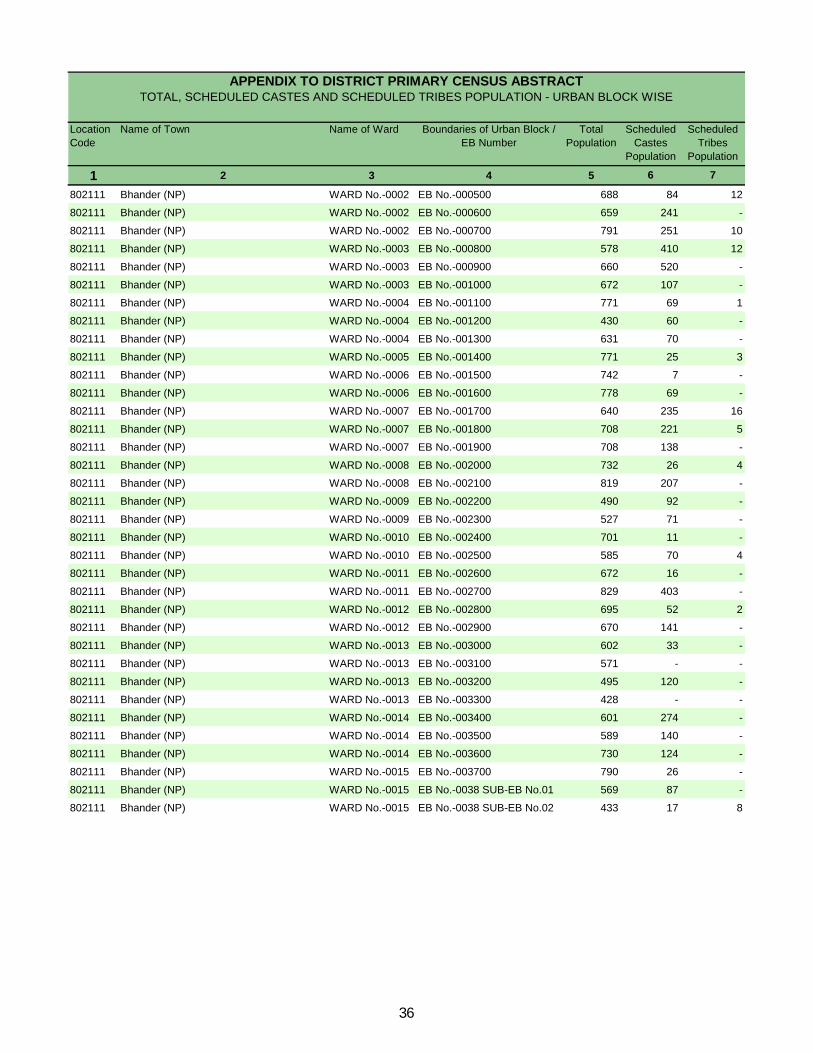
Appendix to District Primary Census Abstract Total, Scheduled Castes andScheduled Tribes Population - Urban Block wise
Primary Census Abstract for Scheduled Castes (SC)
Primary Census Abstract for Scheduled Tribes (ST)
Rural PCA-C.D. blocks wise Village Primary Census Abstract
Contents
Administrative Setup
Important Statistics
District Highlights - 2011 Census
Brief History of the District
Foreword
Preface
Acknowledgement
History and Scope of the District Census Handbook
(ii) Table -2: Percentage distribution of Households living in Permanent,Semi permanent and Temporary houses, 2011 144
(iii) Table -3: Number and Percentage of Households by main source ofDrinking water, 2011 146
(iv) Table -4: Number and Percentage of Households by main source ofLighting, 2011 148
(v) Table -5: Number and Percentage of Households by type of Latrinefacility, 2011 150
(vi) Table -6: Number and Percentage of Households by type of Drainageconnectivity for waste water outlet, 2011 152
(vii) Table -7: Number and Percentage of Households by availability ofKitchen facility, 2011 153
(viii) Table -8: Number and Percentage of Households by type of fuel used forCooking, 2011 154
(ix) Table -9:Number and Percentage of Households availing Bankingservices and number of Households having each of thespecified Assets, 2011
156
1
FOREWORD
The District Census Handbook (DCHB) is an important publication of theCensus Organization since 1951. It contains both Census and non Census data of urban and rural areas for each District. The Census data provide information on demographic and socio-economic characteristics of population at the lowest administrative unit i.e. of each Village, Town and Ward of the District. The Primary Census Abstract (PCA) part of this publication contains Census data including data on household amenities collected during 1st phase of the Census i.e. House Listing and Housing Census. The non Census data presented in the DCHB is in the form of Village Directory and Town Directory contain information on various infrastructure facilities available in the village and town viz; education, medical, drinking water, communication and transport, post and telegraph, electricity, banking, and other miscellaneous facilities. Later on, the Telegraph Services were closed by the Government of India on 15th July, 2013. The data of DCHB are of considerable importance in the context of planning and development at the grass-root level.
2. In the 1961 Census, DCHB provided a descriptive account of the District,administrative statistics, Census tables and Village and Town Directory including Primary Census Abstract. This pattern was changed in 1971 Census and the DCHB was published in three parts: Part-A related to Village and Town Directory, Part-B to Village and Town PCA and Part-C comprised analytical report, administrative statistics, District Census tables and certain analytical tables based on PCA and amenity data in respect of Villages. The 1981 Census DCHB was published in two parts: Part-A contained Village and Town Directory and Part-B the PCA of Village and Town including the SCs and STs PCA up to Tahsil/Town levels. New features along with restructuring of the formats of Village and Town Directory were added. In Village Directory, all amenities except electricity were brought together and if any amenity was not available in the referent Village, the distance in broad ranges from the nearest place having such an amenity, was given.
3. The pattern of 1981 Census was followed by and large for the DCHB of 1991Census except the format of PCA. It was restructured. Nine-fold industrial classification of main workers was given against the four-fold industrial classification presented in the 1981 Census. In addition, sex wise population in 0-6 age group was included in the PCA for the first time with a view to enable the data users to compile more realistic literacy rate as all children below 7 years of age had been treated as illiterate at the time of 1991 Census. One of the important innovations in the 1991 Census was the Community Development Block (CD Block) level presentation of Village Directory and PCA data instead of the traditional Tahsil/Taluk/PS level presentation.
4. As regards DCHB of 2001 Census, the scope of Village Directory was improvedby including some other amenities like banking, recreational and cultural facilities, newspapers & magazines and `most important commodity’ manufactured in a Village in addition to prescribed facilities of earlier Censuses. In Town Directory, the statement on Slums was modified and its coverage was enlarged by including details on all slums instead of ‘notified slums’.
2
5. The scope and coverage of Village Directory of 2011 DCHB has been widened byincluding a number of new amenities in addition to those of 2001. These newly added amenities are: Pre-Primary School, Engineering College, Medical College, Management Institute, Polytechnic, Non-formal Training Centre, Special School for Disabled, Community Health Centre, Veterinary Hospital, Mobile Health Clinic, Medical Practitioner with MBBS Degree, Medical Practitioner with no degree, Traditional Practitioner and faith Healer, Medicine Shop, Community Toilet, Rural Sanitary Mart or Sanitary Hardware Outlet in the Village, Community Bio- gas, Sub Post Office, Village Pin Code, Public Call Office, Mobile Phone Coverage, Internet Cafes/ Common Service Centre, Private Courier Facility, Auto/Modified Autos, Taxis and Vans, Tractors, Cycle-pulled Rickshaws, Carts driven by Animals, Village connected to National Highway, State Highway, Major District Road, and Other District Road, Availability of Water Bounded Macadam Roads in Village, ATM, Self-Help Group, Public Distribution System(PDS) Shop, Mandis/Regular Market, Weekly Haat, Agricultural Marketing Society, Nutritional Centers (ICDS), Anganwadi Centre, ASHA (Accredited Social Health Activist), Sports Field, Public Library, Public Reading Room, Assembly Polling station, Birth & Death Registration Office. In the Town Directory, seven Statements containing the details and the data of each Town have been presented viz.; (i) Status and Growth History of Towns, (ii) Physical Aspects and Location of Towns, (iii) Civic and other Amenities (iv) Medical Facilities, (v) Educational, Recreational & Cultural Facilities, (vi) Industry & Banking, and (vii) Civic & other amenities in Slums respectively. CD Block wise data of Village Directory and Village PCA have been presented in DCHB of 2011 Census as presented in earlier Census.
6. The data of DCHB 2011 Census have been presented in two parts, Part-Acontains Village and Town Directory and Part-B contains Village and Town wise Primary Census Abstract. Both the Parts have been published in separate volumes in 2011 Census.
7. The Village and Town level amenities data have been collected, compiled andcomputerized under the supervision of Shri Sachin Sinha, IAS, Directorate of Census Operations, Madhya Pradesh. The task of Planning, Designing and Co-ordination of this publication was carried out by Dr. Pratibha Kumari, Assistant Registrar General (SS) under the guidance & supervision of Dr. R.C.Sethi, Ex-Addl. RGI and Shri Deepak Rastogi present Addl.RGI. Shri A.P. Singh, Deputy Registrar General, (Map) provided the technical guidance in the preparation of maps. Shri A.K. Arora, Joint Director of Data Processing Division under the overall supervision of Shri M.S.Thapa, Addl. Director (EDP) provided full cooperation in preparation of record structure for digitization and validity checking of Village and Town Directory data and the programme for the generation of Village Directory and Town Directory including various analytical inset tables as well as Primary Census Abstract (PCA). The work of preparation of DCHB, 2011 Census has been monitored in the Social Studies Division. I am thankful to all of them and others who have contributed to bring out this publication in time.
(C.Chandramouli) Registrar General &
Census Commissioner, India New Delhi. Dated:- 16-06-2014
3
Preface
The District Census Handbook (DCHB) compiled by the Census organization, Government of India is one of the most valuable and useful product of the Census which is brought out for each district in the State having micro level Census and Non Census data . It contains CD Block wise Primary Census Abstract at village/ward level under Census data. The amenities data along with additional information regarding area, population, civic status, land use etc. for every village/town is covered under Non Census data. This publication started from the 1951 Census, but prior to this, a similar publication was released in the earlier censuses. Those publications contained only village statistics, village names and total population. The 1951 Census could, therefore be said to represent a significant step forward, in the process of making detailed census statistics available down to the village level. An important achievement, for the first time in 1991 Census, was that the village level data was presented Community Development Blockwise.
The scope of District Census Handbook has undergone considerable change since 1951. This is basically due to the growing demand for more information. To make the basic statistics available to the data users, as early as possible, the District Census Handbook of 1991 was brought out in a single volume as against the earlier practice of bringing it out in two parts. The volume was however divided in two parts viz. part A and part B. Part A contained the Village/Town Directory while part B contained the Primary Census Data. Continuing the practice of 1991 Census, the 2001 series of the District Census Handbooks also comprised of two parts. However the present DCHB is prepared in two separate volumes. Volume II contains the Primary Census Abstract and Volume I contains the village/town directory of the District.
Volume II of the District Census Handbook contains Village and Town Primary Census Abstract. This provides information on area, occupied residential houses, number of households, sex-wise total population. child population in age-group 0-6, Scheduled Castes and Scheduled Tribes, literates, workers, non-workers and classification of workers into four broad categories i.e. cultivators, agricultural labourers, workers in household industries and other workers in respect of each village and town of the district. Besides the brief history and other major characteristics of the district, inset tables and appendixes based on Houselisting and PCA alongwith analysis in the District Census Handbook provide glimpse of availability of amenities to villages relating to housing, assets available with households and demographic profile of population at tahsil/ C.D block level which are helpful for rural planning.
Volume I contains Village Directory which provides information on infrastructure amenities and land use data at village level i.e. name and location of villages, area, population, number of households, important civic amenities/facilities available in villages like educational, medical, drinking water, drainage, post, telegraph, public call office, mobile coverage, internet cafe, private courier service, commercial and co-operative banks, agricultural and non-agricultural credit societies, recreational and cultural facilities, communications, approach to the village, nearest town and its distance and power supply. Similarly, the comprehensive statements and their analysis of Town Directory provide valuable information on growth, physical, economic, civic and development aspects in respect of each town of the district. C.D.
4
block being the lowest administrative unit for developmental planning, it is assumed that the data provided at this level would be extremely useful to the planners for formulating micro level development plans.
It may be noted that the village wise area figures presented in the PCA are based on village information as furnished by the revenue authority and the “total area” given for the community development blocks, is the sum total of the area figures of all villages coming under it. The “total area” of tahsil is based on the information furnished by the Commissioner, Land Records ,Government of Madhya Pradesh, Gwalior. In some cases the total area shown against the tahsil, may not tally with the total of the area figures of villages coming under it.
The design of 2011 District Census Handbook has been evolved centrally by the Census Commissioner, India and accordingly these books have been prepared by my office. In earlier censuses and until 1991, the cost of publication of these books were borne by the State Government but since 2001 these are being printed centrally by the Census organization. In accomplishing this task we have had the whole hearted cooperation of the staff at various levels of different departments of the State Government. The data supplied by the field level officers have been comparatively checked with 2001 DCHB information and have been cross checked with the data obtained from various departments. An attempt had been made to reconcile the discrepancies by external validation to make it more reliable. I am grateful to all heads of departments of the State Government, officers and staff engaged in the conduct of 2011 Census for their cooperation to accomplish this task.
Thecompilation of such a huge amount of varied data requires proper planning and close monitoring. We had the honour of having enlightened guidance and encouragement of Dr. C. Chandramouli, IAS, Registrar General and Census Commissioner of India.
The data presented in the District Census Handbook required a concerted team work of officers and staff member of this Directorate who were involved with it at various stages of its planning, supervision, field work, computerisation, preparation of manuscript, maps and printing. I express my appreciation for the painstaking dedicated service rendered by all of them and also to the officers and staff of Data Centre, Bhopal for their untiring cooperation in finalizing the 2011 Census Data.
I shall feel greatly rewarded if the book comes to the expectation of the data users.
Sachin Sinha Joint Secretary & Director Dated : Directorate of Census Operations, Bhopal 31.03.2014 Madhya Pradesh
5
ACKNOWLEDGEMENTS
SUPERVISION AND MONITORING SHRI P. K. CHAUDHARY JOINT DIRECTOR
OFFICERS ASSOCIATED SHRI S.L.JAIN JOINT DIRECTOR (UP TO JUNE 2013)
SHRI H.K.KAUSHAL DEPUTY DIRECTOR (UP TO JUNE 2012)
SHRI R.K. NAIK DEPUTY DIRECTOR
PREPARATION OF ANALYTICAL NOTE SHRI V.SATISH IYER ASSTT. DIRECTOR
SHRI RAJENDRA KUMAR RESEARCH OFFICER
DCHB/VILLAGE AND TOWN DIRECTORY SHRI R.L.JAIN ASSTT. DIRECTOR
SHRI JEROM KUJUR ASSTT. DIRECTOR
SMT ANCY REJI S.I. GR.II
SMT SUDHA SHRIVASVATA S.I. GR.II
SHRI ABHIMANYU SINGH S.I. GR.II
SMT FARZANA YUSUF S.I. GR.II
SHRI RISHABH KUMAR JAIN S.I. GR.II
SMT REKHA PINDAWALA SR. COMPILOR
SHRI RAM NARAYAN ASSTT. COMPILOR
MAP DR. RAJENDRA KUMAR RESEARCH OFFICER
SHRI VINOD KUMAR SINGH SENIOR DRAFTSMAN
SMT MEENA SHINDE SENIOR DRAFTSMAN
SHRI J.U.GODBOLE SENIOR DRAFTSMAN
SHRI RAJENDRA GUMDELWAR SENIOR DRAFTSMAN
SHRI MANOJ PRABHAKAR MANIK SENIOR DRAFTSMAN
SHRI JITENDRA SINGH VERMA DEO GR.B
6
CENTRAL TABULATION UNIT SHRI NAMIT YADAV ASSTT. DIRECTOR
SMT ANITA SHRIVASTAVA S.I. GR.II
SMT PRABHA SHRIVASTAVA S.I. GR.II
SMT. RIZWANA KHAN SR. COMPILOR
DESIGNING AND DEVELOPING SHRI GUNWANT V. DHABALE DATA PROCESSING ASSISTANT GR.A
SHRI MILIND DESHPANDE DEO GR.B
SHRI MANOJ NATHANI DEO GR.B
COMPOSING SHRI PRAVEEN KUMAR MODHE DEO GR.B
SHRI G.D. RAHI DEO GR.B
SHRI AJAY SONI DEO GR.B
SHRI JITENDRA BAKLIWAL DEO GR.B
SMT VAISHALI PUROHIT DEO GR.B
SMT VANDANA SAHU DEO GR.B
ORGI DATA PROCESSING DIVISION SHRI JASPAL SINGH LAMBA DD (EDP)
MS. USHA AD (EDP)
SHRI ANURAG GUPTA DPA GRADE ‘A’
SHRI MUKESH KUMAR MAHAWAR DPA GRADE ‘A’
MS. SHAGUFTA NASREEN BHAT DPA GRADE ‘A’
MS. KIRAN BALA SEXANA SR. SUPERVISOR
SHRI KHEM VERMA JADON SR. CONSULTANT
SHRI YASHWANT SINGH JR. CONSULTANT
7
HISTORY AND SCOPE OF THE DISTRICT CENSUS HANDBOOK
The need of data at the grass root level for the administrative and planning purposes at sub micro level as well as academic studies prompted the innovation of District Census Handbook. District Census Handbook is a unique publication from the Census organization which provides most authentic details of census and non-census information from village and town level to district level. The District Census Handbook was firstly introduced during the 1951 Census. It contains both census and non census data of urban as well as rural areas for each district. The census data contain several demographic and socio-economic characteristics of the lowest administrative unit i.e. of each village and town and ward of the district. The non census data comprise of data on availability of various civic amenities and infrastructural facilities etc. at the town and village level which constitute Village Directory and Town Directory part of the DCHB. The data of DCHB are of considerable importance in the context of planning and development at grass-root level.
In1961 census DCHB provided a descriptive account of the district, administrative statistics, census tables and village and town directory including Primary Census Abstract. This pattern was changed in 1971 Census and the DCHB was published in three parts: Part-A related to village and town directory, Part-B to village and town PCA and Part-C comprised analytical report, administrative statistics, district census tables and certain analytical tables based on PCA and amenity data in respect of villages.The 1981 census DCHB was published in two parts: Part-A contained village and town directory and Part-B the PCA of village and town including the SCs and STs PCA up to tahsil/town levels. New features along with restructuring of the formats of village and town directory were added into it. In Village Directory, all amenities except electricity were brought together and if any amenity was not available in the referent village, the distance in broad ranges from the nearest place having such an amenity, was given. The pattern of 1981 census was followed by and large for the DCHB of 1991 Census except the format of PCA. It was restructured. Nine-fold industrial classification of main workers was given against the four-fold industrial classification presented in the 1981 census. In addition, sex wise population in 0-6 age group was included in the PCA for the first time with a view to enable the data users to compile more realistic literacy rate as all children below 7 years of age had been treated as illiterate at the time of 1991 census. One of the important innovations in the 1991 census was the Community Development Block (CD Block) level presentation of village directory and PCA data instead of the traditional tahsil/taluk/PS level presentation.
8
As regards DCHB of 2001 Census, the scope of Village Directory was improved by including some other amenities like banking, recreational and cultural facilities, news papers & magazines and `most important commodity’ manufactured in a village in addition to prescribed facilities of earlier censuses. In Town Directory, the statement on Slums was modified and its coverage was enlarged by including details on all slums instead of ‘notified slums’.
The scope and coverage of Village Directory of 2011 DCHB hasbeen widenedby including a number of new amenities in addition to those of 2001. In the Town Directory, seven Statements containing the details and the data of each town have been presentedviz.;(i)-Status and Growth History of towns,(ii)-Physical Aspects and Location of Towns,(iii)-Civic and other Amenities,(iv)-Medical Facilities,(v)-Educational, Recreational & Cultural Facilities,(vi)-Industry & Banking, and (vii)-Civic & other amenities in Slums respectively.CD Block wise data of Village Directory and Village PCA have been presented in DCHB of 2011 census as presented in earlier census.The data of DCHB 2011Census have been presented in two parts, Part-Acontains Village and Town Directory and Part-B contains Village and Town wise Primary Census Abstract. Both the Parts have been published in separate volumes in 2011 Census.
--------------------------------------------------------
9
BRIEF HISTORY OF THE DISTRICT
The district is named after the district headquarters town of Datia. The term Datia is derived from Dant. As per the legend Danta Vakra, the danava (demon) king of Karush opposed Lord Krishna and was killed. Thus the place was known as Dant Nagar in those times.
In ancient times Datia was included in the Chedi kingdom and from all sources it can be surmised that the district shared the brilliance of the golden age came under Gupta sway in the middle of the fourth century till the early years of the eighth century A.D. after Nanda, Maurya, Sunga and Naga dynasty. Padmavati was the capital of royal house of the Nagas during the first century A.D.
In the year 515 A.D, the Huna chief Mihirakula acquired large part of Gwalior including Datia and remained till 533 A.D. when Mihirakula was defeated and killed by Yasodharman of Mandsaur. Then the district came under the sway of the Pratihara dynasty in the second half of the 8th century till the third quarter of the 10 th century A.D. Nagabhato II was a great conqueror who formed Datia as part of his empire.
The Chandellas, a Rajput clan ruled over the territory around Khujuraho in the earlier part of the 9th century A.D. The king Harshadeva was important king who ruled over the region from 900 to 925 A.D. and enhanced the army and became the most powerful monarch. Dhanga was the greatest king of Chandella dynasty and was a military genius ruled over the kingdom till 1008 A.D. The next king Vidyadhara achieved the distinction of being the only Indian ruler of those times who effectively checked Mahmood’s triumphant march in India and saved his kingdom from needless destruction by the ruthless invader. From Vidyadhara onwards the Chandella rulers were entangled in protracted clashes with the Chedi and Paramar rulers which kept their kingdom in constant turmoil. The last known rulers of this dynasty were Hammitavarman and Viravarman II after whom nothing is heard of this royal house.
After the downfall of Chandella dynasty, Sultanate (mugal period) started from Qutbuddin Aibak in 1207 A.D. Datia territory was a part of Mohammad –Bin Tughluqs regime till 1351 A.D. The Sultanate period lasted from year 1389-90. After the invasion of Timur in 1398 the Tomar Rajputs rose to power at Gwalior and included part of Datia district till the final victory of Ibrahim Lodi in 1518. Dungar Singh with his extra ordinary abilities attained a new eminence in the political spirit of northern India. After the downfall of Tomars and Khangars, Bundelas became powerful in the land of this region who fought with Mughals. In the year 1736 Indrajit, the grandson of Ram Chandra succeeded the throne without any interest. He died at Datia in 1762, succeeded by his son Shatrujat
10
who ruled Datia till 1801. After his death Datia came under the British protection although the king was free in the internal administration of the state. The king Parichhat (died in 1839) was succeeded by adopted son Vijai Bahadur who kept himself aloof from the politics.
Practically whole of the former princely state of Datia became a part of the former province of Vindhya Pradesh in 1948. With the merger of Vindhya Pradesh and other areas, the new state of Madhya Pradesh came into being on 1st November 1956 as a consequence of Reorganization of states on linguistic basis and Datia continued to remain as a separate district of the new state. In the year 1998, Bhandertahsil of district Gwalior and Udgavan revenue circle of the Shivpuri district were merged in the district.
11
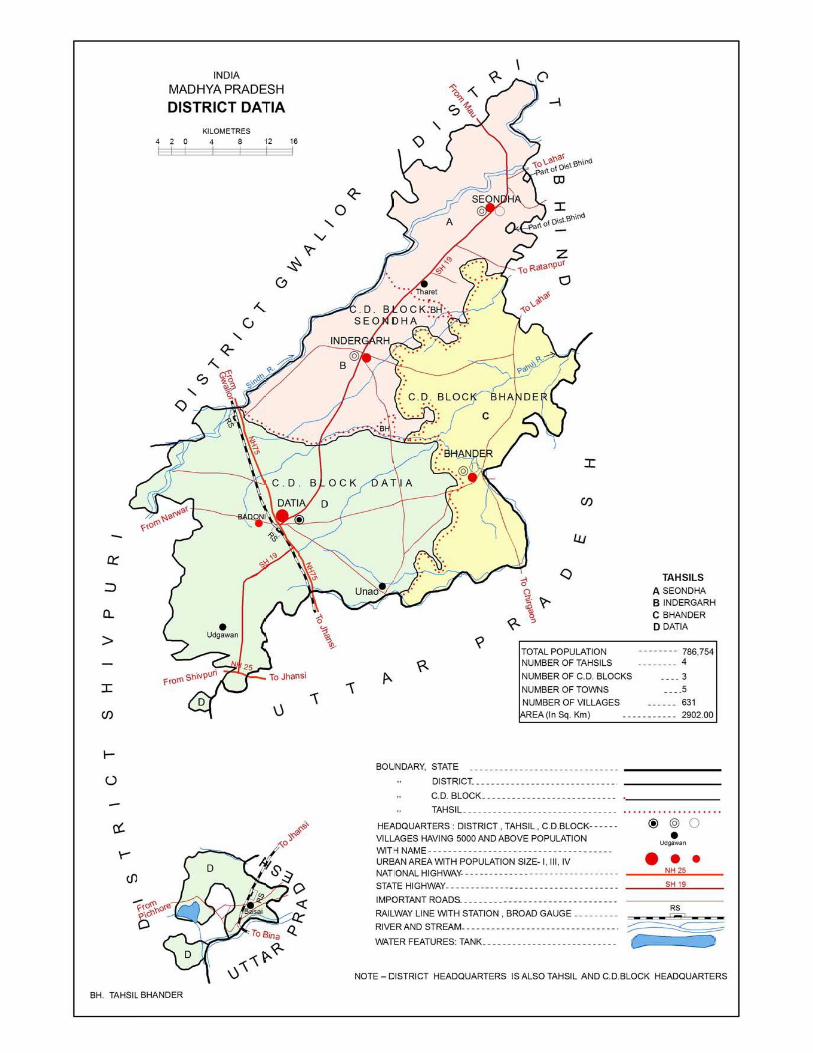
ADMINISTRATIVE SETUP
The district is situated in the northern Bundelkhand region of Madhya Pradesh. The district headquarter is Datia. According to Census 2011, the total number of villages in the district are 631. Out of which 586 villages are inhabited and 45 villages are un-inhabited. Tahsilwise number of villages are, Seondha(110), Indergarh(113), Datia(254) and Bhander(154). Number of Gram Panchayats are 281. There are 285 Patwarihalka, Revenue villages 247 under revenue administration. In the district there are 4 tahsils, 3 CD blocks, namely Seondha, Datia and Bhander. There are 5 towns in the district. As per urban classification, Datia municipality (M), whereas Seondha(N.P.), Indergarh(N.P.), Badoni(N.P.) and Bhander(N.P.) are Nagar Panchayats. In all the CD blocks headquarters there are 3 Janpadpanchayats. The district has one parliamentary constituency i.e. Datia and three assembly constituencies viz. Seondha, Datia and Bhander.
The district is the basic territorial unit of administration in the state as well as in India. The Collector, as the head of district administration is the key-functionary of the Government, having vast powers and wide responsibilities. In many ways he is the link between the State Government and the people. He is the custodian of law & order and local administration.
Collector is the Chief Executive Officer of the district and as such he/she exercises general supervision over various departments. Co-ordination of the activities of various departments, control over local-self governing bodies, execution of Government schemes and miscellaneous functions, such as Panchayats, Census, election and relief measures in time of natural calamities like floods, famine and epidemics, etc.
The Organisational set-up of the collectorate may be divided into three main, viz.(i) land revenue, land-records including consolidation of land and other allied matters. (ii) law& order and (iii) development.
The Collector is assisted by Deputy Collectors, SDM, Tahsildars, Naib Tahsildars, revenue inspectors, Patwaries etc. The Collector is also associated with a number of other committee in the district. The most important among them is the District Advisory Committee. The Collector is also visited with statutory powers under excise act, so as to enable him/her to implement the excise and prohibition policy of the Government. Superintendent of Police is the head of police department at the district headquarters, In order to facilitate proper and smooth judicial administration there are 23 police-stations and 6 police out-post in the district.
The Judiciary is independent. At the district level, there is District Court headed by District and Session Judge. District and Session Judge is assisted by Civil Judges posted at tahsil level.
12
DISTRICT HIGHLIGHTS - 2011 CENSUS
The district occupies 43rd place in the state according to population.
The district occupies 49th rank in the state in terms of area having 2,902
sq. km which is 0.94 percent of the total area of state.
Literacy Rate of Datia district is 72.6 percent and it occupies 11th
position in the state. The female literacy rate of the district is 59.4
percent.
Density wise the rank of the district is 13th in the state.
Ranking of the district according to the sex-ratio is 47th in the state.
Female work participation of the district is 26.0 percent of total female
population. Rank of the district according to female work participation is
40th.
Population wise largest village is Unao of Datia tahsil L.C.No.454755
with 8182 population and smallest villages are Khiriya, Bilhar of
Indergarh, Datia, tahsil L.C.No. 454514, 454766 with population of only
1 person.
Population wise largest town is Datia (M) having population 100284 and
smallest is Badoni (NP) with 10309 population.
Economy of the district is mainly dependent on agriculture and the
district is famous for Jain temple of Sonagiri.
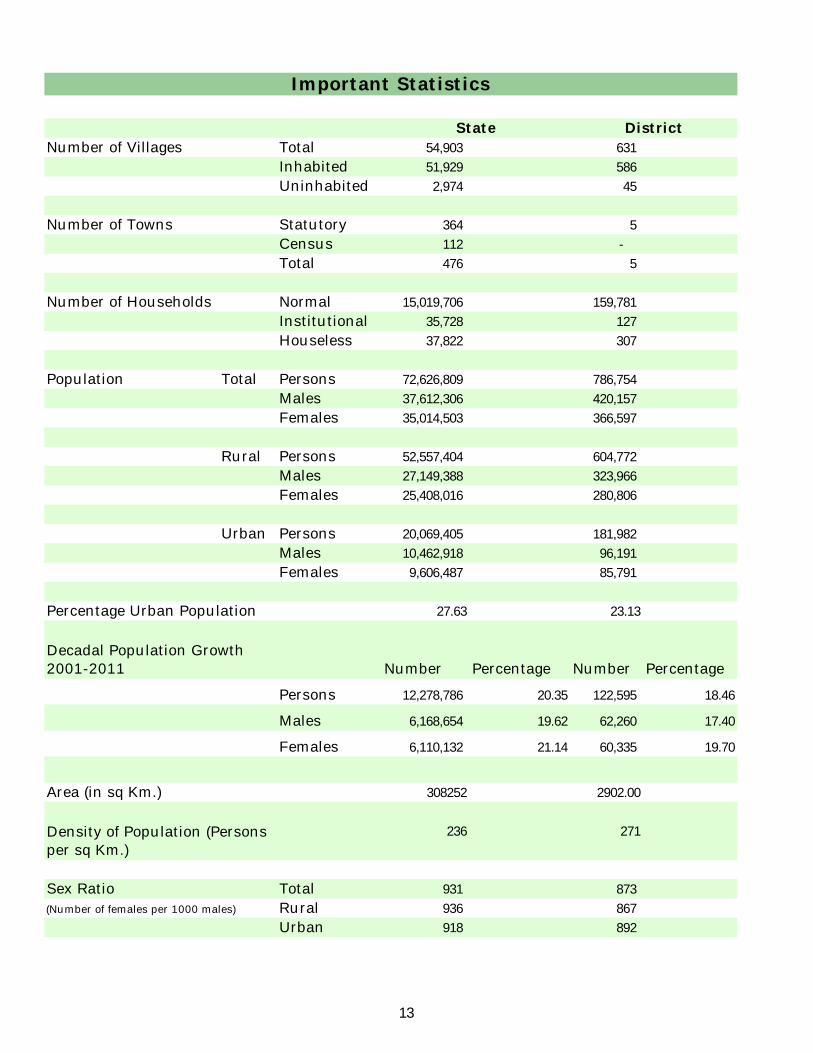
Number of Villages Total 54,903 631 Inhabited 51,929 586 Uninhabited 2,974 45
Number of Towns Statutory 364 5 Census 112 - Total 476 5
Number of Households Normal 15,019,706 159,781 Institutional 35,728 127 Houseless 37,822 307
Population Total Persons 72,626,809 786,754 Males 37,612,306 420,157 Females 35,014,503 366,597
Rural Persons 52,557,404 604,772 Males 27,149,388 323,966 Females 25,408,016 280,806
Urban Persons 20,069,405 181,982 Males 10,462,918 96,191 Females 9,606,487 85,791
Percentage Urban Population 27.63 23.13
Number Percentage Number Percentage
Persons 12,278,786 20.35 122,595 18.46
Males 6,168,654 19.62 62,260 17.40
Females 6,110,132 21.14 60,335 19.70
Area (in sq Km.) 308252 2902.00
236 271
Sex Ratio Total 931 873 (Number of females per 1000 males) Rural 936 867
Urban 918 892
District
Important Statistics
Decadal Population Growth 2001-2011
Density of Population (Persons per sq Km.)
State
13
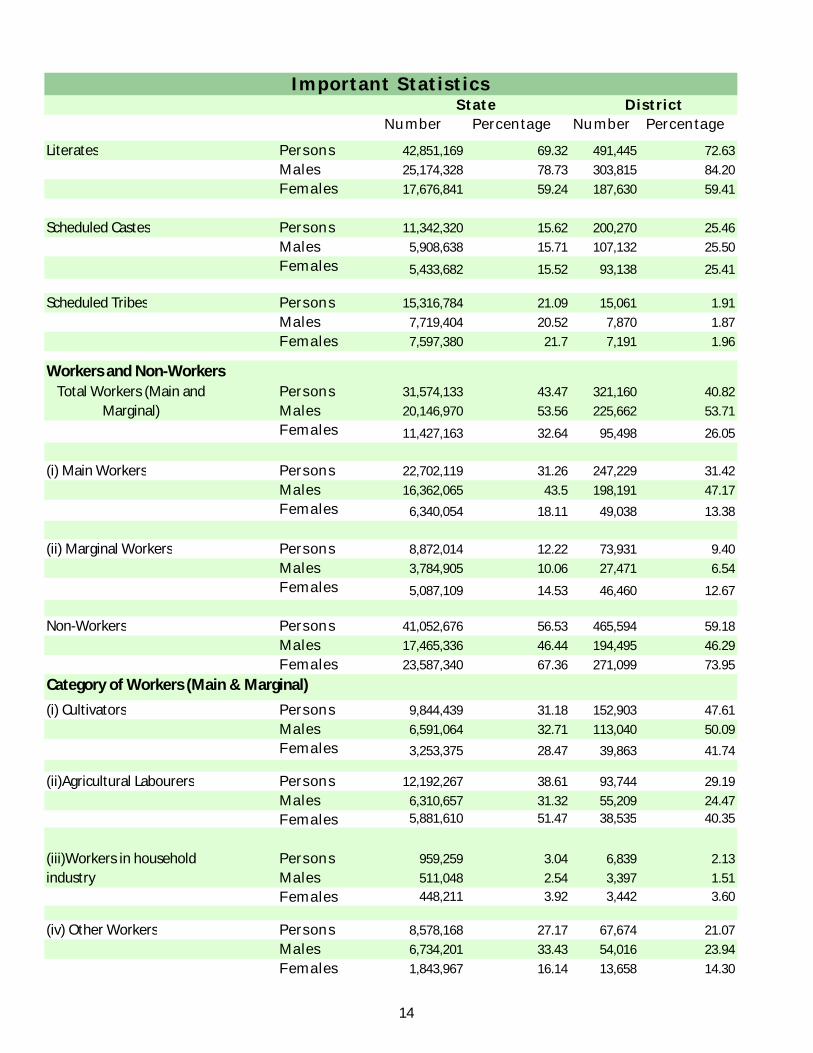
Important Statistics
Number Percentage Number Percentage
Literates Persons 42,851,169 69.32 491,445 72.63Males 25,174,328 78.73 303,815 84.20Females 17,676,841 59.24 187,630 59.41
Scheduled Castes Persons 11,342,320 15.62 200,270 25.46Males 5,908,638 15.71 107,132 25.50Females 5,433,682 15.52 93,138 25.41
Scheduled Tribes Persons 15,316,784 21.09 15,061 1.91Males 7,719,404 20.52 7,870 1.87Females 7,597,380 21.7 7,191 1.96
Workers and Non-WorkersPersons 31,574,133 43.47 321,160 40.82Males 20,146,970 53.56 225,662 53.71Females 11,427,163 32.64 95,498 26.05
(i) Main Workers Persons 22,702,119 31.26 247,229 31.42Males 16,362,065 43.5 198,191 47.17Females 6,340,054 18.11 49,038 13.38
(ii) Marginal Workers Persons 8,872,014 12.22 73,931 9.40Males 3,784,905 10.06 27,471 6.54Females 5,087,109 14.53 46,460 12.67
Non-Workers Persons 41,052,676 56.53 465,594 59.18Males 17,465,336 46.44 194,495 46.29Females 23,587,340 67.36 271,099 73.95
(i) Cultivators Persons 9,844,439 31.18 152,903 47.61Males 6,591,064 32.71 113,040 50.09Females 3,253,375 28.47 39,863 41.74
(ii)Agricultural Labourers Persons 12,192,267 38.61 93,744 29.19Males 6,310,657 31.32 55,209 24.47Females 5,881,610 51.47 38,535 40.35
Persons 959,259 3.04 6,839 2.13Males 511,048 2.54 3,397 1.51Females 448,211 3.92 3,442 3.60
(iv) Other Workers Persons 8,578,168 27.17 67,674 21.07Males 6,734,201 33.43 54,016 23.94Females 1,843,967 16.14 13,658 14.30
Total Workers (Main and Marginal)
Category of Workers (Main & Marginal)
(iii)Workers in household industry
State District
14
Section - I
Primary Census Abstract (PCA)
16
Brief Note on Primary Census Abstract
Introduction: The Indian Census has the reputation of being one of the best in the world.
The first Census in India was conducted in the year 1872. This was conducted at different points of time in different parts of the country. In 1881 a Census was taken for the entire country simultaneously. Since then, Census has been conducted every ten years, without a break. Thus, the Census of India 2011 was the fifteenth in this unbroken series since 1872, the seventh after independence and the second census of the third millennium and twenty first century. The census has been uninterruptedly continued despite of several adversities like wars, epidemics, natural calamities, political unrest, etc.
The Census of India is conducted under the provisions of the Census Act 1948 and the Census Rules, 1990. In Censuses until 1931, a synchronous de-facto method was adopted wherein the Census was conducted throughout the country on a single night. This being a very costly affair and involved the deployment of very large force at one point of time was given up in 1941. Since then the same methodology has been followed in all the Censuses. It is a gigantic operation and considered to be the single largest, complex, peace time administrative exercise in the world.
The Census Operation in India is carried out in two distinct but inter connected phases - the House listing and Housing Census followed by the Population Enumeration. During the first phase of Census 2011 i.e., House listing and Housing Census, the buildings, census houses and households were identified and systematically listed in the House Listing and Housing Census Schedule during the period April to September, 2010 in different States/Union Territories. Apart from listing of houses, some useful data on the amenities available to the households was also collected for assessing condition of human settlements, housing deficits etc.
Censuses prior to Census 2001 had the system of collecting the information through Individual Slip which was a key schedule for every individual. The information collected through slip was then compiled for a household. Some information was also collected in addition to this for the household. During 2001 Census a comprehensive Household Schedule was adopted replacing the individual slip concept. In 2011 Census also similar household schedule was used for canvassing. The scope of demographic, socio-economic parameters has been widened in every census.
2. Population Enumeration - Census 2011: The field work of the second phase i.e. Population Enumeration was carried out during February-March, 2011. One of the essential features of Population Enumeration in the second phase was that each person was enumerated and her/his individual particulars were collected at a well-defined point of time.
17
The Census moment and the reference date for the Census of India 2011 was 00:00 hours of 1st March, 2011. The enumeration was conducted from 9th February to 28th February, 2011 along with a revisional round from 1st March, 2011 to 5th March, 2011 synchronously all over the country except for few specific areas of the Jammu & Kashmir, Himachal Pradesh and Uttarakhand states that remain snowbound in February. In these locations the population enumeration was done from 11th September, 2010 to 30th September, 2010 along with a revisional round from 1st October, 2010 to 5th October, 2010. The reference date for the census in snow bound non-synchronous areas of these states was 00.00 hours of the first day of October, 2010. In addition to the coverage during House listing & Housing Census, the enumeration of the Houseless population was carried out on the night of 28th February, 2011, as has been the usual practice. For the purpose of Census, certain areas where the access of the civilian enumerators was not permissible due to security reasons termed as ‘Special Charges’ such as the Defence and strictly Military/Para-Military areas, including operational areas were also covered. Such areas were not covered during the House listing & Housing Census. In addition to the defence/para-military areas, Special Charges also included certain factory areas, certain colonies, sensitive areas, scientific establishments, etc. These also formed Special Charges as these were not accessible by the usual census enumerator.
3. Quality Assurance:A Task Force for Quality Assurance (TFQA) functioned under the
chairmanship of the RG & CCI. Experienced officers of the different divisions of the organization i.e. Heads and senior officers of the Census Division, Data Processing Division, Map Division, Demography Division and Social Studies Division comprised the TFQA. The Directors of Census Operations were co-opted as members whenever the TFQA discussed the data for their States/Union territories. The main objective of constituting the TFQA was to subject the data to stringent validation checks and ensure its quality before release as it was expedient to be satisfied itself about the quality of data before putting the same in public domain.
The Directors and their senior officers were involved at all levels with respect to the quality and the coverage of their states/Uts. The TFQA intensively scrutinized coverage and content parameters including edit and imputation logic. The most important aspect of the data quality was to ensure complete coverage of all geographical areas especially for the population enumeration phase where the data is disseminated right up to the village level in the rural areas and the ward level in the urban areas. Thus ensuring the complete coverage and correct geographical linkage of each enumeration block was one of the major planks of the quality control, especially for small area population statistics. The content was scrutinized mainly through the process of internal consistency, comparison with similar data in the past and also through validation with likewise data if
18
available, from external sources. Quite often the local knowledge and perception was looked at to understand both the existing and the new emerging trends of population distribution and characteristics. A very comprehensive check and edit mechanism was put in place to objectively examine the preliminary Census 2011 Population Enumeration results and finally clear them for use. The population data was cleared only after the full possible satisfaction of the TFQA.
The entire work relating to the data validation and scrutiny was completed by all the States/Union territories under the overall supervision and monitoring of the Census Division of the Office of the Registrar General, India with active cooperation and support of the Social Studies Division, Data Processing Division, Data Dissemination Division and Map Division.
4. Primary Census Abstract:The Primary Census Abstract which is important publication of 2011
Census gives basic information on Area, Total Number of Households, Total Population, Scheduled Castes, Scheduled Tribes Population, Population in the age group 0-6, Literates, Main Workers and Marginal Workers classified by the four broad industrial categories, namely, (i) Cultivators, (ii) Agricultural Labourers, (iii) Household Industry Workers, and (iv) Other Workers and also Non-Workers. The characteristics of the Total Population include Scheduled Castes, Scheduled Tribes, Institutional and Houseless Population and are presented by sex and rural-urban residence.
In 1981 census main workers were presented into four categories. As regards 1991 Census, the nine-fold industrial classification of main workers has been given in the Primary Census Abstract. One of the important features of the Primary Census Abstract of 1991 Census was the presentation of population of the age group 0-6 which is continued in 2001 and 2011 Census. All the children of age 6 years or less have been treated as illiterate even if the child is going to a school and may have picked up reading and writing. This will help the data users in better analysis and understanding of the literacy data as the literacy rate is calculated with 7 years and above population and it is referred as effective literacy rate. In 2001 and 2011 census four categories of main workers have been given in the Primary Census Abstract.
5. Level of Presentation of PCA data in District Census Handbooks:The format of Primary Census Abstract (PCA) adopted in the DCHB of
2001 Census has been continued for 2011 Census as the data on four categories of works have been presented similar to 2001 census. The Primary Census Abstract data in different PCAs are presented at different levels. The level of presentation of Primary Census Abstracts in DCHB is as under:
1. District Primary Census Abstract -District/C.D. Block/Town.2. Primary Census Abstract for Scheduled Castes- District/C.D. Block/Town.3. Primary Census Abstract for Scheduled Tribes -District/C.D. Block/Town.4. Village Primary Census Abstract -C.D. Block/Village wise.5. Urban Primary Census Abstract- Town/Ward level.
19
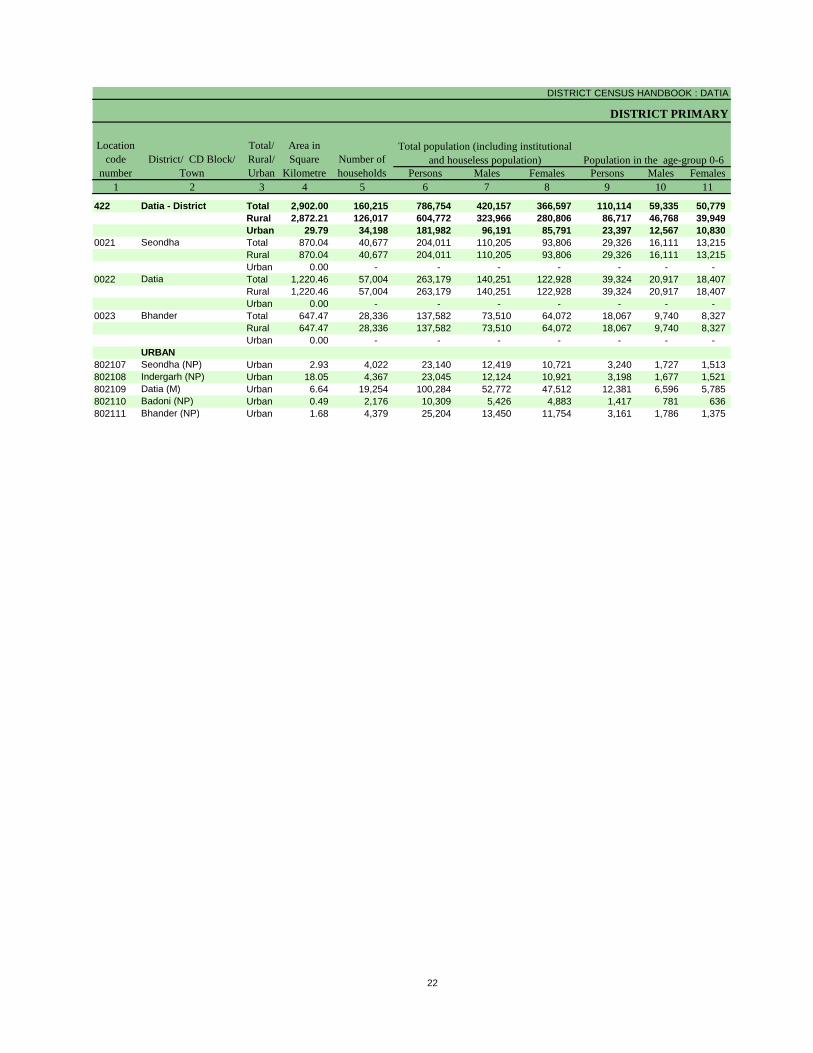
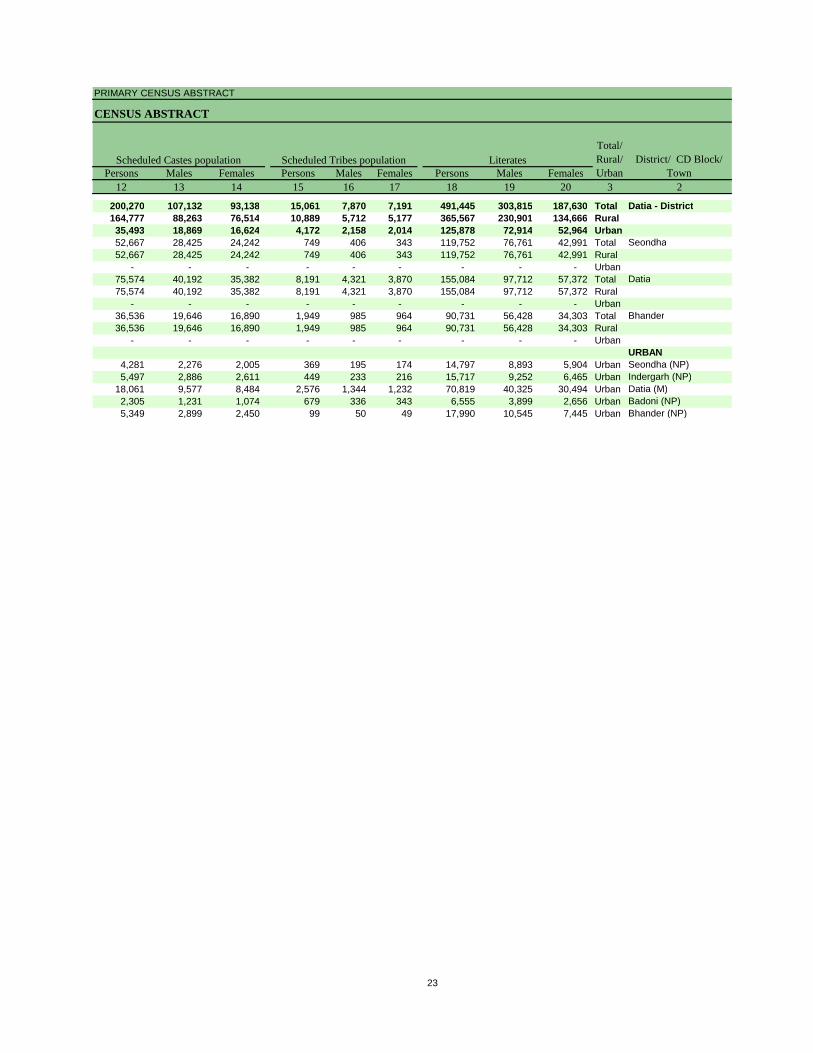
The PCA Data for villages was presented C.D. Block wise for the first time in 1991 Census. This practice is continued in 2001 and 2011 Census. The term ‘Total Population’ includes the Scheduled Castes, the Scheduled Tribes, the Institutional and the Houseless populations. An appendix to District Primary Census Abstract has also been furnished showing urban enumeration block-wise particulars on Total Population, the Scheduled Castes Population and the Scheduled Tribes Population for each town. 6. Area Figures: The area figures supplied by local revenue authorities of the district in respect of tahsils, Police Stations and by the local bodies in respect of towns are given in square kilometers. The area figures of the villages supplied by the Tahsildars in acres have been converted and shown in hectares. The area figures of the C.D. Block are the total of the village areas coming under each C.D. Block. The area figures for the district are the same as adopted by the Surveyor General of India to maintain uniformity at the national level.
-----------------------------------------------------------------

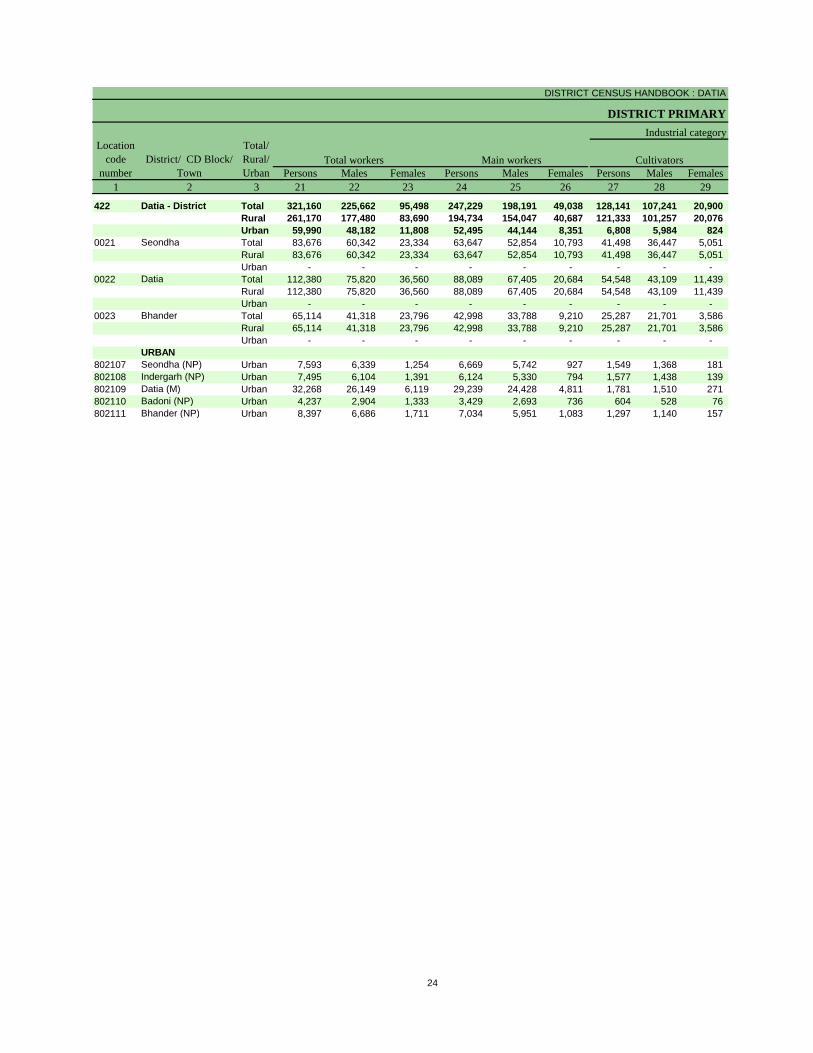
District Primary Census Abstract
DISTRICT CENSUS HANDBOOK : DATIA
DISTRICT PRIMARY
Persons Males Females Persons Males Females1 2 3 4 5 6 7 8 9 10 11
422 Datia - District Total 2,902.00 160,215 786,754 420,157 366,597 110,114 59,335 50,779 Rural 2,872.21 126,017 604,772 323,966 280,806 86,717 46,768 39,949 Urban 29.79 34,198 181,982 96,191 85,791 23,397 12,567 10,830
0021 Seondha Total 870.04 40,677 204,011 110,205 93,806 29,326 16,111 13,215 Rural 870.04 40,677 204,011 110,205 93,806 29,326 16,111 13,215 Urban 0.00 - - - - - - -
0022 Datia Total 1,220.46 57,004 263,179 140,251 122,928 39,324 20,917 18,407 Rural 1,220.46 57,004 263,179 140,251 122,928 39,324 20,917 18,407 Urban 0.00 - - - - - - -
0023 Bhander Total 647.47 28,336 137,582 73,510 64,072 18,067 9,740 8,327 Rural 647.47 28,336 137,582 73,510 64,072 18,067 9,740 8,327 Urban 0.00 - - - - - - -
URBAN802107 Seondha (NP) Urban 2.93 4,022 23,140 12,419 10,721 3,240 1,727 1,513 802108 Indergarh (NP) Urban 18.05 4,367 23,045 12,124 10,921 3,198 1,677 1,521 802109 Datia (M) Urban 6.64 19,254 100,284 52,772 47,512 12,381 6,596 5,785 802110 Badoni (NP) Urban 0.49 2,176 10,309 5,426 4,883 1,417 781 636 802111 Bhander (NP) Urban 1.68 4,379 25,204 13,450 11,754 3,161 1,786 1,375
Location code
numberDistrict/ CD Block/
Town
Total/ Rural/ Urban
Area in Square
KilometreNumber of households
Total population (including institutional and houseless population) Population in the age-group 0-6
22
PRIMARY CENSUS ABSTRACT
CENSUS ABSTRACT
Persons Males Females Persons Males Females Persons Males Females12 13 14 15 16 17 18 19 20 3 2
200,270 107,132 93,138 15,061 7,870 7,191 491,445 303,815 187,630 Total Datia - District164,777 88,263 76,514 10,889 5,712 5,177 365,567 230,901 134,666 Rural35,493 18,869 16,624 4,172 2,158 2,014 125,878 72,914 52,964 Urban52,667 28,425 24,242 749 406 343 119,752 76,761 42,991 Total Seondha52,667 28,425 24,242 749 406 343 119,752 76,761 42,991 Rural
- - - - - - - - - Urban75,574 40,192 35,382 8,191 4,321 3,870 155,084 97,712 57,372 Total Datia75,574 40,192 35,382 8,191 4,321 3,870 155,084 97,712 57,372 Rural
- - - - - - - - - Urban36,536 19,646 16,890 1,949 985 964 90,731 56,428 34,303 Total Bhander36,536 19,646 16,890 1,949 985 964 90,731 56,428 34,303 Rural
- - - - - - - - - UrbanURBAN
4,281 2,276 2,005 369 195 174 14,797 8,893 5,904 Urban Seondha (NP)5,497 2,886 2,611 449 233 216 15,717 9,252 6,465 Urban Indergarh (NP)
18,061 9,577 8,484 2,576 1,344 1,232 70,819 40,325 30,494 Urban Datia (M)2,305 1,231 1,074 679 336 343 6,555 3,899 2,656 Urban Badoni (NP)5,349 2,899 2,450 99 50 49 17,990 10,545 7,445 Urban Bhander (NP)
Scheduled Castes population Scheduled Tribes population LiteratesTotal/ Rural/ Urban
District/ CD Block/ Town
23
DISTRICT CENSUS HANDBOOK : DATIA
DISTRICT PRIMARY
Persons Males Females Persons Males Females Persons Males Females1 2 3 21 22 23 24 25 26 27 28 29
422 Datia - District Total 321,160 225,662 95,498 247,229 198,191 49,038 128,141 107,241 20,900 Rural 261,170 177,480 83,690 194,734 154,047 40,687 121,333 101,257 20,076 Urban 59,990 48,182 11,808 52,495 44,144 8,351 6,808 5,984 824
0021 Seondha Total 83,676 60,342 23,334 63,647 52,854 10,793 41,498 36,447 5,051 Rural 83,676 60,342 23,334 63,647 52,854 10,793 41,498 36,447 5,051 Urban - - - - - - - - -
0022 Datia Total 112,380 75,820 36,560 88,089 67,405 20,684 54,548 43,109 11,439 Rural 112,380 75,820 36,560 88,089 67,405 20,684 54,548 43,109 11,439 Urban - - - - - - - - -
0023 Bhander Total 65,114 41,318 23,796 42,998 33,788 9,210 25,287 21,701 3,586 Rural 65,114 41,318 23,796 42,998 33,788 9,210 25,287 21,701 3,586 Urban - - - - - - - - -
URBAN802107 Seondha (NP) Urban 7,593 6,339 1,254 6,669 5,742 927 1,549 1,368 181 802108 Indergarh (NP) Urban 7,495 6,104 1,391 6,124 5,330 794 1,577 1,438 139 802109 Datia (M) Urban 32,268 26,149 6,119 29,239 24,428 4,811 1,781 1,510 271 802110 Badoni (NP) Urban 4,237 2,904 1,333 3,429 2,693 736 604 528 76 802111 Bhander (NP) Urban 8,397 6,686 1,711 7,034 5,951 1,083 1,297 1,140 157
Location code
numberDistrict/ CD Block/
Town
Total/ Rural/ Urban
Total workers Main workers
Industrial category
Cultivators
24
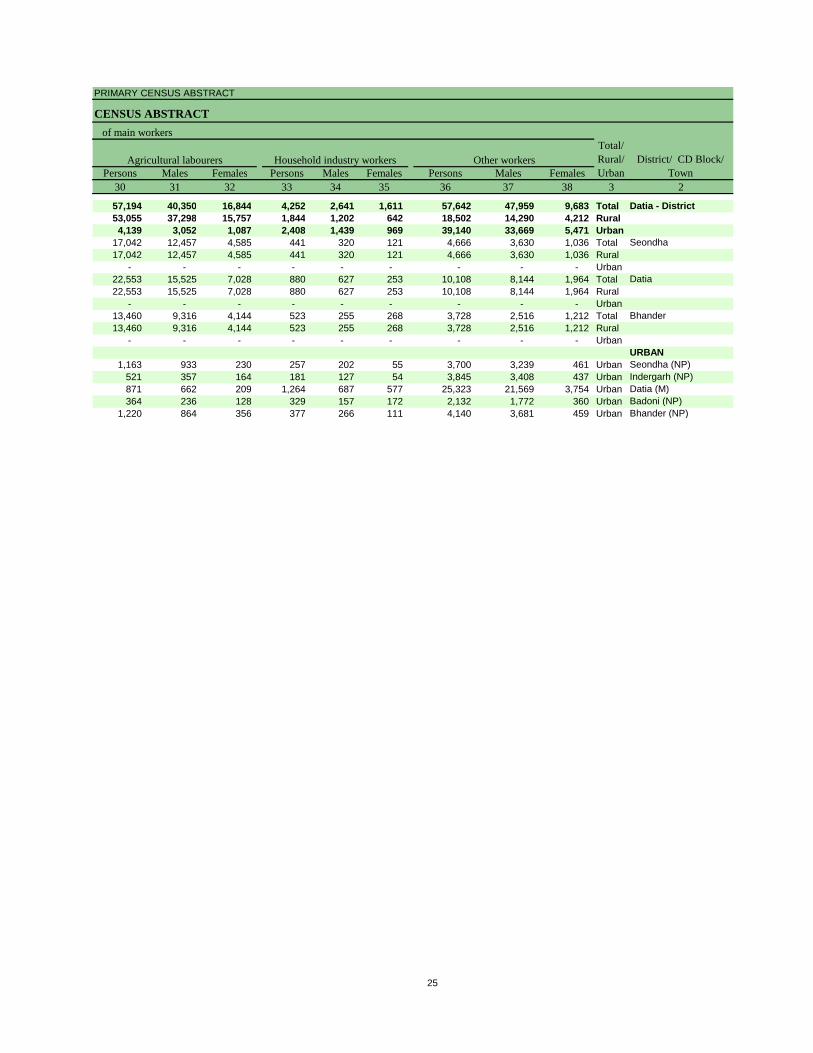
PRIMARY CENSUS ABSTRACT
CENSUS ABSTRACT
Persons Males Females Persons Males Females Persons Males Females30 31 32 33 34 35 36 37 38 3 2
57,194 40,350 16,844 4,252 2,641 1,611 57,642 47,959 9,683 Total Datia - District53,055 37,298 15,757 1,844 1,202 642 18,502 14,290 4,212 Rural4,139 3,052 1,087 2,408 1,439 969 39,140 33,669 5,471 Urban
17,042 12,457 4,585 441 320 121 4,666 3,630 1,036 Total Seondha17,042 12,457 4,585 441 320 121 4,666 3,630 1,036 Rural
- - - - - - - - - Urban22,553 15,525 7,028 880 627 253 10,108 8,144 1,964 Total Datia22,553 15,525 7,028 880 627 253 10,108 8,144 1,964 Rural
- - - - - - - - - Urban13,460 9,316 4,144 523 255 268 3,728 2,516 1,212 Total Bhander13,460 9,316 4,144 523 255 268 3,728 2,516 1,212 Rural
- - - - - - - - - UrbanURBAN
1,163 933 230 257 202 55 3,700 3,239 461 Urban Seondha (NP)521 357 164 181 127 54 3,845 3,408 437 Urban Indergarh (NP)871 662 209 1,264 687 577 25,323 21,569 3,754 Urban Datia (M)364 236 128 329 157 172 2,132 1,772 360 Urban Badoni (NP)
1,220 864 356 377 266 111 4,140 3,681 459 Urban Bhander (NP)
of main workers
Agricultural labourers Household industry workers Other workersTotal/ Rural/ Urban
District/ CD Block/ Town
25
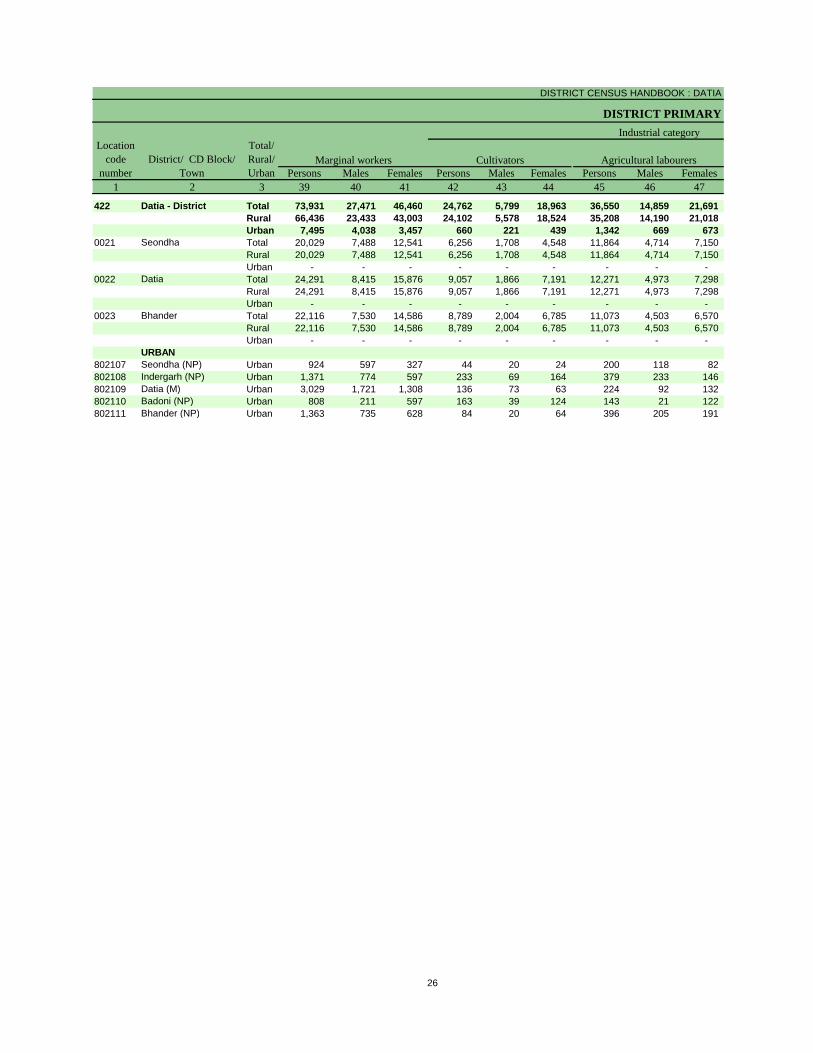
DISTRICT CENSUS HANDBOOK : DATIA
DISTRICT PRIMARY
Persons Males Females Persons Males Females Persons Males Females1 2 3 39 40 41 42 43 44 45 46 47
422 Datia - District Total 73,931 27,471 46,460 24,762 5,799 18,963 36,550 14,859 21,691 Rural 66,436 23,433 43,003 24,102 5,578 18,524 35,208 14,190 21,018 Urban 7,495 4,038 3,457 660 221 439 1,342 669 673
0021 Seondha Total 20,029 7,488 12,541 6,256 1,708 4,548 11,864 4,714 7,150 Rural 20,029 7,488 12,541 6,256 1,708 4,548 11,864 4,714 7,150 Urban - - - - - - - - -
0022 Datia Total 24,291 8,415 15,876 9,057 1,866 7,191 12,271 4,973 7,298 Rural 24,291 8,415 15,876 9,057 1,866 7,191 12,271 4,973 7,298 Urban - - - - - - - - -
0023 Bhander Total 22,116 7,530 14,586 8,789 2,004 6,785 11,073 4,503 6,570 Rural 22,116 7,530 14,586 8,789 2,004 6,785 11,073 4,503 6,570 Urban - - - - - - - - -
URBAN802107 Seondha (NP) Urban 924 597 327 44 20 24 200 118 82 802108 Indergarh (NP) Urban 1,371 774 597 233 69 164 379 233 146 802109 Datia (M) Urban 3,029 1,721 1,308 136 73 63 224 92 132 802110 Badoni (NP) Urban 808 211 597 163 39 124 143 21 122 802111 Bhander (NP) Urban 1,363 735 628 84 20 64 396 205 191
Marginal workers CultivatorsLocation
code number
District/ CD Block/ Town
Total/ Rural/ Urban
Industrial category
Agricultural labourers
26
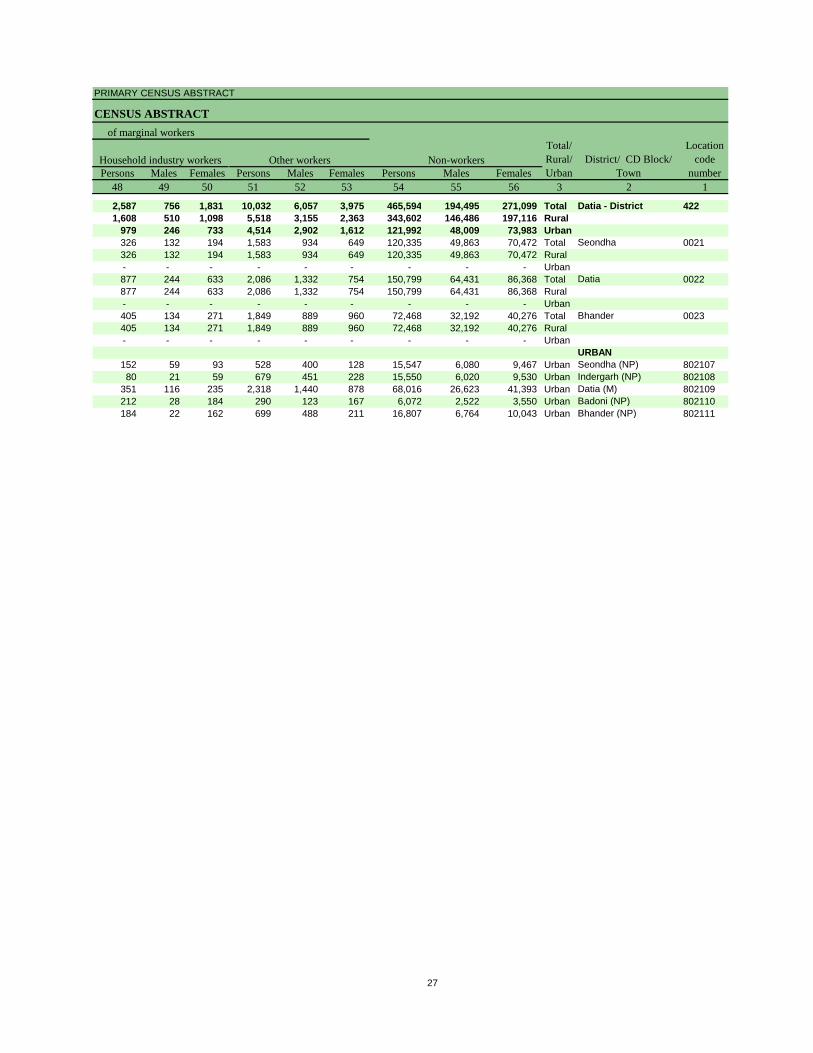
PRIMARY CENSUS ABSTRACT
CENSUS ABSTRACT
Persons Males Females Persons Males Females Persons Males Females48 49 50 51 52 53 54 55 56 3 2 1
2,587 756 1,831 10,032 6,057 3,975 465,594 194,495 271,099 Total Datia - District 4221,608 510 1,098 5,518 3,155 2,363 343,602 146,486 197,116 Rural
979 246 733 4,514 2,902 1,612 121,992 48,009 73,983 Urban326 132 194 1,583 934 649 120,335 49,863 70,472 Total Seondha 0021326 132 194 1,583 934 649 120,335 49,863 70,472 Rural- - - - - - - - - Urban877 244 633 2,086 1,332 754 150,799 64,431 86,368 Total Datia 0022877 244 633 2,086 1,332 754 150,799 64,431 86,368 Rural- - - - - - - - - Urban405 134 271 1,849 889 960 72,468 32,192 40,276 Total Bhander 0023405 134 271 1,849 889 960 72,468 32,192 40,276 Rural- - - - - - - - - Urban
URBAN152 59 93 528 400 128 15,547 6,080 9,467 Urban Seondha (NP) 80210780 21 59 679 451 228 15,550 6,020 9,530 Urban Indergarh (NP) 802108
351 116 235 2,318 1,440 878 68,016 26,623 41,393 Urban Datia (M) 802109212 28 184 290 123 167 6,072 2,522 3,550 Urban Badoni (NP) 802110184 22 162 699 488 211 16,807 6,764 10,043 Urban Bhander (NP) 802111
District/ CD Block/ Town
Location code
numberHousehold industry workers Other workers Non-workers
of marginal workersTotal/ Rural/ Urban
27

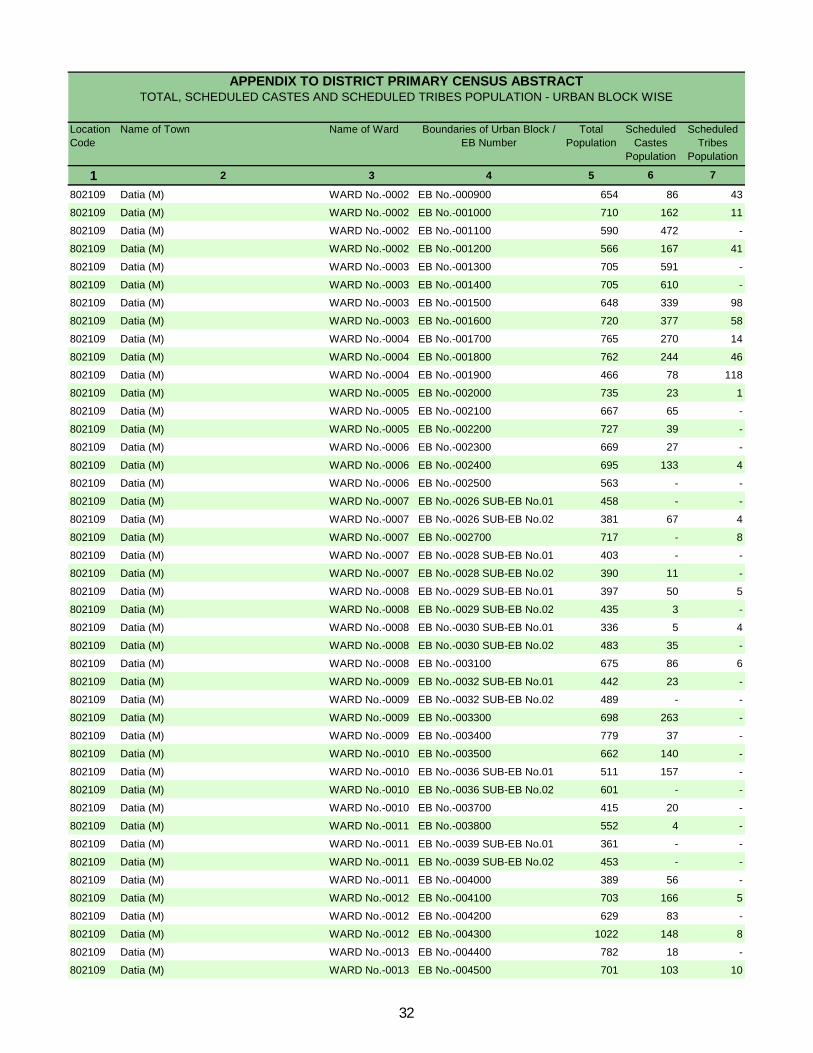
Appendix to District Primary Census Abstract
Total, Scheduled Castes and Scheduled Tribes
Population - Urban Block wise

Location Code
Name of Town Name of Ward Boundaries of Urban Block / EB Number
Total Population
Scheduled Castes
Population
Scheduled Tribes
Population
1 2 3 4 5 6 7
802107 Seondha (NP) WARD No.-0001 EB No.-000100 504 77 -
802107 Seondha (NP) WARD No.-0001 EB No.-000200 548 11 -
802107 Seondha (NP) WARD No.-0001 EB No.-000300 593 21 -
802107 Seondha (NP) WARD No.-0002 EB No.-000400 629 - -
802107 Seondha (NP) WARD No.-0002 EB No.-000500 484 8 134
802107 Seondha (NP) WARD No.-0002 EB No.-000600 296 44 2
802107 Seondha (NP) WARD No.-0003 EB No.-000700 502 88 -
802107 Seondha (NP) WARD No.-0003 EB No.-000800 687 36 2
802107 Seondha (NP) WARD No.-0004 EB No.-000900 711 154 -
802107 Seondha (NP) WARD No.-0004 EB No.-001000 664 5 -
802107 Seondha (NP) WARD No.-0004 EB No.-001100 392 4 6
802107 Seondha (NP) WARD No.-0005 EB No.-001200 738 253 -
802107 Seondha (NP) WARD No.-0005 EB No.-001300 716 163 10
802107 Seondha (NP) WARD No.-0005 EB No.-0014 SUB-EB No.01 410 48 -
802107 Seondha (NP) WARD No.-0005 EB No.-0014 SUB-EB No.02 410 92 -
802107 Seondha (NP) WARD No.-0006 EB No.-001500 598 19 -
802107 Seondha (NP) WARD No.-0006 EB No.-001600 663 76 -
802107 Seondha (NP) WARD No.-0006 EB No.-001700 565 78 17
802107 Seondha (NP) WARD No.-0006 EB No.-001800 782 113 7
802107 Seondha (NP) WARD No.-0007 EB No.-001900 640 22 5
802107 Seondha (NP) WARD No.-0007 EB No.-002000 634 105 -
802107 Seondha (NP) WARD No.-0007 EB No.-002100 605 3 -
802107 Seondha (NP) WARD No.-0007 EB No.-002200 753 245 -
802107 Seondha (NP) WARD No.-0008 EB No.-002300 703 249 -
802107 Seondha (NP) WARD No.-0008 EB No.-002400 512 461 -
802107 Seondha (NP) WARD No.-0009 EB No.-002500 502 237 -
802107 Seondha (NP) WARD No.-0009 EB No.-002600 376 185 -
802107 Seondha (NP) WARD No.-0010 EB No.-002700 634 - -
802107 Seondha (NP) WARD No.-0010 EB No.-002800 565 13 -
802107 Seondha (NP) WARD No.-0011 EB No.-002900 673 139 -
802107 Seondha (NP) WARD No.-0011 EB No.-003000 741 406 -
802107 Seondha (NP) WARD No.-0012 EB No.-003100 666 411 -
802107 Seondha (NP) WARD No.-0012 EB No.-003200 388 118 -
802107 Seondha (NP) WARD No.-0013 EB No.-003300 700 9 59
802107 Seondha (NP) WARD No.-0013 EB No.-003400 352 27 -
802107 Seondha (NP) WARD No.-0014 EB No.-003500 660 102 29
802107 Seondha (NP) WARD No.-0014 EB No.-003600 785 15 1
802107 Seondha (NP) WARD No.-0015 EB No.-003700 625 208 -
802107 Seondha (NP) WARD No.-0015 EB No.-003800 734 36 97
802108 Indergarh (NP) WARD No.-0001 EB No.-000100 758 3 -
802108 Indergarh (NP) WARD No.-0002 EB No.-000200 364 68 -
802108 Indergarh (NP) WARD No.-0002 EB No.-000300 427 65 -
802108 Indergarh (NP) WARD No.-0003 EB No.-0004 SUB-EB No.01 675 24 -
802108 Indergarh (NP) WARD No.-0003 EB No.-0004 SUB-EB No.02 190 - -
APPENDIX TO DISTRICT PRIMARY CENSUS ABSTRACT TOTAL, SCHEDULED CASTES AND SCHEDULED TRIBES POPULATION - URBAN BLOCK WISE
30

Location Code
Name of Town Name of Ward Boundaries of Urban Block / EB Number
Total Population
Scheduled Castes
Population
Scheduled Tribes
Population
1 2 3 4 5 6 7
APPENDIX TO DISTRICT PRIMARY CENSUS ABSTRACT TOTAL, SCHEDULED CASTES AND SCHEDULED TRIBES POPULATION - URBAN BLOCK WISE
802108 Indergarh (NP) WARD No.-0004 EB No.-000500 740 41 -
802108 Indergarh (NP) WARD No.-0005 EB No.-000600 673 40 -
802108 Indergarh (NP) WARD No.-0006 EB No.-000700 373 94 9
802108 Indergarh (NP) WARD No.-0006 EB No.-000800 525 37 -
802108 Indergarh (NP) WARD No.-0006 EB No.-000900 507 28 -
802108 Indergarh (NP) WARD No.-0007 EB No.-001000 317 71 -
802108 Indergarh (NP) WARD No.-0007 EB No.-001100 580 31 -
802108 Indergarh (NP) WARD No.-0007 EB No.-001200 625 337 5
802108 Indergarh (NP) WARD No.-0007 EB No.-001300 625 331 -
802108 Indergarh (NP) WARD No.-0008 EB No.-001400 721 345 -
802108 Indergarh (NP) WARD No.-0008 EB No.-001500 614 54 -
802108 Indergarh (NP) WARD No.-0008 EB No.-001600 739 92 -
802108 Indergarh (NP) WARD No.-0009 EB No.-001700 719 10 -
802108 Indergarh (NP) WARD No.-0009 EB No.-001800 681 75 4
802108 Indergarh (NP) WARD No.-0009 EB No.-001900 746 570 -
802108 Indergarh (NP) WARD No.-0009 EB No.-002000 430 300 -
802108 Indergarh (NP) WARD No.-0010 EB No.-002100 506 71 -
802108 Indergarh (NP) WARD No.-0010 EB No.-002200 648 89 22
802108 Indergarh (NP) WARD No.-0011 EB No.-0023 SUB-EB No.01 626 43 -
802108 Indergarh (NP) WARD No.-0011 EB No.-0023 SUB-EB No.02 233 - 1
802108 Indergarh (NP) WARD No.-0011 EB No.-0024 SUB-EB No.01 637 259 76
802108 Indergarh (NP) WARD No.-0011 EB No.-0024 SUB-EB No.02 279 130 136
802108 Indergarh (NP) WARD No.-0012 EB No.-002500 676 327 6
802108 Indergarh (NP) WARD No.-0012 EB No.-002600 513 221 15
802108 Indergarh (NP) WARD No.-0012 EB No.-002700 715 192 17
802108 Indergarh (NP) WARD No.-0013 EB No.-002800 596 165 10
802108 Indergarh (NP) WARD No.-0013 EB No.-002900 696 135 11
802108 Indergarh (NP) WARD No.-0013 EB No.-003000 833 152 43
802108 Indergarh (NP) WARD No.-0014 EB No.-003100 567 187 10
802108 Indergarh (NP) WARD No.-0014 EB No.-0032 SUB-EB No.01 658 53 -
802108 Indergarh (NP) WARD No.-0014 EB No.-0032 SUB-EB No.02 186 - 12
802108 Indergarh (NP) WARD No.-0014 EB No.-003300 763 36 46
802108 Indergarh (NP) WARD No.-0014 EB No.-003400 740 233 14
802108 Indergarh (NP) WARD No.-0015 EB No.-003500 672 158 12
802108 Indergarh (NP) WARD No.-0015 EB No.-003600 472 430 -
802109 Datia (M) WARD No.-0001 EB No.-000100 825 353 103
802109 Datia (M) WARD No.-0001 EB No.-000200 463 145 -
802109 Datia (M) WARD No.-0001 EB No.-000300 588 74 1
802109 Datia (M) WARD No.-0001 EB No.-000400 509 101 62
802109 Datia (M) WARD No.-0001 EB No.-000500 569 187 123
802109 Datia (M) WARD No.-0001 EB No.-000600 481 - -
802109 Datia (M) WARD No.-0001 EB No.-0007 SUB-EB No.01 784 13 -
802109 Datia (M) WARD No.-0001 EB No.-0007 SUB-EB No.02 312 - -
802109 Datia (M) WARD No.-0002 EB No.-000800 672 117 4
31
Location Code
Name of Town Name of Ward Boundaries of Urban Block / EB Number
Total Population
Scheduled Castes
Population
Scheduled Tribes
Population
1 2 3 4 5 6 7
APPENDIX TO DISTRICT PRIMARY CENSUS ABSTRACT TOTAL, SCHEDULED CASTES AND SCHEDULED TRIBES POPULATION - URBAN BLOCK WISE
802109 Datia (M) WARD No.-0002 EB No.-000900 654 86 43
802109 Datia (M) WARD No.-0002 EB No.-001000 710 162 11
802109 Datia (M) WARD No.-0002 EB No.-001100 590 472 -
802109 Datia (M) WARD No.-0002 EB No.-001200 566 167 41
802109 Datia (M) WARD No.-0003 EB No.-001300 705 591 -
802109 Datia (M) WARD No.-0003 EB No.-001400 705 610 -
802109 Datia (M) WARD No.-0003 EB No.-001500 648 339 98
802109 Datia (M) WARD No.-0003 EB No.-001600 720 377 58
802109 Datia (M) WARD No.-0004 EB No.-001700 765 270 14
802109 Datia (M) WARD No.-0004 EB No.-001800 762 244 46
802109 Datia (M) WARD No.-0004 EB No.-001900 466 78 118
802109 Datia (M) WARD No.-0005 EB No.-002000 735 23 1
802109 Datia (M) WARD No.-0005 EB No.-002100 667 65 -
802109 Datia (M) WARD No.-0005 EB No.-002200 727 39 -
802109 Datia (M) WARD No.-0006 EB No.-002300 669 27 -
802109 Datia (M) WARD No.-0006 EB No.-002400 695 133 4
802109 Datia (M) WARD No.-0006 EB No.-002500 563 - -
802109 Datia (M) WARD No.-0007 EB No.-0026 SUB-EB No.01 458 - -
802109 Datia (M) WARD No.-0007 EB No.-0026 SUB-EB No.02 381 67 4
802109 Datia (M) WARD No.-0007 EB No.-002700 717 - 8
802109 Datia (M) WARD No.-0007 EB No.-0028 SUB-EB No.01 403 - -
802109 Datia (M) WARD No.-0007 EB No.-0028 SUB-EB No.02 390 11 -
802109 Datia (M) WARD No.-0008 EB No.-0029 SUB-EB No.01 397 50 5
802109 Datia (M) WARD No.-0008 EB No.-0029 SUB-EB No.02 435 3 -
802109 Datia (M) WARD No.-0008 EB No.-0030 SUB-EB No.01 336 5 4
802109 Datia (M) WARD No.-0008 EB No.-0030 SUB-EB No.02 483 35 -
802109 Datia (M) WARD No.-0008 EB No.-003100 675 86 6
802109 Datia (M) WARD No.-0009 EB No.-0032 SUB-EB No.01 442 23 -
802109 Datia (M) WARD No.-0009 EB No.-0032 SUB-EB No.02 489 - -
802109 Datia (M) WARD No.-0009 EB No.-003300 698 263 -
802109 Datia (M) WARD No.-0009 EB No.-003400 779 37 -
802109 Datia (M) WARD No.-0010 EB No.-003500 662 140 -
802109 Datia (M) WARD No.-0010 EB No.-0036 SUB-EB No.01 511 157 -
802109 Datia (M) WARD No.-0010 EB No.-0036 SUB-EB No.02 601 - -
802109 Datia (M) WARD No.-0010 EB No.-003700 415 20 -
802109 Datia (M) WARD No.-0011 EB No.-003800 552 4 -
802109 Datia (M) WARD No.-0011 EB No.-0039 SUB-EB No.01 361 - -
802109 Datia (M) WARD No.-0011 EB No.-0039 SUB-EB No.02 453 - -
802109 Datia (M) WARD No.-0011 EB No.-004000 389 56 -
802109 Datia (M) WARD No.-0012 EB No.-004100 703 166 5
802109 Datia (M) WARD No.-0012 EB No.-004200 629 83 -
802109 Datia (M) WARD No.-0012 EB No.-004300 1022 148 8
802109 Datia (M) WARD No.-0013 EB No.-004400 782 18 -
802109 Datia (M) WARD No.-0013 EB No.-004500 701 103 10
32
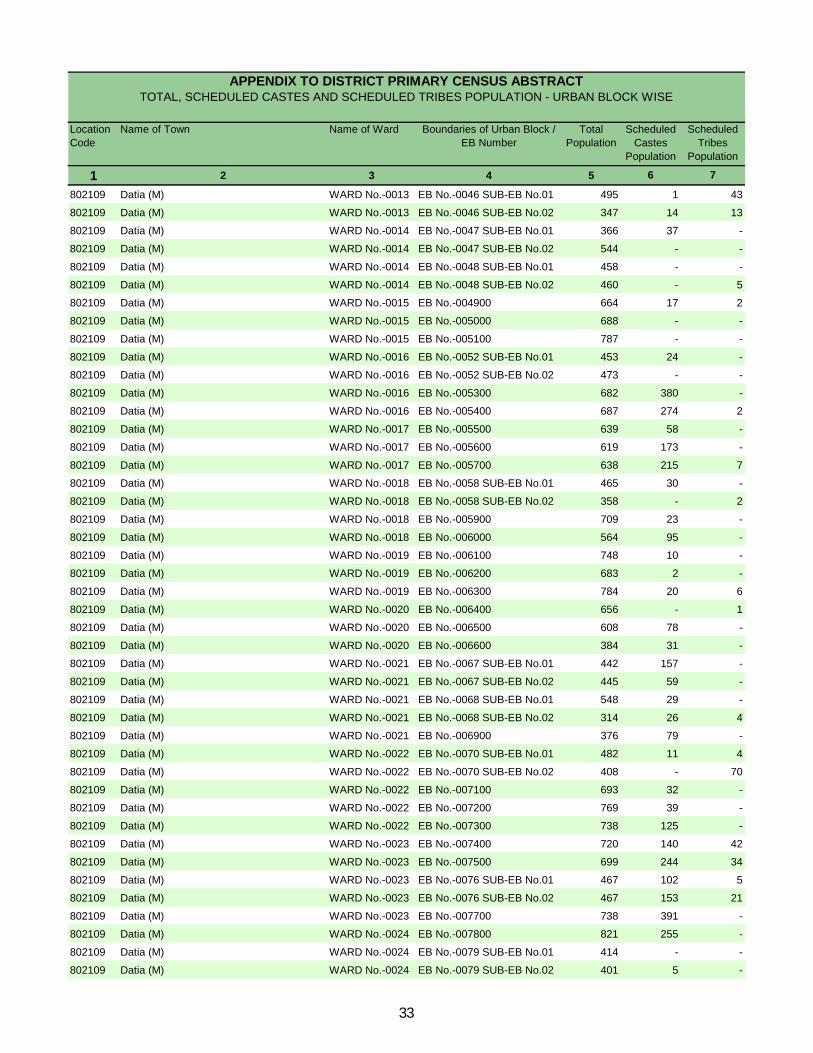
Location Code
Name of Town Name of Ward Boundaries of Urban Block / EB Number
Total Population
Scheduled Castes
Population
Scheduled Tribes
Population
1 2 3 4 5 6 7
APPENDIX TO DISTRICT PRIMARY CENSUS ABSTRACT TOTAL, SCHEDULED CASTES AND SCHEDULED TRIBES POPULATION - URBAN BLOCK WISE
802109 Datia (M) WARD No.-0013 EB No.-0046 SUB-EB No.01 495 1 43
802109 Datia (M) WARD No.-0013 EB No.-0046 SUB-EB No.02 347 14 13
802109 Datia (M) WARD No.-0014 EB No.-0047 SUB-EB No.01 366 37 -
802109 Datia (M) WARD No.-0014 EB No.-0047 SUB-EB No.02 544 - -
802109 Datia (M) WARD No.-0014 EB No.-0048 SUB-EB No.01 458 - -
802109 Datia (M) WARD No.-0014 EB No.-0048 SUB-EB No.02 460 - 5
802109 Datia (M) WARD No.-0015 EB No.-004900 664 17 2
802109 Datia (M) WARD No.-0015 EB No.-005000 688 - -
802109 Datia (M) WARD No.-0015 EB No.-005100 787 - -
802109 Datia (M) WARD No.-0016 EB No.-0052 SUB-EB No.01 453 24 -
802109 Datia (M) WARD No.-0016 EB No.-0052 SUB-EB No.02 473 - -
802109 Datia (M) WARD No.-0016 EB No.-005300 682 380 -
802109 Datia (M) WARD No.-0016 EB No.-005400 687 274 2
802109 Datia (M) WARD No.-0017 EB No.-005500 639 58 -
802109 Datia (M) WARD No.-0017 EB No.-005600 619 173 -
802109 Datia (M) WARD No.-0017 EB No.-005700 638 215 7
802109 Datia (M) WARD No.-0018 EB No.-0058 SUB-EB No.01 465 30 -
802109 Datia (M) WARD No.-0018 EB No.-0058 SUB-EB No.02 358 - 2
802109 Datia (M) WARD No.-0018 EB No.-005900 709 23 -
802109 Datia (M) WARD No.-0018 EB No.-006000 564 95 -
802109 Datia (M) WARD No.-0019 EB No.-006100 748 10 -
802109 Datia (M) WARD No.-0019 EB No.-006200 683 2 -
802109 Datia (M) WARD No.-0019 EB No.-006300 784 20 6
802109 Datia (M) WARD No.-0020 EB No.-006400 656 - 1
802109 Datia (M) WARD No.-0020 EB No.-006500 608 78 -
802109 Datia (M) WARD No.-0020 EB No.-006600 384 31 -
802109 Datia (M) WARD No.-0021 EB No.-0067 SUB-EB No.01 442 157 -
802109 Datia (M) WARD No.-0021 EB No.-0067 SUB-EB No.02 445 59 -
802109 Datia (M) WARD No.-0021 EB No.-0068 SUB-EB No.01 548 29 -
802109 Datia (M) WARD No.-0021 EB No.-0068 SUB-EB No.02 314 26 4
802109 Datia (M) WARD No.-0021 EB No.-006900 376 79 -
802109 Datia (M) WARD No.-0022 EB No.-0070 SUB-EB No.01 482 11 4
802109 Datia (M) WARD No.-0022 EB No.-0070 SUB-EB No.02 408 - 70
802109 Datia (M) WARD No.-0022 EB No.-007100 693 32 -
802109 Datia (M) WARD No.-0022 EB No.-007200 769 39 -
802109 Datia (M) WARD No.-0022 EB No.-007300 738 125 -
802109 Datia (M) WARD No.-0023 EB No.-007400 720 140 42
802109 Datia (M) WARD No.-0023 EB No.-007500 699 244 34
802109 Datia (M) WARD No.-0023 EB No.-0076 SUB-EB No.01 467 102 5
802109 Datia (M) WARD No.-0023 EB No.-0076 SUB-EB No.02 467 153 21
802109 Datia (M) WARD No.-0023 EB No.-007700 738 391 -
802109 Datia (M) WARD No.-0024 EB No.-007800 821 255 -
802109 Datia (M) WARD No.-0024 EB No.-0079 SUB-EB No.01 414 - -
802109 Datia (M) WARD No.-0024 EB No.-0079 SUB-EB No.02 401 5 -
33
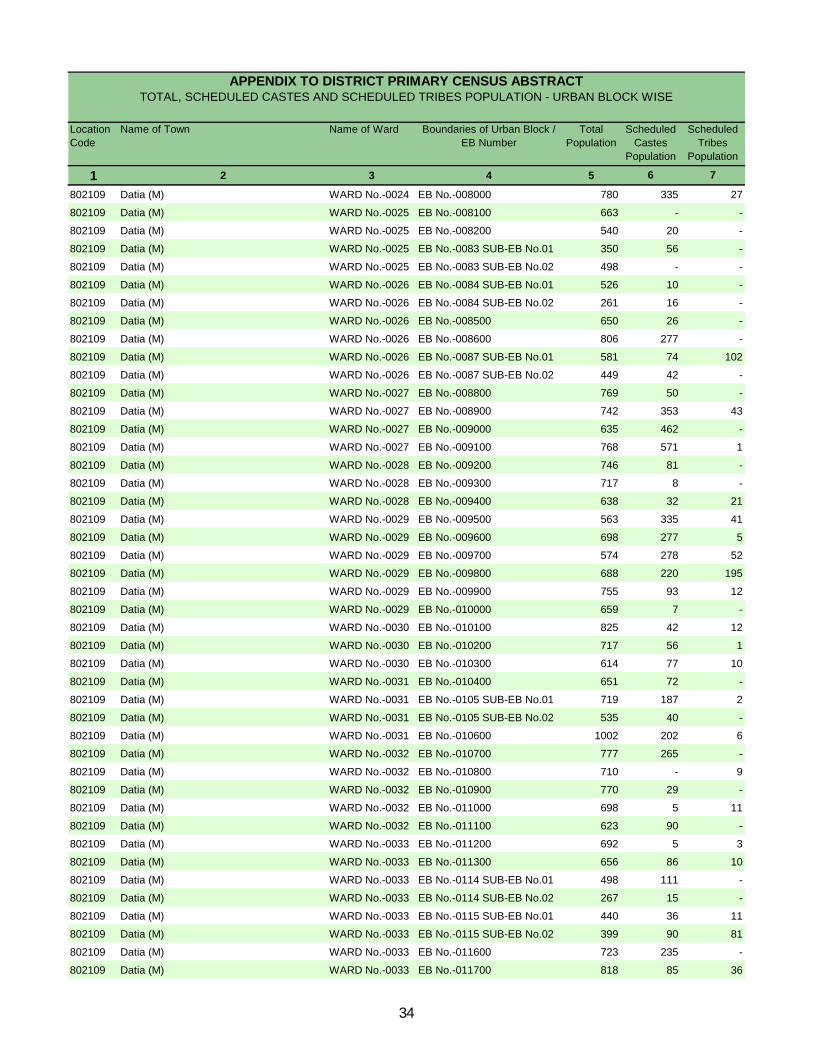
Location Code
Name of Town Name of Ward Boundaries of Urban Block / EB Number
Total Population
Scheduled Castes
Population
Scheduled Tribes
Population
1 2 3 4 5 6 7
APPENDIX TO DISTRICT PRIMARY CENSUS ABSTRACT TOTAL, SCHEDULED CASTES AND SCHEDULED TRIBES POPULATION - URBAN BLOCK WISE
802109 Datia (M) WARD No.-0024 EB No.-008000 780 335 27
802109 Datia (M) WARD No.-0025 EB No.-008100 663 - -
802109 Datia (M) WARD No.-0025 EB No.-008200 540 20 -
802109 Datia (M) WARD No.-0025 EB No.-0083 SUB-EB No.01 350 56 -
802109 Datia (M) WARD No.-0025 EB No.-0083 SUB-EB No.02 498 - -
802109 Datia (M) WARD No.-0026 EB No.-0084 SUB-EB No.01 526 10 -
802109 Datia (M) WARD No.-0026 EB No.-0084 SUB-EB No.02 261 16 -
802109 Datia (M) WARD No.-0026 EB No.-008500 650 26 -
802109 Datia (M) WARD No.-0026 EB No.-008600 806 277 -
802109 Datia (M) WARD No.-0026 EB No.-0087 SUB-EB No.01 581 74 102
802109 Datia (M) WARD No.-0026 EB No.-0087 SUB-EB No.02 449 42 -
802109 Datia (M) WARD No.-0027 EB No.-008800 769 50 -
802109 Datia (M) WARD No.-0027 EB No.-008900 742 353 43
802109 Datia (M) WARD No.-0027 EB No.-009000 635 462 -
802109 Datia (M) WARD No.-0027 EB No.-009100 768 571 1
802109 Datia (M) WARD No.-0028 EB No.-009200 746 81 -
802109 Datia (M) WARD No.-0028 EB No.-009300 717 8 -
802109 Datia (M) WARD No.-0028 EB No.-009400 638 32 21
802109 Datia (M) WARD No.-0029 EB No.-009500 563 335 41
802109 Datia (M) WARD No.-0029 EB No.-009600 698 277 5
802109 Datia (M) WARD No.-0029 EB No.-009700 574 278 52
802109 Datia (M) WARD No.-0029 EB No.-009800 688 220 195
802109 Datia (M) WARD No.-0029 EB No.-009900 755 93 12
802109 Datia (M) WARD No.-0029 EB No.-010000 659 7 -
802109 Datia (M) WARD No.-0030 EB No.-010100 825 42 12
802109 Datia (M) WARD No.-0030 EB No.-010200 717 56 1
802109 Datia (M) WARD No.-0030 EB No.-010300 614 77 10
802109 Datia (M) WARD No.-0031 EB No.-010400 651 72 -
802109 Datia (M) WARD No.-0031 EB No.-0105 SUB-EB No.01 719 187 2
802109 Datia (M) WARD No.-0031 EB No.-0105 SUB-EB No.02 535 40 -
802109 Datia (M) WARD No.-0031 EB No.-010600 1002 202 6
802109 Datia (M) WARD No.-0032 EB No.-010700 777 265 -
802109 Datia (M) WARD No.-0032 EB No.-010800 710 - 9
802109 Datia (M) WARD No.-0032 EB No.-010900 770 29 -
802109 Datia (M) WARD No.-0032 EB No.-011000 698 5 11
802109 Datia (M) WARD No.-0032 EB No.-011100 623 90 -
802109 Datia (M) WARD No.-0033 EB No.-011200 692 5 3
802109 Datia (M) WARD No.-0033 EB No.-011300 656 86 10
802109 Datia (M) WARD No.-0033 EB No.-0114 SUB-EB No.01 498 111 -
802109 Datia (M) WARD No.-0033 EB No.-0114 SUB-EB No.02 267 15 -
802109 Datia (M) WARD No.-0033 EB No.-0115 SUB-EB No.01 440 36 11
802109 Datia (M) WARD No.-0033 EB No.-0115 SUB-EB No.02 399 90 81
802109 Datia (M) WARD No.-0033 EB No.-011600 723 235 -
802109 Datia (M) WARD No.-0033 EB No.-011700 818 85 36
34
Location Code
Name of Town Name of Ward Boundaries of Urban Block / EB Number
Total Population
Scheduled Castes
Population
Scheduled Tribes
Population
1 2 3 4 5 6 7
APPENDIX TO DISTRICT PRIMARY CENSUS ABSTRACT TOTAL, SCHEDULED CASTES AND SCHEDULED TRIBES POPULATION - URBAN BLOCK WISE
802109 Datia (M) WARD No.-0033 EB No.-011800 842 48 116
802109 Datia (M) WARD No.-0033 EB No.-011900 649 24 24
802109 Datia (M) WARD No.-0033 EB No.-012000 561 46 17
802109 Datia (M) WARD No.-0034 EB No.-012100 575 22 -
802109 Datia (M) WARD No.-0034 EB No.-012200 805 103 14
802109 Datia (M) WARD No.-0034 EB No.-0123 SUB-EB No.01 550 71 -
802109 Datia (M) WARD No.-0034 EB No.-0123 SUB-EB No.02 512 70 99
802109 Datia (M) WARD No.-0034 EB No.-012400 509 83 50
802109 Datia (M) WARD No.-0034 EB No.-012500 702 255 -
802109 Datia (M) WARD No.-0034 EB No.-012600 612 166 22
802109 Datia (M) WARD No.-0034 EB No.-012700 634 275 43
802109 Datia (M) WARD No.-0034 EB No.-012800 412 84 40
802109 Datia (M) WARD No.-0035 EB No.-012900 610 175 8
802109 Datia (M) WARD No.-0035 EB No.-013000 588 16 6
802109 Datia (M) WARD No.-0035 EB No.-013100 677 - -
802109 Datia (M) WARD No.-0036 EB No.-0132 SUB-EB No.01 507 7 -
802109 Datia (M) WARD No.-0036 EB No.-0132 SUB-EB No.02 419 62 3
802109 Datia (M) WARD No.-0036 EB No.-013300 742 134 21
802109 Datia (M) WARD No.-0036 EB No.-013400 783 176 -
802109 Datia (M) WARD No.-0036 EB No.-013500 793 239 4
802109 Datia (M) WARD No.-0036 EB No.-0136 SUB-EB No.01 552 504 -
802109 Datia (M) WARD No.-0036 EB No.-0136 SUB-EB No.02 525 244 -
802109 Datia (M) WARD No.-0036 EB No.-0137 SUB-EB No.01 768 229 22
802109 Datia (M) WARD No.-0036 EB No.-0137 SUB-EB No.02 809 127 358
802109 Datia (M) WARD No.-0036 EB No.-013800 643 73 -
802110 Badoni (NP) WARD No.-0001 EB No.-000100 647 40 1
802110 Badoni (NP) WARD No.-0002 EB No.-000200 623 123 5
802110 Badoni (NP) WARD No.-0003 EB No.-000300 905 370 14
802110 Badoni (NP) WARD No.-0004 EB No.-000400 438 353 -
802110 Badoni (NP) WARD No.-0005 EB No.-000500 762 330 -
802110 Badoni (NP) WARD No.-0006 EB No.-000600 612 56 -
802110 Badoni (NP) WARD No.-0007 EB No.-000700 555 7 -
802110 Badoni (NP) WARD No.-0008 EB No.-000800 689 - 22
802110 Badoni (NP) WARD No.-0009 EB No.-000900 623 41 -
802110 Badoni (NP) WARD No.-0010 EB No.-001000 683 128 -
802110 Badoni (NP) WARD No.-0011 EB No.-001100 685 223 4
802110 Badoni (NP) WARD No.-0012 EB No.-001200 664 197 3
802110 Badoni (NP) WARD No.-0013 EB No.-001300 751 182 -
802110 Badoni (NP) WARD No.-0014 EB No.-001400 700 229 3
802110 Badoni (NP) WARD No.-0015 EB No.-001500 972 26 627
802111 Bhander (NP) WARD No.-0001 EB No.-000100 498 48 -
802111 Bhander (NP) WARD No.-0001 EB No.-000200 528 142 -
802111 Bhander (NP) WARD No.-0001 EB No.-000300 528 282 12
802111 Bhander (NP) WARD No.-0001 EB No.-000400 895 460 10
35
Location Code
Name of Town Name of Ward Boundaries of Urban Block / EB Number
Total Population
Scheduled Castes
Population
Scheduled Tribes
Population
1 2 3 4 5 6 7
APPENDIX TO DISTRICT PRIMARY CENSUS ABSTRACT TOTAL, SCHEDULED CASTES AND SCHEDULED TRIBES POPULATION - URBAN BLOCK WISE
802111 Bhander (NP) WARD No.-0002 EB No.-000500 688 84 12
802111 Bhander (NP) WARD No.-0002 EB No.-000600 659 241 -
802111 Bhander (NP) WARD No.-0002 EB No.-000700 791 251 10
802111 Bhander (NP) WARD No.-0003 EB No.-000800 578 410 12
802111 Bhander (NP) WARD No.-0003 EB No.-000900 660 520 -
802111 Bhander (NP) WARD No.-0003 EB No.-001000 672 107 -
802111 Bhander (NP) WARD No.-0004 EB No.-001100 771 69 1
802111 Bhander (NP) WARD No.-0004 EB No.-001200 430 60 -
802111 Bhander (NP) WARD No.-0004 EB No.-001300 631 70 -
802111 Bhander (NP) WARD No.-0005 EB No.-001400 771 25 3
802111 Bhander (NP) WARD No.-0006 EB No.-001500 742 7 -
802111 Bhander (NP) WARD No.-0006 EB No.-001600 778 69 -
802111 Bhander (NP) WARD No.-0007 EB No.-001700 640 235 16
802111 Bhander (NP) WARD No.-0007 EB No.-001800 708 221 5
802111 Bhander (NP) WARD No.-0007 EB No.-001900 708 138 -
802111 Bhander (NP) WARD No.-0008 EB No.-002000 732 26 4
802111 Bhander (NP) WARD No.-0008 EB No.-002100 819 207 -
802111 Bhander (NP) WARD No.-0009 EB No.-002200 490 92 -
802111 Bhander (NP) WARD No.-0009 EB No.-002300 527 71 -
802111 Bhander (NP) WARD No.-0010 EB No.-002400 701 11 -
802111 Bhander (NP) WARD No.-0010 EB No.-002500 585 70 4
802111 Bhander (NP) WARD No.-0011 EB No.-002600 672 16 -
802111 Bhander (NP) WARD No.-0011 EB No.-002700 829 403 -
802111 Bhander (NP) WARD No.-0012 EB No.-002800 695 52 2
802111 Bhander (NP) WARD No.-0012 EB No.-002900 670 141 -
802111 Bhander (NP) WARD No.-0013 EB No.-003000 602 33 -
802111 Bhander (NP) WARD No.-0013 EB No.-003100 571 - -
802111 Bhander (NP) WARD No.-0013 EB No.-003200 495 120 -
802111 Bhander (NP) WARD No.-0013 EB No.-003300 428 - -
802111 Bhander (NP) WARD No.-0014 EB No.-003400 601 274 -
802111 Bhander (NP) WARD No.-0014 EB No.-003500 589 140 -
802111 Bhander (NP) WARD No.-0014 EB No.-003600 730 124 -
802111 Bhander (NP) WARD No.-0015 EB No.-003700 790 26 -
802111 Bhander (NP) WARD No.-0015 EB No.-0038 SUB-EB No.01 569 87 -
802111 Bhander (NP) WARD No.-0015 EB No.-0038 SUB-EB No.02 433 17 8
36
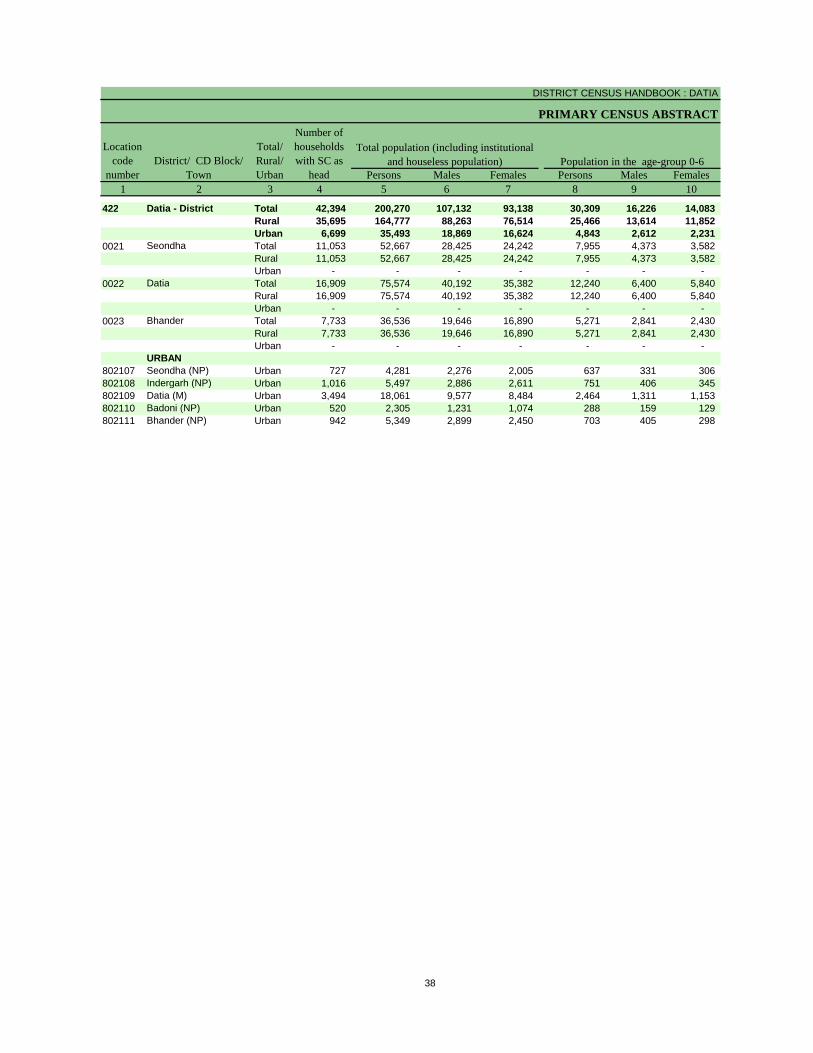
Primary Census Abstract for Scheduled Castes (SC)
DISTRICT CENSUS HANDBOOK : DATIA
PRIMARY CENSUS ABSTRACT
Persons Males Females Persons Males Females1 2 3 4 5 6 7 8 9 10
422 Datia - District Total 42,394 200,270 107,132 93,138 30,309 16,226 14,083 Rural 35,695 164,777 88,263 76,514 25,466 13,614 11,852 Urban 6,699 35,493 18,869 16,624 4,843 2,612 2,231
0021 Seondha Total 11,053 52,667 28,425 24,242 7,955 4,373 3,582 Rural 11,053 52,667 28,425 24,242 7,955 4,373 3,582 Urban - - - - - - -
0022 Datia Total 16,909 75,574 40,192 35,382 12,240 6,400 5,840 Rural 16,909 75,574 40,192 35,382 12,240 6,400 5,840 Urban - - - - - - -
0023 Bhander Total 7,733 36,536 19,646 16,890 5,271 2,841 2,430 Rural 7,733 36,536 19,646 16,890 5,271 2,841 2,430 Urban - - - - - - -
URBAN802107 Seondha (NP) Urban 727 4,281 2,276 2,005 637 331 306 802108 Indergarh (NP) Urban 1,016 5,497 2,886 2,611 751 406 345 802109 Datia (M) Urban 3,494 18,061 9,577 8,484 2,464 1,311 1,153 802110 Badoni (NP) Urban 520 2,305 1,231 1,074 288 159 129 802111 Bhander (NP) Urban 942 5,349 2,899 2,450 703 405 298
Location code
numberDistrict/ CD Block/
Town
Total/ Rural/ Urban
Number of households with SC as
head
Total population (including institutional and houseless population) Population in the age-group 0-6
38
PRIMARY CENSUS ABSTRACT
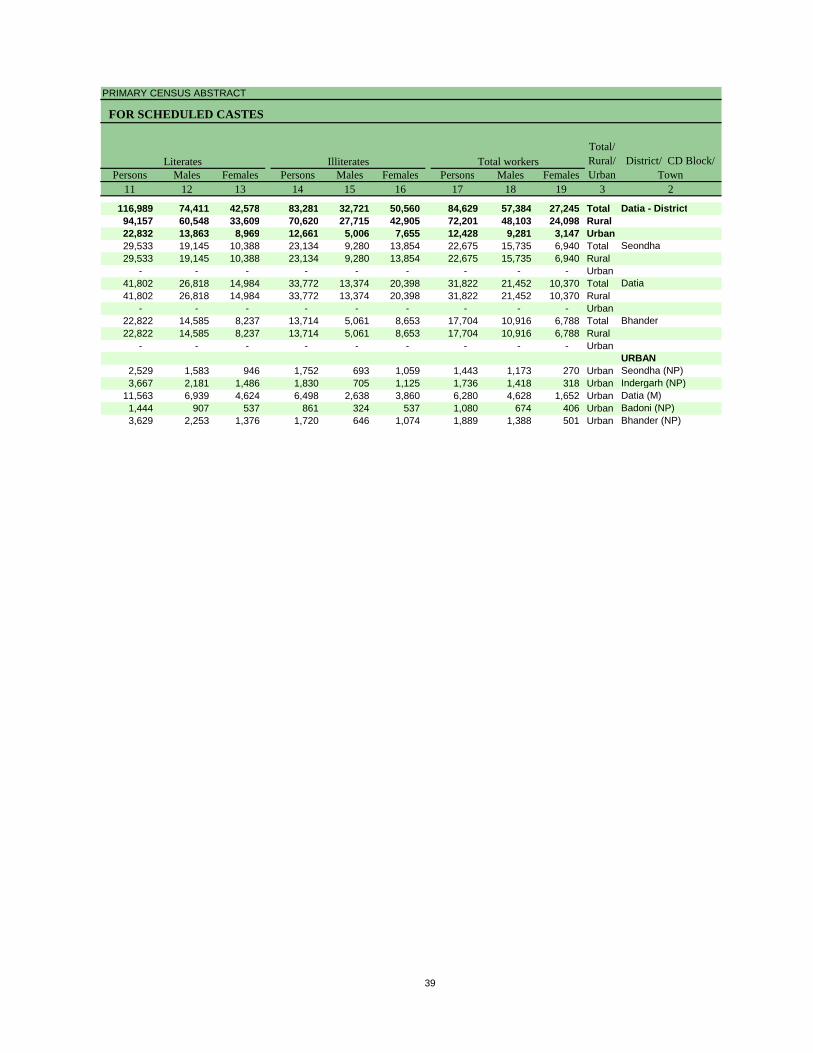
FOR SCHEDULED CASTES
Persons Males Females Persons Males Females Persons Males Females11 12 13 14 15 16 17 18 19 3 2
116,989 74,411 42,578 83,281 32,721 50,560 84,629 57,384 27,245 Total Datia - District94,157 60,548 33,609 70,620 27,715 42,905 72,201 48,103 24,098 Rural22,832 13,863 8,969 12,661 5,006 7,655 12,428 9,281 3,147 Urban29,533 19,145 10,388 23,134 9,280 13,854 22,675 15,735 6,940 Total Seondha29,533 19,145 10,388 23,134 9,280 13,854 22,675 15,735 6,940 Rural
- - - - - - - - - Urban41,802 26,818 14,984 33,772 13,374 20,398 31,822 21,452 10,370 Total Datia41,802 26,818 14,984 33,772 13,374 20,398 31,822 21,452 10,370 Rural
- - - - - - - - - Urban22,822 14,585 8,237 13,714 5,061 8,653 17,704 10,916 6,788 Total Bhander22,822 14,585 8,237 13,714 5,061 8,653 17,704 10,916 6,788 Rural
- - - - - - - - - UrbanURBAN
2,529 1,583 946 1,752 693 1,059 1,443 1,173 270 Urban Seondha (NP)3,667 2,181 1,486 1,830 705 1,125 1,736 1,418 318 Urban Indergarh (NP)
11,563 6,939 4,624 6,498 2,638 3,860 6,280 4,628 1,652 Urban Datia (M)1,444 907 537 861 324 537 1,080 674 406 Urban Badoni (NP)3,629 2,253 1,376 1,720 646 1,074 1,889 1,388 501 Urban Bhander (NP)
District/ CD Block/ Town
Total/ Rural/ Urban
Total workersLiterates Illiterates
39
DISTRICT CENSUS HANDBOOK : DATIA
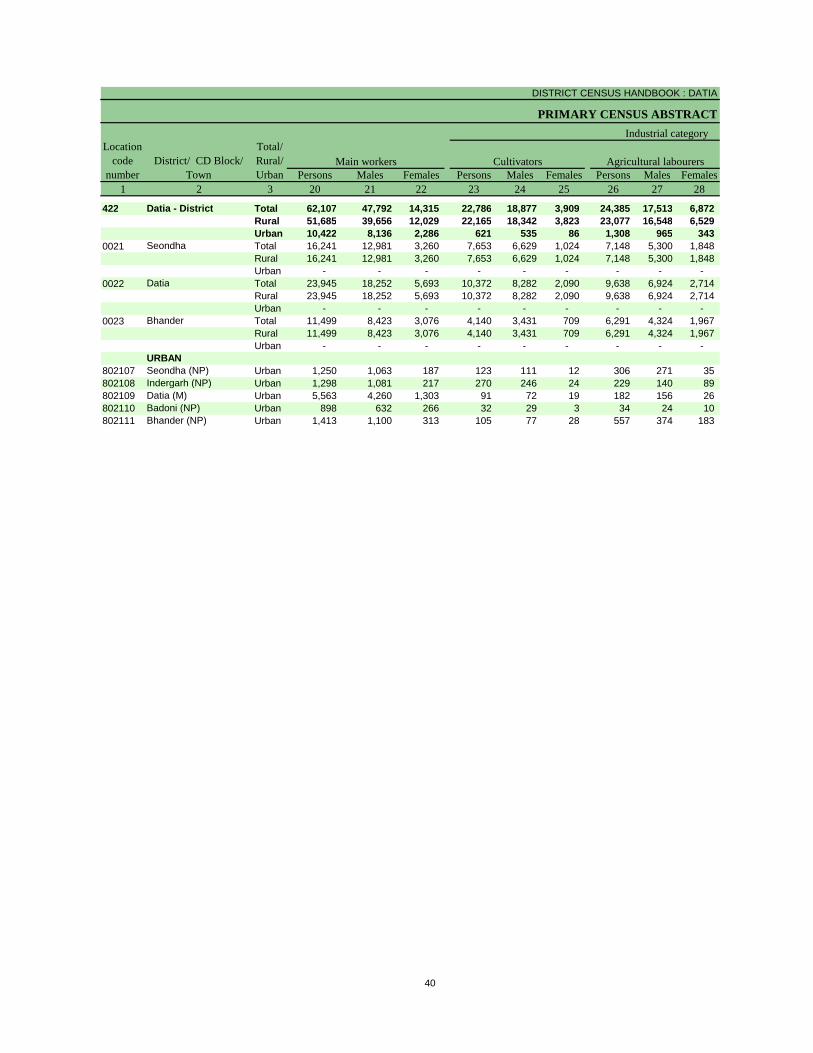
PRIMARY CENSUS ABSTRACT
Persons Males Females Persons Males Females Persons Males Females1 2 3 20 21 22 23 24 25 26 27 28
422 Datia - District Total 62,107 47,792 14,315 22,786 18,877 3,909 24,385 17,513 6,872 Rural 51,685 39,656 12,029 22,165 18,342 3,823 23,077 16,548 6,529 Urban 10,422 8,136 2,286 621 535 86 1,308 965 343
0021 Seondha Total 16,241 12,981 3,260 7,653 6,629 1,024 7,148 5,300 1,848 Rural 16,241 12,981 3,260 7,653 6,629 1,024 7,148 5,300 1,848 Urban - - - - - - - - -
0022 Datia Total 23,945 18,252 5,693 10,372 8,282 2,090 9,638 6,924 2,714 Rural 23,945 18,252 5,693 10,372 8,282 2,090 9,638 6,924 2,714 Urban - - - - - - - - -
0023 Bhander Total 11,499 8,423 3,076 4,140 3,431 709 6,291 4,324 1,967 Rural 11,499 8,423 3,076 4,140 3,431 709 6,291 4,324 1,967 Urban - - - - - - - - -
URBAN802107 Seondha (NP) Urban 1,250 1,063 187 123 111 12 306 271 35 802108 Indergarh (NP) Urban 1,298 1,081 217 270 246 24 229 140 89 802109 Datia (M) Urban 5,563 4,260 1,303 91 72 19 182 156 26 802110 Badoni (NP) Urban 898 632 266 32 29 3 34 24 10 802111 Bhander (NP) Urban 1,413 1,100 313 105 77 28 557 374 183
CultivatorsMain workersLocation
code number
District/ CD Block/ Town
Total/ Rural/ Urban
Industrial category
Agricultural labourers
40

PRIMARY CENSUS ABSTRACT
FOR SCHEDULED CASTES
Persons Males Females Persons Males Females Persons Males Females29 30 31 32 33 34 35 36 37 3 2
1,389 641 748 13,547 10,761 2,786 22,522 9,592 12,930 Total Datia - District563 300 263 5,880 4,466 1,414 20,516 8,447 12,069 Rural826 341 485 7,667 6,295 1,372 2,006 1,145 861 Urban129 94 35 1,311 958 353 6,434 2,754 3,680 Total Seondha129 94 35 1,311 958 353 6,434 2,754 3,680 Rural- - - - - - - - - Urban310 158 152 3,625 2,888 737 7,877 3,200 4,677 Total Datia310 158 152 3,625 2,888 737 7,877 3,200 4,677 Rural- - - - - - - - - Urban124 48 76 944 620 324 6,205 2,493 3,712 Total Bhander124 48 76 944 620 324 6,205 2,493 3,712 Rural- - - - - - - - - Urban
URBAN122 95 27 699 586 113 193 110 83 Urban Seondha (NP)30 24 6 769 671 98 438 337 101 Urban Indergarh (NP)
389 92 297 4,901 3,940 961 717 368 349 Urban Datia (M)237 105 132 595 474 121 182 42 140 Urban Badoni (NP)48 25 23 703 624 79 476 288 188 Urban Bhander (NP)
Household industry workers Marginal workersTotal/ Rural/ Urban
District/ CD Block/ Town
of main workers
Other workers
41
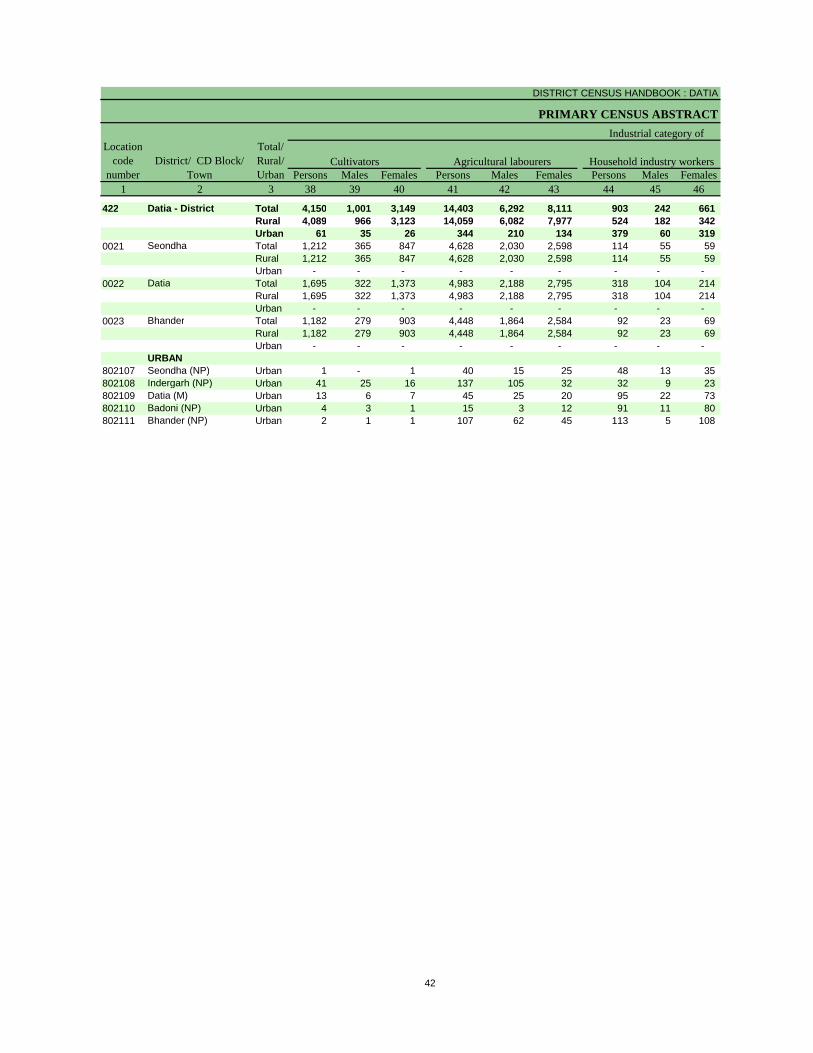
DISTRICT CENSUS HANDBOOK : DATIA
PRIMARY CENSUS ABSTRACT
Persons Males Females Persons Males Females Persons Males Females1 2 3 38 39 40 41 42 43 44 45 46
422 Datia - District Total 4,150 1,001 3,149 14,403 6,292 8,111 903 242 661 Rural 4,089 966 3,123 14,059 6,082 7,977 524 182 342 Urban 61 35 26 344 210 134 379 60 319
0021 Seondha Total 1,212 365 847 4,628 2,030 2,598 114 55 59 Rural 1,212 365 847 4,628 2,030 2,598 114 55 59 Urban - - - - - - - - -
0022 Datia Total 1,695 322 1,373 4,983 2,188 2,795 318 104 214 Rural 1,695 322 1,373 4,983 2,188 2,795 318 104 214 Urban - - - - - - - - -
0023 Bhander Total 1,182 279 903 4,448 1,864 2,584 92 23 69 Rural 1,182 279 903 4,448 1,864 2,584 92 23 69 Urban - - - - - - - - -
URBAN802107 Seondha (NP) Urban 1 - 1 40 15 25 48 13 35 802108 Indergarh (NP) Urban 41 25 16 137 105 32 32 9 23 802109 Datia (M) Urban 13 6 7 45 25 20 95 22 73 802110 Badoni (NP) Urban 4 3 1 15 3 12 91 11 80 802111 Bhander (NP) Urban 2 1 1 107 62 45 113 5 108
Location code
numberDistrict/ CD Block/
Town
Total/ Rural/ Urban
Agricultural labourers
Industrial category of
Cultivators Household industry workers
42
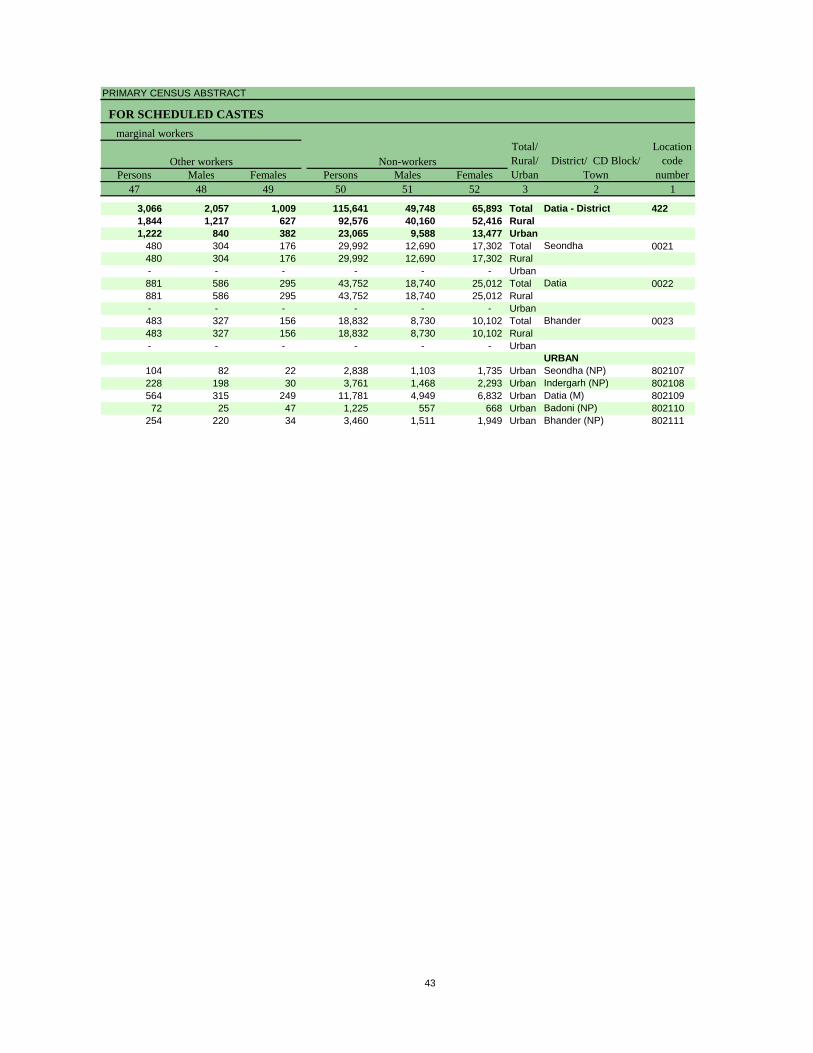
PRIMARY CENSUS ABSTRACT
FOR SCHEDULED CASTES
Persons Males Females Persons Males Females47 48 49 50 51 52 3 2 1
3,066 2,057 1,009 115,641 49,748 65,893 Total Datia - District 4221,844 1,217 627 92,576 40,160 52,416 Rural1,222 840 382 23,065 9,588 13,477 Urban
480 304 176 29,992 12,690 17,302 Total Seondha 0021480 304 176 29,992 12,690 17,302 Rural- - - - - - Urban881 586 295 43,752 18,740 25,012 Total Datia 0022881 586 295 43,752 18,740 25,012 Rural- - - - - - Urban483 327 156 18,832 8,730 10,102 Total Bhander 0023483 327 156 18,832 8,730 10,102 Rural- - - - - - Urban
URBAN104 82 22 2,838 1,103 1,735 Urban Seondha (NP) 802107228 198 30 3,761 1,468 2,293 Urban Indergarh (NP) 802108564 315 249 11,781 4,949 6,832 Urban Datia (M) 80210972 25 47 1,225 557 668 Urban Badoni (NP) 802110
254 220 34 3,460 1,511 1,949 Urban Bhander (NP) 802111
Non-workersTotal/ Rural/ Urban
marginal workers
District/ CD Block/ Town
Location code
numberOther workers
43

Primary Census Abstract for Scheduled Tribes (ST)
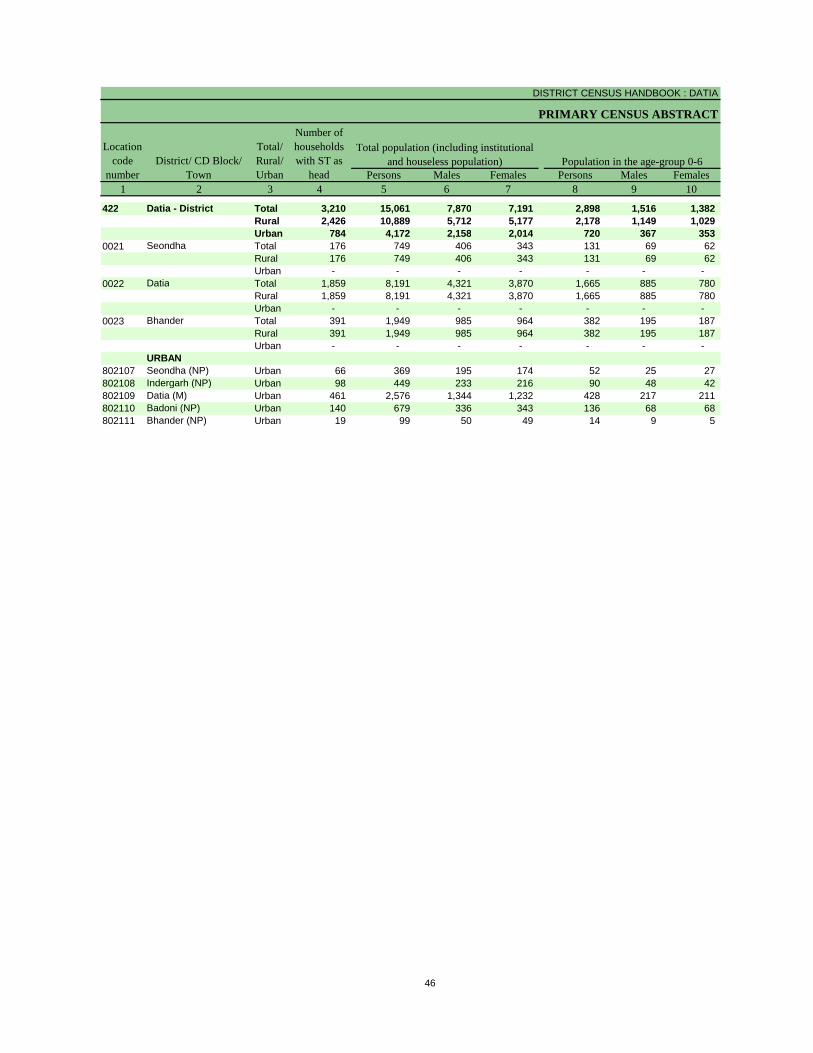
DISTRICT CENSUS HANDBOOK : DATIA
PRIMARY CENSUS ABSTRACT
Persons Males Females Persons Males Females1 2 3 4 5 6 7 8 9 10
422 Datia - District Total 3,210 15,061 7,870 7,191 2,898 1,516 1,382 Rural 2,426 10,889 5,712 5,177 2,178 1,149 1,029 Urban 784 4,172 2,158 2,014 720 367 353
0021 Seondha Total 176 749 406 343 131 69 62 Rural 176 749 406 343 131 69 62 Urban - - - - - - -
0022 Datia Total 1,859 8,191 4,321 3,870 1,665 885 780 Rural 1,859 8,191 4,321 3,870 1,665 885 780 Urban - - - - - - -
0023 Bhander Total 391 1,949 985 964 382 195 187 Rural 391 1,949 985 964 382 195 187 Urban - - - - - - -
URBAN802107 Seondha (NP) Urban 66 369 195 174 52 25 27 802108 Indergarh (NP) Urban 98 449 233 216 90 48 42 802109 Datia (M) Urban 461 2,576 1,344 1,232 428 217 211 802110 Badoni (NP) Urban 140 679 336 343 136 68 68 802111 Bhander (NP) Urban 19 99 50 49 14 9 5
Location code
numberDistrict/ CD Block/
Town
Total/ Rural/ Urban
Number of households with ST as
head
Total population (including institutional and houseless population) Population in the age-group 0-6
46
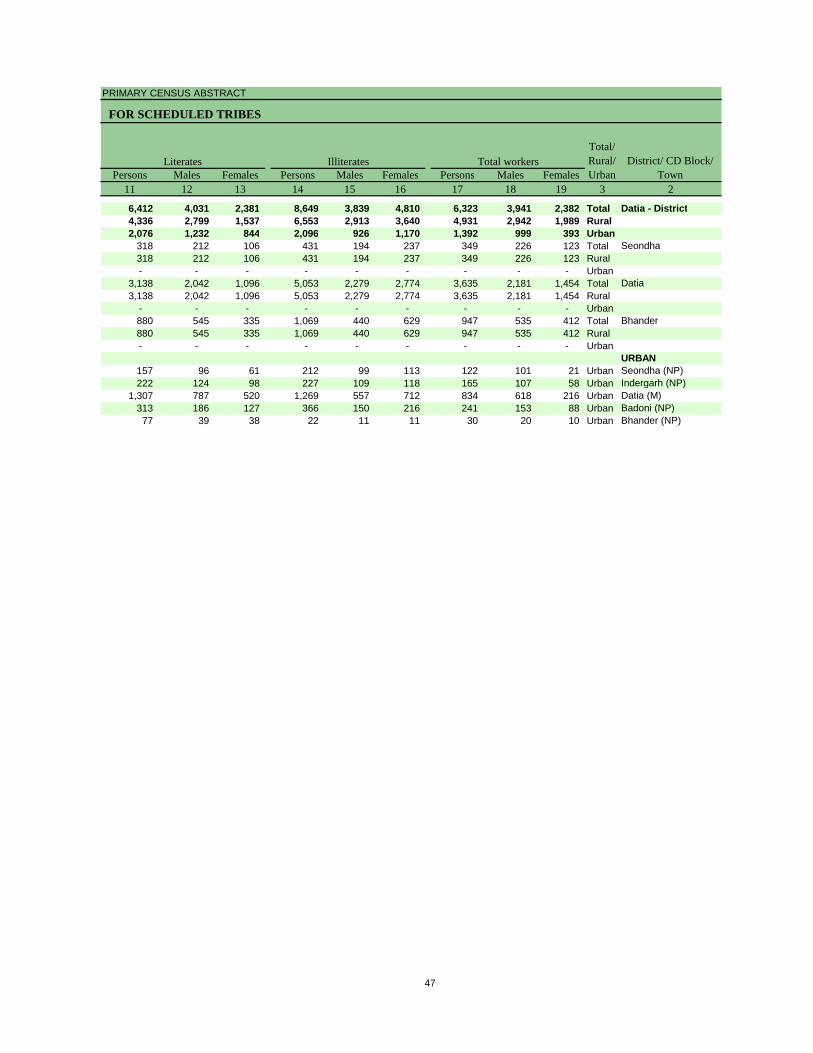
PRIMARY CENSUS ABSTRACT
FOR SCHEDULED TRIBES
Persons Males Females Persons Males Females Persons Males Females11 12 13 14 15 16 17 18 19 3 2
6,412 4,031 2,381 8,649 3,839 4,810 6,323 3,941 2,382 Total Datia - District4,336 2,799 1,537 6,553 2,913 3,640 4,931 2,942 1,989 Rural2,076 1,232 844 2,096 926 1,170 1,392 999 393 Urban
318 212 106 431 194 237 349 226 123 Total Seondha318 212 106 431 194 237 349 226 123 Rural- - - - - - - - - Urban
3,138 2,042 1,096 5,053 2,279 2,774 3,635 2,181 1,454 Total Datia3,138 2,042 1,096 5,053 2,279 2,774 3,635 2,181 1,454 Rural
- - - - - - - - - Urban880 545 335 1,069 440 629 947 535 412 Total Bhander880 545 335 1,069 440 629 947 535 412 Rural- - - - - - - - - Urban
URBAN157 96 61 212 99 113 122 101 21 Urban Seondha (NP)222 124 98 227 109 118 165 107 58 Urban Indergarh (NP)
1,307 787 520 1,269 557 712 834 618 216 Urban Datia (M)313 186 127 366 150 216 241 153 88 Urban Badoni (NP)77 39 38 22 11 11 30 20 10 Urban Bhander (NP)
District/ CD Block/ Town
Total/ Rural/ Urban
Total workersLiterates Illiterates
47
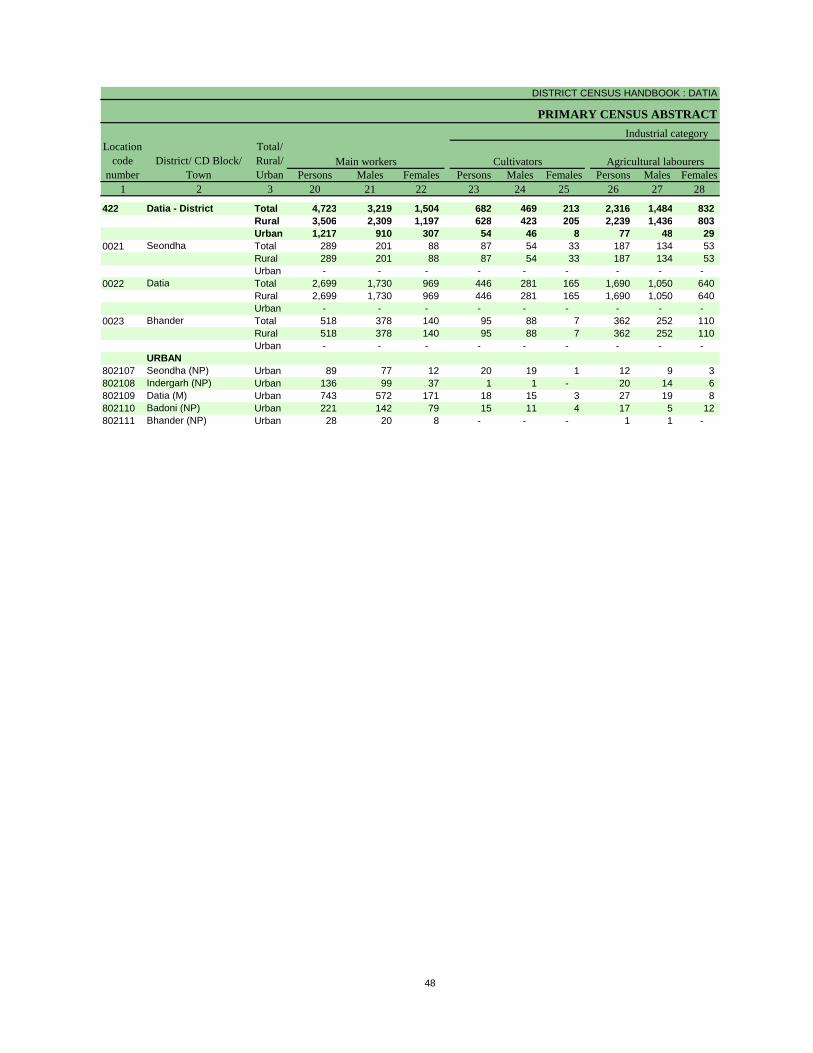
DISTRICT CENSUS HANDBOOK : DATIA
PRIMARY CENSUS ABSTRACT
Persons Males Females Persons Males Females Persons Males Females1 2 3 20 21 22 23 24 25 26 27 28
422 Datia - District Total 4,723 3,219 1,504 682 469 213 2,316 1,484 832 Rural 3,506 2,309 1,197 628 423 205 2,239 1,436 803 Urban 1,217 910 307 54 46 8 77 48 29
0021 Seondha Total 289 201 88 87 54 33 187 134 53 Rural 289 201 88 87 54 33 187 134 53 Urban - - - - - - - - -
0022 Datia Total 2,699 1,730 969 446 281 165 1,690 1,050 640 Rural 2,699 1,730 969 446 281 165 1,690 1,050 640 Urban - - - - - - - - -
0023 Bhander Total 518 378 140 95 88 7 362 252 110 Rural 518 378 140 95 88 7 362 252 110 Urban - - - - - - - - -
URBAN802107 Seondha (NP) Urban 89 77 12 20 19 1 12 9 3 802108 Indergarh (NP) Urban 136 99 37 1 1 - 20 14 6 802109 Datia (M) Urban 743 572 171 18 15 3 27 19 8 802110 Badoni (NP) Urban 221 142 79 15 11 4 17 5 12 802111 Bhander (NP) Urban 28 20 8 - - - 1 1 -
District/ CD Block/ Town
Total/ Rural/ Urban
Industrial category
Agricultural labourersMain workersLocation
code number
Cultivators
48
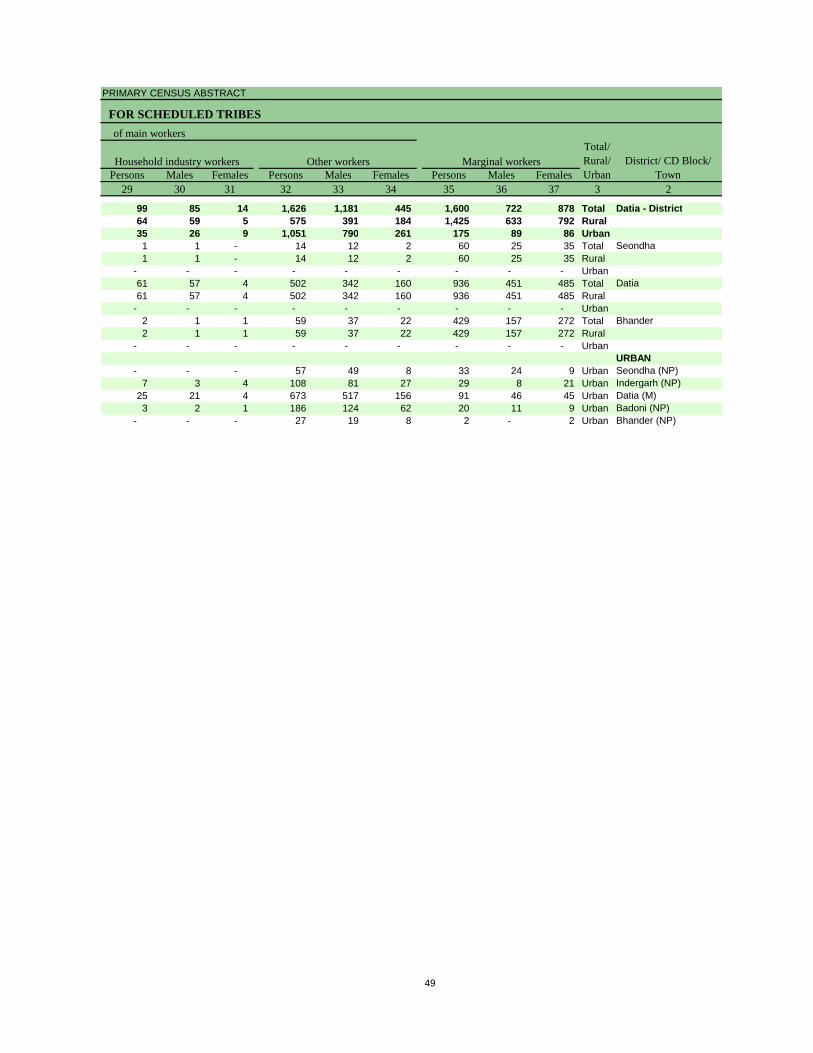
PRIMARY CENSUS ABSTRACT
FOR SCHEDULED TRIBES
Persons Males Females Persons Males Females Persons Males Females29 30 31 32 33 34 35 36 37 3 2
99 85 14 1,626 1,181 445 1,600 722 878 Total Datia - District64 59 5 575 391 184 1,425 633 792 Rural35 26 9 1,051 790 261 175 89 86 Urban1 1 - 14 12 2 60 25 35 Total Seondha1 1 - 14 12 2 60 25 35 Rural
- - - - - - - - - Urban61 57 4 502 342 160 936 451 485 Total Datia61 57 4 502 342 160 936 451 485 Rural
- - - - - - - - - Urban2 1 1 59 37 22 429 157 272 Total Bhander2 1 1 59 37 22 429 157 272 Rural
- - - - - - - - - UrbanURBAN
- - - 57 49 8 33 24 9 Urban Seondha (NP)7 3 4 108 81 27 29 8 21 Urban Indergarh (NP)
25 21 4 673 517 156 91 46 45 Urban Datia (M)3 2 1 186 124 62 20 11 9 Urban Badoni (NP)
- - - 27 19 8 2 - 2 Urban Bhander (NP)
of main workers
Other workersHousehold industry workers Marginal workersTotal/ Rural/ Urban
District/ CD Block/ Town
49
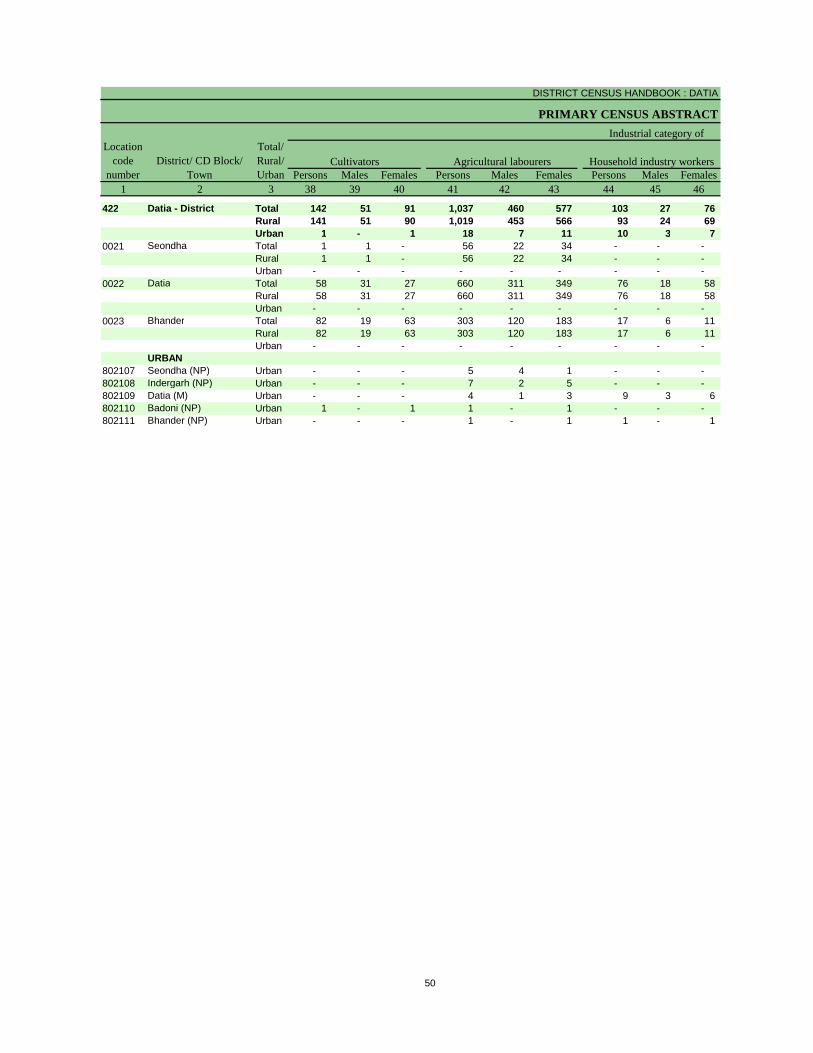
DISTRICT CENSUS HANDBOOK : DATIA
PRIMARY CENSUS ABSTRACT
Persons Males Females Persons Males Females Persons Males Females1 2 3 38 39 40 41 42 43 44 45 46
422 Datia - District Total 142 51 91 1,037 460 577 103 27 76 Rural 141 51 90 1,019 453 566 93 24 69 Urban 1 - 1 18 7 11 10 3 7
0021 Seondha Total 1 1 - 56 22 34 - - - Rural 1 1 - 56 22 34 - - - Urban - - - - - - - - -
0022 Datia Total 58 31 27 660 311 349 76 18 58 Rural 58 31 27 660 311 349 76 18 58 Urban - - - - - - - - -
0023 Bhander Total 82 19 63 303 120 183 17 6 11 Rural 82 19 63 303 120 183 17 6 11 Urban - - - - - - - - -
URBAN802107 Seondha (NP) Urban - - - 5 4 1 - - - 802108 Indergarh (NP) Urban - - - 7 2 5 - - - 802109 Datia (M) Urban - - - 4 1 3 9 3 6 802110 Badoni (NP) Urban 1 - 1 1 - 1 - - - 802111 Bhander (NP) Urban - - - 1 - 1 1 - 1
Cultivators Household industry workersLocation
code number
District/ CD Block/ Town
Total/ Rural/ Urban
Agricultural labourers
Industrial category of
50
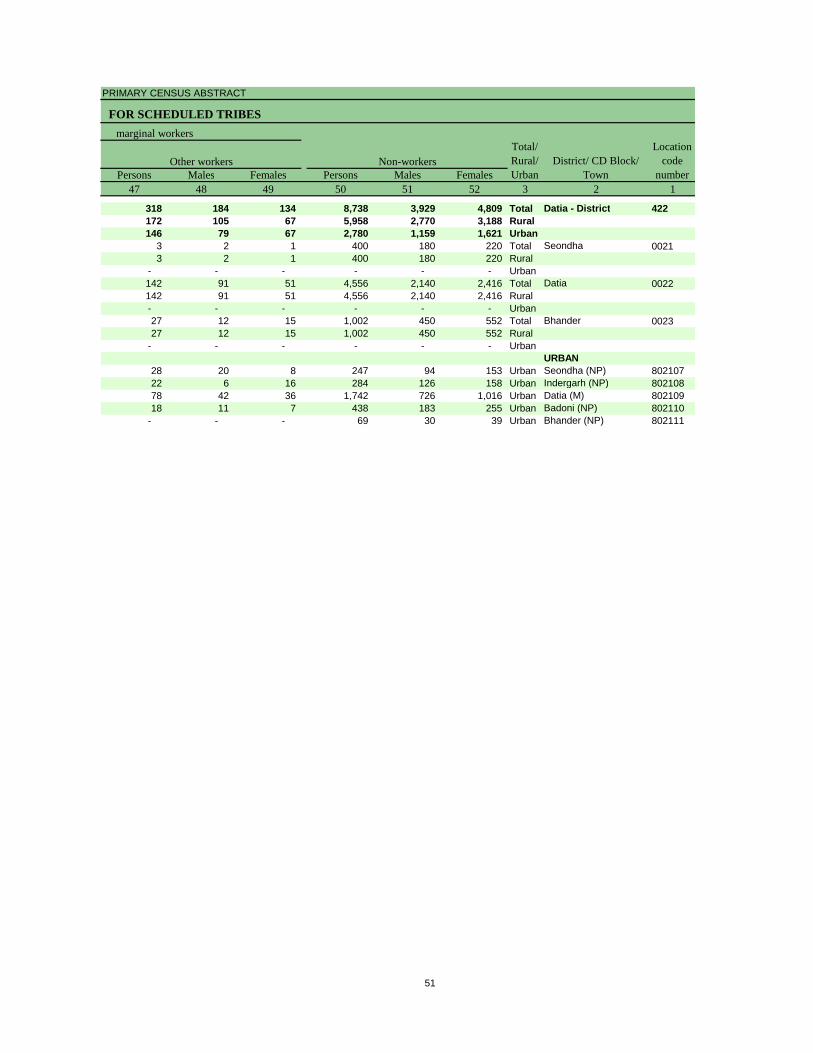
PRIMARY CENSUS ABSTRACT
FOR SCHEDULED TRIBES
Persons Males Females Persons Males Females47 48 49 50 51 52 3 2 1
318 184 134 8,738 3,929 4,809 Total Datia - District 422172 105 67 5,958 2,770 3,188 Rural146 79 67 2,780 1,159 1,621 Urban
3 2 1 400 180 220 Total Seondha 00213 2 1 400 180 220 Rural
- - - - - - Urban142 91 51 4,556 2,140 2,416 Total Datia 0022142 91 51 4,556 2,140 2,416 Rural- - - - - - Urban27 12 15 1,002 450 552 Total Bhander 002327 12 15 1,002 450 552 Rural
- - - - - - UrbanURBAN
28 20 8 247 94 153 Urban Seondha (NP) 80210722 6 16 284 126 158 Urban Indergarh (NP) 80210878 42 36 1,742 726 1,016 Urban Datia (M) 80210918 11 7 438 183 255 Urban Badoni (NP) 802110
- - - 69 30 39 Urban Bhander (NP) 802111
District/ CD Block/ Town
Location code
numberOther workers Non-workers
Total/ Rural/ Urban
marginal workers
51

Rural PCA-C.D. blocks wise Village Primary Census
Abstract
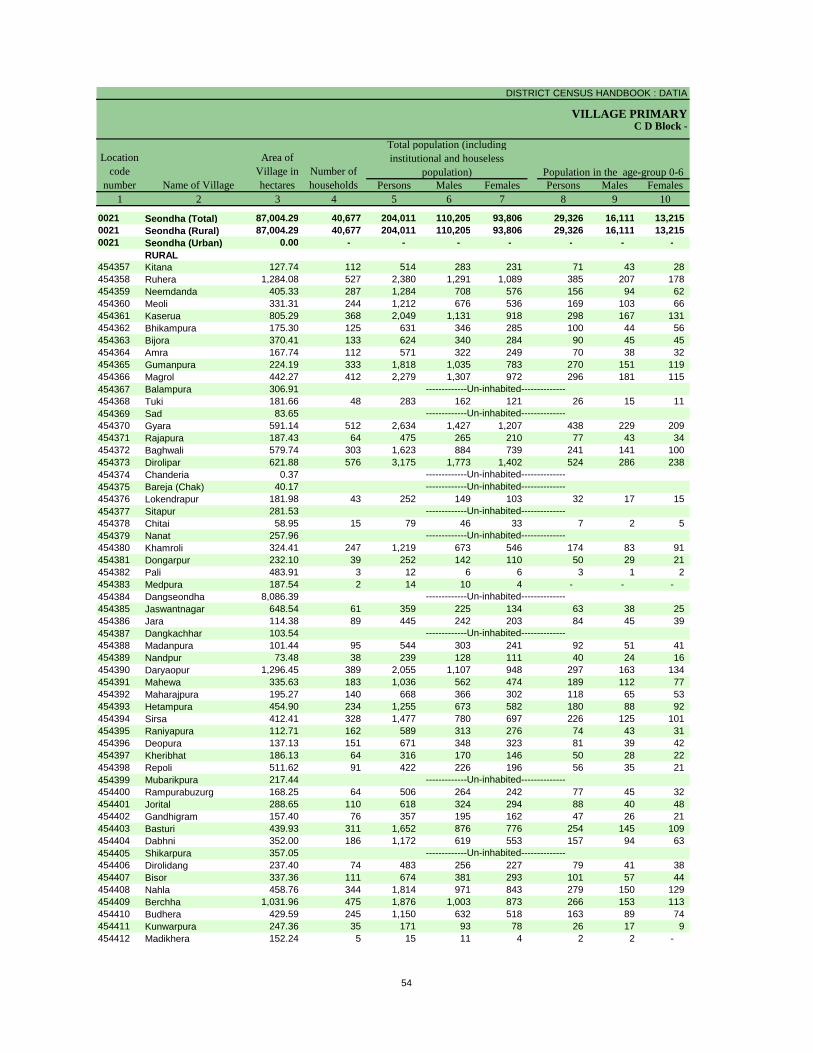
DISTRICT CENSUS HANDBOOK : DATIA
VILLAGE PRIMARY
Persons Males Females Persons Males Females1 2 3 4 5 6 7 8 9 10
0021 Seondha (Total) 87,004.29 40,677 204,011 110,205 93,806 29,326 16,111 13,215 0021 Seondha (Rural) 87,004.29 40,677 204,011 110,205 93,806 29,326 16,111 13,215 0021 Seondha (Urban) 0.00 - - - - - - -
RURAL454357 Kitana 127.74 112 514 283 231 71 43 28 454358 Ruhera 1,284.08 527 2,380 1,291 1,089 385 207 178 454359 Neemdanda 405.33 287 1,284 708 576 156 94 62 454360 Meoli 331.31 244 1,212 676 536 169 103 66 454361 Kaserua 805.29 368 2,049 1,131 918 298 167 131 454362 Bhikampura 175.30 125 631 346 285 100 44 56 454363 Bijora 370.41 133 624 340 284 90 45 45 454364 Amra 167.74 112 571 322 249 70 38 32 454365 Gumanpura 224.19 333 1,818 1,035 783 270 151 119 454366 Magrol 442.27 412 2,279 1,307 972 296 181 115 454367 Balampura 306.91454368 Tuki 181.66 48 283 162 121 26 15 11 454369 Sad 83.65454370 Gyara 591.14 512 2,634 1,427 1,207 438 229 209 454371 Rajapura 187.43 64 475 265 210 77 43 34 454372 Baghwali 579.74 303 1,623 884 739 241 141 100 454373 Dirolipar 621.88 576 3,175 1,773 1,402 524 286 238 454374 Chanderia 0.37454375 Bareja (Chak) 40.17454376 Lokendrapur 181.98 43 252 149 103 32 17 15 454377 Sitapur 281.53454378 Chitai 58.95 15 79 46 33 7 2 5 454379 Nanat 257.96454380 Khamroli 324.41 247 1,219 673 546 174 83 91 454381 Dongarpur 232.10 39 252 142 110 50 29 21 454382 Pali 483.91 3 12 6 6 3 1 2 454383 Medpura 187.54 2 14 10 4 - - - 454384 Dangseondha 8,086.39454385 Jaswantnagar 648.54 61 359 225 134 63 38 25 454386 Jara 114.38 89 445 242 203 84 45 39 454387 Dangkachhar 103.54454388 Madanpura 101.44 95 544 303 241 92 51 41 454389 Nandpur 73.48 38 239 128 111 40 24 16 454390 Daryaopur 1,296.45 389 2,055 1,107 948 297 163 134 454391 Mahewa 335.63 183 1,036 562 474 189 112 77 454392 Maharajpura 195.27 140 668 366 302 118 65 53 454393 Hetampura 454.90 234 1,255 673 582 180 88 92 454394 Sirsa 412.41 328 1,477 780 697 226 125 101 454395 Raniyapura 112.71 162 589 313 276 74 43 31 454396 Deopura 137.13 151 671 348 323 81 39 42 454397 Kheribhat 186.13 64 316 170 146 50 28 22 454398 Repoli 511.62 91 422 226 196 56 35 21 454399 Mubarikpura 217.44454400 Rampurabuzurg 168.25 64 506 264 242 77 45 32 454401 Jorital 288.65 110 618 324 294 88 40 48 454402 Gandhigram 157.40 76 357 195 162 47 26 21 454403 Basturi 439.93 311 1,652 876 776 254 145 109 454404 Dabhni 352.00 186 1,172 619 553 157 94 63 454405 Shikarpura 357.05454406 Dirolidang 237.40 74 483 256 227 79 41 38 454407 Bisor 337.36 111 674 381 293 101 57 44 454408 Nahla 458.76 344 1,814 971 843 279 150 129 454409 Berchha 1,031.96 475 1,876 1,003 873 266 153 113 454410 Budhera 429.59 245 1,150 632 518 163 89 74 454411 Kunwarpura 247.36 35 171 93 78 26 17 9 454412 Madikhera 152.24 5 15 11 4 2 2 -
Name of Village
Location code
number
Total population (including institutional and houseless
population)Area of
Village in hectares
Number of households
C D Block -
Population in the age-group 0-6
-------------Un-inhabited--------------
-------------Un-inhabited--------------
-------------Un-inhabited---------------------------Un-inhabited--------------
-------------Un-inhabited--------------
-------------Un-inhabited--------------
-------------Un-inhabited--------------
-------------Un-inhabited--------------
-------------Un-inhabited--------------
-------------Un-inhabited--------------
54
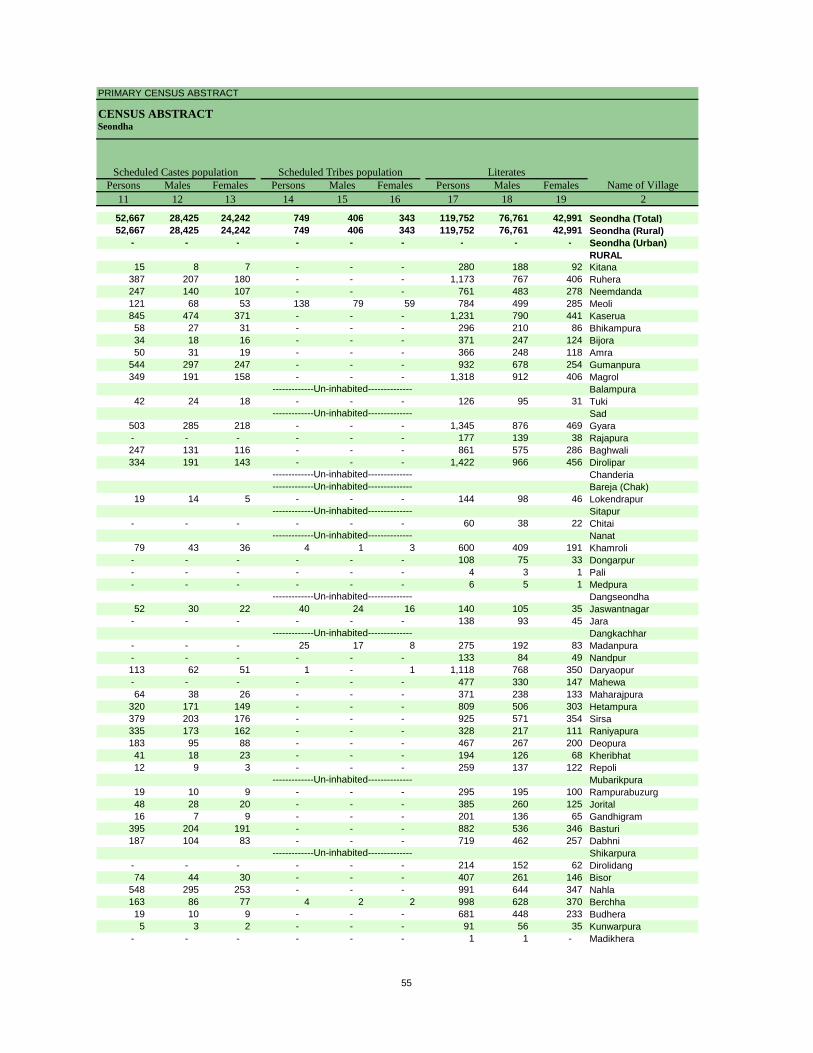
PRIMARY CENSUS ABSTRACT
CENSUS ABSTRACTSeondha
Persons Males Females Persons Males Females Persons Males Females11 12 13 14 15 16 17 18 19 2
52,667 28,425 24,242 749 406 343 119,752 76,761 42,991 Seondha (Total)52,667 28,425 24,242 749 406 343 119,752 76,761 42,991 Seondha (Rural)
- - - - - - - - - Seondha (Urban)RURAL
15 8 7 - - - 280 188 92 Kitana387 207 180 - - - 1,173 767 406 Ruhera247 140 107 - - - 761 483 278 Neemdanda121 68 53 138 79 59 784 499 285 Meoli845 474 371 - - - 1,231 790 441 Kaserua58 27 31 - - - 296 210 86 Bhikampura34 18 16 - - - 371 247 124 Bijora50 31 19 - - - 366 248 118 Amra
544 297 247 - - - 932 678 254 Gumanpura349 191 158 - - - 1,318 912 406 Magrol
Balampura42 24 18 - - - 126 95 31 Tuki
Sad503 285 218 - - - 1,345 876 469 Gyara- - - - - - 177 139 38 Rajapura247 131 116 - - - 861 575 286 Baghwali334 191 143 - - - 1,422 966 456 Dirolipar
ChanderiaBareja (Chak)
19 14 5 - - - 144 98 46 LokendrapurSitapur
- - - - - - 60 38 22 ChitaiNanat
79 43 36 4 1 3 600 409 191 Khamroli- - - - - - 108 75 33 Dongarpur- - - - - - 4 3 1 Pali- - - - - - 6 5 1 Medpura
Dangseondha52 30 22 40 24 16 140 105 35 Jaswantnagar
- - - - - - 138 93 45 JaraDangkachhar
- - - 25 17 8 275 192 83 Madanpura- - - - - - 133 84 49 Nandpur113 62 51 1 - 1 1,118 768 350 Daryaopur- - - - - - 477 330 147 Mahewa64 38 26 - - - 371 238 133 Maharajpura
320 171 149 - - - 809 506 303 Hetampura379 203 176 - - - 925 571 354 Sirsa335 173 162 - - - 328 217 111 Raniyapura183 95 88 - - - 467 267 200 Deopura41 18 23 - - - 194 126 68 Kheribhat12 9 3 - - - 259 137 122 Repoli
Mubarikpura19 10 9 - - - 295 195 100 Rampurabuzurg48 28 20 - - - 385 260 125 Jorital16 7 9 - - - 201 136 65 Gandhigram
395 204 191 - - - 882 536 346 Basturi187 104 83 - - - 719 462 257 Dabhni
Shikarpura- - - - - - 214 152 62 Dirolidang74 44 30 - - - 407 261 146 Bisor
548 295 253 - - - 991 644 347 Nahla163 86 77 4 2 2 998 628 370 Berchha19 10 9 - - - 681 448 233 Budhera5 3 2 - - - 91 56 35 Kunwarpura
- - - - - - 1 1 - Madikhera
Name of VillageLiteratesScheduled Castes population Scheduled Tribes population
-------------Un-inhabited--------------
-------------Un-inhabited--------------
-------------Un-inhabited---------------------------Un-inhabited--------------
-------------Un-inhabited--------------
-------------Un-inhabited--------------
-------------Un-inhabited--------------
-------------Un-inhabited--------------
-------------Un-inhabited--------------
-------------Un-inhabited--------------
55
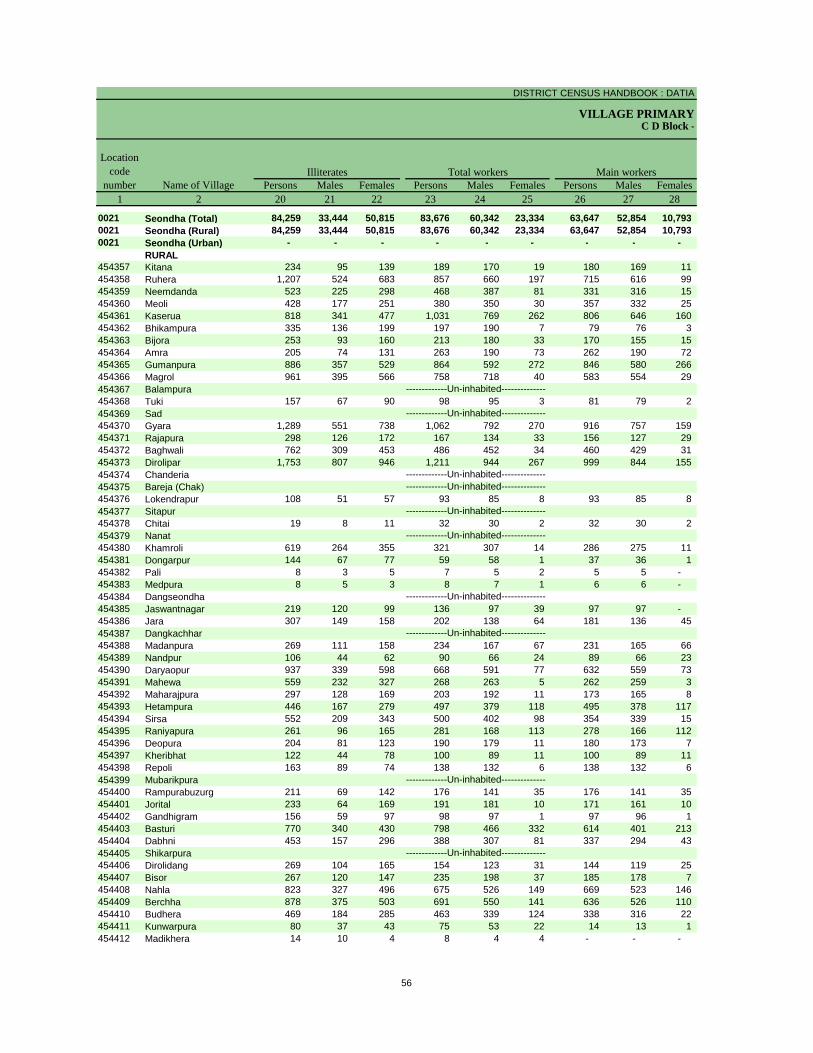
DISTRICT CENSUS HANDBOOK : DATIA
VILLAGE PRIMARYC D Block -
Persons Males Females Persons Males Females Persons Males Females1 2 20 21 22 23 24 25 26 27 28
0021 Seondha (Total) 84,259 33,444 50,815 83,676 60,342 23,334 63,647 52,854 10,793 0021 Seondha (Rural) 84,259 33,444 50,815 83,676 60,342 23,334 63,647 52,854 10,793 0021 Seondha (Urban) - - - - - - - - -
RURAL454357 Kitana 234 95 139 189 170 19 180 169 11 454358 Ruhera 1,207 524 683 857 660 197 715 616 99 454359 Neemdanda 523 225 298 468 387 81 331 316 15 454360 Meoli 428 177 251 380 350 30 357 332 25 454361 Kaserua 818 341 477 1,031 769 262 806 646 160 454362 Bhikampura 335 136 199 197 190 7 79 76 3 454363 Bijora 253 93 160 213 180 33 170 155 15 454364 Amra 205 74 131 263 190 73 262 190 72 454365 Gumanpura 886 357 529 864 592 272 846 580 266 454366 Magrol 961 395 566 758 718 40 583 554 29 454367 Balampura454368 Tuki 157 67 90 98 95 3 81 79 2 454369 Sad454370 Gyara 1,289 551 738 1,062 792 270 916 757 159 454371 Rajapura 298 126 172 167 134 33 156 127 29 454372 Baghwali 762 309 453 486 452 34 460 429 31 454373 Dirolipar 1,753 807 946 1,211 944 267 999 844 155 454374 Chanderia454375 Bareja (Chak)454376 Lokendrapur 108 51 57 93 85 8 93 85 8 454377 Sitapur454378 Chitai 19 8 11 32 30 2 32 30 2 454379 Nanat454380 Khamroli 619 264 355 321 307 14 286 275 11 454381 Dongarpur 144 67 77 59 58 1 37 36 1 454382 Pali 8 3 5 7 5 2 5 5 - 454383 Medpura 8 5 3 8 7 1 6 6 - 454384 Dangseondha454385 Jaswantnagar 219 120 99 136 97 39 97 97 - 454386 Jara 307 149 158 202 138 64 181 136 45 454387 Dangkachhar454388 Madanpura 269 111 158 234 167 67 231 165 66 454389 Nandpur 106 44 62 90 66 24 89 66 23 454390 Daryaopur 937 339 598 668 591 77 632 559 73 454391 Mahewa 559 232 327 268 263 5 262 259 3 454392 Maharajpura 297 128 169 203 192 11 173 165 8 454393 Hetampura 446 167 279 497 379 118 495 378 117 454394 Sirsa 552 209 343 500 402 98 354 339 15 454395 Raniyapura 261 96 165 281 168 113 278 166 112 454396 Deopura 204 81 123 190 179 11 180 173 7 454397 Kheribhat 122 44 78 100 89 11 100 89 11 454398 Repoli 163 89 74 138 132 6 138 132 6 454399 Mubarikpura454400 Rampurabuzurg 211 69 142 176 141 35 176 141 35 454401 Jorital 233 64 169 191 181 10 171 161 10 454402 Gandhigram 156 59 97 98 97 1 97 96 1 454403 Basturi 770 340 430 798 466 332 614 401 213 454404 Dabhni 453 157 296 388 307 81 337 294 43 454405 Shikarpura454406 Dirolidang 269 104 165 154 123 31 144 119 25 454407 Bisor 267 120 147 235 198 37 185 178 7 454408 Nahla 823 327 496 675 526 149 669 523 146 454409 Berchha 878 375 503 691 550 141 636 526 110 454410 Budhera 469 184 285 463 339 124 338 316 22 454411 Kunwarpura 80 37 43 75 53 22 14 13 1 454412 Madikhera 14 10 4 8 4 4 - - -
Name of Village
Location code
numberIlliterates Total workers Main workers
-------------Un-inhabited--------------
-------------Un-inhabited--------------
-------------Un-inhabited---------------------------Un-inhabited--------------
-------------Un-inhabited--------------
-------------Un-inhabited--------------
-------------Un-inhabited--------------
-------------Un-inhabited--------------
-------------Un-inhabited--------------
-------------Un-inhabited--------------
56
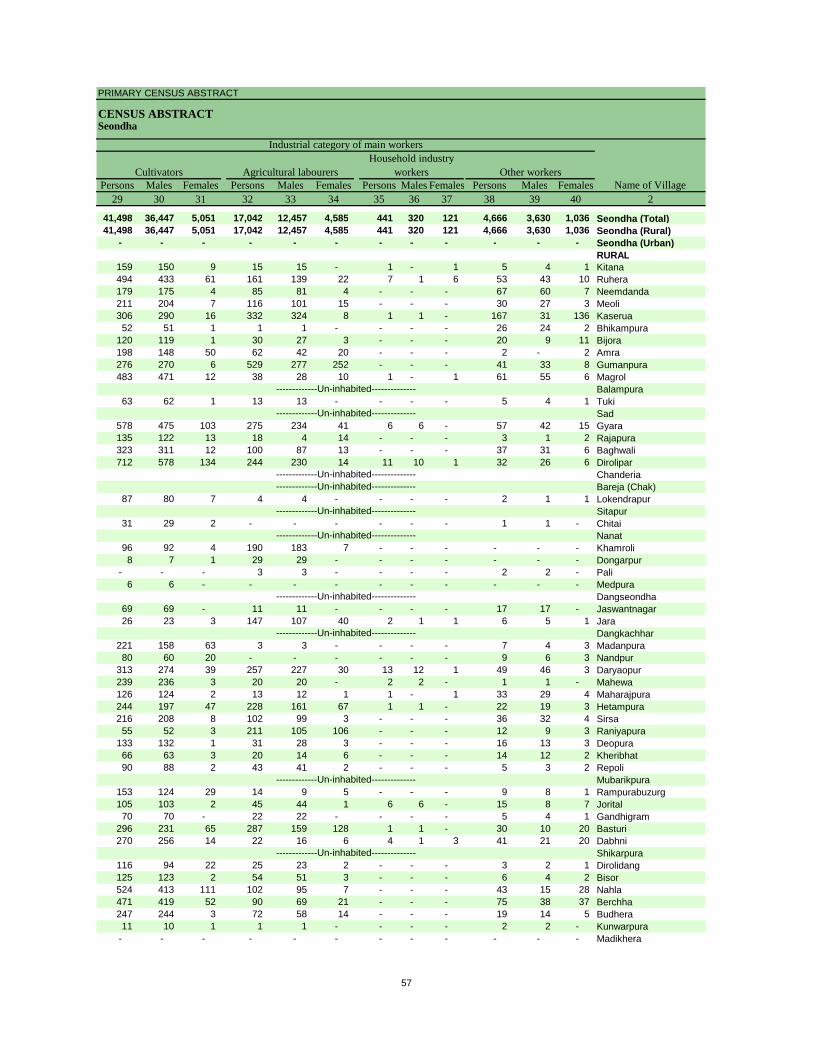
PRIMARY CENSUS ABSTRACT
CENSUS ABSTRACTSeondha
Persons Males Females Persons Males Females Persons Males Females Persons Males Females29 30 31 32 33 34 35 36 37 38 39 40 2
41,498 36,447 5,051 17,042 12,457 4,585 441 320 121 4,666 3,630 1,036 Seondha (Total)41,498 36,447 5,051 17,042 12,457 4,585 441 320 121 4,666 3,630 1,036 Seondha (Rural)
- - - - - - - - - - - - Seondha (Urban)RURAL
159 150 9 15 15 - 1 - 1 5 4 1 Kitana494 433 61 161 139 22 7 1 6 53 43 10 Ruhera179 175 4 85 81 4 - - - 67 60 7 Neemdanda211 204 7 116 101 15 - - - 30 27 3 Meoli306 290 16 332 324 8 1 1 - 167 31 136 Kaserua52 51 1 1 1 - - - - 26 24 2 Bhikampura
120 119 1 30 27 3 - - - 20 9 11 Bijora198 148 50 62 42 20 - - - 2 - 2 Amra276 270 6 529 277 252 - - - 41 33 8 Gumanpura483 471 12 38 28 10 1 - 1 61 55 6 Magrol
Balampura63 62 1 13 13 - - - - 5 4 1 Tuki
Sad578 475 103 275 234 41 6 6 - 57 42 15 Gyara135 122 13 18 4 14 - - - 3 1 2 Rajapura323 311 12 100 87 13 - - - 37 31 6 Baghwali712 578 134 244 230 14 11 10 1 32 26 6 Dirolipar
ChanderiaBareja (Chak)
87 80 7 4 4 - - - - 2 1 1 LokendrapurSitapur
31 29 2 - - - - - - 1 1 - ChitaiNanat
96 92 4 190 183 7 - - - - - - Khamroli8 7 1 29 29 - - - - - - - Dongarpur
- - - 3 3 - - - - 2 2 - Pali6 6 - - - - - - - - - - Medpura
Dangseondha69 69 - 11 11 - - - - 17 17 - Jaswantnagar26 23 3 147 107 40 2 1 1 6 5 1 Jara
Dangkachhar221 158 63 3 3 - - - - 7 4 3 Madanpura80 60 20 - - - - - - 9 6 3 Nandpur
313 274 39 257 227 30 13 12 1 49 46 3 Daryaopur239 236 3 20 20 - 2 2 - 1 1 - Mahewa126 124 2 13 12 1 1 - 1 33 29 4 Maharajpura244 197 47 228 161 67 1 1 - 22 19 3 Hetampura216 208 8 102 99 3 - - - 36 32 4 Sirsa55 52 3 211 105 106 - - - 12 9 3 Raniyapura
133 132 1 31 28 3 - - - 16 13 3 Deopura66 63 3 20 14 6 - - - 14 12 2 Kheribhat90 88 2 43 41 2 - - - 5 3 2 Repoli
Mubarikpura153 124 29 14 9 5 - - - 9 8 1 Rampurabuzurg105 103 2 45 44 1 6 6 - 15 8 7 Jorital70 70 - 22 22 - - - - 5 4 1 Gandhigram
296 231 65 287 159 128 1 1 - 30 10 20 Basturi270 256 14 22 16 6 4 1 3 41 21 20 Dabhni
Shikarpura116 94 22 25 23 2 - - - 3 2 1 Dirolidang125 123 2 54 51 3 - - - 6 4 2 Bisor524 413 111 102 95 7 - - - 43 15 28 Nahla471 419 52 90 69 21 - - - 75 38 37 Berchha247 244 3 72 58 14 - - - 19 14 5 Budhera11 10 1 1 1 - - - - 2 2 - Kunwarpura
- - - - - - - - - - - - Madikhera
CultivatorsName of Village
Household industry workersAgricultural labourers
Industrial category of main workers
Other workers
-------------Un-inhabited--------------
-------------Un-inhabited--------------
-------------Un-inhabited---------------------------Un-inhabited--------------
-------------Un-inhabited--------------
-------------Un-inhabited--------------
-------------Un-inhabited--------------
-------------Un-inhabited--------------
-------------Un-inhabited--------------
-------------Un-inhabited--------------
57
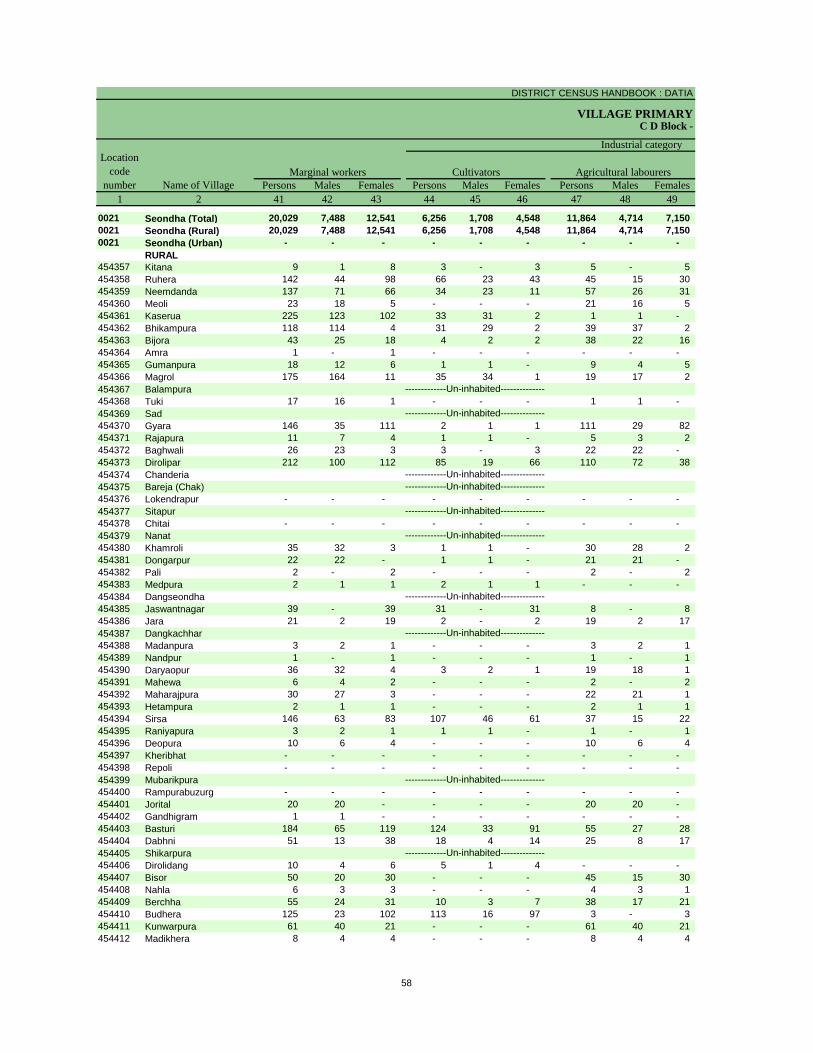
DISTRICT CENSUS HANDBOOK : DATIA
VILLAGE PRIMARYC D Block -
Persons Males Females Persons Males Females Persons Males Females1 2 41 42 43 44 45 46 47 48 49
0021 Seondha (Total) 20,029 7,488 12,541 6,256 1,708 4,548 11,864 4,714 7,150 0021 Seondha (Rural) 20,029 7,488 12,541 6,256 1,708 4,548 11,864 4,714 7,150 0021 Seondha (Urban) - - - - - - - - -
RURAL454357 Kitana 9 1 8 3 - 3 5 - 5 454358 Ruhera 142 44 98 66 23 43 45 15 30 454359 Neemdanda 137 71 66 34 23 11 57 26 31 454360 Meoli 23 18 5 - - - 21 16 5 454361 Kaserua 225 123 102 33 31 2 1 1 - 454362 Bhikampura 118 114 4 31 29 2 39 37 2 454363 Bijora 43 25 18 4 2 2 38 22 16 454364 Amra 1 - 1 - - - - - - 454365 Gumanpura 18 12 6 1 1 - 9 4 5 454366 Magrol 175 164 11 35 34 1 19 17 2 454367 Balampura454368 Tuki 17 16 1 - - - 1 1 - 454369 Sad454370 Gyara 146 35 111 2 1 1 111 29 82 454371 Rajapura 11 7 4 1 1 - 5 3 2 454372 Baghwali 26 23 3 3 - 3 22 22 - 454373 Dirolipar 212 100 112 85 19 66 110 72 38 454374 Chanderia454375 Bareja (Chak)454376 Lokendrapur - - - - - - - - - 454377 Sitapur454378 Chitai - - - - - - - - - 454379 Nanat454380 Khamroli 35 32 3 1 1 - 30 28 2 454381 Dongarpur 22 22 - 1 1 - 21 21 - 454382 Pali 2 - 2 - - - 2 - 2 454383 Medpura 2 1 1 2 1 1 - - - 454384 Dangseondha454385 Jaswantnagar 39 - 39 31 - 31 8 - 8 454386 Jara 21 2 19 2 - 2 19 2 17 454387 Dangkachhar454388 Madanpura 3 2 1 - - - 3 2 1 454389 Nandpur 1 - 1 - - - 1 - 1 454390 Daryaopur 36 32 4 3 2 1 19 18 1 454391 Mahewa 6 4 2 - - - 2 - 2 454392 Maharajpura 30 27 3 - - - 22 21 1 454393 Hetampura 2 1 1 - - - 2 1 1 454394 Sirsa 146 63 83 107 46 61 37 15 22 454395 Raniyapura 3 2 1 1 1 - 1 - 1 454396 Deopura 10 6 4 - - - 10 6 4 454397 Kheribhat - - - - - - - - - 454398 Repoli - - - - - - - - - 454399 Mubarikpura454400 Rampurabuzurg - - - - - - - - - 454401 Jorital 20 20 - - - - 20 20 - 454402 Gandhigram 1 1 - - - - - - - 454403 Basturi 184 65 119 124 33 91 55 27 28 454404 Dabhni 51 13 38 18 4 14 25 8 17 454405 Shikarpura454406 Dirolidang 10 4 6 5 1 4 - - - 454407 Bisor 50 20 30 - - - 45 15 30 454408 Nahla 6 3 3 - - - 4 3 1 454409 Berchha 55 24 31 10 3 7 38 17 21 454410 Budhera 125 23 102 113 16 97 3 - 3 454411 Kunwarpura 61 40 21 - - - 61 40 21 454412 Madikhera 8 4 4 - - - 8 4 4
Name of VillageMarginal workers Cultivators Agricultural labourers
Industrial category Location
code number
-------------Un-inhabited--------------
-------------Un-inhabited--------------
-------------Un-inhabited---------------------------Un-inhabited--------------
-------------Un-inhabited--------------
-------------Un-inhabited--------------
-------------Un-inhabited--------------
-------------Un-inhabited--------------
-------------Un-inhabited--------------
-------------Un-inhabited--------------
58
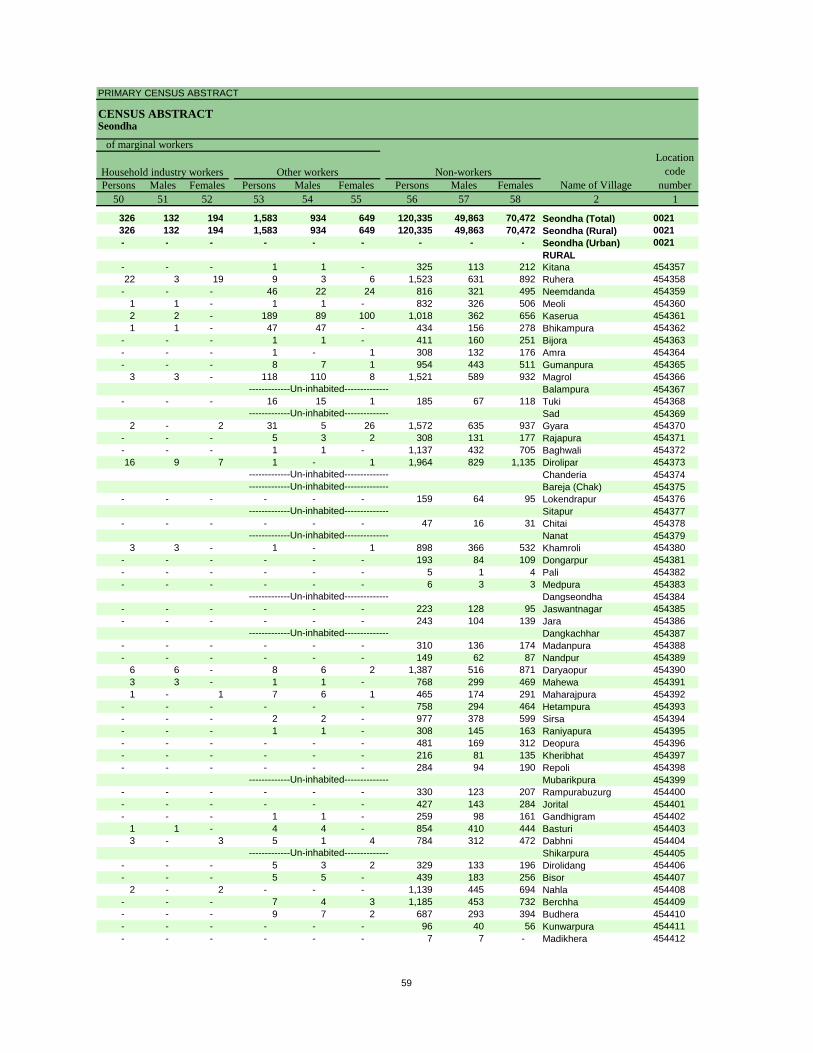
PRIMARY CENSUS ABSTRACT
CENSUS ABSTRACTSeondha
Persons Males Females Persons Males Females Persons Males Females50 51 52 53 54 55 56 57 58 2 1
326 132 194 1,583 934 649 120,335 49,863 70,472 Seondha (Total) 0021326 132 194 1,583 934 649 120,335 49,863 70,472 Seondha (Rural) 0021- - - - - - - - - Seondha (Urban) 0021
RURAL- - - 1 1 - 325 113 212 Kitana 45435722 3 19 9 3 6 1,523 631 892 Ruhera 454358
- - - 46 22 24 816 321 495 Neemdanda 4543591 1 - 1 1 - 832 326 506 Meoli 4543602 2 - 189 89 100 1,018 362 656 Kaserua 4543611 1 - 47 47 - 434 156 278 Bhikampura 454362
- - - 1 1 - 411 160 251 Bijora 454363- - - 1 - 1 308 132 176 Amra 454364- - - 8 7 1 954 443 511 Gumanpura 454365
3 3 - 118 110 8 1,521 589 932 Magrol 454366Balampura 454367
- - - 16 15 1 185 67 118 Tuki 454368Sad 454369
2 - 2 31 5 26 1,572 635 937 Gyara 454370- - - 5 3 2 308 131 177 Rajapura 454371- - - 1 1 - 1,137 432 705 Baghwali 45437216 9 7 1 - 1 1,964 829 1,135 Dirolipar 454373
Chanderia 454374Bareja (Chak) 454375
- - - - - - 159 64 95 Lokendrapur 454376Sitapur 454377
- - - - - - 47 16 31 Chitai 454378Nanat 454379
3 3 - 1 - 1 898 366 532 Khamroli 454380- - - - - - 193 84 109 Dongarpur 454381- - - - - - 5 1 4 Pali 454382- - - - - - 6 3 3 Medpura 454383
Dangseondha 454384- - - - - - 223 128 95 Jaswantnagar 454385- - - - - - 243 104 139 Jara 454386
Dangkachhar 454387- - - - - - 310 136 174 Madanpura 454388- - - - - - 149 62 87 Nandpur 454389
6 6 - 8 6 2 1,387 516 871 Daryaopur 4543903 3 - 1 1 - 768 299 469 Mahewa 4543911 - 1 7 6 1 465 174 291 Maharajpura 454392
- - - - - - 758 294 464 Hetampura 454393- - - 2 2 - 977 378 599 Sirsa 454394- - - 1 1 - 308 145 163 Raniyapura 454395- - - - - - 481 169 312 Deopura 454396- - - - - - 216 81 135 Kheribhat 454397- - - - - - 284 94 190 Repoli 454398
Mubarikpura 454399- - - - - - 330 123 207 Rampurabuzurg 454400- - - - - - 427 143 284 Jorital 454401- - - 1 1 - 259 98 161 Gandhigram 454402
1 1 - 4 4 - 854 410 444 Basturi 4544033 - 3 5 1 4 784 312 472 Dabhni 454404
Shikarpura 454405- - - 5 3 2 329 133 196 Dirolidang 454406- - - 5 5 - 439 183 256 Bisor 454407
2 - 2 - - - 1,139 445 694 Nahla 454408- - - 7 4 3 1,185 453 732 Berchha 454409- - - 9 7 2 687 293 394 Budhera 454410- - - - - - 96 40 56 Kunwarpura 454411- - - - - - 7 7 - Madikhera 454412
Location code
numberHousehold industry workers
Name of VillageOther workers Non-workers
of marginal workers
-------------Un-inhabited--------------
-------------Un-inhabited--------------
-------------Un-inhabited---------------------------Un-inhabited--------------
-------------Un-inhabited--------------
-------------Un-inhabited--------------
-------------Un-inhabited--------------
-------------Un-inhabited--------------
-------------Un-inhabited--------------
-------------Un-inhabited--------------
59
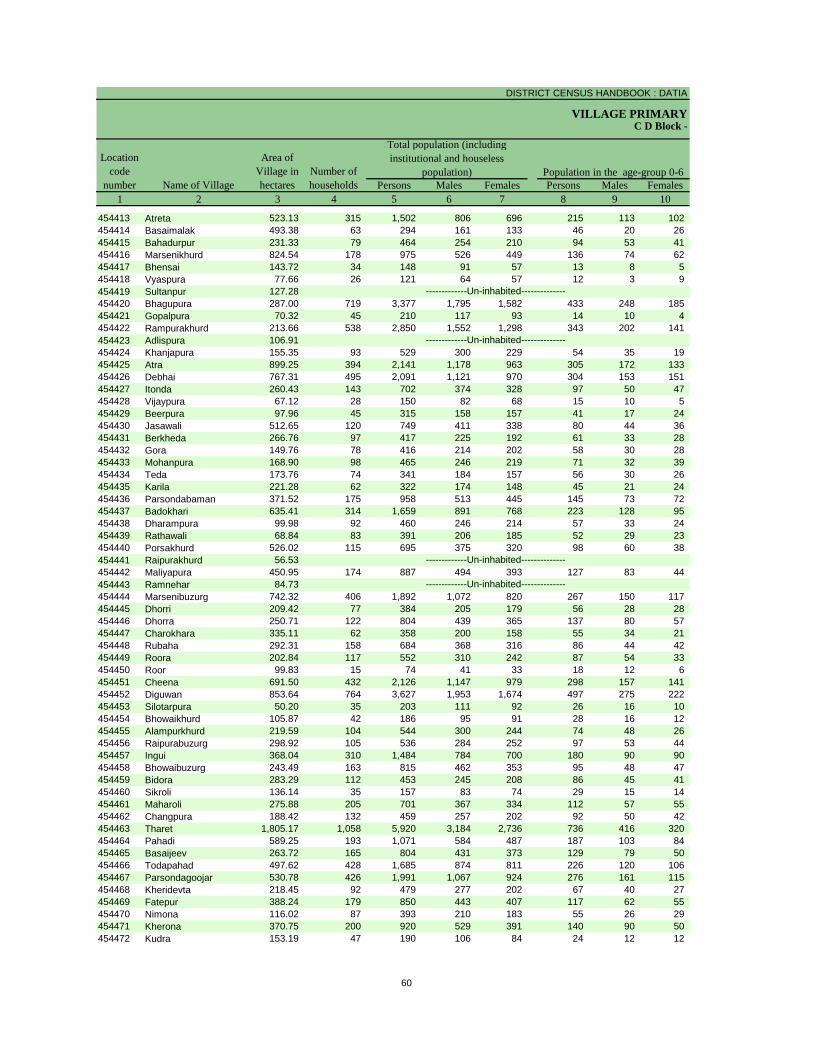
DISTRICT CENSUS HANDBOOK : DATIA
VILLAGE PRIMARY
Persons Males Females Persons Males Females1 2 3 4 5 6 7 8 9 10
Name of Village
Location code
number
Total population (including institutional and houseless
population)Area of
Village in hectares
Number of households
C D Block -
Population in the age-group 0-6
454413 Atreta 523.13 315 1,502 806 696 215 113 102 454414 Basaimalak 493.38 63 294 161 133 46 20 26 454415 Bahadurpur 231.33 79 464 254 210 94 53 41 454416 Marsenikhurd 824.54 178 975 526 449 136 74 62 454417 Bhensai 143.72 34 148 91 57 13 8 5 454418 Vyaspura 77.66 26 121 64 57 12 3 9 454419 Sultanpur 127.28454420 Bhagupura 287.00 719 3,377 1,795 1,582 433 248 185 454421 Gopalpura 70.32 45 210 117 93 14 10 4 454422 Rampurakhurd 213.66 538 2,850 1,552 1,298 343 202 141 454423 Adlispura 106.91454424 Khanjapura 155.35 93 529 300 229 54 35 19 454425 Atra 899.25 394 2,141 1,178 963 305 172 133 454426 Debhai 767.31 495 2,091 1,121 970 304 153 151 454427 Itonda 260.43 143 702 374 328 97 50 47 454428 Vijaypura 67.12 28 150 82 68 15 10 5 454429 Beerpura 97.96 45 315 158 157 41 17 24 454430 Jasawali 512.65 120 749 411 338 80 44 36 454431 Berkheda 266.76 97 417 225 192 61 33 28 454432 Gora 149.76 78 416 214 202 58 30 28 454433 Mohanpura 168.90 98 465 246 219 71 32 39 454434 Teda 173.76 74 341 184 157 56 30 26 454435 Karila 221.28 62 322 174 148 45 21 24 454436 Parsondabaman 371.52 175 958 513 445 145 73 72 454437 Badokhari 635.41 314 1,659 891 768 223 128 95 454438 Dharampura 99.98 92 460 246 214 57 33 24 454439 Rathawali 68.84 83 391 206 185 52 29 23 454440 Porsakhurd 526.02 115 695 375 320 98 60 38 454441 Raipurakhurd 56.53454442 Maliyapura 450.95 174 887 494 393 127 83 44 454443 Ramnehar 84.73454444 Marsenibuzurg 742.32 406 1,892 1,072 820 267 150 117 454445 Dhorri 209.42 77 384 205 179 56 28 28 454446 Dhorra 250.71 122 804 439 365 137 80 57 454447 Charokhara 335.11 62 358 200 158 55 34 21 454448 Rubaha 292.31 158 684 368 316 86 44 42 454449 Roora 202.84 117 552 310 242 87 54 33 454450 Roor 99.83 15 74 41 33 18 12 6 454451 Cheena 691.50 432 2,126 1,147 979 298 157 141 454452 Diguwan 853.64 764 3,627 1,953 1,674 497 275 222 454453 Silotarpura 50.20 35 203 111 92 26 16 10 454454 Bhowaikhurd 105.87 42 186 95 91 28 16 12 454455 Alampurkhurd 219.59 104 544 300 244 74 48 26 454456 Raipurabuzurg 298.92 105 536 284 252 97 53 44 454457 Ingui 368.04 310 1,484 784 700 180 90 90 454458 Bhowaibuzurg 243.49 163 815 462 353 95 48 47 454459 Bidora 283.29 112 453 245 208 86 45 41 454460 Sikroli 136.14 35 157 83 74 29 15 14 454461 Maharoli 275.88 205 701 367 334 112 57 55 454462 Changpura 188.42 132 459 257 202 92 50 42 454463 Tharet 1,805.17 1,058 5,920 3,184 2,736 736 416 320 454464 Pahadi 589.25 193 1,071 584 487 187 103 84 454465 Basaijeev 263.72 165 804 431 373 129 79 50 454466 Todapahad 497.62 428 1,685 874 811 226 120 106 454467 Parsondagoojar 530.78 426 1,991 1,067 924 276 161 115 454468 Kheridevta 218.45 92 479 277 202 67 40 27 454469 Fatepur 388.24 179 850 443 407 117 62 55 454470 Nimona 116.02 87 393 210 183 55 26 29 454471 Kherona 370.75 200 920 529 391 140 90 50 454472 Kudra 153.19 47 190 106 84 24 12 12
-------------Un-inhabited--------------
-------------Un-inhabited--------------
-------------Un-inhabited--------------
-------------Un-inhabited--------------
60
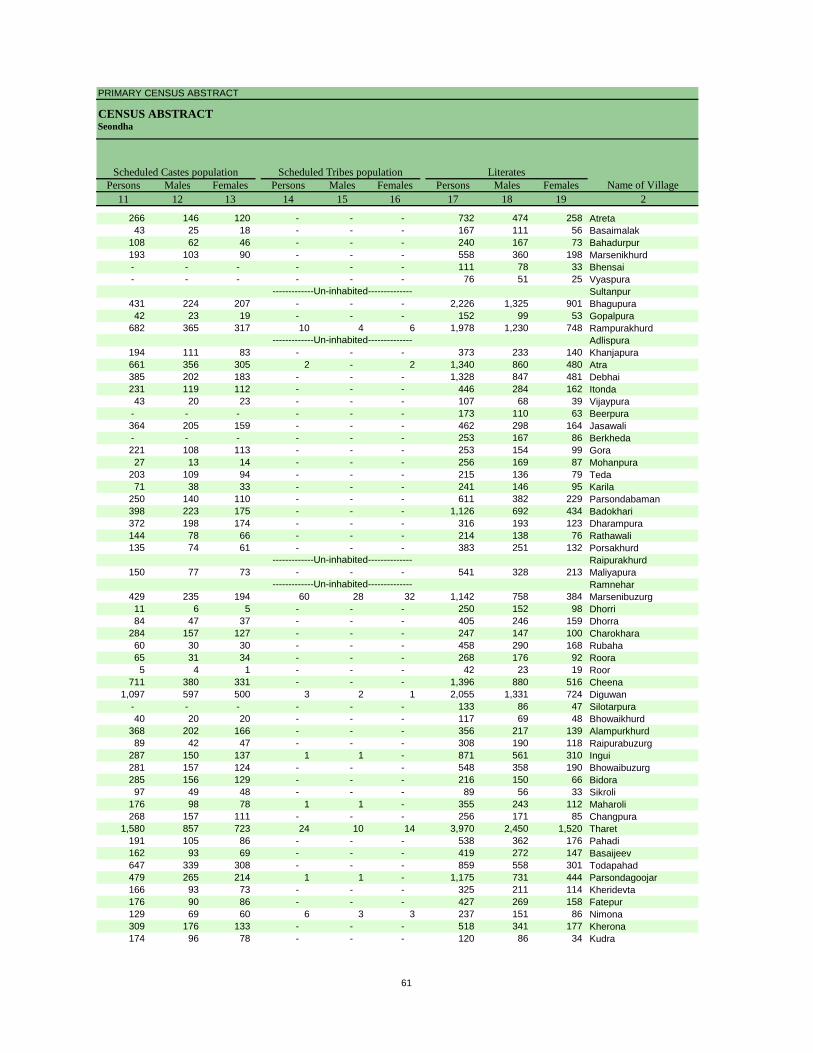
PRIMARY CENSUS ABSTRACT
CENSUS ABSTRACTSeondha
Persons Males Females Persons Males Females Persons Males Females11 12 13 14 15 16 17 18 19 2
Name of VillageLiteratesScheduled Castes population Scheduled Tribes population
266 146 120 - - - 732 474 258 Atreta43 25 18 - - - 167 111 56 Basaimalak
108 62 46 - - - 240 167 73 Bahadurpur193 103 90 - - - 558 360 198 Marsenikhurd- - - - - - 111 78 33 Bhensai- - - - - - 76 51 25 Vyaspura
Sultanpur431 224 207 - - - 2,226 1,325 901 Bhagupura42 23 19 - - - 152 99 53 Gopalpura
682 365 317 10 4 6 1,978 1,230 748 RampurakhurdAdlispura
194 111 83 - - - 373 233 140 Khanjapura661 356 305 2 - 2 1,340 860 480 Atra385 202 183 - - - 1,328 847 481 Debhai231 119 112 - - - 446 284 162 Itonda43 20 23 - - - 107 68 39 Vijaypura
- - - - - - 173 110 63 Beerpura364 205 159 - - - 462 298 164 Jasawali- - - - - - 253 167 86 Berkheda221 108 113 - - - 253 154 99 Gora27 13 14 - - - 256 169 87 Mohanpura
203 109 94 - - - 215 136 79 Teda71 38 33 - - - 241 146 95 Karila
250 140 110 - - - 611 382 229 Parsondabaman398 223 175 - - - 1,126 692 434 Badokhari372 198 174 - - - 316 193 123 Dharampura144 78 66 - - - 214 138 76 Rathawali135 74 61 - - - 383 251 132 Porsakhurd
Raipurakhurd150 77 73 - - - 541 328 213 Maliyapura
Ramnehar429 235 194 60 28 32 1,142 758 384 Marsenibuzurg11 6 5 - - - 250 152 98 Dhorri84 47 37 - - - 405 246 159 Dhorra
284 157 127 - - - 247 147 100 Charokhara60 30 30 - - - 458 290 168 Rubaha65 31 34 - - - 268 176 92 Roora5 4 1 - - - 42 23 19 Roor
711 380 331 - - - 1,396 880 516 Cheena1,097 597 500 3 2 1 2,055 1,331 724 Diguwan
- - - - - - 133 86 47 Silotarpura40 20 20 - - - 117 69 48 Bhowaikhurd
368 202 166 - - - 356 217 139 Alampurkhurd89 42 47 - - - 308 190 118 Raipurabuzurg
287 150 137 1 1 - 871 561 310 Ingui281 157 124 - - - 548 358 190 Bhowaibuzurg285 156 129 - - - 216 150 66 Bidora97 49 48 - - - 89 56 33 Sikroli
176 98 78 1 1 - 355 243 112 Maharoli268 157 111 - - - 256 171 85 Changpura
1,580 857 723 24 10 14 3,970 2,450 1,520 Tharet191 105 86 - - - 538 362 176 Pahadi162 93 69 - - - 419 272 147 Basaijeev647 339 308 - - - 859 558 301 Todapahad479 265 214 1 1 - 1,175 731 444 Parsondagoojar166 93 73 - - - 325 211 114 Kheridevta176 90 86 - - - 427 269 158 Fatepur129 69 60 6 3 3 237 151 86 Nimona309 176 133 - - - 518 341 177 Kherona174 96 78 - - - 120 86 34 Kudra
-------------Un-inhabited--------------
-------------Un-inhabited--------------
-------------Un-inhabited--------------
-------------Un-inhabited--------------
61
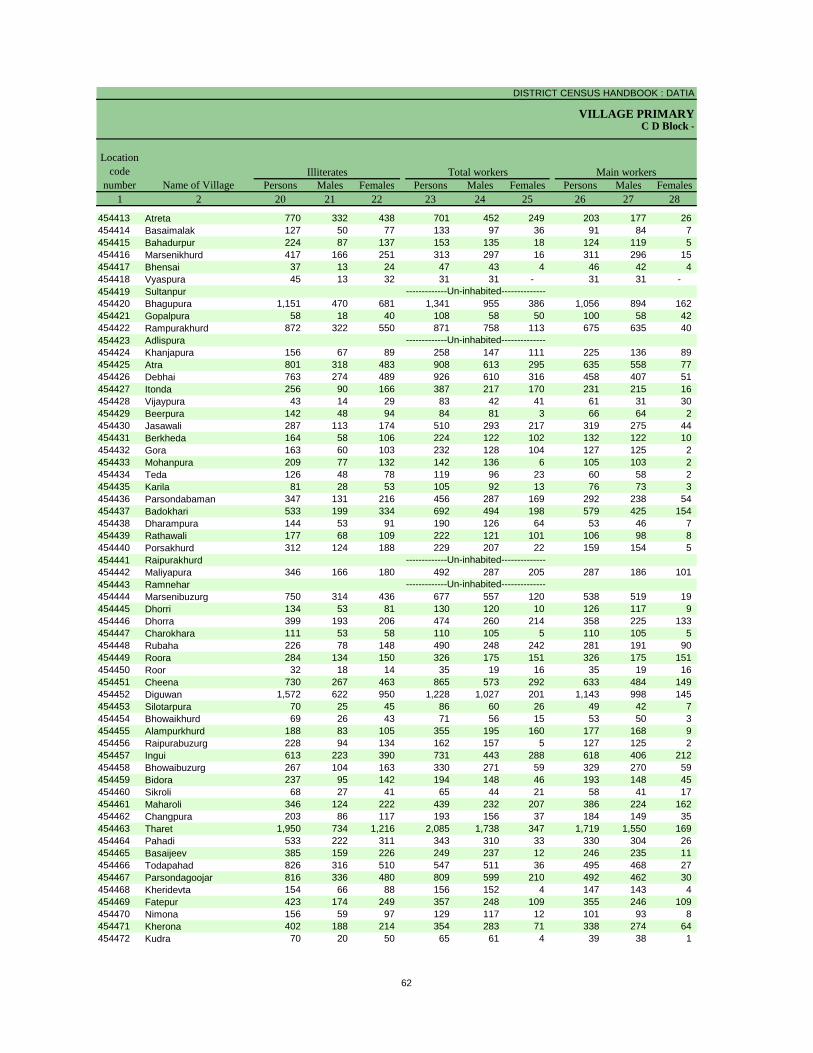
DISTRICT CENSUS HANDBOOK : DATIA
VILLAGE PRIMARYC D Block -
Persons Males Females Persons Males Females Persons Males Females1 2 20 21 22 23 24 25 26 27 28
Name of Village
Location code
numberIlliterates Total workers Main workers
454413 Atreta 770 332 438 701 452 249 203 177 26 454414 Basaimalak 127 50 77 133 97 36 91 84 7 454415 Bahadurpur 224 87 137 153 135 18 124 119 5 454416 Marsenikhurd 417 166 251 313 297 16 311 296 15 454417 Bhensai 37 13 24 47 43 4 46 42 4 454418 Vyaspura 45 13 32 31 31 - 31 31 - 454419 Sultanpur454420 Bhagupura 1,151 470 681 1,341 955 386 1,056 894 162 454421 Gopalpura 58 18 40 108 58 50 100 58 42 454422 Rampurakhurd 872 322 550 871 758 113 675 635 40 454423 Adlispura454424 Khanjapura 156 67 89 258 147 111 225 136 89 454425 Atra 801 318 483 908 613 295 635 558 77 454426 Debhai 763 274 489 926 610 316 458 407 51 454427 Itonda 256 90 166 387 217 170 231 215 16 454428 Vijaypura 43 14 29 83 42 41 61 31 30 454429 Beerpura 142 48 94 84 81 3 66 64 2 454430 Jasawali 287 113 174 510 293 217 319 275 44 454431 Berkheda 164 58 106 224 122 102 132 122 10 454432 Gora 163 60 103 232 128 104 127 125 2 454433 Mohanpura 209 77 132 142 136 6 105 103 2 454434 Teda 126 48 78 119 96 23 60 58 2 454435 Karila 81 28 53 105 92 13 76 73 3 454436 Parsondabaman 347 131 216 456 287 169 292 238 54 454437 Badokhari 533 199 334 692 494 198 579 425 154 454438 Dharampura 144 53 91 190 126 64 53 46 7 454439 Rathawali 177 68 109 222 121 101 106 98 8 454440 Porsakhurd 312 124 188 229 207 22 159 154 5 454441 Raipurakhurd454442 Maliyapura 346 166 180 492 287 205 287 186 101 454443 Ramnehar454444 Marsenibuzurg 750 314 436 677 557 120 538 519 19 454445 Dhorri 134 53 81 130 120 10 126 117 9 454446 Dhorra 399 193 206 474 260 214 358 225 133 454447 Charokhara 111 53 58 110 105 5 110 105 5 454448 Rubaha 226 78 148 490 248 242 281 191 90 454449 Roora 284 134 150 326 175 151 326 175 151 454450 Roor 32 18 14 35 19 16 35 19 16 454451 Cheena 730 267 463 865 573 292 633 484 149 454452 Diguwan 1,572 622 950 1,228 1,027 201 1,143 998 145 454453 Silotarpura 70 25 45 86 60 26 49 42 7 454454 Bhowaikhurd 69 26 43 71 56 15 53 50 3 454455 Alampurkhurd 188 83 105 355 195 160 177 168 9 454456 Raipurabuzurg 228 94 134 162 157 5 127 125 2 454457 Ingui 613 223 390 731 443 288 618 406 212 454458 Bhowaibuzurg 267 104 163 330 271 59 329 270 59 454459 Bidora 237 95 142 194 148 46 193 148 45 454460 Sikroli 68 27 41 65 44 21 58 41 17 454461 Maharoli 346 124 222 439 232 207 386 224 162 454462 Changpura 203 86 117 193 156 37 184 149 35 454463 Tharet 1,950 734 1,216 2,085 1,738 347 1,719 1,550 169 454464 Pahadi 533 222 311 343 310 33 330 304 26 454465 Basaijeev 385 159 226 249 237 12 246 235 11 454466 Todapahad 826 316 510 547 511 36 495 468 27 454467 Parsondagoojar 816 336 480 809 599 210 492 462 30 454468 Kheridevta 154 66 88 156 152 4 147 143 4 454469 Fatepur 423 174 249 357 248 109 355 246 109 454470 Nimona 156 59 97 129 117 12 101 93 8 454471 Kherona 402 188 214 354 283 71 338 274 64 454472 Kudra 70 20 50 65 61 4 39 38 1
-------------Un-inhabited--------------
-------------Un-inhabited--------------
-------------Un-inhabited--------------
-------------Un-inhabited--------------
62
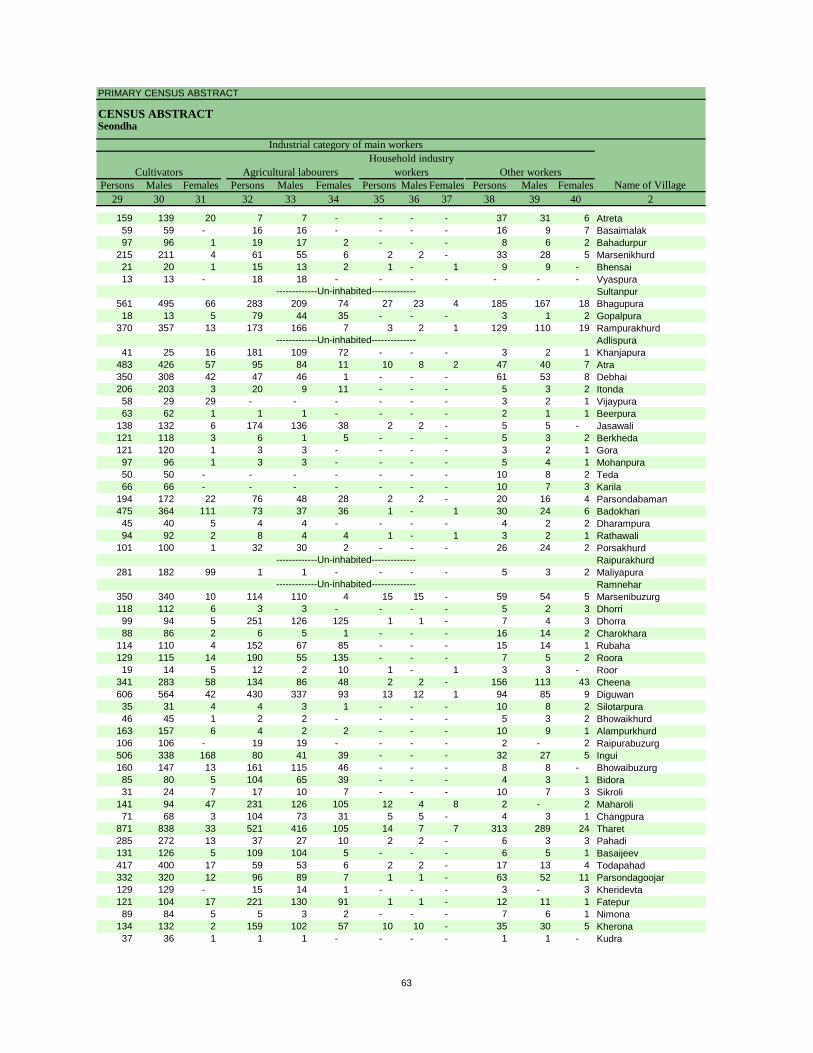
PRIMARY CENSUS ABSTRACT
CENSUS ABSTRACTSeondha
Persons Males Females Persons Males Females Persons Males Females Persons Males Females29 30 31 32 33 34 35 36 37 38 39 40 2
CultivatorsName of Village
Household industry workersAgricultural labourers
Industrial category of main workers
Other workers
159 139 20 7 7 - - - - 37 31 6 Atreta59 59 - 16 16 - - - - 16 9 7 Basaimalak97 96 1 19 17 2 - - - 8 6 2 Bahadurpur
215 211 4 61 55 6 2 2 - 33 28 5 Marsenikhurd21 20 1 15 13 2 1 - 1 9 9 - Bhensai13 13 - 18 18 - - - - - - - Vyaspura
Sultanpur561 495 66 283 209 74 27 23 4 185 167 18 Bhagupura18 13 5 79 44 35 - - - 3 1 2 Gopalpura
370 357 13 173 166 7 3 2 1 129 110 19 RampurakhurdAdlispura
41 25 16 181 109 72 - - - 3 2 1 Khanjapura483 426 57 95 84 11 10 8 2 47 40 7 Atra350 308 42 47 46 1 - - - 61 53 8 Debhai206 203 3 20 9 11 - - - 5 3 2 Itonda58 29 29 - - - - - - 3 2 1 Vijaypura63 62 1 1 1 - - - - 2 1 1 Beerpura
138 132 6 174 136 38 2 2 - 5 5 - Jasawali121 118 3 6 1 5 - - - 5 3 2 Berkheda121 120 1 3 3 - - - - 3 2 1 Gora97 96 1 3 3 - - - - 5 4 1 Mohanpura50 50 - - - - - - - 10 8 2 Teda66 66 - - - - - - - 10 7 3 Karila
194 172 22 76 48 28 2 2 - 20 16 4 Parsondabaman475 364 111 73 37 36 1 - 1 30 24 6 Badokhari45 40 5 4 4 - - - - 4 2 2 Dharampura94 92 2 8 4 4 1 - 1 3 2 1 Rathawali
101 100 1 32 30 2 - - - 26 24 2 PorsakhurdRaipurakhurd
281 182 99 1 1 - - - - 5 3 2 MaliyapuraRamnehar
350 340 10 114 110 4 15 15 - 59 54 5 Marsenibuzurg118 112 6 3 3 - - - - 5 2 3 Dhorri99 94 5 251 126 125 1 1 - 7 4 3 Dhorra88 86 2 6 5 1 - - - 16 14 2 Charokhara
114 110 4 152 67 85 - - - 15 14 1 Rubaha129 115 14 190 55 135 - - - 7 5 2 Roora19 14 5 12 2 10 1 - 1 3 3 - Roor
341 283 58 134 86 48 2 2 - 156 113 43 Cheena606 564 42 430 337 93 13 12 1 94 85 9 Diguwan35 31 4 4 3 1 - - - 10 8 2 Silotarpura46 45 1 2 2 - - - - 5 3 2 Bhowaikhurd
163 157 6 4 2 2 - - - 10 9 1 Alampurkhurd106 106 - 19 19 - - - - 2 - 2 Raipurabuzurg506 338 168 80 41 39 - - - 32 27 5 Ingui160 147 13 161 115 46 - - - 8 8 - Bhowaibuzurg85 80 5 104 65 39 - - - 4 3 1 Bidora31 24 7 17 10 7 - - - 10 7 3 Sikroli
141 94 47 231 126 105 12 4 8 2 - 2 Maharoli71 68 3 104 73 31 5 5 - 4 3 1 Changpura
871 838 33 521 416 105 14 7 7 313 289 24 Tharet285 272 13 37 27 10 2 2 - 6 3 3 Pahadi131 126 5 109 104 5 - - - 6 5 1 Basaijeev417 400 17 59 53 6 2 2 - 17 13 4 Todapahad332 320 12 96 89 7 1 1 - 63 52 11 Parsondagoojar129 129 - 15 14 1 - - - 3 - 3 Kheridevta121 104 17 221 130 91 1 1 - 12 11 1 Fatepur89 84 5 5 3 2 - - - 7 6 1 Nimona
134 132 2 159 102 57 10 10 - 35 30 5 Kherona37 36 1 1 1 - - - - 1 1 - Kudra
-------------Un-inhabited--------------
-------------Un-inhabited--------------
-------------Un-inhabited--------------
-------------Un-inhabited--------------
63
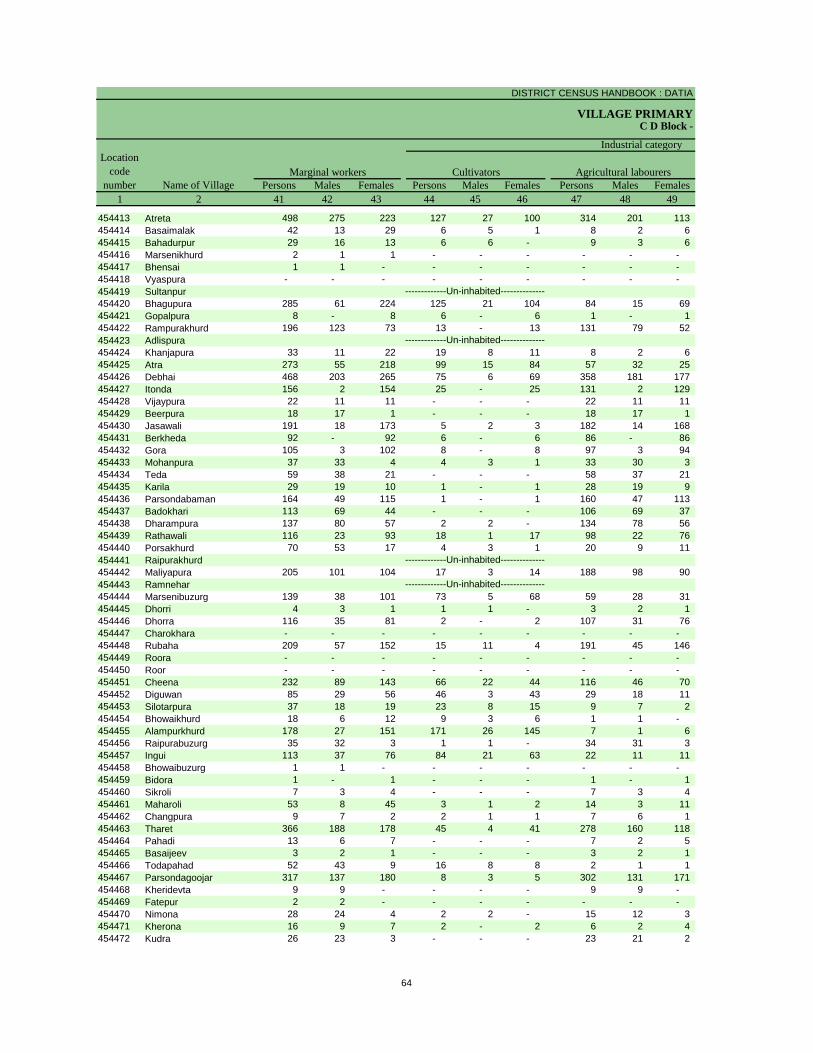
DISTRICT CENSUS HANDBOOK : DATIA
VILLAGE PRIMARYC D Block -
Persons Males Females Persons Males Females Persons Males Females1 2 41 42 43 44 45 46 47 48 49
Name of VillageMarginal workers Cultivators Agricultural labourers
Industrial category Location
code number
454413 Atreta 498 275 223 127 27 100 314 201 113 454414 Basaimalak 42 13 29 6 5 1 8 2 6 454415 Bahadurpur 29 16 13 6 6 - 9 3 6 454416 Marsenikhurd 2 1 1 - - - - - - 454417 Bhensai 1 1 - - - - - - - 454418 Vyaspura - - - - - - - - - 454419 Sultanpur454420 Bhagupura 285 61 224 125 21 104 84 15 69 454421 Gopalpura 8 - 8 6 - 6 1 - 1 454422 Rampurakhurd 196 123 73 13 - 13 131 79 52 454423 Adlispura454424 Khanjapura 33 11 22 19 8 11 8 2 6 454425 Atra 273 55 218 99 15 84 57 32 25 454426 Debhai 468 203 265 75 6 69 358 181 177 454427 Itonda 156 2 154 25 - 25 131 2 129 454428 Vijaypura 22 11 11 - - - 22 11 11 454429 Beerpura 18 17 1 - - - 18 17 1 454430 Jasawali 191 18 173 5 2 3 182 14 168 454431 Berkheda 92 - 92 6 - 6 86 - 86 454432 Gora 105 3 102 8 - 8 97 3 94 454433 Mohanpura 37 33 4 4 3 1 33 30 3 454434 Teda 59 38 21 - - - 58 37 21 454435 Karila 29 19 10 1 - 1 28 19 9 454436 Parsondabaman 164 49 115 1 - 1 160 47 113 454437 Badokhari 113 69 44 - - - 106 69 37 454438 Dharampura 137 80 57 2 2 - 134 78 56 454439 Rathawali 116 23 93 18 1 17 98 22 76 454440 Porsakhurd 70 53 17 4 3 1 20 9 11 454441 Raipurakhurd454442 Maliyapura 205 101 104 17 3 14 188 98 90 454443 Ramnehar454444 Marsenibuzurg 139 38 101 73 5 68 59 28 31 454445 Dhorri 4 3 1 1 1 - 3 2 1 454446 Dhorra 116 35 81 2 - 2 107 31 76 454447 Charokhara - - - - - - - - - 454448 Rubaha 209 57 152 15 11 4 191 45 146 454449 Roora - - - - - - - - - 454450 Roor - - - - - - - - - 454451 Cheena 232 89 143 66 22 44 116 46 70 454452 Diguwan 85 29 56 46 3 43 29 18 11 454453 Silotarpura 37 18 19 23 8 15 9 7 2 454454 Bhowaikhurd 18 6 12 9 3 6 1 1 - 454455 Alampurkhurd 178 27 151 171 26 145 7 1 6 454456 Raipurabuzurg 35 32 3 1 1 - 34 31 3 454457 Ingui 113 37 76 84 21 63 22 11 11 454458 Bhowaibuzurg 1 1 - - - - - - - 454459 Bidora 1 - 1 - - - 1 - 1 454460 Sikroli 7 3 4 - - - 7 3 4 454461 Maharoli 53 8 45 3 1 2 14 3 11 454462 Changpura 9 7 2 2 1 1 7 6 1 454463 Tharet 366 188 178 45 4 41 278 160 118 454464 Pahadi 13 6 7 - - - 7 2 5 454465 Basaijeev 3 2 1 - - - 3 2 1 454466 Todapahad 52 43 9 16 8 8 2 1 1 454467 Parsondagoojar 317 137 180 8 3 5 302 131 171 454468 Kheridevta 9 9 - - - - 9 9 - 454469 Fatepur 2 2 - - - - - - - 454470 Nimona 28 24 4 2 2 - 15 12 3 454471 Kherona 16 9 7 2 - 2 6 2 4 454472 Kudra 26 23 3 - - - 23 21 2
-------------Un-inhabited--------------
-------------Un-inhabited--------------
-------------Un-inhabited--------------
-------------Un-inhabited--------------
64
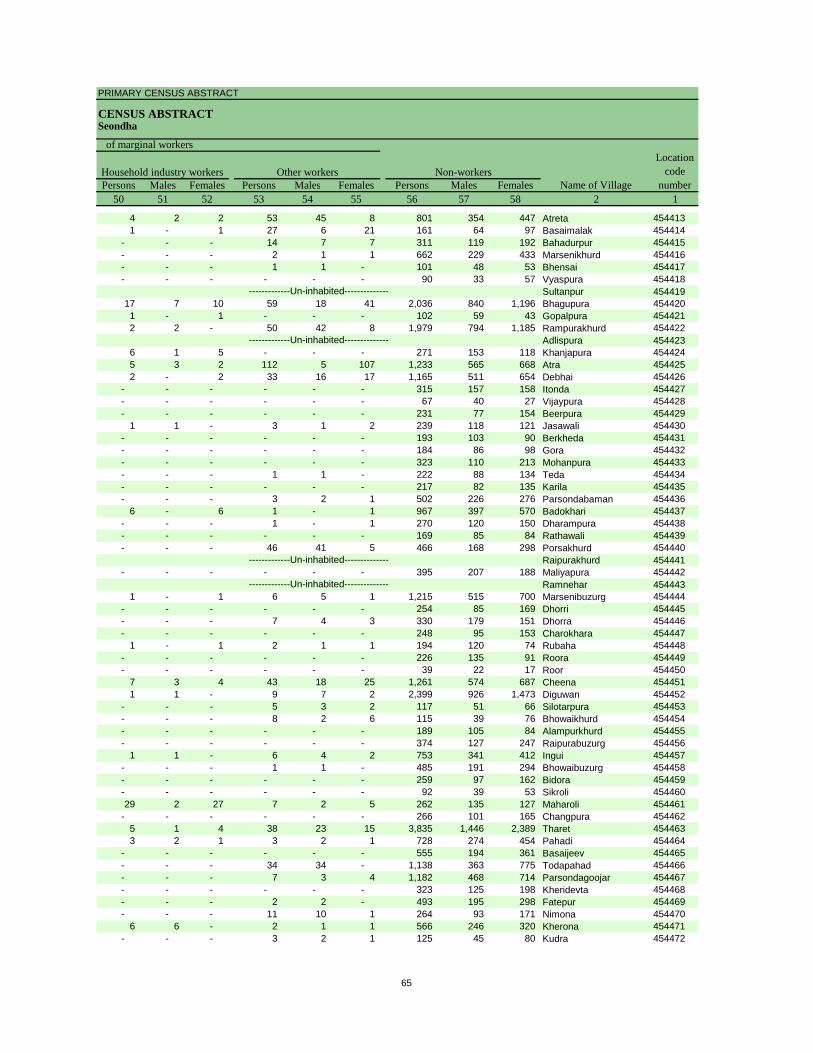
PRIMARY CENSUS ABSTRACT
CENSUS ABSTRACTSeondha
Persons Males Females Persons Males Females Persons Males Females50 51 52 53 54 55 56 57 58 2 1
Location code
numberHousehold industry workers
Name of VillageOther workers Non-workers
of marginal workers
4 2 2 53 45 8 801 354 447 Atreta 4544131 - 1 27 6 21 161 64 97 Basaimalak 454414
- - - 14 7 7 311 119 192 Bahadurpur 454415- - - 2 1 1 662 229 433 Marsenikhurd 454416- - - 1 1 - 101 48 53 Bhensai 454417- - - - - - 90 33 57 Vyaspura 454418
Sultanpur 45441917 7 10 59 18 41 2,036 840 1,196 Bhagupura 4544201 - 1 - - - 102 59 43 Gopalpura 4544212 2 - 50 42 8 1,979 794 1,185 Rampurakhurd 454422
Adlispura 4544236 1 5 - - - 271 153 118 Khanjapura 4544245 3 2 112 5 107 1,233 565 668 Atra 4544252 - 2 33 16 17 1,165 511 654 Debhai 454426
- - - - - - 315 157 158 Itonda 454427- - - - - - 67 40 27 Vijaypura 454428- - - - - - 231 77 154 Beerpura 454429
1 1 - 3 1 2 239 118 121 Jasawali 454430- - - - - - 193 103 90 Berkheda 454431- - - - - - 184 86 98 Gora 454432- - - - - - 323 110 213 Mohanpura 454433- - - 1 1 - 222 88 134 Teda 454434- - - - - - 217 82 135 Karila 454435- - - 3 2 1 502 226 276 Parsondabaman 454436
6 - 6 1 - 1 967 397 570 Badokhari 454437- - - 1 - 1 270 120 150 Dharampura 454438- - - - - - 169 85 84 Rathawali 454439- - - 46 41 5 466 168 298 Porsakhurd 454440
Raipurakhurd 454441- - - - - - 395 207 188 Maliyapura 454442
Ramnehar 4544431 - 1 6 5 1 1,215 515 700 Marsenibuzurg 454444
- - - - - - 254 85 169 Dhorri 454445- - - 7 4 3 330 179 151 Dhorra 454446- - - - - - 248 95 153 Charokhara 454447
1 - 1 2 1 1 194 120 74 Rubaha 454448- - - - - - 226 135 91 Roora 454449- - - - - - 39 22 17 Roor 454450
7 3 4 43 18 25 1,261 574 687 Cheena 4544511 1 - 9 7 2 2,399 926 1,473 Diguwan 454452
- - - 5 3 2 117 51 66 Silotarpura 454453- - - 8 2 6 115 39 76 Bhowaikhurd 454454- - - - - - 189 105 84 Alampurkhurd 454455- - - - - - 374 127 247 Raipurabuzurg 454456
1 1 - 6 4 2 753 341 412 Ingui 454457- - - 1 1 - 485 191 294 Bhowaibuzurg 454458- - - - - - 259 97 162 Bidora 454459- - - - - - 92 39 53 Sikroli 45446029 2 27 7 2 5 262 135 127 Maharoli 454461
- - - - - - 266 101 165 Changpura 4544625 1 4 38 23 15 3,835 1,446 2,389 Tharet 4544633 2 1 3 2 1 728 274 454 Pahadi 454464
- - - - - - 555 194 361 Basaijeev 454465- - - 34 34 - 1,138 363 775 Todapahad 454466- - - 7 3 4 1,182 468 714 Parsondagoojar 454467- - - - - - 323 125 198 Kheridevta 454468- - - 2 2 - 493 195 298 Fatepur 454469- - - 11 10 1 264 93 171 Nimona 454470
6 6 - 2 1 1 566 246 320 Kherona 454471- - - 3 2 1 125 45 80 Kudra 454472
-------------Un-inhabited--------------
-------------Un-inhabited--------------
-------------Un-inhabited--------------
-------------Un-inhabited--------------
65
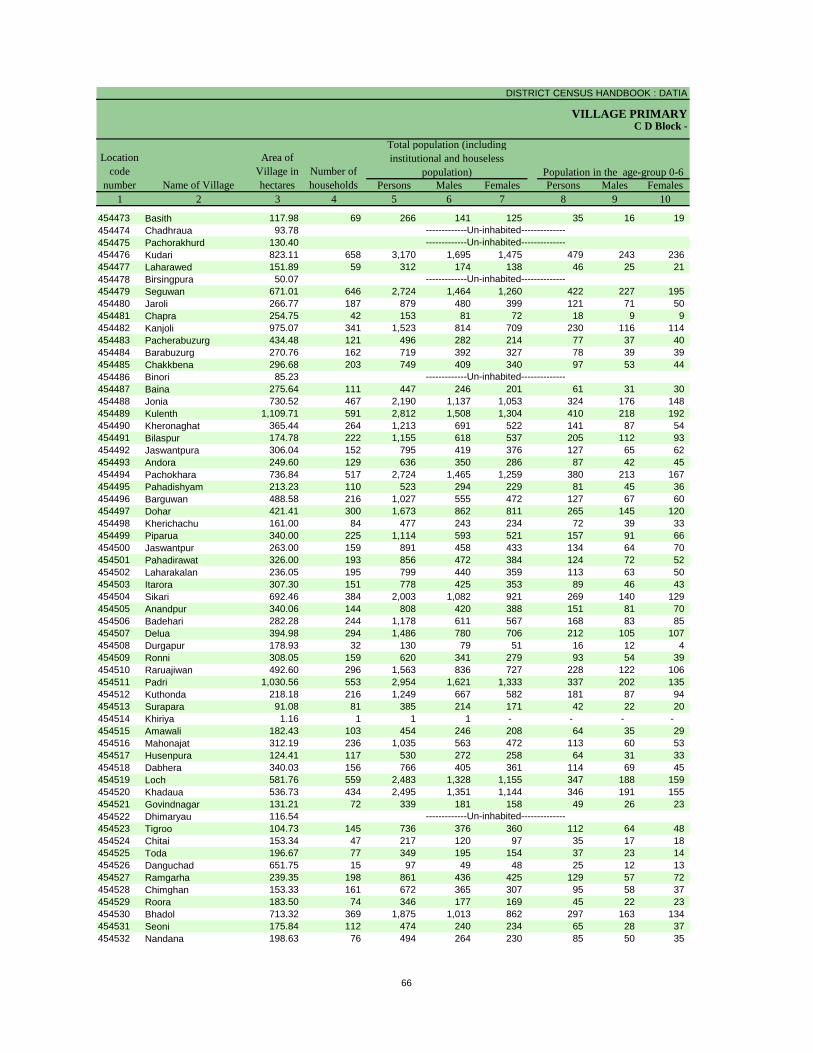
DISTRICT CENSUS HANDBOOK : DATIA
VILLAGE PRIMARY
Persons Males Females Persons Males Females1 2 3 4 5 6 7 8 9 10
Name of Village
Location code
number
Total population (including institutional and houseless
population)Area of
Village in hectares
Number of households
C D Block -
Population in the age-group 0-6
454473 Basith 117.98 69 266 141 125 35 16 19 454474 Chadhraua 93.78454475 Pachorakhurd 130.40454476 Kudari 823.11 658 3,170 1,695 1,475 479 243 236 454477 Laharawed 151.89 59 312 174 138 46 25 21 454478 Birsingpura 50.07454479 Seguwan 671.01 646 2,724 1,464 1,260 422 227 195 454480 Jaroli 266.77 187 879 480 399 121 71 50 454481 Chapra 254.75 42 153 81 72 18 9 9 454482 Kanjoli 975.07 341 1,523 814 709 230 116 114 454483 Pacherabuzurg 434.48 121 496 282 214 77 37 40 454484 Barabuzurg 270.76 162 719 392 327 78 39 39 454485 Chakkbena 296.68 203 749 409 340 97 53 44 454486 Binori 85.23454487 Baina 275.64 111 447 246 201 61 31 30 454488 Jonia 730.52 467 2,190 1,137 1,053 324 176 148 454489 Kulenth 1,109.71 591 2,812 1,508 1,304 410 218 192 454490 Kheronaghat 365.44 264 1,213 691 522 141 87 54 454491 Bilaspur 174.78 222 1,155 618 537 205 112 93 454492 Jaswantpura 306.04 152 795 419 376 127 65 62 454493 Andora 249.60 129 636 350 286 87 42 45 454494 Pachokhara 736.84 517 2,724 1,465 1,259 380 213 167 454495 Pahadishyam 213.23 110 523 294 229 81 45 36 454496 Barguwan 488.58 216 1,027 555 472 127 67 60 454497 Dohar 421.41 300 1,673 862 811 265 145 120 454498 Kherichachu 161.00 84 477 243 234 72 39 33 454499 Piparua 340.00 225 1,114 593 521 157 91 66 454500 Jaswantpur 263.00 159 891 458 433 134 64 70 454501 Pahadirawat 326.00 193 856 472 384 124 72 52 454502 Laharakalan 236.05 195 799 440 359 113 63 50 454503 Itarora 307.30 151 778 425 353 89 46 43 454504 Sikari 692.46 384 2,003 1,082 921 269 140 129 454505 Anandpur 340.06 144 808 420 388 151 81 70 454506 Badehari 282.28 244 1,178 611 567 168 83 85 454507 Delua 394.98 294 1,486 780 706 212 105 107 454508 Durgapur 178.93 32 130 79 51 16 12 4 454509 Ronni 308.05 159 620 341 279 93 54 39 454510 Raruajiwan 492.60 296 1,563 836 727 228 122 106 454511 Padri 1,030.56 553 2,954 1,621 1,333 337 202 135 454512 Kuthonda 218.18 216 1,249 667 582 181 87 94 454513 Surapara 91.08 81 385 214 171 42 22 20 454514 Khiriya 1.16 1 1 1 - - - - 454515 Amawali 182.43 103 454 246 208 64 35 29 454516 Mahonajat 312.19 236 1,035 563 472 113 60 53 454517 Husenpura 124.41 117 530 272 258 64 31 33 454518 Dabhera 340.03 156 766 405 361 114 69 45 454519 Loch 581.76 559 2,483 1,328 1,155 347 188 159 454520 Khadaua 536.73 434 2,495 1,351 1,144 346 191 155 454521 Govindnagar 131.21 72 339 181 158 49 26 23 454522 Dhimaryau 116.54454523 Tigroo 104.73 145 736 376 360 112 64 48 454524 Chitai 153.34 47 217 120 97 35 17 18 454525 Toda 196.67 77 349 195 154 37 23 14 454526 Danguchad 651.75 15 97 49 48 25 12 13 454527 Ramgarha 239.35 198 861 436 425 129 57 72 454528 Chimghan 153.33 161 672 365 307 95 58 37 454529 Roora 183.50 74 346 177 169 45 22 23 454530 Bhadol 713.32 369 1,875 1,013 862 297 163 134 454531 Seoni 175.84 112 474 240 234 65 28 37 454532 Nandana 198.63 76 494 264 230 85 50 35
-------------Un-inhabited---------------------------Un-inhabited--------------
-------------Un-inhabited--------------
-------------Un-inhabited--------------
-------------Un-inhabited--------------
66
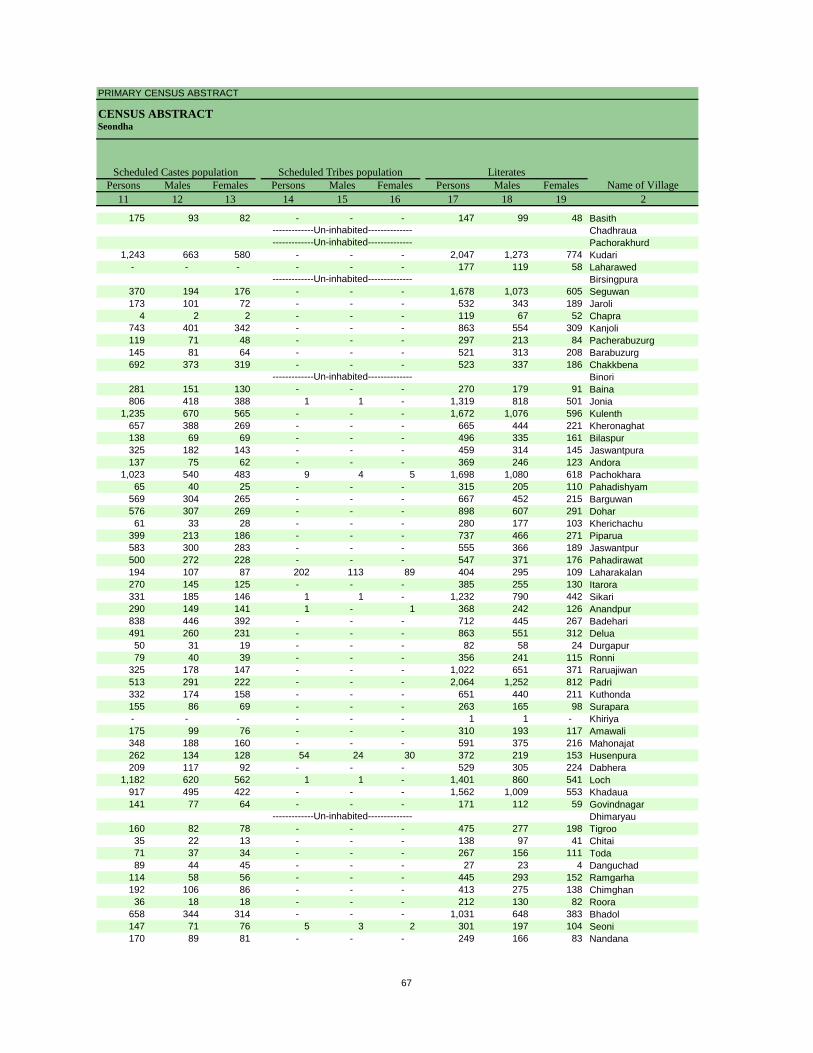
PRIMARY CENSUS ABSTRACT
CENSUS ABSTRACTSeondha
Persons Males Females Persons Males Females Persons Males Females11 12 13 14 15 16 17 18 19 2
Name of VillageLiteratesScheduled Castes population Scheduled Tribes population
175 93 82 - - - 147 99 48 BasithChadhrauaPachorakhurd
1,243 663 580 - - - 2,047 1,273 774 Kudari- - - - - - 177 119 58 Laharawed
Birsingpura370 194 176 - - - 1,678 1,073 605 Seguwan173 101 72 - - - 532 343 189 Jaroli
4 2 2 - - - 119 67 52 Chapra743 401 342 - - - 863 554 309 Kanjoli119 71 48 - - - 297 213 84 Pacherabuzurg145 81 64 - - - 521 313 208 Barabuzurg692 373 319 - - - 523 337 186 Chakkbena
Binori281 151 130 - - - 270 179 91 Baina806 418 388 1 1 - 1,319 818 501 Jonia
1,235 670 565 - - - 1,672 1,076 596 Kulenth657 388 269 - - - 665 444 221 Kheronaghat138 69 69 - - - 496 335 161 Bilaspur325 182 143 - - - 459 314 145 Jaswantpura137 75 62 - - - 369 246 123 Andora
1,023 540 483 9 4 5 1,698 1,080 618 Pachokhara65 40 25 - - - 315 205 110 Pahadishyam
569 304 265 - - - 667 452 215 Barguwan576 307 269 - - - 898 607 291 Dohar61 33 28 - - - 280 177 103 Kherichachu
399 213 186 - - - 737 466 271 Piparua583 300 283 - - - 555 366 189 Jaswantpur500 272 228 - - - 547 371 176 Pahadirawat194 107 87 202 113 89 404 295 109 Laharakalan270 145 125 - - - 385 255 130 Itarora331 185 146 1 1 - 1,232 790 442 Sikari290 149 141 1 - 1 368 242 126 Anandpur838 446 392 - - - 712 445 267 Badehari491 260 231 - - - 863 551 312 Delua50 31 19 - - - 82 58 24 Durgapur79 40 39 - - - 356 241 115 Ronni
325 178 147 - - - 1,022 651 371 Raruajiwan513 291 222 - - - 2,064 1,252 812 Padri332 174 158 - - - 651 440 211 Kuthonda155 86 69 - - - 263 165 98 Surapara- - - - - - 1 1 - Khiriya175 99 76 - - - 310 193 117 Amawali348 188 160 - - - 591 375 216 Mahonajat262 134 128 54 24 30 372 219 153 Husenpura209 117 92 - - - 529 305 224 Dabhera
1,182 620 562 1 1 - 1,401 860 541 Loch917 495 422 - - - 1,562 1,009 553 Khadaua141 77 64 - - - 171 112 59 Govindnagar
Dhimaryau160 82 78 - - - 475 277 198 Tigroo35 22 13 - - - 138 97 41 Chitai71 37 34 - - - 267 156 111 Toda89 44 45 - - - 27 23 4 Danguchad
114 58 56 - - - 445 293 152 Ramgarha192 106 86 - - - 413 275 138 Chimghan36 18 18 - - - 212 130 82 Roora
658 344 314 - - - 1,031 648 383 Bhadol147 71 76 5 3 2 301 197 104 Seoni170 89 81 - - - 249 166 83 Nandana
-------------Un-inhabited---------------------------Un-inhabited--------------
-------------Un-inhabited--------------
-------------Un-inhabited--------------
-------------Un-inhabited--------------
67
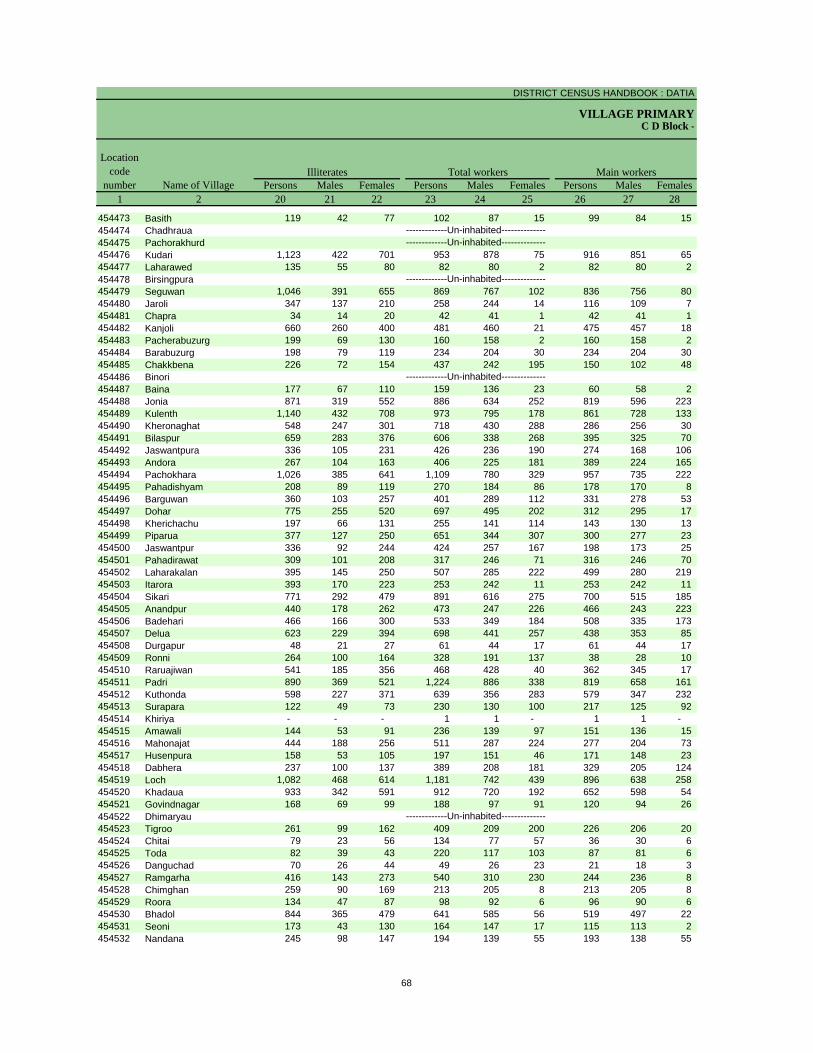
DISTRICT CENSUS HANDBOOK : DATIA
VILLAGE PRIMARYC D Block -
Persons Males Females Persons Males Females Persons Males Females1 2 20 21 22 23 24 25 26 27 28
Name of Village
Location code
numberIlliterates Total workers Main workers
454473 Basith 119 42 77 102 87 15 99 84 15 454474 Chadhraua454475 Pachorakhurd454476 Kudari 1,123 422 701 953 878 75 916 851 65 454477 Laharawed 135 55 80 82 80 2 82 80 2 454478 Birsingpura454479 Seguwan 1,046 391 655 869 767 102 836 756 80 454480 Jaroli 347 137 210 258 244 14 116 109 7 454481 Chapra 34 14 20 42 41 1 42 41 1 454482 Kanjoli 660 260 400 481 460 21 475 457 18 454483 Pacherabuzurg 199 69 130 160 158 2 160 158 2 454484 Barabuzurg 198 79 119 234 204 30 234 204 30 454485 Chakkbena 226 72 154 437 242 195 150 102 48 454486 Binori454487 Baina 177 67 110 159 136 23 60 58 2 454488 Jonia 871 319 552 886 634 252 819 596 223 454489 Kulenth 1,140 432 708 973 795 178 861 728 133 454490 Kheronaghat 548 247 301 718 430 288 286 256 30 454491 Bilaspur 659 283 376 606 338 268 395 325 70 454492 Jaswantpura 336 105 231 426 236 190 274 168 106 454493 Andora 267 104 163 406 225 181 389 224 165 454494 Pachokhara 1,026 385 641 1,109 780 329 957 735 222 454495 Pahadishyam 208 89 119 270 184 86 178 170 8 454496 Barguwan 360 103 257 401 289 112 331 278 53 454497 Dohar 775 255 520 697 495 202 312 295 17 454498 Kherichachu 197 66 131 255 141 114 143 130 13 454499 Piparua 377 127 250 651 344 307 300 277 23 454500 Jaswantpur 336 92 244 424 257 167 198 173 25 454501 Pahadirawat 309 101 208 317 246 71 316 246 70 454502 Laharakalan 395 145 250 507 285 222 499 280 219 454503 Itarora 393 170 223 253 242 11 253 242 11 454504 Sikari 771 292 479 891 616 275 700 515 185 454505 Anandpur 440 178 262 473 247 226 466 243 223 454506 Badehari 466 166 300 533 349 184 508 335 173 454507 Delua 623 229 394 698 441 257 438 353 85 454508 Durgapur 48 21 27 61 44 17 61 44 17 454509 Ronni 264 100 164 328 191 137 38 28 10 454510 Raruajiwan 541 185 356 468 428 40 362 345 17 454511 Padri 890 369 521 1,224 886 338 819 658 161 454512 Kuthonda 598 227 371 639 356 283 579 347 232 454513 Surapara 122 49 73 230 130 100 217 125 92 454514 Khiriya - - - 1 1 - 1 1 - 454515 Amawali 144 53 91 236 139 97 151 136 15 454516 Mahonajat 444 188 256 511 287 224 277 204 73 454517 Husenpura 158 53 105 197 151 46 171 148 23 454518 Dabhera 237 100 137 389 208 181 329 205 124 454519 Loch 1,082 468 614 1,181 742 439 896 638 258 454520 Khadaua 933 342 591 912 720 192 652 598 54 454521 Govindnagar 168 69 99 188 97 91 120 94 26 454522 Dhimaryau454523 Tigroo 261 99 162 409 209 200 226 206 20 454524 Chitai 79 23 56 134 77 57 36 30 6 454525 Toda 82 39 43 220 117 103 87 81 6 454526 Danguchad 70 26 44 49 26 23 21 18 3 454527 Ramgarha 416 143 273 540 310 230 244 236 8 454528 Chimghan 259 90 169 213 205 8 213 205 8 454529 Roora 134 47 87 98 92 6 96 90 6 454530 Bhadol 844 365 479 641 585 56 519 497 22 454531 Seoni 173 43 130 164 147 17 115 113 2 454532 Nandana 245 98 147 194 139 55 193 138 55
-------------Un-inhabited---------------------------Un-inhabited--------------
-------------Un-inhabited--------------
-------------Un-inhabited--------------
-------------Un-inhabited--------------
68
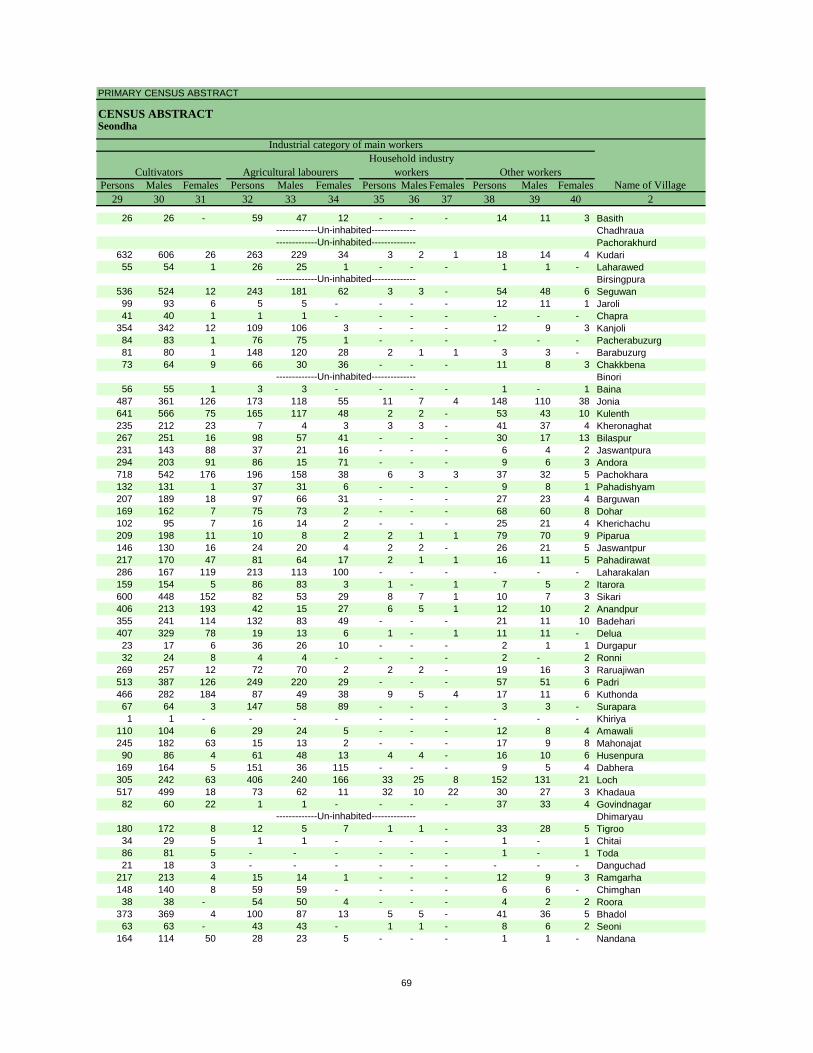
PRIMARY CENSUS ABSTRACT
CENSUS ABSTRACTSeondha
Persons Males Females Persons Males Females Persons Males Females Persons Males Females29 30 31 32 33 34 35 36 37 38 39 40 2
CultivatorsName of Village
Household industry workersAgricultural labourers
Industrial category of main workers
Other workers
26 26 - 59 47 12 - - - 14 11 3 BasithChadhrauaPachorakhurd
632 606 26 263 229 34 3 2 1 18 14 4 Kudari55 54 1 26 25 1 - - - 1 1 - Laharawed
Birsingpura536 524 12 243 181 62 3 3 - 54 48 6 Seguwan99 93 6 5 5 - - - - 12 11 1 Jaroli41 40 1 1 1 - - - - - - - Chapra
354 342 12 109 106 3 - - - 12 9 3 Kanjoli84 83 1 76 75 1 - - - - - - Pacherabuzurg81 80 1 148 120 28 2 1 1 3 3 - Barabuzurg73 64 9 66 30 36 - - - 11 8 3 Chakkbena
Binori56 55 1 3 3 - - - - 1 - 1 Baina
487 361 126 173 118 55 11 7 4 148 110 38 Jonia641 566 75 165 117 48 2 2 - 53 43 10 Kulenth235 212 23 7 4 3 3 3 - 41 37 4 Kheronaghat267 251 16 98 57 41 - - - 30 17 13 Bilaspur231 143 88 37 21 16 - - - 6 4 2 Jaswantpura294 203 91 86 15 71 - - - 9 6 3 Andora718 542 176 196 158 38 6 3 3 37 32 5 Pachokhara132 131 1 37 31 6 - - - 9 8 1 Pahadishyam207 189 18 97 66 31 - - - 27 23 4 Barguwan169 162 7 75 73 2 - - - 68 60 8 Dohar102 95 7 16 14 2 - - - 25 21 4 Kherichachu209 198 11 10 8 2 2 1 1 79 70 9 Piparua146 130 16 24 20 4 2 2 - 26 21 5 Jaswantpur217 170 47 81 64 17 2 1 1 16 11 5 Pahadirawat286 167 119 213 113 100 - - - - - - Laharakalan159 154 5 86 83 3 1 - 1 7 5 2 Itarora600 448 152 82 53 29 8 7 1 10 7 3 Sikari406 213 193 42 15 27 6 5 1 12 10 2 Anandpur355 241 114 132 83 49 - - - 21 11 10 Badehari407 329 78 19 13 6 1 - 1 11 11 - Delua23 17 6 36 26 10 - - - 2 1 1 Durgapur32 24 8 4 4 - - - - 2 - 2 Ronni
269 257 12 72 70 2 2 2 - 19 16 3 Raruajiwan513 387 126 249 220 29 - - - 57 51 6 Padri466 282 184 87 49 38 9 5 4 17 11 6 Kuthonda67 64 3 147 58 89 - - - 3 3 - Surapara1 1 - - - - - - - - - - Khiriya
110 104 6 29 24 5 - - - 12 8 4 Amawali245 182 63 15 13 2 - - - 17 9 8 Mahonajat90 86 4 61 48 13 4 4 - 16 10 6 Husenpura
169 164 5 151 36 115 - - - 9 5 4 Dabhera305 242 63 406 240 166 33 25 8 152 131 21 Loch517 499 18 73 62 11 32 10 22 30 27 3 Khadaua82 60 22 1 1 - - - - 37 33 4 Govindnagar
Dhimaryau180 172 8 12 5 7 1 1 - 33 28 5 Tigroo34 29 5 1 1 - - - - 1 - 1 Chitai86 81 5 - - - - - - 1 - 1 Toda21 18 3 - - - - - - - - - Danguchad
217 213 4 15 14 1 - - - 12 9 3 Ramgarha148 140 8 59 59 - - - - 6 6 - Chimghan38 38 - 54 50 4 - - - 4 2 2 Roora
373 369 4 100 87 13 5 5 - 41 36 5 Bhadol63 63 - 43 43 - 1 1 - 8 6 2 Seoni
164 114 50 28 23 5 - - - 1 1 - Nandana
-------------Un-inhabited---------------------------Un-inhabited--------------
-------------Un-inhabited--------------
-------------Un-inhabited--------------
-------------Un-inhabited--------------
69

DISTRICT CENSUS HANDBOOK : DATIA
VILLAGE PRIMARYC D Block -
Persons Males Females Persons Males Females Persons Males Females1 2 41 42 43 44 45 46 47 48 49
Name of VillageMarginal workers Cultivators Agricultural labourers
Industrial category Location
code number
454473 Basith 3 3 - - - - - - - 454474 Chadhraua454475 Pachorakhurd454476 Kudari 37 27 10 11 8 3 21 15 6 454477 Laharawed - - - - - - - - - 454478 Birsingpura454479 Seguwan 33 11 22 16 4 12 15 6 9 454480 Jaroli 142 135 7 42 40 2 92 87 5 454481 Chapra - - - - - - - - - 454482 Kanjoli 6 3 3 - - - 6 3 3 454483 Pacherabuzurg - - - - - - - - - 454484 Barabuzurg - - - - - - - - - 454485 Chakkbena 287 140 147 19 5 14 263 130 133 454486 Binori454487 Baina 99 78 21 - - - 77 58 19 454488 Jonia 67 38 29 9 4 5 47 27 20 454489 Kulenth 112 67 45 28 13 15 74 53 21 454490 Kheronaghat 432 174 258 173 71 102 226 73 153 454491 Bilaspur 211 13 198 21 5 16 188 8 180 454492 Jaswantpura 152 68 84 88 30 58 64 38 26 454493 Andora 17 1 16 12 1 11 4 - 4 454494 Pachokhara 152 45 107 16 13 3 92 16 76 454495 Pahadishyam 92 14 78 1 - 1 89 13 76 454496 Barguwan 70 11 59 6 - 6 64 11 53 454497 Dohar 385 200 185 126 121 5 254 74 180 454498 Kherichachu 112 11 101 63 2 61 48 8 40 454499 Piparua 351 67 284 137 37 100 181 19 162 454500 Jaswantpur 226 84 142 26 10 16 180 65 115 454501 Pahadirawat 1 - 1 - - - - - - 454502 Laharakalan 8 5 3 - - - 5 3 2 454503 Itarora - - - - - - - - - 454504 Sikari 191 101 90 38 21 17 141 76 65 454505 Anandpur 7 4 3 - - - 3 - 3 454506 Badehari 25 14 11 1 1 - 24 13 11 454507 Delua 260 88 172 3 2 1 254 83 171 454508 Durgapur - - - - - - - - - 454509 Ronni 290 163 127 107 59 48 183 104 79 454510 Raruajiwan 106 83 23 50 36 14 50 41 9 454511 Padri 405 228 177 383 217 166 15 7 8 454512 Kuthonda 60 9 51 42 4 38 16 4 12 454513 Surapara 13 5 8 - - - 9 1 8 454514 Khiriya - - - - - - - - - 454515 Amawali 85 3 82 73 1 72 11 1 10 454516 Mahonajat 234 83 151 99 4 95 129 75 54 454517 Husenpura 26 3 23 3 1 2 17 - 17 454518 Dabhera 60 3 57 19 2 17 39 1 38 454519 Loch 285 104 181 92 23 69 175 67 108 454520 Khadaua 260 122 138 62 7 55 183 108 75 454521 Govindnagar 68 3 65 60 3 57 8 - 8 454522 Dhimaryau454523 Tigroo 183 3 180 175 1 174 6 1 5 454524 Chitai 98 47 51 58 17 41 40 30 10 454525 Toda 133 36 97 125 30 95 7 6 1 454526 Danguchad 28 8 20 22 4 18 6 4 2 454527 Ramgarha 296 74 222 256 63 193 38 9 29 454528 Chimghan - - - - - - - - - 454529 Roora 2 2 - - - - 1 1 - 454530 Bhadol 122 88 34 21 3 18 95 83 12 454531 Seoni 49 34 15 27 23 4 19 9 10 454532 Nandana 1 1 - - - - 1 1 -
-------------Un-inhabited---------------------------Un-inhabited--------------
-------------Un-inhabited--------------
-------------Un-inhabited--------------
-------------Un-inhabited--------------
70

PRIMARY CENSUS ABSTRACT
CENSUS ABSTRACTSeondha
Persons Males Females Persons Males Females Persons Males Females50 51 52 53 54 55 56 57 58 2 1
Location code
numberHousehold industry workers
Name of VillageOther workers Non-workers
of marginal workers
1 1 - 2 2 - 164 54 110 Basith 454473Chadhraua 454474Pachorakhurd 454475
- - - 5 4 1 2,217 817 1,400 Kudari 454476- - - - - - 230 94 136 Laharawed 454477
Birsingpura 454478- - - 2 1 1 1,855 697 1,158 Seguwan 454479- - - 8 8 - 621 236 385 Jaroli 454480- - - - - - 111 40 71 Chapra 454481- - - - - - 1,042 354 688 Kanjoli 454482- - - - - - 336 124 212 Pacherabuzurg 454483- - - - - - 485 188 297 Barabuzurg 454484
1 1 - 4 4 - 312 167 145 Chakkbena 454485Binori 454486
4 3 1 18 17 1 288 110 178 Baina 4544871 1 - 10 6 4 1,304 503 801 Jonia 454488
- - - 10 1 9 1,839 713 1,126 Kulenth 4544892 - 2 31 30 1 495 261 234 Kheronaghat 454490
- - - 2 - 2 549 280 269 Bilaspur 454491- - - - - - 369 183 186 Jaswantpura 454492- - - 1 - 1 230 125 105 Andora 45449329 12 17 15 4 11 1,615 685 930 Pachokhara 4544941 - 1 1 1 - 253 110 143 Pahadishyam 454495
- - - - - - 626 266 360 Barguwan 454496- - - 5 5 - 976 367 609 Dohar 454497- - - 1 1 - 222 102 120 Kherichachu 454498- - - 33 11 22 463 249 214 Piparua 454499
5 1 4 15 8 7 467 201 266 Jaswantpur 454500- - - 1 - 1 539 226 313 Pahadirawat 454501- - - 3 2 1 292 155 137 Laharakalan 454502- - - - - - 525 183 342 Itarora 454503
5 2 3 7 2 5 1,112 466 646 Sikari 4545041 1 - 3 3 - 335 173 162 Anandpur 454505
- - - - - - 645 262 383 Badehari 454506- - - 3 3 - 788 339 449 Delua 454507- - - - - - 69 35 34 Durgapur 454508- - - - - - 292 150 142 Ronni 454509
5 5 - 1 1 - 1,095 408 687 Raruajiwan 454510- - - 7 4 3 1,730 735 995 Padri 454511- - - 2 1 1 610 311 299 Kuthonda 454512
2 2 - 2 2 - 155 84 71 Surapara 454513- - - - - - - - - Khiriya 454514- - - 1 1 - 218 107 111 Amawali 454515- - - 6 4 2 524 276 248 Mahonajat 454516
2 - 2 4 2 2 333 121 212 Husenpura 454517- - - 2 - 2 377 197 180 Dabhera 454518
2 2 - 16 12 4 1,302 586 716 Loch 4545197 1 6 8 6 2 1,583 631 952 Khadaua 454520
- - - - - - 151 84 67 Govindnagar 454521Dhimaryau 454522
1 1 - 1 - 1 327 167 160 Tigroo 454523- - - - - - 83 43 40 Chitai 454524- - - 1 - 1 129 78 51 Toda 454525- - - - - - 48 23 25 Danguchad 454526- - - 2 2 - 321 126 195 Ramgarha 454527- - - - - - 459 160 299 Chimghan 454528- - - 1 1 - 248 85 163 Roora 454529
1 1 - 5 1 4 1,234 428 806 Bhadol 4545302 1 1 1 1 - 310 93 217 Seoni 454531
- - - - - - 300 125 175 Nandana 454532
-------------Un-inhabited---------------------------Un-inhabited--------------
-------------Un-inhabited--------------
-------------Un-inhabited--------------
-------------Un-inhabited--------------
71
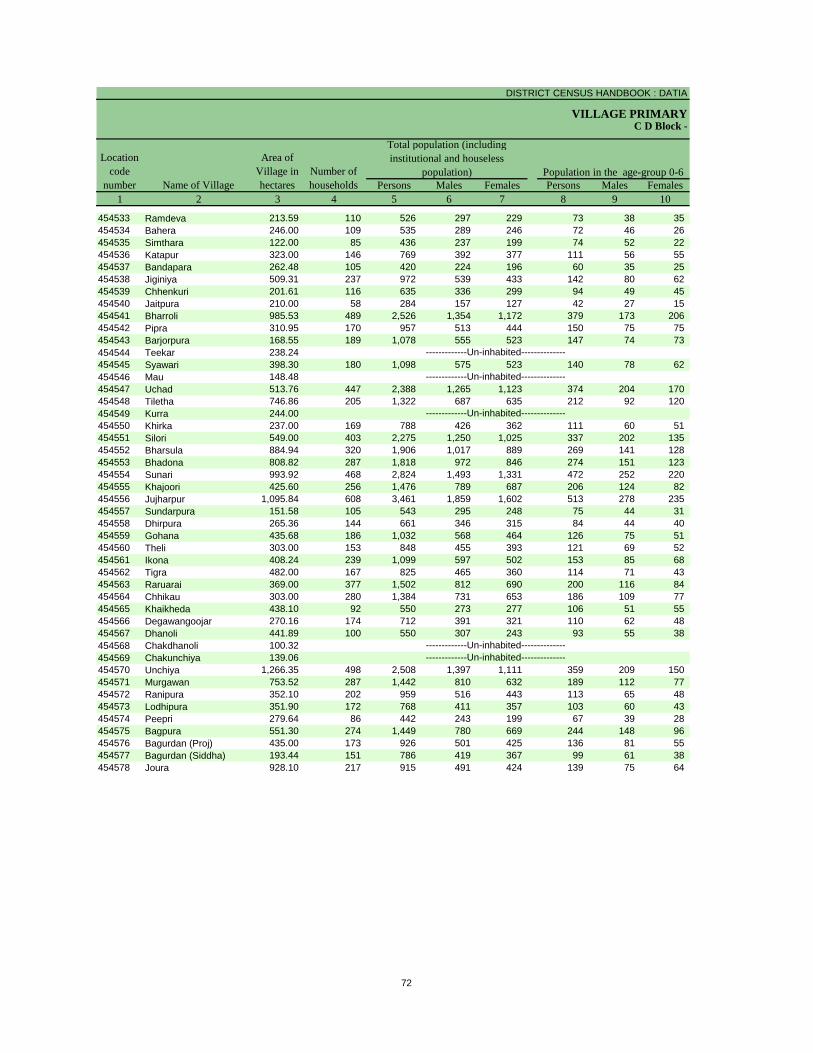
DISTRICT CENSUS HANDBOOK : DATIA
VILLAGE PRIMARY
Persons Males Females Persons Males Females1 2 3 4 5 6 7 8 9 10
Name of Village
Location code
number
Total population (including institutional and houseless
population)Area of
Village in hectares
Number of households
C D Block -
Population in the age-group 0-6
454533 Ramdeva 213.59 110 526 297 229 73 38 35 454534 Bahera 246.00 109 535 289 246 72 46 26 454535 Simthara 122.00 85 436 237 199 74 52 22 454536 Katapur 323.00 146 769 392 377 111 56 55 454537 Bandapara 262.48 105 420 224 196 60 35 25 454538 Jiginiya 509.31 237 972 539 433 142 80 62 454539 Chhenkuri 201.61 116 635 336 299 94 49 45 454540 Jaitpura 210.00 58 284 157 127 42 27 15 454541 Bharroli 985.53 489 2,526 1,354 1,172 379 173 206 454542 Pipra 310.95 170 957 513 444 150 75 75 454543 Barjorpura 168.55 189 1,078 555 523 147 74 73 454544 Teekar 238.24454545 Syawari 398.30 180 1,098 575 523 140 78 62 454546 Mau 148.48454547 Uchad 513.76 447 2,388 1,265 1,123 374 204 170 454548 Tiletha 746.86 205 1,322 687 635 212 92 120 454549 Kurra 244.00454550 Khirka 237.00 169 788 426 362 111 60 51 454551 Silori 549.00 403 2,275 1,250 1,025 337 202 135 454552 Bharsula 884.94 320 1,906 1,017 889 269 141 128 454553 Bhadona 808.82 287 1,818 972 846 274 151 123 454554 Sunari 993.92 468 2,824 1,493 1,331 472 252 220 454555 Khajoori 425.60 256 1,476 789 687 206 124 82 454556 Jujharpur 1,095.84 608 3,461 1,859 1,602 513 278 235 454557 Sundarpura 151.58 105 543 295 248 75 44 31 454558 Dhirpura 265.36 144 661 346 315 84 44 40 454559 Gohana 435.68 186 1,032 568 464 126 75 51 454560 Theli 303.00 153 848 455 393 121 69 52 454561 Ikona 408.24 239 1,099 597 502 153 85 68 454562 Tigra 482.00 167 825 465 360 114 71 43 454563 Raruarai 369.00 377 1,502 812 690 200 116 84 454564 Chhikau 303.00 280 1,384 731 653 186 109 77 454565 Khaikheda 438.10 92 550 273 277 106 51 55 454566 Degawangoojar 270.16 174 712 391 321 110 62 48 454567 Dhanoli 441.89 100 550 307 243 93 55 38 454568 Chakdhanoli 100.32454569 Chakunchiya 139.06454570 Unchiya 1,266.35 498 2,508 1,397 1,111 359 209 150 454571 Murgawan 753.52 287 1,442 810 632 189 112 77 454572 Ranipura 352.10 202 959 516 443 113 65 48 454573 Lodhipura 351.90 172 768 411 357 103 60 43 454574 Peepri 279.64 86 442 243 199 67 39 28 454575 Bagpura 551.30 274 1,449 780 669 244 148 96 454576 Bagurdan (Proj) 435.00 173 926 501 425 136 81 55 454577 Bagurdan (Siddha) 193.44 151 786 419 367 99 61 38 454578 Joura 928.10 217 915 491 424 139 75 64
-------------Un-inhabited--------------
-------------Un-inhabited--------------
-------------Un-inhabited--------------
-------------Un-inhabited---------------------------Un-inhabited--------------
72
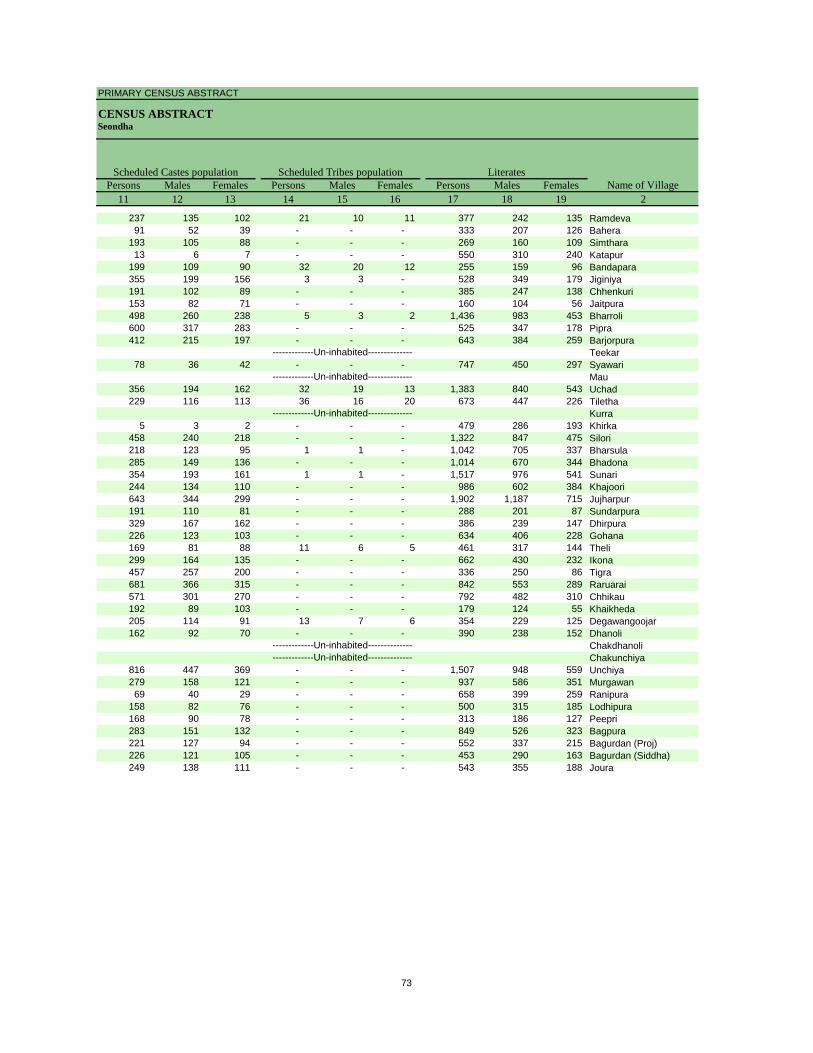
PRIMARY CENSUS ABSTRACT
CENSUS ABSTRACTSeondha
Persons Males Females Persons Males Females Persons Males Females11 12 13 14 15 16 17 18 19 2
Name of VillageLiteratesScheduled Castes population Scheduled Tribes population
237 135 102 21 10 11 377 242 135 Ramdeva91 52 39 - - - 333 207 126 Bahera
193 105 88 - - - 269 160 109 Simthara13 6 7 - - - 550 310 240 Katapur
199 109 90 32 20 12 255 159 96 Bandapara355 199 156 3 3 - 528 349 179 Jiginiya191 102 89 - - - 385 247 138 Chhenkuri153 82 71 - - - 160 104 56 Jaitpura498 260 238 5 3 2 1,436 983 453 Bharroli600 317 283 - - - 525 347 178 Pipra412 215 197 - - - 643 384 259 Barjorpura
Teekar78 36 42 - - - 747 450 297 Syawari
Mau356 194 162 32 19 13 1,383 840 543 Uchad229 116 113 36 16 20 673 447 226 Tiletha
Kurra5 3 2 - - - 479 286 193 Khirka
458 240 218 - - - 1,322 847 475 Silori218 123 95 1 1 - 1,042 705 337 Bharsula285 149 136 - - - 1,014 670 344 Bhadona354 193 161 1 1 - 1,517 976 541 Sunari244 134 110 - - - 986 602 384 Khajoori643 344 299 - - - 1,902 1,187 715 Jujharpur191 110 81 - - - 288 201 87 Sundarpura329 167 162 - - - 386 239 147 Dhirpura226 123 103 - - - 634 406 228 Gohana169 81 88 11 6 5 461 317 144 Theli299 164 135 - - - 662 430 232 Ikona457 257 200 - - - 336 250 86 Tigra681 366 315 - - - 842 553 289 Raruarai571 301 270 - - - 792 482 310 Chhikau192 89 103 - - - 179 124 55 Khaikheda205 114 91 13 7 6 354 229 125 Degawangoojar162 92 70 - - - 390 238 152 Dhanoli
ChakdhanoliChakunchiya
816 447 369 - - - 1,507 948 559 Unchiya279 158 121 - - - 937 586 351 Murgawan69 40 29 - - - 658 399 259 Ranipura
158 82 76 - - - 500 315 185 Lodhipura168 90 78 - - - 313 186 127 Peepri283 151 132 - - - 849 526 323 Bagpura221 127 94 - - - 552 337 215 Bagurdan (Proj)226 121 105 - - - 453 290 163 Bagurdan (Siddha)249 138 111 - - - 543 355 188 Joura
-------------Un-inhabited--------------
-------------Un-inhabited--------------
-------------Un-inhabited--------------
-------------Un-inhabited---------------------------Un-inhabited--------------
73
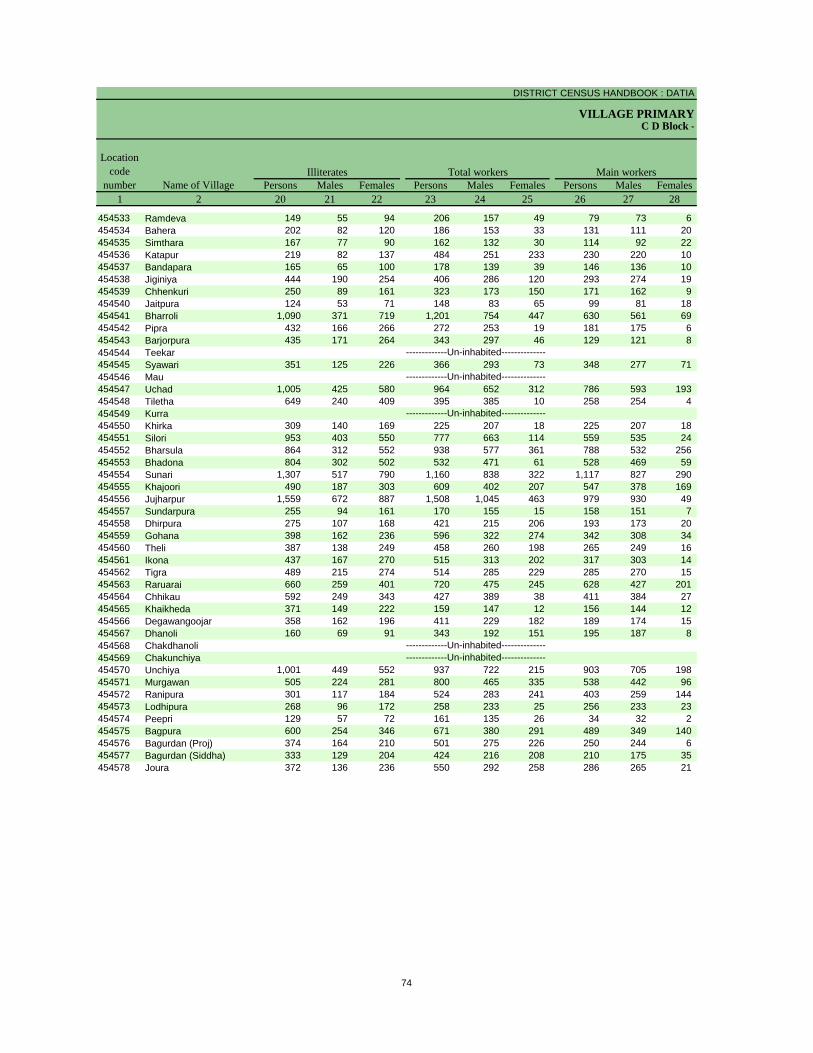
DISTRICT CENSUS HANDBOOK : DATIA
VILLAGE PRIMARYC D Block -
Persons Males Females Persons Males Females Persons Males Females1 2 20 21 22 23 24 25 26 27 28
Name of Village
Location code
numberIlliterates Total workers Main workers
454533 Ramdeva 149 55 94 206 157 49 79 73 6 454534 Bahera 202 82 120 186 153 33 131 111 20 454535 Simthara 167 77 90 162 132 30 114 92 22 454536 Katapur 219 82 137 484 251 233 230 220 10 454537 Bandapara 165 65 100 178 139 39 146 136 10 454538 Jiginiya 444 190 254 406 286 120 293 274 19 454539 Chhenkuri 250 89 161 323 173 150 171 162 9 454540 Jaitpura 124 53 71 148 83 65 99 81 18 454541 Bharroli 1,090 371 719 1,201 754 447 630 561 69 454542 Pipra 432 166 266 272 253 19 181 175 6 454543 Barjorpura 435 171 264 343 297 46 129 121 8 454544 Teekar454545 Syawari 351 125 226 366 293 73 348 277 71 454546 Mau454547 Uchad 1,005 425 580 964 652 312 786 593 193 454548 Tiletha 649 240 409 395 385 10 258 254 4 454549 Kurra454550 Khirka 309 140 169 225 207 18 225 207 18 454551 Silori 953 403 550 777 663 114 559 535 24 454552 Bharsula 864 312 552 938 577 361 788 532 256 454553 Bhadona 804 302 502 532 471 61 528 469 59 454554 Sunari 1,307 517 790 1,160 838 322 1,117 827 290 454555 Khajoori 490 187 303 609 402 207 547 378 169 454556 Jujharpur 1,559 672 887 1,508 1,045 463 979 930 49 454557 Sundarpura 255 94 161 170 155 15 158 151 7 454558 Dhirpura 275 107 168 421 215 206 193 173 20 454559 Gohana 398 162 236 596 322 274 342 308 34 454560 Theli 387 138 249 458 260 198 265 249 16 454561 Ikona 437 167 270 515 313 202 317 303 14 454562 Tigra 489 215 274 514 285 229 285 270 15 454563 Raruarai 660 259 401 720 475 245 628 427 201 454564 Chhikau 592 249 343 427 389 38 411 384 27 454565 Khaikheda 371 149 222 159 147 12 156 144 12 454566 Degawangoojar 358 162 196 411 229 182 189 174 15 454567 Dhanoli 160 69 91 343 192 151 195 187 8 454568 Chakdhanoli454569 Chakunchiya454570 Unchiya 1,001 449 552 937 722 215 903 705 198 454571 Murgawan 505 224 281 800 465 335 538 442 96 454572 Ranipura 301 117 184 524 283 241 403 259 144 454573 Lodhipura 268 96 172 258 233 25 256 233 23 454574 Peepri 129 57 72 161 135 26 34 32 2 454575 Bagpura 600 254 346 671 380 291 489 349 140 454576 Bagurdan (Proj) 374 164 210 501 275 226 250 244 6 454577 Bagurdan (Siddha) 333 129 204 424 216 208 210 175 35 454578 Joura 372 136 236 550 292 258 286 265 21
-------------Un-inhabited--------------
-------------Un-inhabited--------------
-------------Un-inhabited--------------
-------------Un-inhabited---------------------------Un-inhabited--------------
74
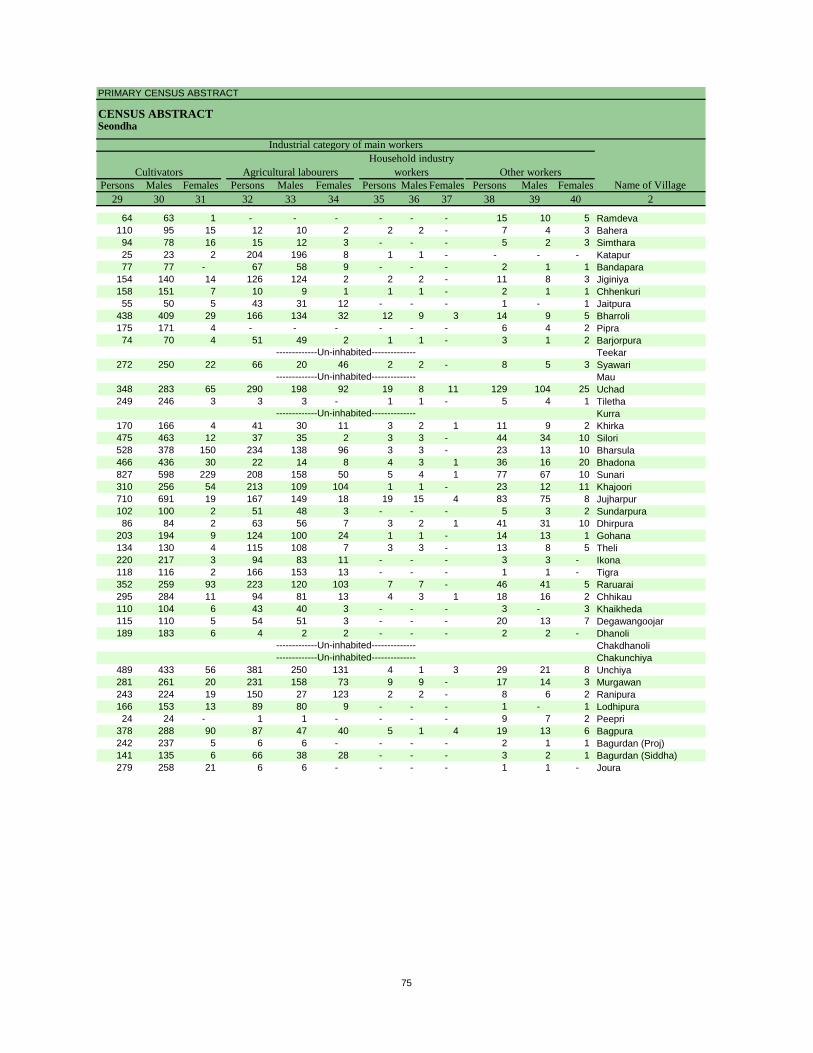
PRIMARY CENSUS ABSTRACT
CENSUS ABSTRACTSeondha
Persons Males Females Persons Males Females Persons Males Females Persons Males Females29 30 31 32 33 34 35 36 37 38 39 40 2
CultivatorsName of Village
Household industry workersAgricultural labourers
Industrial category of main workers
Other workers
64 63 1 - - - - - - 15 10 5 Ramdeva110 95 15 12 10 2 2 2 - 7 4 3 Bahera94 78 16 15 12 3 - - - 5 2 3 Simthara25 23 2 204 196 8 1 1 - - - - Katapur77 77 - 67 58 9 - - - 2 1 1 Bandapara
154 140 14 126 124 2 2 2 - 11 8 3 Jiginiya158 151 7 10 9 1 1 1 - 2 1 1 Chhenkuri55 50 5 43 31 12 - - - 1 - 1 Jaitpura
438 409 29 166 134 32 12 9 3 14 9 5 Bharroli175 171 4 - - - - - - 6 4 2 Pipra74 70 4 51 49 2 1 1 - 3 1 2 Barjorpura
Teekar272 250 22 66 20 46 2 2 - 8 5 3 Syawari
Mau348 283 65 290 198 92 19 8 11 129 104 25 Uchad249 246 3 3 3 - 1 1 - 5 4 1 Tiletha
Kurra170 166 4 41 30 11 3 2 1 11 9 2 Khirka475 463 12 37 35 2 3 3 - 44 34 10 Silori528 378 150 234 138 96 3 3 - 23 13 10 Bharsula466 436 30 22 14 8 4 3 1 36 16 20 Bhadona827 598 229 208 158 50 5 4 1 77 67 10 Sunari310 256 54 213 109 104 1 1 - 23 12 11 Khajoori710 691 19 167 149 18 19 15 4 83 75 8 Jujharpur102 100 2 51 48 3 - - - 5 3 2 Sundarpura86 84 2 63 56 7 3 2 1 41 31 10 Dhirpura
203 194 9 124 100 24 1 1 - 14 13 1 Gohana134 130 4 115 108 7 3 3 - 13 8 5 Theli220 217 3 94 83 11 - - - 3 3 - Ikona118 116 2 166 153 13 - - - 1 1 - Tigra352 259 93 223 120 103 7 7 - 46 41 5 Raruarai295 284 11 94 81 13 4 3 1 18 16 2 Chhikau110 104 6 43 40 3 - - - 3 - 3 Khaikheda115 110 5 54 51 3 - - - 20 13 7 Degawangoojar189 183 6 4 2 2 - - - 2 2 - Dhanoli
ChakdhanoliChakunchiya
489 433 56 381 250 131 4 1 3 29 21 8 Unchiya281 261 20 231 158 73 9 9 - 17 14 3 Murgawan243 224 19 150 27 123 2 2 - 8 6 2 Ranipura166 153 13 89 80 9 - - - 1 - 1 Lodhipura24 24 - 1 1 - - - - 9 7 2 Peepri
378 288 90 87 47 40 5 1 4 19 13 6 Bagpura242 237 5 6 6 - - - - 2 1 1 Bagurdan (Proj)141 135 6 66 38 28 - - - 3 2 1 Bagurdan (Siddha)279 258 21 6 6 - - - - 1 1 - Joura
-------------Un-inhabited--------------
-------------Un-inhabited--------------
-------------Un-inhabited--------------
-------------Un-inhabited---------------------------Un-inhabited--------------
75
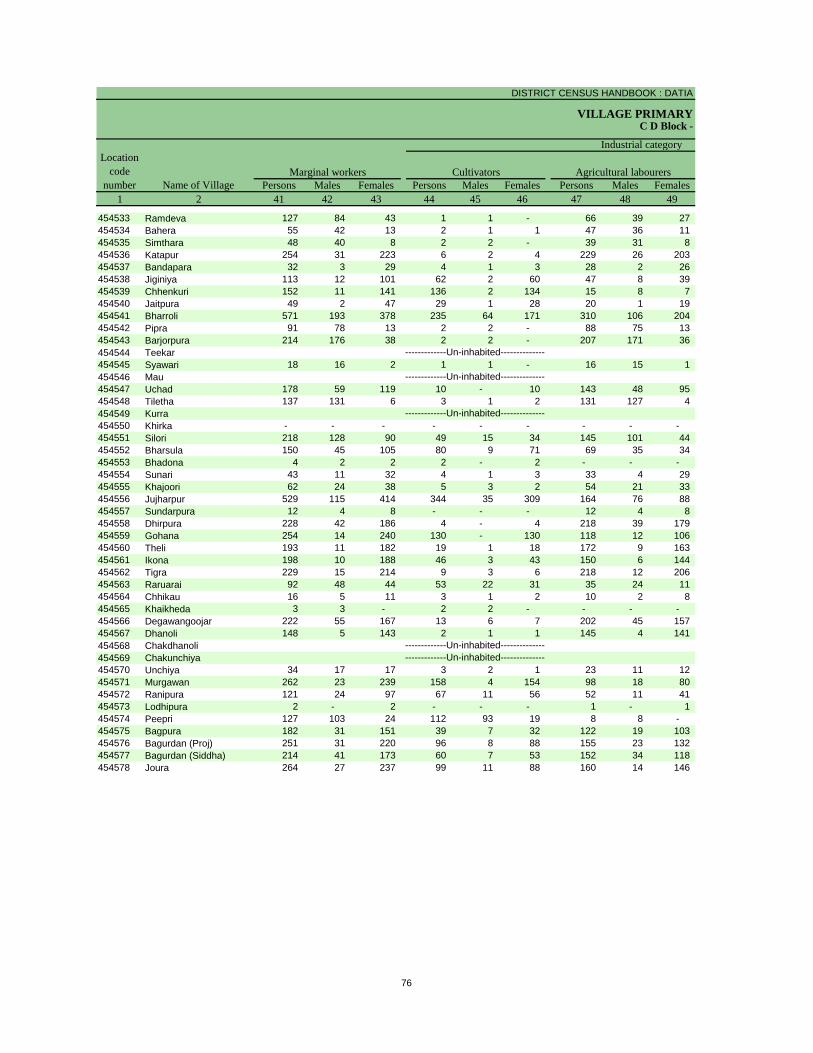
DISTRICT CENSUS HANDBOOK : DATIA
VILLAGE PRIMARYC D Block -
Persons Males Females Persons Males Females Persons Males Females1 2 41 42 43 44 45 46 47 48 49
Name of VillageMarginal workers Cultivators Agricultural labourers
Industrial category Location
code number
454533 Ramdeva 127 84 43 1 1 - 66 39 27 454534 Bahera 55 42 13 2 1 1 47 36 11 454535 Simthara 48 40 8 2 2 - 39 31 8 454536 Katapur 254 31 223 6 2 4 229 26 203 454537 Bandapara 32 3 29 4 1 3 28 2 26 454538 Jiginiya 113 12 101 62 2 60 47 8 39 454539 Chhenkuri 152 11 141 136 2 134 15 8 7 454540 Jaitpura 49 2 47 29 1 28 20 1 19 454541 Bharroli 571 193 378 235 64 171 310 106 204 454542 Pipra 91 78 13 2 2 - 88 75 13 454543 Barjorpura 214 176 38 2 2 - 207 171 36 454544 Teekar454545 Syawari 18 16 2 1 1 - 16 15 1 454546 Mau454547 Uchad 178 59 119 10 - 10 143 48 95 454548 Tiletha 137 131 6 3 1 2 131 127 4 454549 Kurra454550 Khirka - - - - - - - - - 454551 Silori 218 128 90 49 15 34 145 101 44 454552 Bharsula 150 45 105 80 9 71 69 35 34 454553 Bhadona 4 2 2 2 - 2 - - - 454554 Sunari 43 11 32 4 1 3 33 4 29 454555 Khajoori 62 24 38 5 3 2 54 21 33 454556 Jujharpur 529 115 414 344 35 309 164 76 88 454557 Sundarpura 12 4 8 - - - 12 4 8 454558 Dhirpura 228 42 186 4 - 4 218 39 179 454559 Gohana 254 14 240 130 - 130 118 12 106 454560 Theli 193 11 182 19 1 18 172 9 163 454561 Ikona 198 10 188 46 3 43 150 6 144 454562 Tigra 229 15 214 9 3 6 218 12 206 454563 Raruarai 92 48 44 53 22 31 35 24 11 454564 Chhikau 16 5 11 3 1 2 10 2 8 454565 Khaikheda 3 3 - 2 2 - - - - 454566 Degawangoojar 222 55 167 13 6 7 202 45 157 454567 Dhanoli 148 5 143 2 1 1 145 4 141 454568 Chakdhanoli454569 Chakunchiya454570 Unchiya 34 17 17 3 2 1 23 11 12 454571 Murgawan 262 23 239 158 4 154 98 18 80 454572 Ranipura 121 24 97 67 11 56 52 11 41 454573 Lodhipura 2 - 2 - - - 1 - 1 454574 Peepri 127 103 24 112 93 19 8 8 - 454575 Bagpura 182 31 151 39 7 32 122 19 103 454576 Bagurdan (Proj) 251 31 220 96 8 88 155 23 132 454577 Bagurdan (Siddha) 214 41 173 60 7 53 152 34 118 454578 Joura 264 27 237 99 11 88 160 14 146
-------------Un-inhabited--------------
-------------Un-inhabited--------------
-------------Un-inhabited--------------
-------------Un-inhabited---------------------------Un-inhabited--------------
76
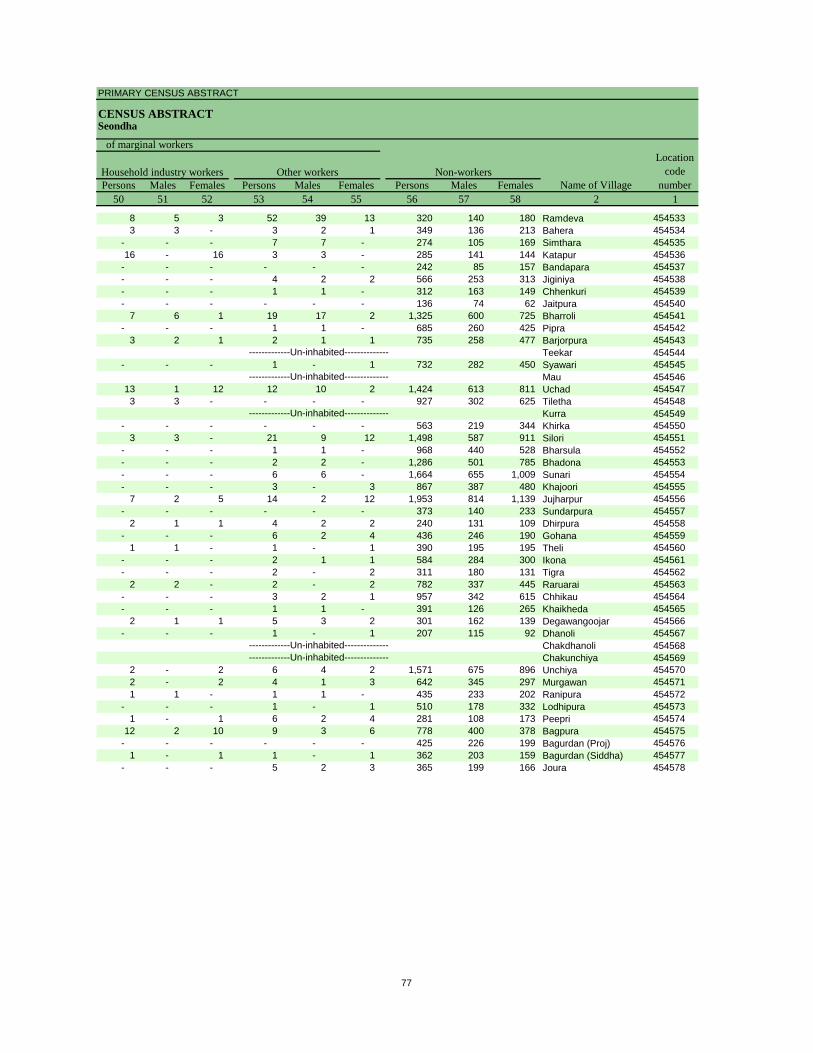
PRIMARY CENSUS ABSTRACT
CENSUS ABSTRACTSeondha
Persons Males Females Persons Males Females Persons Males Females50 51 52 53 54 55 56 57 58 2 1
Location code
numberHousehold industry workers
Name of VillageOther workers Non-workers
of marginal workers
8 5 3 52 39 13 320 140 180 Ramdeva 4545333 3 - 3 2 1 349 136 213 Bahera 454534
- - - 7 7 - 274 105 169 Simthara 45453516 - 16 3 3 - 285 141 144 Katapur 454536
- - - - - - 242 85 157 Bandapara 454537- - - 4 2 2 566 253 313 Jiginiya 454538- - - 1 1 - 312 163 149 Chhenkuri 454539- - - - - - 136 74 62 Jaitpura 454540
7 6 1 19 17 2 1,325 600 725 Bharroli 454541- - - 1 1 - 685 260 425 Pipra 454542
3 2 1 2 1 1 735 258 477 Barjorpura 454543Teekar 454544
- - - 1 - 1 732 282 450 Syawari 454545Mau 454546
13 1 12 12 10 2 1,424 613 811 Uchad 4545473 3 - - - - 927 302 625 Tiletha 454548
Kurra 454549- - - - - - 563 219 344 Khirka 454550
3 3 - 21 9 12 1,498 587 911 Silori 454551- - - 1 1 - 968 440 528 Bharsula 454552- - - 2 2 - 1,286 501 785 Bhadona 454553- - - 6 6 - 1,664 655 1,009 Sunari 454554- - - 3 - 3 867 387 480 Khajoori 454555
7 2 5 14 2 12 1,953 814 1,139 Jujharpur 454556- - - - - - 373 140 233 Sundarpura 454557
2 1 1 4 2 2 240 131 109 Dhirpura 454558- - - 6 2 4 436 246 190 Gohana 454559
1 1 - 1 - 1 390 195 195 Theli 454560- - - 2 1 1 584 284 300 Ikona 454561- - - 2 - 2 311 180 131 Tigra 454562
2 2 - 2 - 2 782 337 445 Raruarai 454563- - - 3 2 1 957 342 615 Chhikau 454564- - - 1 1 - 391 126 265 Khaikheda 454565
2 1 1 5 3 2 301 162 139 Degawangoojar 454566- - - 1 - 1 207 115 92 Dhanoli 454567
Chakdhanoli 454568Chakunchiya 454569
2 - 2 6 4 2 1,571 675 896 Unchiya 4545702 - 2 4 1 3 642 345 297 Murgawan 4545711 1 - 1 1 - 435 233 202 Ranipura 454572
- - - 1 - 1 510 178 332 Lodhipura 4545731 - 1 6 2 4 281 108 173 Peepri 454574
12 2 10 9 3 6 778 400 378 Bagpura 454575- - - - - - 425 226 199 Bagurdan (Proj) 454576
1 - 1 1 - 1 362 203 159 Bagurdan (Siddha) 454577- - - 5 2 3 365 199 166 Joura 454578
-------------Un-inhabited--------------
-------------Un-inhabited--------------
-------------Un-inhabited--------------
-------------Un-inhabited---------------------------Un-inhabited--------------
77
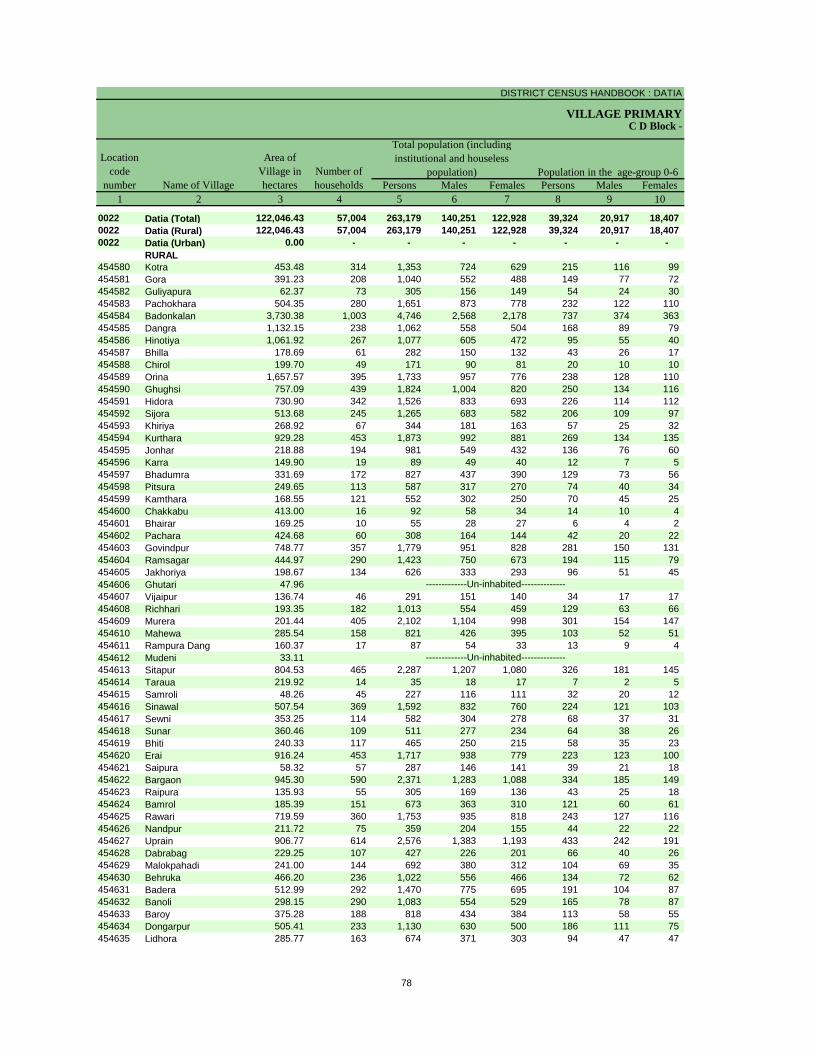
DISTRICT CENSUS HANDBOOK : DATIA
VILLAGE PRIMARY
Persons Males Females Persons Males Females1 2 3 4 5 6 7 8 9 10
0022 Datia (Total) 122,046.43 57,004 263,179 140,251 122,928 39,324 20,917 18,407 0022 Datia (Rural) 122,046.43 57,004 263,179 140,251 122,928 39,324 20,917 18,407 0022 Datia (Urban) 0.00 - - - - - - -
RURAL454580 Kotra 453.48 314 1,353 724 629 215 116 99 454581 Gora 391.23 208 1,040 552 488 149 77 72 454582 Guliyapura 62.37 73 305 156 149 54 24 30 454583 Pachokhara 504.35 280 1,651 873 778 232 122 110 454584 Badonkalan 3,730.38 1,003 4,746 2,568 2,178 737 374 363 454585 Dangra 1,132.15 238 1,062 558 504 168 89 79 454586 Hinotiya 1,061.92 267 1,077 605 472 95 55 40 454587 Bhilla 178.69 61 282 150 132 43 26 17 454588 Chirol 199.70 49 171 90 81 20 10 10 454589 Orina 1,657.57 395 1,733 957 776 238 128 110 454590 Ghughsi 757.09 439 1,824 1,004 820 250 134 116 454591 Hidora 730.90 342 1,526 833 693 226 114 112 454592 Sijora 513.68 245 1,265 683 582 206 109 97 454593 Khiriya 268.92 67 344 181 163 57 25 32 454594 Kurthara 929.28 453 1,873 992 881 269 134 135 454595 Jonhar 218.88 194 981 549 432 136 76 60 454596 Karra 149.90 19 89 49 40 12 7 5 454597 Bhadumra 331.69 172 827 437 390 129 73 56 454598 Pitsura 249.65 113 587 317 270 74 40 34 454599 Kamthara 168.55 121 552 302 250 70 45 25 454600 Chakkabu 413.00 16 92 58 34 14 10 4 454601 Bhairar 169.25 10 55 28 27 6 4 2 454602 Pachara 424.68 60 308 164 144 42 20 22 454603 Govindpur 748.77 357 1,779 951 828 281 150 131 454604 Ramsagar 444.97 290 1,423 750 673 194 115 79 454605 Jakhoriya 198.67 134 626 333 293 96 51 45 454606 Ghutari 47.96454607 Vijaipur 136.74 46 291 151 140 34 17 17 454608 Richhari 193.35 182 1,013 554 459 129 63 66 454609 Murera 201.44 405 2,102 1,104 998 301 154 147 454610 Mahewa 285.54 158 821 426 395 103 52 51 454611 Rampura Dang 160.37 17 87 54 33 13 9 4 454612 Mudeni 33.11454613 Sitapur 804.53 465 2,287 1,207 1,080 326 181 145 454614 Taraua 219.92 14 35 18 17 7 2 5 454615 Samroli 48.26 45 227 116 111 32 20 12 454616 Sinawal 507.54 369 1,592 832 760 224 121 103 454617 Sewni 353.25 114 582 304 278 68 37 31 454618 Sunar 360.46 109 511 277 234 64 38 26 454619 Bhiti 240.33 117 465 250 215 58 35 23 454620 Erai 916.24 453 1,717 938 779 223 123 100 454621 Saipura 58.32 57 287 146 141 39 21 18 454622 Bargaon 945.30 590 2,371 1,283 1,088 334 185 149 454623 Raipura 135.93 55 305 169 136 43 25 18 454624 Bamrol 185.39 151 673 363 310 121 60 61 454625 Rawari 719.59 360 1,753 935 818 243 127 116 454626 Nandpur 211.72 75 359 204 155 44 22 22 454627 Uprain 906.77 614 2,576 1,383 1,193 433 242 191 454628 Dabrabag 229.25 107 427 226 201 66 40 26 454629 Malokpahadi 241.00 144 692 380 312 104 69 35 454630 Behruka 466.20 236 1,022 556 466 134 72 62 454631 Badera 512.99 292 1,470 775 695 191 104 87 454632 Banoli 298.15 290 1,083 554 529 165 78 87 454633 Baroy 375.28 188 818 434 384 113 58 55 454634 Dongarpur 505.41 233 1,130 630 500 186 111 75 454635 Lidhora 285.77 163 674 371 303 94 47 47
Name of Village
Location code
number
Total population (including institutional and houseless
population)Area of
Village in hectares
Number of households
C D Block -
Population in the age-group 0-6
-------------Un-inhabited--------------
-------------Un-inhabited--------------
78
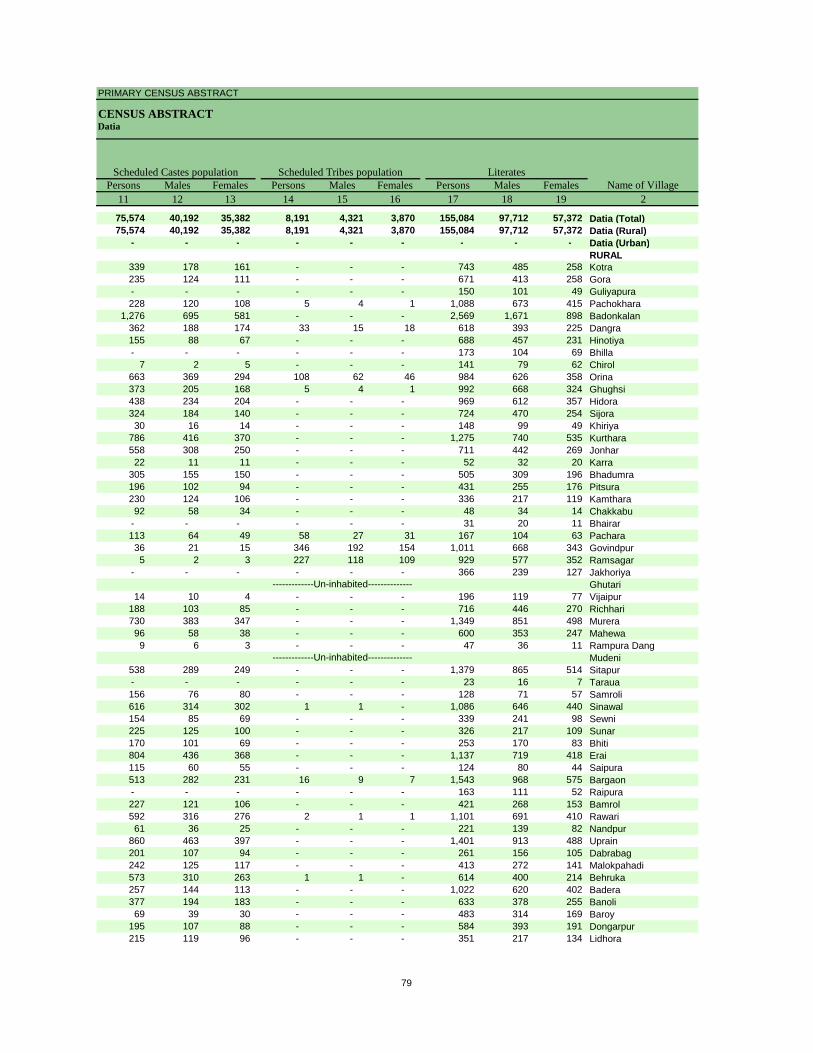
PRIMARY CENSUS ABSTRACT
CENSUS ABSTRACTDatia
Persons Males Females Persons Males Females Persons Males Females11 12 13 14 15 16 17 18 19 2
75,574 40,192 35,382 8,191 4,321 3,870 155,084 97,712 57,372 Datia (Total)75,574 40,192 35,382 8,191 4,321 3,870 155,084 97,712 57,372 Datia (Rural)
- - - - - - - - - Datia (Urban)RURAL
339 178 161 - - - 743 485 258 Kotra235 124 111 - - - 671 413 258 Gora- - - - - - 150 101 49 Guliyapura228 120 108 5 4 1 1,088 673 415 Pachokhara
1,276 695 581 - - - 2,569 1,671 898 Badonkalan362 188 174 33 15 18 618 393 225 Dangra155 88 67 - - - 688 457 231 Hinotiya- - - - - - 173 104 69 Bhilla
7 2 5 - - - 141 79 62 Chirol663 369 294 108 62 46 984 626 358 Orina373 205 168 5 4 1 992 668 324 Ghughsi438 234 204 - - - 969 612 357 Hidora324 184 140 - - - 724 470 254 Sijora30 16 14 - - - 148 99 49 Khiriya
786 416 370 - - - 1,275 740 535 Kurthara558 308 250 - - - 711 442 269 Jonhar22 11 11 - - - 52 32 20 Karra
305 155 150 - - - 505 309 196 Bhadumra196 102 94 - - - 431 255 176 Pitsura230 124 106 - - - 336 217 119 Kamthara92 58 34 - - - 48 34 14 Chakkabu
- - - - - - 31 20 11 Bhairar113 64 49 58 27 31 167 104 63 Pachara36 21 15 346 192 154 1,011 668 343 Govindpur5 2 3 227 118 109 929 577 352 Ramsagar
- - - - - - 366 239 127 JakhoriyaGhutari
14 10 4 - - - 196 119 77 Vijaipur188 103 85 - - - 716 446 270 Richhari730 383 347 - - - 1,349 851 498 Murera96 58 38 - - - 600 353 247 Mahewa9 6 3 - - - 47 36 11 Rampura Dang
Mudeni538 289 249 - - - 1,379 865 514 Sitapur- - - - - - 23 16 7 Taraua156 76 80 - - - 128 71 57 Samroli616 314 302 1 1 - 1,086 646 440 Sinawal154 85 69 - - - 339 241 98 Sewni225 125 100 - - - 326 217 109 Sunar170 101 69 - - - 253 170 83 Bhiti804 436 368 - - - 1,137 719 418 Erai115 60 55 - - - 124 80 44 Saipura513 282 231 16 9 7 1,543 968 575 Bargaon- - - - - - 163 111 52 Raipura227 121 106 - - - 421 268 153 Bamrol592 316 276 2 1 1 1,101 691 410 Rawari61 36 25 - - - 221 139 82 Nandpur
860 463 397 - - - 1,401 913 488 Uprain201 107 94 - - - 261 156 105 Dabrabag242 125 117 - - - 413 272 141 Malokpahadi573 310 263 1 1 - 614 400 214 Behruka257 144 113 - - - 1,022 620 402 Badera377 194 183 - - - 633 378 255 Banoli69 39 30 - - - 483 314 169 Baroy
195 107 88 - - - 584 393 191 Dongarpur215 119 96 - - - 351 217 134 Lidhora
Name of VillageLiteratesScheduled Castes population Scheduled Tribes population
-------------Un-inhabited--------------
-------------Un-inhabited--------------
79
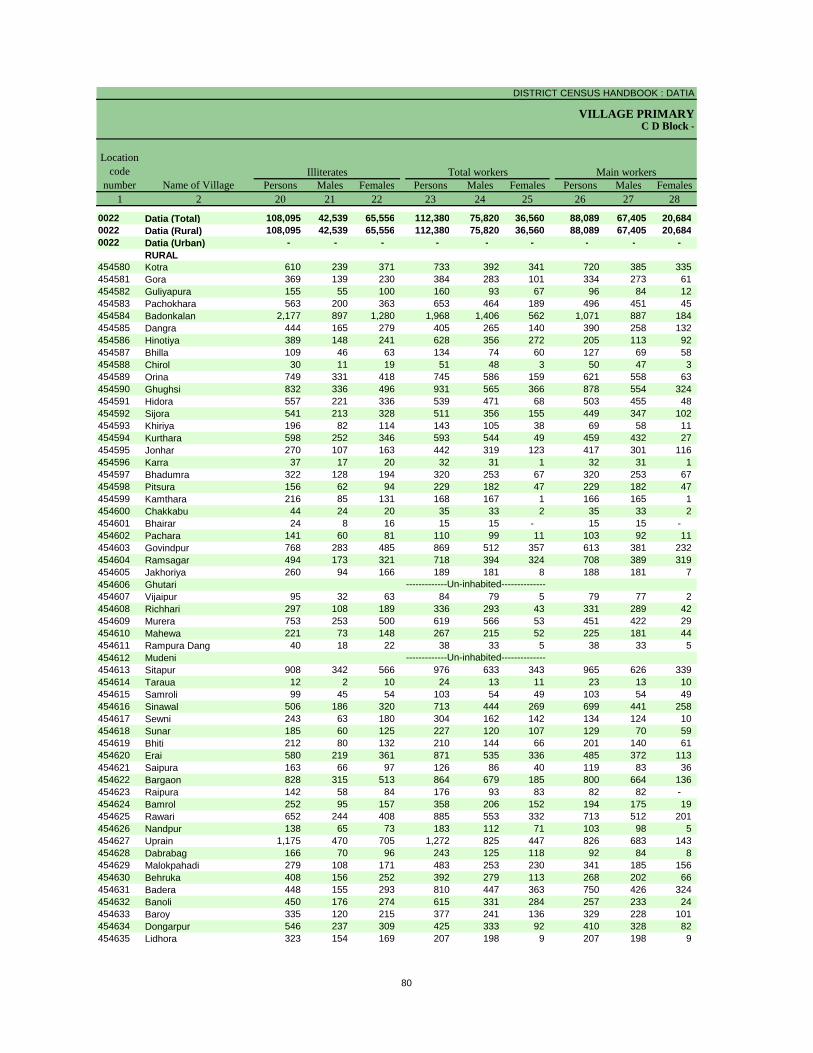
DISTRICT CENSUS HANDBOOK : DATIA
VILLAGE PRIMARYC D Block -
Persons Males Females Persons Males Females Persons Males Females1 2 20 21 22 23 24 25 26 27 28
0022 Datia (Total) 108,095 42,539 65,556 112,380 75,820 36,560 88,089 67,405 20,684 0022 Datia (Rural) 108,095 42,539 65,556 112,380 75,820 36,560 88,089 67,405 20,684 0022 Datia (Urban) - - - - - - - - -
RURAL454580 Kotra 610 239 371 733 392 341 720 385 335 454581 Gora 369 139 230 384 283 101 334 273 61 454582 Guliyapura 155 55 100 160 93 67 96 84 12 454583 Pachokhara 563 200 363 653 464 189 496 451 45 454584 Badonkalan 2,177 897 1,280 1,968 1,406 562 1,071 887 184 454585 Dangra 444 165 279 405 265 140 390 258 132 454586 Hinotiya 389 148 241 628 356 272 205 113 92 454587 Bhilla 109 46 63 134 74 60 127 69 58 454588 Chirol 30 11 19 51 48 3 50 47 3 454589 Orina 749 331 418 745 586 159 621 558 63 454590 Ghughsi 832 336 496 931 565 366 878 554 324 454591 Hidora 557 221 336 539 471 68 503 455 48 454592 Sijora 541 213 328 511 356 155 449 347 102 454593 Khiriya 196 82 114 143 105 38 69 58 11 454594 Kurthara 598 252 346 593 544 49 459 432 27 454595 Jonhar 270 107 163 442 319 123 417 301 116 454596 Karra 37 17 20 32 31 1 32 31 1 454597 Bhadumra 322 128 194 320 253 67 320 253 67 454598 Pitsura 156 62 94 229 182 47 229 182 47 454599 Kamthara 216 85 131 168 167 1 166 165 1 454600 Chakkabu 44 24 20 35 33 2 35 33 2 454601 Bhairar 24 8 16 15 15 - 15 15 - 454602 Pachara 141 60 81 110 99 11 103 92 11 454603 Govindpur 768 283 485 869 512 357 613 381 232 454604 Ramsagar 494 173 321 718 394 324 708 389 319 454605 Jakhoriya 260 94 166 189 181 8 188 181 7 454606 Ghutari454607 Vijaipur 95 32 63 84 79 5 79 77 2 454608 Richhari 297 108 189 336 293 43 331 289 42 454609 Murera 753 253 500 619 566 53 451 422 29 454610 Mahewa 221 73 148 267 215 52 225 181 44 454611 Rampura Dang 40 18 22 38 33 5 38 33 5 454612 Mudeni454613 Sitapur 908 342 566 976 633 343 965 626 339 454614 Taraua 12 2 10 24 13 11 23 13 10 454615 Samroli 99 45 54 103 54 49 103 54 49 454616 Sinawal 506 186 320 713 444 269 699 441 258 454617 Sewni 243 63 180 304 162 142 134 124 10 454618 Sunar 185 60 125 227 120 107 129 70 59 454619 Bhiti 212 80 132 210 144 66 201 140 61 454620 Erai 580 219 361 871 535 336 485 372 113 454621 Saipura 163 66 97 126 86 40 119 83 36 454622 Bargaon 828 315 513 864 679 185 800 664 136 454623 Raipura 142 58 84 176 93 83 82 82 - 454624 Bamrol 252 95 157 358 206 152 194 175 19 454625 Rawari 652 244 408 885 553 332 713 512 201 454626 Nandpur 138 65 73 183 112 71 103 98 5 454627 Uprain 1,175 470 705 1,272 825 447 826 683 143 454628 Dabrabag 166 70 96 243 125 118 92 84 8 454629 Malokpahadi 279 108 171 483 253 230 341 185 156 454630 Behruka 408 156 252 392 279 113 268 202 66 454631 Badera 448 155 293 810 447 363 750 426 324 454632 Banoli 450 176 274 615 331 284 257 233 24 454633 Baroy 335 120 215 377 241 136 329 228 101 454634 Dongarpur 546 237 309 425 333 92 410 328 82 454635 Lidhora 323 154 169 207 198 9 207 198 9
Name of Village
Location code
numberIlliterates Total workers Main workers
-------------Un-inhabited--------------
-------------Un-inhabited--------------
80
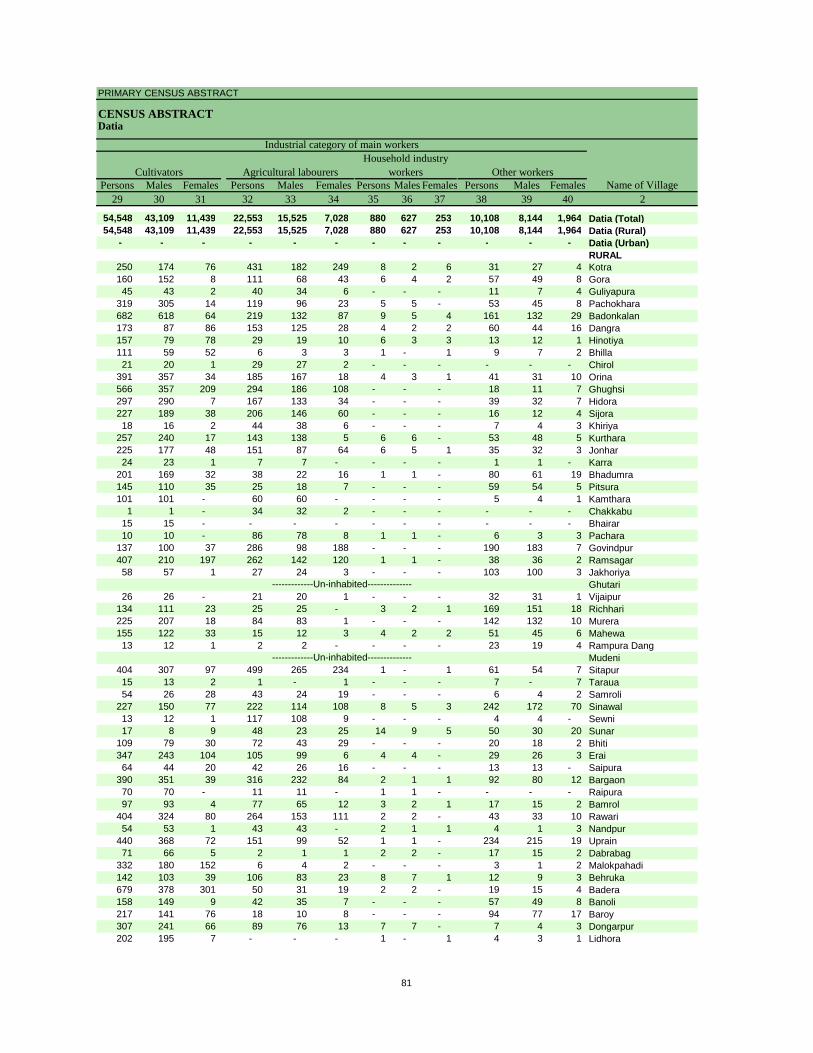
PRIMARY CENSUS ABSTRACT
CENSUS ABSTRACTDatia
Persons Males Females Persons Males Females Persons Males Females Persons Males Females29 30 31 32 33 34 35 36 37 38 39 40 2
54,548 43,109 11,439 22,553 15,525 7,028 880 627 253 10,108 8,144 1,964 Datia (Total)54,548 43,109 11,439 22,553 15,525 7,028 880 627 253 10,108 8,144 1,964 Datia (Rural)
- - - - - - - - - - - - Datia (Urban)RURAL
250 174 76 431 182 249 8 2 6 31 27 4 Kotra160 152 8 111 68 43 6 4 2 57 49 8 Gora45 43 2 40 34 6 - - - 11 7 4 Guliyapura
319 305 14 119 96 23 5 5 - 53 45 8 Pachokhara682 618 64 219 132 87 9 5 4 161 132 29 Badonkalan173 87 86 153 125 28 4 2 2 60 44 16 Dangra157 79 78 29 19 10 6 3 3 13 12 1 Hinotiya111 59 52 6 3 3 1 - 1 9 7 2 Bhilla21 20 1 29 27 2 - - - - - - Chirol
391 357 34 185 167 18 4 3 1 41 31 10 Orina566 357 209 294 186 108 - - - 18 11 7 Ghughsi297 290 7 167 133 34 - - - 39 32 7 Hidora227 189 38 206 146 60 - - - 16 12 4 Sijora18 16 2 44 38 6 - - - 7 4 3 Khiriya
257 240 17 143 138 5 6 6 - 53 48 5 Kurthara225 177 48 151 87 64 6 5 1 35 32 3 Jonhar24 23 1 7 7 - - - - 1 1 - Karra
201 169 32 38 22 16 1 1 - 80 61 19 Bhadumra145 110 35 25 18 7 - - - 59 54 5 Pitsura101 101 - 60 60 - - - - 5 4 1 Kamthara
1 1 - 34 32 2 - - - - - - Chakkabu15 15 - - - - - - - - - - Bhairar10 10 - 86 78 8 1 1 - 6 3 3 Pachara
137 100 37 286 98 188 - - - 190 183 7 Govindpur407 210 197 262 142 120 1 1 - 38 36 2 Ramsagar58 57 1 27 24 3 - - - 103 100 3 Jakhoriya
Ghutari26 26 - 21 20 1 - - - 32 31 1 Vijaipur
134 111 23 25 25 - 3 2 1 169 151 18 Richhari225 207 18 84 83 1 - - - 142 132 10 Murera155 122 33 15 12 3 4 2 2 51 45 6 Mahewa13 12 1 2 2 - - - - 23 19 4 Rampura Dang
Mudeni404 307 97 499 265 234 1 - 1 61 54 7 Sitapur15 13 2 1 - 1 - - - 7 - 7 Taraua54 26 28 43 24 19 - - - 6 4 2 Samroli
227 150 77 222 114 108 8 5 3 242 172 70 Sinawal13 12 1 117 108 9 - - - 4 4 - Sewni17 8 9 48 23 25 14 9 5 50 30 20 Sunar
109 79 30 72 43 29 - - - 20 18 2 Bhiti347 243 104 105 99 6 4 4 - 29 26 3 Erai64 44 20 42 26 16 - - - 13 13 - Saipura
390 351 39 316 232 84 2 1 1 92 80 12 Bargaon70 70 - 11 11 - 1 1 - - - - Raipura97 93 4 77 65 12 3 2 1 17 15 2 Bamrol
404 324 80 264 153 111 2 2 - 43 33 10 Rawari54 53 1 43 43 - 2 1 1 4 1 3 Nandpur
440 368 72 151 99 52 1 1 - 234 215 19 Uprain71 66 5 2 1 1 2 2 - 17 15 2 Dabrabag
332 180 152 6 4 2 - - - 3 1 2 Malokpahadi142 103 39 106 83 23 8 7 1 12 9 3 Behruka679 378 301 50 31 19 2 2 - 19 15 4 Badera158 149 9 42 35 7 - - - 57 49 8 Banoli217 141 76 18 10 8 - - - 94 77 17 Baroy307 241 66 89 76 13 7 7 - 7 4 3 Dongarpur202 195 7 - - - 1 - 1 4 3 1 Lidhora
CultivatorsName of Village
Household industry workersAgricultural labourers
Industrial category of main workers
Other workers
-------------Un-inhabited--------------
-------------Un-inhabited--------------
81
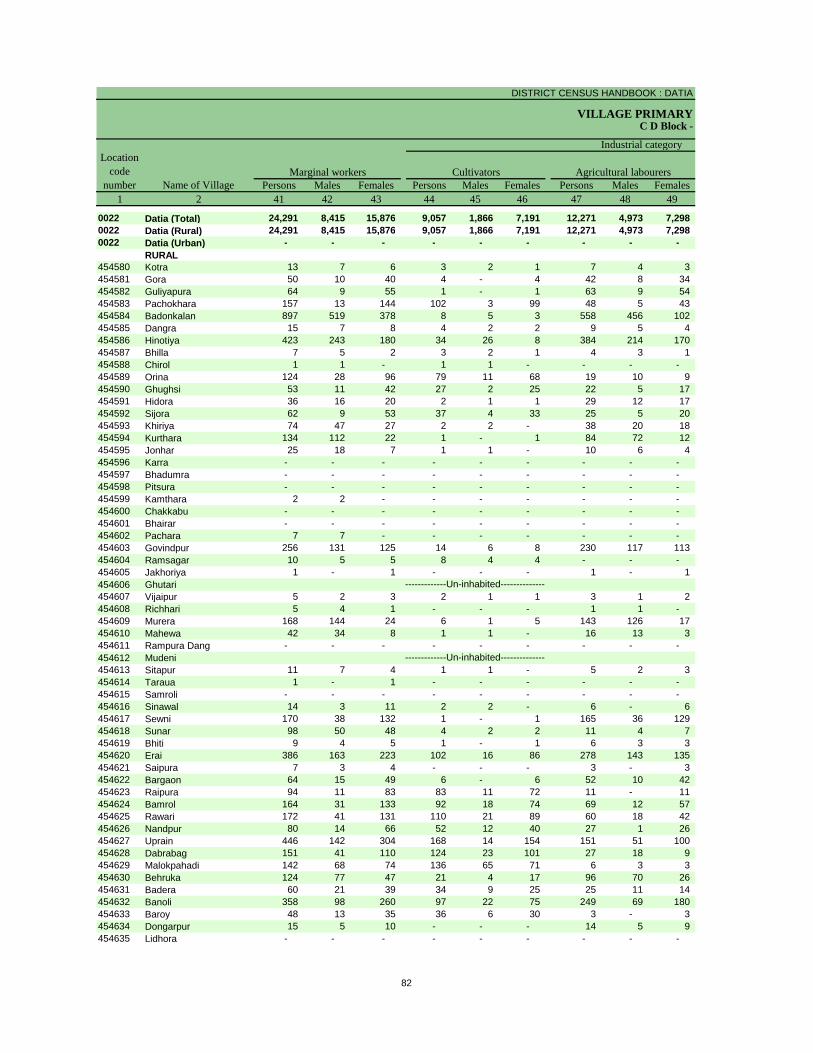
DISTRICT CENSUS HANDBOOK : DATIA
VILLAGE PRIMARYC D Block -
Persons Males Females Persons Males Females Persons Males Females1 2 41 42 43 44 45 46 47 48 49
0022 Datia (Total) 24,291 8,415 15,876 9,057 1,866 7,191 12,271 4,973 7,298 0022 Datia (Rural) 24,291 8,415 15,876 9,057 1,866 7,191 12,271 4,973 7,298 0022 Datia (Urban) - - - - - - - - -
RURAL454580 Kotra 13 7 6 3 2 1 7 4 3 454581 Gora 50 10 40 4 - 4 42 8 34 454582 Guliyapura 64 9 55 1 - 1 63 9 54 454583 Pachokhara 157 13 144 102 3 99 48 5 43 454584 Badonkalan 897 519 378 8 5 3 558 456 102 454585 Dangra 15 7 8 4 2 2 9 5 4 454586 Hinotiya 423 243 180 34 26 8 384 214 170 454587 Bhilla 7 5 2 3 2 1 4 3 1 454588 Chirol 1 1 - 1 1 - - - - 454589 Orina 124 28 96 79 11 68 19 10 9 454590 Ghughsi 53 11 42 27 2 25 22 5 17 454591 Hidora 36 16 20 2 1 1 29 12 17 454592 Sijora 62 9 53 37 4 33 25 5 20 454593 Khiriya 74 47 27 2 2 - 38 20 18 454594 Kurthara 134 112 22 1 - 1 84 72 12 454595 Jonhar 25 18 7 1 1 - 10 6 4 454596 Karra - - - - - - - - - 454597 Bhadumra - - - - - - - - - 454598 Pitsura - - - - - - - - - 454599 Kamthara 2 2 - - - - - - - 454600 Chakkabu - - - - - - - - - 454601 Bhairar - - - - - - - - - 454602 Pachara 7 7 - - - - - - - 454603 Govindpur 256 131 125 14 6 8 230 117 113 454604 Ramsagar 10 5 5 8 4 4 - - - 454605 Jakhoriya 1 - 1 - - - 1 - 1 454606 Ghutari454607 Vijaipur 5 2 3 2 1 1 3 1 2 454608 Richhari 5 4 1 - - - 1 1 - 454609 Murera 168 144 24 6 1 5 143 126 17 454610 Mahewa 42 34 8 1 1 - 16 13 3 454611 Rampura Dang - - - - - - - - - 454612 Mudeni454613 Sitapur 11 7 4 1 1 - 5 2 3 454614 Taraua 1 - 1 - - - - - - 454615 Samroli - - - - - - - - - 454616 Sinawal 14 3 11 2 2 - 6 - 6 454617 Sewni 170 38 132 1 - 1 165 36 129 454618 Sunar 98 50 48 4 2 2 11 4 7 454619 Bhiti 9 4 5 1 - 1 6 3 3 454620 Erai 386 163 223 102 16 86 278 143 135 454621 Saipura 7 3 4 - - - 3 - 3 454622 Bargaon 64 15 49 6 - 6 52 10 42 454623 Raipura 94 11 83 83 11 72 11 - 11 454624 Bamrol 164 31 133 92 18 74 69 12 57 454625 Rawari 172 41 131 110 21 89 60 18 42 454626 Nandpur 80 14 66 52 12 40 27 1 26 454627 Uprain 446 142 304 168 14 154 151 51 100 454628 Dabrabag 151 41 110 124 23 101 27 18 9 454629 Malokpahadi 142 68 74 136 65 71 6 3 3 454630 Behruka 124 77 47 21 4 17 96 70 26 454631 Badera 60 21 39 34 9 25 25 11 14 454632 Banoli 358 98 260 97 22 75 249 69 180 454633 Baroy 48 13 35 36 6 30 3 - 3 454634 Dongarpur 15 5 10 - - - 14 5 9 454635 Lidhora - - - - - - - - -
Name of VillageMarginal workers Cultivators Agricultural labourers
Industrial category Location
code number
-------------Un-inhabited--------------
-------------Un-inhabited--------------
82
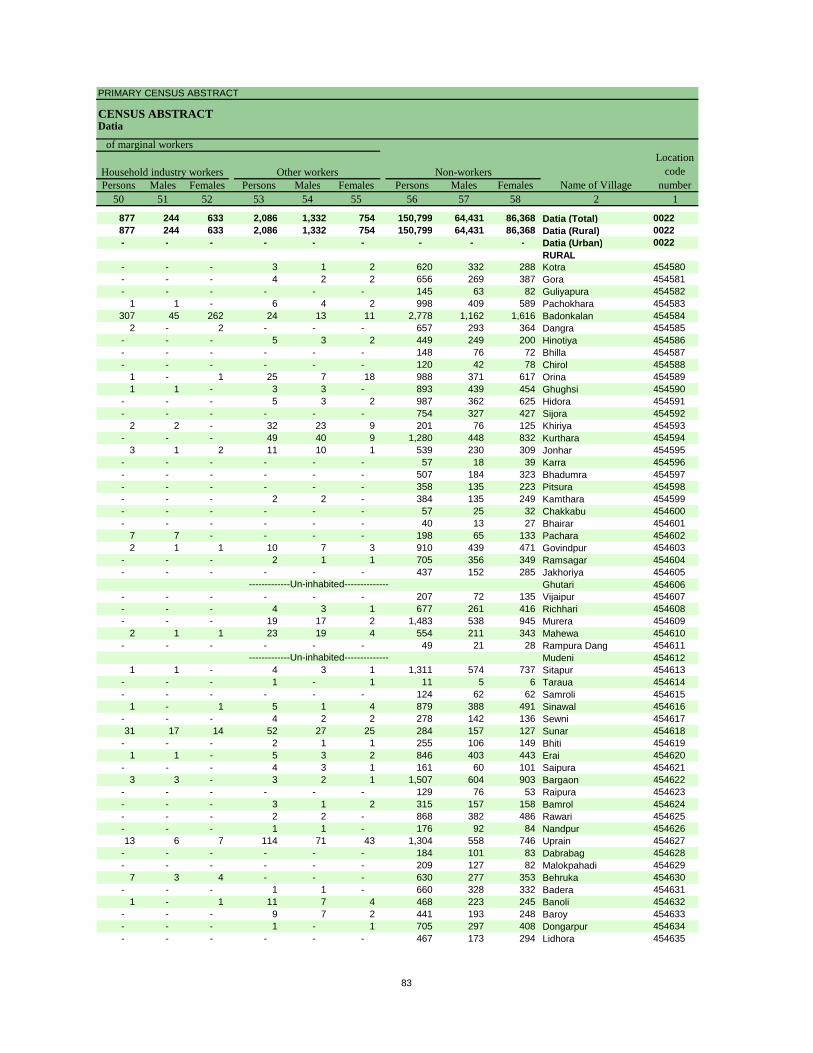
PRIMARY CENSUS ABSTRACT
CENSUS ABSTRACTDatia
Persons Males Females Persons Males Females Persons Males Females50 51 52 53 54 55 56 57 58 2 1
877 244 633 2,086 1,332 754 150,799 64,431 86,368 Datia (Total) 0022877 244 633 2,086 1,332 754 150,799 64,431 86,368 Datia (Rural) 0022- - - - - - - - - Datia (Urban) 0022
RURAL- - - 3 1 2 620 332 288 Kotra 454580- - - 4 2 2 656 269 387 Gora 454581- - - - - - 145 63 82 Guliyapura 454582
1 1 - 6 4 2 998 409 589 Pachokhara 454583307 45 262 24 13 11 2,778 1,162 1,616 Badonkalan 454584
2 - 2 - - - 657 293 364 Dangra 454585- - - 5 3 2 449 249 200 Hinotiya 454586- - - - - - 148 76 72 Bhilla 454587- - - - - - 120 42 78 Chirol 454588
1 - 1 25 7 18 988 371 617 Orina 4545891 1 - 3 3 - 893 439 454 Ghughsi 454590
- - - 5 3 2 987 362 625 Hidora 454591- - - - - - 754 327 427 Sijora 454592
2 2 - 32 23 9 201 76 125 Khiriya 454593- - - 49 40 9 1,280 448 832 Kurthara 454594
3 1 2 11 10 1 539 230 309 Jonhar 454595- - - - - - 57 18 39 Karra 454596- - - - - - 507 184 323 Bhadumra 454597- - - - - - 358 135 223 Pitsura 454598- - - 2 2 - 384 135 249 Kamthara 454599- - - - - - 57 25 32 Chakkabu 454600- - - - - - 40 13 27 Bhairar 454601
7 7 - - - - 198 65 133 Pachara 4546022 1 1 10 7 3 910 439 471 Govindpur 454603
- - - 2 1 1 705 356 349 Ramsagar 454604- - - - - - 437 152 285 Jakhoriya 454605
Ghutari 454606- - - - - - 207 72 135 Vijaipur 454607- - - 4 3 1 677 261 416 Richhari 454608- - - 19 17 2 1,483 538 945 Murera 454609
2 1 1 23 19 4 554 211 343 Mahewa 454610- - - - - - 49 21 28 Rampura Dang 454611
Mudeni 4546121 1 - 4 3 1 1,311 574 737 Sitapur 454613
- - - 1 - 1 11 5 6 Taraua 454614- - - - - - 124 62 62 Samroli 454615
1 - 1 5 1 4 879 388 491 Sinawal 454616- - - 4 2 2 278 142 136 Sewni 45461731 17 14 52 27 25 284 157 127 Sunar 454618
- - - 2 1 1 255 106 149 Bhiti 4546191 1 - 5 3 2 846 403 443 Erai 454620
- - - 4 3 1 161 60 101 Saipura 4546213 3 - 3 2 1 1,507 604 903 Bargaon 454622
- - - - - - 129 76 53 Raipura 454623- - - 3 1 2 315 157 158 Bamrol 454624- - - 2 2 - 868 382 486 Rawari 454625- - - 1 1 - 176 92 84 Nandpur 45462613 6 7 114 71 43 1,304 558 746 Uprain 454627
- - - - - - 184 101 83 Dabrabag 454628- - - - - - 209 127 82 Malokpahadi 454629
7 3 4 - - - 630 277 353 Behruka 454630- - - 1 1 - 660 328 332 Badera 454631
1 - 1 11 7 4 468 223 245 Banoli 454632- - - 9 7 2 441 193 248 Baroy 454633- - - 1 - 1 705 297 408 Dongarpur 454634- - - - - - 467 173 294 Lidhora 454635
Location code
numberHousehold industry workers
Name of VillageOther workers Non-workers
of marginal workers
-------------Un-inhabited--------------
-------------Un-inhabited--------------
83
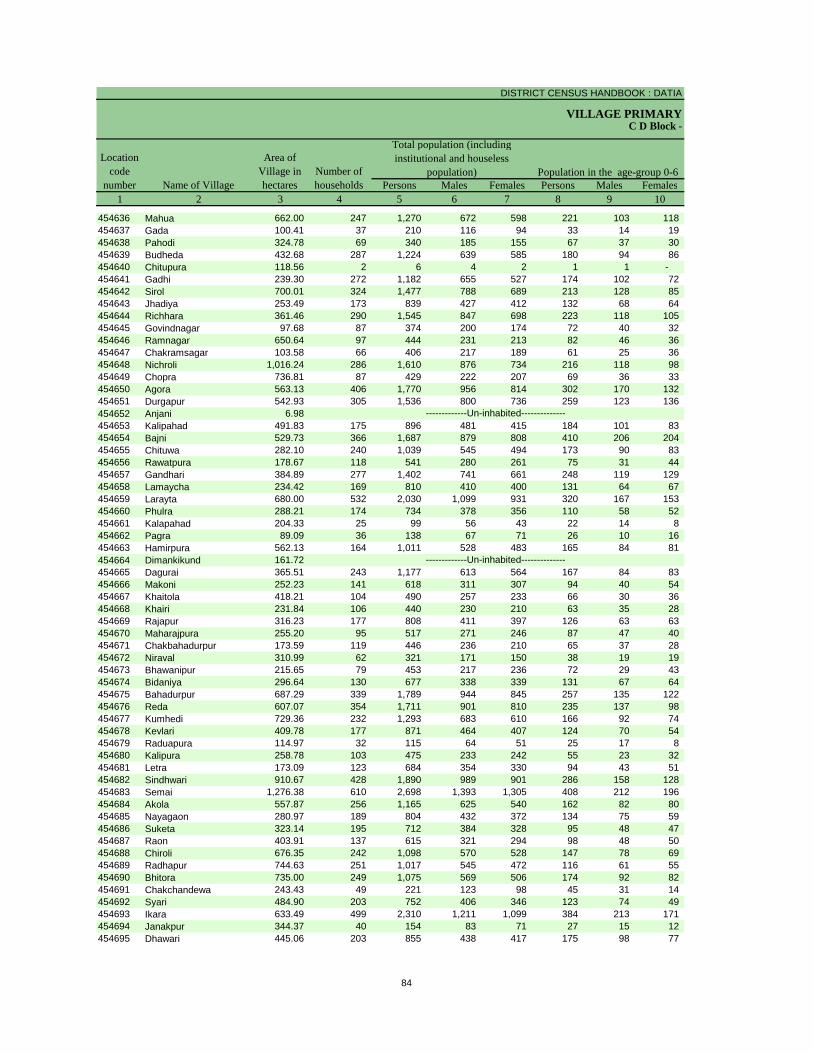
DISTRICT CENSUS HANDBOOK : DATIA
VILLAGE PRIMARY
Persons Males Females Persons Males Females1 2 3 4 5 6 7 8 9 10
Name of Village
Location code
number
Total population (including institutional and houseless
population)Area of
Village in hectares
Number of households
C D Block -
Population in the age-group 0-6
454636 Mahua 662.00 247 1,270 672 598 221 103 118 454637 Gada 100.41 37 210 116 94 33 14 19 454638 Pahodi 324.78 69 340 185 155 67 37 30 454639 Budheda 432.68 287 1,224 639 585 180 94 86 454640 Chitupura 118.56 2 6 4 2 1 1 - 454641 Gadhi 239.30 272 1,182 655 527 174 102 72 454642 Sirol 700.01 324 1,477 788 689 213 128 85 454643 Jhadiya 253.49 173 839 427 412 132 68 64 454644 Richhara 361.46 290 1,545 847 698 223 118 105 454645 Govindnagar 97.68 87 374 200 174 72 40 32 454646 Ramnagar 650.64 97 444 231 213 82 46 36 454647 Chakramsagar 103.58 66 406 217 189 61 25 36 454648 Nichroli 1,016.24 286 1,610 876 734 216 118 98 454649 Chopra 736.81 87 429 222 207 69 36 33 454650 Agora 563.13 406 1,770 956 814 302 170 132 454651 Durgapur 542.93 305 1,536 800 736 259 123 136 454652 Anjani 6.98454653 Kalipahad 491.83 175 896 481 415 184 101 83 454654 Bajni 529.73 366 1,687 879 808 410 206 204 454655 Chituwa 282.10 240 1,039 545 494 173 90 83 454656 Rawatpura 178.67 118 541 280 261 75 31 44 454657 Gandhari 384.89 277 1,402 741 661 248 119 129 454658 Lamaycha 234.42 169 810 410 400 131 64 67 454659 Larayta 680.00 532 2,030 1,099 931 320 167 153 454660 Phulra 288.21 174 734 378 356 110 58 52 454661 Kalapahad 204.33 25 99 56 43 22 14 8 454662 Pagra 89.09 36 138 67 71 26 10 16 454663 Hamirpura 562.13 164 1,011 528 483 165 84 81 454664 Dimankikund 161.72454665 Dagurai 365.51 243 1,177 613 564 167 84 83 454666 Makoni 252.23 141 618 311 307 94 40 54 454667 Khaitola 418.21 104 490 257 233 66 30 36 454668 Khairi 231.84 106 440 230 210 63 35 28 454669 Rajapur 316.23 177 808 411 397 126 63 63 454670 Maharajpura 255.20 95 517 271 246 87 47 40 454671 Chakbahadurpur 173.59 119 446 236 210 65 37 28 454672 Niraval 310.99 62 321 171 150 38 19 19 454673 Bhawanipur 215.65 79 453 217 236 72 29 43 454674 Bidaniya 296.64 130 677 338 339 131 67 64 454675 Bahadurpur 687.29 339 1,789 944 845 257 135 122 454676 Reda 607.07 354 1,711 901 810 235 137 98 454677 Kumhedi 729.36 232 1,293 683 610 166 92 74 454678 Kevlari 409.78 177 871 464 407 124 70 54 454679 Raduapura 114.97 32 115 64 51 25 17 8 454680 Kalipura 258.78 103 475 233 242 55 23 32 454681 Letra 173.09 123 684 354 330 94 43 51 454682 Sindhwari 910.67 428 1,890 989 901 286 158 128 454683 Semai 1,276.38 610 2,698 1,393 1,305 408 212 196 454684 Akola 557.87 256 1,165 625 540 162 82 80 454685 Nayagaon 280.97 189 804 432 372 134 75 59 454686 Suketa 323.14 195 712 384 328 95 48 47 454687 Raon 403.91 137 615 321 294 98 48 50 454688 Chiroli 676.35 242 1,098 570 528 147 78 69 454689 Radhapur 744.63 251 1,017 545 472 116 61 55 454690 Bhitora 735.00 249 1,075 569 506 174 92 82 454691 Chakchandewa 243.43 49 221 123 98 45 31 14 454692 Syari 484.90 203 752 406 346 123 74 49 454693 Ikara 633.49 499 2,310 1,211 1,099 384 213 171 454694 Janakpur 344.37 40 154 83 71 27 15 12 454695 Dhawari 445.06 203 855 438 417 175 98 77
-------------Un-inhabited--------------
-------------Un-inhabited--------------
84
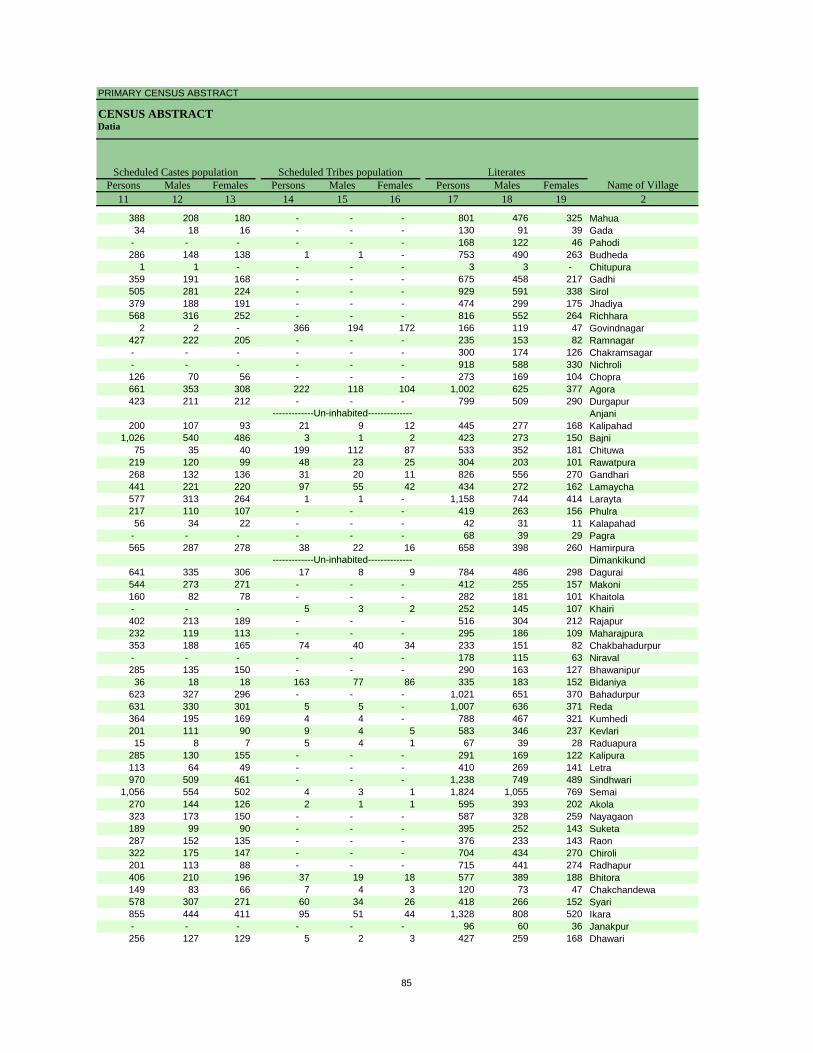
PRIMARY CENSUS ABSTRACT
CENSUS ABSTRACTDatia
Persons Males Females Persons Males Females Persons Males Females11 12 13 14 15 16 17 18 19 2
Name of VillageLiteratesScheduled Castes population Scheduled Tribes population
388 208 180 - - - 801 476 325 Mahua34 18 16 - - - 130 91 39 Gada
- - - - - - 168 122 46 Pahodi286 148 138 1 1 - 753 490 263 Budheda
1 1 - - - - 3 3 - Chitupura359 191 168 - - - 675 458 217 Gadhi505 281 224 - - - 929 591 338 Sirol379 188 191 - - - 474 299 175 Jhadiya568 316 252 - - - 816 552 264 Richhara
2 2 - 366 194 172 166 119 47 Govindnagar427 222 205 - - - 235 153 82 Ramnagar- - - - - - 300 174 126 Chakramsagar- - - - - - 918 588 330 Nichroli126 70 56 - - - 273 169 104 Chopra661 353 308 222 118 104 1,002 625 377 Agora423 211 212 - - - 799 509 290 Durgapur
Anjani200 107 93 21 9 12 445 277 168 Kalipahad
1,026 540 486 3 1 2 423 273 150 Bajni75 35 40 199 112 87 533 352 181 Chituwa
219 120 99 48 23 25 304 203 101 Rawatpura268 132 136 31 20 11 826 556 270 Gandhari441 221 220 97 55 42 434 272 162 Lamaycha577 313 264 1 1 - 1,158 744 414 Larayta217 110 107 - - - 419 263 156 Phulra56 34 22 - - - 42 31 11 Kalapahad
- - - - - - 68 39 29 Pagra565 287 278 38 22 16 658 398 260 Hamirpura
Dimankikund641 335 306 17 8 9 784 486 298 Dagurai544 273 271 - - - 412 255 157 Makoni160 82 78 - - - 282 181 101 Khaitola- - - 5 3 2 252 145 107 Khairi402 213 189 - - - 516 304 212 Rajapur232 119 113 - - - 295 186 109 Maharajpura353 188 165 74 40 34 233 151 82 Chakbahadurpur- - - - - - 178 115 63 Niraval285 135 150 - - - 290 163 127 Bhawanipur36 18 18 163 77 86 335 183 152 Bidaniya
623 327 296 - - - 1,021 651 370 Bahadurpur631 330 301 5 5 - 1,007 636 371 Reda364 195 169 4 4 - 788 467 321 Kumhedi201 111 90 9 4 5 583 346 237 Kevlari15 8 7 5 4 1 67 39 28 Raduapura
285 130 155 - - - 291 169 122 Kalipura113 64 49 - - - 410 269 141 Letra970 509 461 - - - 1,238 749 489 Sindhwari
1,056 554 502 4 3 1 1,824 1,055 769 Semai270 144 126 2 1 1 595 393 202 Akola323 173 150 - - - 587 328 259 Nayagaon189 99 90 - - - 395 252 143 Suketa287 152 135 - - - 376 233 143 Raon322 175 147 - - - 704 434 270 Chiroli201 113 88 - - - 715 441 274 Radhapur406 210 196 37 19 18 577 389 188 Bhitora149 83 66 7 4 3 120 73 47 Chakchandewa578 307 271 60 34 26 418 266 152 Syari855 444 411 95 51 44 1,328 808 520 Ikara- - - - - - 96 60 36 Janakpur256 127 129 5 2 3 427 259 168 Dhawari
-------------Un-inhabited--------------
-------------Un-inhabited--------------
85
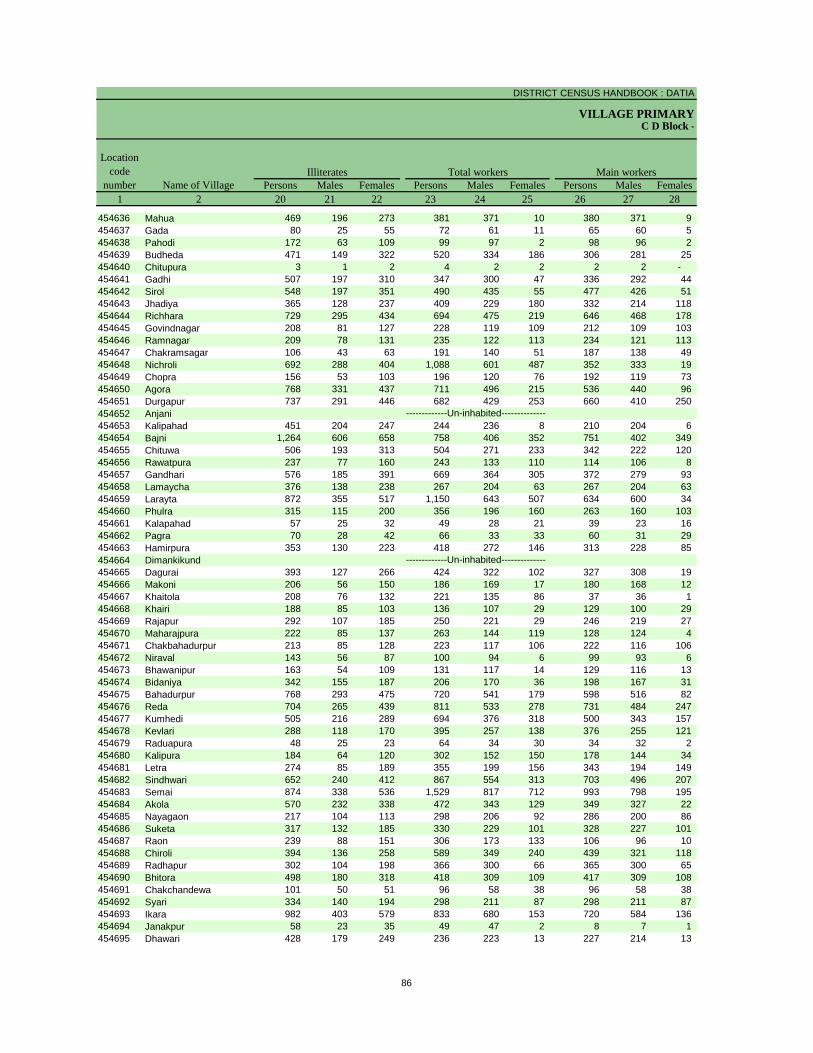
DISTRICT CENSUS HANDBOOK : DATIA
VILLAGE PRIMARYC D Block -
Persons Males Females Persons Males Females Persons Males Females1 2 20 21 22 23 24 25 26 27 28
Name of Village
Location code
numberIlliterates Total workers Main workers
454636 Mahua 469 196 273 381 371 10 380 371 9 454637 Gada 80 25 55 72 61 11 65 60 5 454638 Pahodi 172 63 109 99 97 2 98 96 2 454639 Budheda 471 149 322 520 334 186 306 281 25 454640 Chitupura 3 1 2 4 2 2 2 2 - 454641 Gadhi 507 197 310 347 300 47 336 292 44 454642 Sirol 548 197 351 490 435 55 477 426 51 454643 Jhadiya 365 128 237 409 229 180 332 214 118 454644 Richhara 729 295 434 694 475 219 646 468 178 454645 Govindnagar 208 81 127 228 119 109 212 109 103 454646 Ramnagar 209 78 131 235 122 113 234 121 113 454647 Chakramsagar 106 43 63 191 140 51 187 138 49 454648 Nichroli 692 288 404 1,088 601 487 352 333 19 454649 Chopra 156 53 103 196 120 76 192 119 73 454650 Agora 768 331 437 711 496 215 536 440 96 454651 Durgapur 737 291 446 682 429 253 660 410 250 454652 Anjani454653 Kalipahad 451 204 247 244 236 8 210 204 6 454654 Bajni 1,264 606 658 758 406 352 751 402 349 454655 Chituwa 506 193 313 504 271 233 342 222 120 454656 Rawatpura 237 77 160 243 133 110 114 106 8 454657 Gandhari 576 185 391 669 364 305 372 279 93 454658 Lamaycha 376 138 238 267 204 63 267 204 63 454659 Larayta 872 355 517 1,150 643 507 634 600 34 454660 Phulra 315 115 200 356 196 160 263 160 103 454661 Kalapahad 57 25 32 49 28 21 39 23 16 454662 Pagra 70 28 42 66 33 33 60 31 29 454663 Hamirpura 353 130 223 418 272 146 313 228 85 454664 Dimankikund454665 Dagurai 393 127 266 424 322 102 327 308 19 454666 Makoni 206 56 150 186 169 17 180 168 12 454667 Khaitola 208 76 132 221 135 86 37 36 1 454668 Khairi 188 85 103 136 107 29 129 100 29 454669 Rajapur 292 107 185 250 221 29 246 219 27 454670 Maharajpura 222 85 137 263 144 119 128 124 4 454671 Chakbahadurpur 213 85 128 223 117 106 222 116 106 454672 Niraval 143 56 87 100 94 6 99 93 6 454673 Bhawanipur 163 54 109 131 117 14 129 116 13 454674 Bidaniya 342 155 187 206 170 36 198 167 31 454675 Bahadurpur 768 293 475 720 541 179 598 516 82 454676 Reda 704 265 439 811 533 278 731 484 247 454677 Kumhedi 505 216 289 694 376 318 500 343 157 454678 Kevlari 288 118 170 395 257 138 376 255 121 454679 Raduapura 48 25 23 64 34 30 34 32 2 454680 Kalipura 184 64 120 302 152 150 178 144 34 454681 Letra 274 85 189 355 199 156 343 194 149 454682 Sindhwari 652 240 412 867 554 313 703 496 207 454683 Semai 874 338 536 1,529 817 712 993 798 195 454684 Akola 570 232 338 472 343 129 349 327 22 454685 Nayagaon 217 104 113 298 206 92 286 200 86 454686 Suketa 317 132 185 330 229 101 328 227 101 454687 Raon 239 88 151 306 173 133 106 96 10 454688 Chiroli 394 136 258 589 349 240 439 321 118 454689 Radhapur 302 104 198 366 300 66 365 300 65 454690 Bhitora 498 180 318 418 309 109 417 309 108 454691 Chakchandewa 101 50 51 96 58 38 96 58 38 454692 Syari 334 140 194 298 211 87 298 211 87 454693 Ikara 982 403 579 833 680 153 720 584 136 454694 Janakpur 58 23 35 49 47 2 8 7 1 454695 Dhawari 428 179 249 236 223 13 227 214 13
-------------Un-inhabited--------------
-------------Un-inhabited--------------
86
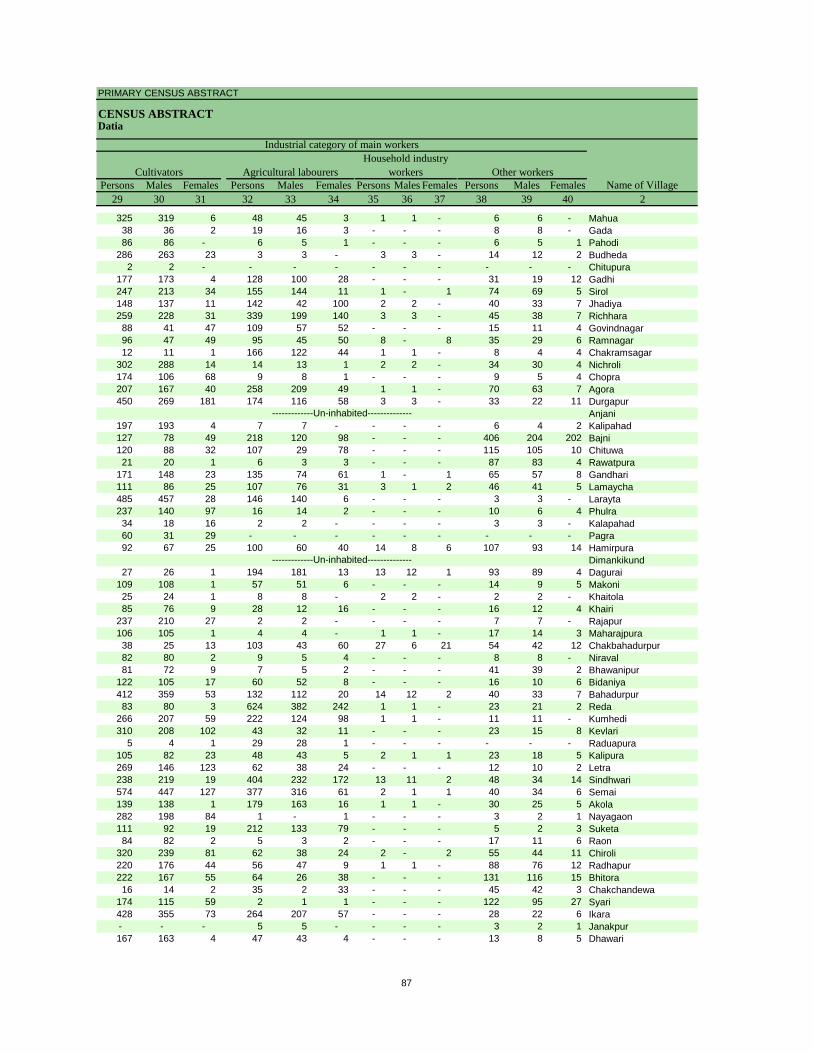
PRIMARY CENSUS ABSTRACT
CENSUS ABSTRACTDatia
Persons Males Females Persons Males Females Persons Males Females Persons Males Females29 30 31 32 33 34 35 36 37 38 39 40 2
CultivatorsName of Village
Household industry workersAgricultural labourers
Industrial category of main workers
Other workers
325 319 6 48 45 3 1 1 - 6 6 - Mahua38 36 2 19 16 3 - - - 8 8 - Gada86 86 - 6 5 1 - - - 6 5 1 Pahodi
286 263 23 3 3 - 3 3 - 14 12 2 Budheda2 2 - - - - - - - - - - Chitupura
177 173 4 128 100 28 - - - 31 19 12 Gadhi247 213 34 155 144 11 1 - 1 74 69 5 Sirol148 137 11 142 42 100 2 2 - 40 33 7 Jhadiya259 228 31 339 199 140 3 3 - 45 38 7 Richhara88 41 47 109 57 52 - - - 15 11 4 Govindnagar96 47 49 95 45 50 8 - 8 35 29 6 Ramnagar12 11 1 166 122 44 1 1 - 8 4 4 Chakramsagar
302 288 14 14 13 1 2 2 - 34 30 4 Nichroli174 106 68 9 8 1 - - - 9 5 4 Chopra207 167 40 258 209 49 1 1 - 70 63 7 Agora450 269 181 174 116 58 3 3 - 33 22 11 Durgapur
Anjani197 193 4 7 7 - - - - 6 4 2 Kalipahad127 78 49 218 120 98 - - - 406 204 202 Bajni120 88 32 107 29 78 - - - 115 105 10 Chituwa21 20 1 6 3 3 - - - 87 83 4 Rawatpura
171 148 23 135 74 61 1 - 1 65 57 8 Gandhari111 86 25 107 76 31 3 1 2 46 41 5 Lamaycha485 457 28 146 140 6 - - - 3 3 - Larayta237 140 97 16 14 2 - - - 10 6 4 Phulra34 18 16 2 2 - - - - 3 3 - Kalapahad60 31 29 - - - - - - - - - Pagra92 67 25 100 60 40 14 8 6 107 93 14 Hamirpura
Dimankikund27 26 1 194 181 13 13 12 1 93 89 4 Dagurai
109 108 1 57 51 6 - - - 14 9 5 Makoni25 24 1 8 8 - 2 2 - 2 2 - Khaitola85 76 9 28 12 16 - - - 16 12 4 Khairi
237 210 27 2 2 - - - - 7 7 - Rajapur106 105 1 4 4 - 1 1 - 17 14 3 Maharajpura38 25 13 103 43 60 27 6 21 54 42 12 Chakbahadurpur82 80 2 9 5 4 - - - 8 8 - Niraval81 72 9 7 5 2 - - - 41 39 2 Bhawanipur
122 105 17 60 52 8 - - - 16 10 6 Bidaniya412 359 53 132 112 20 14 12 2 40 33 7 Bahadurpur83 80 3 624 382 242 1 1 - 23 21 2 Reda
266 207 59 222 124 98 1 1 - 11 11 - Kumhedi310 208 102 43 32 11 - - - 23 15 8 Kevlari
5 4 1 29 28 1 - - - - - - Raduapura105 82 23 48 43 5 2 1 1 23 18 5 Kalipura269 146 123 62 38 24 - - - 12 10 2 Letra238 219 19 404 232 172 13 11 2 48 34 14 Sindhwari574 447 127 377 316 61 2 1 1 40 34 6 Semai139 138 1 179 163 16 1 1 - 30 25 5 Akola282 198 84 1 - 1 - - - 3 2 1 Nayagaon111 92 19 212 133 79 - - - 5 2 3 Suketa84 82 2 5 3 2 - - - 17 11 6 Raon
320 239 81 62 38 24 2 - 2 55 44 11 Chiroli220 176 44 56 47 9 1 1 - 88 76 12 Radhapur222 167 55 64 26 38 - - - 131 116 15 Bhitora16 14 2 35 2 33 - - - 45 42 3 Chakchandewa
174 115 59 2 1 1 - - - 122 95 27 Syari428 355 73 264 207 57 - - - 28 22 6 Ikara- - - 5 5 - - - - 3 2 1 Janakpur167 163 4 47 43 4 - - - 13 8 5 Dhawari
-------------Un-inhabited--------------
-------------Un-inhabited--------------
87
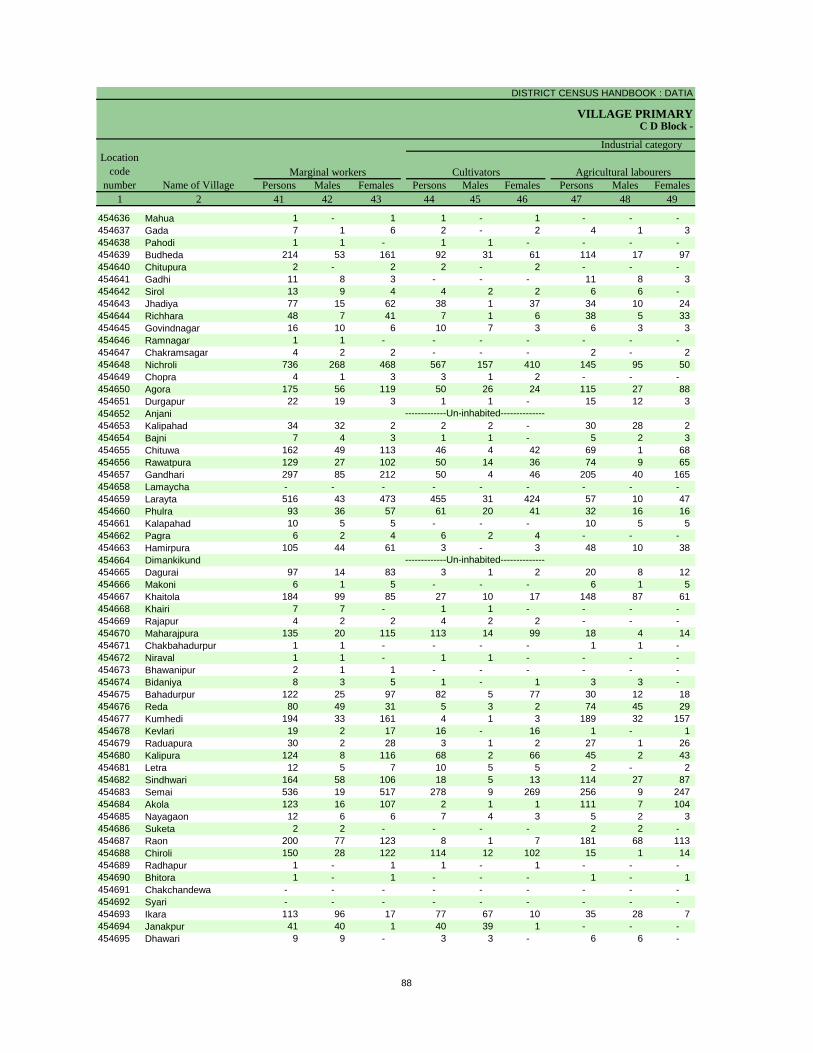
DISTRICT CENSUS HANDBOOK : DATIA
VILLAGE PRIMARYC D Block -
Persons Males Females Persons Males Females Persons Males Females1 2 41 42 43 44 45 46 47 48 49
Name of VillageMarginal workers Cultivators Agricultural labourers
Industrial category Location
code number
454636 Mahua 1 - 1 1 - 1 - - - 454637 Gada 7 1 6 2 - 2 4 1 3 454638 Pahodi 1 1 - 1 1 - - - - 454639 Budheda 214 53 161 92 31 61 114 17 97 454640 Chitupura 2 - 2 2 - 2 - - - 454641 Gadhi 11 8 3 - - - 11 8 3 454642 Sirol 13 9 4 4 2 2 6 6 - 454643 Jhadiya 77 15 62 38 1 37 34 10 24 454644 Richhara 48 7 41 7 1 6 38 5 33 454645 Govindnagar 16 10 6 10 7 3 6 3 3 454646 Ramnagar 1 1 - - - - - - - 454647 Chakramsagar 4 2 2 - - - 2 - 2 454648 Nichroli 736 268 468 567 157 410 145 95 50 454649 Chopra 4 1 3 3 1 2 - - - 454650 Agora 175 56 119 50 26 24 115 27 88 454651 Durgapur 22 19 3 1 1 - 15 12 3 454652 Anjani454653 Kalipahad 34 32 2 2 2 - 30 28 2 454654 Bajni 7 4 3 1 1 - 5 2 3 454655 Chituwa 162 49 113 46 4 42 69 1 68 454656 Rawatpura 129 27 102 50 14 36 74 9 65 454657 Gandhari 297 85 212 50 4 46 205 40 165 454658 Lamaycha - - - - - - - - - 454659 Larayta 516 43 473 455 31 424 57 10 47 454660 Phulra 93 36 57 61 20 41 32 16 16 454661 Kalapahad 10 5 5 - - - 10 5 5 454662 Pagra 6 2 4 6 2 4 - - - 454663 Hamirpura 105 44 61 3 - 3 48 10 38 454664 Dimankikund454665 Dagurai 97 14 83 3 1 2 20 8 12 454666 Makoni 6 1 5 - - - 6 1 5 454667 Khaitola 184 99 85 27 10 17 148 87 61 454668 Khairi 7 7 - 1 1 - - - - 454669 Rajapur 4 2 2 4 2 2 - - - 454670 Maharajpura 135 20 115 113 14 99 18 4 14 454671 Chakbahadurpur 1 1 - - - - 1 1 - 454672 Niraval 1 1 - 1 1 - - - - 454673 Bhawanipur 2 1 1 - - - - - - 454674 Bidaniya 8 3 5 1 - 1 3 3 - 454675 Bahadurpur 122 25 97 82 5 77 30 12 18 454676 Reda 80 49 31 5 3 2 74 45 29 454677 Kumhedi 194 33 161 4 1 3 189 32 157 454678 Kevlari 19 2 17 16 - 16 1 - 1 454679 Raduapura 30 2 28 3 1 2 27 1 26 454680 Kalipura 124 8 116 68 2 66 45 2 43 454681 Letra 12 5 7 10 5 5 2 - 2 454682 Sindhwari 164 58 106 18 5 13 114 27 87 454683 Semai 536 19 517 278 9 269 256 9 247 454684 Akola 123 16 107 2 1 1 111 7 104 454685 Nayagaon 12 6 6 7 4 3 5 2 3 454686 Suketa 2 2 - - - - 2 2 - 454687 Raon 200 77 123 8 1 7 181 68 113 454688 Chiroli 150 28 122 114 12 102 15 1 14 454689 Radhapur 1 - 1 1 - 1 - - - 454690 Bhitora 1 - 1 - - - 1 - 1 454691 Chakchandewa - - - - - - - - - 454692 Syari - - - - - - - - - 454693 Ikara 113 96 17 77 67 10 35 28 7 454694 Janakpur 41 40 1 40 39 1 - - - 454695 Dhawari 9 9 - 3 3 - 6 6 -
-------------Un-inhabited--------------
-------------Un-inhabited--------------
88
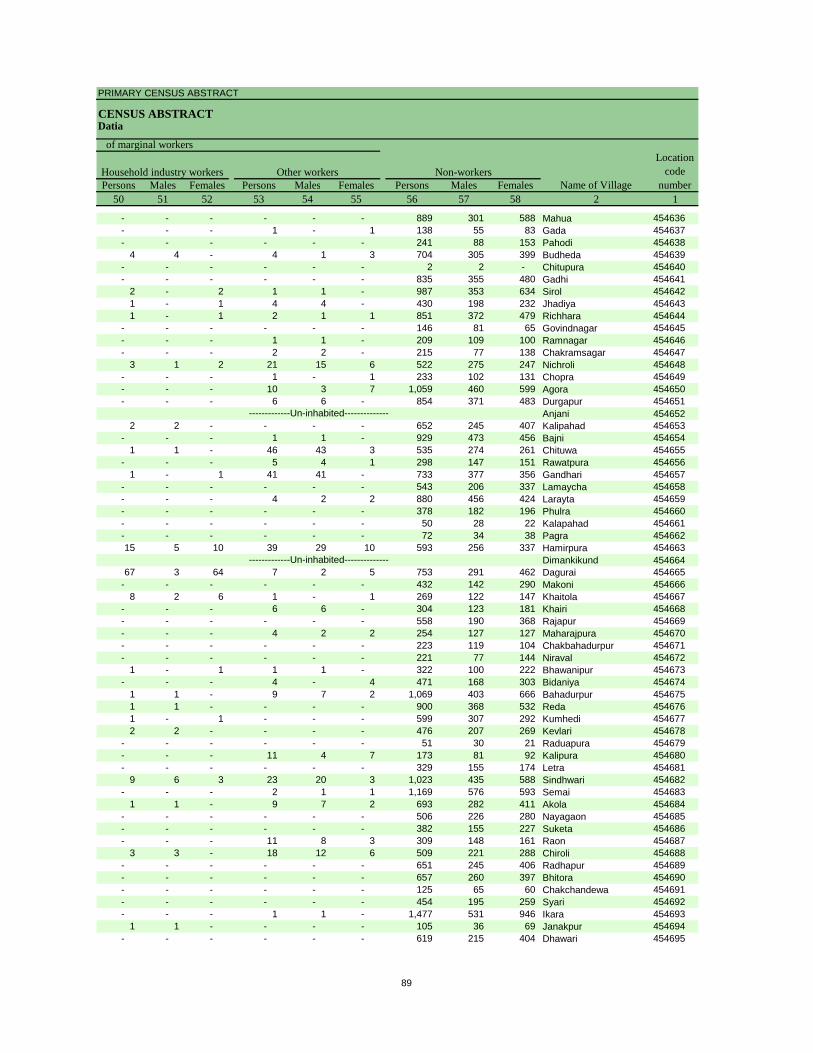
PRIMARY CENSUS ABSTRACT
CENSUS ABSTRACTDatia
Persons Males Females Persons Males Females Persons Males Females50 51 52 53 54 55 56 57 58 2 1
Location code
numberHousehold industry workers
Name of VillageOther workers Non-workers
of marginal workers
- - - - - - 889 301 588 Mahua 454636- - - 1 - 1 138 55 83 Gada 454637- - - - - - 241 88 153 Pahodi 454638
4 4 - 4 1 3 704 305 399 Budheda 454639- - - - - - 2 2 - Chitupura 454640- - - - - - 835 355 480 Gadhi 454641
2 - 2 1 1 - 987 353 634 Sirol 4546421 - 1 4 4 - 430 198 232 Jhadiya 4546431 - 1 2 1 1 851 372 479 Richhara 454644
- - - - - - 146 81 65 Govindnagar 454645- - - 1 1 - 209 109 100 Ramnagar 454646- - - 2 2 - 215 77 138 Chakramsagar 454647
3 1 2 21 15 6 522 275 247 Nichroli 454648- - - 1 - 1 233 102 131 Chopra 454649- - - 10 3 7 1,059 460 599 Agora 454650- - - 6 6 - 854 371 483 Durgapur 454651
Anjani 4546522 2 - - - - 652 245 407 Kalipahad 454653
- - - 1 1 - 929 473 456 Bajni 4546541 1 - 46 43 3 535 274 261 Chituwa 454655
- - - 5 4 1 298 147 151 Rawatpura 4546561 - 1 41 41 - 733 377 356 Gandhari 454657
- - - - - - 543 206 337 Lamaycha 454658- - - 4 2 2 880 456 424 Larayta 454659- - - - - - 378 182 196 Phulra 454660- - - - - - 50 28 22 Kalapahad 454661- - - - - - 72 34 38 Pagra 45466215 5 10 39 29 10 593 256 337 Hamirpura 454663
Dimankikund 45466467 3 64 7 2 5 753 291 462 Dagurai 454665
- - - - - - 432 142 290 Makoni 4546668 2 6 1 - 1 269 122 147 Khaitola 454667
- - - 6 6 - 304 123 181 Khairi 454668- - - - - - 558 190 368 Rajapur 454669- - - 4 2 2 254 127 127 Maharajpura 454670- - - - - - 223 119 104 Chakbahadurpur 454671- - - - - - 221 77 144 Niraval 454672
1 - 1 1 1 - 322 100 222 Bhawanipur 454673- - - 4 - 4 471 168 303 Bidaniya 454674
1 1 - 9 7 2 1,069 403 666 Bahadurpur 4546751 1 - - - - 900 368 532 Reda 4546761 - 1 - - - 599 307 292 Kumhedi 4546772 2 - - - - 476 207 269 Kevlari 454678
- - - - - - 51 30 21 Raduapura 454679- - - 11 4 7 173 81 92 Kalipura 454680- - - - - - 329 155 174 Letra 454681
9 6 3 23 20 3 1,023 435 588 Sindhwari 454682- - - 2 1 1 1,169 576 593 Semai 454683
1 1 - 9 7 2 693 282 411 Akola 454684- - - - - - 506 226 280 Nayagaon 454685- - - - - - 382 155 227 Suketa 454686- - - 11 8 3 309 148 161 Raon 454687
3 3 - 18 12 6 509 221 288 Chiroli 454688- - - - - - 651 245 406 Radhapur 454689- - - - - - 657 260 397 Bhitora 454690- - - - - - 125 65 60 Chakchandewa 454691- - - - - - 454 195 259 Syari 454692- - - 1 1 - 1,477 531 946 Ikara 454693
1 1 - - - - 105 36 69 Janakpur 454694- - - - - - 619 215 404 Dhawari 454695
-------------Un-inhabited--------------
-------------Un-inhabited--------------
89
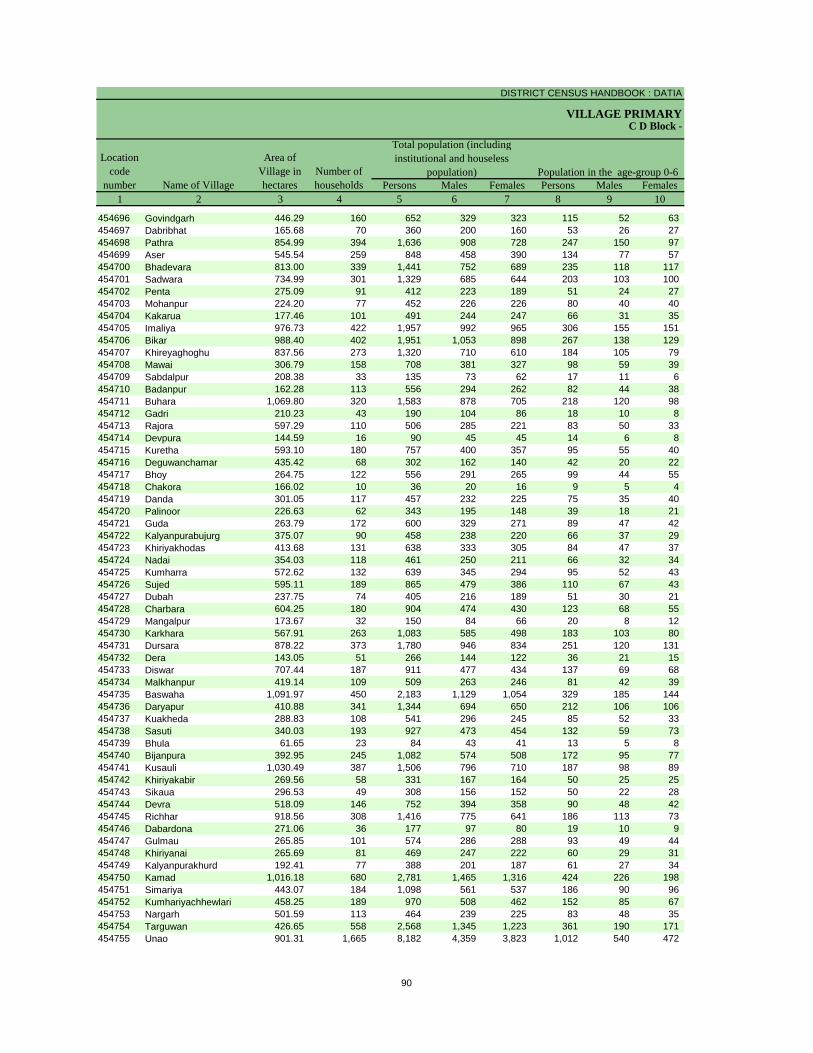
DISTRICT CENSUS HANDBOOK : DATIA
VILLAGE PRIMARY
Persons Males Females Persons Males Females1 2 3 4 5 6 7 8 9 10
Name of Village
Location code
number
Total population (including institutional and houseless
population)Area of
Village in hectares
Number of households
C D Block -
Population in the age-group 0-6
454696 Govindgarh 446.29 160 652 329 323 115 52 63 454697 Dabribhat 165.68 70 360 200 160 53 26 27 454698 Pathra 854.99 394 1,636 908 728 247 150 97 454699 Aser 545.54 259 848 458 390 134 77 57 454700 Bhadevara 813.00 339 1,441 752 689 235 118 117 454701 Sadwara 734.99 301 1,329 685 644 203 103 100 454702 Penta 275.09 91 412 223 189 51 24 27 454703 Mohanpur 224.20 77 452 226 226 80 40 40 454704 Kakarua 177.46 101 491 244 247 66 31 35 454705 Imaliya 976.73 422 1,957 992 965 306 155 151 454706 Bikar 988.40 402 1,951 1,053 898 267 138 129 454707 Khireyaghoghu 837.56 273 1,320 710 610 184 105 79 454708 Mawai 306.79 158 708 381 327 98 59 39 454709 Sabdalpur 208.38 33 135 73 62 17 11 6 454710 Badanpur 162.28 113 556 294 262 82 44 38 454711 Buhara 1,069.80 320 1,583 878 705 218 120 98 454712 Gadri 210.23 43 190 104 86 18 10 8 454713 Rajora 597.29 110 506 285 221 83 50 33 454714 Devpura 144.59 16 90 45 45 14 6 8 454715 Kuretha 593.10 180 757 400 357 95 55 40 454716 Deguwanchamar 435.42 68 302 162 140 42 20 22 454717 Bhoy 264.75 122 556 291 265 99 44 55 454718 Chakora 166.02 10 36 20 16 9 5 4 454719 Danda 301.05 117 457 232 225 75 35 40 454720 Palinoor 226.63 62 343 195 148 39 18 21 454721 Guda 263.79 172 600 329 271 89 47 42 454722 Kalyanpurabujurg 375.07 90 458 238 220 66 37 29 454723 Khiriyakhodas 413.68 131 638 333 305 84 47 37 454724 Nadai 354.03 118 461 250 211 66 32 34 454725 Kumharra 572.62 132 639 345 294 95 52 43 454726 Sujed 595.11 189 865 479 386 110 67 43 454727 Dubah 237.75 74 405 216 189 51 30 21 454728 Charbara 604.25 180 904 474 430 123 68 55 454729 Mangalpur 173.67 32 150 84 66 20 8 12 454730 Karkhara 567.91 263 1,083 585 498 183 103 80 454731 Dursara 878.22 373 1,780 946 834 251 120 131 454732 Dera 143.05 51 266 144 122 36 21 15 454733 Diswar 707.44 187 911 477 434 137 69 68 454734 Malkhanpur 419.14 109 509 263 246 81 42 39 454735 Baswaha 1,091.97 450 2,183 1,129 1,054 329 185 144 454736 Daryapur 410.88 341 1,344 694 650 212 106 106 454737 Kuakheda 288.83 108 541 296 245 85 52 33 454738 Sasuti 340.03 193 927 473 454 132 59 73 454739 Bhula 61.65 23 84 43 41 13 5 8 454740 Bijanpura 392.95 245 1,082 574 508 172 95 77 454741 Kusauli 1,030.49 387 1,506 796 710 187 98 89 454742 Khiriyakabir 269.56 58 331 167 164 50 25 25 454743 Sikaua 296.53 49 308 156 152 50 22 28 454744 Devra 518.09 146 752 394 358 90 48 42 454745 Richhar 918.56 308 1,416 775 641 186 113 73 454746 Dabardona 271.06 36 177 97 80 19 10 9 454747 Gulmau 265.85 101 574 286 288 93 49 44 454748 Khiriyanai 265.69 81 469 247 222 60 29 31 454749 Kalyanpurakhurd 192.41 77 388 201 187 61 27 34 454750 Kamad 1,016.18 680 2,781 1,465 1,316 424 226 198 454751 Simariya 443.07 184 1,098 561 537 186 90 96 454752 Kumhariyachhewlari 458.25 189 970 508 462 152 85 67 454753 Nargarh 501.59 113 464 239 225 83 48 35 454754 Targuwan 426.65 558 2,568 1,345 1,223 361 190 171 454755 Unao 901.31 1,665 8,182 4,359 3,823 1,012 540 472
90
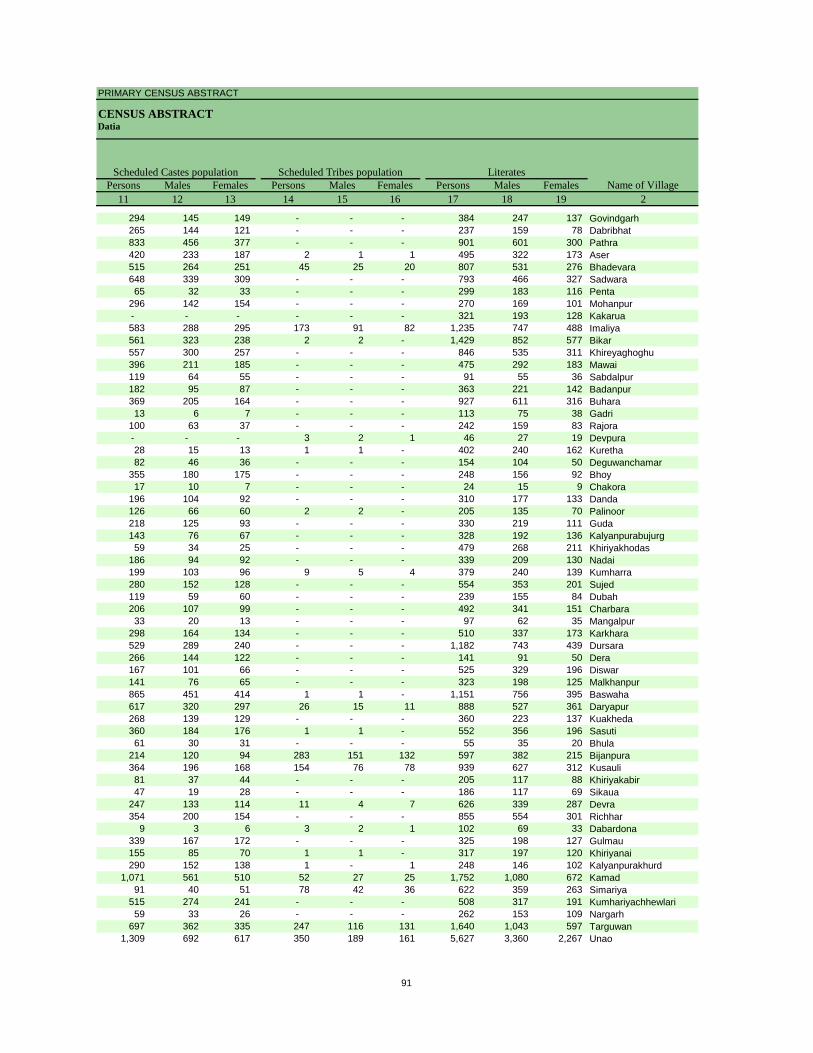
PRIMARY CENSUS ABSTRACT
CENSUS ABSTRACTDatia
Persons Males Females Persons Males Females Persons Males Females11 12 13 14 15 16 17 18 19 2
Name of VillageLiteratesScheduled Castes population Scheduled Tribes population
294 145 149 - - - 384 247 137 Govindgarh265 144 121 - - - 237 159 78 Dabribhat833 456 377 - - - 901 601 300 Pathra420 233 187 2 1 1 495 322 173 Aser515 264 251 45 25 20 807 531 276 Bhadevara648 339 309 - - - 793 466 327 Sadwara65 32 33 - - - 299 183 116 Penta
296 142 154 - - - 270 169 101 Mohanpur- - - - - - 321 193 128 Kakarua583 288 295 173 91 82 1,235 747 488 Imaliya561 323 238 2 2 - 1,429 852 577 Bikar557 300 257 - - - 846 535 311 Khireyaghoghu396 211 185 - - - 475 292 183 Mawai119 64 55 - - - 91 55 36 Sabdalpur182 95 87 - - - 363 221 142 Badanpur369 205 164 - - - 927 611 316 Buhara13 6 7 - - - 113 75 38 Gadri
100 63 37 - - - 242 159 83 Rajora- - - 3 2 1 46 27 19 Devpura28 15 13 1 1 - 402 240 162 Kuretha82 46 36 - - - 154 104 50 Deguwanchamar
355 180 175 - - - 248 156 92 Bhoy17 10 7 - - - 24 15 9 Chakora
196 104 92 - - - 310 177 133 Danda126 66 60 2 2 - 205 135 70 Palinoor218 125 93 - - - 330 219 111 Guda143 76 67 - - - 328 192 136 Kalyanpurabujurg59 34 25 - - - 479 268 211 Khiriyakhodas
186 94 92 - - - 339 209 130 Nadai199 103 96 9 5 4 379 240 139 Kumharra280 152 128 - - - 554 353 201 Sujed119 59 60 - - - 239 155 84 Dubah206 107 99 - - - 492 341 151 Charbara33 20 13 - - - 97 62 35 Mangalpur
298 164 134 - - - 510 337 173 Karkhara529 289 240 - - - 1,182 743 439 Dursara266 144 122 - - - 141 91 50 Dera167 101 66 - - - 525 329 196 Diswar141 76 65 - - - 323 198 125 Malkhanpur865 451 414 1 1 - 1,151 756 395 Baswaha617 320 297 26 15 11 888 527 361 Daryapur268 139 129 - - - 360 223 137 Kuakheda360 184 176 1 1 - 552 356 196 Sasuti61 30 31 - - - 55 35 20 Bhula
214 120 94 283 151 132 597 382 215 Bijanpura364 196 168 154 76 78 939 627 312 Kusauli81 37 44 - - - 205 117 88 Khiriyakabir47 19 28 - - - 186 117 69 Sikaua
247 133 114 11 4 7 626 339 287 Devra354 200 154 - - - 855 554 301 Richhar
9 3 6 3 2 1 102 69 33 Dabardona339 167 172 - - - 325 198 127 Gulmau155 85 70 1 1 - 317 197 120 Khiriyanai290 152 138 1 - 1 248 146 102 Kalyanpurakhurd
1,071 561 510 52 27 25 1,752 1,080 672 Kamad91 40 51 78 42 36 622 359 263 Simariya
515 274 241 - - - 508 317 191 Kumhariyachhewlari59 33 26 - - - 262 153 109 Nargarh
697 362 335 247 116 131 1,640 1,043 597 Targuwan1,309 692 617 350 189 161 5,627 3,360 2,267 Unao
91
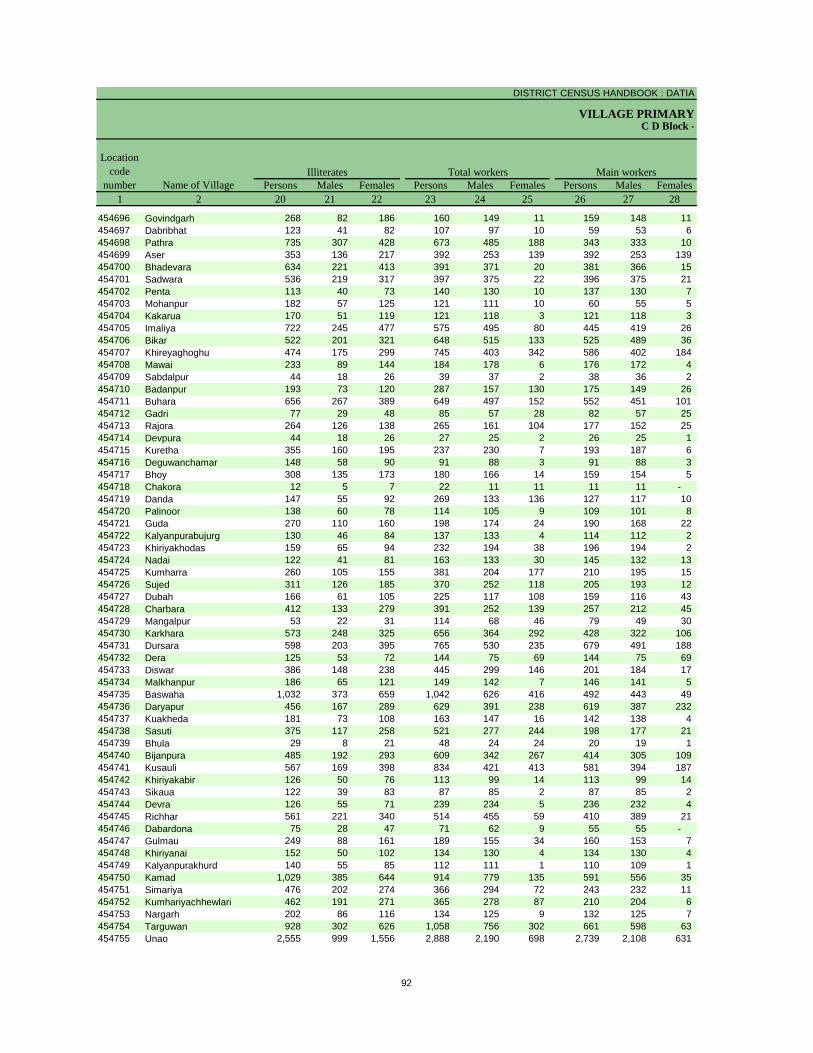
DISTRICT CENSUS HANDBOOK : DATIA
VILLAGE PRIMARYC D Block -
Persons Males Females Persons Males Females Persons Males Females1 2 20 21 22 23 24 25 26 27 28
Name of Village
Location code
numberIlliterates Total workers Main workers
454696 Govindgarh 268 82 186 160 149 11 159 148 11 454697 Dabribhat 123 41 82 107 97 10 59 53 6 454698 Pathra 735 307 428 673 485 188 343 333 10 454699 Aser 353 136 217 392 253 139 392 253 139 454700 Bhadevara 634 221 413 391 371 20 381 366 15 454701 Sadwara 536 219 317 397 375 22 396 375 21 454702 Penta 113 40 73 140 130 10 137 130 7 454703 Mohanpur 182 57 125 121 111 10 60 55 5 454704 Kakarua 170 51 119 121 118 3 121 118 3 454705 Imaliya 722 245 477 575 495 80 445 419 26 454706 Bikar 522 201 321 648 515 133 525 489 36 454707 Khireyaghoghu 474 175 299 745 403 342 586 402 184 454708 Mawai 233 89 144 184 178 6 176 172 4 454709 Sabdalpur 44 18 26 39 37 2 38 36 2 454710 Badanpur 193 73 120 287 157 130 175 149 26 454711 Buhara 656 267 389 649 497 152 552 451 101 454712 Gadri 77 29 48 85 57 28 82 57 25 454713 Rajora 264 126 138 265 161 104 177 152 25 454714 Devpura 44 18 26 27 25 2 26 25 1 454715 Kuretha 355 160 195 237 230 7 193 187 6 454716 Deguwanchamar 148 58 90 91 88 3 91 88 3 454717 Bhoy 308 135 173 180 166 14 159 154 5 454718 Chakora 12 5 7 22 11 11 11 11 - 454719 Danda 147 55 92 269 133 136 127 117 10 454720 Palinoor 138 60 78 114 105 9 109 101 8 454721 Guda 270 110 160 198 174 24 190 168 22 454722 Kalyanpurabujurg 130 46 84 137 133 4 114 112 2 454723 Khiriyakhodas 159 65 94 232 194 38 196 194 2 454724 Nadai 122 41 81 163 133 30 145 132 13 454725 Kumharra 260 105 155 381 204 177 210 195 15 454726 Sujed 311 126 185 370 252 118 205 193 12 454727 Dubah 166 61 105 225 117 108 159 116 43 454728 Charbara 412 133 279 391 252 139 257 212 45 454729 Mangalpur 53 22 31 114 68 46 79 49 30 454730 Karkhara 573 248 325 656 364 292 428 322 106 454731 Dursara 598 203 395 765 530 235 679 491 188 454732 Dera 125 53 72 144 75 69 144 75 69 454733 Diswar 386 148 238 445 299 146 201 184 17 454734 Malkhanpur 186 65 121 149 142 7 146 141 5 454735 Baswaha 1,032 373 659 1,042 626 416 492 443 49 454736 Daryapur 456 167 289 629 391 238 619 387 232 454737 Kuakheda 181 73 108 163 147 16 142 138 4 454738 Sasuti 375 117 258 521 277 244 198 177 21 454739 Bhula 29 8 21 48 24 24 20 19 1 454740 Bijanpura 485 192 293 609 342 267 414 305 109 454741 Kusauli 567 169 398 834 421 413 581 394 187 454742 Khiriyakabir 126 50 76 113 99 14 113 99 14 454743 Sikaua 122 39 83 87 85 2 87 85 2 454744 Devra 126 55 71 239 234 5 236 232 4 454745 Richhar 561 221 340 514 455 59 410 389 21 454746 Dabardona 75 28 47 71 62 9 55 55 - 454747 Gulmau 249 88 161 189 155 34 160 153 7 454748 Khiriyanai 152 50 102 134 130 4 134 130 4 454749 Kalyanpurakhurd 140 55 85 112 111 1 110 109 1 454750 Kamad 1,029 385 644 914 779 135 591 556 35 454751 Simariya 476 202 274 366 294 72 243 232 11 454752 Kumhariyachhewlari 462 191 271 365 278 87 210 204 6 454753 Nargarh 202 86 116 134 125 9 132 125 7 454754 Targuwan 928 302 626 1,058 756 302 661 598 63 454755 Unao 2,555 999 1,556 2,888 2,190 698 2,739 2,108 631
92
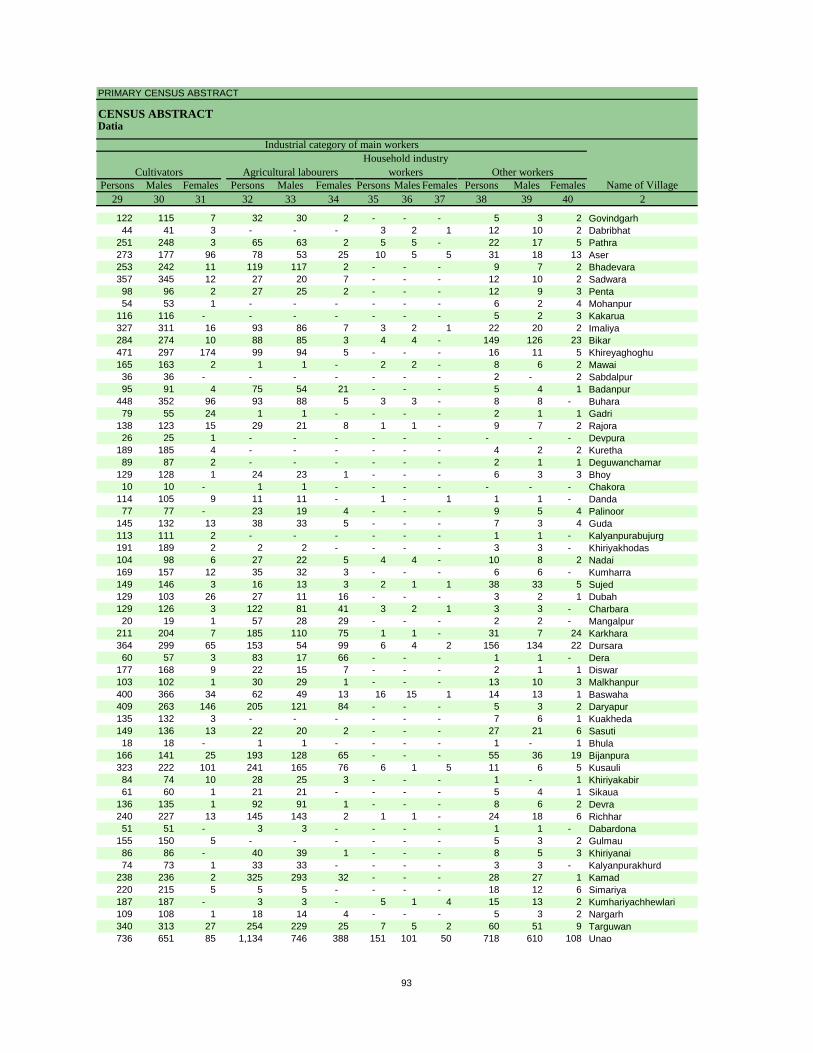
PRIMARY CENSUS ABSTRACT
CENSUS ABSTRACTDatia
Persons Males Females Persons Males Females Persons Males Females Persons Males Females29 30 31 32 33 34 35 36 37 38 39 40 2
CultivatorsName of Village
Household industry workersAgricultural labourers
Industrial category of main workers
Other workers
122 115 7 32 30 2 - - - 5 3 2 Govindgarh44 41 3 - - - 3 2 1 12 10 2 Dabribhat
251 248 3 65 63 2 5 5 - 22 17 5 Pathra273 177 96 78 53 25 10 5 5 31 18 13 Aser253 242 11 119 117 2 - - - 9 7 2 Bhadevara357 345 12 27 20 7 - - - 12 10 2 Sadwara98 96 2 27 25 2 - - - 12 9 3 Penta54 53 1 - - - - - - 6 2 4 Mohanpur
116 116 - - - - - - - 5 2 3 Kakarua327 311 16 93 86 7 3 2 1 22 20 2 Imaliya284 274 10 88 85 3 4 4 - 149 126 23 Bikar471 297 174 99 94 5 - - - 16 11 5 Khireyaghoghu165 163 2 1 1 - 2 2 - 8 6 2 Mawai36 36 - - - - - - - 2 - 2 Sabdalpur95 91 4 75 54 21 - - - 5 4 1 Badanpur
448 352 96 93 88 5 3 3 - 8 8 - Buhara79 55 24 1 1 - - - - 2 1 1 Gadri
138 123 15 29 21 8 1 1 - 9 7 2 Rajora26 25 1 - - - - - - - - - Devpura
189 185 4 - - - - - - 4 2 2 Kuretha89 87 2 - - - - - - 2 1 1 Deguwanchamar
129 128 1 24 23 1 - - - 6 3 3 Bhoy10 10 - 1 1 - - - - - - - Chakora
114 105 9 11 11 - 1 - 1 1 1 - Danda77 77 - 23 19 4 - - - 9 5 4 Palinoor
145 132 13 38 33 5 - - - 7 3 4 Guda113 111 2 - - - - - - 1 1 - Kalyanpurabujurg191 189 2 2 2 - - - - 3 3 - Khiriyakhodas104 98 6 27 22 5 4 4 - 10 8 2 Nadai169 157 12 35 32 3 - - - 6 6 - Kumharra149 146 3 16 13 3 2 1 1 38 33 5 Sujed129 103 26 27 11 16 - - - 3 2 1 Dubah129 126 3 122 81 41 3 2 1 3 3 - Charbara20 19 1 57 28 29 - - - 2 2 - Mangalpur
211 204 7 185 110 75 1 1 - 31 7 24 Karkhara364 299 65 153 54 99 6 4 2 156 134 22 Dursara60 57 3 83 17 66 - - - 1 1 - Dera
177 168 9 22 15 7 - - - 2 1 1 Diswar103 102 1 30 29 1 - - - 13 10 3 Malkhanpur400 366 34 62 49 13 16 15 1 14 13 1 Baswaha409 263 146 205 121 84 - - - 5 3 2 Daryapur135 132 3 - - - - - - 7 6 1 Kuakheda149 136 13 22 20 2 - - - 27 21 6 Sasuti18 18 - 1 1 - - - - 1 - 1 Bhula
166 141 25 193 128 65 - - - 55 36 19 Bijanpura323 222 101 241 165 76 6 1 5 11 6 5 Kusauli84 74 10 28 25 3 - - - 1 - 1 Khiriyakabir61 60 1 21 21 - - - - 5 4 1 Sikaua
136 135 1 92 91 1 - - - 8 6 2 Devra240 227 13 145 143 2 1 1 - 24 18 6 Richhar51 51 - 3 3 - - - - 1 1 - Dabardona
155 150 5 - - - - - - 5 3 2 Gulmau86 86 - 40 39 1 - - - 8 5 3 Khiriyanai74 73 1 33 33 - - - - 3 3 - Kalyanpurakhurd
238 236 2 325 293 32 - - - 28 27 1 Kamad220 215 5 5 5 - - - - 18 12 6 Simariya187 187 - 3 3 - 5 1 4 15 13 2 Kumhariyachhewlari109 108 1 18 14 4 - - - 5 3 2 Nargarh340 313 27 254 229 25 7 5 2 60 51 9 Targuwan736 651 85 1,134 746 388 151 101 50 718 610 108 Unao
93
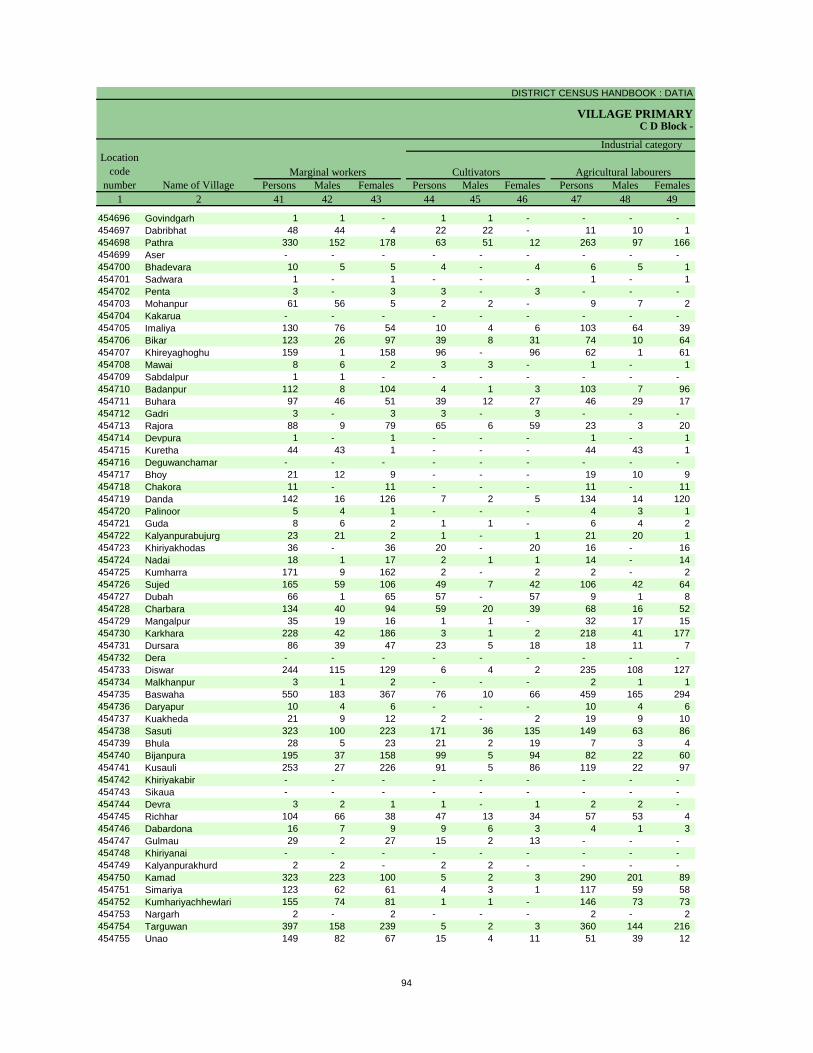
DISTRICT CENSUS HANDBOOK : DATIA
VILLAGE PRIMARYC D Block -
Persons Males Females Persons Males Females Persons Males Females1 2 41 42 43 44 45 46 47 48 49
Name of VillageMarginal workers Cultivators Agricultural labourers
Industrial category Location
code number
454696 Govindgarh 1 1 - 1 1 - - - - 454697 Dabribhat 48 44 4 22 22 - 11 10 1 454698 Pathra 330 152 178 63 51 12 263 97 166 454699 Aser - - - - - - - - - 454700 Bhadevara 10 5 5 4 - 4 6 5 1 454701 Sadwara 1 - 1 - - - 1 - 1 454702 Penta 3 - 3 3 - 3 - - - 454703 Mohanpur 61 56 5 2 2 - 9 7 2 454704 Kakarua - - - - - - - - - 454705 Imaliya 130 76 54 10 4 6 103 64 39 454706 Bikar 123 26 97 39 8 31 74 10 64 454707 Khireyaghoghu 159 1 158 96 - 96 62 1 61 454708 Mawai 8 6 2 3 3 - 1 - 1 454709 Sabdalpur 1 1 - - - - - - - 454710 Badanpur 112 8 104 4 1 3 103 7 96 454711 Buhara 97 46 51 39 12 27 46 29 17 454712 Gadri 3 - 3 3 - 3 - - - 454713 Rajora 88 9 79 65 6 59 23 3 20 454714 Devpura 1 - 1 - - - 1 - 1 454715 Kuretha 44 43 1 - - - 44 43 1 454716 Deguwanchamar - - - - - - - - - 454717 Bhoy 21 12 9 - - - 19 10 9 454718 Chakora 11 - 11 - - - 11 - 11 454719 Danda 142 16 126 7 2 5 134 14 120 454720 Palinoor 5 4 1 - - - 4 3 1 454721 Guda 8 6 2 1 1 - 6 4 2 454722 Kalyanpurabujurg 23 21 2 1 - 1 21 20 1 454723 Khiriyakhodas 36 - 36 20 - 20 16 - 16 454724 Nadai 18 1 17 2 1 1 14 - 14 454725 Kumharra 171 9 162 2 - 2 2 - 2 454726 Sujed 165 59 106 49 7 42 106 42 64 454727 Dubah 66 1 65 57 - 57 9 1 8 454728 Charbara 134 40 94 59 20 39 68 16 52 454729 Mangalpur 35 19 16 1 1 - 32 17 15 454730 Karkhara 228 42 186 3 1 2 218 41 177 454731 Dursara 86 39 47 23 5 18 18 11 7 454732 Dera - - - - - - - - - 454733 Diswar 244 115 129 6 4 2 235 108 127 454734 Malkhanpur 3 1 2 - - - 2 1 1 454735 Baswaha 550 183 367 76 10 66 459 165 294 454736 Daryapur 10 4 6 - - - 10 4 6 454737 Kuakheda 21 9 12 2 - 2 19 9 10 454738 Sasuti 323 100 223 171 36 135 149 63 86 454739 Bhula 28 5 23 21 2 19 7 3 4 454740 Bijanpura 195 37 158 99 5 94 82 22 60 454741 Kusauli 253 27 226 91 5 86 119 22 97 454742 Khiriyakabir - - - - - - - - - 454743 Sikaua - - - - - - - - - 454744 Devra 3 2 1 1 - 1 2 2 - 454745 Richhar 104 66 38 47 13 34 57 53 4 454746 Dabardona 16 7 9 9 6 3 4 1 3 454747 Gulmau 29 2 27 15 2 13 - - - 454748 Khiriyanai - - - - - - - - - 454749 Kalyanpurakhurd 2 2 - 2 2 - - - - 454750 Kamad 323 223 100 5 2 3 290 201 89 454751 Simariya 123 62 61 4 3 1 117 59 58 454752 Kumhariyachhewlari 155 74 81 1 1 - 146 73 73 454753 Nargarh 2 - 2 - - - 2 - 2 454754 Targuwan 397 158 239 5 2 3 360 144 216 454755 Unao 149 82 67 15 4 11 51 39 12
94

PRIMARY CENSUS ABSTRACT
CENSUS ABSTRACTDatia
Persons Males Females Persons Males Females Persons Males Females50 51 52 53 54 55 56 57 58 2 1
Location code
numberHousehold industry workers
Name of VillageOther workers Non-workers
of marginal workers
- - - - - - 492 180 312 Govindgarh 4546963 3 - 12 9 3 253 103 150 Dabribhat 4546973 3 - 1 1 - 963 423 540 Pathra 454698
- - - - - - 456 205 251 Aser 454699- - - - - - 1,050 381 669 Bhadevara 454700- - - - - - 932 310 622 Sadwara 454701- - - - - - 272 93 179 Penta 454702
2 2 - 48 45 3 331 115 216 Mohanpur 454703- - - - - - 370 126 244 Kakarua 45470415 7 8 2 1 1 1,382 497 885 Imaliya 4547051 1 - 9 7 2 1,303 538 765 Bikar 454706
- - - 1 - 1 575 307 268 Khireyaghoghu 4547071 1 - 3 2 1 524 203 321 Mawai 454708
- - - 1 1 - 96 36 60 Sabdalpur 4547095 - 5 - - - 269 137 132 Badanpur 4547101 1 - 11 4 7 934 381 553 Buhara 454711
- - - - - - 105 47 58 Gadri 454712- - - - - - 241 124 117 Rajora 454713- - - - - - 63 20 43 Devpura 454714- - - - - - 520 170 350 Kuretha 454715- - - - - - 211 74 137 Deguwanchamar 454716- - - 2 2 - 376 125 251 Bhoy 454717- - - - - - 14 9 5 Chakora 454718
1 - 1 - - - 188 99 89 Danda 454719- - - 1 1 - 229 90 139 Palinoor 454720- - - 1 1 - 402 155 247 Guda 454721- - - 1 1 - 321 105 216 Kalyanpurabujurg 454722- - - - - - 406 139 267 Khiriyakhodas 454723
1 - 1 1 - 1 298 117 181 Nadai 454724- - - 167 9 158 258 141 117 Kumharra 454725- - - 10 10 - 495 227 268 Sujed 454726- - - - - - 180 99 81 Dubah 454727
4 3 1 3 1 2 513 222 291 Charbara 454728- - - 2 1 1 36 16 20 Mangalpur 454729
2 - 2 5 - 5 427 221 206 Karkhara 4547303 3 - 42 20 22 1,015 416 599 Dursara 454731
- - - - - - 122 69 53 Dera 4547321 1 - 2 2 - 466 178 288 Diswar 454733
- - - 1 - 1 360 121 239 Malkhanpur 45473410 4 6 5 4 1 1,141 503 638 Baswaha 454735
- - - - - - 715 303 412 Daryapur 454736- - - - - - 378 149 229 Kuakheda 454737- - - 3 1 2 406 196 210 Sasuti 454738- - - - - - 36 19 17 Bhula 454739- - - 14 10 4 473 232 241 Bijanpura 45474043 - 43 - - - 672 375 297 Kusauli 454741
- - - - - - 218 68 150 Khiriyakabir 454742- - - - - - 221 71 150 Sikaua 454743- - - - - - 513 160 353 Devra 454744- - - - - - 902 320 582 Richhar 454745
1 - 1 2 - 2 106 35 71 Dabardona 4547467 - 7 7 - 7 385 131 254 Gulmau 454747
- - - - - - 335 117 218 Khiriyanai 454748- - - - - - 276 90 186 Kalyanpurakhurd 45474919 13 6 9 7 2 1,867 686 1,181 Kamad 454750
- - - 2 - 2 732 267 465 Simariya 4547513 - 3 5 - 5 605 230 375 Kumhariyachhewlari 454752
- - - - - - 330 114 216 Nargarh 45475322 8 14 10 4 6 1,510 589 921 Targuwan 4547544 2 2 79 37 42 5,294 2,169 3,125 Unao 454755
95
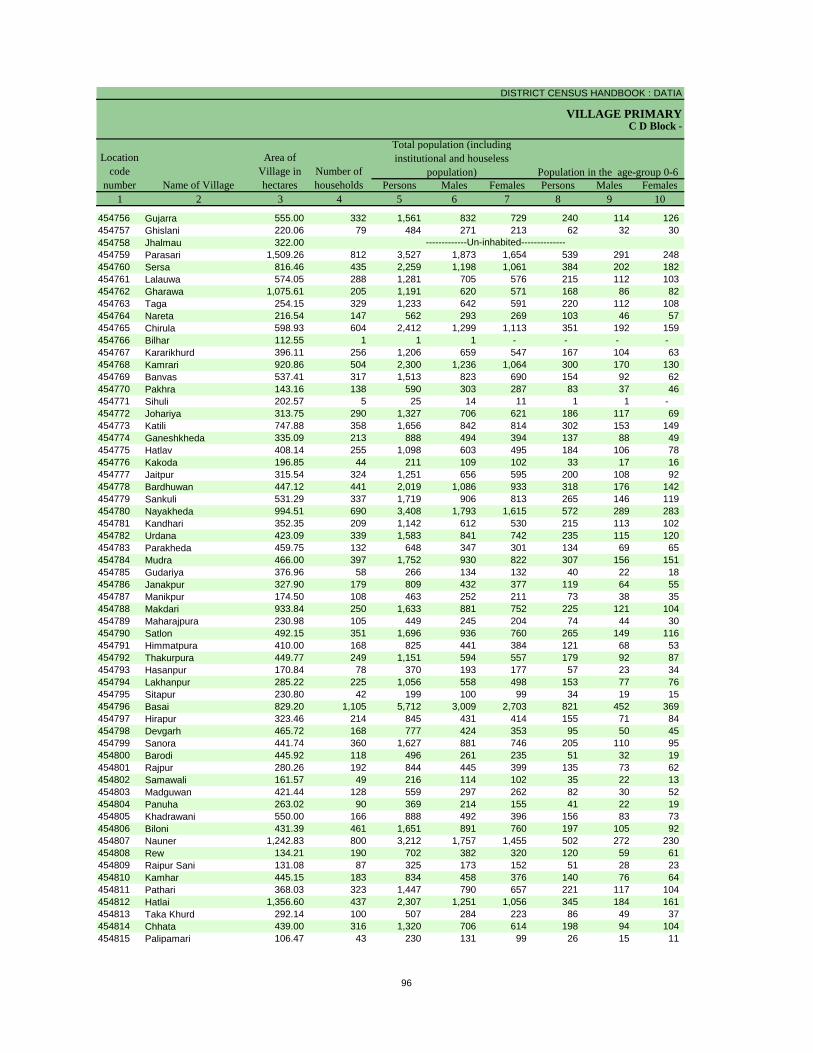
DISTRICT CENSUS HANDBOOK : DATIA
VILLAGE PRIMARY
Persons Males Females Persons Males Females1 2 3 4 5 6 7 8 9 10
Name of Village
Location code
number
Total population (including institutional and houseless
population)Area of
Village in hectares
Number of households
C D Block -
Population in the age-group 0-6
454756 Gujarra 555.00 332 1,561 832 729 240 114 126 454757 Ghislani 220.06 79 484 271 213 62 32 30 454758 Jhalmau 322.00454759 Parasari 1,509.26 812 3,527 1,873 1,654 539 291 248 454760 Sersa 816.46 435 2,259 1,198 1,061 384 202 182 454761 Lalauwa 574.05 288 1,281 705 576 215 112 103 454762 Gharawa 1,075.61 205 1,191 620 571 168 86 82 454763 Taga 254.15 329 1,233 642 591 220 112 108 454764 Nareta 216.54 147 562 293 269 103 46 57 454765 Chirula 598.93 604 2,412 1,299 1,113 351 192 159 454766 Bilhar 112.55 1 1 1 - - - - 454767 Kararikhurd 396.11 256 1,206 659 547 167 104 63 454768 Kamrari 920.86 504 2,300 1,236 1,064 300 170 130 454769 Banvas 537.41 317 1,513 823 690 154 92 62 454770 Pakhra 143.16 138 590 303 287 83 37 46 454771 Sihuli 202.57 5 25 14 11 1 1 - 454772 Johariya 313.75 290 1,327 706 621 186 117 69 454773 Katili 747.88 358 1,656 842 814 302 153 149 454774 Ganeshkheda 335.09 213 888 494 394 137 88 49 454775 Hatlav 408.14 255 1,098 603 495 184 106 78 454776 Kakoda 196.85 44 211 109 102 33 17 16 454777 Jaitpur 315.54 324 1,251 656 595 200 108 92 454778 Bardhuwan 447.12 441 2,019 1,086 933 318 176 142 454779 Sankuli 531.29 337 1,719 906 813 265 146 119 454780 Nayakheda 994.51 690 3,408 1,793 1,615 572 289 283 454781 Kandhari 352.35 209 1,142 612 530 215 113 102 454782 Urdana 423.09 339 1,583 841 742 235 115 120 454783 Parakheda 459.75 132 648 347 301 134 69 65 454784 Mudra 466.00 397 1,752 930 822 307 156 151 454785 Gudariya 376.96 58 266 134 132 40 22 18 454786 Janakpur 327.90 179 809 432 377 119 64 55 454787 Manikpur 174.50 108 463 252 211 73 38 35 454788 Makdari 933.84 250 1,633 881 752 225 121 104 454789 Maharajpura 230.98 105 449 245 204 74 44 30 454790 Satlon 492.15 351 1,696 936 760 265 149 116 454791 Himmatpura 410.00 168 825 441 384 121 68 53 454792 Thakurpura 449.77 249 1,151 594 557 179 92 87 454793 Hasanpur 170.84 78 370 193 177 57 23 34 454794 Lakhanpur 285.22 225 1,056 558 498 153 77 76 454795 Sitapur 230.80 42 199 100 99 34 19 15 454796 Basai 829.20 1,105 5,712 3,009 2,703 821 452 369 454797 Hirapur 323.46 214 845 431 414 155 71 84 454798 Devgarh 465.72 168 777 424 353 95 50 45 454799 Sanora 441.74 360 1,627 881 746 205 110 95 454800 Barodi 445.92 118 496 261 235 51 32 19 454801 Rajpur 280.26 192 844 445 399 135 73 62 454802 Samawali 161.57 49 216 114 102 35 22 13 454803 Madguwan 421.44 128 559 297 262 82 30 52 454804 Panuha 263.02 90 369 214 155 41 22 19 454805 Khadrawani 550.00 166 888 492 396 156 83 73 454806 Biloni 431.39 461 1,651 891 760 197 105 92 454807 Nauner 1,242.83 800 3,212 1,757 1,455 502 272 230 454808 Rew 134.21 190 702 382 320 120 59 61 454809 Raipur Sani 131.08 87 325 173 152 51 28 23 454810 Kamhar 445.15 183 834 458 376 140 76 64 454811 Pathari 368.03 323 1,447 790 657 221 117 104 454812 Hatlai 1,356.60 437 2,307 1,251 1,056 345 184 161 454813 Taka Khurd 292.14 100 507 284 223 86 49 37 454814 Chhata 439.00 316 1,320 706 614 198 94 104 454815 Palipamari 106.47 43 230 131 99 26 15 11
-------------Un-inhabited--------------
96
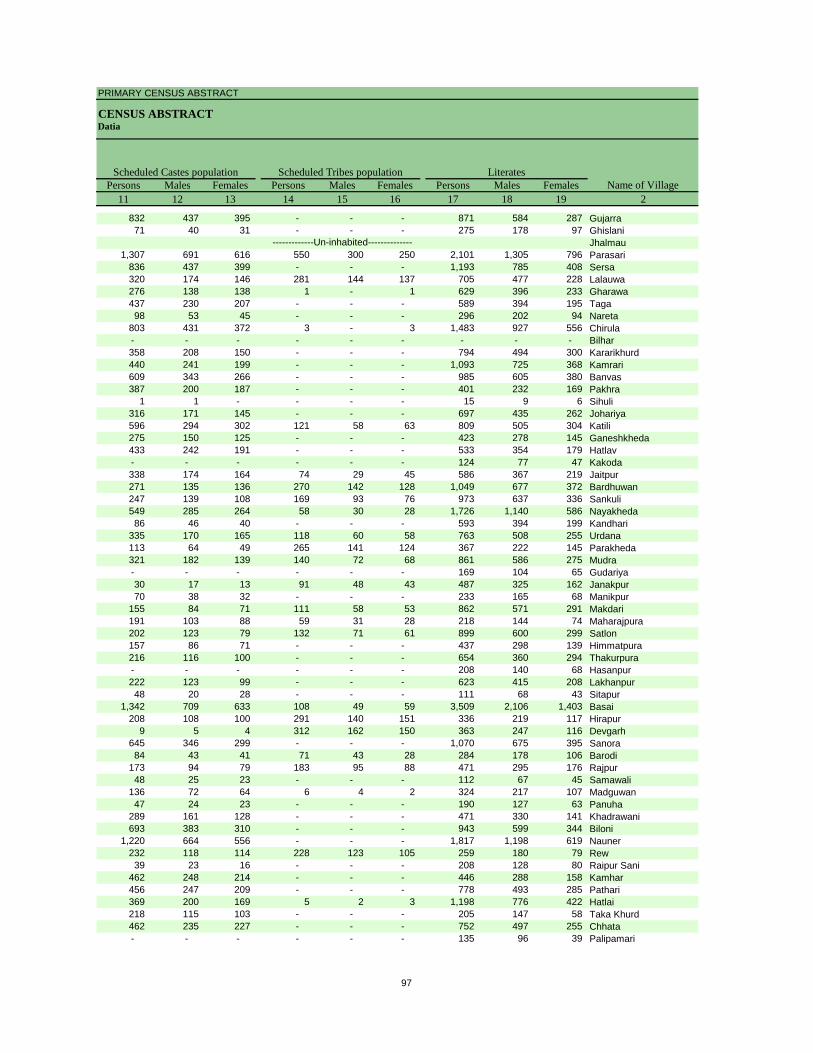
PRIMARY CENSUS ABSTRACT
CENSUS ABSTRACTDatia
Persons Males Females Persons Males Females Persons Males Females11 12 13 14 15 16 17 18 19 2
Name of VillageLiteratesScheduled Castes population Scheduled Tribes population
832 437 395 - - - 871 584 287 Gujarra71 40 31 - - - 275 178 97 Ghislani
Jhalmau1,307 691 616 550 300 250 2,101 1,305 796 Parasari
836 437 399 - - - 1,193 785 408 Sersa320 174 146 281 144 137 705 477 228 Lalauwa276 138 138 1 - 1 629 396 233 Gharawa437 230 207 - - - 589 394 195 Taga98 53 45 - - - 296 202 94 Nareta
803 431 372 3 - 3 1,483 927 556 Chirula- - - - - - - - - Bilhar358 208 150 - - - 794 494 300 Kararikhurd440 241 199 - - - 1,093 725 368 Kamrari609 343 266 - - - 985 605 380 Banvas387 200 187 - - - 401 232 169 Pakhra
1 1 - - - - 15 9 6 Sihuli316 171 145 - - - 697 435 262 Johariya596 294 302 121 58 63 809 505 304 Katili275 150 125 - - - 423 278 145 Ganeshkheda433 242 191 - - - 533 354 179 Hatlav- - - - - - 124 77 47 Kakoda338 174 164 74 29 45 586 367 219 Jaitpur271 135 136 270 142 128 1,049 677 372 Bardhuwan247 139 108 169 93 76 973 637 336 Sankuli549 285 264 58 30 28 1,726 1,140 586 Nayakheda86 46 40 - - - 593 394 199 Kandhari
335 170 165 118 60 58 763 508 255 Urdana113 64 49 265 141 124 367 222 145 Parakheda321 182 139 140 72 68 861 586 275 Mudra- - - - - - 169 104 65 Gudariya30 17 13 91 48 43 487 325 162 Janakpur70 38 32 - - - 233 165 68 Manikpur
155 84 71 111 58 53 862 571 291 Makdari191 103 88 59 31 28 218 144 74 Maharajpura202 123 79 132 71 61 899 600 299 Satlon157 86 71 - - - 437 298 139 Himmatpura216 116 100 - - - 654 360 294 Thakurpura- - - - - - 208 140 68 Hasanpur222 123 99 - - - 623 415 208 Lakhanpur48 20 28 - - - 111 68 43 Sitapur
1,342 709 633 108 49 59 3,509 2,106 1,403 Basai208 108 100 291 140 151 336 219 117 Hirapur
9 5 4 312 162 150 363 247 116 Devgarh645 346 299 - - - 1,070 675 395 Sanora84 43 41 71 43 28 284 178 106 Barodi
173 94 79 183 95 88 471 295 176 Rajpur48 25 23 - - - 112 67 45 Samawali
136 72 64 6 4 2 324 217 107 Madguwan47 24 23 - - - 190 127 63 Panuha
289 161 128 - - - 471 330 141 Khadrawani693 383 310 - - - 943 599 344 Biloni
1,220 664 556 - - - 1,817 1,198 619 Nauner232 118 114 228 123 105 259 180 79 Rew39 23 16 - - - 208 128 80 Raipur Sani
462 248 214 - - - 446 288 158 Kamhar456 247 209 - - - 778 493 285 Pathari369 200 169 5 2 3 1,198 776 422 Hatlai218 115 103 - - - 205 147 58 Taka Khurd462 235 227 - - - 752 497 255 Chhata- - - - - - 135 96 39 Palipamari
-------------Un-inhabited--------------
97
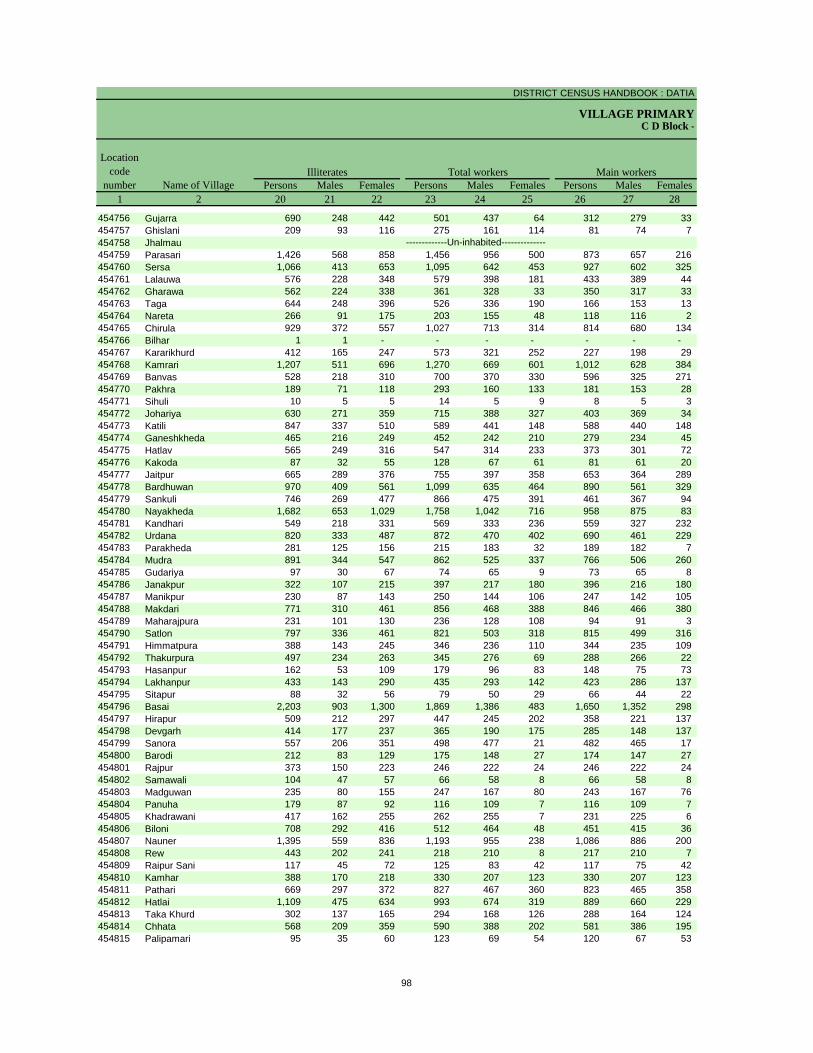
DISTRICT CENSUS HANDBOOK : DATIA
VILLAGE PRIMARYC D Block -
Persons Males Females Persons Males Females Persons Males Females1 2 20 21 22 23 24 25 26 27 28
Name of Village
Location code
numberIlliterates Total workers Main workers
454756 Gujarra 690 248 442 501 437 64 312 279 33 454757 Ghislani 209 93 116 275 161 114 81 74 7 454758 Jhalmau454759 Parasari 1,426 568 858 1,456 956 500 873 657 216 454760 Sersa 1,066 413 653 1,095 642 453 927 602 325 454761 Lalauwa 576 228 348 579 398 181 433 389 44 454762 Gharawa 562 224 338 361 328 33 350 317 33 454763 Taga 644 248 396 526 336 190 166 153 13 454764 Nareta 266 91 175 203 155 48 118 116 2 454765 Chirula 929 372 557 1,027 713 314 814 680 134 454766 Bilhar 1 1 - - - - - - - 454767 Kararikhurd 412 165 247 573 321 252 227 198 29 454768 Kamrari 1,207 511 696 1,270 669 601 1,012 628 384 454769 Banvas 528 218 310 700 370 330 596 325 271 454770 Pakhra 189 71 118 293 160 133 181 153 28 454771 Sihuli 10 5 5 14 5 9 8 5 3 454772 Johariya 630 271 359 715 388 327 403 369 34 454773 Katili 847 337 510 589 441 148 588 440 148 454774 Ganeshkheda 465 216 249 452 242 210 279 234 45 454775 Hatlav 565 249 316 547 314 233 373 301 72 454776 Kakoda 87 32 55 128 67 61 81 61 20 454777 Jaitpur 665 289 376 755 397 358 653 364 289 454778 Bardhuwan 970 409 561 1,099 635 464 890 561 329 454779 Sankuli 746 269 477 866 475 391 461 367 94 454780 Nayakheda 1,682 653 1,029 1,758 1,042 716 958 875 83 454781 Kandhari 549 218 331 569 333 236 559 327 232 454782 Urdana 820 333 487 872 470 402 690 461 229 454783 Parakheda 281 125 156 215 183 32 189 182 7 454784 Mudra 891 344 547 862 525 337 766 506 260 454785 Gudariya 97 30 67 74 65 9 73 65 8 454786 Janakpur 322 107 215 397 217 180 396 216 180 454787 Manikpur 230 87 143 250 144 106 247 142 105 454788 Makdari 771 310 461 856 468 388 846 466 380 454789 Maharajpura 231 101 130 236 128 108 94 91 3 454790 Satlon 797 336 461 821 503 318 815 499 316 454791 Himmatpura 388 143 245 346 236 110 344 235 109 454792 Thakurpura 497 234 263 345 276 69 288 266 22 454793 Hasanpur 162 53 109 179 96 83 148 75 73 454794 Lakhanpur 433 143 290 435 293 142 423 286 137 454795 Sitapur 88 32 56 79 50 29 66 44 22 454796 Basai 2,203 903 1,300 1,869 1,386 483 1,650 1,352 298 454797 Hirapur 509 212 297 447 245 202 358 221 137 454798 Devgarh 414 177 237 365 190 175 285 148 137 454799 Sanora 557 206 351 498 477 21 482 465 17 454800 Barodi 212 83 129 175 148 27 174 147 27 454801 Rajpur 373 150 223 246 222 24 246 222 24 454802 Samawali 104 47 57 66 58 8 66 58 8 454803 Madguwan 235 80 155 247 167 80 243 167 76 454804 Panuha 179 87 92 116 109 7 116 109 7 454805 Khadrawani 417 162 255 262 255 7 231 225 6 454806 Biloni 708 292 416 512 464 48 451 415 36 454807 Nauner 1,395 559 836 1,193 955 238 1,086 886 200 454808 Rew 443 202 241 218 210 8 217 210 7 454809 Raipur Sani 117 45 72 125 83 42 117 75 42 454810 Kamhar 388 170 218 330 207 123 330 207 123 454811 Pathari 669 297 372 827 467 360 823 465 358 454812 Hatlai 1,109 475 634 993 674 319 889 660 229 454813 Taka Khurd 302 137 165 294 168 126 288 164 124 454814 Chhata 568 209 359 590 388 202 581 386 195 454815 Palipamari 95 35 60 123 69 54 120 67 53
-------------Un-inhabited--------------
98
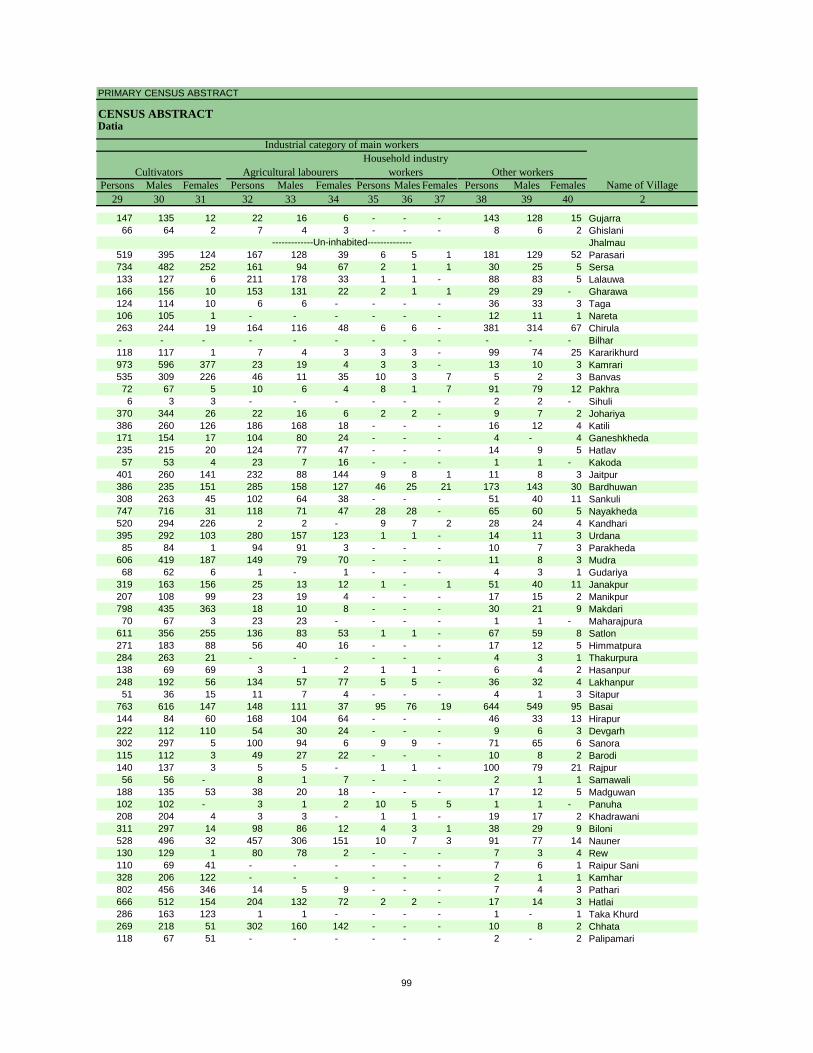
PRIMARY CENSUS ABSTRACT
CENSUS ABSTRACTDatia
Persons Males Females Persons Males Females Persons Males Females Persons Males Females29 30 31 32 33 34 35 36 37 38 39 40 2
CultivatorsName of Village
Household industry workersAgricultural labourers
Industrial category of main workers
Other workers
147 135 12 22 16 6 - - - 143 128 15 Gujarra66 64 2 7 4 3 - - - 8 6 2 Ghislani
Jhalmau519 395 124 167 128 39 6 5 1 181 129 52 Parasari734 482 252 161 94 67 2 1 1 30 25 5 Sersa133 127 6 211 178 33 1 1 - 88 83 5 Lalauwa166 156 10 153 131 22 2 1 1 29 29 - Gharawa124 114 10 6 6 - - - - 36 33 3 Taga106 105 1 - - - - - - 12 11 1 Nareta263 244 19 164 116 48 6 6 - 381 314 67 Chirula- - - - - - - - - - - - Bilhar118 117 1 7 4 3 3 3 - 99 74 25 Kararikhurd973 596 377 23 19 4 3 3 - 13 10 3 Kamrari535 309 226 46 11 35 10 3 7 5 2 3 Banvas72 67 5 10 6 4 8 1 7 91 79 12 Pakhra6 3 3 - - - - - - 2 2 - Sihuli
370 344 26 22 16 6 2 2 - 9 7 2 Johariya386 260 126 186 168 18 - - - 16 12 4 Katili171 154 17 104 80 24 - - - 4 - 4 Ganeshkheda235 215 20 124 77 47 - - - 14 9 5 Hatlav57 53 4 23 7 16 - - - 1 1 - Kakoda
401 260 141 232 88 144 9 8 1 11 8 3 Jaitpur386 235 151 285 158 127 46 25 21 173 143 30 Bardhuwan308 263 45 102 64 38 - - - 51 40 11 Sankuli747 716 31 118 71 47 28 28 - 65 60 5 Nayakheda520 294 226 2 2 - 9 7 2 28 24 4 Kandhari395 292 103 280 157 123 1 1 - 14 11 3 Urdana85 84 1 94 91 3 - - - 10 7 3 Parakheda
606 419 187 149 79 70 - - - 11 8 3 Mudra68 62 6 1 - 1 - - - 4 3 1 Gudariya
319 163 156 25 13 12 1 - 1 51 40 11 Janakpur207 108 99 23 19 4 - - - 17 15 2 Manikpur798 435 363 18 10 8 - - - 30 21 9 Makdari70 67 3 23 23 - - - - 1 1 - Maharajpura
611 356 255 136 83 53 1 1 - 67 59 8 Satlon271 183 88 56 40 16 - - - 17 12 5 Himmatpura284 263 21 - - - - - - 4 3 1 Thakurpura138 69 69 3 1 2 1 1 - 6 4 2 Hasanpur248 192 56 134 57 77 5 5 - 36 32 4 Lakhanpur51 36 15 11 7 4 - - - 4 1 3 Sitapur
763 616 147 148 111 37 95 76 19 644 549 95 Basai144 84 60 168 104 64 - - - 46 33 13 Hirapur222 112 110 54 30 24 - - - 9 6 3 Devgarh302 297 5 100 94 6 9 9 - 71 65 6 Sanora115 112 3 49 27 22 - - - 10 8 2 Barodi140 137 3 5 5 - 1 1 - 100 79 21 Rajpur56 56 - 8 1 7 - - - 2 1 1 Samawali
188 135 53 38 20 18 - - - 17 12 5 Madguwan102 102 - 3 1 2 10 5 5 1 1 - Panuha208 204 4 3 3 - 1 1 - 19 17 2 Khadrawani311 297 14 98 86 12 4 3 1 38 29 9 Biloni528 496 32 457 306 151 10 7 3 91 77 14 Nauner130 129 1 80 78 2 - - - 7 3 4 Rew110 69 41 - - - - - - 7 6 1 Raipur Sani328 206 122 - - - - - - 2 1 1 Kamhar802 456 346 14 5 9 - - - 7 4 3 Pathari666 512 154 204 132 72 2 2 - 17 14 3 Hatlai286 163 123 1 1 - - - - 1 - 1 Taka Khurd269 218 51 302 160 142 - - - 10 8 2 Chhata118 67 51 - - - - - - 2 - 2 Palipamari
-------------Un-inhabited--------------
99
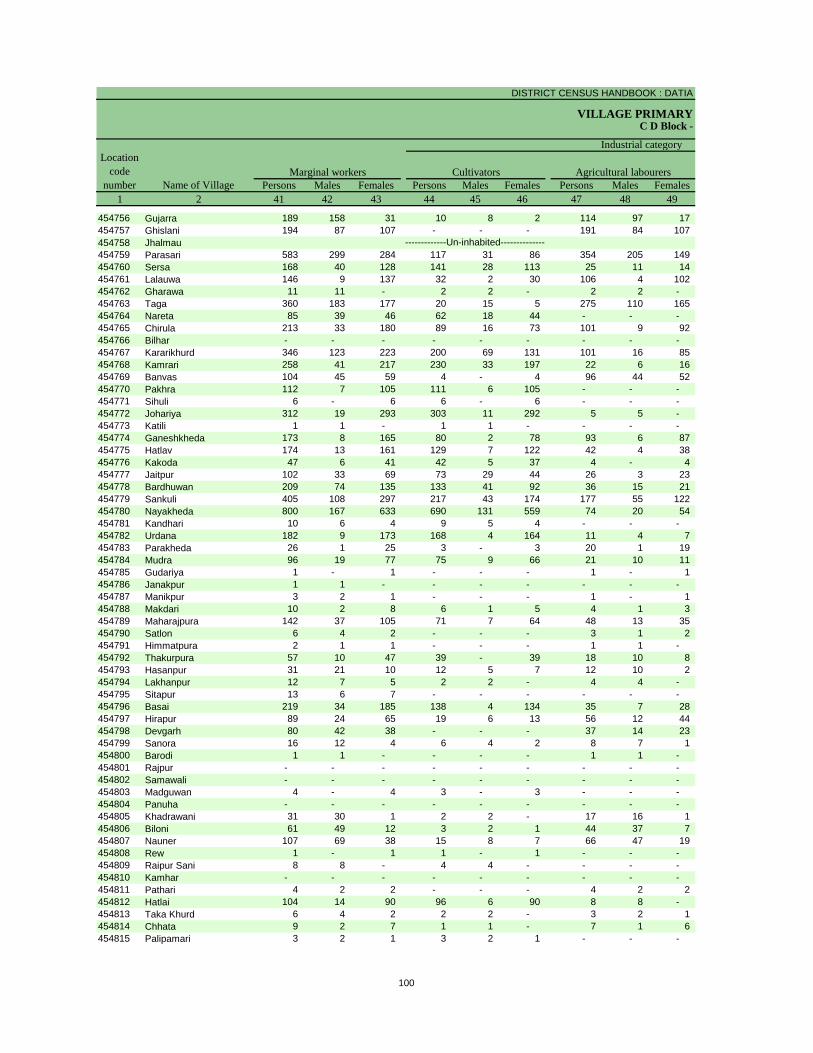
DISTRICT CENSUS HANDBOOK : DATIA
VILLAGE PRIMARYC D Block -
Persons Males Females Persons Males Females Persons Males Females1 2 41 42 43 44 45 46 47 48 49
Name of VillageMarginal workers Cultivators Agricultural labourers
Industrial category Location
code number
454756 Gujarra 189 158 31 10 8 2 114 97 17 454757 Ghislani 194 87 107 - - - 191 84 107 454758 Jhalmau454759 Parasari 583 299 284 117 31 86 354 205 149 454760 Sersa 168 40 128 141 28 113 25 11 14 454761 Lalauwa 146 9 137 32 2 30 106 4 102 454762 Gharawa 11 11 - 2 2 - 2 2 - 454763 Taga 360 183 177 20 15 5 275 110 165 454764 Nareta 85 39 46 62 18 44 - - - 454765 Chirula 213 33 180 89 16 73 101 9 92 454766 Bilhar - - - - - - - - - 454767 Kararikhurd 346 123 223 200 69 131 101 16 85 454768 Kamrari 258 41 217 230 33 197 22 6 16 454769 Banvas 104 45 59 4 - 4 96 44 52 454770 Pakhra 112 7 105 111 6 105 - - - 454771 Sihuli 6 - 6 6 - 6 - - - 454772 Johariya 312 19 293 303 11 292 5 5 - 454773 Katili 1 1 - 1 1 - - - - 454774 Ganeshkheda 173 8 165 80 2 78 93 6 87 454775 Hatlav 174 13 161 129 7 122 42 4 38 454776 Kakoda 47 6 41 42 5 37 4 - 4 454777 Jaitpur 102 33 69 73 29 44 26 3 23 454778 Bardhuwan 209 74 135 133 41 92 36 15 21 454779 Sankuli 405 108 297 217 43 174 177 55 122 454780 Nayakheda 800 167 633 690 131 559 74 20 54 454781 Kandhari 10 6 4 9 5 4 - - - 454782 Urdana 182 9 173 168 4 164 11 4 7 454783 Parakheda 26 1 25 3 - 3 20 1 19 454784 Mudra 96 19 77 75 9 66 21 10 11 454785 Gudariya 1 - 1 - - - 1 - 1 454786 Janakpur 1 1 - - - - - - - 454787 Manikpur 3 2 1 - - - 1 - 1 454788 Makdari 10 2 8 6 1 5 4 1 3 454789 Maharajpura 142 37 105 71 7 64 48 13 35 454790 Satlon 6 4 2 - - - 3 1 2 454791 Himmatpura 2 1 1 - - - 1 1 - 454792 Thakurpura 57 10 47 39 - 39 18 10 8 454793 Hasanpur 31 21 10 12 5 7 12 10 2 454794 Lakhanpur 12 7 5 2 2 - 4 4 - 454795 Sitapur 13 6 7 - - - - - - 454796 Basai 219 34 185 138 4 134 35 7 28 454797 Hirapur 89 24 65 19 6 13 56 12 44 454798 Devgarh 80 42 38 - - - 37 14 23 454799 Sanora 16 12 4 6 4 2 8 7 1 454800 Barodi 1 1 - - - - 1 1 - 454801 Rajpur - - - - - - - - - 454802 Samawali - - - - - - - - - 454803 Madguwan 4 - 4 3 - 3 - - - 454804 Panuha - - - - - - - - - 454805 Khadrawani 31 30 1 2 2 - 17 16 1 454806 Biloni 61 49 12 3 2 1 44 37 7 454807 Nauner 107 69 38 15 8 7 66 47 19 454808 Rew 1 - 1 1 - 1 - - - 454809 Raipur Sani 8 8 - 4 4 - - - - 454810 Kamhar - - - - - - - - - 454811 Pathari 4 2 2 - - - 4 2 2 454812 Hatlai 104 14 90 96 6 90 8 8 - 454813 Taka Khurd 6 4 2 2 2 - 3 2 1 454814 Chhata 9 2 7 1 1 - 7 1 6 454815 Palipamari 3 2 1 3 2 1 - - -
-------------Un-inhabited--------------
100
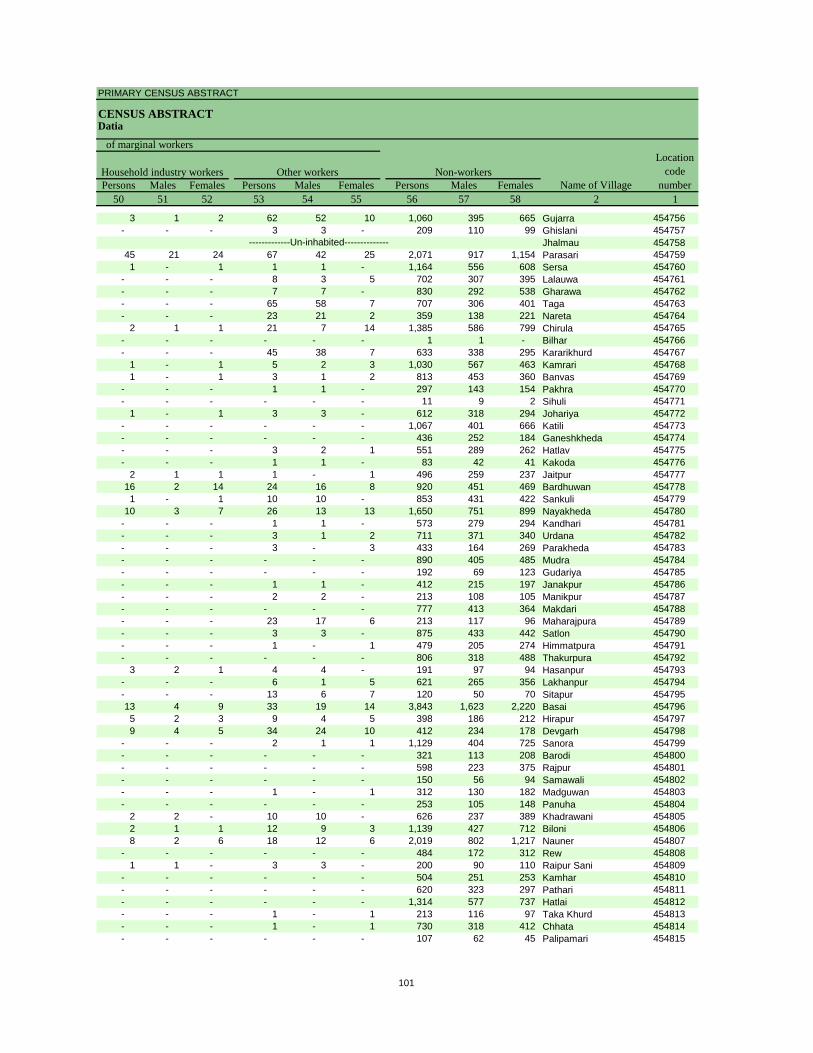
PRIMARY CENSUS ABSTRACT
CENSUS ABSTRACTDatia
Persons Males Females Persons Males Females Persons Males Females50 51 52 53 54 55 56 57 58 2 1
Location code
numberHousehold industry workers
Name of VillageOther workers Non-workers
of marginal workers
3 1 2 62 52 10 1,060 395 665 Gujarra 454756- - - 3 3 - 209 110 99 Ghislani 454757
Jhalmau 45475845 21 24 67 42 25 2,071 917 1,154 Parasari 4547591 - 1 1 1 - 1,164 556 608 Sersa 454760
- - - 8 3 5 702 307 395 Lalauwa 454761- - - 7 7 - 830 292 538 Gharawa 454762- - - 65 58 7 707 306 401 Taga 454763- - - 23 21 2 359 138 221 Nareta 454764
2 1 1 21 7 14 1,385 586 799 Chirula 454765- - - - - - 1 1 - Bilhar 454766- - - 45 38 7 633 338 295 Kararikhurd 454767
1 - 1 5 2 3 1,030 567 463 Kamrari 4547681 - 1 3 1 2 813 453 360 Banvas 454769
- - - 1 1 - 297 143 154 Pakhra 454770- - - - - - 11 9 2 Sihuli 454771
1 - 1 3 3 - 612 318 294 Johariya 454772- - - - - - 1,067 401 666 Katili 454773- - - - - - 436 252 184 Ganeshkheda 454774- - - 3 2 1 551 289 262 Hatlav 454775- - - 1 1 - 83 42 41 Kakoda 454776
2 1 1 1 - 1 496 259 237 Jaitpur 45477716 2 14 24 16 8 920 451 469 Bardhuwan 4547781 - 1 10 10 - 853 431 422 Sankuli 454779
10 3 7 26 13 13 1,650 751 899 Nayakheda 454780- - - 1 1 - 573 279 294 Kandhari 454781- - - 3 1 2 711 371 340 Urdana 454782- - - 3 - 3 433 164 269 Parakheda 454783- - - - - - 890 405 485 Mudra 454784- - - - - - 192 69 123 Gudariya 454785- - - 1 1 - 412 215 197 Janakpur 454786- - - 2 2 - 213 108 105 Manikpur 454787- - - - - - 777 413 364 Makdari 454788- - - 23 17 6 213 117 96 Maharajpura 454789- - - 3 3 - 875 433 442 Satlon 454790- - - 1 - 1 479 205 274 Himmatpura 454791- - - - - - 806 318 488 Thakurpura 454792
3 2 1 4 4 - 191 97 94 Hasanpur 454793- - - 6 1 5 621 265 356 Lakhanpur 454794- - - 13 6 7 120 50 70 Sitapur 45479513 4 9 33 19 14 3,843 1,623 2,220 Basai 4547965 2 3 9 4 5 398 186 212 Hirapur 4547979 4 5 34 24 10 412 234 178 Devgarh 454798
- - - 2 1 1 1,129 404 725 Sanora 454799- - - - - - 321 113 208 Barodi 454800- - - - - - 598 223 375 Rajpur 454801- - - - - - 150 56 94 Samawali 454802- - - 1 - 1 312 130 182 Madguwan 454803- - - - - - 253 105 148 Panuha 454804
2 2 - 10 10 - 626 237 389 Khadrawani 4548052 1 1 12 9 3 1,139 427 712 Biloni 4548068 2 6 18 12 6 2,019 802 1,217 Nauner 454807
- - - - - - 484 172 312 Rew 4548081 1 - 3 3 - 200 90 110 Raipur Sani 454809
- - - - - - 504 251 253 Kamhar 454810- - - - - - 620 323 297 Pathari 454811- - - - - - 1,314 577 737 Hatlai 454812- - - 1 - 1 213 116 97 Taka Khurd 454813- - - 1 - 1 730 318 412 Chhata 454814- - - - - - 107 62 45 Palipamari 454815
-------------Un-inhabited--------------
101
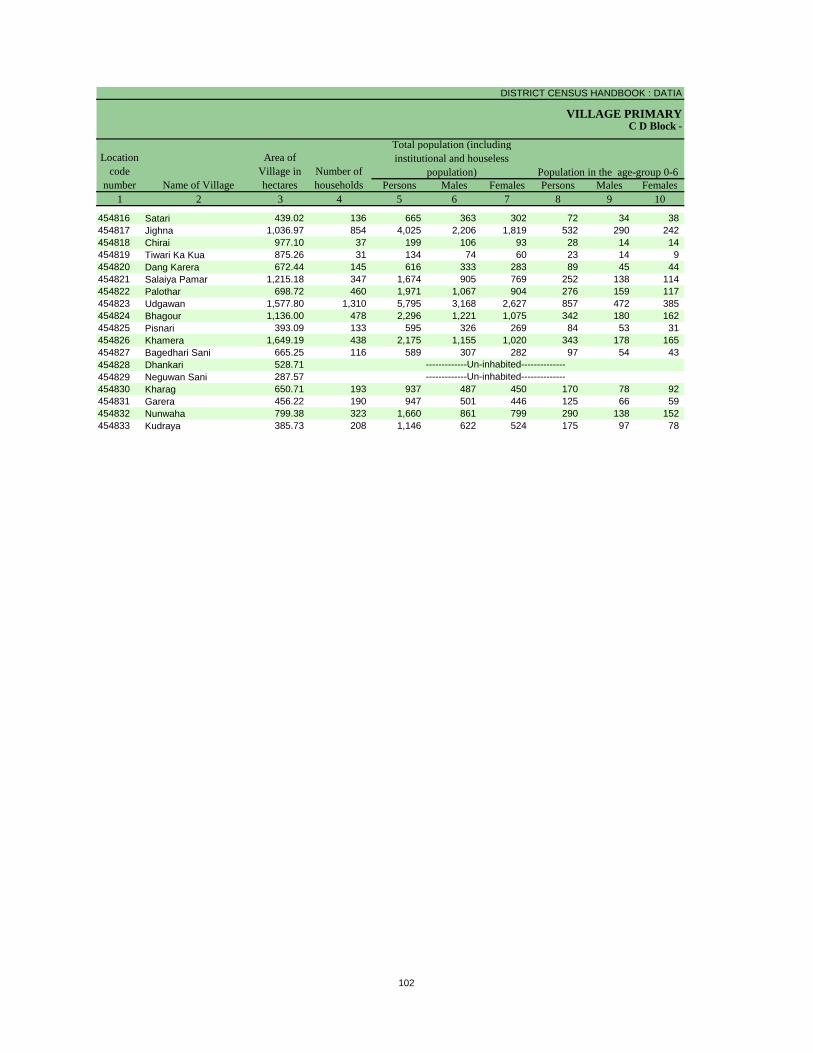
DISTRICT CENSUS HANDBOOK : DATIA
VILLAGE PRIMARY
Persons Males Females Persons Males Females1 2 3 4 5 6 7 8 9 10
Name of Village
Location code
number
Total population (including institutional and houseless
population)Area of
Village in hectares
Number of households
C D Block -
Population in the age-group 0-6
454816 Satari 439.02 136 665 363 302 72 34 38 454817 Jighna 1,036.97 854 4,025 2,206 1,819 532 290 242 454818 Chirai 977.10 37 199 106 93 28 14 14 454819 Tiwari Ka Kua 875.26 31 134 74 60 23 14 9 454820 Dang Karera 672.44 145 616 333 283 89 45 44 454821 Salaiya Pamar 1,215.18 347 1,674 905 769 252 138 114 454822 Palothar 698.72 460 1,971 1,067 904 276 159 117 454823 Udgawan 1,577.80 1,310 5,795 3,168 2,627 857 472 385 454824 Bhagour 1,136.00 478 2,296 1,221 1,075 342 180 162 454825 Pisnari 393.09 133 595 326 269 84 53 31 454826 Khamera 1,649.19 438 2,175 1,155 1,020 343 178 165 454827 Bagedhari Sani 665.25 116 589 307 282 97 54 43 454828 Dhankari 528.71454829 Neguwan Sani 287.57454830 Kharag 650.71 193 937 487 450 170 78 92 454831 Garera 456.22 190 947 501 446 125 66 59 454832 Nunwaha 799.38 323 1,660 861 799 290 138 152 454833 Kudraya 385.73 208 1,146 622 524 175 97 78
-------------Un-inhabited---------------------------Un-inhabited--------------
102
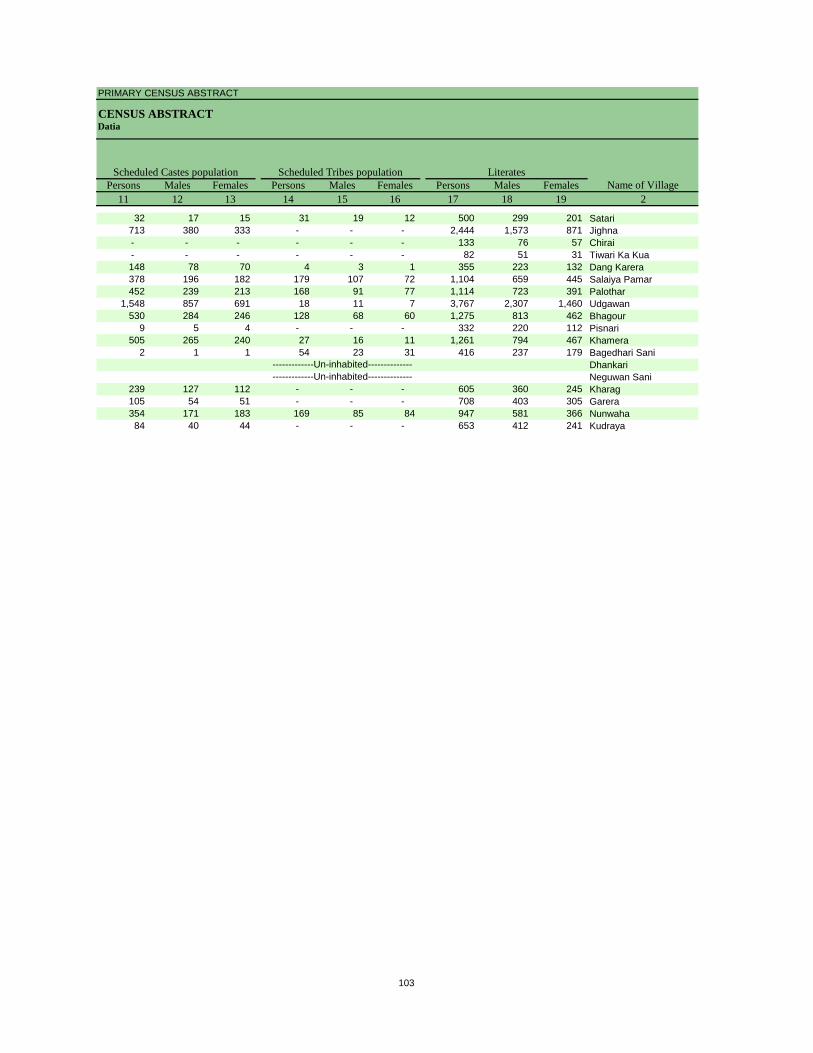
PRIMARY CENSUS ABSTRACT
CENSUS ABSTRACTDatia
Persons Males Females Persons Males Females Persons Males Females11 12 13 14 15 16 17 18 19 2
Name of VillageLiteratesScheduled Castes population Scheduled Tribes population
32 17 15 31 19 12 500 299 201 Satari713 380 333 - - - 2,444 1,573 871 Jighna- - - - - - 133 76 57 Chirai- - - - - - 82 51 31 Tiwari Ka Kua148 78 70 4 3 1 355 223 132 Dang Karera378 196 182 179 107 72 1,104 659 445 Salaiya Pamar452 239 213 168 91 77 1,114 723 391 Palothar
1,548 857 691 18 11 7 3,767 2,307 1,460 Udgawan530 284 246 128 68 60 1,275 813 462 Bhagour
9 5 4 - - - 332 220 112 Pisnari505 265 240 27 16 11 1,261 794 467 Khamera
2 1 1 54 23 31 416 237 179 Bagedhari SaniDhankariNeguwan Sani
239 127 112 - - - 605 360 245 Kharag105 54 51 - - - 708 403 305 Garera354 171 183 169 85 84 947 581 366 Nunwaha84 40 44 - - - 653 412 241 Kudraya
-------------Un-inhabited---------------------------Un-inhabited--------------
103
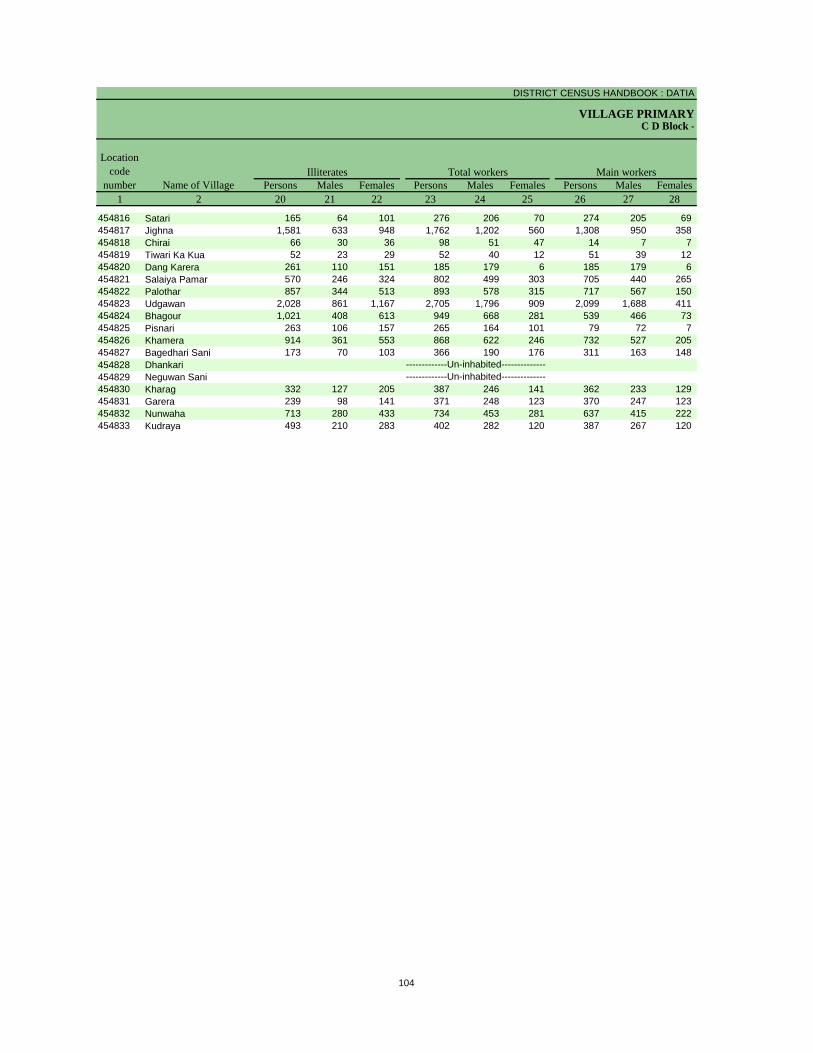
DISTRICT CENSUS HANDBOOK : DATIA
VILLAGE PRIMARYC D Block -
Persons Males Females Persons Males Females Persons Males Females1 2 20 21 22 23 24 25 26 27 28
Name of Village
Location code
numberIlliterates Total workers Main workers
454816 Satari 165 64 101 276 206 70 274 205 69 454817 Jighna 1,581 633 948 1,762 1,202 560 1,308 950 358 454818 Chirai 66 30 36 98 51 47 14 7 7 454819 Tiwari Ka Kua 52 23 29 52 40 12 51 39 12 454820 Dang Karera 261 110 151 185 179 6 185 179 6 454821 Salaiya Pamar 570 246 324 802 499 303 705 440 265 454822 Palothar 857 344 513 893 578 315 717 567 150 454823 Udgawan 2,028 861 1,167 2,705 1,796 909 2,099 1,688 411 454824 Bhagour 1,021 408 613 949 668 281 539 466 73 454825 Pisnari 263 106 157 265 164 101 79 72 7 454826 Khamera 914 361 553 868 622 246 732 527 205 454827 Bagedhari Sani 173 70 103 366 190 176 311 163 148 454828 Dhankari454829 Neguwan Sani454830 Kharag 332 127 205 387 246 141 362 233 129 454831 Garera 239 98 141 371 248 123 370 247 123 454832 Nunwaha 713 280 433 734 453 281 637 415 222 454833 Kudraya 493 210 283 402 282 120 387 267 120
-------------Un-inhabited---------------------------Un-inhabited--------------
104
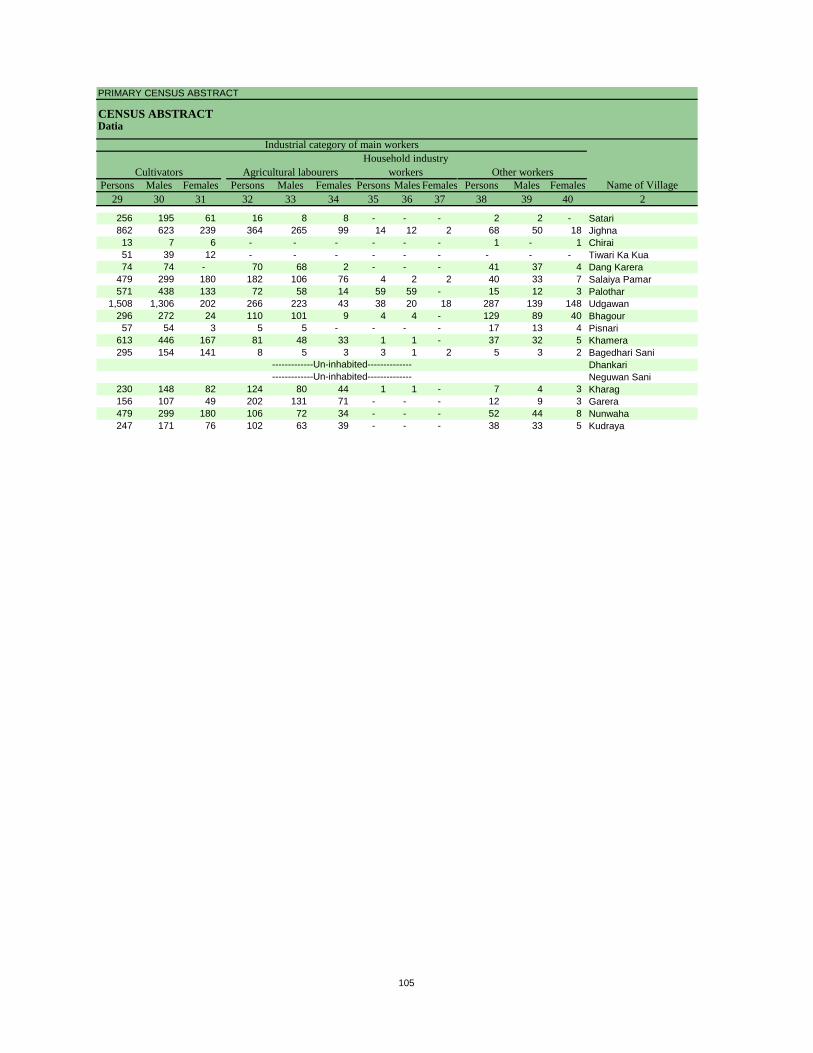
PRIMARY CENSUS ABSTRACT
CENSUS ABSTRACTDatia
Persons Males Females Persons Males Females Persons Males Females Persons Males Females29 30 31 32 33 34 35 36 37 38 39 40 2
CultivatorsName of Village
Household industry workersAgricultural labourers
Industrial category of main workers
Other workers
256 195 61 16 8 8 - - - 2 2 - Satari862 623 239 364 265 99 14 12 2 68 50 18 Jighna13 7 6 - - - - - - 1 - 1 Chirai51 39 12 - - - - - - - - - Tiwari Ka Kua74 74 - 70 68 2 - - - 41 37 4 Dang Karera
479 299 180 182 106 76 4 2 2 40 33 7 Salaiya Pamar571 438 133 72 58 14 59 59 - 15 12 3 Palothar
1,508 1,306 202 266 223 43 38 20 18 287 139 148 Udgawan296 272 24 110 101 9 4 4 - 129 89 40 Bhagour57 54 3 5 5 - - - - 17 13 4 Pisnari
613 446 167 81 48 33 1 1 - 37 32 5 Khamera295 154 141 8 5 3 3 1 2 5 3 2 Bagedhari Sani
DhankariNeguwan Sani
230 148 82 124 80 44 1 1 - 7 4 3 Kharag156 107 49 202 131 71 - - - 12 9 3 Garera479 299 180 106 72 34 - - - 52 44 8 Nunwaha247 171 76 102 63 39 - - - 38 33 5 Kudraya
-------------Un-inhabited---------------------------Un-inhabited--------------
105
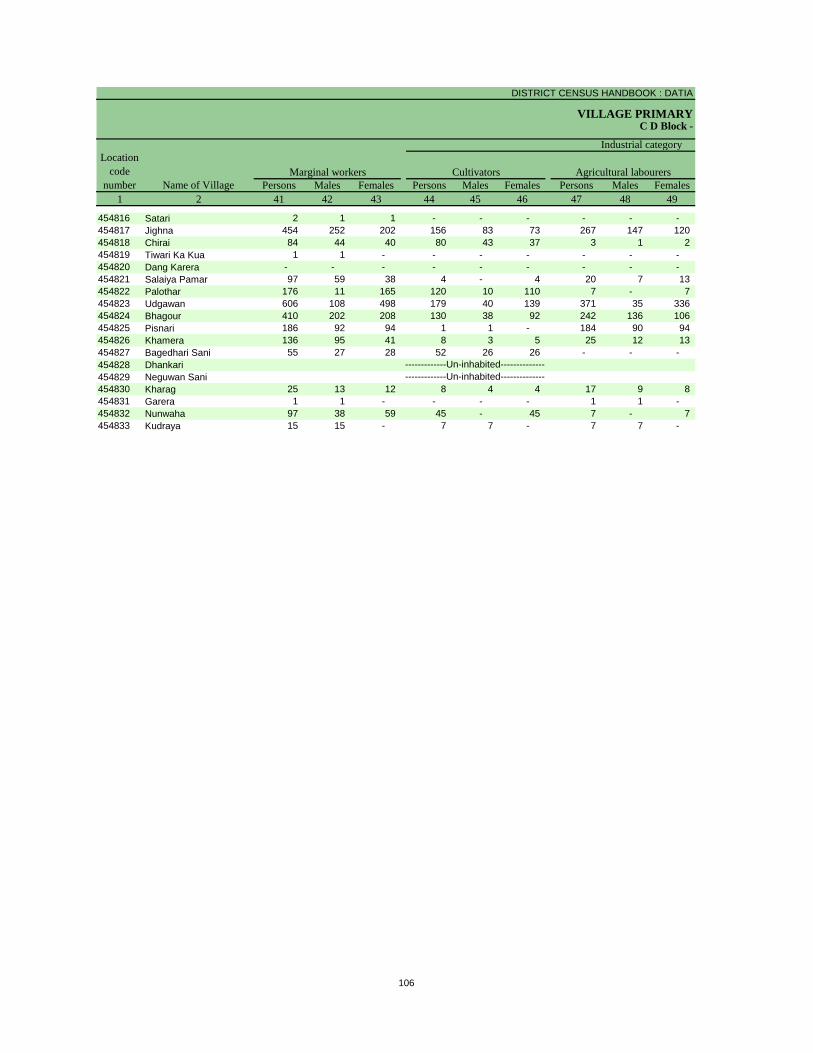
DISTRICT CENSUS HANDBOOK : DATIA
VILLAGE PRIMARYC D Block -
Persons Males Females Persons Males Females Persons Males Females1 2 41 42 43 44 45 46 47 48 49
Name of VillageMarginal workers Cultivators Agricultural labourers
Industrial category Location
code number
454816 Satari 2 1 1 - - - - - - 454817 Jighna 454 252 202 156 83 73 267 147 120 454818 Chirai 84 44 40 80 43 37 3 1 2 454819 Tiwari Ka Kua 1 1 - - - - - - - 454820 Dang Karera - - - - - - - - - 454821 Salaiya Pamar 97 59 38 4 - 4 20 7 13 454822 Palothar 176 11 165 120 10 110 7 - 7 454823 Udgawan 606 108 498 179 40 139 371 35 336 454824 Bhagour 410 202 208 130 38 92 242 136 106 454825 Pisnari 186 92 94 1 1 - 184 90 94 454826 Khamera 136 95 41 8 3 5 25 12 13 454827 Bagedhari Sani 55 27 28 52 26 26 - - - 454828 Dhankari454829 Neguwan Sani454830 Kharag 25 13 12 8 4 4 17 9 8 454831 Garera 1 1 - - - - 1 1 - 454832 Nunwaha 97 38 59 45 - 45 7 - 7 454833 Kudraya 15 15 - 7 7 - 7 7 -
-------------Un-inhabited---------------------------Un-inhabited--------------
106
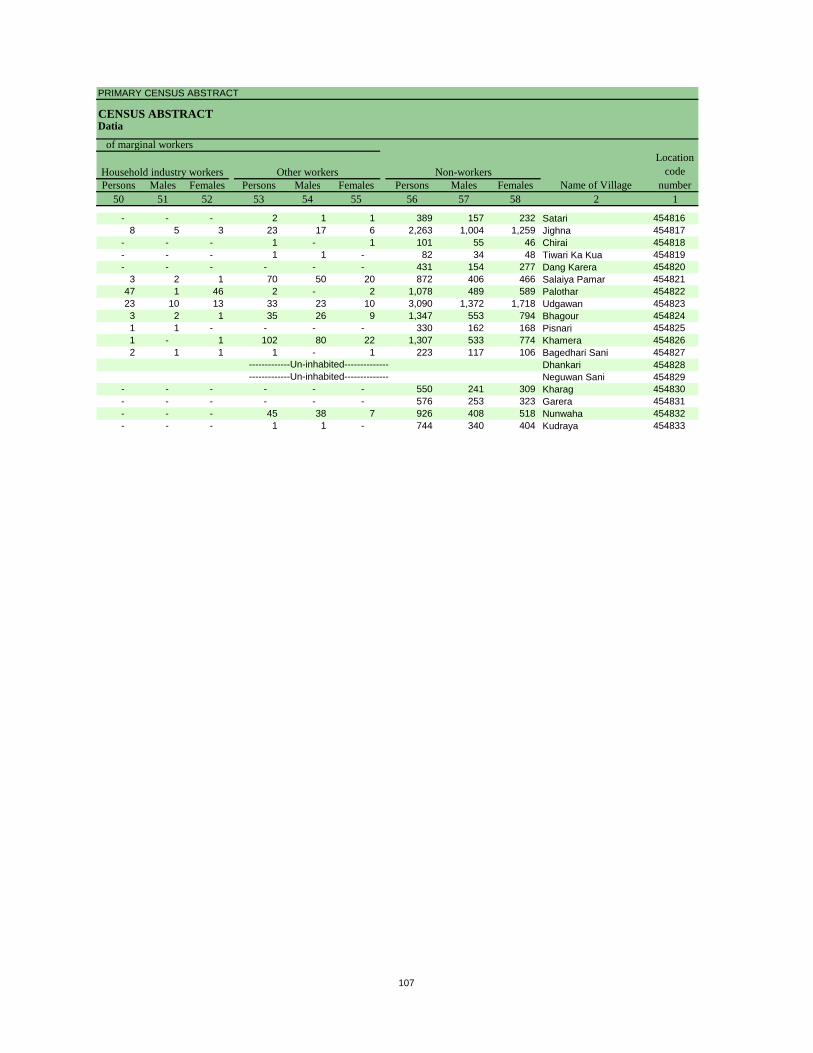
PRIMARY CENSUS ABSTRACT
CENSUS ABSTRACTDatia
Persons Males Females Persons Males Females Persons Males Females50 51 52 53 54 55 56 57 58 2 1
Location code
numberHousehold industry workers
Name of VillageOther workers Non-workers
of marginal workers
- - - 2 1 1 389 157 232 Satari 4548168 5 3 23 17 6 2,263 1,004 1,259 Jighna 454817
- - - 1 - 1 101 55 46 Chirai 454818- - - 1 1 - 82 34 48 Tiwari Ka Kua 454819- - - - - - 431 154 277 Dang Karera 454820
3 2 1 70 50 20 872 406 466 Salaiya Pamar 45482147 1 46 2 - 2 1,078 489 589 Palothar 45482223 10 13 33 23 10 3,090 1,372 1,718 Udgawan 4548233 2 1 35 26 9 1,347 553 794 Bhagour 4548241 1 - - - - 330 162 168 Pisnari 4548251 - 1 102 80 22 1,307 533 774 Khamera 4548262 1 1 1 - 1 223 117 106 Bagedhari Sani 454827
Dhankari 454828Neguwan Sani 454829
- - - - - - 550 241 309 Kharag 454830- - - - - - 576 253 323 Garera 454831- - - 45 38 7 926 408 518 Nunwaha 454832- - - 1 1 - 744 340 404 Kudraya 454833
-------------Un-inhabited---------------------------Un-inhabited--------------
107
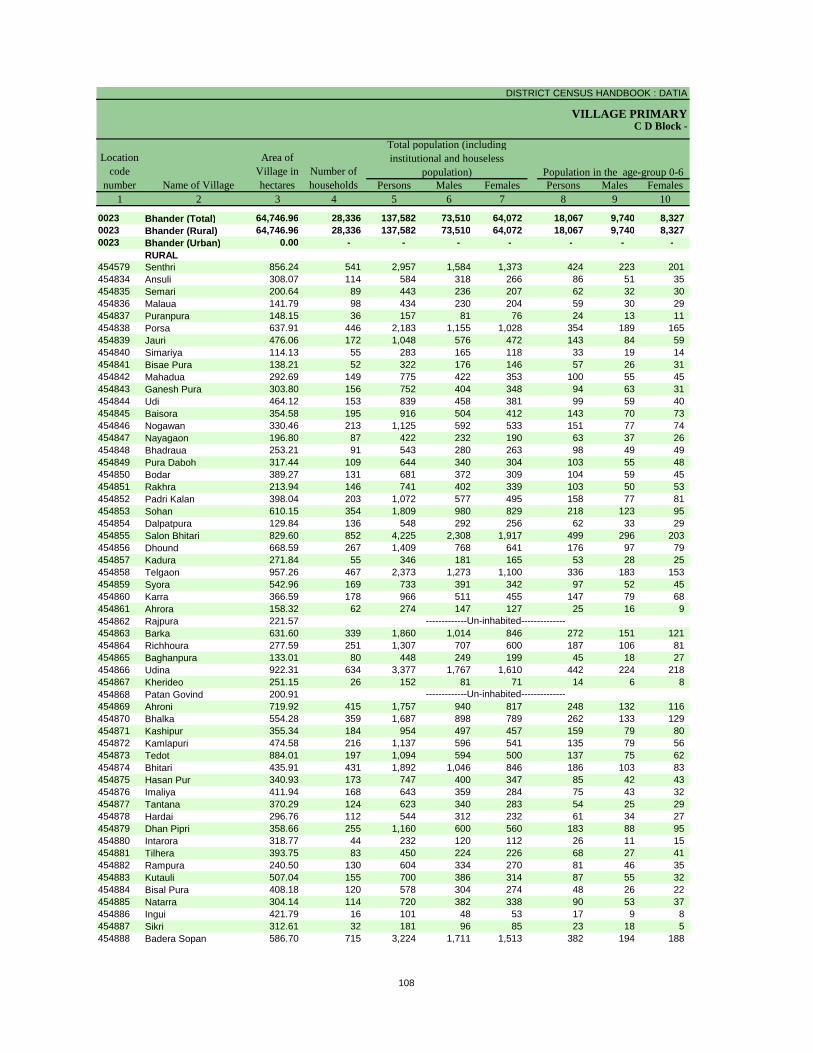
DISTRICT CENSUS HANDBOOK : DATIA
VILLAGE PRIMARY
Persons Males Females Persons Males Females1 2 3 4 5 6 7 8 9 10
0023 Bhander (Total) 64,746.96 28,336 137,582 73,510 64,072 18,067 9,740 8,327 0023 Bhander (Rural) 64,746.96 28,336 137,582 73,510 64,072 18,067 9,740 8,327 0023 Bhander (Urban) 0.00 - - - - - - -
RURAL454579 Senthri 856.24 541 2,957 1,584 1,373 424 223 201 454834 Ansuli 308.07 114 584 318 266 86 51 35 454835 Semari 200.64 89 443 236 207 62 32 30 454836 Malaua 141.79 98 434 230 204 59 30 29 454837 Puranpura 148.15 36 157 81 76 24 13 11 454838 Porsa 637.91 446 2,183 1,155 1,028 354 189 165 454839 Jauri 476.06 172 1,048 576 472 143 84 59 454840 Simariya 114.13 55 283 165 118 33 19 14 454841 Bisae Pura 138.21 52 322 176 146 57 26 31 454842 Mahadua 292.69 149 775 422 353 100 55 45 454843 Ganesh Pura 303.80 156 752 404 348 94 63 31 454844 Udi 464.12 153 839 458 381 99 59 40 454845 Baisora 354.58 195 916 504 412 143 70 73 454846 Nogawan 330.46 213 1,125 592 533 151 77 74 454847 Nayagaon 196.80 87 422 232 190 63 37 26 454848 Bhadraua 253.21 91 543 280 263 98 49 49 454849 Pura Daboh 317.44 109 644 340 304 103 55 48 454850 Bodar 389.27 131 681 372 309 104 59 45 454851 Rakhra 213.94 146 741 402 339 103 50 53 454852 Padri Kalan 398.04 203 1,072 577 495 158 77 81 454853 Sohan 610.15 354 1,809 980 829 218 123 95 454854 Dalpatpura 129.84 136 548 292 256 62 33 29 454855 Salon Bhitari 829.60 852 4,225 2,308 1,917 499 296 203 454856 Dhound 668.59 267 1,409 768 641 176 97 79 454857 Kadura 271.84 55 346 181 165 53 28 25 454858 Telgaon 957.26 467 2,373 1,273 1,100 336 183 153 454859 Syora 542.96 169 733 391 342 97 52 45 454860 Karra 366.59 178 966 511 455 147 79 68 454861 Ahrora 158.32 62 274 147 127 25 16 9 454862 Rajpura 221.57454863 Barka 631.60 339 1,860 1,014 846 272 151 121 454864 Richhoura 277.59 251 1,307 707 600 187 106 81 454865 Baghanpura 133.01 80 448 249 199 45 18 27 454866 Udina 922.31 634 3,377 1,767 1,610 442 224 218 454867 Kherideo 251.15 26 152 81 71 14 6 8 454868 Patan Govind 200.91454869 Ahroni 719.92 415 1,757 940 817 248 132 116 454870 Bhalka 554.28 359 1,687 898 789 262 133 129 454871 Kashipur 355.34 184 954 497 457 159 79 80 454872 Kamlapuri 474.58 216 1,137 596 541 135 79 56 454873 Tedot 884.01 197 1,094 594 500 137 75 62 454874 Bhitari 435.91 431 1,892 1,046 846 186 103 83 454875 Hasan Pur 340.93 173 747 400 347 85 42 43 454876 Imaliya 411.94 168 643 359 284 75 43 32 454877 Tantana 370.29 124 623 340 283 54 25 29 454878 Hardai 296.76 112 544 312 232 61 34 27 454879 Dhan Pipri 358.66 255 1,160 600 560 183 88 95 454880 Intarora 318.77 44 232 120 112 26 11 15 454881 Tilhera 393.75 83 450 224 226 68 27 41 454882 Rampura 240.50 130 604 334 270 81 46 35 454883 Kutauli 507.04 155 700 386 314 87 55 32 454884 Bisal Pura 408.18 120 578 304 274 48 26 22 454885 Natarra 304.14 114 720 382 338 90 53 37 454886 Ingui 421.79 16 101 48 53 17 9 8 454887 Sikri 312.61 32 181 96 85 23 18 5 454888 Badera Sopan 586.70 715 3,224 1,711 1,513 382 194 188
Name of Village
Location code
number
Total population (including institutional and houseless
population)Area of
Village in hectares
Number of households
C D Block -
Population in the age-group 0-6
-------------Un-inhabited--------------
-------------Un-inhabited--------------
108
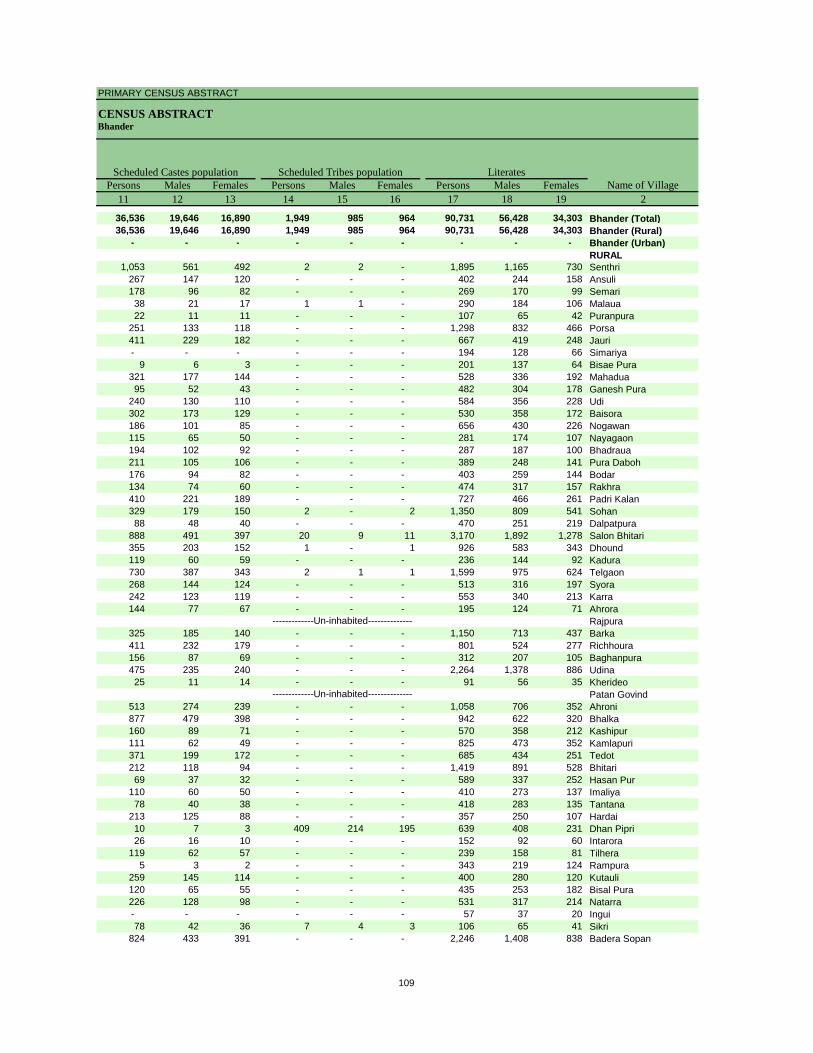
PRIMARY CENSUS ABSTRACT
CENSUS ABSTRACTBhander
Persons Males Females Persons Males Females Persons Males Females11 12 13 14 15 16 17 18 19 2
36,536 19,646 16,890 1,949 985 964 90,731 56,428 34,303 Bhander (Total)36,536 19,646 16,890 1,949 985 964 90,731 56,428 34,303 Bhander (Rural)
- - - - - - - - - Bhander (Urban)RURAL
1,053 561 492 2 2 - 1,895 1,165 730 Senthri267 147 120 - - - 402 244 158 Ansuli178 96 82 - - - 269 170 99 Semari38 21 17 1 1 - 290 184 106 Malaua22 11 11 - - - 107 65 42 Puranpura
251 133 118 - - - 1,298 832 466 Porsa411 229 182 - - - 667 419 248 Jauri- - - - - - 194 128 66 Simariya
9 6 3 - - - 201 137 64 Bisae Pura321 177 144 - - - 528 336 192 Mahadua95 52 43 - - - 482 304 178 Ganesh Pura
240 130 110 - - - 584 356 228 Udi302 173 129 - - - 530 358 172 Baisora186 101 85 - - - 656 430 226 Nogawan115 65 50 - - - 281 174 107 Nayagaon194 102 92 - - - 287 187 100 Bhadraua211 105 106 - - - 389 248 141 Pura Daboh176 94 82 - - - 403 259 144 Bodar134 74 60 - - - 474 317 157 Rakhra410 221 189 - - - 727 466 261 Padri Kalan329 179 150 2 - 2 1,350 809 541 Sohan88 48 40 - - - 470 251 219 Dalpatpura
888 491 397 20 9 11 3,170 1,892 1,278 Salon Bhitari355 203 152 1 - 1 926 583 343 Dhound119 60 59 - - - 236 144 92 Kadura730 387 343 2 1 1 1,599 975 624 Telgaon268 144 124 - - - 513 316 197 Syora242 123 119 - - - 553 340 213 Karra144 77 67 - - - 195 124 71 Ahrora
Rajpura325 185 140 - - - 1,150 713 437 Barka411 232 179 - - - 801 524 277 Richhoura156 87 69 - - - 312 207 105 Baghanpura475 235 240 - - - 2,264 1,378 886 Udina25 11 14 - - - 91 56 35 Kherideo
Patan Govind513 274 239 - - - 1,058 706 352 Ahroni877 479 398 - - - 942 622 320 Bhalka160 89 71 - - - 570 358 212 Kashipur111 62 49 - - - 825 473 352 Kamlapuri371 199 172 - - - 685 434 251 Tedot212 118 94 - - - 1,419 891 528 Bhitari69 37 32 - - - 589 337 252 Hasan Pur
110 60 50 - - - 410 273 137 Imaliya78 40 38 - - - 418 283 135 Tantana
213 125 88 - - - 357 250 107 Hardai10 7 3 409 214 195 639 408 231 Dhan Pipri26 16 10 - - - 152 92 60 Intarora
119 62 57 - - - 239 158 81 Tilhera5 3 2 - - - 343 219 124 Rampura
259 145 114 - - - 400 280 120 Kutauli120 65 55 - - - 435 253 182 Bisal Pura226 128 98 - - - 531 317 214 Natarra- - - - - - 57 37 20 Ingui78 42 36 7 4 3 106 65 41 Sikri
824 433 391 - - - 2,246 1,408 838 Badera Sopan
Name of VillageLiteratesScheduled Castes population Scheduled Tribes population
-------------Un-inhabited--------------
-------------Un-inhabited--------------
109
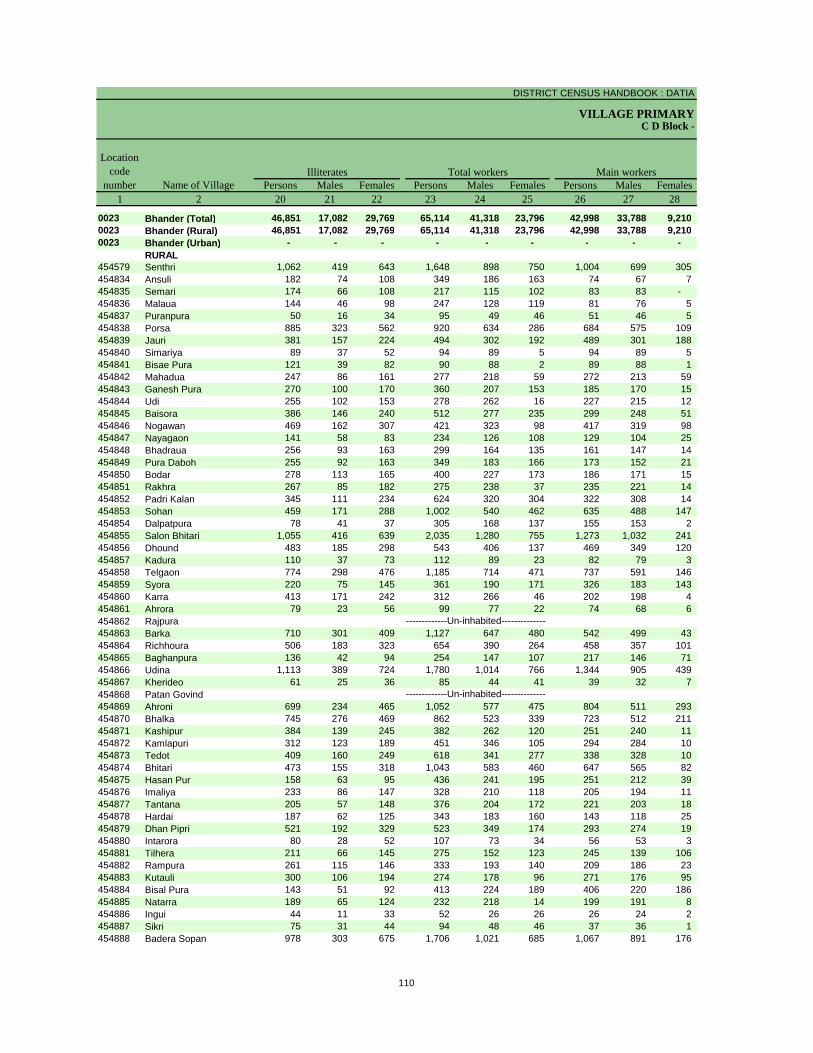
DISTRICT CENSUS HANDBOOK : DATIA
VILLAGE PRIMARYC D Block -
Persons Males Females Persons Males Females Persons Males Females1 2 20 21 22 23 24 25 26 27 28
0023 Bhander (Total) 46,851 17,082 29,769 65,114 41,318 23,796 42,998 33,788 9,210 0023 Bhander (Rural) 46,851 17,082 29,769 65,114 41,318 23,796 42,998 33,788 9,210 0023 Bhander (Urban) - - - - - - - - -
RURAL454579 Senthri 1,062 419 643 1,648 898 750 1,004 699 305 454834 Ansuli 182 74 108 349 186 163 74 67 7 454835 Semari 174 66 108 217 115 102 83 83 - 454836 Malaua 144 46 98 247 128 119 81 76 5 454837 Puranpura 50 16 34 95 49 46 51 46 5 454838 Porsa 885 323 562 920 634 286 684 575 109 454839 Jauri 381 157 224 494 302 192 489 301 188 454840 Simariya 89 37 52 94 89 5 94 89 5 454841 Bisae Pura 121 39 82 90 88 2 89 88 1 454842 Mahadua 247 86 161 277 218 59 272 213 59 454843 Ganesh Pura 270 100 170 360 207 153 185 170 15 454844 Udi 255 102 153 278 262 16 227 215 12 454845 Baisora 386 146 240 512 277 235 299 248 51 454846 Nogawan 469 162 307 421 323 98 417 319 98 454847 Nayagaon 141 58 83 234 126 108 129 104 25 454848 Bhadraua 256 93 163 299 164 135 161 147 14 454849 Pura Daboh 255 92 163 349 183 166 173 152 21 454850 Bodar 278 113 165 400 227 173 186 171 15 454851 Rakhra 267 85 182 275 238 37 235 221 14 454852 Padri Kalan 345 111 234 624 320 304 322 308 14 454853 Sohan 459 171 288 1,002 540 462 635 488 147 454854 Dalpatpura 78 41 37 305 168 137 155 153 2 454855 Salon Bhitari 1,055 416 639 2,035 1,280 755 1,273 1,032 241 454856 Dhound 483 185 298 543 406 137 469 349 120 454857 Kadura 110 37 73 112 89 23 82 79 3 454858 Telgaon 774 298 476 1,185 714 471 737 591 146 454859 Syora 220 75 145 361 190 171 326 183 143 454860 Karra 413 171 242 312 266 46 202 198 4 454861 Ahrora 79 23 56 99 77 22 74 68 6 454862 Rajpura454863 Barka 710 301 409 1,127 647 480 542 499 43 454864 Richhoura 506 183 323 654 390 264 458 357 101 454865 Baghanpura 136 42 94 254 147 107 217 146 71 454866 Udina 1,113 389 724 1,780 1,014 766 1,344 905 439 454867 Kherideo 61 25 36 85 44 41 39 32 7 454868 Patan Govind454869 Ahroni 699 234 465 1,052 577 475 804 511 293 454870 Bhalka 745 276 469 862 523 339 723 512 211 454871 Kashipur 384 139 245 382 262 120 251 240 11 454872 Kamlapuri 312 123 189 451 346 105 294 284 10 454873 Tedot 409 160 249 618 341 277 338 328 10 454874 Bhitari 473 155 318 1,043 583 460 647 565 82 454875 Hasan Pur 158 63 95 436 241 195 251 212 39 454876 Imaliya 233 86 147 328 210 118 205 194 11 454877 Tantana 205 57 148 376 204 172 221 203 18 454878 Hardai 187 62 125 343 183 160 143 118 25 454879 Dhan Pipri 521 192 329 523 349 174 293 274 19 454880 Intarora 80 28 52 107 73 34 56 53 3 454881 Tilhera 211 66 145 275 152 123 245 139 106 454882 Rampura 261 115 146 333 193 140 209 186 23 454883 Kutauli 300 106 194 274 178 96 271 176 95 454884 Bisal Pura 143 51 92 413 224 189 406 220 186 454885 Natarra 189 65 124 232 218 14 199 191 8 454886 Ingui 44 11 33 52 26 26 26 24 2 454887 Sikri 75 31 44 94 48 46 37 36 1 454888 Badera Sopan 978 303 675 1,706 1,021 685 1,067 891 176
Name of Village
Location code
numberIlliterates Total workers Main workers
-------------Un-inhabited--------------
-------------Un-inhabited--------------
110
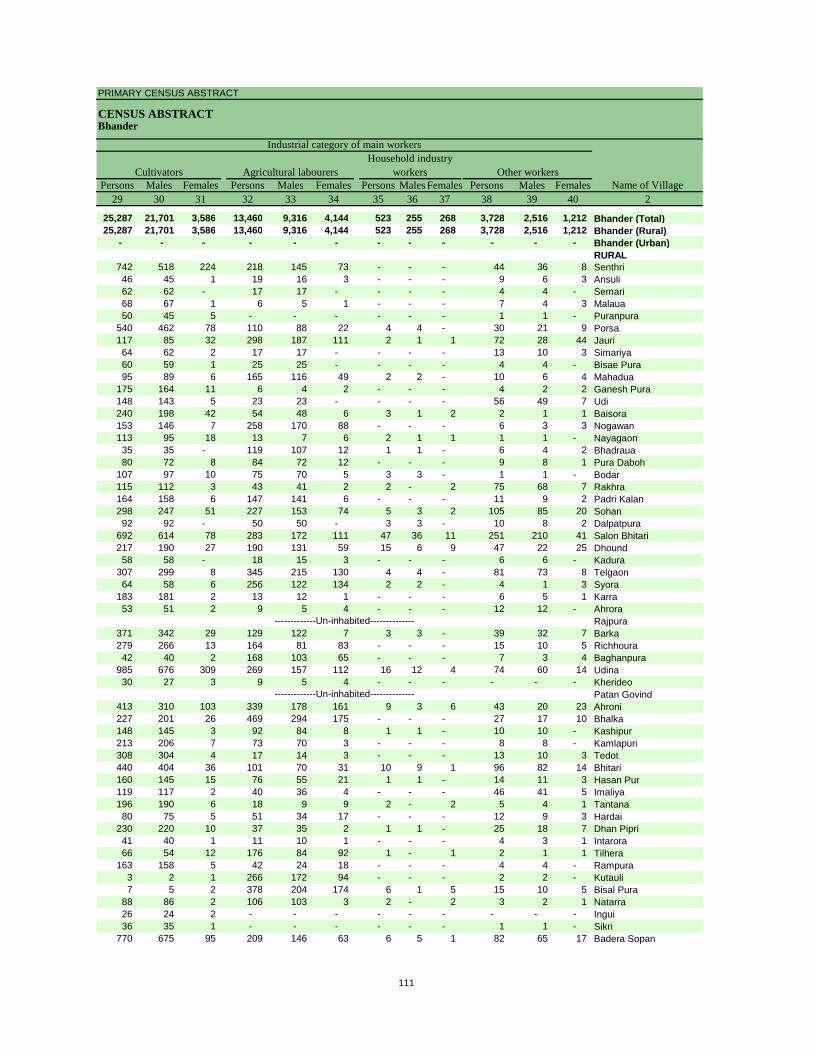
PRIMARY CENSUS ABSTRACT
CENSUS ABSTRACTBhander
Persons Males Females Persons Males Females Persons Males Females Persons Males Females29 30 31 32 33 34 35 36 37 38 39 40 2
25,287 21,701 3,586 13,460 9,316 4,144 523 255 268 3,728 2,516 1,212 Bhander (Total)25,287 21,701 3,586 13,460 9,316 4,144 523 255 268 3,728 2,516 1,212 Bhander (Rural)
- - - - - - - - - - - - Bhander (Urban)RURAL
742 518 224 218 145 73 - - - 44 36 8 Senthri46 45 1 19 16 3 - - - 9 6 3 Ansuli62 62 - 17 17 - - - - 4 4 - Semari68 67 1 6 5 1 - - - 7 4 3 Malaua50 45 5 - - - - - - 1 1 - Puranpura
540 462 78 110 88 22 4 4 - 30 21 9 Porsa117 85 32 298 187 111 2 1 1 72 28 44 Jauri64 62 2 17 17 - - - - 13 10 3 Simariya60 59 1 25 25 - - - - 4 4 - Bisae Pura95 89 6 165 116 49 2 2 - 10 6 4 Mahadua
175 164 11 6 4 2 - - - 4 2 2 Ganesh Pura148 143 5 23 23 - - - - 56 49 7 Udi240 198 42 54 48 6 3 1 2 2 1 1 Baisora153 146 7 258 170 88 - - - 6 3 3 Nogawan113 95 18 13 7 6 2 1 1 1 1 - Nayagaon35 35 - 119 107 12 1 1 - 6 4 2 Bhadraua80 72 8 84 72 12 - - - 9 8 1 Pura Daboh
107 97 10 75 70 5 3 3 - 1 1 - Bodar115 112 3 43 41 2 2 - 2 75 68 7 Rakhra164 158 6 147 141 6 - - - 11 9 2 Padri Kalan298 247 51 227 153 74 5 3 2 105 85 20 Sohan92 92 - 50 50 - 3 3 - 10 8 2 Dalpatpura
692 614 78 283 172 111 47 36 11 251 210 41 Salon Bhitari217 190 27 190 131 59 15 6 9 47 22 25 Dhound58 58 - 18 15 3 - - - 6 6 - Kadura
307 299 8 345 215 130 4 4 - 81 73 8 Telgaon64 58 6 256 122 134 2 2 - 4 1 3 Syora
183 181 2 13 12 1 - - - 6 5 1 Karra53 51 2 9 5 4 - - - 12 12 - Ahrora
Rajpura371 342 29 129 122 7 3 3 - 39 32 7 Barka279 266 13 164 81 83 - - - 15 10 5 Richhoura42 40 2 168 103 65 - - - 7 3 4 Baghanpura
985 676 309 269 157 112 16 12 4 74 60 14 Udina30 27 3 9 5 4 - - - - - - Kherideo
Patan Govind413 310 103 339 178 161 9 3 6 43 20 23 Ahroni227 201 26 469 294 175 - - - 27 17 10 Bhalka148 145 3 92 84 8 1 1 - 10 10 - Kashipur213 206 7 73 70 3 - - - 8 8 - Kamlapuri308 304 4 17 14 3 - - - 13 10 3 Tedot440 404 36 101 70 31 10 9 1 96 82 14 Bhitari160 145 15 76 55 21 1 1 - 14 11 3 Hasan Pur119 117 2 40 36 4 - - - 46 41 5 Imaliya196 190 6 18 9 9 2 - 2 5 4 1 Tantana80 75 5 51 34 17 - - - 12 9 3 Hardai
230 220 10 37 35 2 1 1 - 25 18 7 Dhan Pipri41 40 1 11 10 1 - - - 4 3 1 Intarora66 54 12 176 84 92 1 - 1 2 1 1 Tilhera
163 158 5 42 24 18 - - - 4 4 - Rampura3 2 1 266 172 94 - - - 2 2 - Kutauli7 5 2 378 204 174 6 1 5 15 10 5 Bisal Pura
88 86 2 106 103 3 2 - 2 3 2 1 Natarra26 24 2 - - - - - - - - - Ingui36 35 1 - - - - - - 1 1 - Sikri
770 675 95 209 146 63 6 5 1 82 65 17 Badera Sopan
CultivatorsName of Village
Household industry workersAgricultural labourers
Industrial category of main workers
Other workers
-------------Un-inhabited--------------
-------------Un-inhabited--------------
111
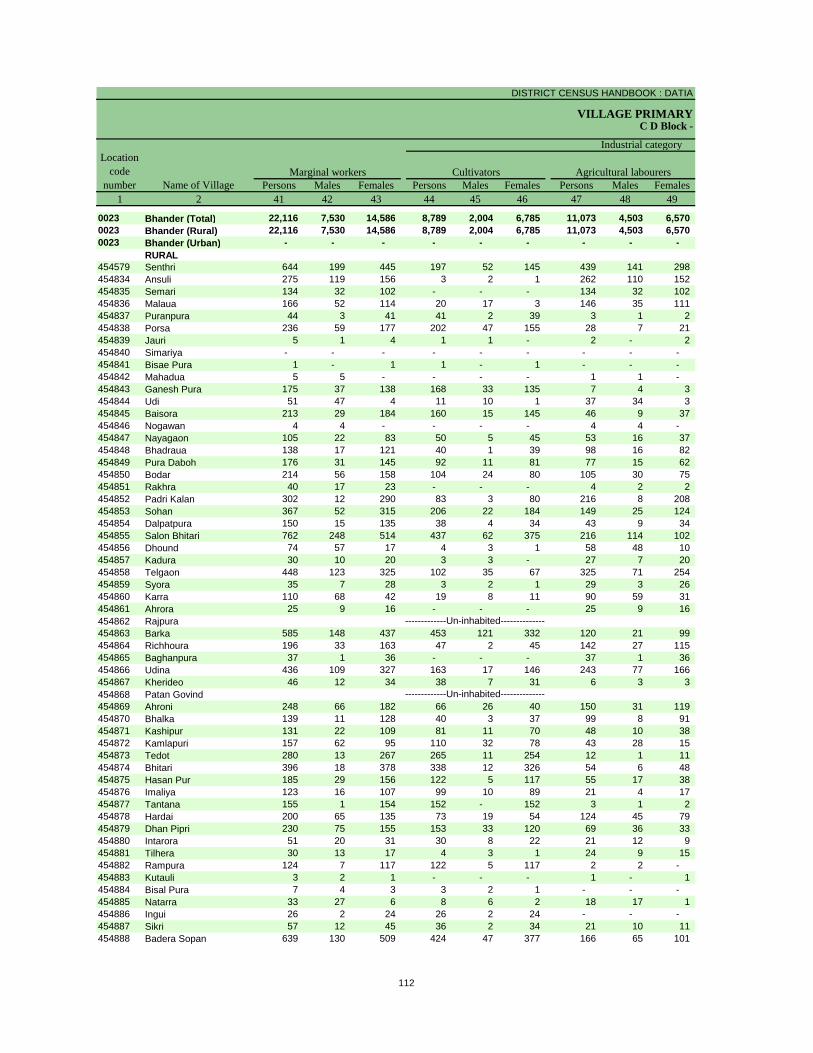
DISTRICT CENSUS HANDBOOK : DATIA
VILLAGE PRIMARYC D Block -
Persons Males Females Persons Males Females Persons Males Females1 2 41 42 43 44 45 46 47 48 49
0023 Bhander (Total) 22,116 7,530 14,586 8,789 2,004 6,785 11,073 4,503 6,570 0023 Bhander (Rural) 22,116 7,530 14,586 8,789 2,004 6,785 11,073 4,503 6,570 0023 Bhander (Urban) - - - - - - - - -
RURAL454579 Senthri 644 199 445 197 52 145 439 141 298 454834 Ansuli 275 119 156 3 2 1 262 110 152 454835 Semari 134 32 102 - - - 134 32 102 454836 Malaua 166 52 114 20 17 3 146 35 111 454837 Puranpura 44 3 41 41 2 39 3 1 2 454838 Porsa 236 59 177 202 47 155 28 7 21 454839 Jauri 5 1 4 1 1 - 2 - 2 454840 Simariya - - - - - - - - - 454841 Bisae Pura 1 - 1 1 - 1 - - - 454842 Mahadua 5 5 - - - - 1 1 - 454843 Ganesh Pura 175 37 138 168 33 135 7 4 3 454844 Udi 51 47 4 11 10 1 37 34 3 454845 Baisora 213 29 184 160 15 145 46 9 37 454846 Nogawan 4 4 - - - - 4 4 - 454847 Nayagaon 105 22 83 50 5 45 53 16 37 454848 Bhadraua 138 17 121 40 1 39 98 16 82 454849 Pura Daboh 176 31 145 92 11 81 77 15 62 454850 Bodar 214 56 158 104 24 80 105 30 75 454851 Rakhra 40 17 23 - - - 4 2 2 454852 Padri Kalan 302 12 290 83 3 80 216 8 208 454853 Sohan 367 52 315 206 22 184 149 25 124 454854 Dalpatpura 150 15 135 38 4 34 43 9 34 454855 Salon Bhitari 762 248 514 437 62 375 216 114 102 454856 Dhound 74 57 17 4 3 1 58 48 10 454857 Kadura 30 10 20 3 3 - 27 7 20 454858 Telgaon 448 123 325 102 35 67 325 71 254 454859 Syora 35 7 28 3 2 1 29 3 26 454860 Karra 110 68 42 19 8 11 90 59 31 454861 Ahrora 25 9 16 - - - 25 9 16 454862 Rajpura454863 Barka 585 148 437 453 121 332 120 21 99 454864 Richhoura 196 33 163 47 2 45 142 27 115 454865 Baghanpura 37 1 36 - - - 37 1 36 454866 Udina 436 109 327 163 17 146 243 77 166 454867 Kherideo 46 12 34 38 7 31 6 3 3 454868 Patan Govind454869 Ahroni 248 66 182 66 26 40 150 31 119 454870 Bhalka 139 11 128 40 3 37 99 8 91 454871 Kashipur 131 22 109 81 11 70 48 10 38 454872 Kamlapuri 157 62 95 110 32 78 43 28 15 454873 Tedot 280 13 267 265 11 254 12 1 11 454874 Bhitari 396 18 378 338 12 326 54 6 48 454875 Hasan Pur 185 29 156 122 5 117 55 17 38 454876 Imaliya 123 16 107 99 10 89 21 4 17 454877 Tantana 155 1 154 152 - 152 3 1 2 454878 Hardai 200 65 135 73 19 54 124 45 79 454879 Dhan Pipri 230 75 155 153 33 120 69 36 33 454880 Intarora 51 20 31 30 8 22 21 12 9 454881 Tilhera 30 13 17 4 3 1 24 9 15 454882 Rampura 124 7 117 122 5 117 2 2 - 454883 Kutauli 3 2 1 - - - 1 - 1 454884 Bisal Pura 7 4 3 3 2 1 - - - 454885 Natarra 33 27 6 8 6 2 18 17 1 454886 Ingui 26 2 24 26 2 24 - - - 454887 Sikri 57 12 45 36 2 34 21 10 11 454888 Badera Sopan 639 130 509 424 47 377 166 65 101
Name of VillageMarginal workers Cultivators Agricultural labourers
Industrial category Location
code number
-------------Un-inhabited--------------
-------------Un-inhabited--------------
112
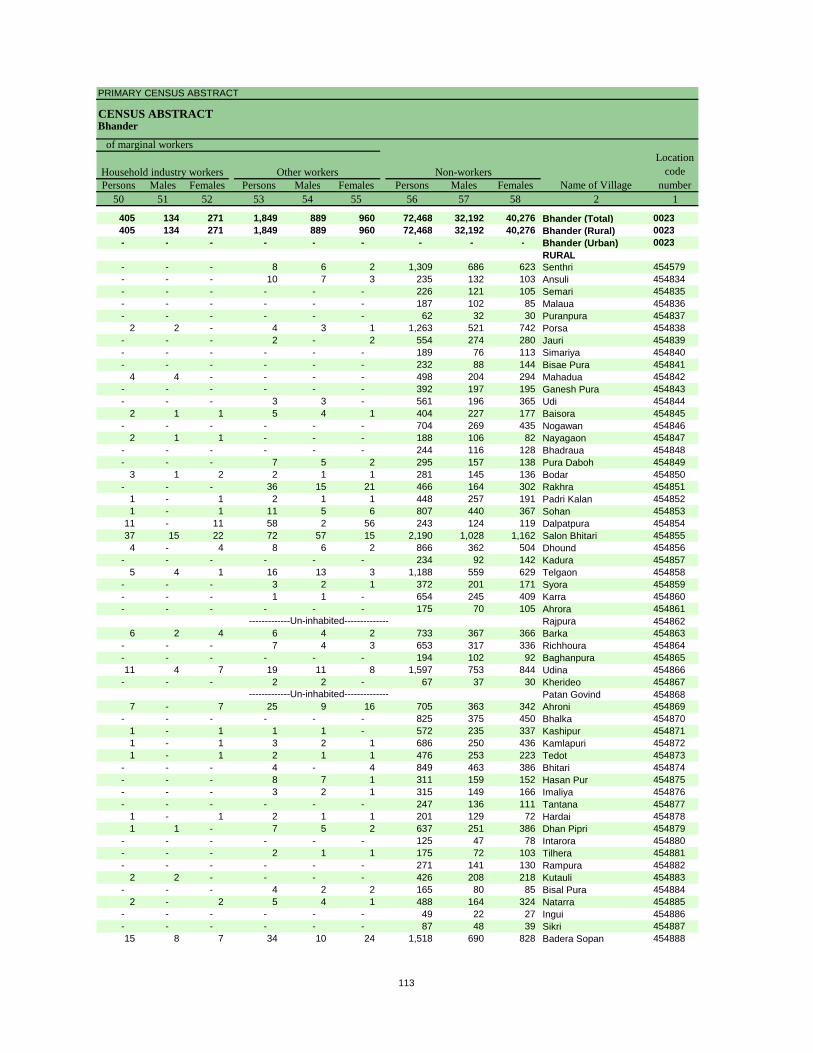
PRIMARY CENSUS ABSTRACT
CENSUS ABSTRACTBhander
Persons Males Females Persons Males Females Persons Males Females50 51 52 53 54 55 56 57 58 2 1
405 134 271 1,849 889 960 72,468 32,192 40,276 Bhander (Total) 0023405 134 271 1,849 889 960 72,468 32,192 40,276 Bhander (Rural) 0023- - - - - - - - - Bhander (Urban) 0023
RURAL- - - 8 6 2 1,309 686 623 Senthri 454579- - - 10 7 3 235 132 103 Ansuli 454834- - - - - - 226 121 105 Semari 454835- - - - - - 187 102 85 Malaua 454836- - - - - - 62 32 30 Puranpura 454837
2 2 - 4 3 1 1,263 521 742 Porsa 454838- - - 2 - 2 554 274 280 Jauri 454839- - - - - - 189 76 113 Simariya 454840- - - - - - 232 88 144 Bisae Pura 454841
4 4 - - - - 498 204 294 Mahadua 454842- - - - - - 392 197 195 Ganesh Pura 454843- - - 3 3 - 561 196 365 Udi 454844
2 1 1 5 4 1 404 227 177 Baisora 454845- - - - - - 704 269 435 Nogawan 454846
2 1 1 - - - 188 106 82 Nayagaon 454847- - - - - - 244 116 128 Bhadraua 454848- - - 7 5 2 295 157 138 Pura Daboh 454849
3 1 2 2 1 1 281 145 136 Bodar 454850- - - 36 15 21 466 164 302 Rakhra 454851
1 - 1 2 1 1 448 257 191 Padri Kalan 4548521 - 1 11 5 6 807 440 367 Sohan 454853
11 - 11 58 2 56 243 124 119 Dalpatpura 45485437 15 22 72 57 15 2,190 1,028 1,162 Salon Bhitari 4548554 - 4 8 6 2 866 362 504 Dhound 454856
- - - - - - 234 92 142 Kadura 4548575 4 1 16 13 3 1,188 559 629 Telgaon 454858
- - - 3 2 1 372 201 171 Syora 454859- - - 1 1 - 654 245 409 Karra 454860- - - - - - 175 70 105 Ahrora 454861
Rajpura 4548626 2 4 6 4 2 733 367 366 Barka 454863
- - - 7 4 3 653 317 336 Richhoura 454864- - - - - - 194 102 92 Baghanpura 45486511 4 7 19 11 8 1,597 753 844 Udina 454866
- - - 2 2 - 67 37 30 Kherideo 454867Patan Govind 454868
7 - 7 25 9 16 705 363 342 Ahroni 454869- - - - - - 825 375 450 Bhalka 454870
1 - 1 1 1 - 572 235 337 Kashipur 4548711 - 1 3 2 1 686 250 436 Kamlapuri 4548721 - 1 2 1 1 476 253 223 Tedot 454873
- - - 4 - 4 849 463 386 Bhitari 454874- - - 8 7 1 311 159 152 Hasan Pur 454875- - - 3 2 1 315 149 166 Imaliya 454876- - - - - - 247 136 111 Tantana 454877
1 - 1 2 1 1 201 129 72 Hardai 4548781 1 - 7 5 2 637 251 386 Dhan Pipri 454879
- - - - - - 125 47 78 Intarora 454880- - - 2 1 1 175 72 103 Tilhera 454881- - - - - - 271 141 130 Rampura 454882
2 2 - - - - 426 208 218 Kutauli 454883- - - 4 2 2 165 80 85 Bisal Pura 454884
2 - 2 5 4 1 488 164 324 Natarra 454885- - - - - - 49 22 27 Ingui 454886- - - - - - 87 48 39 Sikri 45488715 8 7 34 10 24 1,518 690 828 Badera Sopan 454888
Location code
numberHousehold industry workers
Name of VillageOther workers Non-workers
of marginal workers
-------------Un-inhabited--------------
-------------Un-inhabited--------------
113
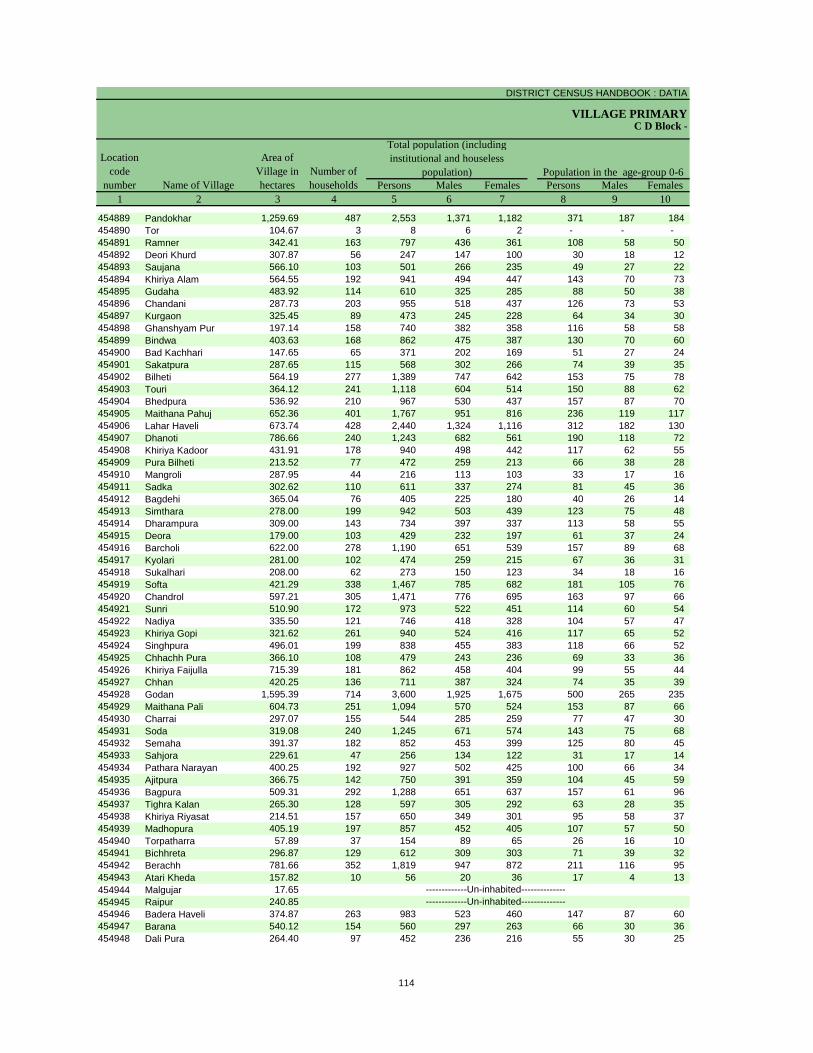
DISTRICT CENSUS HANDBOOK : DATIA
VILLAGE PRIMARY
Persons Males Females Persons Males Females1 2 3 4 5 6 7 8 9 10
Name of Village
Location code
number
Total population (including institutional and houseless
population)Area of
Village in hectares
Number of households
C D Block -
Population in the age-group 0-6
454889 Pandokhar 1,259.69 487 2,553 1,371 1,182 371 187 184 454890 Tor 104.67 3 8 6 2 - - - 454891 Ramner 342.41 163 797 436 361 108 58 50 454892 Deori Khurd 307.87 56 247 147 100 30 18 12 454893 Saujana 566.10 103 501 266 235 49 27 22 454894 Khiriya Alam 564.55 192 941 494 447 143 70 73 454895 Gudaha 483.92 114 610 325 285 88 50 38 454896 Chandani 287.73 203 955 518 437 126 73 53 454897 Kurgaon 325.45 89 473 245 228 64 34 30 454898 Ghanshyam Pur 197.14 158 740 382 358 116 58 58 454899 Bindwa 403.63 168 862 475 387 130 70 60 454900 Bad Kachhari 147.65 65 371 202 169 51 27 24 454901 Sakatpura 287.65 115 568 302 266 74 39 35 454902 Bilheti 564.19 277 1,389 747 642 153 75 78 454903 Touri 364.12 241 1,118 604 514 150 88 62 454904 Bhedpura 536.92 210 967 530 437 157 87 70 454905 Maithana Pahuj 652.36 401 1,767 951 816 236 119 117 454906 Lahar Haveli 673.74 428 2,440 1,324 1,116 312 182 130 454907 Dhanoti 786.66 240 1,243 682 561 190 118 72 454908 Khiriya Kadoor 431.91 178 940 498 442 117 62 55 454909 Pura Bilheti 213.52 77 472 259 213 66 38 28 454910 Mangroli 287.95 44 216 113 103 33 17 16 454911 Sadka 302.62 110 611 337 274 81 45 36 454912 Bagdehi 365.04 76 405 225 180 40 26 14 454913 Simthara 278.00 199 942 503 439 123 75 48 454914 Dharampura 309.00 143 734 397 337 113 58 55 454915 Deora 179.00 103 429 232 197 61 37 24 454916 Barcholi 622.00 278 1,190 651 539 157 89 68 454917 Kyolari 281.00 102 474 259 215 67 36 31 454918 Sukalhari 208.00 62 273 150 123 34 18 16 454919 Softa 421.29 338 1,467 785 682 181 105 76 454920 Chandrol 597.21 305 1,471 776 695 163 97 66 454921 Sunri 510.90 172 973 522 451 114 60 54 454922 Nadiya 335.50 121 746 418 328 104 57 47 454923 Khiriya Gopi 321.62 261 940 524 416 117 65 52 454924 Singhpura 496.01 199 838 455 383 118 66 52 454925 Chhachh Pura 366.10 108 479 243 236 69 33 36 454926 Khiriya Faijulla 715.39 181 862 458 404 99 55 44 454927 Chhan 420.25 136 711 387 324 74 35 39 454928 Godan 1,595.39 714 3,600 1,925 1,675 500 265 235 454929 Maithana Pali 604.73 251 1,094 570 524 153 87 66 454930 Charrai 297.07 155 544 285 259 77 47 30 454931 Soda 319.08 240 1,245 671 574 143 75 68 454932 Semaha 391.37 182 852 453 399 125 80 45 454933 Sahjora 229.61 47 256 134 122 31 17 14 454934 Pathara Narayan 400.25 192 927 502 425 100 66 34 454935 Ajitpura 366.75 142 750 391 359 104 45 59 454936 Bagpura 509.31 292 1,288 651 637 157 61 96 454937 Tighra Kalan 265.30 128 597 305 292 63 28 35 454938 Khiriya Riyasat 214.51 157 650 349 301 95 58 37 454939 Madhopura 405.19 197 857 452 405 107 57 50 454940 Torpatharra 57.89 37 154 89 65 26 16 10 454941 Bichhreta 296.87 129 612 309 303 71 39 32 454942 Berachh 781.66 352 1,819 947 872 211 116 95 454943 Atari Kheda 157.82 10 56 20 36 17 4 13 454944 Malgujar 17.65454945 Raipur 240.85454946 Badera Haveli 374.87 263 983 523 460 147 87 60 454947 Barana 540.12 154 560 297 263 66 30 36 454948 Dali Pura 264.40 97 452 236 216 55 30 25
-------------Un-inhabited---------------------------Un-inhabited--------------
114
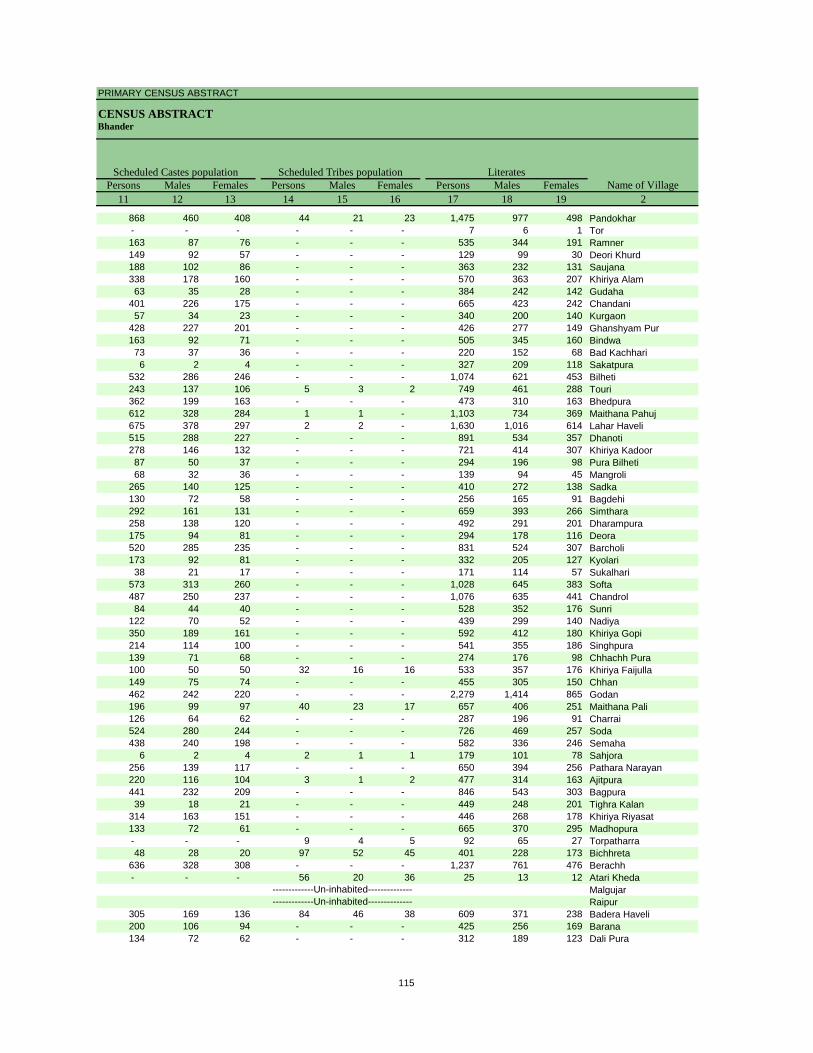
PRIMARY CENSUS ABSTRACT
CENSUS ABSTRACTBhander
Persons Males Females Persons Males Females Persons Males Females11 12 13 14 15 16 17 18 19 2
Name of VillageLiteratesScheduled Castes population Scheduled Tribes population
868 460 408 44 21 23 1,475 977 498 Pandokhar- - - - - - 7 6 1 Tor163 87 76 - - - 535 344 191 Ramner149 92 57 - - - 129 99 30 Deori Khurd188 102 86 - - - 363 232 131 Saujana338 178 160 - - - 570 363 207 Khiriya Alam63 35 28 - - - 384 242 142 Gudaha
401 226 175 - - - 665 423 242 Chandani57 34 23 - - - 340 200 140 Kurgaon
428 227 201 - - - 426 277 149 Ghanshyam Pur163 92 71 - - - 505 345 160 Bindwa73 37 36 - - - 220 152 68 Bad Kachhari6 2 4 - - - 327 209 118 Sakatpura
532 286 246 - - - 1,074 621 453 Bilheti243 137 106 5 3 2 749 461 288 Touri362 199 163 - - - 473 310 163 Bhedpura612 328 284 1 1 - 1,103 734 369 Maithana Pahuj675 378 297 2 2 - 1,630 1,016 614 Lahar Haveli515 288 227 - - - 891 534 357 Dhanoti278 146 132 - - - 721 414 307 Khiriya Kadoor87 50 37 - - - 294 196 98 Pura Bilheti68 32 36 - - - 139 94 45 Mangroli
265 140 125 - - - 410 272 138 Sadka130 72 58 - - - 256 165 91 Bagdehi292 161 131 - - - 659 393 266 Simthara258 138 120 - - - 492 291 201 Dharampura175 94 81 - - - 294 178 116 Deora520 285 235 - - - 831 524 307 Barcholi173 92 81 - - - 332 205 127 Kyolari38 21 17 - - - 171 114 57 Sukalhari
573 313 260 - - - 1,028 645 383 Softa487 250 237 - - - 1,076 635 441 Chandrol84 44 40 - - - 528 352 176 Sunri
122 70 52 - - - 439 299 140 Nadiya350 189 161 - - - 592 412 180 Khiriya Gopi214 114 100 - - - 541 355 186 Singhpura139 71 68 - - - 274 176 98 Chhachh Pura100 50 50 32 16 16 533 357 176 Khiriya Faijulla149 75 74 - - - 455 305 150 Chhan462 242 220 - - - 2,279 1,414 865 Godan196 99 97 40 23 17 657 406 251 Maithana Pali126 64 62 - - - 287 196 91 Charrai524 280 244 - - - 726 469 257 Soda438 240 198 - - - 582 336 246 Semaha
6 2 4 2 1 1 179 101 78 Sahjora256 139 117 - - - 650 394 256 Pathara Narayan220 116 104 3 1 2 477 314 163 Ajitpura441 232 209 - - - 846 543 303 Bagpura39 18 21 - - - 449 248 201 Tighra Kalan
314 163 151 - - - 446 268 178 Khiriya Riyasat133 72 61 - - - 665 370 295 Madhopura- - - 9 4 5 92 65 27 Torpatharra48 28 20 97 52 45 401 228 173 Bichhreta
636 328 308 - - - 1,237 761 476 Berachh- - - 56 20 36 25 13 12 Atari Kheda
MalgujarRaipur
305 169 136 84 46 38 609 371 238 Badera Haveli200 106 94 - - - 425 256 169 Barana134 72 62 - - - 312 189 123 Dali Pura
-------------Un-inhabited---------------------------Un-inhabited--------------
115
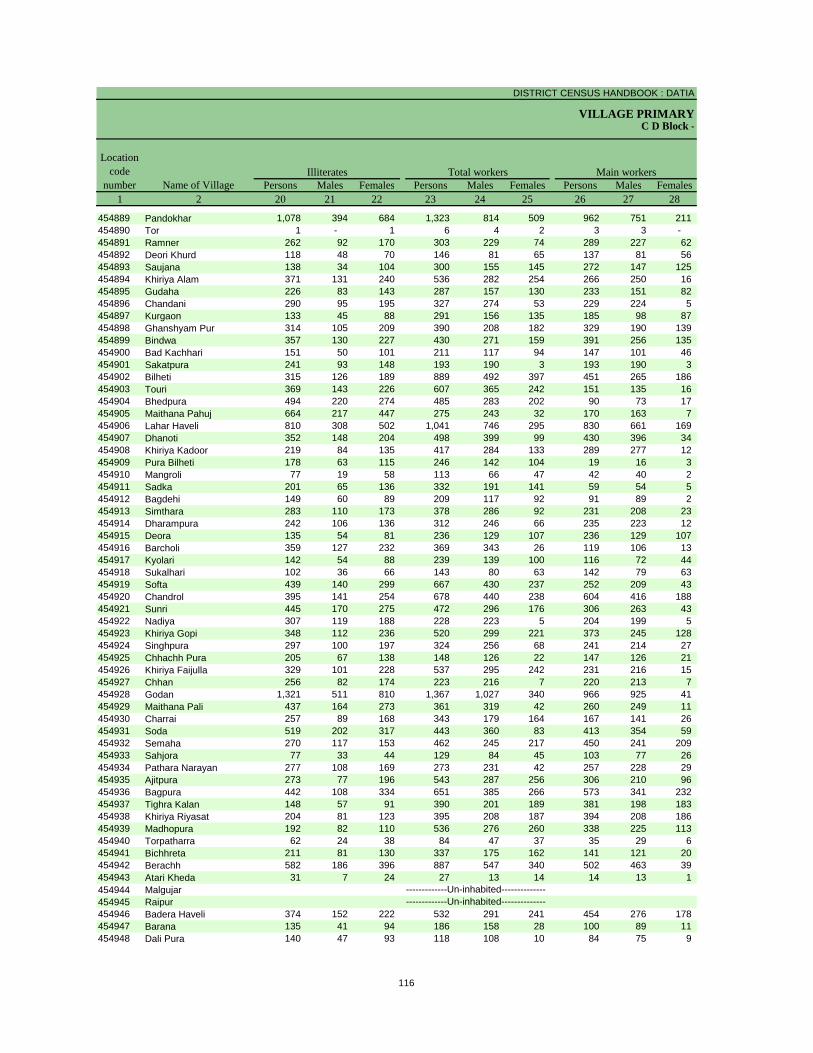
DISTRICT CENSUS HANDBOOK : DATIA
VILLAGE PRIMARYC D Block -
Persons Males Females Persons Males Females Persons Males Females1 2 20 21 22 23 24 25 26 27 28
Name of Village
Location code
numberIlliterates Total workers Main workers
454889 Pandokhar 1,078 394 684 1,323 814 509 962 751 211 454890 Tor 1 - 1 6 4 2 3 3 - 454891 Ramner 262 92 170 303 229 74 289 227 62 454892 Deori Khurd 118 48 70 146 81 65 137 81 56 454893 Saujana 138 34 104 300 155 145 272 147 125 454894 Khiriya Alam 371 131 240 536 282 254 266 250 16 454895 Gudaha 226 83 143 287 157 130 233 151 82 454896 Chandani 290 95 195 327 274 53 229 224 5 454897 Kurgaon 133 45 88 291 156 135 185 98 87 454898 Ghanshyam Pur 314 105 209 390 208 182 329 190 139 454899 Bindwa 357 130 227 430 271 159 391 256 135 454900 Bad Kachhari 151 50 101 211 117 94 147 101 46 454901 Sakatpura 241 93 148 193 190 3 193 190 3 454902 Bilheti 315 126 189 889 492 397 451 265 186 454903 Touri 369 143 226 607 365 242 151 135 16 454904 Bhedpura 494 220 274 485 283 202 90 73 17 454905 Maithana Pahuj 664 217 447 275 243 32 170 163 7 454906 Lahar Haveli 810 308 502 1,041 746 295 830 661 169 454907 Dhanoti 352 148 204 498 399 99 430 396 34 454908 Khiriya Kadoor 219 84 135 417 284 133 289 277 12 454909 Pura Bilheti 178 63 115 246 142 104 19 16 3 454910 Mangroli 77 19 58 113 66 47 42 40 2 454911 Sadka 201 65 136 332 191 141 59 54 5 454912 Bagdehi 149 60 89 209 117 92 91 89 2 454913 Simthara 283 110 173 378 286 92 231 208 23 454914 Dharampura 242 106 136 312 246 66 235 223 12 454915 Deora 135 54 81 236 129 107 236 129 107 454916 Barcholi 359 127 232 369 343 26 119 106 13 454917 Kyolari 142 54 88 239 139 100 116 72 44 454918 Sukalhari 102 36 66 143 80 63 142 79 63 454919 Softa 439 140 299 667 430 237 252 209 43 454920 Chandrol 395 141 254 678 440 238 604 416 188 454921 Sunri 445 170 275 472 296 176 306 263 43 454922 Nadiya 307 119 188 228 223 5 204 199 5 454923 Khiriya Gopi 348 112 236 520 299 221 373 245 128 454924 Singhpura 297 100 197 324 256 68 241 214 27 454925 Chhachh Pura 205 67 138 148 126 22 147 126 21 454926 Khiriya Faijulla 329 101 228 537 295 242 231 216 15 454927 Chhan 256 82 174 223 216 7 220 213 7 454928 Godan 1,321 511 810 1,367 1,027 340 966 925 41 454929 Maithana Pali 437 164 273 361 319 42 260 249 11 454930 Charrai 257 89 168 343 179 164 167 141 26 454931 Soda 519 202 317 443 360 83 413 354 59 454932 Semaha 270 117 153 462 245 217 450 241 209 454933 Sahjora 77 33 44 129 84 45 103 77 26 454934 Pathara Narayan 277 108 169 273 231 42 257 228 29 454935 Ajitpura 273 77 196 543 287 256 306 210 96 454936 Bagpura 442 108 334 651 385 266 573 341 232 454937 Tighra Kalan 148 57 91 390 201 189 381 198 183 454938 Khiriya Riyasat 204 81 123 395 208 187 394 208 186 454939 Madhopura 192 82 110 536 276 260 338 225 113 454940 Torpatharra 62 24 38 84 47 37 35 29 6 454941 Bichhreta 211 81 130 337 175 162 141 121 20 454942 Berachh 582 186 396 887 547 340 502 463 39 454943 Atari Kheda 31 7 24 27 13 14 14 13 1 454944 Malgujar454945 Raipur454946 Badera Haveli 374 152 222 532 291 241 454 276 178 454947 Barana 135 41 94 186 158 28 100 89 11 454948 Dali Pura 140 47 93 118 108 10 84 75 9
-------------Un-inhabited---------------------------Un-inhabited--------------
116
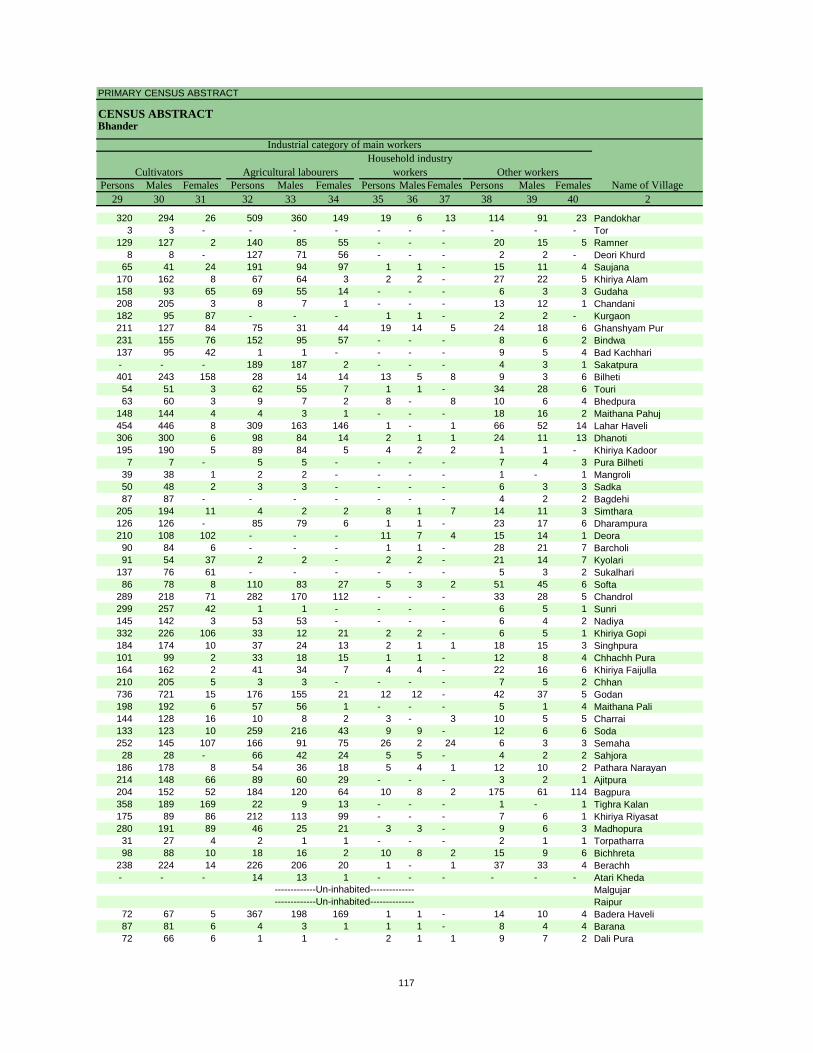
PRIMARY CENSUS ABSTRACT
CENSUS ABSTRACTBhander
Persons Males Females Persons Males Females Persons Males Females Persons Males Females29 30 31 32 33 34 35 36 37 38 39 40 2
CultivatorsName of Village
Household industry workersAgricultural labourers
Industrial category of main workers
Other workers
320 294 26 509 360 149 19 6 13 114 91 23 Pandokhar3 3 - - - - - - - - - - Tor
129 127 2 140 85 55 - - - 20 15 5 Ramner8 8 - 127 71 56 - - - 2 2 - Deori Khurd
65 41 24 191 94 97 1 1 - 15 11 4 Saujana170 162 8 67 64 3 2 2 - 27 22 5 Khiriya Alam158 93 65 69 55 14 - - - 6 3 3 Gudaha208 205 3 8 7 1 - - - 13 12 1 Chandani182 95 87 - - - 1 1 - 2 2 - Kurgaon211 127 84 75 31 44 19 14 5 24 18 6 Ghanshyam Pur231 155 76 152 95 57 - - - 8 6 2 Bindwa137 95 42 1 1 - - - - 9 5 4 Bad Kachhari- - - 189 187 2 - - - 4 3 1 Sakatpura401 243 158 28 14 14 13 5 8 9 3 6 Bilheti54 51 3 62 55 7 1 1 - 34 28 6 Touri63 60 3 9 7 2 8 - 8 10 6 4 Bhedpura
148 144 4 4 3 1 - - - 18 16 2 Maithana Pahuj454 446 8 309 163 146 1 - 1 66 52 14 Lahar Haveli306 300 6 98 84 14 2 1 1 24 11 13 Dhanoti195 190 5 89 84 5 4 2 2 1 1 - Khiriya Kadoor
7 7 - 5 5 - - - - 7 4 3 Pura Bilheti39 38 1 2 2 - - - - 1 - 1 Mangroli50 48 2 3 3 - - - - 6 3 3 Sadka87 87 - - - - - - - 4 2 2 Bagdehi
205 194 11 4 2 2 8 1 7 14 11 3 Simthara126 126 - 85 79 6 1 1 - 23 17 6 Dharampura210 108 102 - - - 11 7 4 15 14 1 Deora90 84 6 - - - 1 1 - 28 21 7 Barcholi91 54 37 2 2 - 2 2 - 21 14 7 Kyolari
137 76 61 - - - - - - 5 3 2 Sukalhari86 78 8 110 83 27 5 3 2 51 45 6 Softa
289 218 71 282 170 112 - - - 33 28 5 Chandrol299 257 42 1 1 - - - - 6 5 1 Sunri145 142 3 53 53 - - - - 6 4 2 Nadiya332 226 106 33 12 21 2 2 - 6 5 1 Khiriya Gopi184 174 10 37 24 13 2 1 1 18 15 3 Singhpura101 99 2 33 18 15 1 1 - 12 8 4 Chhachh Pura164 162 2 41 34 7 4 4 - 22 16 6 Khiriya Faijulla210 205 5 3 3 - - - - 7 5 2 Chhan736 721 15 176 155 21 12 12 - 42 37 5 Godan198 192 6 57 56 1 - - - 5 1 4 Maithana Pali144 128 16 10 8 2 3 - 3 10 5 5 Charrai133 123 10 259 216 43 9 9 - 12 6 6 Soda252 145 107 166 91 75 26 2 24 6 3 3 Semaha28 28 - 66 42 24 5 5 - 4 2 2 Sahjora
186 178 8 54 36 18 5 4 1 12 10 2 Pathara Narayan214 148 66 89 60 29 - - - 3 2 1 Ajitpura204 152 52 184 120 64 10 8 2 175 61 114 Bagpura358 189 169 22 9 13 - - - 1 - 1 Tighra Kalan175 89 86 212 113 99 - - - 7 6 1 Khiriya Riyasat280 191 89 46 25 21 3 3 - 9 6 3 Madhopura31 27 4 2 1 1 - - - 2 1 1 Torpatharra98 88 10 18 16 2 10 8 2 15 9 6 Bichhreta
238 224 14 226 206 20 1 - 1 37 33 4 Berachh- - - 14 13 1 - - - - - - Atari Kheda
MalgujarRaipur
72 67 5 367 198 169 1 1 - 14 10 4 Badera Haveli87 81 6 4 3 1 1 1 - 8 4 4 Barana72 66 6 1 1 - 2 1 1 9 7 2 Dali Pura
-------------Un-inhabited---------------------------Un-inhabited--------------
117
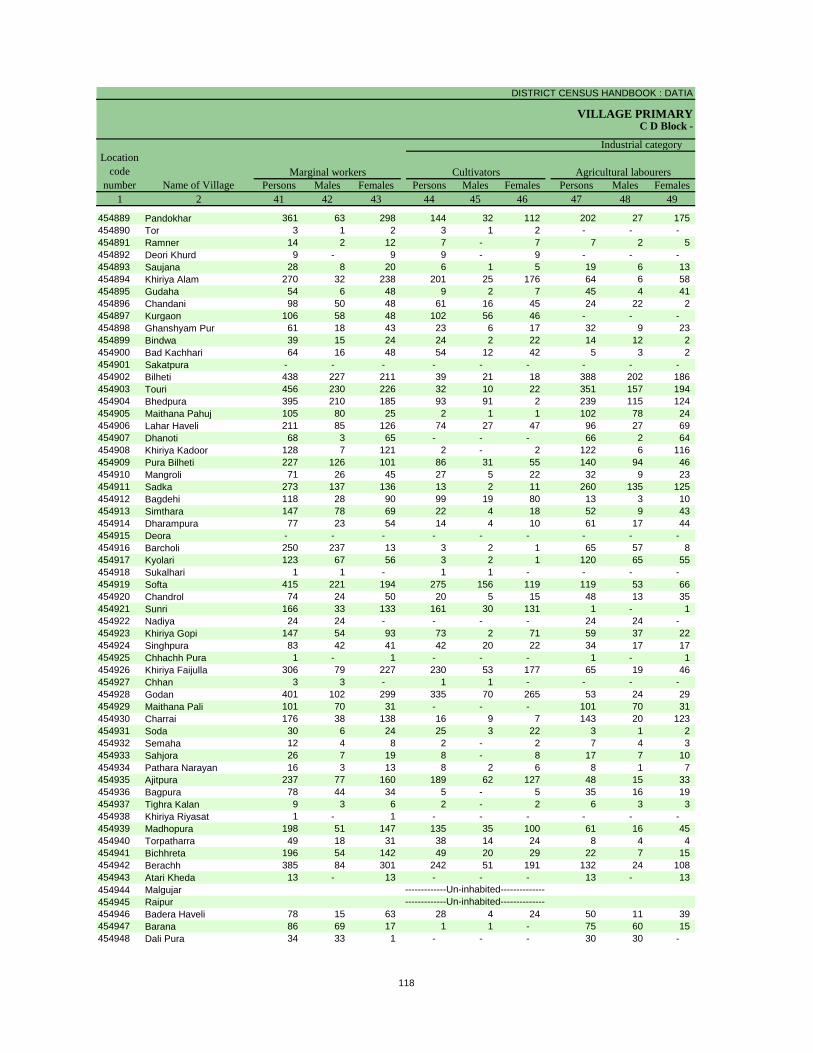
DISTRICT CENSUS HANDBOOK : DATIA
VILLAGE PRIMARYC D Block -
Persons Males Females Persons Males Females Persons Males Females1 2 41 42 43 44 45 46 47 48 49
Name of VillageMarginal workers Cultivators Agricultural labourers
Industrial category Location
code number
454889 Pandokhar 361 63 298 144 32 112 202 27 175 454890 Tor 3 1 2 3 1 2 - - - 454891 Ramner 14 2 12 7 - 7 7 2 5 454892 Deori Khurd 9 - 9 9 - 9 - - - 454893 Saujana 28 8 20 6 1 5 19 6 13 454894 Khiriya Alam 270 32 238 201 25 176 64 6 58 454895 Gudaha 54 6 48 9 2 7 45 4 41 454896 Chandani 98 50 48 61 16 45 24 22 2 454897 Kurgaon 106 58 48 102 56 46 - - - 454898 Ghanshyam Pur 61 18 43 23 6 17 32 9 23 454899 Bindwa 39 15 24 24 2 22 14 12 2 454900 Bad Kachhari 64 16 48 54 12 42 5 3 2 454901 Sakatpura - - - - - - - - - 454902 Bilheti 438 227 211 39 21 18 388 202 186 454903 Touri 456 230 226 32 10 22 351 157 194 454904 Bhedpura 395 210 185 93 91 2 239 115 124 454905 Maithana Pahuj 105 80 25 2 1 1 102 78 24 454906 Lahar Haveli 211 85 126 74 27 47 96 27 69 454907 Dhanoti 68 3 65 - - - 66 2 64 454908 Khiriya Kadoor 128 7 121 2 - 2 122 6 116 454909 Pura Bilheti 227 126 101 86 31 55 140 94 46 454910 Mangroli 71 26 45 27 5 22 32 9 23 454911 Sadka 273 137 136 13 2 11 260 135 125 454912 Bagdehi 118 28 90 99 19 80 13 3 10 454913 Simthara 147 78 69 22 4 18 52 9 43 454914 Dharampura 77 23 54 14 4 10 61 17 44 454915 Deora - - - - - - - - - 454916 Barcholi 250 237 13 3 2 1 65 57 8 454917 Kyolari 123 67 56 3 2 1 120 65 55 454918 Sukalhari 1 1 - 1 1 - - - - 454919 Softa 415 221 194 275 156 119 119 53 66 454920 Chandrol 74 24 50 20 5 15 48 13 35 454921 Sunri 166 33 133 161 30 131 1 - 1 454922 Nadiya 24 24 - - - - 24 24 - 454923 Khiriya Gopi 147 54 93 73 2 71 59 37 22 454924 Singhpura 83 42 41 42 20 22 34 17 17 454925 Chhachh Pura 1 - 1 - - - 1 - 1 454926 Khiriya Faijulla 306 79 227 230 53 177 65 19 46 454927 Chhan 3 3 - 1 1 - - - - 454928 Godan 401 102 299 335 70 265 53 24 29 454929 Maithana Pali 101 70 31 - - - 101 70 31 454930 Charrai 176 38 138 16 9 7 143 20 123 454931 Soda 30 6 24 25 3 22 3 1 2 454932 Semaha 12 4 8 2 - 2 7 4 3 454933 Sahjora 26 7 19 8 - 8 17 7 10 454934 Pathara Narayan 16 3 13 8 2 6 8 1 7 454935 Ajitpura 237 77 160 189 62 127 48 15 33 454936 Bagpura 78 44 34 5 - 5 35 16 19 454937 Tighra Kalan 9 3 6 2 - 2 6 3 3 454938 Khiriya Riyasat 1 - 1 - - - - - - 454939 Madhopura 198 51 147 135 35 100 61 16 45 454940 Torpatharra 49 18 31 38 14 24 8 4 4 454941 Bichhreta 196 54 142 49 20 29 22 7 15 454942 Berachh 385 84 301 242 51 191 132 24 108 454943 Atari Kheda 13 - 13 - - - 13 - 13 454944 Malgujar454945 Raipur454946 Badera Haveli 78 15 63 28 4 24 50 11 39 454947 Barana 86 69 17 1 1 - 75 60 15 454948 Dali Pura 34 33 1 - - - 30 30 -
-------------Un-inhabited---------------------------Un-inhabited--------------
118
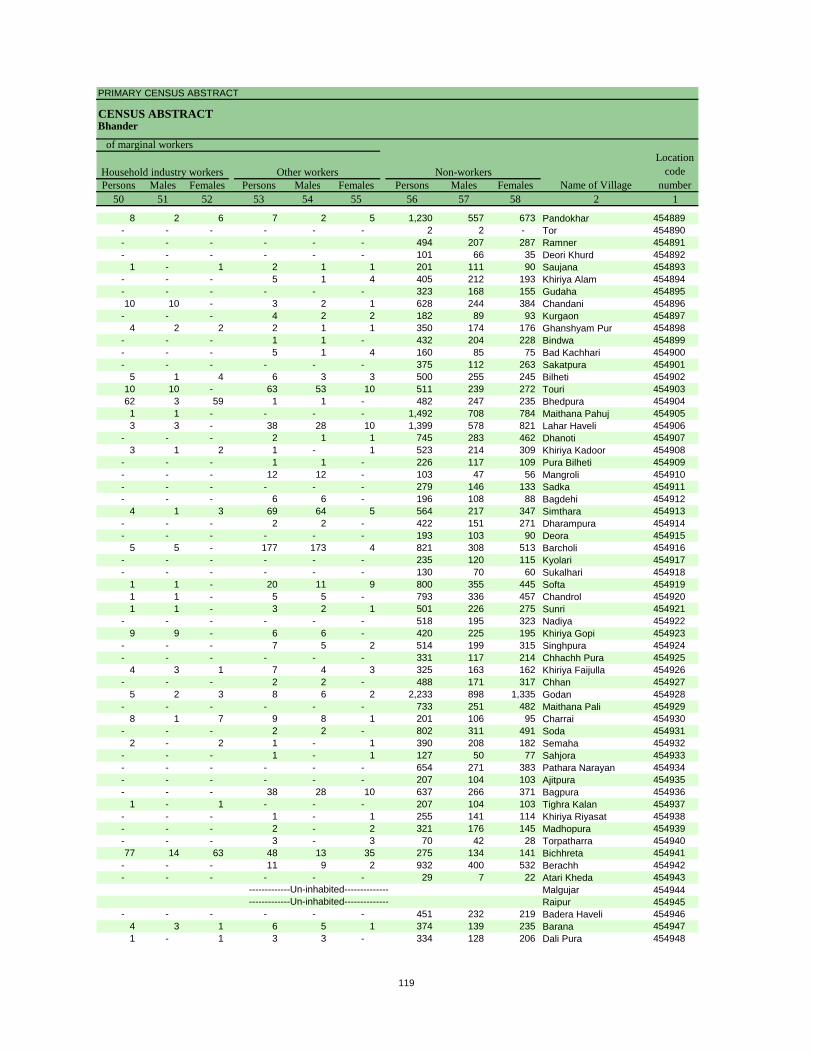
PRIMARY CENSUS ABSTRACT
CENSUS ABSTRACTBhander
Persons Males Females Persons Males Females Persons Males Females50 51 52 53 54 55 56 57 58 2 1
Location code
numberHousehold industry workers
Name of VillageOther workers Non-workers
of marginal workers
8 2 6 7 2 5 1,230 557 673 Pandokhar 454889- - - - - - 2 2 - Tor 454890- - - - - - 494 207 287 Ramner 454891- - - - - - 101 66 35 Deori Khurd 454892
1 - 1 2 1 1 201 111 90 Saujana 454893- - - 5 1 4 405 212 193 Khiriya Alam 454894- - - - - - 323 168 155 Gudaha 45489510 10 - 3 2 1 628 244 384 Chandani 454896
- - - 4 2 2 182 89 93 Kurgaon 4548974 2 2 2 1 1 350 174 176 Ghanshyam Pur 454898
- - - 1 1 - 432 204 228 Bindwa 454899- - - 5 1 4 160 85 75 Bad Kachhari 454900- - - - - - 375 112 263 Sakatpura 454901
5 1 4 6 3 3 500 255 245 Bilheti 45490210 10 - 63 53 10 511 239 272 Touri 45490362 3 59 1 1 - 482 247 235 Bhedpura 4549041 1 - - - - 1,492 708 784 Maithana Pahuj 4549053 3 - 38 28 10 1,399 578 821 Lahar Haveli 454906
- - - 2 1 1 745 283 462 Dhanoti 4549073 1 2 1 - 1 523 214 309 Khiriya Kadoor 454908
- - - 1 1 - 226 117 109 Pura Bilheti 454909- - - 12 12 - 103 47 56 Mangroli 454910- - - - - - 279 146 133 Sadka 454911- - - 6 6 - 196 108 88 Bagdehi 454912
4 1 3 69 64 5 564 217 347 Simthara 454913- - - 2 2 - 422 151 271 Dharampura 454914- - - - - - 193 103 90 Deora 454915
5 5 - 177 173 4 821 308 513 Barcholi 454916- - - - - - 235 120 115 Kyolari 454917- - - - - - 130 70 60 Sukalhari 454918
1 1 - 20 11 9 800 355 445 Softa 4549191 1 - 5 5 - 793 336 457 Chandrol 4549201 1 - 3 2 1 501 226 275 Sunri 454921
- - - - - - 518 195 323 Nadiya 4549229 9 - 6 6 - 420 225 195 Khiriya Gopi 454923
- - - 7 5 2 514 199 315 Singhpura 454924- - - - - - 331 117 214 Chhachh Pura 454925
4 3 1 7 4 3 325 163 162 Khiriya Faijulla 454926- - - 2 2 - 488 171 317 Chhan 454927
5 2 3 8 6 2 2,233 898 1,335 Godan 454928- - - - - - 733 251 482 Maithana Pali 454929
8 1 7 9 8 1 201 106 95 Charrai 454930- - - 2 2 - 802 311 491 Soda 454931
2 - 2 1 - 1 390 208 182 Semaha 454932- - - 1 - 1 127 50 77 Sahjora 454933- - - - - - 654 271 383 Pathara Narayan 454934- - - - - - 207 104 103 Ajitpura 454935- - - 38 28 10 637 266 371 Bagpura 454936
1 - 1 - - - 207 104 103 Tighra Kalan 454937- - - 1 - 1 255 141 114 Khiriya Riyasat 454938- - - 2 - 2 321 176 145 Madhopura 454939- - - 3 - 3 70 42 28 Torpatharra 45494077 14 63 48 13 35 275 134 141 Bichhreta 454941
- - - 11 9 2 932 400 532 Berachh 454942- - - - - - 29 7 22 Atari Kheda 454943
Malgujar 454944Raipur 454945
- - - - - - 451 232 219 Badera Haveli 4549464 3 1 6 5 1 374 139 235 Barana 4549471 - 1 3 3 - 334 128 206 Dali Pura 454948
-------------Un-inhabited---------------------------Un-inhabited--------------
119
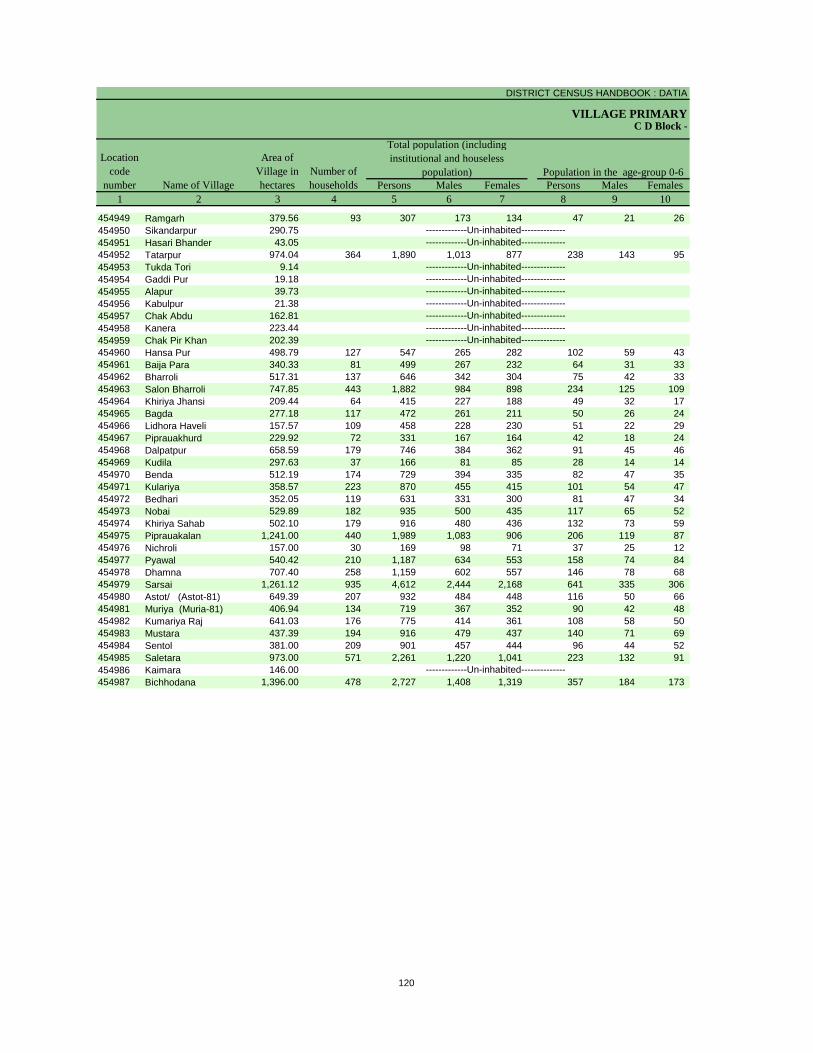
DISTRICT CENSUS HANDBOOK : DATIA
VILLAGE PRIMARY
Persons Males Females Persons Males Females1 2 3 4 5 6 7 8 9 10
Name of Village
Location code
number
Total population (including institutional and houseless
population)Area of
Village in hectares
Number of households
C D Block -
Population in the age-group 0-6
454949 Ramgarh 379.56 93 307 173 134 47 21 26 454950 Sikandarpur 290.75454951 Hasari Bhander 43.05454952 Tatarpur 974.04 364 1,890 1,013 877 238 143 95 454953 Tukda Tori 9.14454954 Gaddi Pur 19.18454955 Alapur 39.73454956 Kabulpur 21.38454957 Chak Abdu 162.81454958 Kanera 223.44454959 Chak Pir Khan 202.39454960 Hansa Pur 498.79 127 547 265 282 102 59 43 454961 Baija Para 340.33 81 499 267 232 64 31 33 454962 Bharroli 517.31 137 646 342 304 75 42 33 454963 Salon Bharroli 747.85 443 1,882 984 898 234 125 109 454964 Khiriya Jhansi 209.44 64 415 227 188 49 32 17 454965 Bagda 277.18 117 472 261 211 50 26 24 454966 Lidhora Haveli 157.57 109 458 228 230 51 22 29 454967 Piprauakhurd 229.92 72 331 167 164 42 18 24 454968 Dalpatpur 658.59 179 746 384 362 91 45 46 454969 Kudila 297.63 37 166 81 85 28 14 14 454970 Benda 512.19 174 729 394 335 82 47 35 454971 Kulariya 358.57 223 870 455 415 101 54 47 454972 Bedhari 352.05 119 631 331 300 81 47 34 454973 Nobai 529.89 182 935 500 435 117 65 52 454974 Khiriya Sahab 502.10 179 916 480 436 132 73 59 454975 Piprauakalan 1,241.00 440 1,989 1,083 906 206 119 87 454976 Nichroli 157.00 30 169 98 71 37 25 12 454977 Pyawal 540.42 210 1,187 634 553 158 74 84 454978 Dhamna 707.40 258 1,159 602 557 146 78 68 454979 Sarsai 1,261.12 935 4,612 2,444 2,168 641 335 306 454980 Astot/ (Astot-81) 649.39 207 932 484 448 116 50 66 454981 Muriya (Muria-81) 406.94 134 719 367 352 90 42 48 454982 Kumariya Raj 641.03 176 775 414 361 108 58 50 454983 Mustara 437.39 194 916 479 437 140 71 69 454984 Sentol 381.00 209 901 457 444 96 44 52 454985 Saletara 973.00 571 2,261 1,220 1,041 223 132 91 454986 Kaimara 146.00454987 Bichhodana 1,396.00 478 2,727 1,408 1,319 357 184 173
-------------Un-inhabited---------------------------Un-inhabited--------------
-------------Un-inhabited---------------------------Un-inhabited---------------------------Un-inhabited---------------------------Un-inhabited---------------------------Un-inhabited---------------------------Un-inhabited---------------------------Un-inhabited--------------
-------------Un-inhabited--------------
120
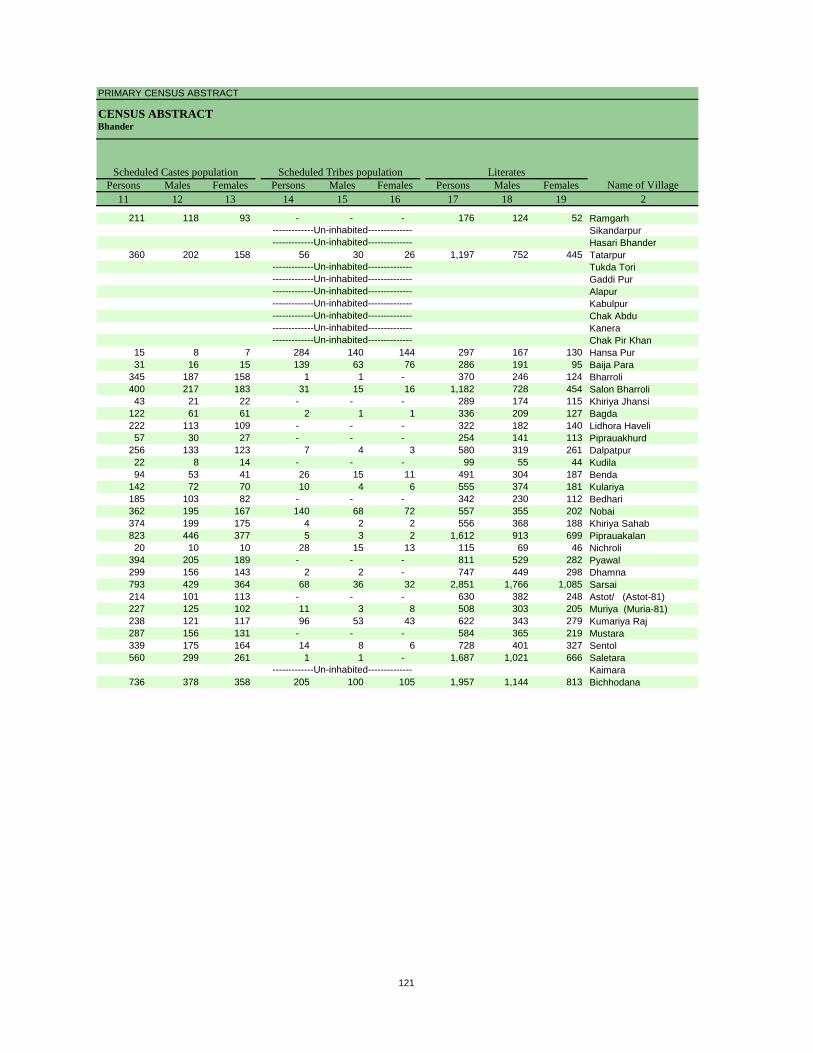
PRIMARY CENSUS ABSTRACT
CENSUS ABSTRACTBhander
Persons Males Females Persons Males Females Persons Males Females11 12 13 14 15 16 17 18 19 2
Name of VillageLiteratesScheduled Castes population Scheduled Tribes population
211 118 93 - - - 176 124 52 RamgarhSikandarpurHasari Bhander
360 202 158 56 30 26 1,197 752 445 TatarpurTukda ToriGaddi PurAlapurKabulpurChak AbduKaneraChak Pir Khan
15 8 7 284 140 144 297 167 130 Hansa Pur31 16 15 139 63 76 286 191 95 Baija Para
345 187 158 1 1 - 370 246 124 Bharroli400 217 183 31 15 16 1,182 728 454 Salon Bharroli43 21 22 - - - 289 174 115 Khiriya Jhansi
122 61 61 2 1 1 336 209 127 Bagda222 113 109 - - - 322 182 140 Lidhora Haveli57 30 27 - - - 254 141 113 Piprauakhurd
256 133 123 7 4 3 580 319 261 Dalpatpur22 8 14 - - - 99 55 44 Kudila94 53 41 26 15 11 491 304 187 Benda
142 72 70 10 4 6 555 374 181 Kulariya185 103 82 - - - 342 230 112 Bedhari362 195 167 140 68 72 557 355 202 Nobai374 199 175 4 2 2 556 368 188 Khiriya Sahab823 446 377 5 3 2 1,612 913 699 Piprauakalan20 10 10 28 15 13 115 69 46 Nichroli
394 205 189 - - - 811 529 282 Pyawal299 156 143 2 2 - 747 449 298 Dhamna793 429 364 68 36 32 2,851 1,766 1,085 Sarsai214 101 113 - - - 630 382 248 Astot/ (Astot-81)227 125 102 11 3 8 508 303 205 Muriya (Muria-81)238 121 117 96 53 43 622 343 279 Kumariya Raj287 156 131 - - - 584 365 219 Mustara339 175 164 14 8 6 728 401 327 Sentol560 299 261 1 1 - 1,687 1,021 666 Saletara
Kaimara736 378 358 205 100 105 1,957 1,144 813 Bichhodana
-------------Un-inhabited---------------------------Un-inhabited--------------
-------------Un-inhabited---------------------------Un-inhabited---------------------------Un-inhabited---------------------------Un-inhabited---------------------------Un-inhabited---------------------------Un-inhabited---------------------------Un-inhabited--------------
-------------Un-inhabited--------------
121
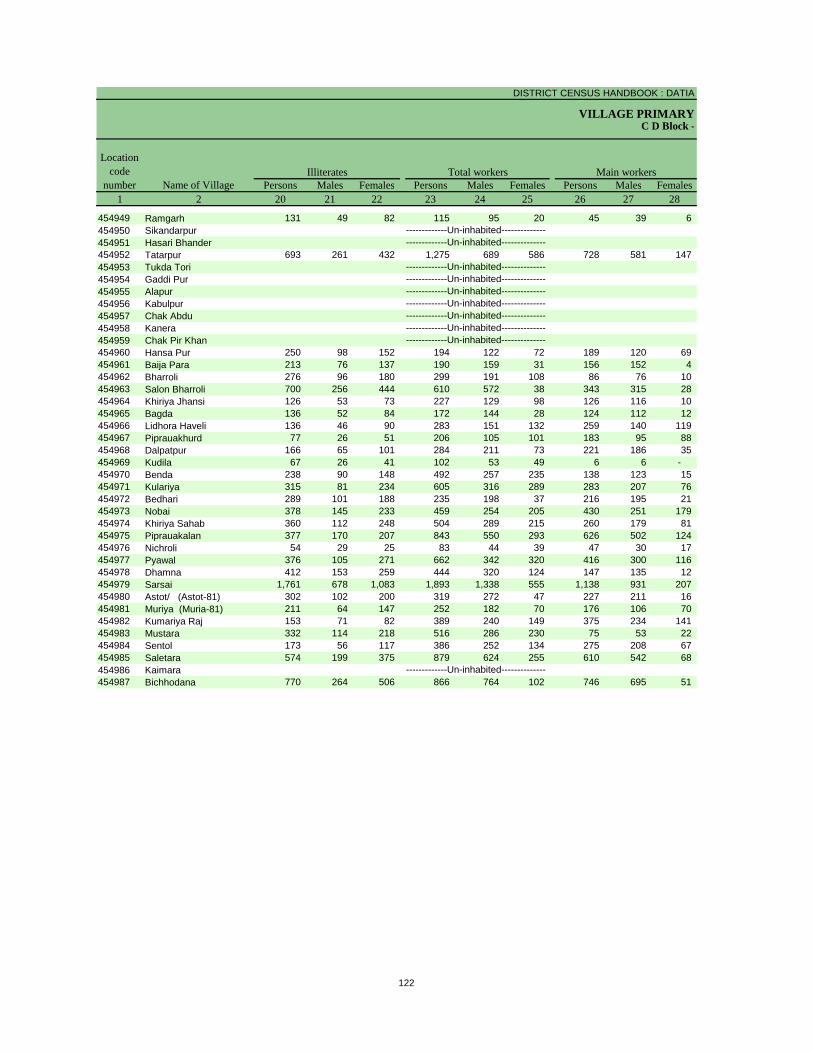
DISTRICT CENSUS HANDBOOK : DATIA
VILLAGE PRIMARYC D Block -
Persons Males Females Persons Males Females Persons Males Females1 2 20 21 22 23 24 25 26 27 28
Name of Village
Location code
numberIlliterates Total workers Main workers
454949 Ramgarh 131 49 82 115 95 20 45 39 6 454950 Sikandarpur454951 Hasari Bhander454952 Tatarpur 693 261 432 1,275 689 586 728 581 147 454953 Tukda Tori454954 Gaddi Pur454955 Alapur454956 Kabulpur454957 Chak Abdu454958 Kanera454959 Chak Pir Khan454960 Hansa Pur 250 98 152 194 122 72 189 120 69 454961 Baija Para 213 76 137 190 159 31 156 152 4 454962 Bharroli 276 96 180 299 191 108 86 76 10 454963 Salon Bharroli 700 256 444 610 572 38 343 315 28 454964 Khiriya Jhansi 126 53 73 227 129 98 126 116 10 454965 Bagda 136 52 84 172 144 28 124 112 12 454966 Lidhora Haveli 136 46 90 283 151 132 259 140 119 454967 Piprauakhurd 77 26 51 206 105 101 183 95 88 454968 Dalpatpur 166 65 101 284 211 73 221 186 35 454969 Kudila 67 26 41 102 53 49 6 6 - 454970 Benda 238 90 148 492 257 235 138 123 15 454971 Kulariya 315 81 234 605 316 289 283 207 76 454972 Bedhari 289 101 188 235 198 37 216 195 21 454973 Nobai 378 145 233 459 254 205 430 251 179 454974 Khiriya Sahab 360 112 248 504 289 215 260 179 81 454975 Piprauakalan 377 170 207 843 550 293 626 502 124 454976 Nichroli 54 29 25 83 44 39 47 30 17 454977 Pyawal 376 105 271 662 342 320 416 300 116 454978 Dhamna 412 153 259 444 320 124 147 135 12 454979 Sarsai 1,761 678 1,083 1,893 1,338 555 1,138 931 207 454980 Astot/ (Astot-81) 302 102 200 319 272 47 227 211 16 454981 Muriya (Muria-81) 211 64 147 252 182 70 176 106 70 454982 Kumariya Raj 153 71 82 389 240 149 375 234 141 454983 Mustara 332 114 218 516 286 230 75 53 22 454984 Sentol 173 56 117 386 252 134 275 208 67 454985 Saletara 574 199 375 879 624 255 610 542 68 454986 Kaimara454987 Bichhodana 770 264 506 866 764 102 746 695 51
-------------Un-inhabited---------------------------Un-inhabited--------------
-------------Un-inhabited---------------------------Un-inhabited---------------------------Un-inhabited---------------------------Un-inhabited---------------------------Un-inhabited---------------------------Un-inhabited---------------------------Un-inhabited--------------
-------------Un-inhabited--------------
122
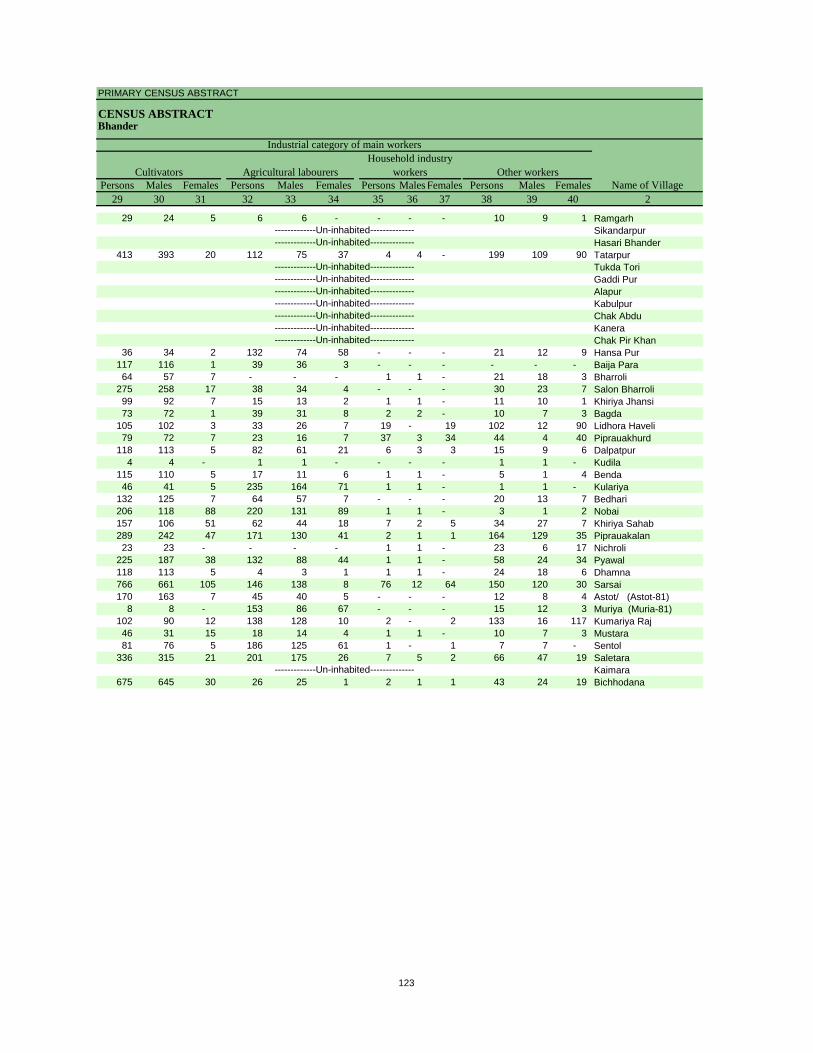
PRIMARY CENSUS ABSTRACT
CENSUS ABSTRACTBhander
Persons Males Females Persons Males Females Persons Males Females Persons Males Females29 30 31 32 33 34 35 36 37 38 39 40 2
CultivatorsName of Village
Household industry workersAgricultural labourers
Industrial category of main workers
Other workers
29 24 5 6 6 - - - - 10 9 1 RamgarhSikandarpurHasari Bhander
413 393 20 112 75 37 4 4 - 199 109 90 TatarpurTukda ToriGaddi PurAlapurKabulpurChak AbduKaneraChak Pir Khan
36 34 2 132 74 58 - - - 21 12 9 Hansa Pur117 116 1 39 36 3 - - - - - - Baija Para64 57 7 - - - 1 1 - 21 18 3 Bharroli
275 258 17 38 34 4 - - - 30 23 7 Salon Bharroli99 92 7 15 13 2 1 1 - 11 10 1 Khiriya Jhansi73 72 1 39 31 8 2 2 - 10 7 3 Bagda
105 102 3 33 26 7 19 - 19 102 12 90 Lidhora Haveli79 72 7 23 16 7 37 3 34 44 4 40 Piprauakhurd
118 113 5 82 61 21 6 3 3 15 9 6 Dalpatpur4 4 - 1 1 - - - - 1 1 - Kudila
115 110 5 17 11 6 1 1 - 5 1 4 Benda46 41 5 235 164 71 1 1 - 1 1 - Kulariya
132 125 7 64 57 7 - - - 20 13 7 Bedhari206 118 88 220 131 89 1 1 - 3 1 2 Nobai157 106 51 62 44 18 7 2 5 34 27 7 Khiriya Sahab289 242 47 171 130 41 2 1 1 164 129 35 Piprauakalan23 23 - - - - 1 1 - 23 6 17 Nichroli
225 187 38 132 88 44 1 1 - 58 24 34 Pyawal118 113 5 4 3 1 1 1 - 24 18 6 Dhamna766 661 105 146 138 8 76 12 64 150 120 30 Sarsai170 163 7 45 40 5 - - - 12 8 4 Astot/ (Astot-81)
8 8 - 153 86 67 - - - 15 12 3 Muriya (Muria-81)102 90 12 138 128 10 2 - 2 133 16 117 Kumariya Raj46 31 15 18 14 4 1 1 - 10 7 3 Mustara81 76 5 186 125 61 1 - 1 7 7 - Sentol
336 315 21 201 175 26 7 5 2 66 47 19 SaletaraKaimara
675 645 30 26 25 1 2 1 1 43 24 19 Bichhodana
-------------Un-inhabited---------------------------Un-inhabited--------------
-------------Un-inhabited---------------------------Un-inhabited---------------------------Un-inhabited---------------------------Un-inhabited---------------------------Un-inhabited---------------------------Un-inhabited---------------------------Un-inhabited--------------
-------------Un-inhabited--------------
123
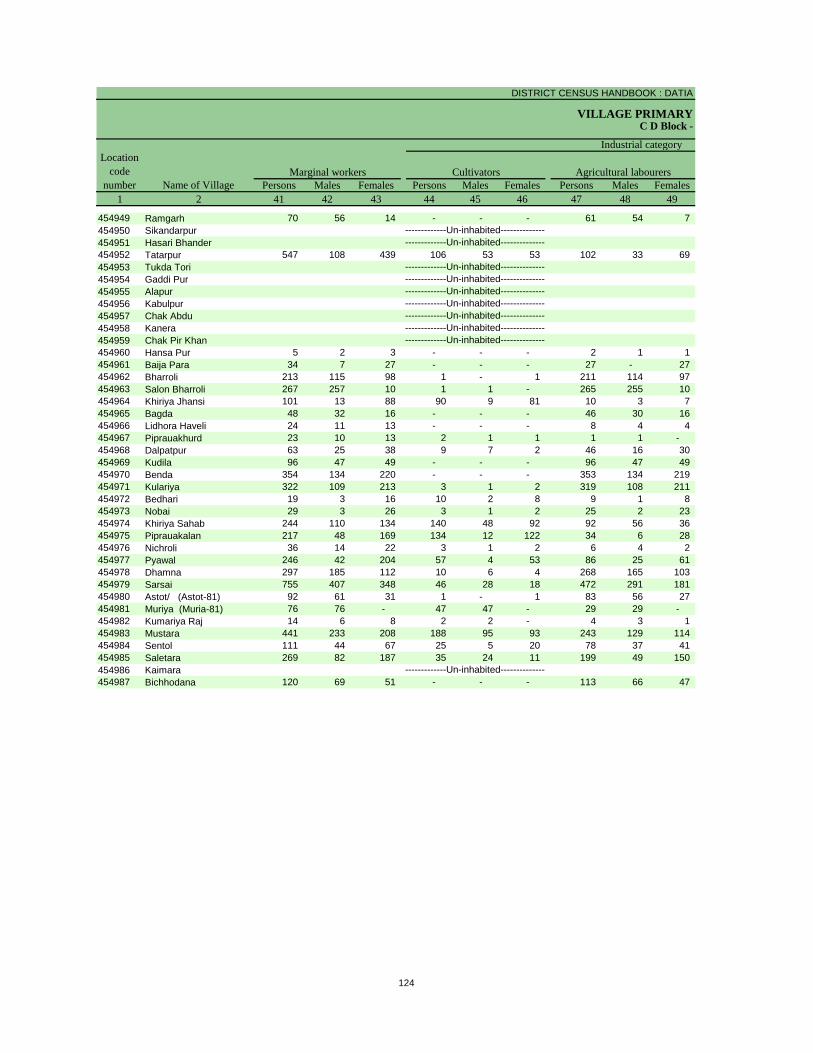
DISTRICT CENSUS HANDBOOK : DATIA
VILLAGE PRIMARYC D Block -
Persons Males Females Persons Males Females Persons Males Females1 2 41 42 43 44 45 46 47 48 49
Name of VillageMarginal workers Cultivators Agricultural labourers
Industrial category Location
code number
454949 Ramgarh 70 56 14 - - - 61 54 7 454950 Sikandarpur454951 Hasari Bhander454952 Tatarpur 547 108 439 106 53 53 102 33 69 454953 Tukda Tori454954 Gaddi Pur454955 Alapur454956 Kabulpur454957 Chak Abdu454958 Kanera454959 Chak Pir Khan454960 Hansa Pur 5 2 3 - - - 2 1 1 454961 Baija Para 34 7 27 - - - 27 - 27 454962 Bharroli 213 115 98 1 - 1 211 114 97 454963 Salon Bharroli 267 257 10 1 1 - 265 255 10 454964 Khiriya Jhansi 101 13 88 90 9 81 10 3 7 454965 Bagda 48 32 16 - - - 46 30 16 454966 Lidhora Haveli 24 11 13 - - - 8 4 4 454967 Piprauakhurd 23 10 13 2 1 1 1 1 - 454968 Dalpatpur 63 25 38 9 7 2 46 16 30 454969 Kudila 96 47 49 - - - 96 47 49 454970 Benda 354 134 220 - - - 353 134 219 454971 Kulariya 322 109 213 3 1 2 319 108 211 454972 Bedhari 19 3 16 10 2 8 9 1 8 454973 Nobai 29 3 26 3 1 2 25 2 23 454974 Khiriya Sahab 244 110 134 140 48 92 92 56 36 454975 Piprauakalan 217 48 169 134 12 122 34 6 28 454976 Nichroli 36 14 22 3 1 2 6 4 2 454977 Pyawal 246 42 204 57 4 53 86 25 61 454978 Dhamna 297 185 112 10 6 4 268 165 103 454979 Sarsai 755 407 348 46 28 18 472 291 181 454980 Astot/ (Astot-81) 92 61 31 1 - 1 83 56 27 454981 Muriya (Muria-81) 76 76 - 47 47 - 29 29 - 454982 Kumariya Raj 14 6 8 2 2 - 4 3 1 454983 Mustara 441 233 208 188 95 93 243 129 114 454984 Sentol 111 44 67 25 5 20 78 37 41 454985 Saletara 269 82 187 35 24 11 199 49 150 454986 Kaimara454987 Bichhodana 120 69 51 - - - 113 66 47
-------------Un-inhabited---------------------------Un-inhabited--------------
-------------Un-inhabited---------------------------Un-inhabited---------------------------Un-inhabited---------------------------Un-inhabited---------------------------Un-inhabited---------------------------Un-inhabited---------------------------Un-inhabited--------------
-------------Un-inhabited--------------
124
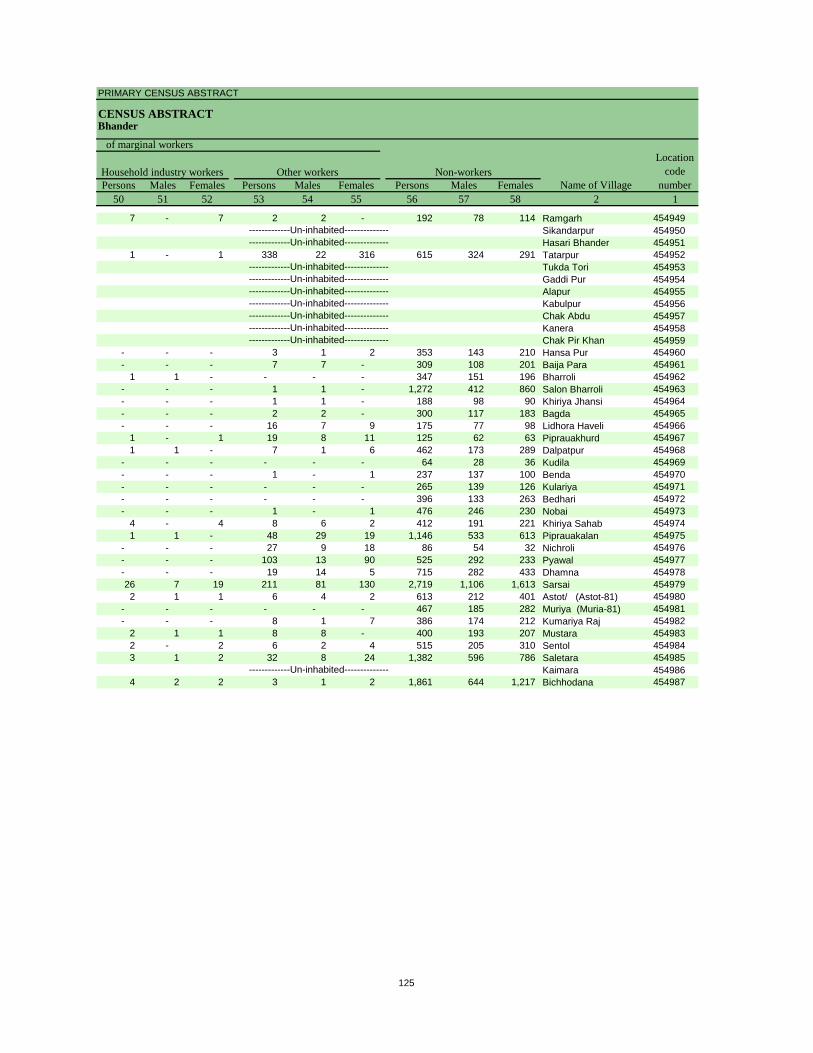
PRIMARY CENSUS ABSTRACT
CENSUS ABSTRACTBhander
Persons Males Females Persons Males Females Persons Males Females50 51 52 53 54 55 56 57 58 2 1
Location code
numberHousehold industry workers
Name of VillageOther workers Non-workers
of marginal workers
7 - 7 2 2 - 192 78 114 Ramgarh 454949Sikandarpur 454950Hasari Bhander 454951
1 - 1 338 22 316 615 324 291 Tatarpur 454952Tukda Tori 454953Gaddi Pur 454954Alapur 454955Kabulpur 454956Chak Abdu 454957Kanera 454958Chak Pir Khan 454959
- - - 3 1 2 353 143 210 Hansa Pur 454960- - - 7 7 - 309 108 201 Baija Para 454961
1 1 - - - - 347 151 196 Bharroli 454962- - - 1 1 - 1,272 412 860 Salon Bharroli 454963- - - 1 1 - 188 98 90 Khiriya Jhansi 454964- - - 2 2 - 300 117 183 Bagda 454965- - - 16 7 9 175 77 98 Lidhora Haveli 454966
1 - 1 19 8 11 125 62 63 Piprauakhurd 4549671 1 - 7 1 6 462 173 289 Dalpatpur 454968
- - - - - - 64 28 36 Kudila 454969- - - 1 - 1 237 137 100 Benda 454970- - - - - - 265 139 126 Kulariya 454971- - - - - - 396 133 263 Bedhari 454972- - - 1 - 1 476 246 230 Nobai 454973
4 - 4 8 6 2 412 191 221 Khiriya Sahab 4549741 1 - 48 29 19 1,146 533 613 Piprauakalan 454975
- - - 27 9 18 86 54 32 Nichroli 454976- - - 103 13 90 525 292 233 Pyawal 454977- - - 19 14 5 715 282 433 Dhamna 45497826 7 19 211 81 130 2,719 1,106 1,613 Sarsai 4549792 1 1 6 4 2 613 212 401 Astot/ (Astot-81) 454980
- - - - - - 467 185 282 Muriya (Muria-81) 454981- - - 8 1 7 386 174 212 Kumariya Raj 454982
2 1 1 8 8 - 400 193 207 Mustara 4549832 - 2 6 2 4 515 205 310 Sentol 4549843 1 2 32 8 24 1,382 596 786 Saletara 454985
Kaimara 4549864 2 2 3 1 2 1,861 644 1,217 Bichhodana 454987
-------------Un-inhabited---------------------------Un-inhabited--------------
-------------Un-inhabited---------------------------Un-inhabited---------------------------Un-inhabited---------------------------Un-inhabited---------------------------Un-inhabited---------------------------Un-inhabited---------------------------Un-inhabited--------------
-------------Un-inhabited--------------
125

Urban PCA-Town wise Primary Census Abstract
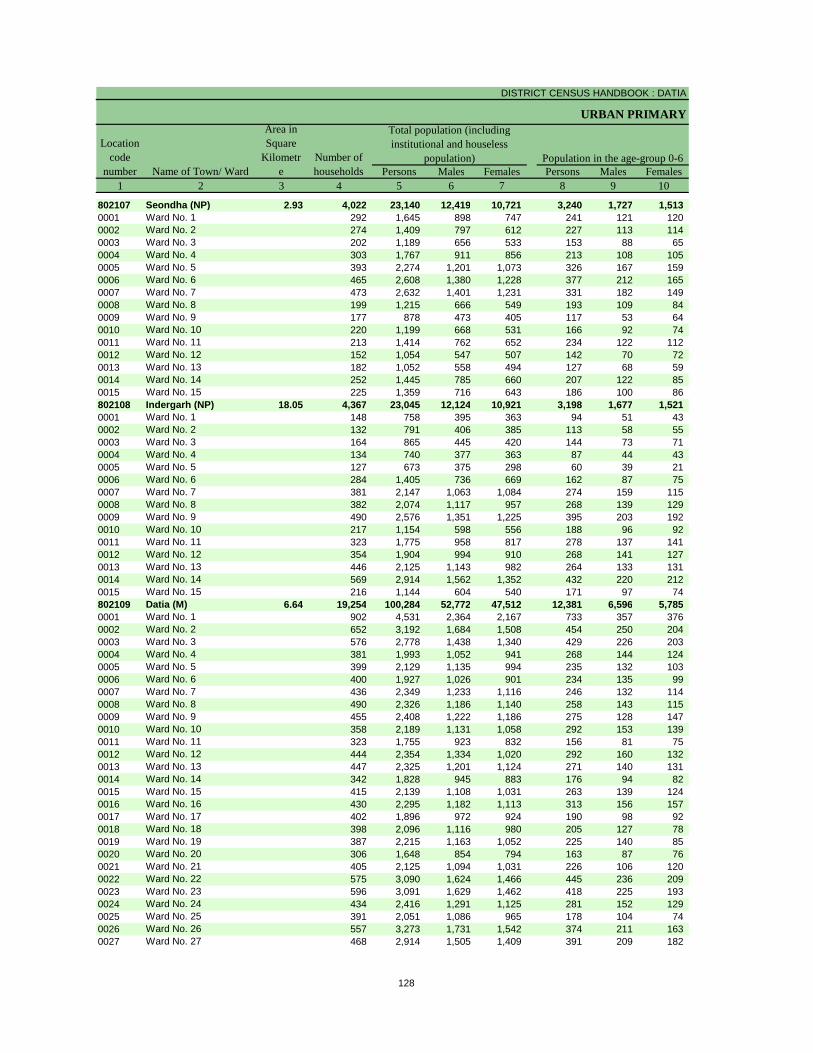
DISTRICT CENSUS HANDBOOK : DATIA
URBAN PRIMARY
Persons Males Females Persons Males Females1 2 3 4 5 6 7 8 9 10
802107 Seondha (NP) 2.93 4,022 23,140 12,419 10,721 3,240 1,727 1,513 0001 Ward No. 1 292 1,645 898 747 241 121 120 0002 Ward No. 2 274 1,409 797 612 227 113 114 0003 Ward No. 3 202 1,189 656 533 153 88 65 0004 Ward No. 4 303 1,767 911 856 213 108 105 0005 Ward No. 5 393 2,274 1,201 1,073 326 167 159 0006 Ward No. 6 465 2,608 1,380 1,228 377 212 165 0007 Ward No. 7 473 2,632 1,401 1,231 331 182 149 0008 Ward No. 8 199 1,215 666 549 193 109 84 0009 Ward No. 9 177 878 473 405 117 53 64 0010 Ward No. 10 220 1,199 668 531 166 92 74 0011 Ward No. 11 213 1,414 762 652 234 122 112 0012 Ward No. 12 152 1,054 547 507 142 70 72 0013 Ward No. 13 182 1,052 558 494 127 68 59 0014 Ward No. 14 252 1,445 785 660 207 122 85 0015 Ward No. 15 225 1,359 716 643 186 100 86 802108 Indergarh (NP) 18.05 4,367 23,045 12,124 10,921 3,198 1,677 1,521 0001 Ward No. 1 148 758 395 363 94 51 43 0002 Ward No. 2 132 791 406 385 113 58 55 0003 Ward No. 3 164 865 445 420 144 73 71 0004 Ward No. 4 134 740 377 363 87 44 43 0005 Ward No. 5 127 673 375 298 60 39 21 0006 Ward No. 6 284 1,405 736 669 162 87 75 0007 Ward No. 7 381 2,147 1,063 1,084 274 159 115 0008 Ward No. 8 382 2,074 1,117 957 268 139 129 0009 Ward No. 9 490 2,576 1,351 1,225 395 203 192 0010 Ward No. 10 217 1,154 598 556 188 96 92 0011 Ward No. 11 323 1,775 958 817 278 137 141 0012 Ward No. 12 354 1,904 994 910 268 141 127 0013 Ward No. 13 446 2,125 1,143 982 264 133 131 0014 Ward No. 14 569 2,914 1,562 1,352 432 220 212 0015 Ward No. 15 216 1,144 604 540 171 97 74 802109 Datia (M) 6.64 19,254 100,284 52,772 47,512 12,381 6,596 5,785 0001 Ward No. 1 902 4,531 2,364 2,167 733 357 376 0002 Ward No. 2 652 3,192 1,684 1,508 454 250 204 0003 Ward No. 3 576 2,778 1,438 1,340 429 226 203 0004 Ward No. 4 381 1,993 1,052 941 268 144 124 0005 Ward No. 5 399 2,129 1,135 994 235 132 103 0006 Ward No. 6 400 1,927 1,026 901 234 135 99 0007 Ward No. 7 436 2,349 1,233 1,116 246 132 114 0008 Ward No. 8 490 2,326 1,186 1,140 258 143 115 0009 Ward No. 9 455 2,408 1,222 1,186 275 128 147 0010 Ward No. 10 358 2,189 1,131 1,058 292 153 139 0011 Ward No. 11 323 1,755 923 832 156 81 75 0012 Ward No. 12 444 2,354 1,334 1,020 292 160 132 0013 Ward No. 13 447 2,325 1,201 1,124 271 140 131 0014 Ward No. 14 342 1,828 945 883 176 94 82 0015 Ward No. 15 415 2,139 1,108 1,031 263 139 124 0016 Ward No. 16 430 2,295 1,182 1,113 313 156 157 0017 Ward No. 17 402 1,896 972 924 190 98 92 0018 Ward No. 18 398 2,096 1,116 980 205 127 78 0019 Ward No. 19 387 2,215 1,163 1,052 225 140 85 0020 Ward No. 20 306 1,648 854 794 163 87 76 0021 Ward No. 21 405 2,125 1,094 1,031 226 106 120 0022 Ward No. 22 575 3,090 1,624 1,466 445 236 209 0023 Ward No. 23 596 3,091 1,629 1,462 418 225 193 0024 Ward No. 24 434 2,416 1,291 1,125 281 152 129 0025 Ward No. 25 391 2,051 1,086 965 178 104 74 0026 Ward No. 26 557 3,273 1,731 1,542 374 211 163 0027 Ward No. 27 468 2,914 1,505 1,409 391 209 182
Name of Town/ Ward
Location code
number
Total population (including institutional and houseless
population)
Area in Square
Kilometre
Number of households
Population in the age-group 0-6
128
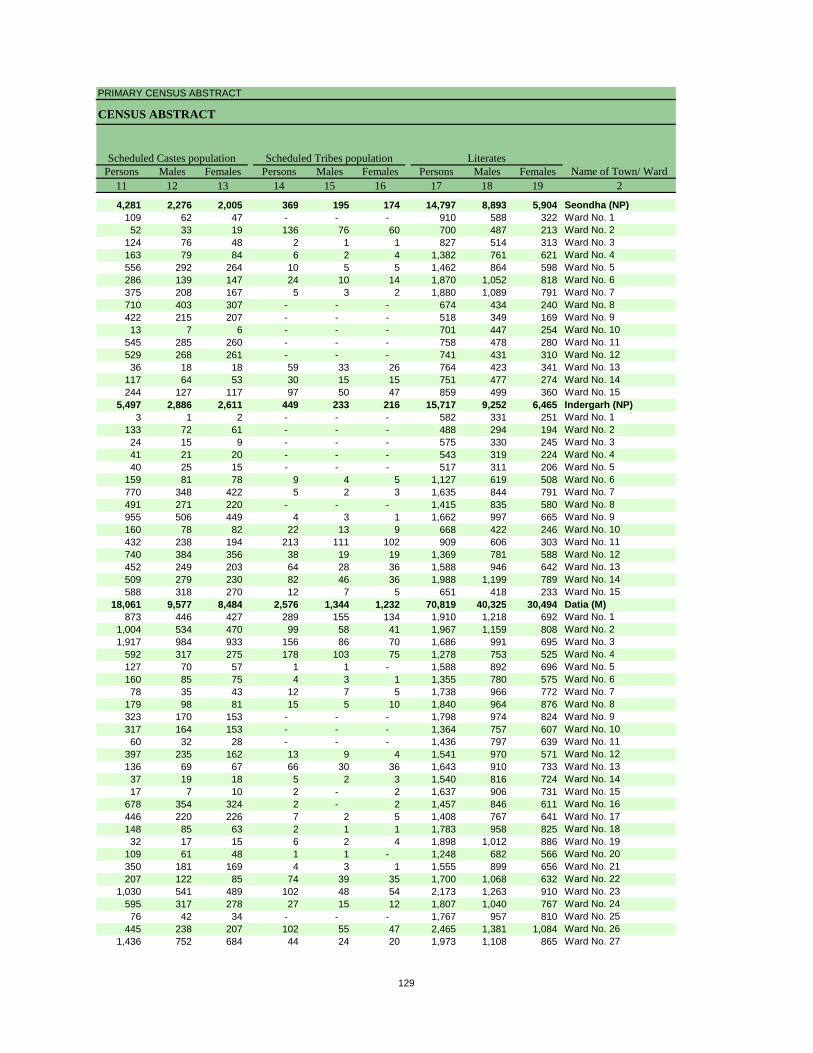
PRIMARY CENSUS ABSTRACT
CENSUS ABSTRACT
Persons Males Females Persons Males Females Persons Males Females11 12 13 14 15 16 17 18 19 2
4,281 2,276 2,005 369 195 174 14,797 8,893 5,904 Seondha (NP)109 62 47 - - - 910 588 322 Ward No. 152 33 19 136 76 60 700 487 213 Ward No. 2
124 76 48 2 1 1 827 514 313 Ward No. 3163 79 84 6 2 4 1,382 761 621 Ward No. 4556 292 264 10 5 5 1,462 864 598 Ward No. 5286 139 147 24 10 14 1,870 1,052 818 Ward No. 6375 208 167 5 3 2 1,880 1,089 791 Ward No. 7710 403 307 - - - 674 434 240 Ward No. 8422 215 207 - - - 518 349 169 Ward No. 913 7 6 - - - 701 447 254 Ward No. 10
545 285 260 - - - 758 478 280 Ward No. 11529 268 261 - - - 741 431 310 Ward No. 1236 18 18 59 33 26 764 423 341 Ward No. 13
117 64 53 30 15 15 751 477 274 Ward No. 14244 127 117 97 50 47 859 499 360 Ward No. 15
5,497 2,886 2,611 449 233 216 15,717 9,252 6,465 Indergarh (NP)3 1 2 - - - 582 331 251 Ward No. 1
133 72 61 - - - 488 294 194 Ward No. 224 15 9 - - - 575 330 245 Ward No. 341 21 20 - - - 543 319 224 Ward No. 440 25 15 - - - 517 311 206 Ward No. 5
159 81 78 9 4 5 1,127 619 508 Ward No. 6770 348 422 5 2 3 1,635 844 791 Ward No. 7491 271 220 - - - 1,415 835 580 Ward No. 8955 506 449 4 3 1 1,662 997 665 Ward No. 9160 78 82 22 13 9 668 422 246 Ward No. 10432 238 194 213 111 102 909 606 303 Ward No. 11740 384 356 38 19 19 1,369 781 588 Ward No. 12452 249 203 64 28 36 1,588 946 642 Ward No. 13509 279 230 82 46 36 1,988 1,199 789 Ward No. 14588 318 270 12 7 5 651 418 233 Ward No. 15
18,061 9,577 8,484 2,576 1,344 1,232 70,819 40,325 30,494 Datia (M)873 446 427 289 155 134 1,910 1,218 692 Ward No. 1
1,004 534 470 99 58 41 1,967 1,159 808 Ward No. 21,917 984 933 156 86 70 1,686 991 695 Ward No. 3
592 317 275 178 103 75 1,278 753 525 Ward No. 4127 70 57 1 1 - 1,588 892 696 Ward No. 5160 85 75 4 3 1 1,355 780 575 Ward No. 678 35 43 12 7 5 1,738 966 772 Ward No. 7
179 98 81 15 5 10 1,840 964 876 Ward No. 8323 170 153 - - - 1,798 974 824 Ward No. 9317 164 153 - - - 1,364 757 607 Ward No. 1060 32 28 - - - 1,436 797 639 Ward No. 11
397 235 162 13 9 4 1,541 970 571 Ward No. 12136 69 67 66 30 36 1,643 910 733 Ward No. 1337 19 18 5 2 3 1,540 816 724 Ward No. 1417 7 10 2 - 2 1,637 906 731 Ward No. 15
678 354 324 2 - 2 1,457 846 611 Ward No. 16446 220 226 7 2 5 1,408 767 641 Ward No. 17148 85 63 2 1 1 1,783 958 825 Ward No. 1832 17 15 6 2 4 1,898 1,012 886 Ward No. 19
109 61 48 1 1 - 1,248 682 566 Ward No. 20350 181 169 4 3 1 1,555 899 656 Ward No. 21207 122 85 74 39 35 1,700 1,068 632 Ward No. 22
1,030 541 489 102 48 54 2,173 1,263 910 Ward No. 23595 317 278 27 15 12 1,807 1,040 767 Ward No. 2476 42 34 - - - 1,767 957 810 Ward No. 25
445 238 207 102 55 47 2,465 1,381 1,084 Ward No. 261,436 752 684 44 24 20 1,973 1,108 865 Ward No. 27
Name of Town/ WardLiteratesScheduled Castes population Scheduled Tribes population
129
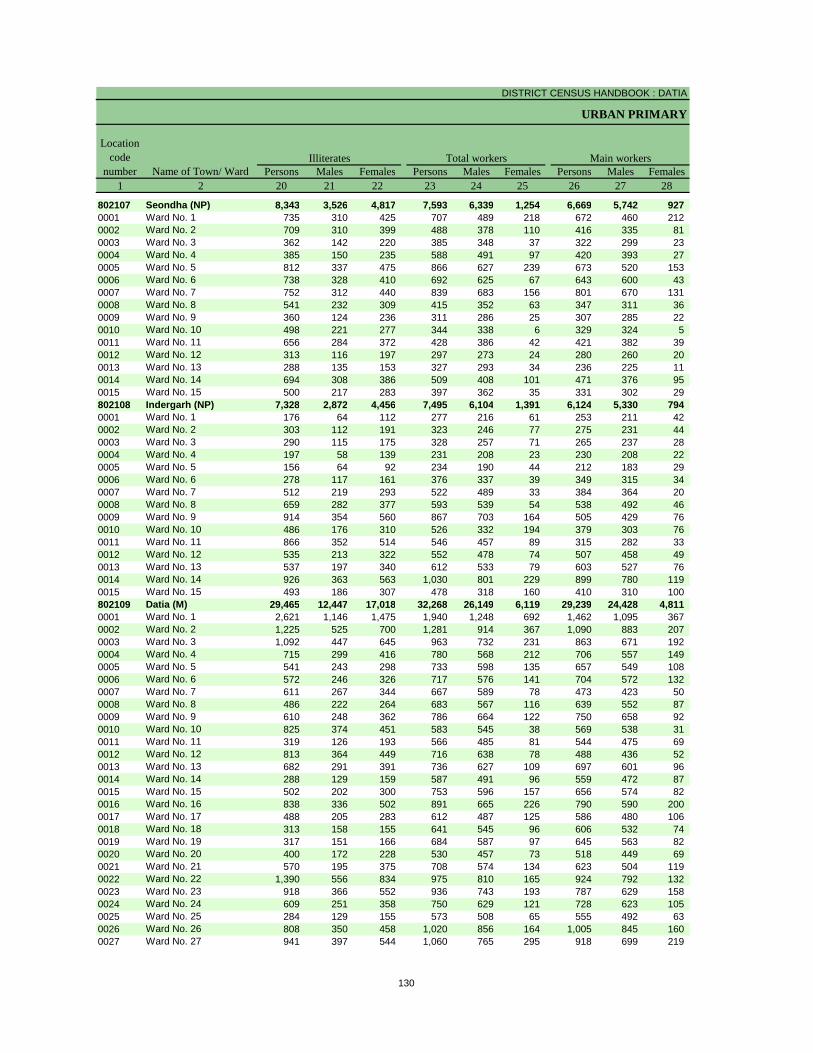
DISTRICT CENSUS HANDBOOK : DATIA
URBAN PRIMARY
Persons Males Females Persons Males Females Persons Males Females1 2 20 21 22 23 24 25 26 27 28
802107 Seondha (NP) 8,343 3,526 4,817 7,593 6,339 1,254 6,669 5,742 927 0001 Ward No. 1 735 310 425 707 489 218 672 460 212 0002 Ward No. 2 709 310 399 488 378 110 416 335 81 0003 Ward No. 3 362 142 220 385 348 37 322 299 23 0004 Ward No. 4 385 150 235 588 491 97 420 393 27 0005 Ward No. 5 812 337 475 866 627 239 673 520 153 0006 Ward No. 6 738 328 410 692 625 67 643 600 43 0007 Ward No. 7 752 312 440 839 683 156 801 670 131 0008 Ward No. 8 541 232 309 415 352 63 347 311 36 0009 Ward No. 9 360 124 236 311 286 25 307 285 22 0010 Ward No. 10 498 221 277 344 338 6 329 324 5 0011 Ward No. 11 656 284 372 428 386 42 421 382 39 0012 Ward No. 12 313 116 197 297 273 24 280 260 20 0013 Ward No. 13 288 135 153 327 293 34 236 225 11 0014 Ward No. 14 694 308 386 509 408 101 471 376 95 0015 Ward No. 15 500 217 283 397 362 35 331 302 29 802108 Indergarh (NP) 7,328 2,872 4,456 7,495 6,104 1,391 6,124 5,330 794 0001 Ward No. 1 176 64 112 277 216 61 253 211 42 0002 Ward No. 2 303 112 191 323 246 77 275 231 44 0003 Ward No. 3 290 115 175 328 257 71 265 237 28 0004 Ward No. 4 197 58 139 231 208 23 230 208 22 0005 Ward No. 5 156 64 92 234 190 44 212 183 29 0006 Ward No. 6 278 117 161 376 337 39 349 315 34 0007 Ward No. 7 512 219 293 522 489 33 384 364 20 0008 Ward No. 8 659 282 377 593 539 54 538 492 46 0009 Ward No. 9 914 354 560 867 703 164 505 429 76 0010 Ward No. 10 486 176 310 526 332 194 379 303 76 0011 Ward No. 11 866 352 514 546 457 89 315 282 33 0012 Ward No. 12 535 213 322 552 478 74 507 458 49 0013 Ward No. 13 537 197 340 612 533 79 603 527 76 0014 Ward No. 14 926 363 563 1,030 801 229 899 780 119 0015 Ward No. 15 493 186 307 478 318 160 410 310 100 802109 Datia (M) 29,465 12,447 17,018 32,268 26,149 6,119 29,239 24,428 4,811 0001 Ward No. 1 2,621 1,146 1,475 1,940 1,248 692 1,462 1,095 367 0002 Ward No. 2 1,225 525 700 1,281 914 367 1,090 883 207 0003 Ward No. 3 1,092 447 645 963 732 231 863 671 192 0004 Ward No. 4 715 299 416 780 568 212 706 557 149 0005 Ward No. 5 541 243 298 733 598 135 657 549 108 0006 Ward No. 6 572 246 326 717 576 141 704 572 132 0007 Ward No. 7 611 267 344 667 589 78 473 423 50 0008 Ward No. 8 486 222 264 683 567 116 639 552 87 0009 Ward No. 9 610 248 362 786 664 122 750 658 92 0010 Ward No. 10 825 374 451 583 545 38 569 538 31 0011 Ward No. 11 319 126 193 566 485 81 544 475 69 0012 Ward No. 12 813 364 449 716 638 78 488 436 52 0013 Ward No. 13 682 291 391 736 627 109 697 601 96 0014 Ward No. 14 288 129 159 587 491 96 559 472 87 0015 Ward No. 15 502 202 300 753 596 157 656 574 82 0016 Ward No. 16 838 336 502 891 665 226 790 590 200 0017 Ward No. 17 488 205 283 612 487 125 586 480 106 0018 Ward No. 18 313 158 155 641 545 96 606 532 74 0019 Ward No. 19 317 151 166 684 587 97 645 563 82 0020 Ward No. 20 400 172 228 530 457 73 518 449 69 0021 Ward No. 21 570 195 375 708 574 134 623 504 119 0022 Ward No. 22 1,390 556 834 975 810 165 924 792 132 0023 Ward No. 23 918 366 552 936 743 193 787 629 158 0024 Ward No. 24 609 251 358 750 629 121 728 623 105 0025 Ward No. 25 284 129 155 573 508 65 555 492 63 0026 Ward No. 26 808 350 458 1,020 856 164 1,005 845 160 0027 Ward No. 27 941 397 544 1,060 765 295 918 699 219
Name of Town/ Ward
Location code
numberIlliterates Total workers Main workers
130
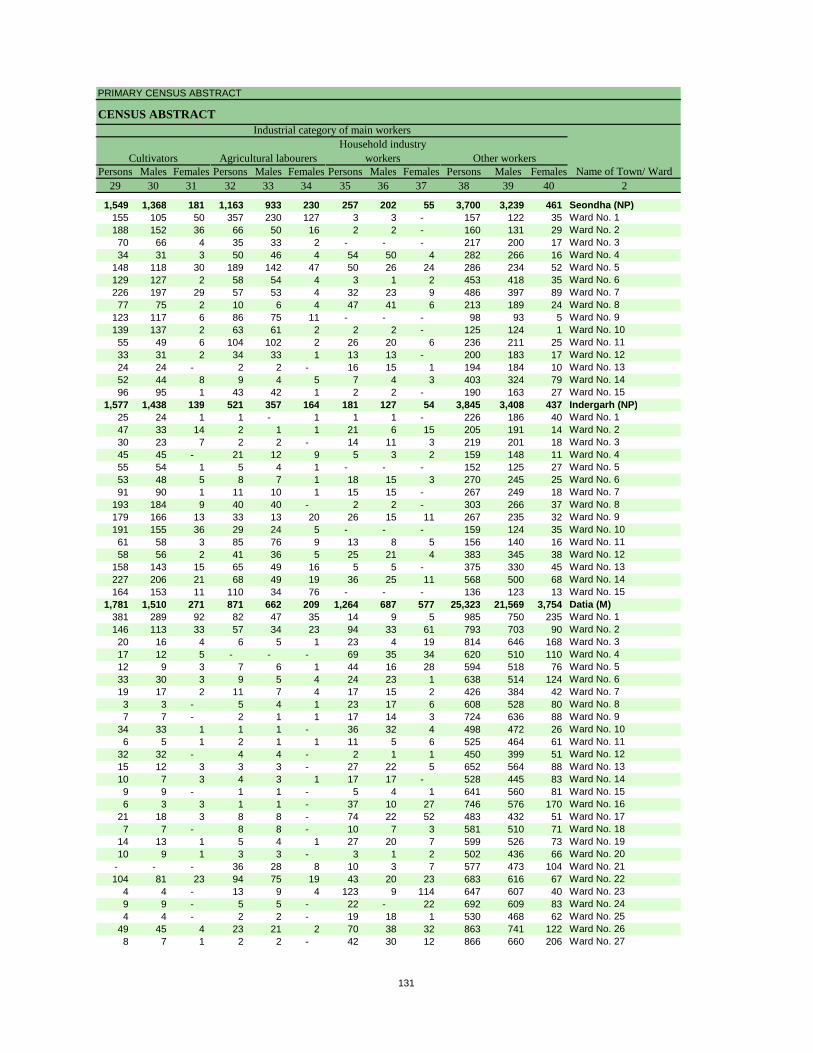
PRIMARY CENSUS ABSTRACT
CENSUS ABSTRACT
Persons Males Females Persons Males Females Persons Males Females Persons Males Females29 30 31 32 33 34 35 36 37 38 39 40 2
1,549 1,368 181 1,163 933 230 257 202 55 3,700 3,239 461 Seondha (NP)155 105 50 357 230 127 3 3 - 157 122 35 Ward No. 1188 152 36 66 50 16 2 2 - 160 131 29 Ward No. 270 66 4 35 33 2 - - - 217 200 17 Ward No. 334 31 3 50 46 4 54 50 4 282 266 16 Ward No. 4
148 118 30 189 142 47 50 26 24 286 234 52 Ward No. 5129 127 2 58 54 4 3 1 2 453 418 35 Ward No. 6226 197 29 57 53 4 32 23 9 486 397 89 Ward No. 777 75 2 10 6 4 47 41 6 213 189 24 Ward No. 8
123 117 6 86 75 11 - - - 98 93 5 Ward No. 9139 137 2 63 61 2 2 2 - 125 124 1 Ward No. 1055 49 6 104 102 2 26 20 6 236 211 25 Ward No. 1133 31 2 34 33 1 13 13 - 200 183 17 Ward No. 1224 24 - 2 2 - 16 15 1 194 184 10 Ward No. 1352 44 8 9 4 5 7 4 3 403 324 79 Ward No. 1496 95 1 43 42 1 2 2 - 190 163 27 Ward No. 15
1,577 1,438 139 521 357 164 181 127 54 3,845 3,408 437 Indergarh (NP)25 24 1 1 - 1 1 1 - 226 186 40 Ward No. 147 33 14 2 1 1 21 6 15 205 191 14 Ward No. 230 23 7 2 2 - 14 11 3 219 201 18 Ward No. 345 45 - 21 12 9 5 3 2 159 148 11 Ward No. 455 54 1 5 4 1 - - - 152 125 27 Ward No. 553 48 5 8 7 1 18 15 3 270 245 25 Ward No. 691 90 1 11 10 1 15 15 - 267 249 18 Ward No. 7
193 184 9 40 40 - 2 2 - 303 266 37 Ward No. 8179 166 13 33 13 20 26 15 11 267 235 32 Ward No. 9191 155 36 29 24 5 - - - 159 124 35 Ward No. 1061 58 3 85 76 9 13 8 5 156 140 16 Ward No. 1158 56 2 41 36 5 25 21 4 383 345 38 Ward No. 12
158 143 15 65 49 16 5 5 - 375 330 45 Ward No. 13227 206 21 68 49 19 36 25 11 568 500 68 Ward No. 14164 153 11 110 34 76 - - - 136 123 13 Ward No. 15
1,781 1,510 271 871 662 209 1,264 687 577 25,323 21,569 3,754 Datia (M)381 289 92 82 47 35 14 9 5 985 750 235 Ward No. 1146 113 33 57 34 23 94 33 61 793 703 90 Ward No. 220 16 4 6 5 1 23 4 19 814 646 168 Ward No. 317 12 5 - - - 69 35 34 620 510 110 Ward No. 412 9 3 7 6 1 44 16 28 594 518 76 Ward No. 533 30 3 9 5 4 24 23 1 638 514 124 Ward No. 619 17 2 11 7 4 17 15 2 426 384 42 Ward No. 73 3 - 5 4 1 23 17 6 608 528 80 Ward No. 87 7 - 2 1 1 17 14 3 724 636 88 Ward No. 9
34 33 1 1 1 - 36 32 4 498 472 26 Ward No. 106 5 1 2 1 1 11 5 6 525 464 61 Ward No. 11
32 32 - 4 4 - 2 1 1 450 399 51 Ward No. 1215 12 3 3 3 - 27 22 5 652 564 88 Ward No. 1310 7 3 4 3 1 17 17 - 528 445 83 Ward No. 149 9 - 1 1 - 5 4 1 641 560 81 Ward No. 156 3 3 1 1 - 37 10 27 746 576 170 Ward No. 16
21 18 3 8 8 - 74 22 52 483 432 51 Ward No. 177 7 - 8 8 - 10 7 3 581 510 71 Ward No. 18
14 13 1 5 4 1 27 20 7 599 526 73 Ward No. 1910 9 1 3 3 - 3 1 2 502 436 66 Ward No. 20
- - - 36 28 8 10 3 7 577 473 104 Ward No. 21104 81 23 94 75 19 43 20 23 683 616 67 Ward No. 22
4 4 - 13 9 4 123 9 114 647 607 40 Ward No. 239 9 - 5 5 - 22 - 22 692 609 83 Ward No. 244 4 - 2 2 - 19 18 1 530 468 62 Ward No. 25
49 45 4 23 21 2 70 38 32 863 741 122 Ward No. 268 7 1 2 2 - 42 30 12 866 660 206 Ward No. 27
Name of Town/ Ward
Household industry workersAgricultural labourers
Industrial category of main workers
Other workersCultivators
131
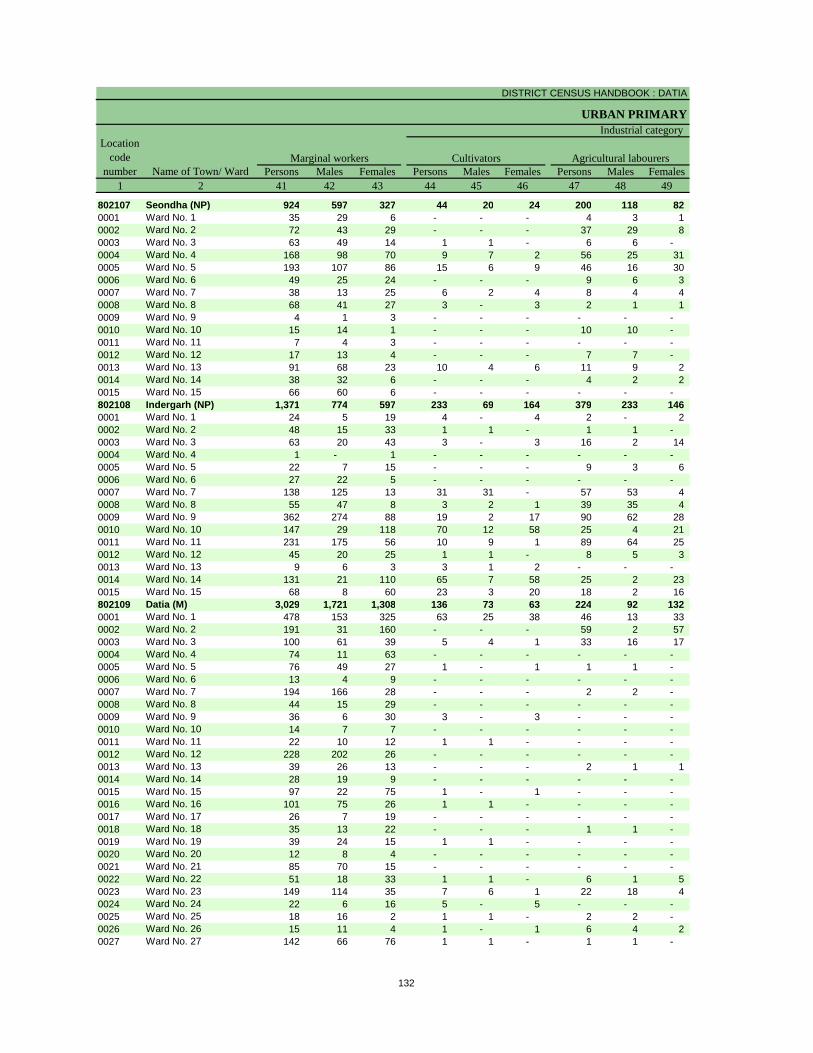
DISTRICT CENSUS HANDBOOK : DATIA
URBAN PRIMARY
Persons Males Females Persons Males Females Persons Males Females1 2 41 42 43 44 45 46 47 48 49
802107 Seondha (NP) 924 597 327 44 20 24 200 118 82 0001 Ward No. 1 35 29 6 - - - 4 3 1 0002 Ward No. 2 72 43 29 - - - 37 29 8 0003 Ward No. 3 63 49 14 1 1 - 6 6 - 0004 Ward No. 4 168 98 70 9 7 2 56 25 31 0005 Ward No. 5 193 107 86 15 6 9 46 16 30 0006 Ward No. 6 49 25 24 - - - 9 6 3 0007 Ward No. 7 38 13 25 6 2 4 8 4 4 0008 Ward No. 8 68 41 27 3 - 3 2 1 1 0009 Ward No. 9 4 1 3 - - - - - - 0010 Ward No. 10 15 14 1 - - - 10 10 - 0011 Ward No. 11 7 4 3 - - - - - - 0012 Ward No. 12 17 13 4 - - - 7 7 - 0013 Ward No. 13 91 68 23 10 4 6 11 9 2 0014 Ward No. 14 38 32 6 - - - 4 2 2 0015 Ward No. 15 66 60 6 - - - - - - 802108 Indergarh (NP) 1,371 774 597 233 69 164 379 233 146 0001 Ward No. 1 24 5 19 4 - 4 2 - 2 0002 Ward No. 2 48 15 33 1 1 - 1 1 - 0003 Ward No. 3 63 20 43 3 - 3 16 2 14 0004 Ward No. 4 1 - 1 - - - - - - 0005 Ward No. 5 22 7 15 - - - 9 3 6 0006 Ward No. 6 27 22 5 - - - - - - 0007 Ward No. 7 138 125 13 31 31 - 57 53 4 0008 Ward No. 8 55 47 8 3 2 1 39 35 4 0009 Ward No. 9 362 274 88 19 2 17 90 62 28 0010 Ward No. 10 147 29 118 70 12 58 25 4 21 0011 Ward No. 11 231 175 56 10 9 1 89 64 25 0012 Ward No. 12 45 20 25 1 1 - 8 5 3 0013 Ward No. 13 9 6 3 3 1 2 - - - 0014 Ward No. 14 131 21 110 65 7 58 25 2 23 0015 Ward No. 15 68 8 60 23 3 20 18 2 16 802109 Datia (M) 3,029 1,721 1,308 136 73 63 224 92 132 0001 Ward No. 1 478 153 325 63 25 38 46 13 33 0002 Ward No. 2 191 31 160 - - - 59 2 57 0003 Ward No. 3 100 61 39 5 4 1 33 16 17 0004 Ward No. 4 74 11 63 - - - - - - 0005 Ward No. 5 76 49 27 1 - 1 1 1 - 0006 Ward No. 6 13 4 9 - - - - - - 0007 Ward No. 7 194 166 28 - - - 2 2 - 0008 Ward No. 8 44 15 29 - - - - - - 0009 Ward No. 9 36 6 30 3 - 3 - - - 0010 Ward No. 10 14 7 7 - - - - - - 0011 Ward No. 11 22 10 12 1 1 - - - - 0012 Ward No. 12 228 202 26 - - - - - - 0013 Ward No. 13 39 26 13 - - - 2 1 1 0014 Ward No. 14 28 19 9 - - - - - - 0015 Ward No. 15 97 22 75 1 - 1 - - - 0016 Ward No. 16 101 75 26 1 1 - - - - 0017 Ward No. 17 26 7 19 - - - - - - 0018 Ward No. 18 35 13 22 - - - 1 1 - 0019 Ward No. 19 39 24 15 1 1 - - - - 0020 Ward No. 20 12 8 4 - - - - - - 0021 Ward No. 21 85 70 15 - - - - - - 0022 Ward No. 22 51 18 33 1 1 - 6 1 5 0023 Ward No. 23 149 114 35 7 6 1 22 18 4 0024 Ward No. 24 22 6 16 5 - 5 - - - 0025 Ward No. 25 18 16 2 1 1 - 2 2 - 0026 Ward No. 26 15 11 4 1 - 1 6 4 2 0027 Ward No. 27 142 66 76 1 1 - 1 1 -
Name of Town/ WardMarginal workers Cultivators Agricultural labourers
Industrial categoryLocation
code number
132
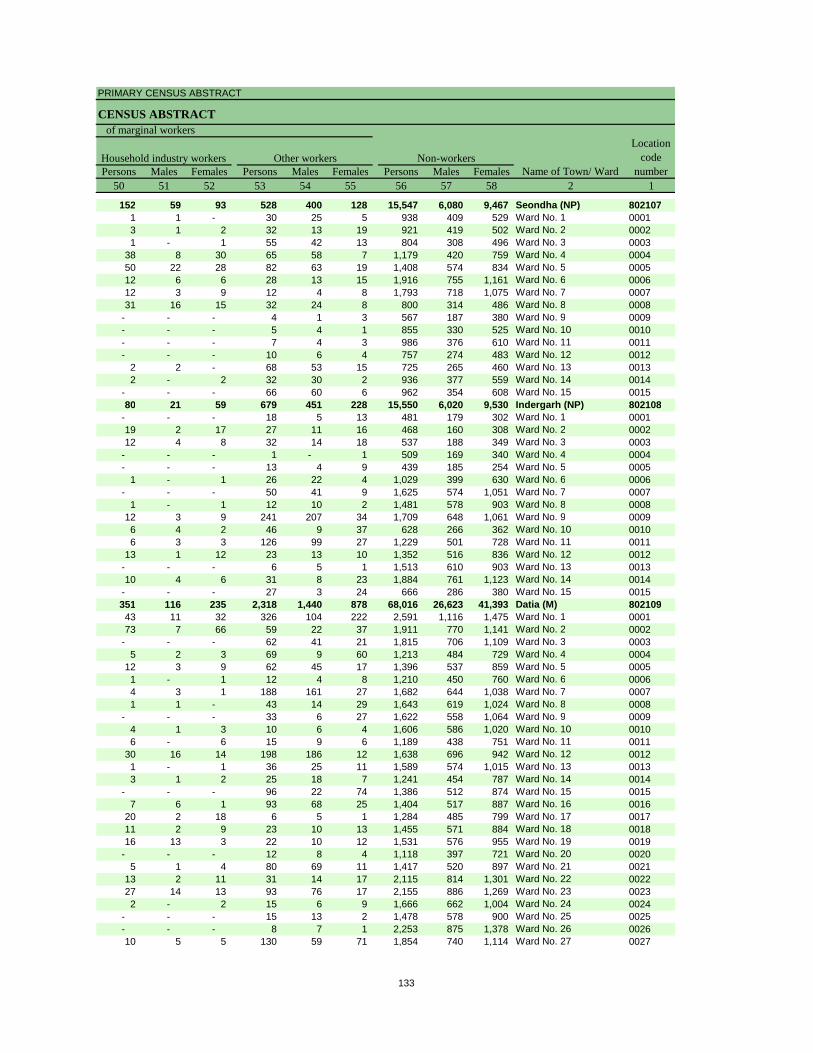
PRIMARY CENSUS ABSTRACT
CENSUS ABSTRACT
Persons Males Females Persons Males Females Persons Males Females50 51 52 53 54 55 56 57 58 2 1
152 59 93 528 400 128 15,547 6,080 9,467 Seondha (NP) 8021071 1 - 30 25 5 938 409 529 Ward No. 1 00013 1 2 32 13 19 921 419 502 Ward No. 2 00021 - 1 55 42 13 804 308 496 Ward No. 3 0003
38 8 30 65 58 7 1,179 420 759 Ward No. 4 000450 22 28 82 63 19 1,408 574 834 Ward No. 5 000512 6 6 28 13 15 1,916 755 1,161 Ward No. 6 000612 3 9 12 4 8 1,793 718 1,075 Ward No. 7 000731 16 15 32 24 8 800 314 486 Ward No. 8 0008
- - - 4 1 3 567 187 380 Ward No. 9 0009- - - 5 4 1 855 330 525 Ward No. 10 0010- - - 7 4 3 986 376 610 Ward No. 11 0011- - - 10 6 4 757 274 483 Ward No. 12 0012
2 2 - 68 53 15 725 265 460 Ward No. 13 00132 - 2 32 30 2 936 377 559 Ward No. 14 0014
- - - 66 60 6 962 354 608 Ward No. 15 001580 21 59 679 451 228 15,550 6,020 9,530 Indergarh (NP) 802108
- - - 18 5 13 481 179 302 Ward No. 1 000119 2 17 27 11 16 468 160 308 Ward No. 2 000212 4 8 32 14 18 537 188 349 Ward No. 3 0003
- - - 1 - 1 509 169 340 Ward No. 4 0004- - - 13 4 9 439 185 254 Ward No. 5 0005
1 - 1 26 22 4 1,029 399 630 Ward No. 6 0006- - - 50 41 9 1,625 574 1,051 Ward No. 7 0007
1 - 1 12 10 2 1,481 578 903 Ward No. 8 000812 3 9 241 207 34 1,709 648 1,061 Ward No. 9 00096 4 2 46 9 37 628 266 362 Ward No. 10 00106 3 3 126 99 27 1,229 501 728 Ward No. 11 0011
13 1 12 23 13 10 1,352 516 836 Ward No. 12 0012- - - 6 5 1 1,513 610 903 Ward No. 13 001310 4 6 31 8 23 1,884 761 1,123 Ward No. 14 0014
- - - 27 3 24 666 286 380 Ward No. 15 0015351 116 235 2,318 1,440 878 68,016 26,623 41,393 Datia (M) 80210943 11 32 326 104 222 2,591 1,116 1,475 Ward No. 1 000173 7 66 59 22 37 1,911 770 1,141 Ward No. 2 0002
- - - 62 41 21 1,815 706 1,109 Ward No. 3 00035 2 3 69 9 60 1,213 484 729 Ward No. 4 0004
12 3 9 62 45 17 1,396 537 859 Ward No. 5 00051 - 1 12 4 8 1,210 450 760 Ward No. 6 00064 3 1 188 161 27 1,682 644 1,038 Ward No. 7 00071 1 - 43 14 29 1,643 619 1,024 Ward No. 8 0008
- - - 33 6 27 1,622 558 1,064 Ward No. 9 00094 1 3 10 6 4 1,606 586 1,020 Ward No. 10 00106 - 6 15 9 6 1,189 438 751 Ward No. 11 0011
30 16 14 198 186 12 1,638 696 942 Ward No. 12 00121 - 1 36 25 11 1,589 574 1,015 Ward No. 13 00133 1 2 25 18 7 1,241 454 787 Ward No. 14 0014
- - - 96 22 74 1,386 512 874 Ward No. 15 00157 6 1 93 68 25 1,404 517 887 Ward No. 16 0016
20 2 18 6 5 1 1,284 485 799 Ward No. 17 001711 2 9 23 10 13 1,455 571 884 Ward No. 18 001816 13 3 22 10 12 1,531 576 955 Ward No. 19 0019
- - - 12 8 4 1,118 397 721 Ward No. 20 00205 1 4 80 69 11 1,417 520 897 Ward No. 21 0021
13 2 11 31 14 17 2,115 814 1,301 Ward No. 22 002227 14 13 93 76 17 2,155 886 1,269 Ward No. 23 00232 - 2 15 6 9 1,666 662 1,004 Ward No. 24 0024
- - - 15 13 2 1,478 578 900 Ward No. 25 0025- - - 8 7 1 2,253 875 1,378 Ward No. 26 002610 5 5 130 59 71 1,854 740 1,114 Ward No. 27 0027
Location code
numberHousehold industry workers
Name of Town/ WardOther workers
of marginal workers
Non-workers
133
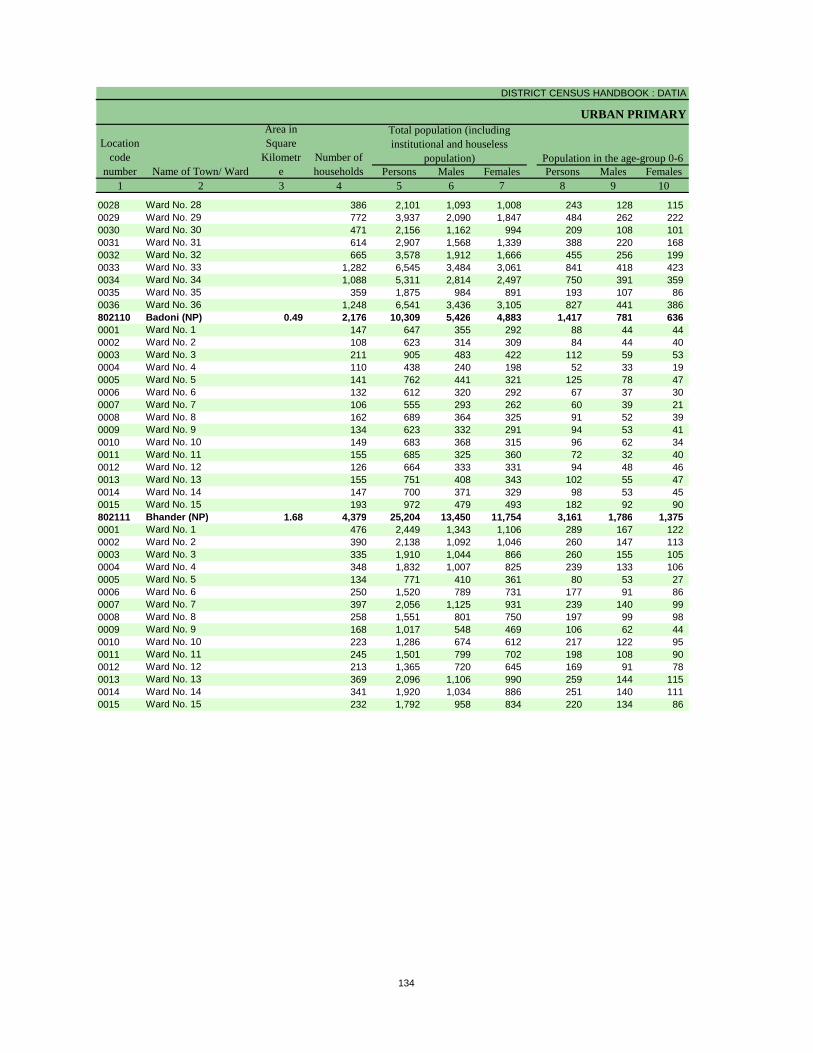
DISTRICT CENSUS HANDBOOK : DATIA
URBAN PRIMARY
Persons Males Females Persons Males Females1 2 3 4 5 6 7 8 9 10
Name of Town/ Ward
Location code
number
Total population (including institutional and houseless
population)
Area in Square
Kilometre
Number of households
Population in the age-group 0-6
0028 Ward No. 28 386 2,101 1,093 1,008 243 128 115 0029 Ward No. 29 772 3,937 2,090 1,847 484 262 222 0030 Ward No. 30 471 2,156 1,162 994 209 108 101 0031 Ward No. 31 614 2,907 1,568 1,339 388 220 168 0032 Ward No. 32 665 3,578 1,912 1,666 455 256 199 0033 Ward No. 33 1,282 6,545 3,484 3,061 841 418 423 0034 Ward No. 34 1,088 5,311 2,814 2,497 750 391 359 0035 Ward No. 35 359 1,875 984 891 193 107 86 0036 Ward No. 36 1,248 6,541 3,436 3,105 827 441 386 802110 Badoni (NP) 0.49 2,176 10,309 5,426 4,883 1,417 781 636 0001 Ward No. 1 147 647 355 292 88 44 44 0002 Ward No. 2 108 623 314 309 84 44 40 0003 Ward No. 3 211 905 483 422 112 59 53 0004 Ward No. 4 110 438 240 198 52 33 19 0005 Ward No. 5 141 762 441 321 125 78 47 0006 Ward No. 6 132 612 320 292 67 37 30 0007 Ward No. 7 106 555 293 262 60 39 21 0008 Ward No. 8 162 689 364 325 91 52 39 0009 Ward No. 9 134 623 332 291 94 53 41 0010 Ward No. 10 149 683 368 315 96 62 34 0011 Ward No. 11 155 685 325 360 72 32 40 0012 Ward No. 12 126 664 333 331 94 48 46 0013 Ward No. 13 155 751 408 343 102 55 47 0014 Ward No. 14 147 700 371 329 98 53 45 0015 Ward No. 15 193 972 479 493 182 92 90 802111 Bhander (NP) 1.68 4,379 25,204 13,450 11,754 3,161 1,786 1,375 0001 Ward No. 1 476 2,449 1,343 1,106 289 167 122 0002 Ward No. 2 390 2,138 1,092 1,046 260 147 113 0003 Ward No. 3 335 1,910 1,044 866 260 155 105 0004 Ward No. 4 348 1,832 1,007 825 239 133 106 0005 Ward No. 5 134 771 410 361 80 53 27 0006 Ward No. 6 250 1,520 789 731 177 91 86 0007 Ward No. 7 397 2,056 1,125 931 239 140 99 0008 Ward No. 8 258 1,551 801 750 197 99 98 0009 Ward No. 9 168 1,017 548 469 106 62 44 0010 Ward No. 10 223 1,286 674 612 217 122 95 0011 Ward No. 11 245 1,501 799 702 198 108 90 0012 Ward No. 12 213 1,365 720 645 169 91 78 0013 Ward No. 13 369 2,096 1,106 990 259 144 115 0014 Ward No. 14 341 1,920 1,034 886 251 140 111 0015 Ward No. 15 232 1,792 958 834 220 134 86
134
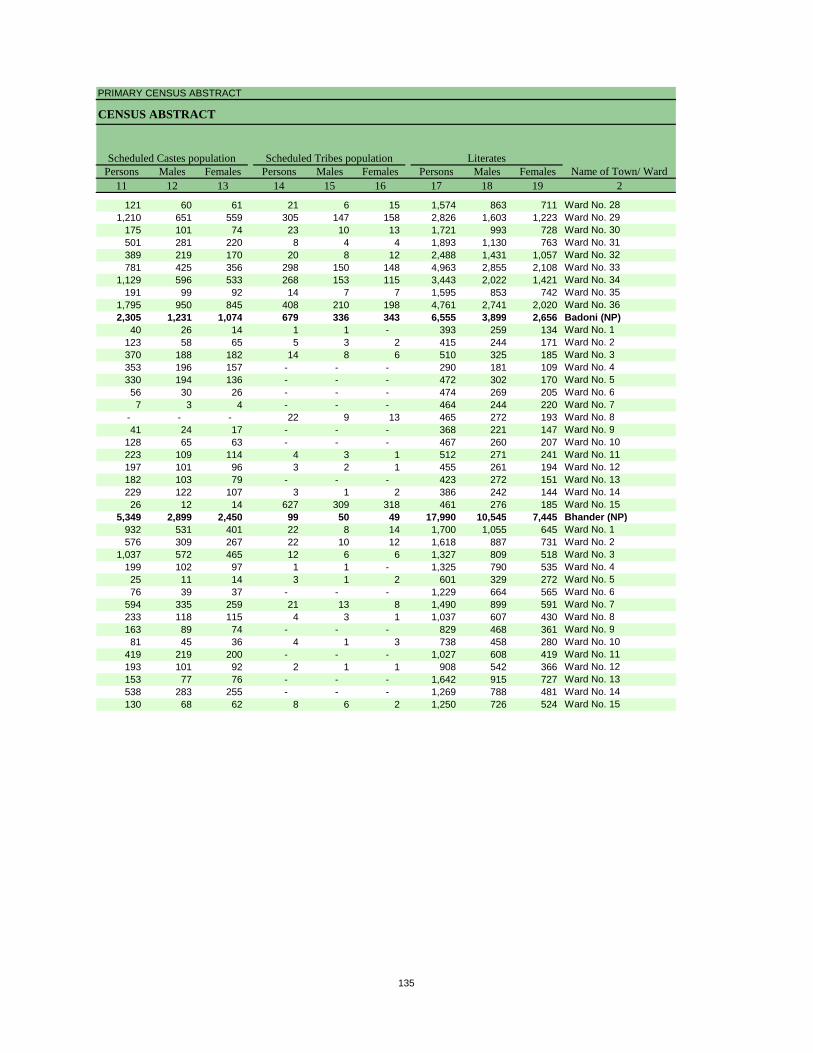
PRIMARY CENSUS ABSTRACT
CENSUS ABSTRACT
Persons Males Females Persons Males Females Persons Males Females11 12 13 14 15 16 17 18 19 2
Name of Town/ WardLiteratesScheduled Castes population Scheduled Tribes population
121 60 61 21 6 15 1,574 863 711 Ward No. 281,210 651 559 305 147 158 2,826 1,603 1,223 Ward No. 29
175 101 74 23 10 13 1,721 993 728 Ward No. 30501 281 220 8 4 4 1,893 1,130 763 Ward No. 31389 219 170 20 8 12 2,488 1,431 1,057 Ward No. 32781 425 356 298 150 148 4,963 2,855 2,108 Ward No. 33
1,129 596 533 268 153 115 3,443 2,022 1,421 Ward No. 34191 99 92 14 7 7 1,595 853 742 Ward No. 35
1,795 950 845 408 210 198 4,761 2,741 2,020 Ward No. 362,305 1,231 1,074 679 336 343 6,555 3,899 2,656 Badoni (NP)
40 26 14 1 1 - 393 259 134 Ward No. 1123 58 65 5 3 2 415 244 171 Ward No. 2370 188 182 14 8 6 510 325 185 Ward No. 3353 196 157 - - - 290 181 109 Ward No. 4330 194 136 - - - 472 302 170 Ward No. 556 30 26 - - - 474 269 205 Ward No. 67 3 4 - - - 464 244 220 Ward No. 7
- - - 22 9 13 465 272 193 Ward No. 841 24 17 - - - 368 221 147 Ward No. 9
128 65 63 - - - 467 260 207 Ward No. 10223 109 114 4 3 1 512 271 241 Ward No. 11197 101 96 3 2 1 455 261 194 Ward No. 12182 103 79 - - - 423 272 151 Ward No. 13229 122 107 3 1 2 386 242 144 Ward No. 1426 12 14 627 309 318 461 276 185 Ward No. 15
5,349 2,899 2,450 99 50 49 17,990 10,545 7,445 Bhander (NP)932 531 401 22 8 14 1,700 1,055 645 Ward No. 1576 309 267 22 10 12 1,618 887 731 Ward No. 2
1,037 572 465 12 6 6 1,327 809 518 Ward No. 3199 102 97 1 1 - 1,325 790 535 Ward No. 425 11 14 3 1 2 601 329 272 Ward No. 576 39 37 - - - 1,229 664 565 Ward No. 6
594 335 259 21 13 8 1,490 899 591 Ward No. 7233 118 115 4 3 1 1,037 607 430 Ward No. 8163 89 74 - - - 829 468 361 Ward No. 981 45 36 4 1 3 738 458 280 Ward No. 10
419 219 200 - - - 1,027 608 419 Ward No. 11193 101 92 2 1 1 908 542 366 Ward No. 12153 77 76 - - - 1,642 915 727 Ward No. 13538 283 255 - - - 1,269 788 481 Ward No. 14130 68 62 8 6 2 1,250 726 524 Ward No. 15
135
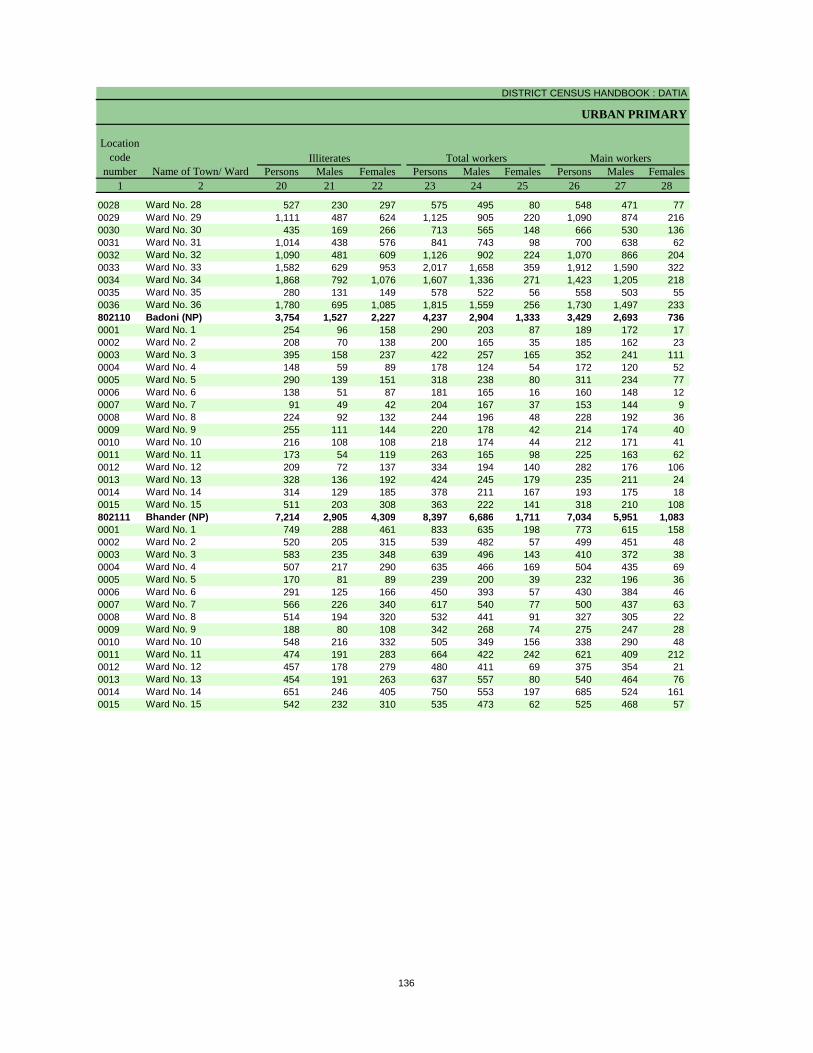
DISTRICT CENSUS HANDBOOK : DATIA
URBAN PRIMARY
Persons Males Females Persons Males Females Persons Males Females1 2 20 21 22 23 24 25 26 27 28
Name of Town/ Ward
Location code
numberIlliterates Total workers Main workers
0028 Ward No. 28 527 230 297 575 495 80 548 471 77 0029 Ward No. 29 1,111 487 624 1,125 905 220 1,090 874 216 0030 Ward No. 30 435 169 266 713 565 148 666 530 136 0031 Ward No. 31 1,014 438 576 841 743 98 700 638 62 0032 Ward No. 32 1,090 481 609 1,126 902 224 1,070 866 204 0033 Ward No. 33 1,582 629 953 2,017 1,658 359 1,912 1,590 322 0034 Ward No. 34 1,868 792 1,076 1,607 1,336 271 1,423 1,205 218 0035 Ward No. 35 280 131 149 578 522 56 558 503 55 0036 Ward No. 36 1,780 695 1,085 1,815 1,559 256 1,730 1,497 233 802110 Badoni (NP) 3,754 1,527 2,227 4,237 2,904 1,333 3,429 2,693 736 0001 Ward No. 1 254 96 158 290 203 87 189 172 17 0002 Ward No. 2 208 70 138 200 165 35 185 162 23 0003 Ward No. 3 395 158 237 422 257 165 352 241 111 0004 Ward No. 4 148 59 89 178 124 54 172 120 52 0005 Ward No. 5 290 139 151 318 238 80 311 234 77 0006 Ward No. 6 138 51 87 181 165 16 160 148 12 0007 Ward No. 7 91 49 42 204 167 37 153 144 9 0008 Ward No. 8 224 92 132 244 196 48 228 192 36 0009 Ward No. 9 255 111 144 220 178 42 214 174 40 0010 Ward No. 10 216 108 108 218 174 44 212 171 41 0011 Ward No. 11 173 54 119 263 165 98 225 163 62 0012 Ward No. 12 209 72 137 334 194 140 282 176 106 0013 Ward No. 13 328 136 192 424 245 179 235 211 24 0014 Ward No. 14 314 129 185 378 211 167 193 175 18 0015 Ward No. 15 511 203 308 363 222 141 318 210 108 802111 Bhander (NP) 7,214 2,905 4,309 8,397 6,686 1,711 7,034 5,951 1,083 0001 Ward No. 1 749 288 461 833 635 198 773 615 158 0002 Ward No. 2 520 205 315 539 482 57 499 451 48 0003 Ward No. 3 583 235 348 639 496 143 410 372 38 0004 Ward No. 4 507 217 290 635 466 169 504 435 69 0005 Ward No. 5 170 81 89 239 200 39 232 196 36 0006 Ward No. 6 291 125 166 450 393 57 430 384 46 0007 Ward No. 7 566 226 340 617 540 77 500 437 63 0008 Ward No. 8 514 194 320 532 441 91 327 305 22 0009 Ward No. 9 188 80 108 342 268 74 275 247 28 0010 Ward No. 10 548 216 332 505 349 156 338 290 48 0011 Ward No. 11 474 191 283 664 422 242 621 409 212 0012 Ward No. 12 457 178 279 480 411 69 375 354 21 0013 Ward No. 13 454 191 263 637 557 80 540 464 76 0014 Ward No. 14 651 246 405 750 553 197 685 524 161 0015 Ward No. 15 542 232 310 535 473 62 525 468 57
136
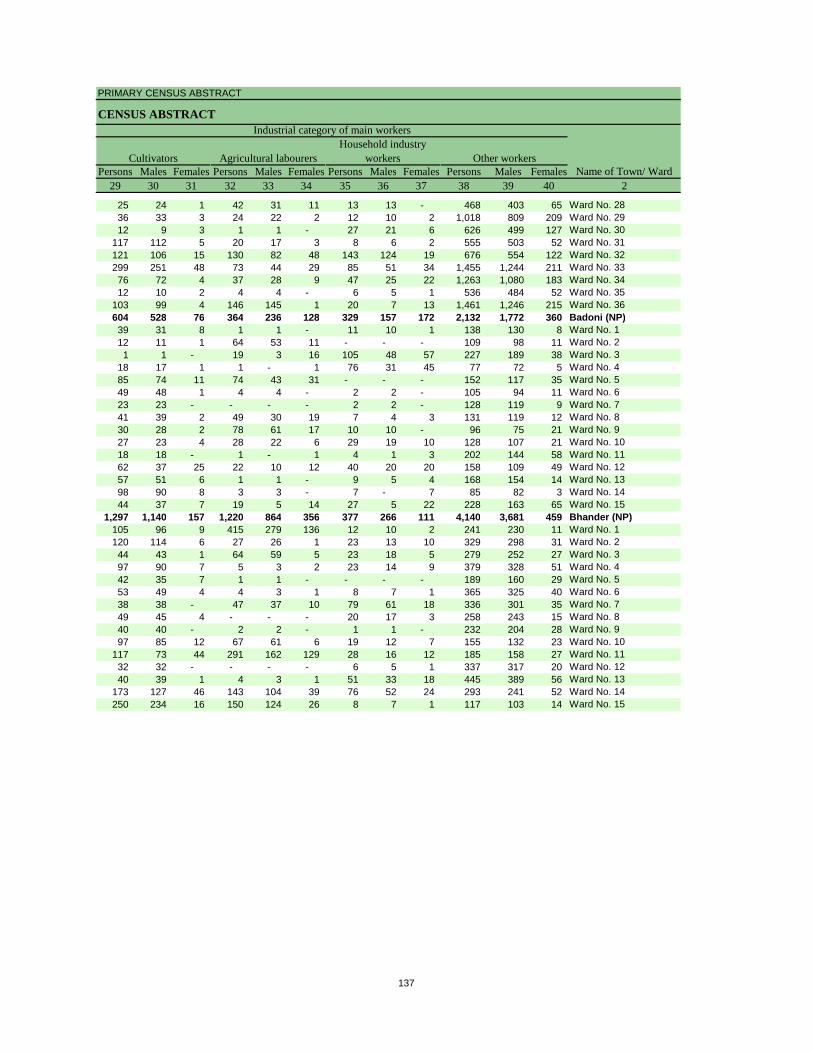
PRIMARY CENSUS ABSTRACT
CENSUS ABSTRACT
Persons Males Females Persons Males Females Persons Males Females Persons Males Females29 30 31 32 33 34 35 36 37 38 39 40 2
Name of Town/ Ward
Household industry workersAgricultural labourers
Industrial category of main workers
Other workersCultivators
25 24 1 42 31 11 13 13 - 468 403 65 Ward No. 2836 33 3 24 22 2 12 10 2 1,018 809 209 Ward No. 2912 9 3 1 1 - 27 21 6 626 499 127 Ward No. 30
117 112 5 20 17 3 8 6 2 555 503 52 Ward No. 31121 106 15 130 82 48 143 124 19 676 554 122 Ward No. 32299 251 48 73 44 29 85 51 34 1,455 1,244 211 Ward No. 3376 72 4 37 28 9 47 25 22 1,263 1,080 183 Ward No. 3412 10 2 4 4 - 6 5 1 536 484 52 Ward No. 35
103 99 4 146 145 1 20 7 13 1,461 1,246 215 Ward No. 36604 528 76 364 236 128 329 157 172 2,132 1,772 360 Badoni (NP)39 31 8 1 1 - 11 10 1 138 130 8 Ward No. 112 11 1 64 53 11 - - - 109 98 11 Ward No. 21 1 - 19 3 16 105 48 57 227 189 38 Ward No. 3
18 17 1 1 - 1 76 31 45 77 72 5 Ward No. 485 74 11 74 43 31 - - - 152 117 35 Ward No. 549 48 1 4 4 - 2 2 - 105 94 11 Ward No. 623 23 - - - - 2 2 - 128 119 9 Ward No. 741 39 2 49 30 19 7 4 3 131 119 12 Ward No. 830 28 2 78 61 17 10 10 - 96 75 21 Ward No. 927 23 4 28 22 6 29 19 10 128 107 21 Ward No. 1018 18 - 1 - 1 4 1 3 202 144 58 Ward No. 1162 37 25 22 10 12 40 20 20 158 109 49 Ward No. 1257 51 6 1 1 - 9 5 4 168 154 14 Ward No. 1398 90 8 3 3 - 7 - 7 85 82 3 Ward No. 1444 37 7 19 5 14 27 5 22 228 163 65 Ward No. 15
1,297 1,140 157 1,220 864 356 377 266 111 4,140 3,681 459 Bhander (NP)105 96 9 415 279 136 12 10 2 241 230 11 Ward No. 1120 114 6 27 26 1 23 13 10 329 298 31 Ward No. 244 43 1 64 59 5 23 18 5 279 252 27 Ward No. 397 90 7 5 3 2 23 14 9 379 328 51 Ward No. 442 35 7 1 1 - - - - 189 160 29 Ward No. 553 49 4 4 3 1 8 7 1 365 325 40 Ward No. 638 38 - 47 37 10 79 61 18 336 301 35 Ward No. 749 45 4 - - - 20 17 3 258 243 15 Ward No. 840 40 - 2 2 - 1 1 - 232 204 28 Ward No. 997 85 12 67 61 6 19 12 7 155 132 23 Ward No. 10
117 73 44 291 162 129 28 16 12 185 158 27 Ward No. 1132 32 - - - - 6 5 1 337 317 20 Ward No. 1240 39 1 4 3 1 51 33 18 445 389 56 Ward No. 13
173 127 46 143 104 39 76 52 24 293 241 52 Ward No. 14250 234 16 150 124 26 8 7 1 117 103 14 Ward No. 15
137
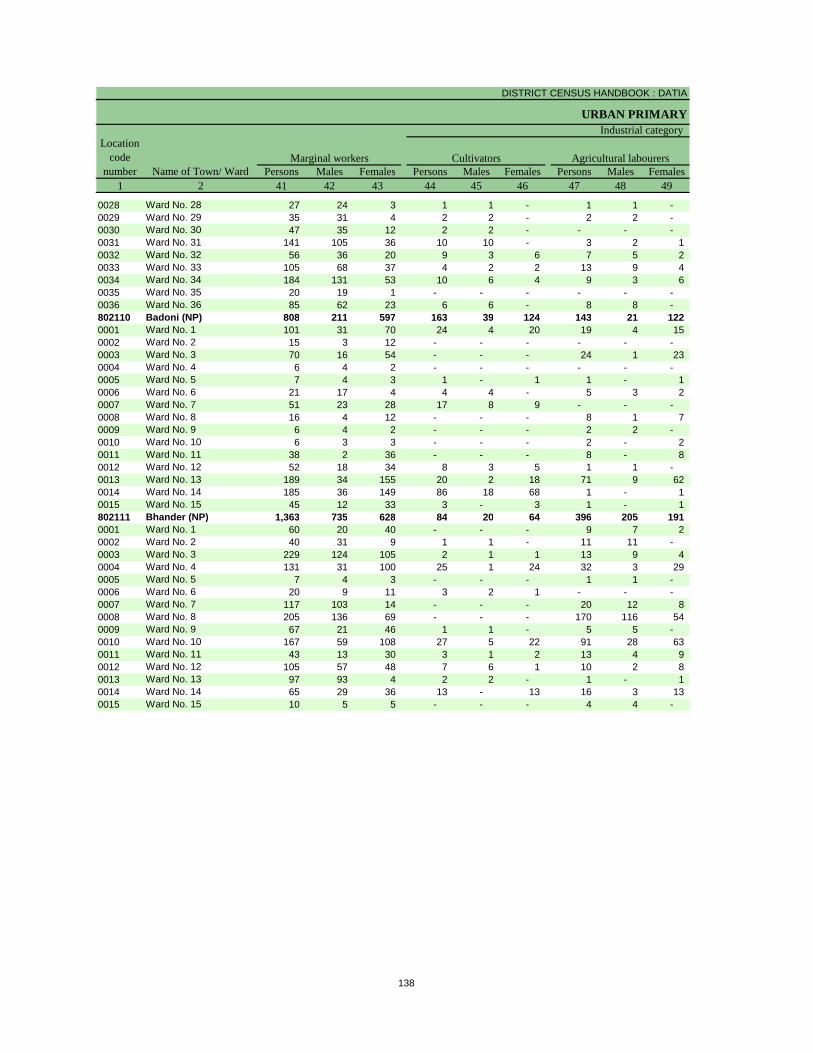
DISTRICT CENSUS HANDBOOK : DATIA
URBAN PRIMARY
Persons Males Females Persons Males Females Persons Males Females1 2 41 42 43 44 45 46 47 48 49
Name of Town/ WardMarginal workers Cultivators Agricultural labourers
Industrial categoryLocation
code number
0028 Ward No. 28 27 24 3 1 1 - 1 1 - 0029 Ward No. 29 35 31 4 2 2 - 2 2 - 0030 Ward No. 30 47 35 12 2 2 - - - - 0031 Ward No. 31 141 105 36 10 10 - 3 2 1 0032 Ward No. 32 56 36 20 9 3 6 7 5 2 0033 Ward No. 33 105 68 37 4 2 2 13 9 4 0034 Ward No. 34 184 131 53 10 6 4 9 3 6 0035 Ward No. 35 20 19 1 - - - - - - 0036 Ward No. 36 85 62 23 6 6 - 8 8 - 802110 Badoni (NP) 808 211 597 163 39 124 143 21 122 0001 Ward No. 1 101 31 70 24 4 20 19 4 15 0002 Ward No. 2 15 3 12 - - - - - - 0003 Ward No. 3 70 16 54 - - - 24 1 23 0004 Ward No. 4 6 4 2 - - - - - - 0005 Ward No. 5 7 4 3 1 - 1 1 - 1 0006 Ward No. 6 21 17 4 4 4 - 5 3 2 0007 Ward No. 7 51 23 28 17 8 9 - - - 0008 Ward No. 8 16 4 12 - - - 8 1 7 0009 Ward No. 9 6 4 2 - - - 2 2 - 0010 Ward No. 10 6 3 3 - - - 2 - 2 0011 Ward No. 11 38 2 36 - - - 8 - 8 0012 Ward No. 12 52 18 34 8 3 5 1 1 - 0013 Ward No. 13 189 34 155 20 2 18 71 9 62 0014 Ward No. 14 185 36 149 86 18 68 1 - 1 0015 Ward No. 15 45 12 33 3 - 3 1 - 1 802111 Bhander (NP) 1,363 735 628 84 20 64 396 205 191 0001 Ward No. 1 60 20 40 - - - 9 7 2 0002 Ward No. 2 40 31 9 1 1 - 11 11 - 0003 Ward No. 3 229 124 105 2 1 1 13 9 4 0004 Ward No. 4 131 31 100 25 1 24 32 3 29 0005 Ward No. 5 7 4 3 - - - 1 1 - 0006 Ward No. 6 20 9 11 3 2 1 - - - 0007 Ward No. 7 117 103 14 - - - 20 12 8 0008 Ward No. 8 205 136 69 - - - 170 116 54 0009 Ward No. 9 67 21 46 1 1 - 5 5 - 0010 Ward No. 10 167 59 108 27 5 22 91 28 63 0011 Ward No. 11 43 13 30 3 1 2 13 4 9 0012 Ward No. 12 105 57 48 7 6 1 10 2 8 0013 Ward No. 13 97 93 4 2 2 - 1 - 1 0014 Ward No. 14 65 29 36 13 - 13 16 3 13 0015 Ward No. 15 10 5 5 - - - 4 4 -
138
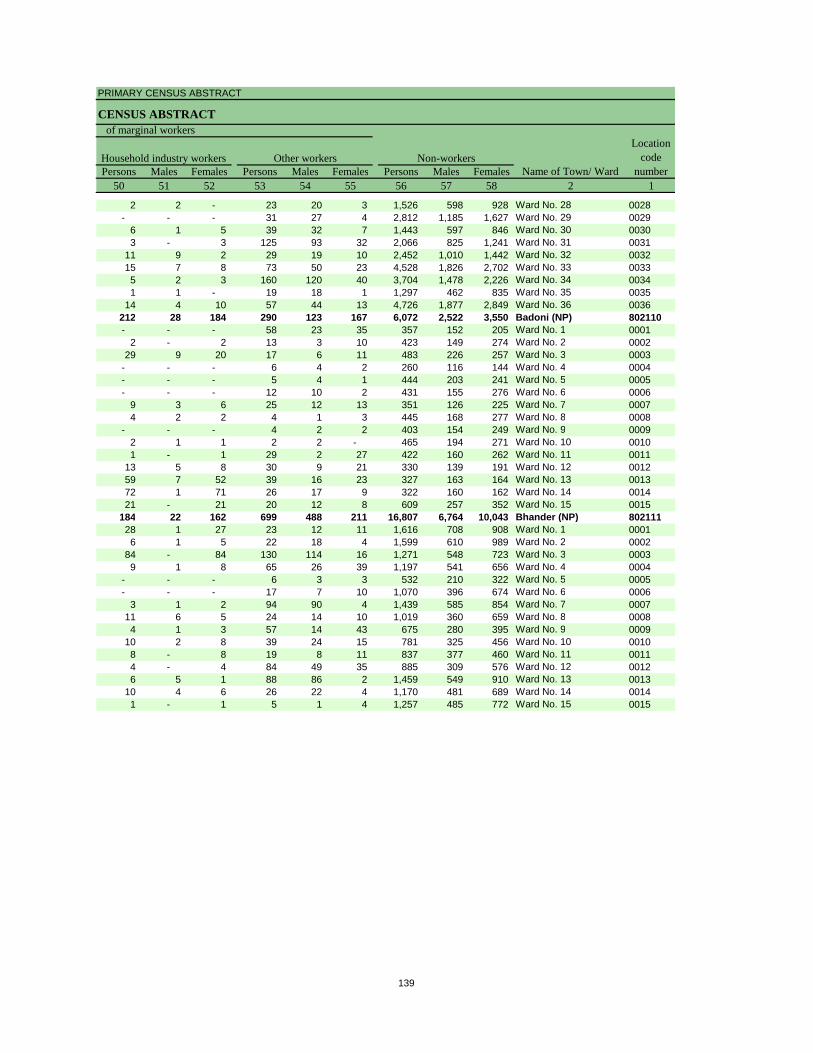
PRIMARY CENSUS ABSTRACT
CENSUS ABSTRACT
Persons Males Females Persons Males Females Persons Males Females50 51 52 53 54 55 56 57 58 2 1
Location code
numberHousehold industry workers
Name of Town/ WardOther workers
of marginal workers
Non-workers
2 2 - 23 20 3 1,526 598 928 Ward No. 28 0028- - - 31 27 4 2,812 1,185 1,627 Ward No. 29 0029
6 1 5 39 32 7 1,443 597 846 Ward No. 30 00303 - 3 125 93 32 2,066 825 1,241 Ward No. 31 0031
11 9 2 29 19 10 2,452 1,010 1,442 Ward No. 32 003215 7 8 73 50 23 4,528 1,826 2,702 Ward No. 33 00335 2 3 160 120 40 3,704 1,478 2,226 Ward No. 34 00341 1 - 19 18 1 1,297 462 835 Ward No. 35 0035
14 4 10 57 44 13 4,726 1,877 2,849 Ward No. 36 0036212 28 184 290 123 167 6,072 2,522 3,550 Badoni (NP) 802110- - - 58 23 35 357 152 205 Ward No. 1 0001
2 - 2 13 3 10 423 149 274 Ward No. 2 000229 9 20 17 6 11 483 226 257 Ward No. 3 0003
- - - 6 4 2 260 116 144 Ward No. 4 0004- - - 5 4 1 444 203 241 Ward No. 5 0005- - - 12 10 2 431 155 276 Ward No. 6 0006
9 3 6 25 12 13 351 126 225 Ward No. 7 00074 2 2 4 1 3 445 168 277 Ward No. 8 0008
- - - 4 2 2 403 154 249 Ward No. 9 00092 1 1 2 2 - 465 194 271 Ward No. 10 00101 - 1 29 2 27 422 160 262 Ward No. 11 0011
13 5 8 30 9 21 330 139 191 Ward No. 12 001259 7 52 39 16 23 327 163 164 Ward No. 13 001372 1 71 26 17 9 322 160 162 Ward No. 14 001421 - 21 20 12 8 609 257 352 Ward No. 15 0015
184 22 162 699 488 211 16,807 6,764 10,043 Bhander (NP) 80211128 1 27 23 12 11 1,616 708 908 Ward No. 1 00016 1 5 22 18 4 1,599 610 989 Ward No. 2 0002
84 - 84 130 114 16 1,271 548 723 Ward No. 3 00039 1 8 65 26 39 1,197 541 656 Ward No. 4 0004
- - - 6 3 3 532 210 322 Ward No. 5 0005- - - 17 7 10 1,070 396 674 Ward No. 6 0006
3 1 2 94 90 4 1,439 585 854 Ward No. 7 000711 6 5 24 14 10 1,019 360 659 Ward No. 8 00084 1 3 57 14 43 675 280 395 Ward No. 9 0009
10 2 8 39 24 15 781 325 456 Ward No. 10 00108 - 8 19 8 11 837 377 460 Ward No. 11 00114 - 4 84 49 35 885 309 576 Ward No. 12 00126 5 1 88 86 2 1,459 549 910 Ward No. 13 0013
10 4 6 26 22 4 1,170 481 689 Ward No. 14 00141 - 1 5 1 4 1,257 485 772 Ward No. 15 0015
139

Section – II
Tables based on Households Amenities and Assets
(Rural /Urban) at District and Sub-District level

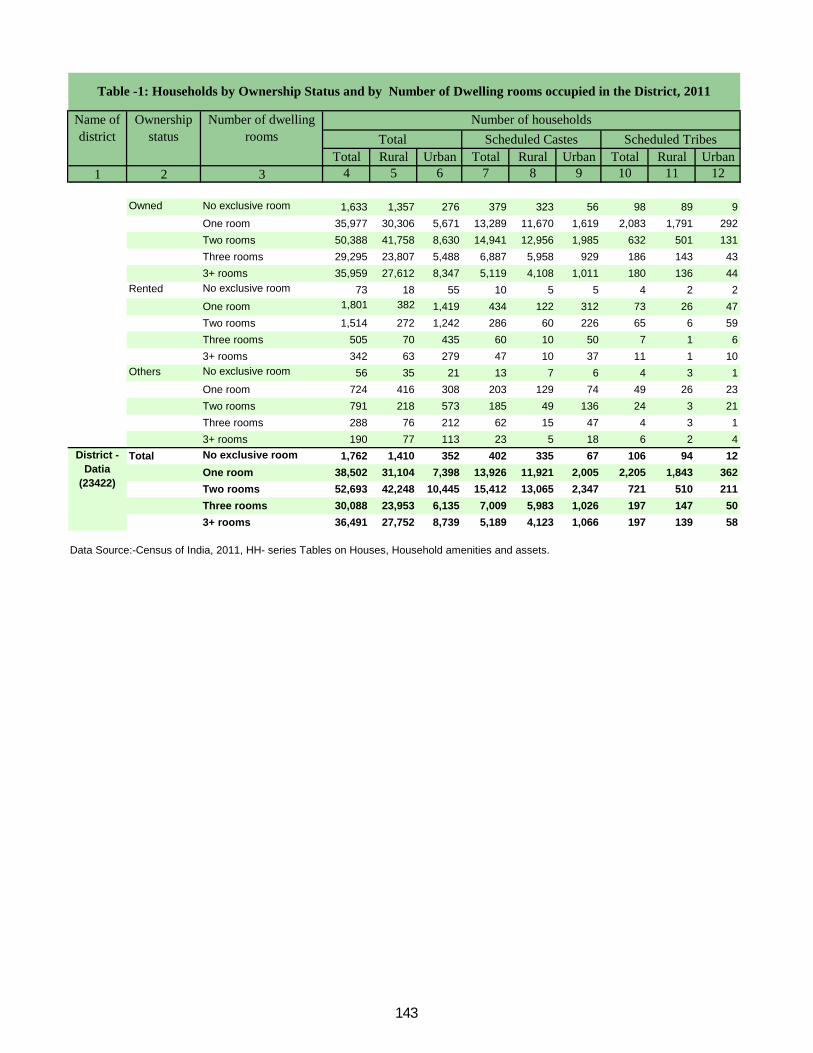
Total Rural Urban Total Rural Urban Total Rural Urban1 2 3 4 5 6 7 8 9 10 11 12
Owned No exclusive room 1,633 1,357 276 379 323 56 98 89 9One room 35,977 30,306 5,671 13,289 11,670 1,619 2,083 1,791 292Two rooms 50,388 41,758 8,630 14,941 12,956 1,985 632 501 131Three rooms 29,295 23,807 5,488 6,887 5,958 929 186 143 433+ rooms 35,959 27,612 8,347 5,119 4,108 1,011 180 136 44
Rented No exclusive room 73 18 55 10 5 5 4 2 2One room 1,801 382 1,419 434 122 312 73 26 47Two rooms 1,514 272 1,242 286 60 226 65 6 59Three rooms 505 70 435 60 10 50 7 1 63+ rooms 342 63 279 47 10 37 11 1 10
Others No exclusive room 56 35 21 13 7 6 4 3 1One room 724 416 308 203 129 74 49 26 23Two rooms 791 218 573 185 49 136 24 3 21Three rooms 288 76 212 62 15 47 4 3 13+ rooms 190 77 113 23 5 18 6 2 4
Total No exclusive room 1,762 1,410 352 402 335 67 106 94 12One room 38,502 31,104 7,398 13,926 11,921 2,005 2,205 1,843 362Two rooms 52,693 42,248 10,445 15,412 13,065 2,347 721 510 211Three rooms 30,088 23,953 6,135 7,009 5,983 1,026 197 147 503+ rooms 36,491 27,752 8,739 5,189 4,123 1,066 197 139 58
Data Source:-Census of India, 2011, HH- series Tables on Houses, Household amenities and assets.
District - Datia
(23422)
Table -1: Households by Ownership Status and by Number of Dwelling rooms occupied in the District, 2011
Name of district
Number of householdsTotal Scheduled Castes Scheduled Tribes
Ownership status
Number of dwelling rooms
143
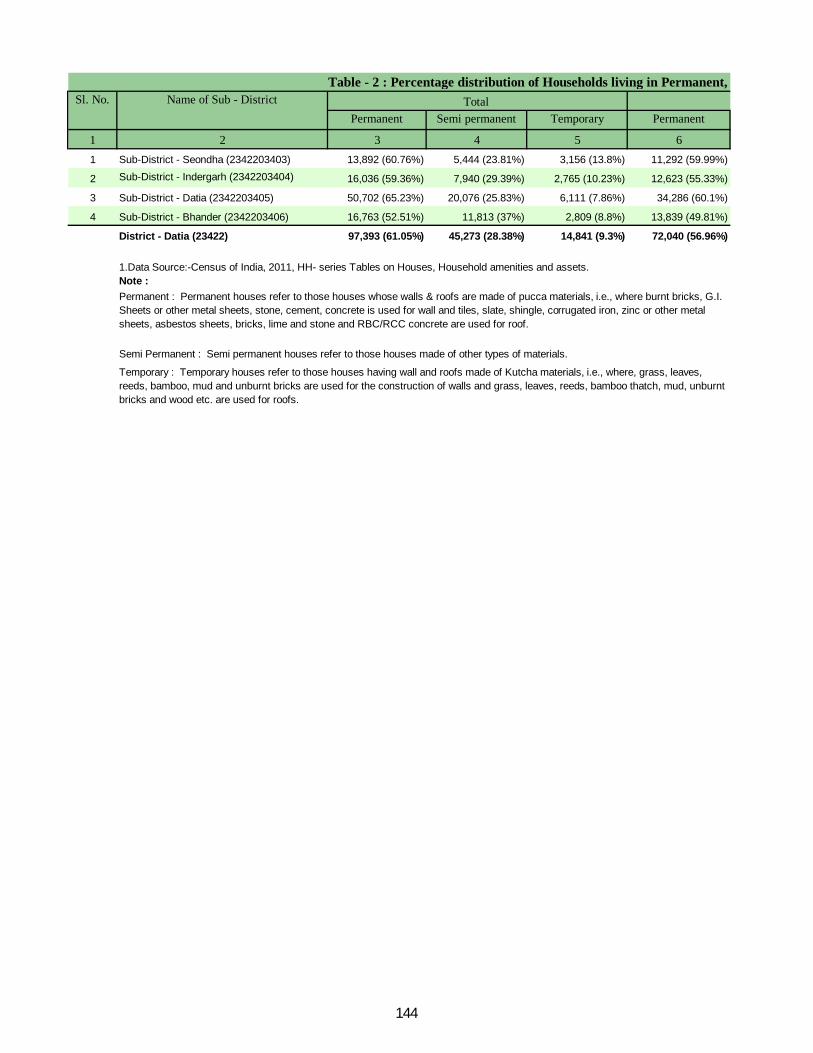
Permanent Semi permanent Temporary Permanent
1 2 3 4 5 61 Sub-District - Seondha (2342203403) 13,892 (60.76%) 5,444 (23.81%) 3,156 (13.8%) 11,292 (59.99%)
2 Sub-District - Indergarh (2342203404) 16,036 (59.36%) 7,940 (29.39%) 2,765 (10.23%) 12,623 (55.33%)
3 Sub-District - Datia (2342203405) 50,702 (65.23%) 20,076 (25.83%) 6,111 (7.86%) 34,286 (60.1%)
4 Sub-District - Bhander (2342203406) 16,763 (52.51%) 11,813 (37%) 2,809 (8.8%) 13,839 (49.81%)
District - Datia (23422) 97,393 (61.05%) 45,273 (28.38%) 14,841 (9.3%) 72,040 (56.96%)
Note : 1.Data Source:-Census of India, 2011, HH- series Tables on Houses, Household amenities and assets.
Permanent : Permanent houses refer to those houses whose walls & roofs are made of pucca materials, i.e., where burnt bricks, G.I. Sheets or other metal sheets, stone, cement, concrete is used for wall and tiles, slate, shingle, corrugated iron, zinc or other metal sheets, asbestos sheets, bricks, lime and stone and RBC/RCC concrete are used for roof.
Semi Permanent : Semi permanent houses refer to those houses made of other types of materials.
Temporary : Temporary houses refer to those houses having wall and roofs made of Kutcha materials, i.e., where, grass, leaves, reeds, bamboo, mud and unburnt bricks are used for the construction of walls and grass, leaves, reeds, bamboo thatch, mud, unburnt bricks and wood etc. are used for roofs.
Table - 2 : Percentage distribution of Households living in Permanent, Sl. No. Name of Sub - District Total
144
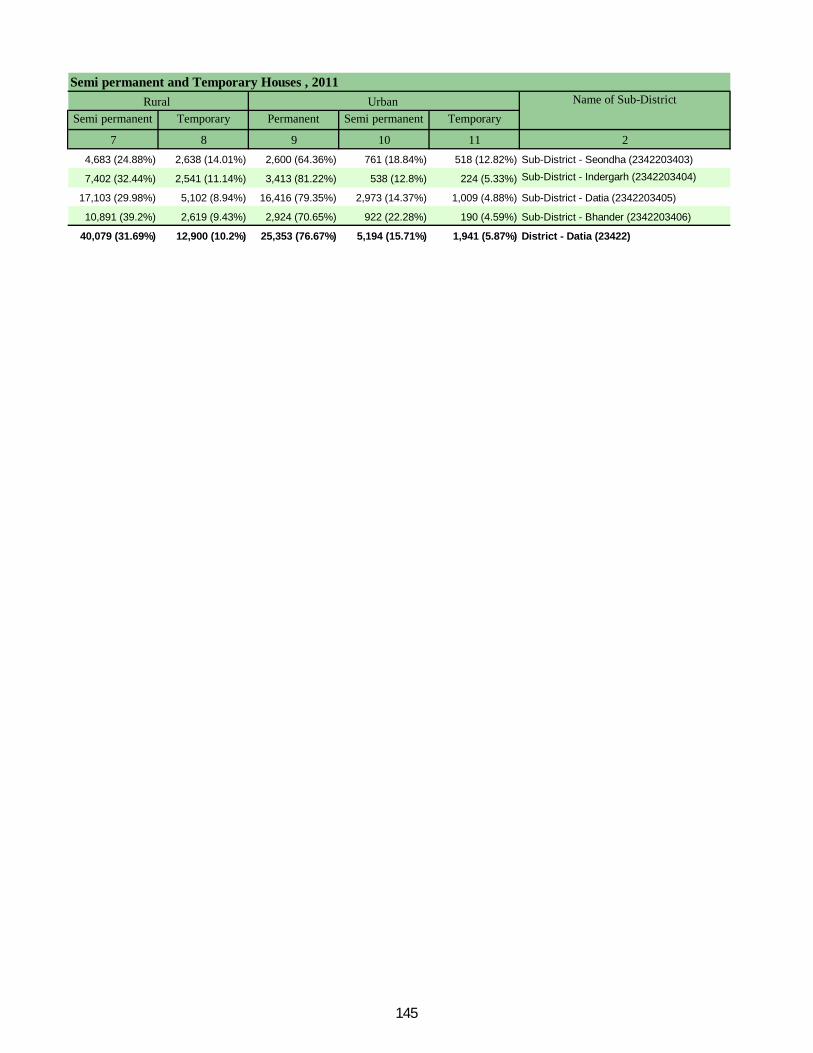
Semi permanent Temporary Permanent Semi permanent Temporary
7 8 9 10 11 24,683 (24.88%) 2,638 (14.01%) 2,600 (64.36%) 761 (18.84%) 518 (12.82%) Sub-District - Seondha (2342203403)
7,402 (32.44%) 2,541 (11.14%) 3,413 (81.22%) 538 (12.8%) 224 (5.33%) Sub-District - Indergarh (2342203404)
17,103 (29.98%) 5,102 (8.94%) 16,416 (79.35%) 2,973 (14.37%) 1,009 (4.88%) Sub-District - Datia (2342203405)
10,891 (39.2%) 2,619 (9.43%) 2,924 (70.65%) 922 (22.28%) 190 (4.59%) Sub-District - Bhander (2342203406)
40,079 (31.69%) 12,900 (10.2%) 25,353 (76.67%) 5,194 (15.71%) 1,941 (5.87%) District - Datia (23422)
Semi permanent and Temporary Houses , 2011Urban Name of Sub-DistrictRural
145
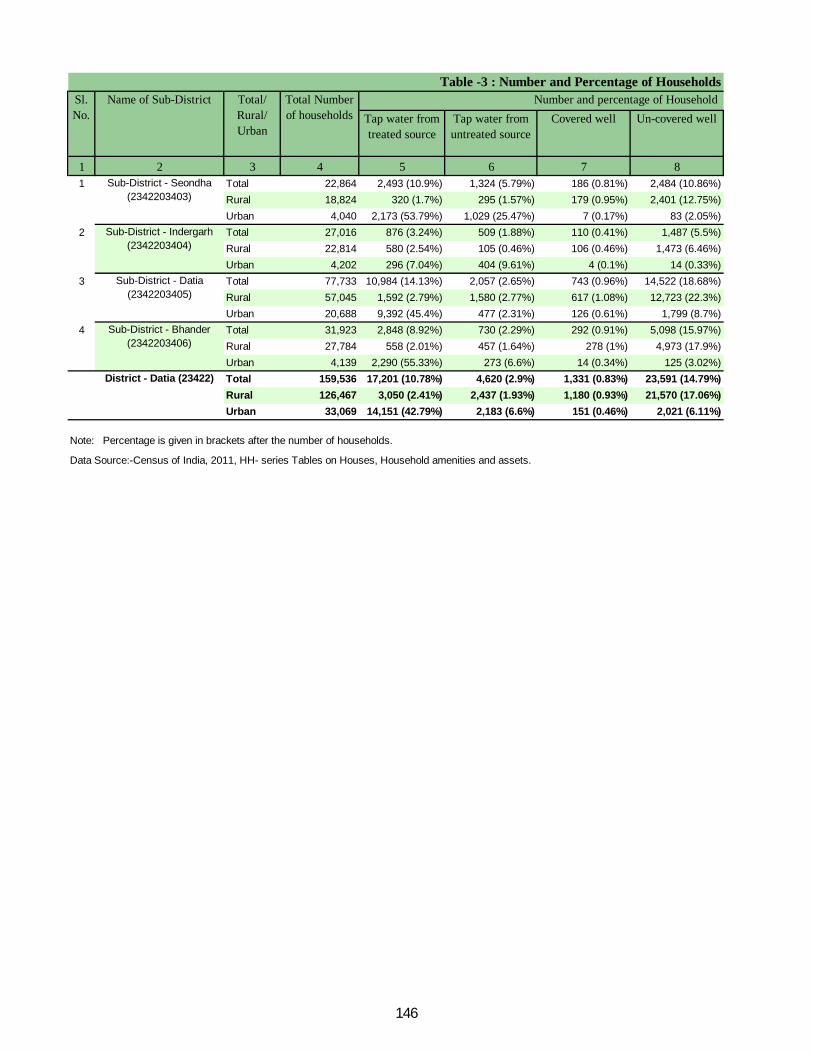
Tap water from treated source
Tap water from untreated source
Covered well Un-covered well
1 2 3 4 5 6 7 81 Total 22,864 2,493 (10.9%) 1,324 (5.79%) 186 (0.81%) 2,484 (10.86%)
Rural 18,824 320 (1.7%) 295 (1.57%) 179 (0.95%) 2,401 (12.75%)Urban 4,040 2,173 (53.79%) 1,029 (25.47%) 7 (0.17%) 83 (2.05%)
2 Total 27,016 876 (3.24%) 509 (1.88%) 110 (0.41%) 1,487 (5.5%)Rural 22,814 580 (2.54%) 105 (0.46%) 106 (0.46%) 1,473 (6.46%)Urban 4,202 296 (7.04%) 404 (9.61%) 4 (0.1%) 14 (0.33%)
3 Total 77,733 10,984 (14.13%) 2,057 (2.65%) 743 (0.96%) 14,522 (18.68%)Rural 57,045 1,592 (2.79%) 1,580 (2.77%) 617 (1.08%) 12,723 (22.3%)Urban 20,688 9,392 (45.4%) 477 (2.31%) 126 (0.61%) 1,799 (8.7%)
4 Total 31,923 2,848 (8.92%) 730 (2.29%) 292 (0.91%) 5,098 (15.97%)Rural 27,784 558 (2.01%) 457 (1.64%) 278 (1%) 4,973 (17.9%)Urban 4,139 2,290 (55.33%) 273 (6.6%) 14 (0.34%) 125 (3.02%)Total 159,536 17,201 (10.78%) 4,620 (2.9%) 1,331 (0.83%) 23,591 (14.79%)Rural 126,467 3,050 (2.41%) 2,437 (1.93%) 1,180 (0.93%) 21,570 (17.06%)Urban 33,069 14,151 (42.79%) 2,183 (6.6%) 151 (0.46%) 2,021 (6.11%)
Data Source:-Census of India, 2011, HH- series Tables on Houses, Household amenities and assets.
Table -3 : Number and Percentage of Households Sl. No.
Name of Sub-District Total/ Rural/ Urban
Total Number of households
Number and percentage of Household
Note: Percentage is given in brackets after the number of households.
Sub-District - Seondha (2342203403)
Sub-District - Indergarh (2342203404)
Sub-District - Datia (2342203405)
Sub-District - Bhander (2342203406)
District - Datia (23422)
146
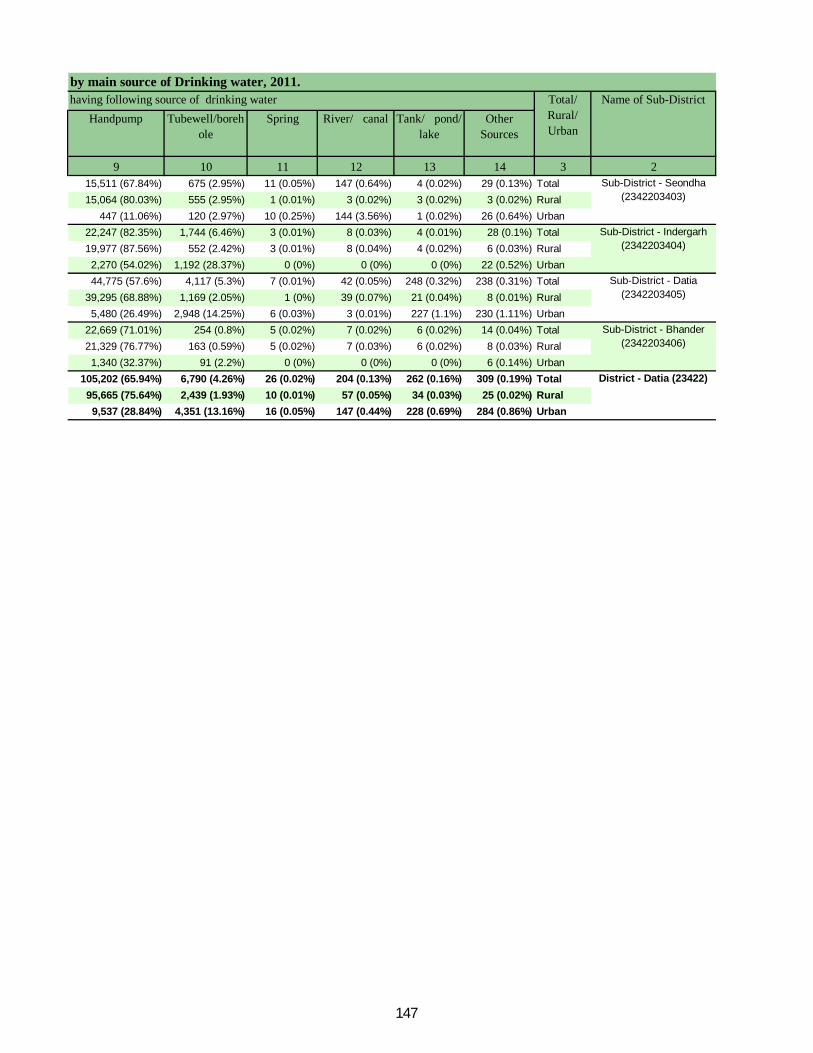
Handpump Tubewell/borehole
Spring River/ canal Tank/ pond/ lake
Other Sources
9 10 11 12 13 14 3 215,511 (67.84%) 675 (2.95%) 11 (0.05%) 147 (0.64%) 4 (0.02%) 29 (0.13%) Total15,064 (80.03%) 555 (2.95%) 1 (0.01%) 3 (0.02%) 3 (0.02%) 3 (0.02%) Rural
447 (11.06%) 120 (2.97%) 10 (0.25%) 144 (3.56%) 1 (0.02%) 26 (0.64%) Urban22,247 (82.35%) 1,744 (6.46%) 3 (0.01%) 8 (0.03%) 4 (0.01%) 28 (0.1%) Total19,977 (87.56%) 552 (2.42%) 3 (0.01%) 8 (0.04%) 4 (0.02%) 6 (0.03%) Rural2,270 (54.02%) 1,192 (28.37%) 0 (0%) 0 (0%) 0 (0%) 22 (0.52%) Urban44,775 (57.6%) 4,117 (5.3%) 7 (0.01%) 42 (0.05%) 248 (0.32%) 238 (0.31%) Total
39,295 (68.88%) 1,169 (2.05%) 1 (0%) 39 (0.07%) 21 (0.04%) 8 (0.01%) Rural5,480 (26.49%) 2,948 (14.25%) 6 (0.03%) 3 (0.01%) 227 (1.1%) 230 (1.11%) Urban
22,669 (71.01%) 254 (0.8%) 5 (0.02%) 7 (0.02%) 6 (0.02%) 14 (0.04%) Total21,329 (76.77%) 163 (0.59%) 5 (0.02%) 7 (0.03%) 6 (0.02%) 8 (0.03%) Rural1,340 (32.37%) 91 (2.2%) 0 (0%) 0 (0%) 0 (0%) 6 (0.14%) Urban
105,202 (65.94%) 6,790 (4.26%) 26 (0.02%) 204 (0.13%) 262 (0.16%) 309 (0.19%) Total95,665 (75.64%) 2,439 (1.93%) 10 (0.01%) 57 (0.05%) 34 (0.03%) 25 (0.02%) Rural9,537 (28.84%) 4,351 (13.16%) 16 (0.05%) 147 (0.44%) 228 (0.69%) 284 (0.86%) Urban
by main source of Drinking water, 2011.Name of Sub-Districthaving following source of drinking water Total/
Rural/ Urban
Sub-District - Seondha (2342203403)
Sub-District - Indergarh (2342203404)
Sub-District - Datia (2342203405)
Sub-District - Bhander (2342203406)
District - Datia (23422)
147
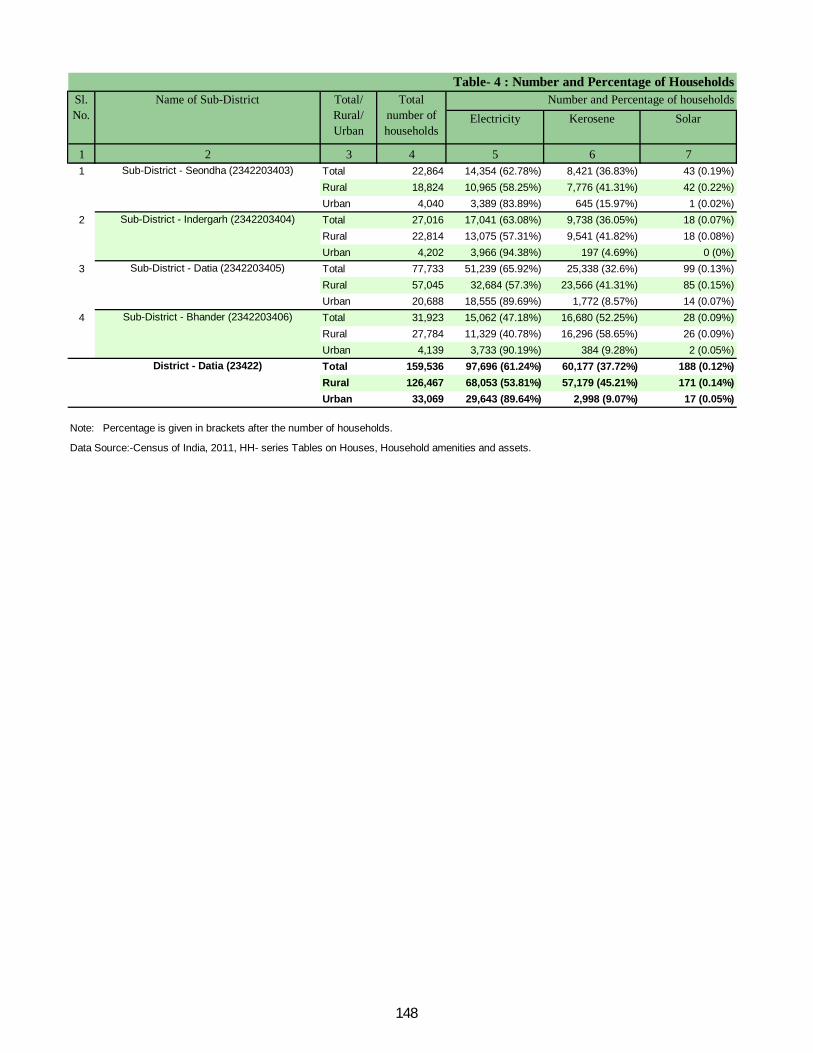
Electricity Kerosene Solar
1 2 3 4 5 6 71 Total 22,864 14,354 (62.78%) 8,421 (36.83%) 43 (0.19%)
Rural 18,824 10,965 (58.25%) 7,776 (41.31%) 42 (0.22%)Urban 4,040 3,389 (83.89%) 645 (15.97%) 1 (0.02%)
2 Total 27,016 17,041 (63.08%) 9,738 (36.05%) 18 (0.07%)Rural 22,814 13,075 (57.31%) 9,541 (41.82%) 18 (0.08%)Urban 4,202 3,966 (94.38%) 197 (4.69%) 0 (0%)
3 Total 77,733 51,239 (65.92%) 25,338 (32.6%) 99 (0.13%)Rural 57,045 32,684 (57.3%) 23,566 (41.31%) 85 (0.15%)Urban 20,688 18,555 (89.69%) 1,772 (8.57%) 14 (0.07%)
4 Total 31,923 15,062 (47.18%) 16,680 (52.25%) 28 (0.09%)Rural 27,784 11,329 (40.78%) 16,296 (58.65%) 26 (0.09%)Urban 4,139 3,733 (90.19%) 384 (9.28%) 2 (0.05%)Total 159,536 97,696 (61.24%) 60,177 (37.72%) 188 (0.12%)Rural 126,467 68,053 (53.81%) 57,179 (45.21%) 171 (0.14%)Urban 33,069 29,643 (89.64%) 2,998 (9.07%) 17 (0.05%)
Data Source:-Census of India, 2011, HH- series Tables on Houses, Household amenities and assets.
Table- 4 : Number and Percentage of Households Sl. No.
Name of Sub-District Total/ Rural/ Urban
Total number of households
Number and Percentage of households
Note: Percentage is given in brackets after the number of households.
Sub-District - Seondha (2342203403)
Sub-District - Indergarh (2342203404)
Sub-District - Datia (2342203405)
Sub-District - Bhander (2342203406)
District - Datia (23422)
148
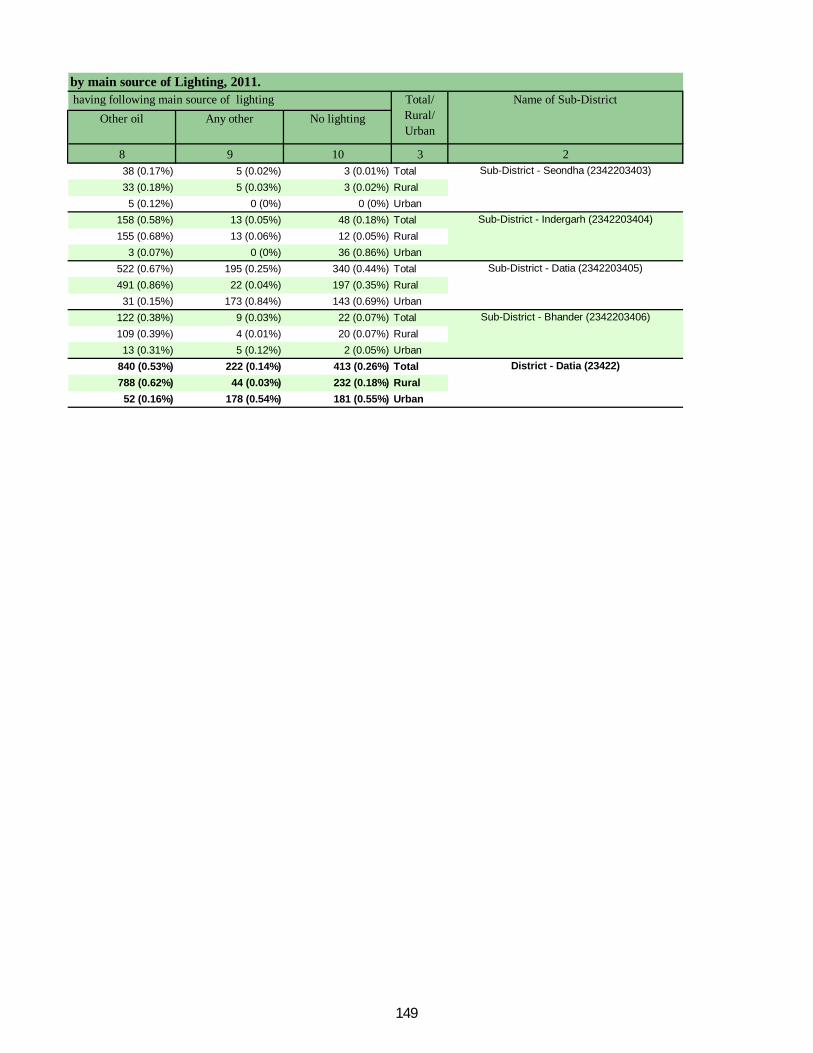
Other oil Any other No lighting
8 9 10 3 238 (0.17%) 5 (0.02%) 3 (0.01%) Total33 (0.18%) 5 (0.03%) 3 (0.02%) Rural5 (0.12%) 0 (0%) 0 (0%) Urban
158 (0.58%) 13 (0.05%) 48 (0.18%) Total155 (0.68%) 13 (0.06%) 12 (0.05%) Rural
3 (0.07%) 0 (0%) 36 (0.86%) Urban522 (0.67%) 195 (0.25%) 340 (0.44%) Total491 (0.86%) 22 (0.04%) 197 (0.35%) Rural31 (0.15%) 173 (0.84%) 143 (0.69%) Urban
122 (0.38%) 9 (0.03%) 22 (0.07%) Total109 (0.39%) 4 (0.01%) 20 (0.07%) Rural13 (0.31%) 5 (0.12%) 2 (0.05%) Urban
840 (0.53%) 222 (0.14%) 413 (0.26%) Total788 (0.62%) 44 (0.03%) 232 (0.18%) Rural52 (0.16%) 178 (0.54%) 181 (0.55%) Urban
Name of Sub-Districtby main source of Lighting, 2011. having following main source of lighting Total/
Rural/ Urban
Sub-District - Seondha (2342203403)
Sub-District - Indergarh (2342203404)
Sub-District - Datia (2342203405)
Sub-District - Bhander (2342203406)
District - Datia (23422)
149
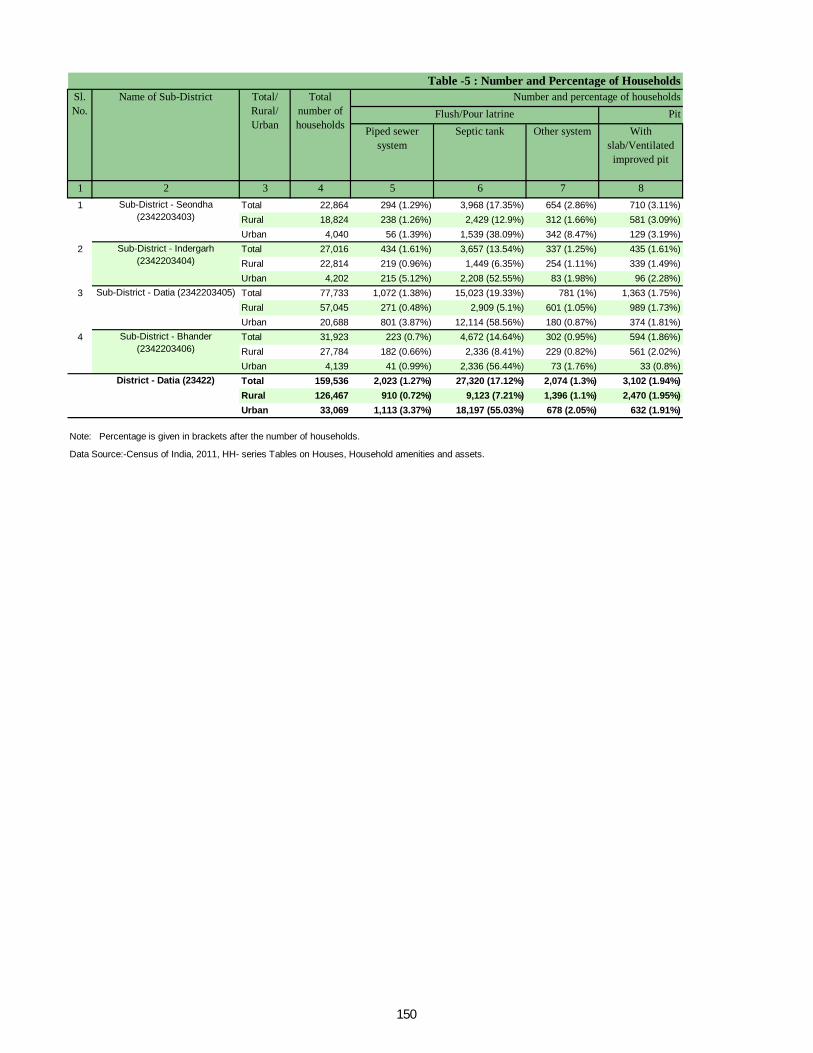
Pit Piped sewer
systemSeptic tank Other system With
slab/Ventilated improved pit
1 2 3 4 5 6 7 81 Total 22,864 294 (1.29%) 3,968 (17.35%) 654 (2.86%) 710 (3.11%)
Rural 18,824 238 (1.26%) 2,429 (12.9%) 312 (1.66%) 581 (3.09%)Urban 4,040 56 (1.39%) 1,539 (38.09%) 342 (8.47%) 129 (3.19%)
2 Total 27,016 434 (1.61%) 3,657 (13.54%) 337 (1.25%) 435 (1.61%)Rural 22,814 219 (0.96%) 1,449 (6.35%) 254 (1.11%) 339 (1.49%)Urban 4,202 215 (5.12%) 2,208 (52.55%) 83 (1.98%) 96 (2.28%)
3 Total 77,733 1,072 (1.38%) 15,023 (19.33%) 781 (1%) 1,363 (1.75%)Rural 57,045 271 (0.48%) 2,909 (5.1%) 601 (1.05%) 989 (1.73%)Urban 20,688 801 (3.87%) 12,114 (58.56%) 180 (0.87%) 374 (1.81%)
4 Total 31,923 223 (0.7%) 4,672 (14.64%) 302 (0.95%) 594 (1.86%)Rural 27,784 182 (0.66%) 2,336 (8.41%) 229 (0.82%) 561 (2.02%)Urban 4,139 41 (0.99%) 2,336 (56.44%) 73 (1.76%) 33 (0.8%)Total 159,536 2,023 (1.27%) 27,320 (17.12%) 2,074 (1.3%) 3,102 (1.94%)Rural 126,467 910 (0.72%) 9,123 (7.21%) 1,396 (1.1%) 2,470 (1.95%)Urban 33,069 1,113 (3.37%) 18,197 (55.03%) 678 (2.05%) 632 (1.91%)
Data Source:-Census of India, 2011, HH- series Tables on Houses, Household amenities and assets.
Note: Percentage is given in brackets after the number of households.
Sub-District - Seondha (2342203403)
Sub-District - Indergarh (2342203404)
Sub-District - Datia (2342203405)
Sub-District - Bhander (2342203406)
District - Datia (23422)
Table -5 : Number and Percentage of Households Sl. No.
Name of Sub-District Total/ Rural/ Urban
Total number of households
Flush/Pour latrine Number and percentage of households
150
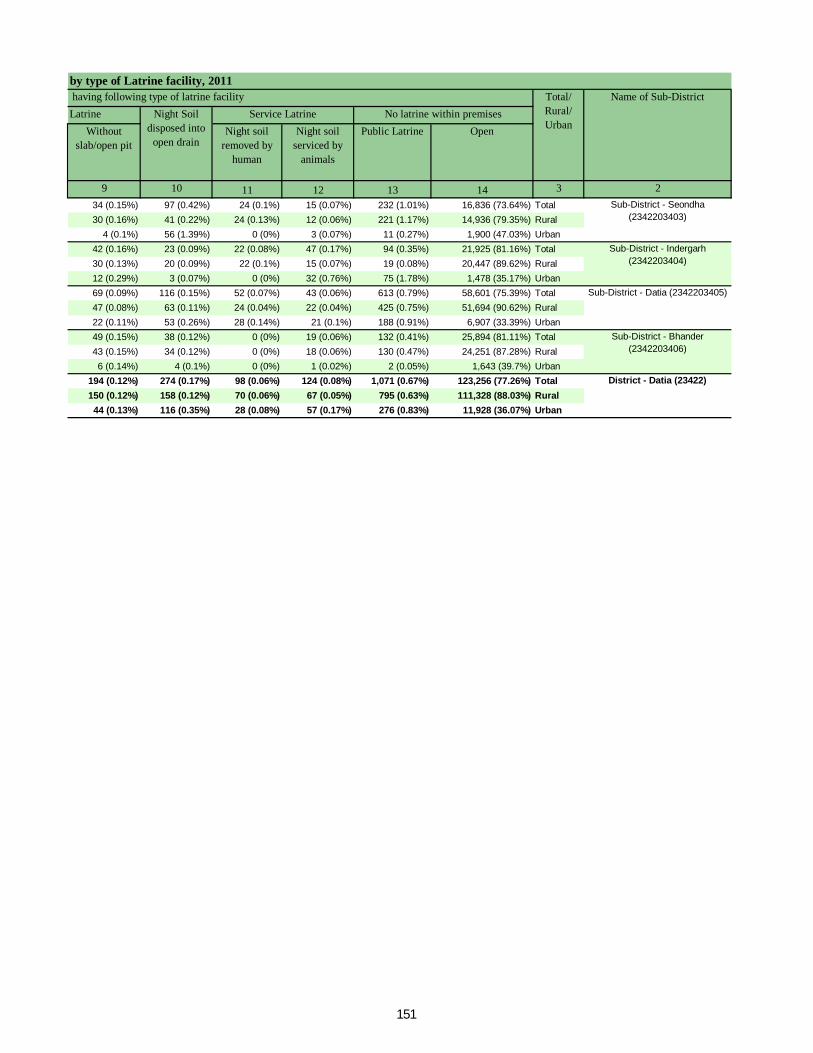
LatrineWithout
slab/open pitNight soil
removed by human
Night soil serviced by
animals
Public Latrine Open
9 10 11 12 13 14 3 234 (0.15%) 97 (0.42%) 24 (0.1%) 15 (0.07%) 232 (1.01%) 16,836 (73.64%) Total30 (0.16%) 41 (0.22%) 24 (0.13%) 12 (0.06%) 221 (1.17%) 14,936 (79.35%) Rural
4 (0.1%) 56 (1.39%) 0 (0%) 3 (0.07%) 11 (0.27%) 1,900 (47.03%) Urban42 (0.16%) 23 (0.09%) 22 (0.08%) 47 (0.17%) 94 (0.35%) 21,925 (81.16%) Total30 (0.13%) 20 (0.09%) 22 (0.1%) 15 (0.07%) 19 (0.08%) 20,447 (89.62%) Rural12 (0.29%) 3 (0.07%) 0 (0%) 32 (0.76%) 75 (1.78%) 1,478 (35.17%) Urban69 (0.09%) 116 (0.15%) 52 (0.07%) 43 (0.06%) 613 (0.79%) 58,601 (75.39%) Total47 (0.08%) 63 (0.11%) 24 (0.04%) 22 (0.04%) 425 (0.75%) 51,694 (90.62%) Rural22 (0.11%) 53 (0.26%) 28 (0.14%) 21 (0.1%) 188 (0.91%) 6,907 (33.39%) Urban49 (0.15%) 38 (0.12%) 0 (0%) 19 (0.06%) 132 (0.41%) 25,894 (81.11%) Total43 (0.15%) 34 (0.12%) 0 (0%) 18 (0.06%) 130 (0.47%) 24,251 (87.28%) Rural6 (0.14%) 4 (0.1%) 0 (0%) 1 (0.02%) 2 (0.05%) 1,643 (39.7%) Urban
194 (0.12%) 274 (0.17%) 98 (0.06%) 124 (0.08%) 1,071 (0.67%) 123,256 (77.26%) Total150 (0.12%) 158 (0.12%) 70 (0.06%) 67 (0.05%) 795 (0.63%) 111,328 (88.03%) Rural44 (0.13%) 116 (0.35%) 28 (0.08%) 57 (0.17%) 276 (0.83%) 11,928 (36.07%) Urban
Sub-District - Seondha (2342203403)
Sub-District - Indergarh (2342203404)
Sub-District - Datia (2342203405)
Sub-District - Bhander (2342203406)
District - Datia (23422)
by type of Latrine facility, 2011Name of Sub-District
No latrine within premisesNight Soil disposed into
open drain
Service Latrine having following type of latrine facility Total/
Rural/ Urban
151
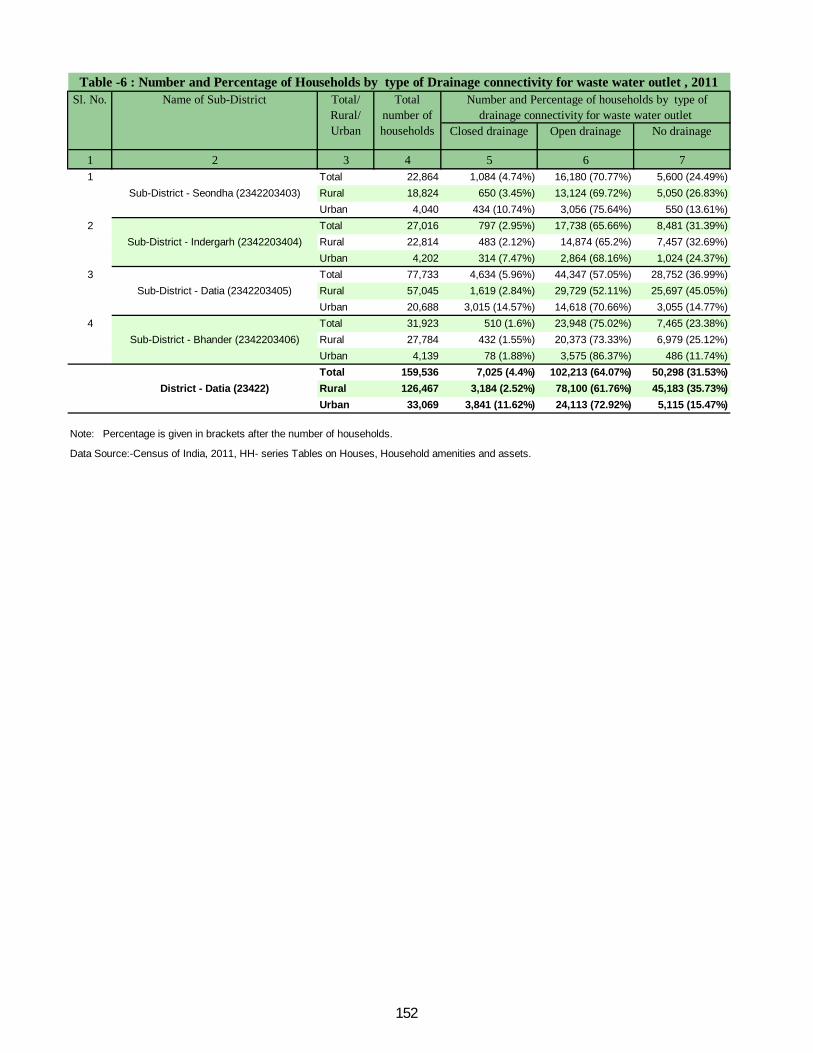
Closed drainage Open drainage No drainage
1 2 3 4 5 6 71 Total 22,864 1,084 (4.74%) 16,180 (70.77%) 5,600 (24.49%)
Rural 18,824 650 (3.45%) 13,124 (69.72%) 5,050 (26.83%)Urban 4,040 434 (10.74%) 3,056 (75.64%) 550 (13.61%)
2 Total 27,016 797 (2.95%) 17,738 (65.66%) 8,481 (31.39%)Rural 22,814 483 (2.12%) 14,874 (65.2%) 7,457 (32.69%)Urban 4,202 314 (7.47%) 2,864 (68.16%) 1,024 (24.37%)
3 Total 77,733 4,634 (5.96%) 44,347 (57.05%) 28,752 (36.99%)Rural 57,045 1,619 (2.84%) 29,729 (52.11%) 25,697 (45.05%)Urban 20,688 3,015 (14.57%) 14,618 (70.66%) 3,055 (14.77%)
4 Total 31,923 510 (1.6%) 23,948 (75.02%) 7,465 (23.38%)Rural 27,784 432 (1.55%) 20,373 (73.33%) 6,979 (25.12%)Urban 4,139 78 (1.88%) 3,575 (86.37%) 486 (11.74%)Total 159,536 7,025 (4.4%) 102,213 (64.07%) 50,298 (31.53%)Rural 126,467 3,184 (2.52%) 78,100 (61.76%) 45,183 (35.73%)Urban 33,069 3,841 (11.62%) 24,113 (72.92%) 5,115 (15.47%)
Data Source:-Census of India, 2011, HH- series Tables on Houses, Household amenities and assets.
Table -6 : Number and Percentage of Households by type of Drainage connectivity for waste water outlet , 2011 Sl. No. Name of Sub-District Total/
Rural/ Urban
Total number of households
Number and Percentage of households by type of drainage connectivity for waste water outlet
Note: Percentage is given in brackets after the number of households.
Sub-District - Seondha (2342203403)
Sub-District - Indergarh (2342203404)
Sub-District - Datia (2342203405)
Sub-District - Bhander (2342203406)
District - Datia (23422)
152
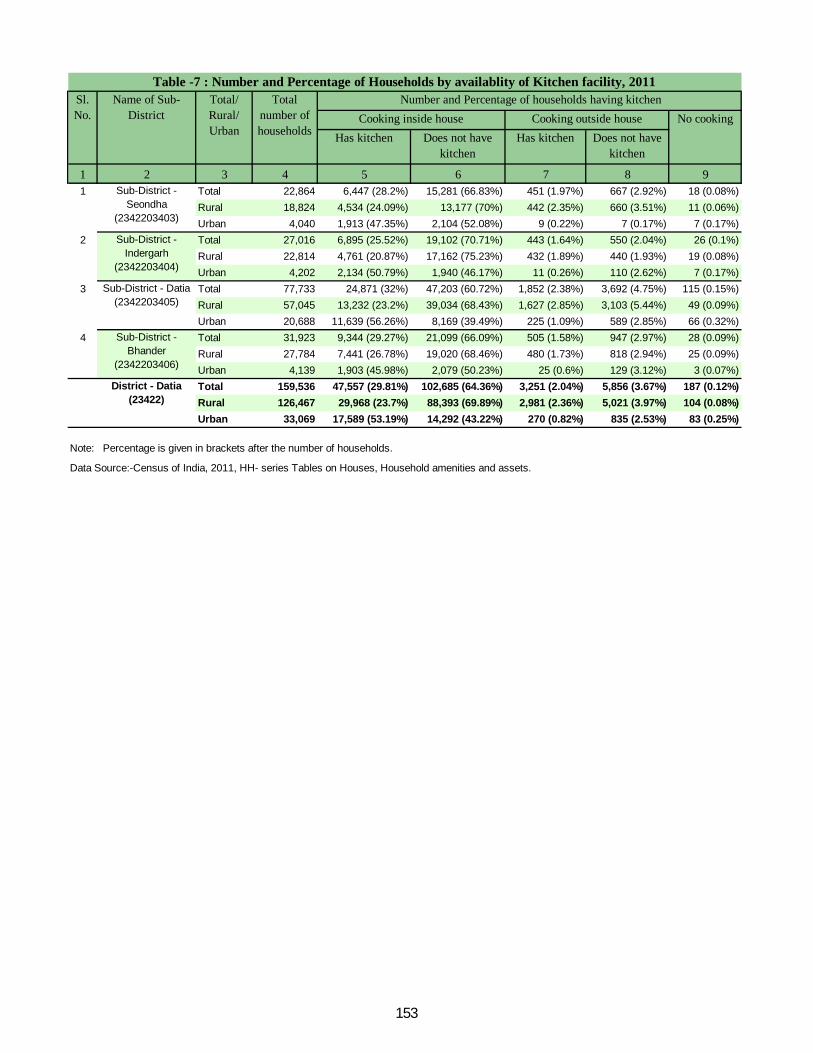
Has kitchen Does not have kitchen
Has kitchen Does not have kitchen
1 2 3 4 5 6 7 8 91 Total 22,864 6,447 (28.2%) 15,281 (66.83%) 451 (1.97%) 667 (2.92%) 18 (0.08%)
Rural 18,824 4,534 (24.09%) 13,177 (70%) 442 (2.35%) 660 (3.51%) 11 (0.06%)Urban 4,040 1,913 (47.35%) 2,104 (52.08%) 9 (0.22%) 7 (0.17%) 7 (0.17%)
2 Total 27,016 6,895 (25.52%) 19,102 (70.71%) 443 (1.64%) 550 (2.04%) 26 (0.1%)Rural 22,814 4,761 (20.87%) 17,162 (75.23%) 432 (1.89%) 440 (1.93%) 19 (0.08%)Urban 4,202 2,134 (50.79%) 1,940 (46.17%) 11 (0.26%) 110 (2.62%) 7 (0.17%)
3 Total 77,733 24,871 (32%) 47,203 (60.72%) 1,852 (2.38%) 3,692 (4.75%) 115 (0.15%)Rural 57,045 13,232 (23.2%) 39,034 (68.43%) 1,627 (2.85%) 3,103 (5.44%) 49 (0.09%)Urban 20,688 11,639 (56.26%) 8,169 (39.49%) 225 (1.09%) 589 (2.85%) 66 (0.32%)
4 Total 31,923 9,344 (29.27%) 21,099 (66.09%) 505 (1.58%) 947 (2.97%) 28 (0.09%)Rural 27,784 7,441 (26.78%) 19,020 (68.46%) 480 (1.73%) 818 (2.94%) 25 (0.09%)Urban 4,139 1,903 (45.98%) 2,079 (50.23%) 25 (0.6%) 129 (3.12%) 3 (0.07%)Total 159,536 47,557 (29.81%) 102,685 (64.36%) 3,251 (2.04%) 5,856 (3.67%) 187 (0.12%)Rural 126,467 29,968 (23.7%) 88,393 (69.89%) 2,981 (2.36%) 5,021 (3.97%) 104 (0.08%)Urban 33,069 17,589 (53.19%) 14,292 (43.22%) 270 (0.82%) 835 (2.53%) 83 (0.25%)
Data Source:-Census of India, 2011, HH- series Tables on Houses, Household amenities and assets.
Table -7 : Number and Percentage of Households by availablity of Kitchen facility, 2011Sl. No.
Name of Sub-District
Total/ Rural/ Urban
Total number of households
Number and Percentage of households having kitchenCooking inside house Cooking outside house No cooking
Note: Percentage is given in brackets after the number of households.
Sub-District - Seondha
(2342203403)
Sub-District - Indergarh
(2342203404)
Sub-District - Datia (2342203405)
Sub-District - Bhander
(2342203406)
District - Datia (23422)
153
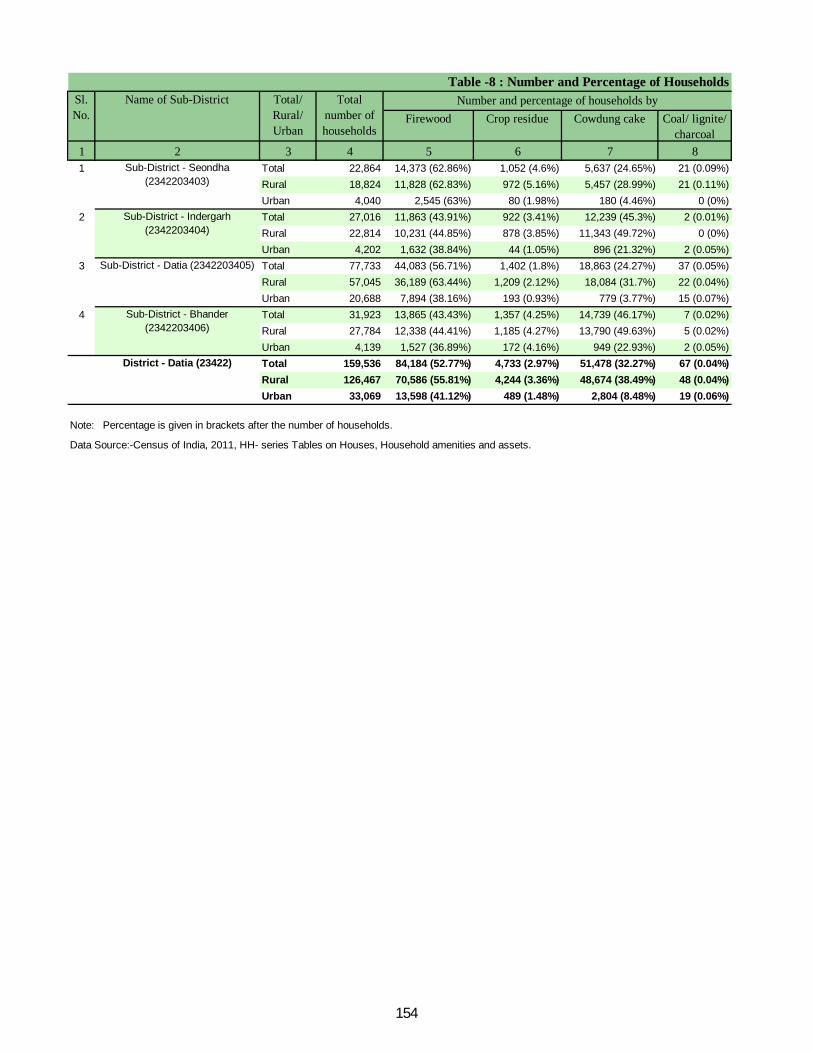
Firewood Crop residue Cowdung cake Coal/ lignite/ charcoal
1 2 3 4 5 6 7 81 Total 22,864 14,373 (62.86%) 1,052 (4.6%) 5,637 (24.65%) 21 (0.09%)
Rural 18,824 11,828 (62.83%) 972 (5.16%) 5,457 (28.99%) 21 (0.11%)Urban 4,040 2,545 (63%) 80 (1.98%) 180 (4.46%) 0 (0%)
2 Total 27,016 11,863 (43.91%) 922 (3.41%) 12,239 (45.3%) 2 (0.01%)Rural 22,814 10,231 (44.85%) 878 (3.85%) 11,343 (49.72%) 0 (0%)Urban 4,202 1,632 (38.84%) 44 (1.05%) 896 (21.32%) 2 (0.05%)
3 Total 77,733 44,083 (56.71%) 1,402 (1.8%) 18,863 (24.27%) 37 (0.05%)Rural 57,045 36,189 (63.44%) 1,209 (2.12%) 18,084 (31.7%) 22 (0.04%)Urban 20,688 7,894 (38.16%) 193 (0.93%) 779 (3.77%) 15 (0.07%)
4 Total 31,923 13,865 (43.43%) 1,357 (4.25%) 14,739 (46.17%) 7 (0.02%)Rural 27,784 12,338 (44.41%) 1,185 (4.27%) 13,790 (49.63%) 5 (0.02%)Urban 4,139 1,527 (36.89%) 172 (4.16%) 949 (22.93%) 2 (0.05%)Total 159,536 84,184 (52.77%) 4,733 (2.97%) 51,478 (32.27%) 67 (0.04%)Rural 126,467 70,586 (55.81%) 4,244 (3.36%) 48,674 (38.49%) 48 (0.04%)Urban 33,069 13,598 (41.12%) 489 (1.48%) 2,804 (8.48%) 19 (0.06%)
Data Source:-Census of India, 2011, HH- series Tables on Houses, Household amenities and assets.
Number and percentage of households bySl. No.
Name of Sub-District Total/ Rural/ Urban
Total number of households
Table -8 : Number and Percentage of Households
Note: Percentage is given in brackets after the number of households.
Sub-District - Seondha (2342203403)
Sub-District - Indergarh (2342203404)
Sub-District - Datia (2342203405)
Sub-District - Bhander (2342203406)
District - Datia (23422)
154
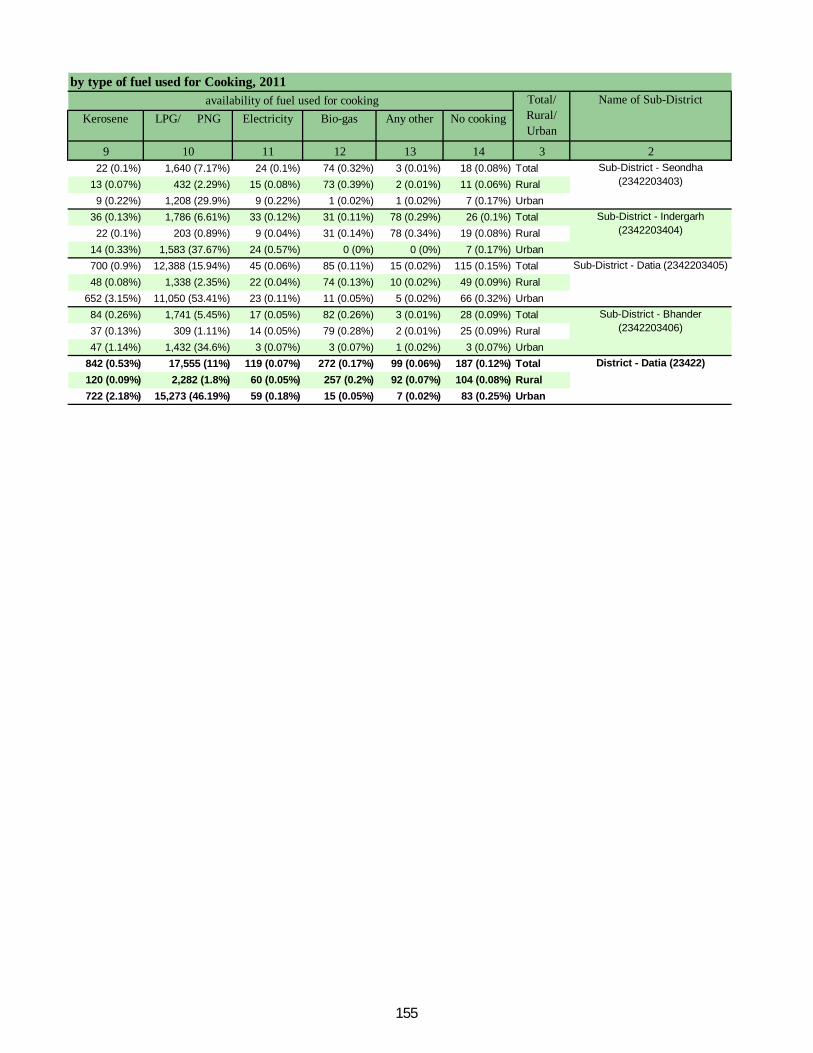
Kerosene LPG/ PNG Electricity Bio-gas Any other No cooking
9 10 11 12 13 14 3 222 (0.1%) 1,640 (7.17%) 24 (0.1%) 74 (0.32%) 3 (0.01%) 18 (0.08%) Total
13 (0.07%) 432 (2.29%) 15 (0.08%) 73 (0.39%) 2 (0.01%) 11 (0.06%) Rural9 (0.22%) 1,208 (29.9%) 9 (0.22%) 1 (0.02%) 1 (0.02%) 7 (0.17%) Urban
36 (0.13%) 1,786 (6.61%) 33 (0.12%) 31 (0.11%) 78 (0.29%) 26 (0.1%) Total22 (0.1%) 203 (0.89%) 9 (0.04%) 31 (0.14%) 78 (0.34%) 19 (0.08%) Rural
14 (0.33%) 1,583 (37.67%) 24 (0.57%) 0 (0%) 0 (0%) 7 (0.17%) Urban700 (0.9%) 12,388 (15.94%) 45 (0.06%) 85 (0.11%) 15 (0.02%) 115 (0.15%) Total48 (0.08%) 1,338 (2.35%) 22 (0.04%) 74 (0.13%) 10 (0.02%) 49 (0.09%) Rural
652 (3.15%) 11,050 (53.41%) 23 (0.11%) 11 (0.05%) 5 (0.02%) 66 (0.32%) Urban84 (0.26%) 1,741 (5.45%) 17 (0.05%) 82 (0.26%) 3 (0.01%) 28 (0.09%) Total37 (0.13%) 309 (1.11%) 14 (0.05%) 79 (0.28%) 2 (0.01%) 25 (0.09%) Rural47 (1.14%) 1,432 (34.6%) 3 (0.07%) 3 (0.07%) 1 (0.02%) 3 (0.07%) Urban
842 (0.53%) 17,555 (11%) 119 (0.07%) 272 (0.17%) 99 (0.06%) 187 (0.12%) Total120 (0.09%) 2,282 (1.8%) 60 (0.05%) 257 (0.2%) 92 (0.07%) 104 (0.08%) Rural722 (2.18%) 15,273 (46.19%) 59 (0.18%) 15 (0.05%) 7 (0.02%) 83 (0.25%) Urban
by type of fuel used for Cooking, 2011 availability of fuel used for cooking Name of Sub-DistrictTotal/
Rural/ Urban
Sub-District - Seondha (2342203403)
Sub-District - Indergarh (2342203404)
Sub-District - Datia (2342203405)
Sub-District - Bhander (2342203406)
District - Datia (23422)
155
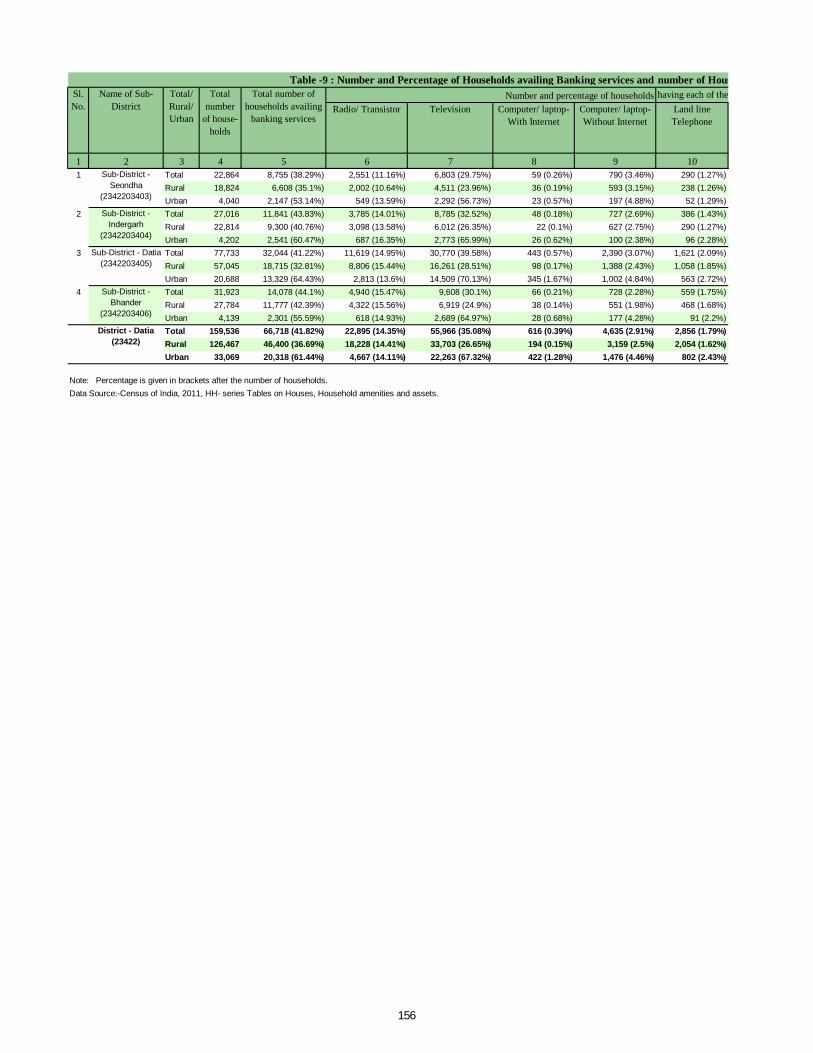
Radio/ Transistor Television Computer/ laptop- With Internet
Computer/ laptop- Without Internet
Land line Telephone
1 2 3 4 5 6 7 8 9 101 Total 22,864 8,755 (38.29%) 2,551 (11.16%) 6,803 (29.75%) 59 (0.26%) 790 (3.46%) 290 (1.27%)
Rural 18,824 6,608 (35.1%) 2,002 (10.64%) 4,511 (23.96%) 36 (0.19%) 593 (3.15%) 238 (1.26%)Urban 4,040 2,147 (53.14%) 549 (13.59%) 2,292 (56.73%) 23 (0.57%) 197 (4.88%) 52 (1.29%)
2 Total 27,016 11,841 (43.83%) 3,785 (14.01%) 8,785 (32.52%) 48 (0.18%) 727 (2.69%) 386 (1.43%)Rural 22,814 9,300 (40.76%) 3,098 (13.58%) 6,012 (26.35%) 22 (0.1%) 627 (2.75%) 290 (1.27%)Urban 4,202 2,541 (60.47%) 687 (16.35%) 2,773 (65.99%) 26 (0.62%) 100 (2.38%) 96 (2.28%)
3 Total 77,733 32,044 (41.22%) 11,619 (14.95%) 30,770 (39.58%) 443 (0.57%) 2,390 (3.07%) 1,621 (2.09%)Rural 57,045 18,715 (32.81%) 8,806 (15.44%) 16,261 (28.51%) 98 (0.17%) 1,388 (2.43%) 1,058 (1.85%)Urban 20,688 13,329 (64.43%) 2,813 (13.6%) 14,509 (70.13%) 345 (1.67%) 1,002 (4.84%) 563 (2.72%)
4 Total 31,923 14,078 (44.1%) 4,940 (15.47%) 9,608 (30.1%) 66 (0.21%) 728 (2.28%) 559 (1.75%)Rural 27,784 11,777 (42.39%) 4,322 (15.56%) 6,919 (24.9%) 38 (0.14%) 551 (1.98%) 468 (1.68%)Urban 4,139 2,301 (55.59%) 618 (14.93%) 2,689 (64.97%) 28 (0.68%) 177 (4.28%) 91 (2.2%)Total 159,536 66,718 (41.82%) 22,895 (14.35%) 55,966 (35.08%) 616 (0.39%) 4,635 (2.91%) 2,856 (1.79%)Rural 126,467 46,400 (36.69%) 18,228 (14.41%) 33,703 (26.65%) 194 (0.15%) 3,159 (2.5%) 2,054 (1.62%)Urban 33,069 20,318 (61.44%) 4,667 (14.11%) 22,263 (67.32%) 422 (1.28%) 1,476 (4.46%) 802 (2.43%)
Table -9 : Number and Percentage of Households availing Banking services and number of Households having each of the specified assets in, 2011 Total
number of house-
holds
Total number of households availing
banking services
Number and percentage of households having each of the following specified assetsSl. No.
Name of Sub-District
Total/ Rural/ Urban
Data Source:-Census of India, 2011, HH- series Tables on Houses, Household amenities and assets.Note: Percentage is given in brackets after the number of households.
Sub-District - Seondha
(2342203403)
Sub-District - Indergarh
(2342203404)
Sub-District - Datia (2342203405)
Sub-District - Bhander
(2342203406)
District - Datia (23422)
156
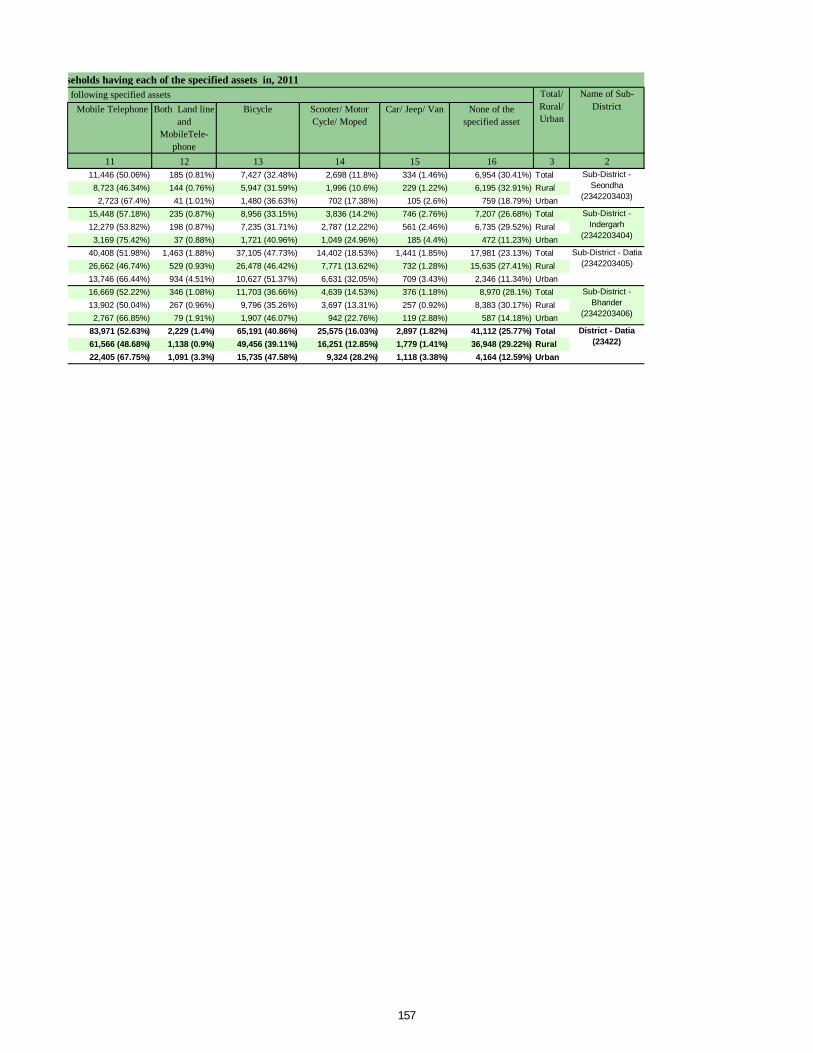
Mobile Telephone Both Land line and
MobileTele-phone
Bicycle Scooter/ Motor Cycle/ Moped
Car/ Jeep/ Van None of the specified asset
11 12 13 14 15 16 3 211,446 (50.06%) 185 (0.81%) 7,427 (32.48%) 2,698 (11.8%) 334 (1.46%) 6,954 (30.41%) Total8,723 (46.34%) 144 (0.76%) 5,947 (31.59%) 1,996 (10.6%) 229 (1.22%) 6,195 (32.91%) Rural2,723 (67.4%) 41 (1.01%) 1,480 (36.63%) 702 (17.38%) 105 (2.6%) 759 (18.79%) Urban
15,448 (57.18%) 235 (0.87%) 8,956 (33.15%) 3,836 (14.2%) 746 (2.76%) 7,207 (26.68%) Total12,279 (53.82%) 198 (0.87%) 7,235 (31.71%) 2,787 (12.22%) 561 (2.46%) 6,735 (29.52%) Rural3,169 (75.42%) 37 (0.88%) 1,721 (40.96%) 1,049 (24.96%) 185 (4.4%) 472 (11.23%) Urban
40,408 (51.98%) 1,463 (1.88%) 37,105 (47.73%) 14,402 (18.53%) 1,441 (1.85%) 17,981 (23.13%) Total26,662 (46.74%) 529 (0.93%) 26,478 (46.42%) 7,771 (13.62%) 732 (1.28%) 15,635 (27.41%) Rural13,746 (66.44%) 934 (4.51%) 10,627 (51.37%) 6,631 (32.05%) 709 (3.43%) 2,346 (11.34%) Urban16,669 (52.22%) 346 (1.08%) 11,703 (36.66%) 4,639 (14.53%) 376 (1.18%) 8,970 (28.1%) Total13,902 (50.04%) 267 (0.96%) 9,796 (35.26%) 3,697 (13.31%) 257 (0.92%) 8,383 (30.17%) Rural2,767 (66.85%) 79 (1.91%) 1,907 (46.07%) 942 (22.76%) 119 (2.88%) 587 (14.18%) Urban
83,971 (52.63%) 2,229 (1.4%) 65,191 (40.86%) 25,575 (16.03%) 2,897 (1.82%) 41,112 (25.77%) Total61,566 (48.68%) 1,138 (0.9%) 49,456 (39.11%) 16,251 (12.85%) 1,779 (1.41%) 36,948 (29.22%) Rural22,405 (67.75%) 1,091 (3.3%) 15,735 (47.58%) 9,324 (28.2%) 1,118 (3.38%) 4,164 (12.59%) Urban
number of Households having each of the specified assets in, 2011 having each of the following specified assets Name of Sub-
DistrictTotal/ Rural/ Urban
Sub-District - Seondha
(2342203403)
Sub-District - Indergarh
(2342203404)
Sub-District - Datia (2342203405)
Sub-District - Bhander
(2342203406)
District - Datia (23422)
157

ORGI – MADHYA PRADESH English - (10-2011)
Directorate of Census Operations, Madhya Pradesh
Ministry of Home Affairs, Janganana Bhavan,
Area Hills, Jail Road, Bhopal - 462004
Email: [email protected] Website: http://www.censusindia.gov.in