Embed Size (px)
Citation preview
Valuation of
Private CompaniesVikash Goel
CA, CFA, MS Finance, MBA, IIM-C, Registered Valuer (IBBI)
Author of Handbook on Valuation of Securities and Financial Assets
Director at Omnifin Solutions P Ltd
Vikash Goel | CA, CFA, MS Fin, MBA, Regd Valuer
What’s covered in here
• Valuation of any company
• Specifics to Private companies
• Valuation of private companies
Vikash Goel | CA, CFA, MBA, MS Fin, Regd Valuer
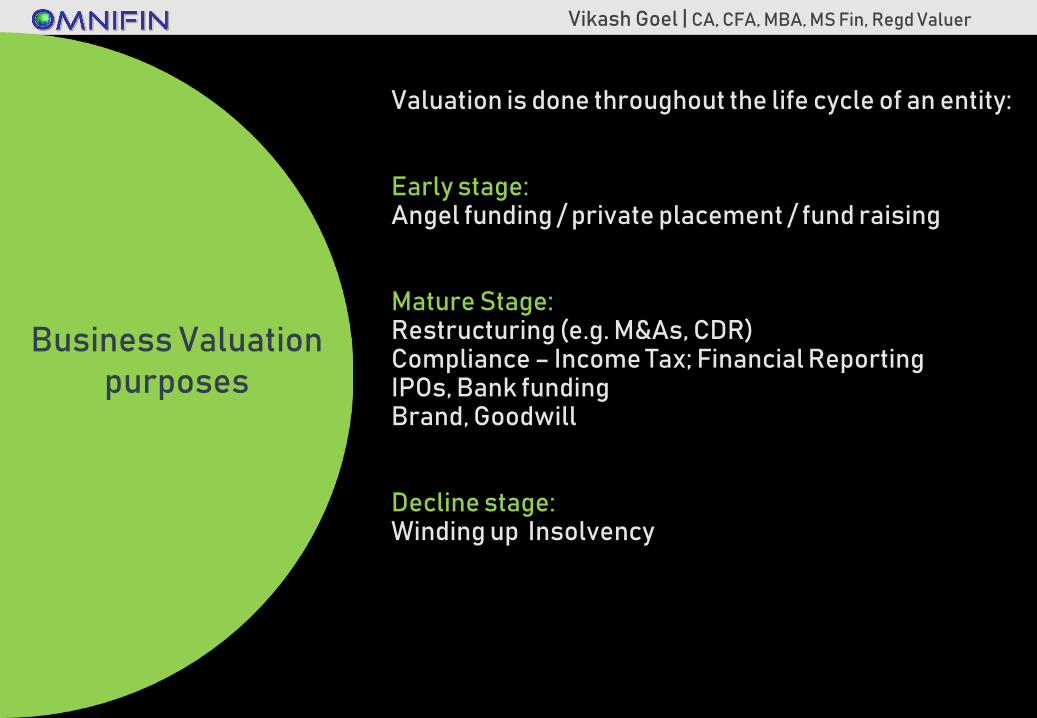
Valuation is done throughout the life cycle of an entity:
Early stage:Angel funding / private placement / fund raising
Mature Stage:Restructuring (e.g. M&As, CDR)Compliance – Income Tax; Financial ReportingIPOs, Bank fundingBrand, Goodwill
Decline stage:Winding up Insolvency
Business Valuation purposes
Vikash Goel | CA, CFA, MS Fin, MBA, Regd Valuer
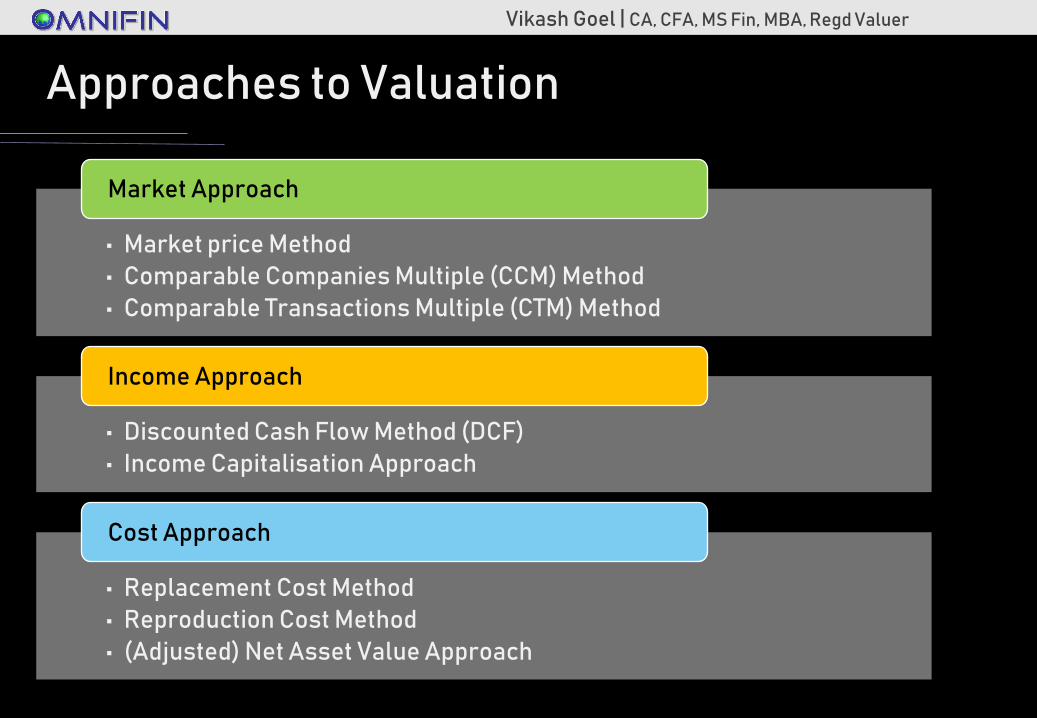
Approaches to Valuation
• Market price Method
• Comparable Companies Multiple (CCM) Method
• Comparable Transactions Multiple (CTM) Method
Market Approach
• Discounted Cash Flow Method (DCF)
• Income Capitalisation Approach
Income Approach
• Replacement Cost Method
• Reproduction Cost Method
• (Adjusted) Net Asset Value Approach
Cost Approach
Vikash Goel | CA, CFA, MS Fin, MBA, Regd Valuer
No market value for either debt or equity.
Insufficient / inadequate listed comparable companies
Lack of transparency in reported financials
Valuation driven by the presence of key managerial personnel
That is, the cash flows represent not only the potential of the business but of theowners as well.
Valuation of Private Cos – key issues
Vikash Goel | CA, CFA, MBA, MS Fin, Regd Valuer
Early stage companies
Vikash Goel | CA, CFA, MS Fin, MBA, Regd Valuer
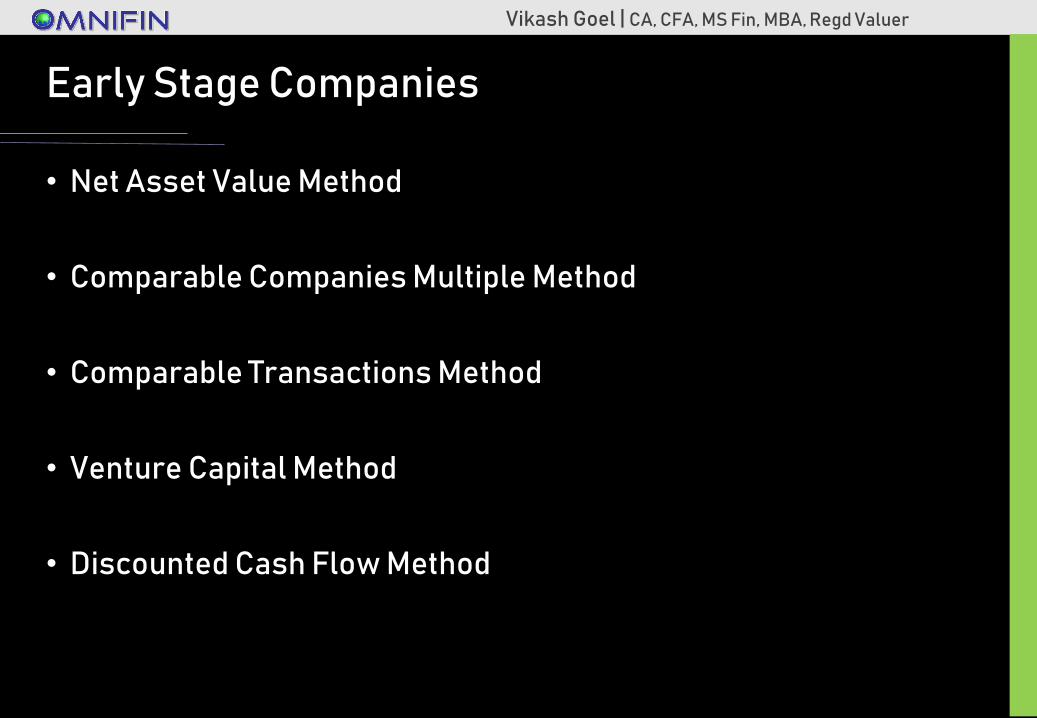
Early Stage Companies
• Net Asset Value Method
• Comparable Companies Multiple Method
• Comparable Transactions Method
• Venture Capital Method
• Discounted Cash Flow Method
Vikash Goel | CA, CFA, MS Fin, MBA, Regd Valuer
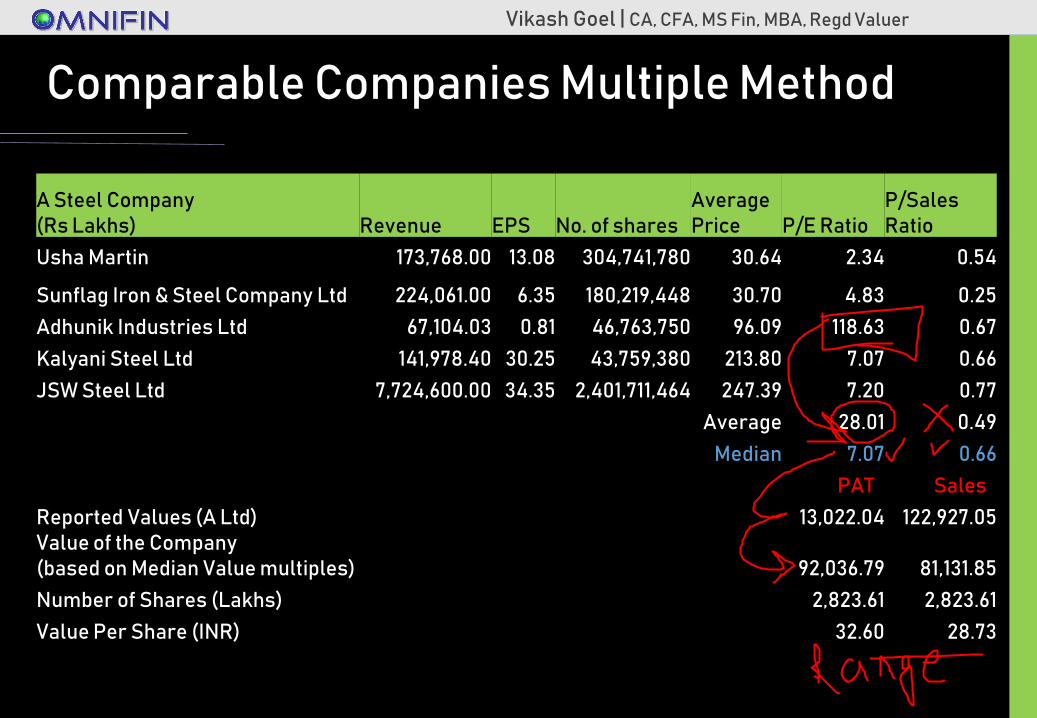
Comparable Companies Multiple Method
A Steel Company(Rs Lakhs) Revenue EPS No. of shares
Average Price P/E Ratio
P/Sales Ratio
Usha Martin 173,768.00 13.08 304,741,780 30.64 2.34 0.54
Sunflag Iron & Steel Company Ltd 224,061.00 6.35 180,219,448 30.70 4.83 0.25
Adhunik Industries Ltd 67,104.03 0.81 46,763,750 96.09 118.63 0.67
Kalyani Steel Ltd 141,978.40 30.25 43,759,380 213.80 7.07 0.66
JSW Steel Ltd 7,724,600.00 34.35 2,401,711,464 247.39 7.20 0.77
Average 28.01 0.49
Median 7.07 0.66
PATT SalesT
Reported Values (A Ltd) 13,022.04 122,927.05 Value of the Company (based on Median Value multiples) 92,036.79 81,131.85
Number of Shares (Lakhs) 2,823.61 2,823.61
Value Per Share (INR) 32.60 28.73
Vikash Goel | CA, CFA, MS Fin, MBA, Regd Valuer
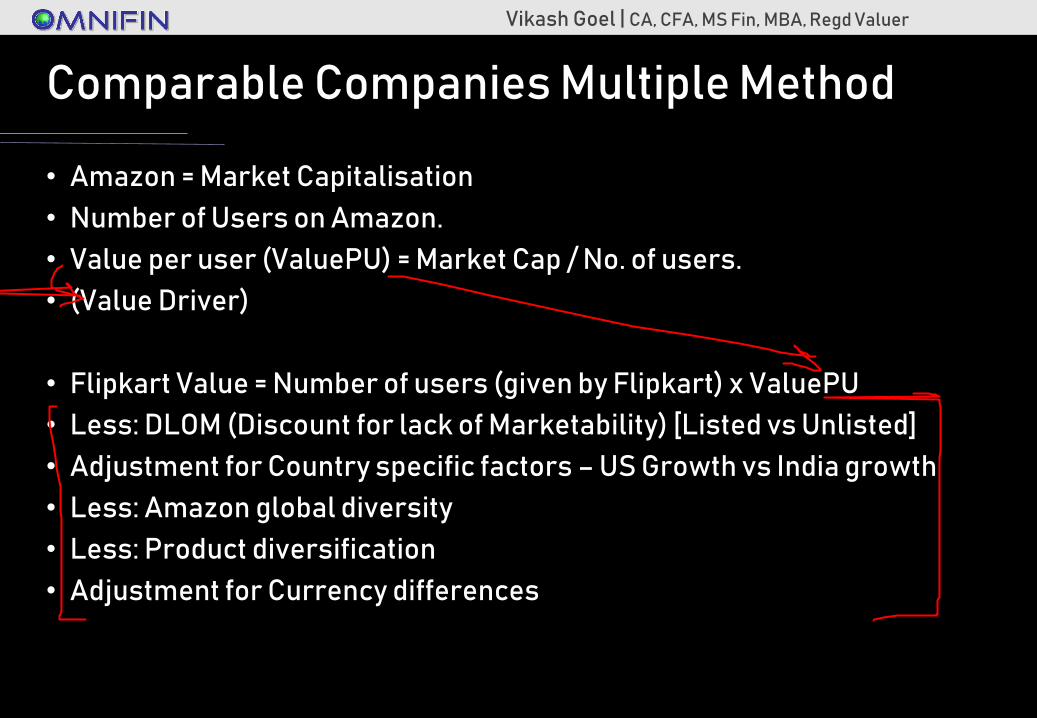
Comparable Companies Multiple Method
• Amazon = Market Capitalisation
• Number of Users on Amazon.
• Value per user (ValuePU) = Market Cap / No. of users.
• (Value Driver)
• Flipkart Value = Number of users (given by Flipkart) x ValuePU
• Less: DLOM (Discount for lack of Marketability) [Listed vs Unlisted]
• Adjustment for Country specific factors – US Growth vs India growth
• Less: Amazon global diversity
• Less: Product diversification
• Adjustment for Currency differences
Vikash Goel | CA, CFA, MS Fin, MBA, Regd Valuer
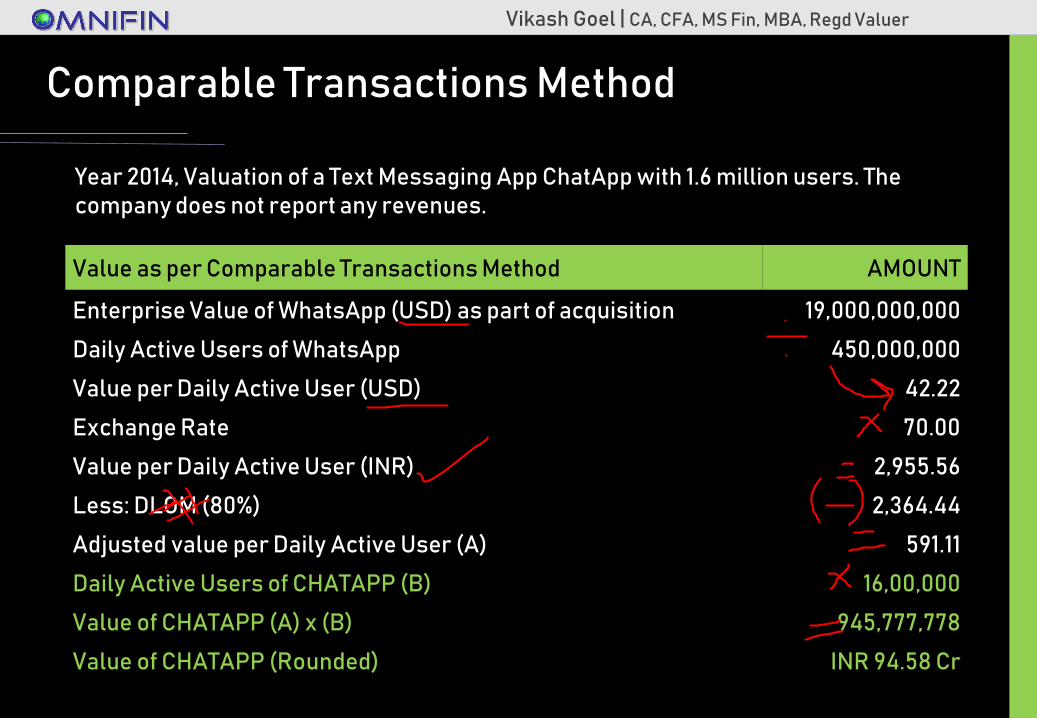
Comparable Transactions Method
Value as per Comparable Transactions Method AMOUNT
Enterprise Value of WhatsApp (USD) as part of acquisition 19,000,000,000
Daily Active Users of WhatsApp 450,000,000
Value per Daily Active User (USD) 42.22
Exchange Rate 70.00
Value per Daily Active User (INR) 2,955.56
Less: DLOM (80%) 2,364.44
Adjusted value per Daily Active User (A) 591.11
Daily Active Users of CHATAPP (B) 16,00,000
Value of CHATAPP (A) x (B) 945,777,778
Value of CHATAPP (Rounded) INR 94.58 Cr
Year 2014, Valuation of a Text Messaging App ChatApp with 1.6 million users. The company does not report any revenues.
Vikash Goel | CA, CFA, MS Fin, MBA, Regd Valuer
Venture Capital Method
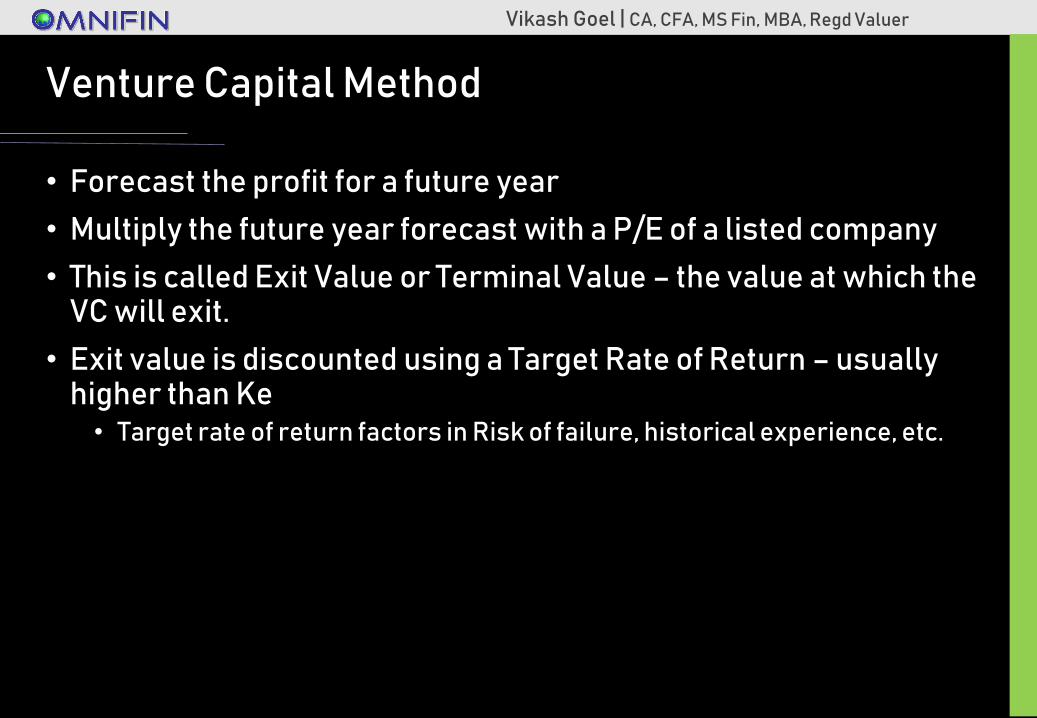
• Forecast the profit for a future year
• Multiply the future year forecast with a P/E of a listed company
• This is called Exit Value or Terminal Value – the value at which the VC will exit.
• Exit value is discounted using a Target Rate of Return – usually higher than Ke• Target rate of return factors in Risk of failure, historical experience, etc.
Vikash Goel | CA, CFA, MS Fin, MBA, Regd Valuer
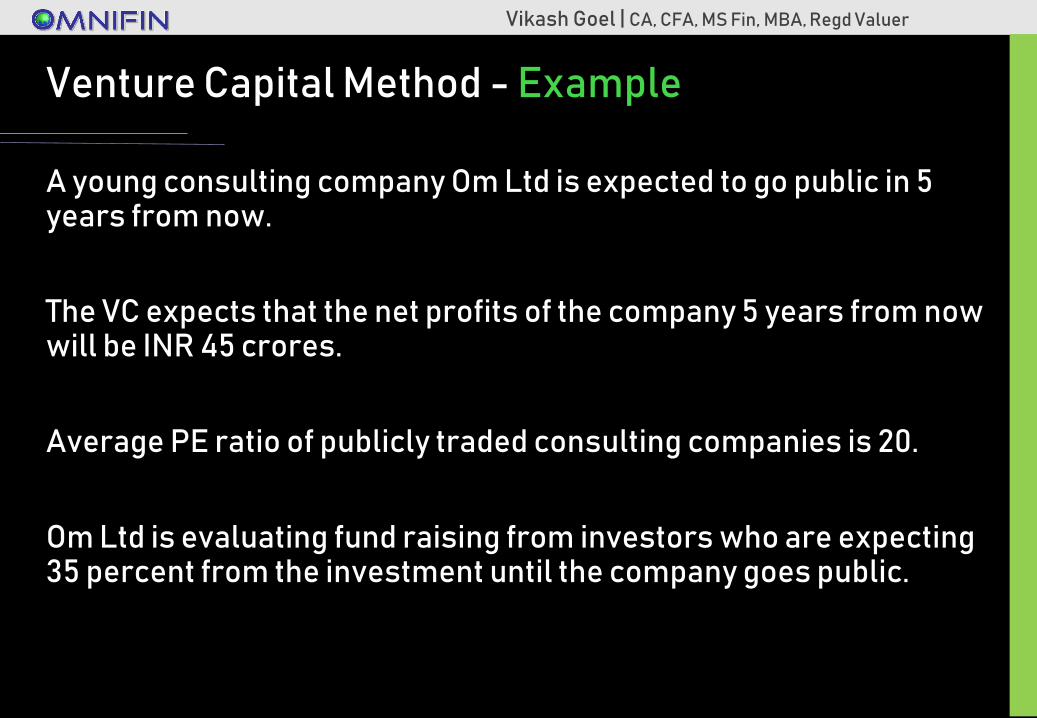
Venture Capital Method - Example
A young consulting company Om Ltd is expected to go public in 5 years from now.
The VC expects that the net profits of the company 5 years from now will be INR 45 crores.
Average PE ratio of publicly traded consulting companies is 20.
Om Ltd is evaluating fund raising from investors who are expecting 35 percent from the investment until the company goes public.
Vikash Goel | CA, CFA, MS Fin, MBA, Regd Valuer
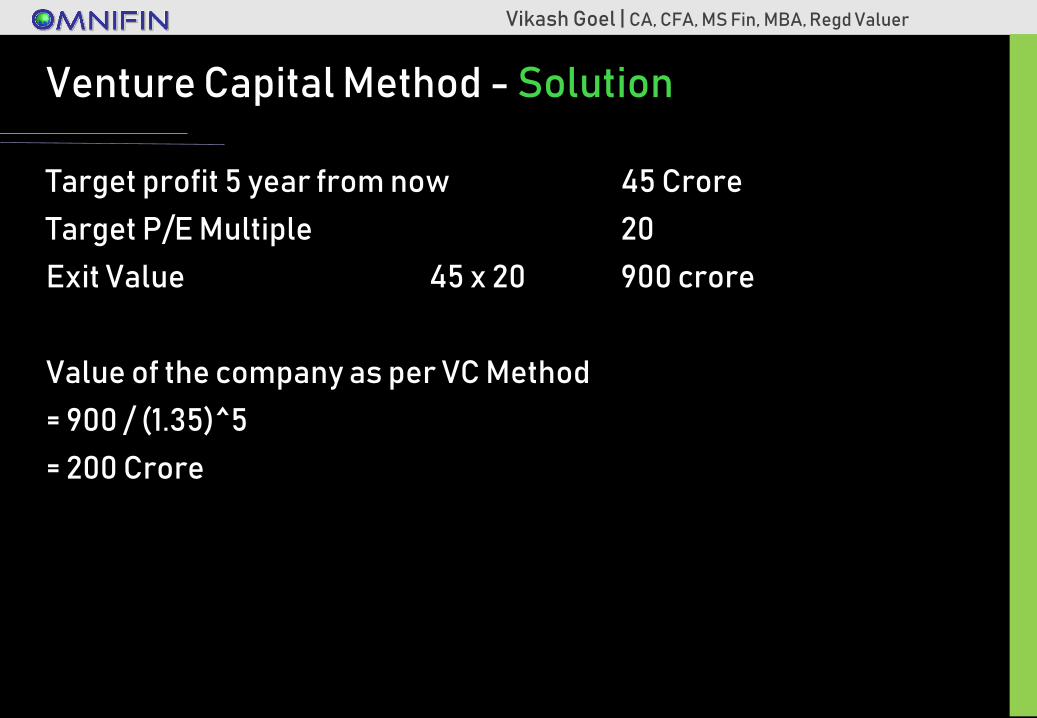
Venture Capital Method - Solution
Target profit 5 year from now 45 Crore
Target P/E Multiple 20
Exit Value 45 x 20 900 crore
Value of the company as per VC Method
= 900 / (1.35)^5
= 200 Crore
Vikash Goel | CA, CFA, MS Fin, MBA, Regd Valuer
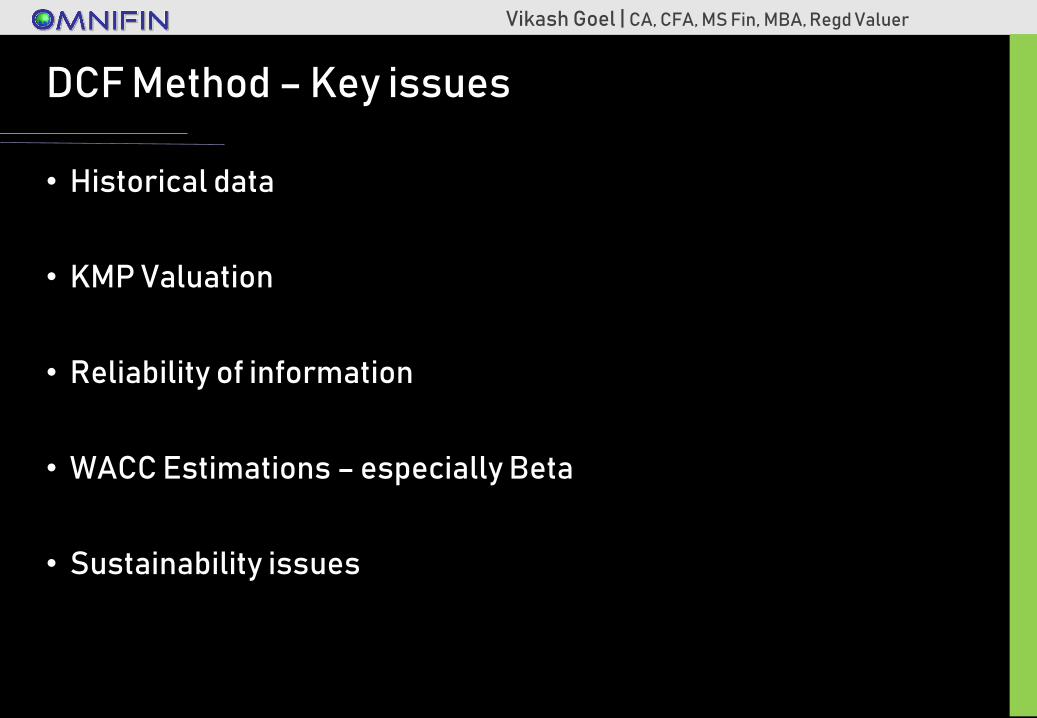
DCF Method – Key issues
• Historical data
• KMP Valuation
• Reliability of information
• WACC Estimations – especially Beta
• Sustainability issues
Vikash Goel | CA, CFA, MS Fin, MBA, Regd Valuer
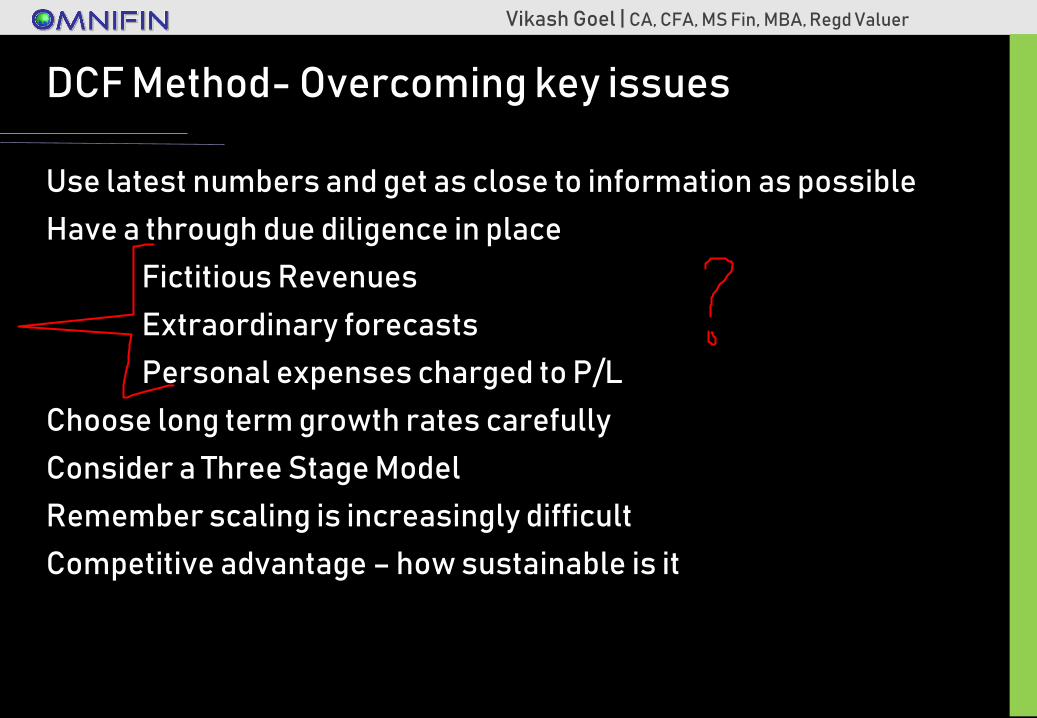
DCF Method- Overcoming key issues
Use latest numbers and get as close to information as possible
Have a through due diligence in place
Fictitious Revenues
Extraordinary forecasts
Personal expenses charged to P/L
Choose long term growth rates carefully
Consider a Three Stage Model
Remember scaling is increasingly difficult
Competitive advantage – how sustainable is it
Vikash Goel | CA, CFA, MS Fin, MBA, Regd Valuer
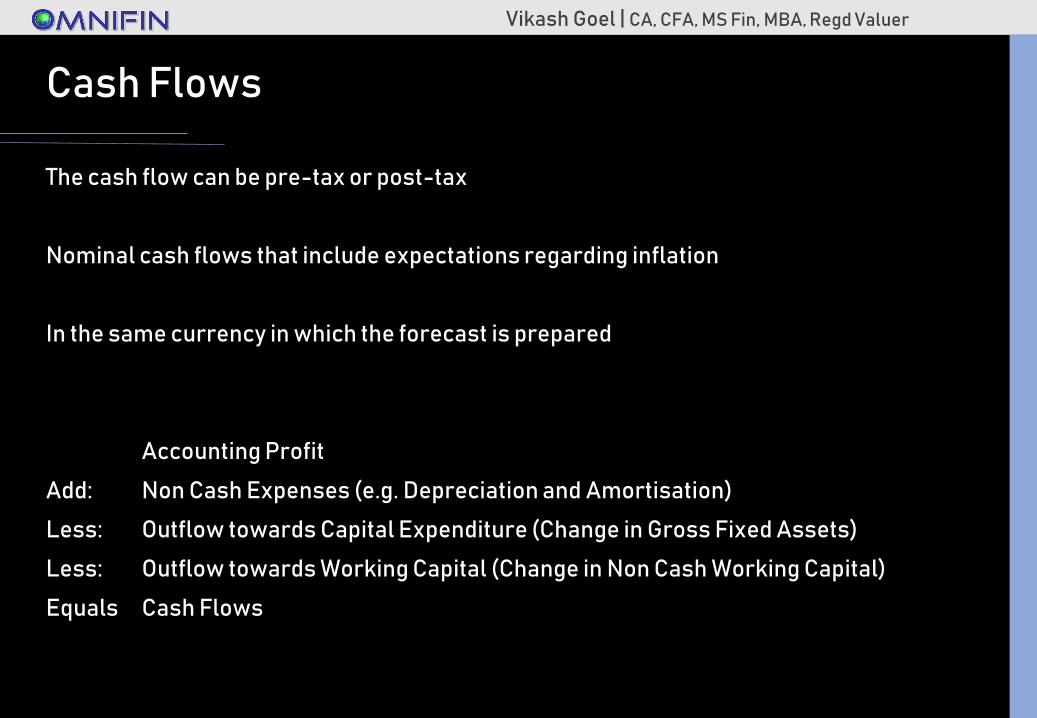
Cash Flows
The cash flow can be pre-tax or post-tax
Nominal cash flows that include expectations regarding inflation
In the same currency in which the forecast is prepared
Accounting Profit
Add: Non Cash Expenses (e.g. Depreciation and Amortisation)
Less: Outflow towards Capital Expenditure (Change in Gross Fixed Assets)
Less: Outflow towards Working Capital (Change in Non Cash Working Capital)
Equals Cash Flows
Vikash Goel | CA, CFA, MS Fin, MBA, Regd Valuer
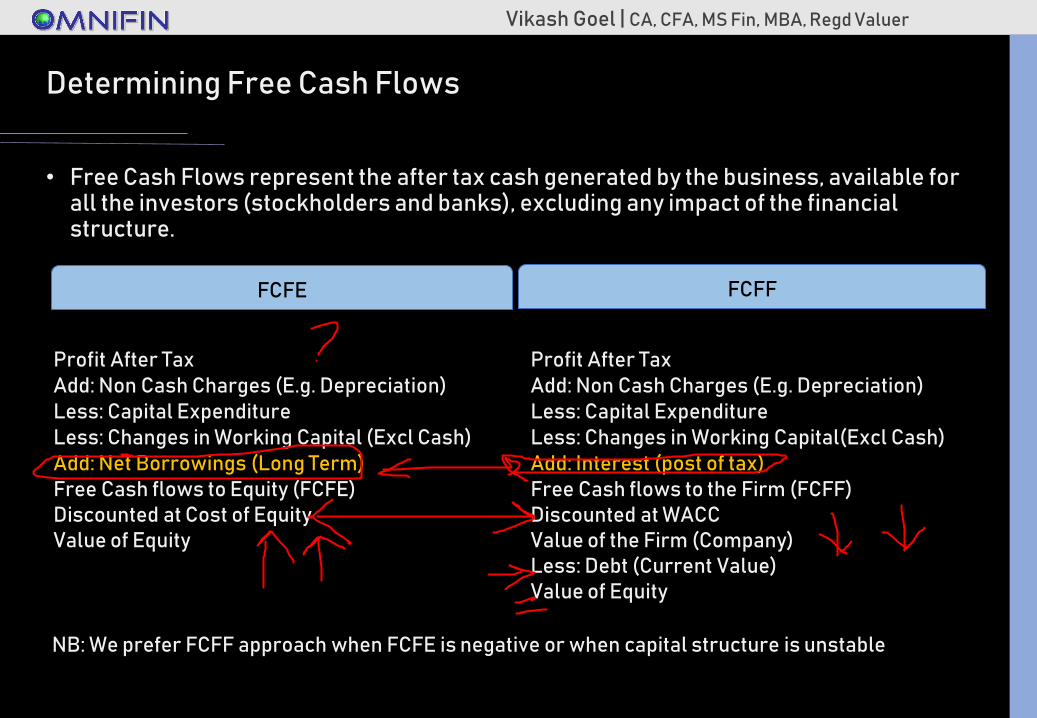
Determining Free Cash Flows
• Free Cash Flows represent the after tax cash generated by the business, available for all the investors (stockholders and banks), excluding any impact of the financial structure.
Profit After TaxAdd: Non Cash Charges (E.g. Depreciation)Less: Capital ExpenditureLess: Changes in Working Capital(Excl Cash)Add: Interest (post of tax)Free Cash flows to the Firm (FCFF)Discounted at WACCValue of the Firm (Company)Less: Debt (Current Value)Value of Equity
NB: We prefer FCFF approach when FCFE is negative or when capital structure is unstable
Profit After TaxAdd: Non Cash Charges (E.g. Depreciation)Less: Capital ExpenditureLess: Changes in Working Capital (Excl Cash)Add: Net Borrowings (Long Term)Free Cash flows to Equity (FCFE)Discounted at Cost of EquityValue of Equity
FCFE FCFF
Vikash Goel | CA, CFA, MS Fin, MBA, Regd Valuer
Discount Rate
Consider:
• The type of asset being valued
• The rates implicit in comparable transactions in the market
• The geographic location of the asset and/or the location of the markets in which it would trade,
• The life/term and/or maturity of the asset and the consistency of inputs.
• The bases of value being applied,
• The currency denomination of the projected cash flows.
Vikash Goel | CA, CFA, MS Fin, MBA, Regd Valuer
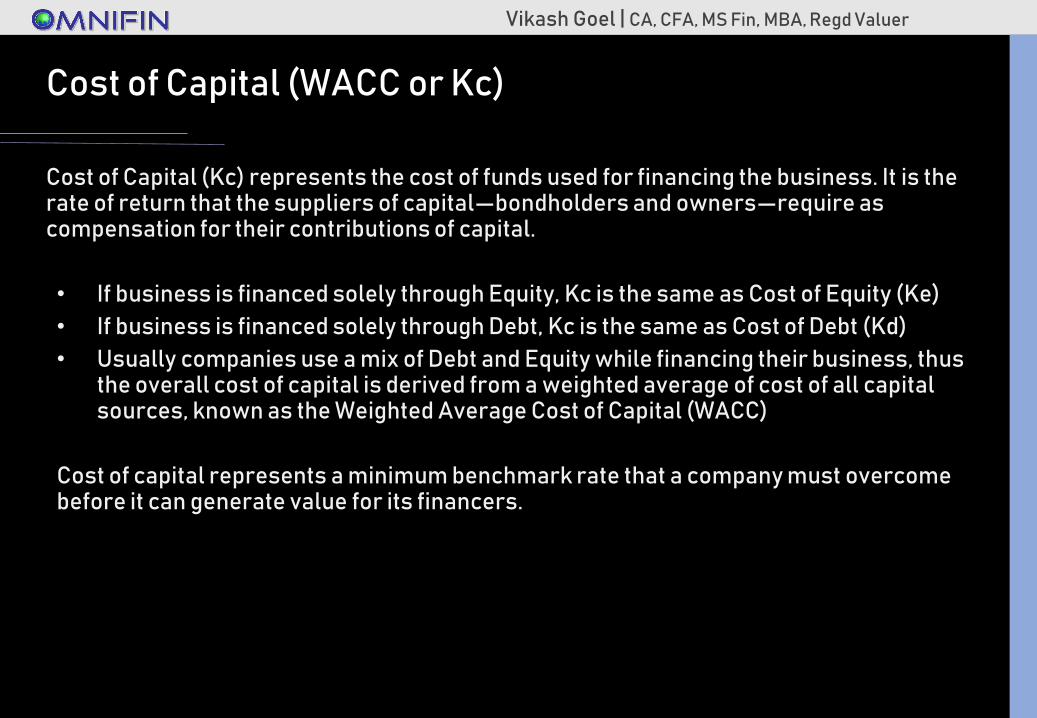
Cost of Capital (WACC or Kc)
Cost of Capital (Kc) represents the cost of funds used for financing the business. It is the rate of return that the suppliers of capital—bondholders and owners—require as compensation for their contributions of capital.
• If business is financed solely through Equity, Kc is the same as Cost of Equity (Ke)
• If business is financed solely through Debt, Kc is the same as Cost of Debt (Kd)
• Usually companies use a mix of Debt and Equity while financing their business, thus the overall cost of capital is derived from a weighted average of cost of all capital sources, known as the Weighted Average Cost of Capital (WACC)
Cost of capital represents a minimum benchmark rate that a company must overcome before it can generate value for its financers.
Vikash Goel | CA, CFA, MS Fin, MBA, Regd Valuer
Cost of CapitalCost of Debt
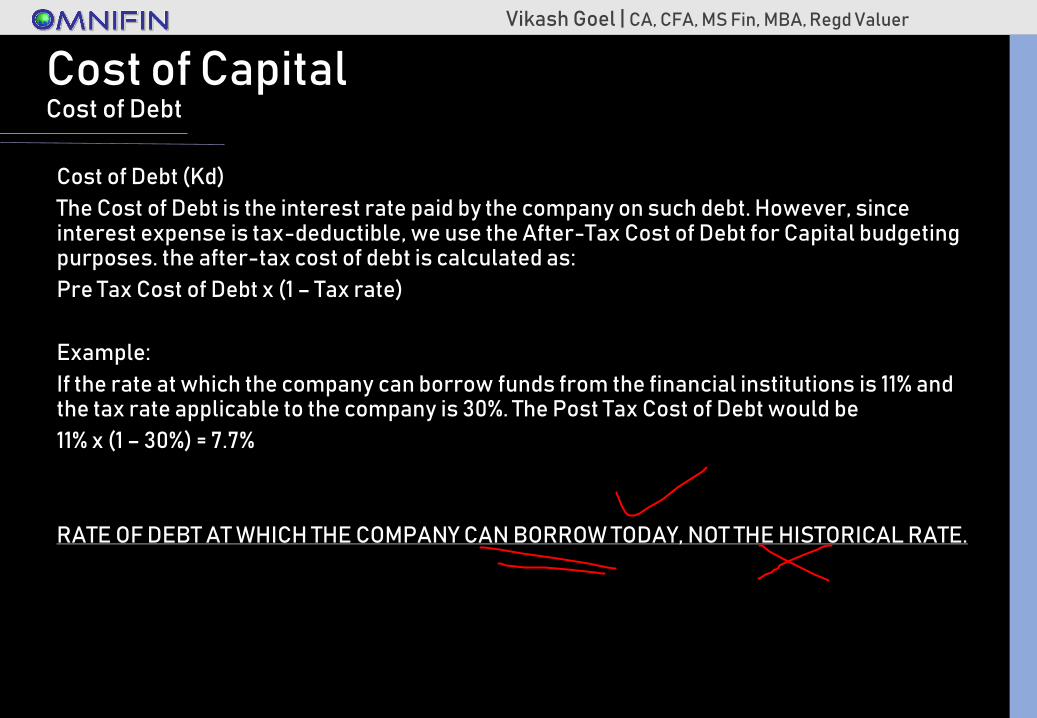
Cost of Debt (Kd)
The Cost of Debt is the interest rate paid by the company on such debt. However, since interest expense is tax-deductible, we use the After-Tax Cost of Debt for Capital budgeting purposes. the after-tax cost of debt is calculated as:
Pre Tax Cost of Debt x (1 – Tax rate)
Example:
If the rate at which the company can borrow funds from the financial institutions is 11% and the tax rate applicable to the company is 30%. The Post Tax Cost of Debt would be
11% x (1 – 30%) = 7.7%
RATE OF DEBT AT WHICH THE COMPANY CAN BORROW TODAY, NOT THE HISTORICAL RATE.
Vikash Goel | CA, CFA, MS Fin, MBA, Regd Valuer
Cost of CapitalCost of Equity
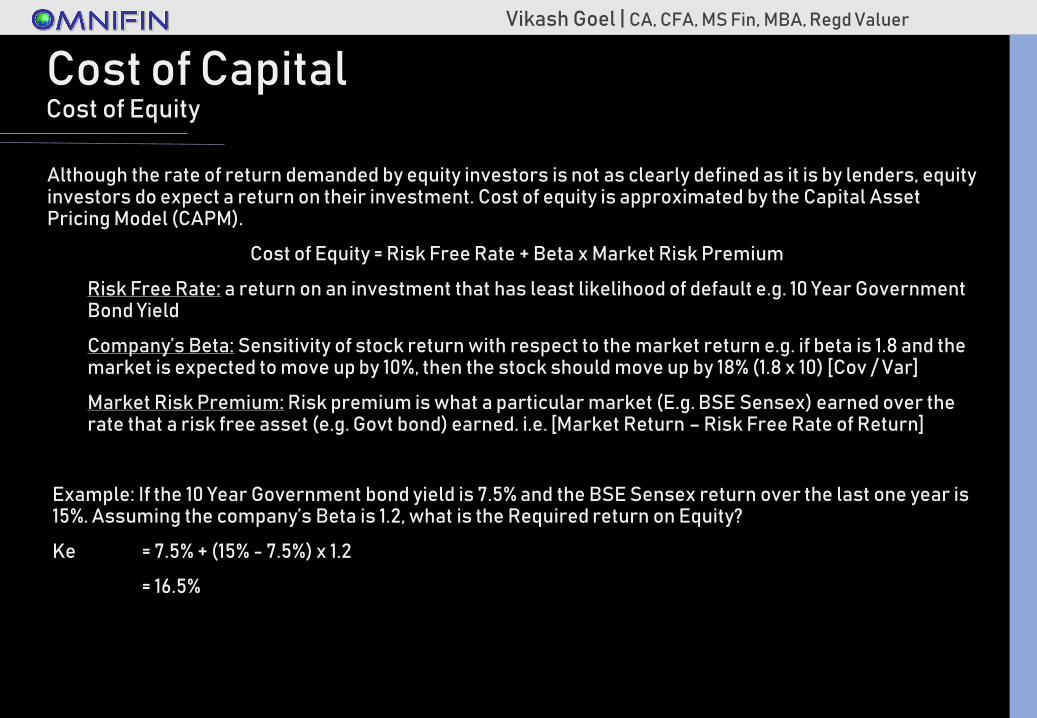
Although the rate of return demanded by equity investors is not as clearly defined as it is by lenders, equity investors do expect a return on their investment. Cost of equity is approximated by the Capital Asset Pricing Model (CAPM).
Cost of Equity = Risk Free Rate + Beta x Market Risk Premium
Risk Free Rate: a return on an investment that has least likelihood of default e.g. 10 Year Government Bond Yield
Company’s Beta: Sensitivity of stock return with respect to the market return e.g. if beta is 1.8 and the market is expected to move up by 10%, then the stock should move up by 18% (1.8 x 10) [Cov / Var]
Market Risk Premium: Risk premium is what a particular market (E.g. BSE Sensex) earned over the rate that a risk free asset (e.g. Govt bond) earned. i.e. [Market Return – Risk Free Rate of Return]
Example: If the 10 Year Government bond yield is 7.5% and the BSE Sensex return over the last one year is 15%. Assuming the company’s Beta is 1.2, what is the Required return on Equity?
Ke = 7.5% + (15% - 7.5%) x 1.2
= 16.5%
Vikash Goel | CA, CFA, MS Fin, MBA, Regd Valuer
Cost of CapitalBeta of a private company
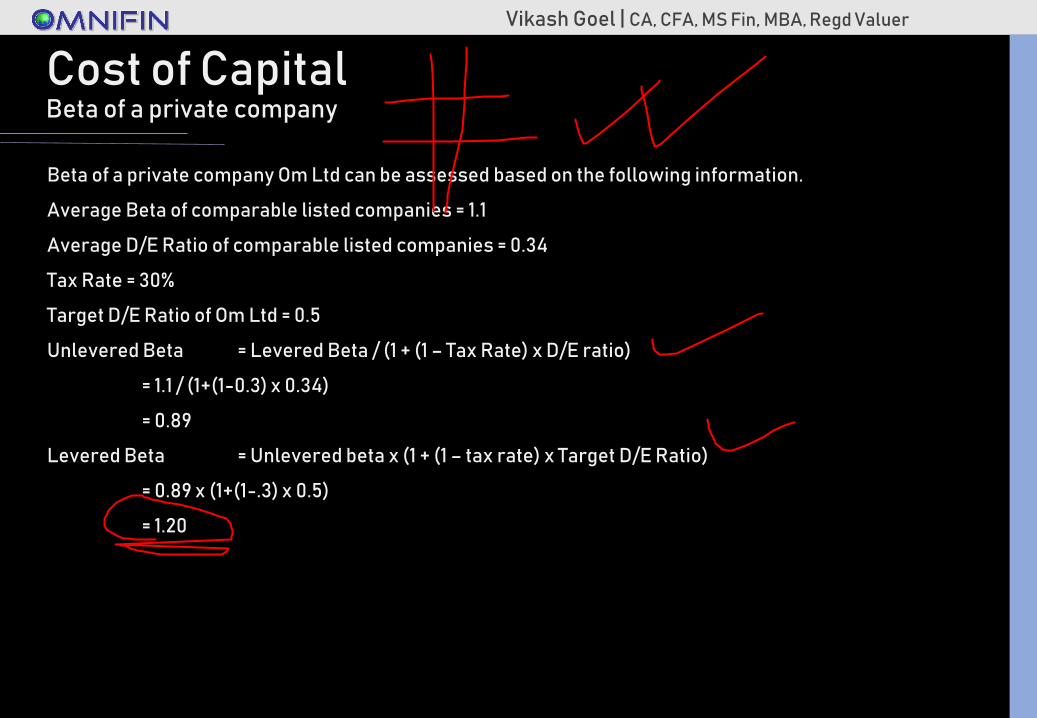
Beta of a private company Om Ltd can be assessed based on the following information.
Average Beta of comparable listed companies = 1.1
Average D/E Ratio of comparable listed companies = 0.34
Tax Rate = 30%
Target D/E Ratio of Om Ltd = 0.5
Unlevered Beta = Levered Beta / (1 + (1 – Tax Rate) x D/E ratio)
= 1.1 / (1+(1-0.3) x 0.34)
= 0.89
Levered Beta = Unlevered beta x (1 + (1 – tax rate) x Target D/E Ratio)
= 0.89 x (1+(1-.3) x 0.5)
= 1.20
Vikash Goel | CA, CFA, MS Fin, MBA, Regd Valuer
Cost of CapitalWeighted Average Cost of Capital
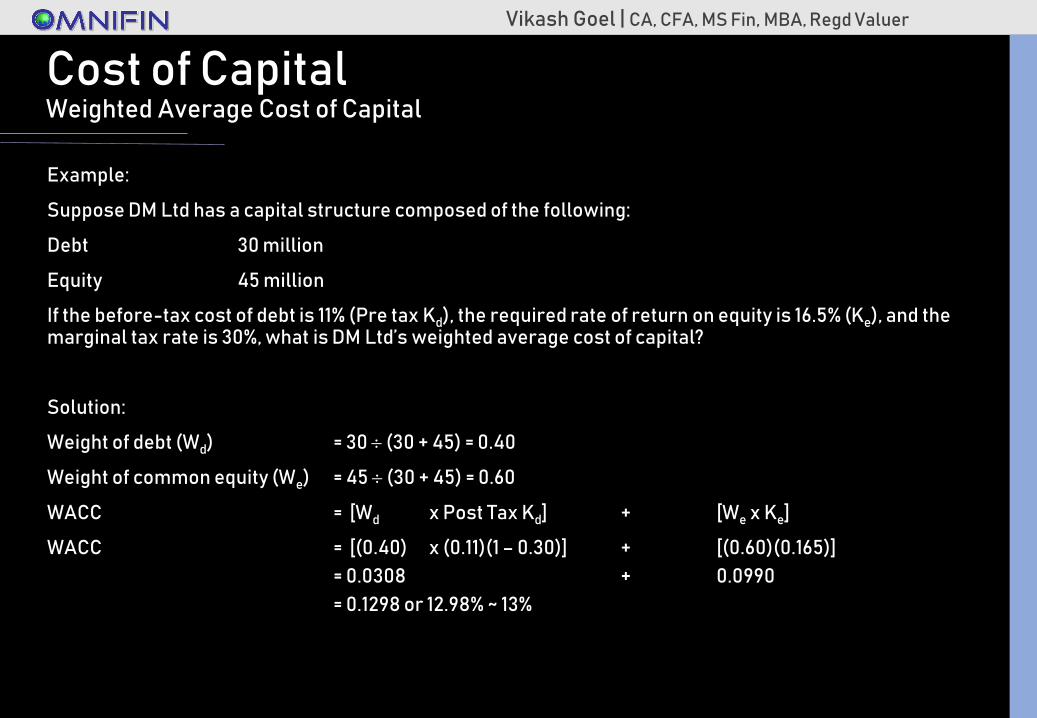
Example:
Suppose DM Ltd has a capital structure composed of the following:
Debt 30 million
Equity 45 million
If the before-tax cost of debt is 11% (Pre tax Kd), the required rate of return on equity is 16.5% (Ke), and the marginal tax rate is 30%, what is DM Ltd’s weighted average cost of capital?
Solution:
Weight of debt (Wd) = 30 (30 + 45) = 0.40
Weight of common equity (We) = 45 (30 + 45) = 0.60
WACC = [Wd x Post Tax Kd] + [We x Ke]
WACC = [(0.40) x (0.11)(1 – 0.30)] + [(0.60)(0.165)]
= 0.0308 + 0.0990
= 0.1298 or 12.98% ~ 13%
Vikash Goel | CA, CFA, MS Fin, MBA, Regd Valuer
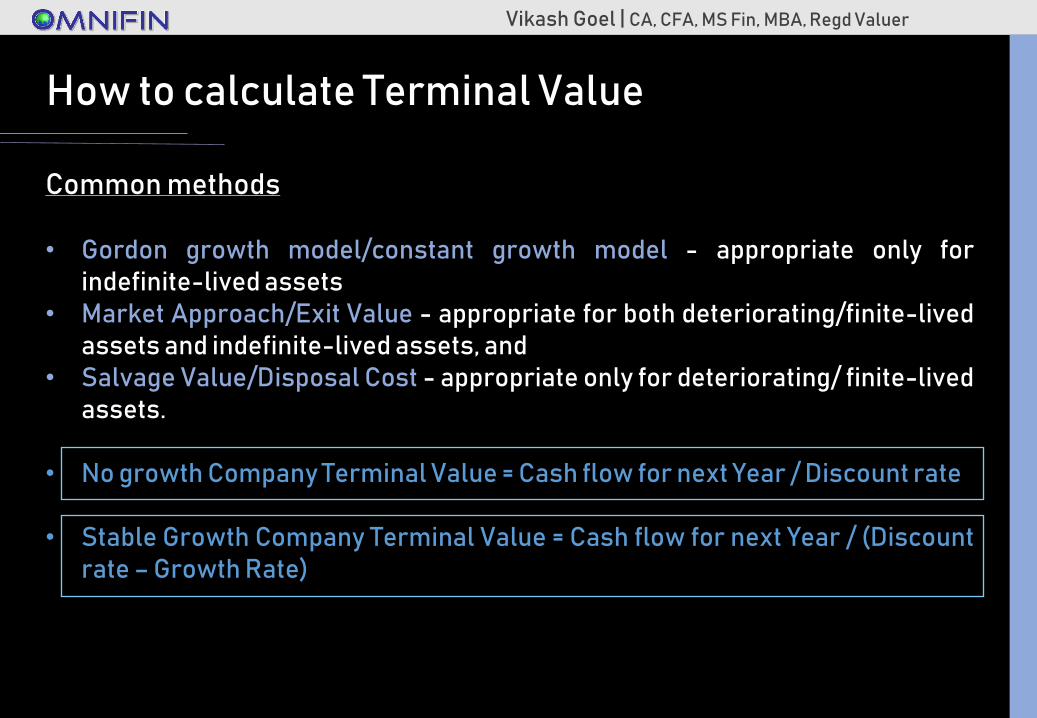
How to calculate Terminal Value
Common methods
• Gordon growth model/constant growth model - appropriate only forindefinite-lived assets
• Market Approach/Exit Value - appropriate for both deteriorating/finite-livedassets and indefinite-lived assets, and
• Salvage Value/Disposal Cost - appropriate only for deteriorating/ finite-livedassets.
• No growth Company Terminal Value = Cash flow for next Year / Discount rate
• Stable Growth Company Terminal Value = Cash flow for next Year / (Discountrate – Growth Rate)
Vikash Goel | CA, CFA, MS Fin, MBA, Regd Valuer
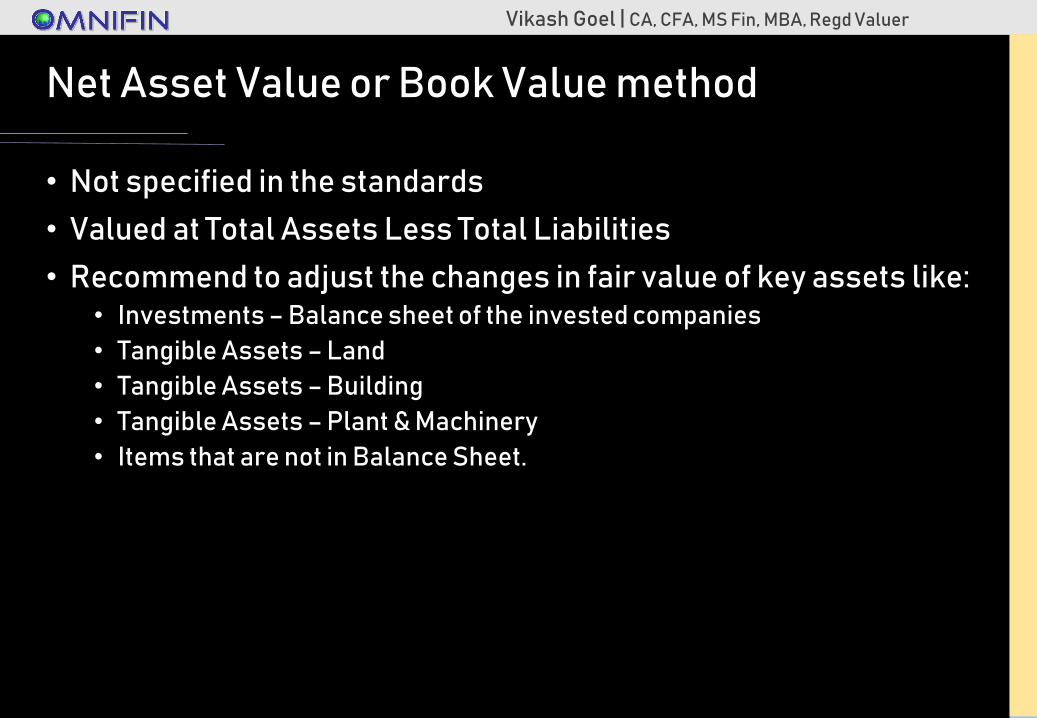
Net Asset Value or Book Value method
• Not specified in the standards
• Valued at Total Assets Less Total Liabilities
• Recommend to adjust the changes in fair value of key assets like:• Investments – Balance sheet of the invested companies
• Tangible Assets – Land
• Tangible Assets – Building
• Tangible Assets – Plant & Machinery
• Items that are not in Balance Sheet.


![ATULYA VIKASH [A Helping Hand]](https://img.pdfslide.us/doc/110x75/626703850d51f6228808aec6/atulya-vikash-a-helping-hand.jpg)