Embed Size (px)
Citation preview

CHAPTER – I
INTRODUCTION
INTRODUCTION1
Investment means “postponed present consumption”
“It may mean many things to many persons. If one person has advanced some
money to another, he may consider his loan as an investment. He expects to get back the
money along with interest at a future date.”
“Another person may have purchased one kg of gold for the purpose of price
appreciation and may consider it as an investment.
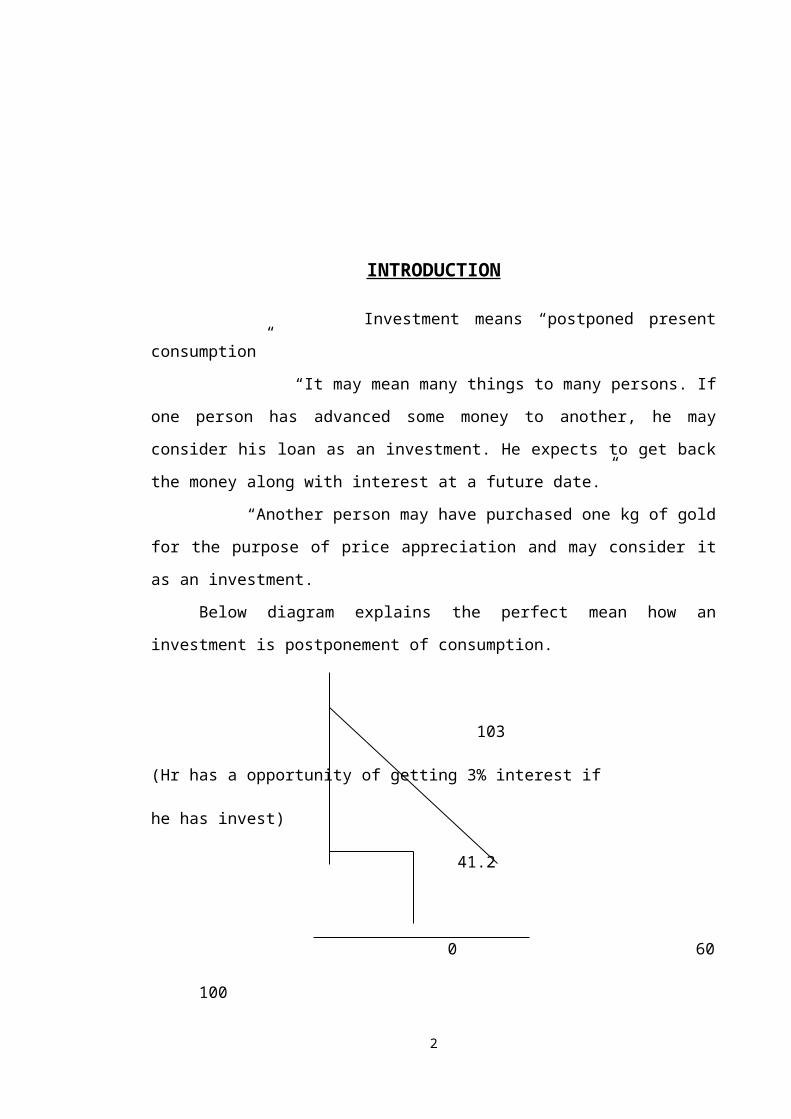
Below diagram explains the perfect mean how an investment is postponement of
consumption.
103 (Hr has a opportunity of getting 3% interest if he has invest) 41.2
0 60 100
Co is the current year consumption axes he can consume high as 100 low as 0.
C1 is the next year consumption high as 103&low as 0
According to the diagram he consumed 60/- and he invested remaining 40/- he
got 41.2/- “so he got more
Avenues of investment
Corporate securities
Deposits in banks and non-banking companies
UTI and other mutual fund schemes
Post office deposits and certificates
Life insurance polices
Provident fund schemes
Government and semi-government securities
2
Driving forces of investment
Though there are many factors that influence the decision of investing in
assets, there are some main driving forces that cause investment in any society like
Retirement plan
Avoidance of taxation
Tempting high rates of interest
High inflation and resultant expectation of increase in the monetary return
Hike in income
Availability of a large number of investment avenues
Legal safeguards
Existence of financial institutions to encourage savings etc.,
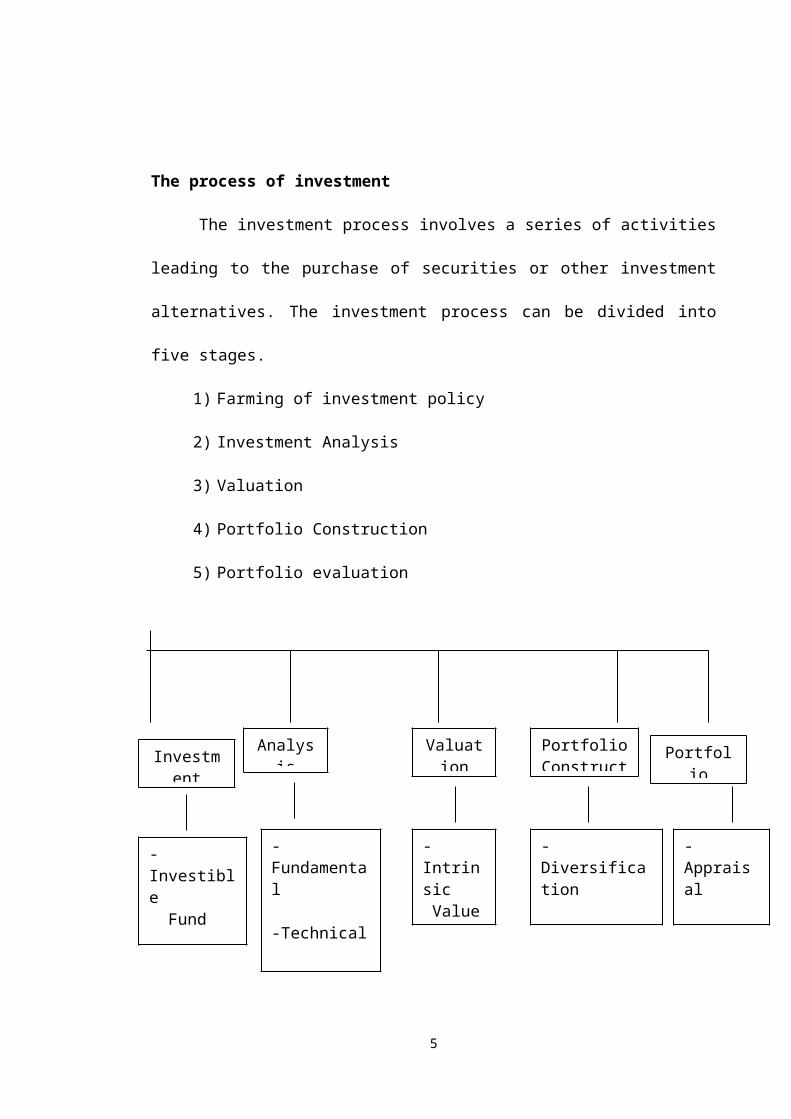
The process of investment
3
The investment process involves a series of activities leading to the purchase of
securities or other investment alternatives. The investment process can be divided into
five stages.
1) Farming of investment policy
2) Investment Analysis
3) Valuation
4) Portfolio Construction
5) Portfolio evaluation
Investment Policy4
Investment Policy
Analysis Valuation PortfolioConstruction
Portfolio Evaluation
-Investible Fund-Objectives-Knowledge
-Fundamental
-Technical
-Efficient Market Hypothesis
-Intrinsic Value-Future Value
-Diversification
-Selection & Allocation
-Appraisal
-Revision
The government or the investor before proceeding into investment formulates
the policy for the systematic functioning. The essential ingredients of the policy are the
Investible funds, objectives and the knowledge about the investment alternatives and
market.
Investible funds: The entire investment procedure revolves around the availability of
investible funds. The fund may be generated through savings or from borrowings. If the
funds are borrowed, the investor has to be extra careful in the selection of investment
alternatives. The return should be higher than the interest he pays. Mutual funds invest
their owner’s money in securities
.
Objectives: The objectives are framed on the premises of the required rate of return,
need for regularity of income, risk perception and the need for liquidity. The risk taker’s
objective is to earn high rate of return in the form of capital appreciation, whereas the
primary objective of the risk averse is the safety of the principle.
Knowledge: The knowledge about the investment alternatives and markets plays a key
role in the policy formulation, the investment alternatives range from security to real
estate, the risk and return associated with investment alternatives differ from each other.
Investment in equity is high yielding but has more risk than the fixed income securities.
The tax sheltered schemes offer tax benefits to the investors.
The investor should be aware of the stock market structure and the functions of
the brokers. The mode of operation varies among BSE, NSE, and OTCEI. Brokerage
charges are also different. The knowledge about the stock exchanges enables him to
trade the stock intelligently
Security Analysis
After formulating the investment policy, the securities to be bought have to be
scrutinized through either Fundamental analysis or Technical analysis or Efficient
Market Hypothesis theory.
Fundamental Analysis: Fundamental analysis is really a logical and systematic
approach to estimating the future dividends and share price. It is based on the basic
5
premise that share price is determined by a number of fundamental factors relating to
the economy, industry and company.
Technical Analysis: According to technical analysis the investors believe that share
prices are determined by the demand and supply forces operating in the market. These
demand and supply forces in turn are influenced by a number of fundamental factors as
well as certain psychological or emotional factors. Many of these factors cannot be
quantified. The technical analyst therefore concentrates on the movement of share
prices. He claims that by examining past share price movements future share prices can
be accurately predicted. Technical analysis is the name given to forecasting techniques
that utilize historical share price data.
The rationale behind technical analysis is that share price behavior repeats itself
over time and the analyst attempts to drive methods to predict this repetition.
Random Walk Theory:. There Stock prices are determined by a number of factors
such as fundamental factors, technical factors and psychological factors. The behavior
of stock prices is studied with the help of different methods such as fundamental
analysis and technical analysis. Fundamental analysis seeks to evaluate the intrinsic
value of securities by studying the fundamental factors affecting the performance of the
economy, industry and companies. Technical analysis believes that the past behavior of
stock prices gives an indication of the future behavior. It tries to study the patterns in
stock price behavior through charts and predict the future movement in pricesis a third
theory on stock price behavior, which questions the assumptions of technical analysis.
The basic assumption in technical analysis is that stock price movement is quite
orderly and not random. The new theory questions this assumption. From the results of
several empirical studies on stock price movements, the advocates of the new theory
assert that share price movements are random. The new theory came to be known as
Random Walk Theory because of its principal contention that share price movements
represent a random walk rather than an orderly movement.
Valuation
6
The valuation helps the investor to determine the return the return and risk
expected from an investment in the common stock. The intrinsic value of the share is
measured through the book value of the share and price earnings ratio. Simple
discounting models also can be adopted to value the shares. The stock market analysts
have developed many advanced models to value the shares. The real worth of the share
is compared with the market price and then the investment decisions and made.
Future value: Future value of the securities could be estimated by using a simple
statistical technique like rend analysis. The analysis of the historical behavior of the
price enables the investor to predict the future value.
Construction of a Portfolio
A portfolio is a combination of securities. The portfolio is constructed in such a
manner to meet the investor’s goals and objectives. The investor should decide how best
to reach the goals with the securities available. The investor tries to attain maximum
risk. Towards this end he diversifies his portfolio and allocates funds among the
securities.
Diversification: The main objective of diversification is the reduction of risk in the loss
of capital and income. A diversified portfolio is comparatively less risky than holding a
single portfolio. There are several ways to diversify the portfolio.
Debt and equity diversification Debt instruments provide assured return with
limited capital appreciation. Common stocks provide income and capital gain but with
the flavor of uncertainty. Both debt instruments and equity are combined to complement
each other.
Industry diversification Industries’ growth and their reaction to government
policies differ from each other. Banking industry shares may provide regular returns but
with limited capital appreciation. The information technology stock yields high return
and capital appreciation but their growth potential after the year2002 is not predictable.
Thus, industry diversification is needed and it reduces risk.
Company diversification Securities from different companies are purchased to
reduce risk. Technical analysts suggest the investors to buy securities based on the price
7
movement. Fundamental analysts suggest the selection of financially sound and investor
friendly companies
Selection: Based on the diversification level, industry and company analyses the
securities have to be selected. Funds are allocated for the selected securities. Selection
of securities and the allocation of funds and sales the construction of portfolio.
Evaluation
The portfolio has to be managed efficiently. The efficient management calls for
evaluation of the portfolio this process consists of portfolio appraisal and revision.
Appraisal: The return and risk performance of the security vary from time to time. The
variability in return of the securities is measured and compared. The developments in
the economy, industry and relevant companies from which the stocks are bought have
to0 be appraised. The appraisal warns the loss and steps cab be taken to avoid such
losses.
Revision: Depends on the results of the appraisal. The low yielding securities with high
risk are replaced with high yielding securities with low risk factor. To keep the return at
a particular level necessitates the investor to revise the components of the portfolio
periodically.
8
NEED OF THE STUDY
To overcome the rumors heard rather than by rational analysis, security analysis
and portfolio management has emerged as a separate discipline.
Portfolio management deals with the rational investment decision making
process.
Portfolio management deal with the analysis of individual securities as well as
with the theory and practice of optimally combining securities into portfolios.
Creation of portfolio helps to reduce risk without sacrificing returns.
SCOPE OF THE STUDY9
This scope of study is limited to few selected industries. Those are
Pharmaceutical, Information Technologies, Automobile, & Banking Industry.
In these industries, only some are selected. They are 6companies each from
pharmaceutical, I.T., Automobile industry and 12 companies from banking industry.
This study is analysis of previous twelve months (Jan-12 to Dec-12) data
relating to prices of shares in Bombay Stock Exchange only.
OBJECTIVES OF THE STUDY10
To ascertain the return both firm wise and industry wise as a whole
To know the risk factor in the firm and Industry as a whole
To know the fluctuations of the security prices of the selected firms.
To compare Industry index with BSE-200 Index in various aspects.
11
RESEARCH METHODOLOGY
Data Collection
Since the primary data is not available within the time permitted, and so
secondary data has been generated from secondary sources, i.e., from web sources and
periodic investment journals.
Tools for evaluation Statistical tools for evaluations:
Standard deviation ()(Risk)
Variation 2 (Unsystematic Risk)
Co-efficient of variation (CV)
Average
Index (simple avg. method)
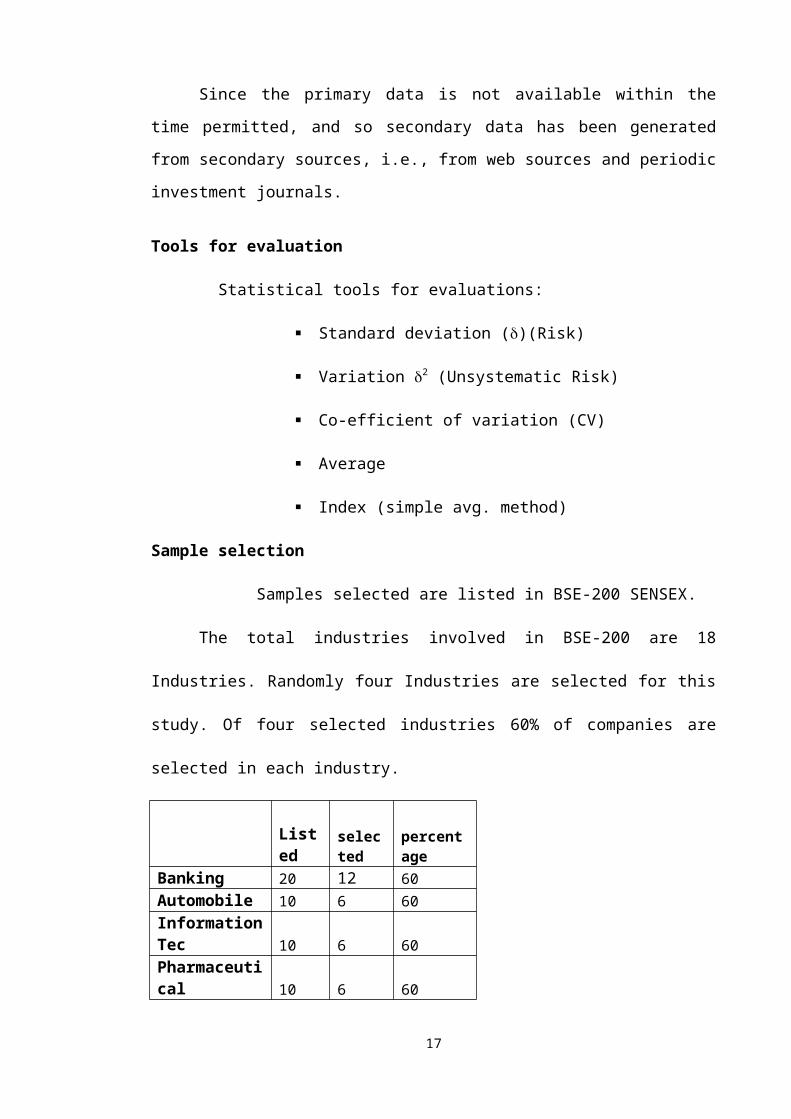
Sample selection
Samples selected are listed in BSE-200 SENSEX.
The total industries involved in BSE-200 are 18 Industries. Randomly four
Industries are selected for this study. Of four selected industries 60% of companies are
selected in each industry.
Listed selected percentage
Banking 20 12 60Automobile 10 6 60Information Tec 10 6 60Pharmaceutical 10 6 60
12

CHAPTER - II
REVIEW OF LITERATURE
REVIEW OF LITERATURE
13
According to Adam. Y. C. Lei & Huihua.li (2012),
Motivated by an obvious gap between the widespread use of Bloomberg terminals in the
finance industry and the scant resources available to an instructor on how to incorporate
the available information through the terminal into a finance course, we illustrate our
experience using the terminal in an equity-focused security analysis and portfolio
management course. Our goal is to enable students inexperienced with the terminal to
prepare an analyst report. We identify the most significant challenges we face and
provide the corresponding solutions. Our results are also applicable to other finance
courses including financial analysis, investments, and student managed investment fund
According to Ali Asghary Karahroudy (2012),
Security Analysis and Framework of Cloud computing offers massive scalability,
immediate availability, and low cost services as major benefits, but as with most new
technologies, it introduces new risks and vulnerabilities too. Despite the fact that
different cloud structures and services are expanding, the cloud computing penetration
has not been as envisioned. Some specific concerns have stopped enterprises from
completely joining the cloud. One of the major disadvantages of using cloud computing
is its increased security risks. In this study I conduct an in depth analyses of
the different aspects of security issues in cloud computing and propose a file
distribution model as a possible solution to alleviate those security risks. It also shows
the effectiveness of the new security model as compared with those currently being
used. I present, a new file storage system with variable size chunks, distributed chunk
addressing, decentralized file allocation tables, spread deciphering key, randomly
selected file servers, and fault tolerant chunk system.\
According to Ran Canetti & IBM Research (2008),
Composable Formal Security Analysis, a security property of a protocol is composable
if it remains intact even when the protocol runs alongside other protocols in the same
system. We describe a method for asserting composable security properties, and
demonstrate its usefulness. In particular, we show how this method can be used to
provide security analysis that is formal, relatively simple, and still does not make un-
justified abstractions of the underlying cryptographic algorithms in use. It can also
greatly enhance the feasibility of automated security analysis of systems of realistic
size.
14

According to, Hari P. Sharma, Dinesh K. Sharma, Princess Anne Jana, (2008),,
The focus of this research paper is to develop a model for security analysis and
investment decisions using multi objective chance constrained programming (CCP).
Using relevant variables and constraints a deterministic nonlinear programming model
is derived using CCP technique. The model’s efficiency and effectiveness is also
evaluated as applied to a sample of stocks selected from the Dow Jones Industrial
Average compiled into a high yielding portfolio.
According to John T. Harvey, (2001),
Security analysis Psychological and Institutional Forces and the Determination
of Exchange Rates, Neoclassical economists, by their own admission, have had a
terrible time explaining foreign-currency prices. In large part, this is due to the fact that
they assume "economic" behavior to be independent of social and cultural influences.
But markets are social institutions. They "organize and guide human social behavior
through sanctions (formal and informal, negative and positive), mores, norms, status,
and shared worldviews". Consequently, explaining economic exchange requires an
understanding of the behavior associated with the subculture of those in question. The
purpose of this paper is to build a model of exchange rates that is based on the
assumption that Homo sapient behavior can only be understood in terms of its social
context. This will be accomplished in four steps. First, the participants in the market
will be identified. Second, their relative significance in the determination of prices will
be discussed. Third and most important, the psychological and institutional forces
molding the behavior of the most influential actors will be explained. Finally, the
implications for foreign exchange prices are outlined.
According to Stanis – aw – Gasik (2007),
Portfolio management, what is a project portfolio? May it contain a set of
investment project only? But in project-based organizations just commercial projects
and their sets are much more important than investment projects. Moreover, in such
organizations you may not easily strictly partition projects into investment and
commercial.Usually the first commercial project of given type delivered to a customer
is to some extent at the same time an investment project as the supplier develops new
techniques then. So even the full model of investment portfolios must cover commercial
project
15

According to keyser, leonid & jonathan W.Lewellen (2005),
The Capital Asset Pricing Model (CAPM), which relates the risk of an
individual security to its expected return, is frequently cited in investments textbooks
and the academic literature as a centerpiece of modem finance theory. The main
prediction of the CAPM is that investors are compensated in the form of expected return
only for bearing systematic or market risk, which is the portion of a security's risk that
cannot be diversified away. That investors demand reparation for and only for
systematic risk is a consequence from the pivotal assumption that all investors have
identical information for the entire universe of publicly traded securities. In actuality,
professional active money managers rarely invest in a portfolio broad enough to be
considered the market portfolio. Instead, the asset management industry has self-
organized over time according to a top-down investment process, where asset allocators
provide capital to security selectors who specialize in high-yield bonds, large-cap value
stocks, and the like. Any losses in diversification benefits resulting from this
theoretically suboptimal two-phase investment strategy are deemed an unavoidable cost
of obtaining accurate forecasts through specialization in security analysis and portfolio
management.
According to Alex Kane, Alan J. Marcus, and Robert R. Trippi (1999),
Active portfolio management is commonly partitioned into two types of
activities: market timing, which requires forecasts of broad-based market movements,
and security analysis, which requires the selection of individual stocks that are
perceived to be underpriced by the market. Robert Merton and others have provided an
insightful and easily implemented means to place a value on market timing and
fundamental analysis skills. While a normative theory of stock selection was outlined in
1973 by Jack Treynor and Fischer Black, no convenient means of valuing potential
selection ability has yet been devised. In this article the authors present a framework for
estimating the value of security analysis, be it by human or computer.
16
CHAPTER – III
INDUSTRY PROFILE&
COMPANY PROFILE
INDUSTRY PROFILE
Security market and Capital market
17

There are 22 stock exchanges in India, the first being the Bombay Stock
Exchange (BSE), which began formal trading in 1875, making it one of the oldest in Asia.
Over the last few years, there has been a rapid change in the Indian securities market,
especially in the secondary market. Advanced technology and online-based transactions
have modernized the stock exchanges. In terms of the number of companies listed and
total market capitalization, the Indian equity market is considered large relative to the
country’s stage of economic development. The number of listed companies increased
from 5,968 in March 1990 to about 10,000 by May 1998 and market capitalization has
grown almost 11 times during the same period.
Trading practices were not transparent, and there was a large amount of insider
trading. Recognizing the importance of increasing investor protection, several measures
were enacted to improve the fairness of the capital market. The Securities and Exchange
Board of The debt market, however, is almost nonexistent in India even though there has
been a large volume of Government bonds traded. Banks and financial institutions have
been holding a substantial part of these bonds as statutory liquidity requirement. The
portfolio restrictions on financial institutions’ statutory liquidity requirement are still in
place. A primary auction market for Government securities has been created and a
primary dealer system was introduced in 1995. There are six authorized primary dealers.
Currently, there are 31 mutual funds, out of which 21 are in the private sector. Mutual
funds were opened to the private sector in 1992. Earlier, in 1987, banks were allowed to
enter this business, breaking the monopoly of the Unit Trust of India (UTI), which
maintains a dominant position. Before 1992, many factors obstructed the expansion of
equity trading. Fresh capital issues were controlled through the Capital Issues Control
Act.
India (SEBI) was established in 1988. Despite the rules it set, problems continued
to exist, including those relating to disclosure criteria, lack of broker capital adequacy,
and poor regulation of merchant bankers and underwriters. There have been significant
reforms in the regulation of the securities market since 1992 in conjunction.
With overall economic and financial reforms. In 1992, the SEBI Act was enacted
giving SEBI statutory status as an apex regulatory body. And a series of reforms was
introduced to improve investor protection, automation of stock trading, integration of
national markets, and efficiency of market operations. India has seen a tremendous
change in the secondary market for equity. Its equity market will most likely be 18
comparable with the world’s most advanced secondary markets within a year or two. The
key ingredients that underlie market quality in India’s equity market are
• Exchanges based on open electronic limit order book;
• Nationwide integrated market with a large number of informed traders and
fluency of short or long positions; and
• No counterparty risk.
Among the processes that have already started and are soon to be fully
implemented are electronic settlement trade and exchange-traded derivatives. Before
1995, markets in India used open outcry, a trading process in which traders shouted and
hand signaled from within a pit. One major policy initiated by SEBI from 1993 involved
the shift of all exchanges to screen-based trading, motivated primarily by the need for
greater transparency. The first exchange to be based on an open electronic limit order
book was the National Stock Exchange (NSE), which started trading debt instruments in
June 1994 and equity in November 1994. In March 1995, BSE shifted from open outcry
to a limit order book market. Currently, 17 of India’s stock exchanges have adopted open
electronic limit order.
Before 1994, India’s stock markets were dominated by BSE. In other parts of the
country, the finding capital market: recent developments and policy issues 113 financial
industry did not have equal access to markets and was unable to participate in forming
prices, compared with market participants in Mumbai (Bombay). As a result, the prices in
markets outside Mumbai were often different from prices in Mumbai. These pricing errors
limited order flow to these markets. Explicit nationwide connectivity and implicit
movement toward one national market has changed this situation (Shah and Thomas,
1997). NSE has established satellite communications which give all trading members of
NSE equal access to the market. Similarly, BSE and the Delhi Stock Exchange are both
expanding the number of trading terminals located all over the country. The arbitrages are
eliminating pricing discrepancies between markets. Despite these big improvements in
microstructure, the Indian capital market has been in decline during the last three years.
The amount of capital issued has dropped from the level of its peak year, 1994/95, and so
have equity prices. In 1994/95, Rs276 billion was raised in the primary equity market.
This figure fell to Rs208 billion in 1995/96 and to Rs142 billion in 1996/97. The BSE-30
index or Sensex, the sensitivity index of equity prices, peaked at 4,361 in September 1994
19
and fell during the following years. A leading cause was that financial irregularities and
overvaluations of equity prices in the earlier years had eroded public confidence in
corporate shares. Also, there was a reduced inflow of foreign investment after the
Mexican and Asian financial crises. In a sense, the market is now undergoing a period of
adjustment. Thus, it is time for regulatory authorities to make greater efforts to recover
investors’ confidence and to further improve the efficiency and transparency of market
operations.
The Indian capital market still faces many challenges if it is to promote more
efficient allocation and mobilization of capital in the economy. First, market infrastructure
has to be improved as it hinders the efficient flow of information and effective corporate
governance. Accounting standards will have to adapt to internationally accepted
accounting practices. The court system and legal mechanism should be enhanced to better
protect small shareholders’ rights and their capacity to on it or corporate activities.
Second, the trading system has to be made more transparent.
Stock market primary market
Since 1991/92, the primary market has grown fast as a result of the removal of
investment restrictions in the overall economy and a repeal of the restrictions imposed
by the Capital Issues Control Act. In 1991/92, Rs62.15 billion was raised in the primary
market. This figure rose to Rs276.21 billion in 1994/95. Since 1995/1996, however,
smaller amounts have been raised due to the overall downtrend in the market and tighter
entry barriers introduced by SEBI for investor protection.
Equity price
For the past 12 years, equity prices have seen two extended periods of declining
prices and two periods of rising prices. Between April 1986 and March 1988, Sensex
decreased from 589 to 398, or by 32 percent. Prices also fell between March 1992, when
the monthly closing level of Sensex was 4,258, and April 1993, when the level was
2,122, a decline of 50.5 percent. Prices generally rose for extended periods from March
1988 to March 1992 and from May 1993 to August 1994. The monthly closing level of
Sensex climbed from 398 in March 1988 to 4,285 in March 1992, an increase of more
than 10 times. In the second period of extended rising equity prices, Sensex increased
20
1.16 times. Since 1995, it has fluctuated around the 3,000-4,000 mark In April 1998,
it hovered around 3,000. In the period of declining prices, from August 1994 to March
1998, the price-earnings (P/E) ratio fell more sharply than prices (Figure 1). In March
1998, the monthly average Sensex P/E ratio was 15.65 while the figure for October
1993 was 38.76.
Risk Management System
SEBI has taken several measures to improve the integrity of the secondary
market. Legislative and regulatory changes have facilitated the corporatization of
stockbrokers. Capital adequacy norms have been prescribed and are being enforced. A
mark-to-market margin and intraday trading limit have also been imposed. Further, the
stock exchanges have put in place circuit breakers, which are applied in times of
excessive volatility. The disclosure of short sales and long purchases is now required at
the end of the day to reduce price volatility and further enhance the integrity of the
secondary market.
Mark-to-market margin and intraday limit
Under the current clearing and settlement system, if an Indian investor buys and
subsequently sells the same number of shares of stock during a settlement period, or
sells and subsequently buys, it is not necessary to take or deliver the shares. The
difference between the selling and buying prices can be paid or received. In other
words, the squaring-off of the trading position during the same settlement period results
in non delivery of the shares that the. A short-term and speculative investment is thus
possible at a relatively low cost. FIIs and domestic institutional investors are, however,
not permitted to trade without delivery, since non delivery transactions are limited only
to individual investors. One of SEBI’s primary concerns is the risk of settlement chaos
that may be caused by an increasing number of non delivery transactions as the stock
market becomes excessively speculative. Accordingly, SEBI has introduced a daily
mark-to-market margin and intraday trading limit. The daily mark-to market margin is a
margin on a broker’s daily position. The intraday trading limit is the limit to a broker’s
intraday trading volume. Every broker is subject to these requirements. Each stock
exchange may take any other measures to ensure the safety of the market. BSE and NSE
impose on members a more stringent daily margin, including one based on
concentration of business. A daily mark-to-market margin is 100 percent of the notional
21
loss of the stockbroker for every stock, calculated as the difference between buying or
selling price and the closing price of that stock at the end of that day. However, there is
a threshold limit of 25 percent of the base minimum capital plus additional capital kept
with the stock exchange or Rs1 million, whichever is lower. Until the notional loss
exceeds the threshold limit, the margin is not payable. This margin is payable by a
stockbroker to the stock exchange in cash or as a bank guarantee from scheduled
commercial bank, on a net basis. It will be released on the pay-in day for the settlement
period. The margin money is held by the exchange for 6-12 days.This costs the broker
about 0.4-1.2 percent of the notional loss, assuming that the broker’s funding cost is
about 24-36 percent (Endo 1998). Thus, speculative trading without the delivery of
shares is no longer cost-free.
Each broker’s trading volume during a day is not allowed to exceed the intraday
trading limit. This limit is 33.3 times the base minimum capital deposited with the
exchange on a gross basis, i.e., purchase plus sale. In the event of brokers wishing to
exceed this limit, they have to deposit additional capital with the exchange and this
cannot be withdrawn for six months.
Circuit Breaker
SEBI has imposed price limits for stocks whose market prices are above Rs10
up to Rs20, a daily price change limit and weekly price change limit of 25 percent. BSE
imposes price limits as a circuit breaker system to maintain the orderly trading of shares
on the exchange. BSE’s computerized trading system rejects buy or sell orders of a
stock at prices outside the price limits. The daily price limit of a stock is measured from
the stock’s closing price in the previous trading session. The weekly price limit is based
on its closing price of the last trading in the previous week, usually its closing price on
the previous Friday.
Short sales and long purchases
SEBI regulates short selling in the stock market by requiring all stock exchanges to
enforce reporting by members of their net short sale and long purchase positions in each
stock at the end of each trading day.
22
Stock Lending
A scheme for regulating stock lending was introduced in February 1997,
following changes in tax regulations. Stock lending can take place through an
intermediary registered for this purpose with SEBI, and which has a minimum capital of
Rs500 million. Lenders and borrowers of securities have to enter into agreements with
the intermediary. Stock lending facilitates the timely settlement of transactions on the
stock exchanges, especially in an environment where physical delivery of certificates is
required for settlement
Stockbrokers
Most stockbrokers in India are still relatively small. They cannot afford to
directly cover every retail investor in a geographically vast country and in such a
complex society. Thus, they are permitted to transact with sub brokers as the latter play
an indispensable role in intermediating between investors and the stock market.
An applicant for a sub broker certificate must be affiliated with a stockbroker of
a recognized stock exchange. A sub broker application may take the form of sole
proprietorship, partnership, or corporation. There are two major issues concerning sub
broker sin the Indian capital market:
• Majority of sub brokers are not registered with SEBI;
• The function of the sub broker is not clearly defined. No sub broker is
supposed to buy, sell, or deal in securities, without a certificate granted by SEBI.
Nevertheless, there were only about 2,593 sub brokers registered with SEBI as of end-
June 1997, while the number of stock sub brokers in India was estimated in the range of
50,000 to 200,000 (Endo, 1998).The Indian law defines a sub broker as any person, not
being a member of a stock exchange, who acts on behalf of a stockbroker as an agent, or
otherwise, to assist the investors in buying, selling, or dealing securities through such a
stockbroker. Based on this definition, the sub broker is either a stockbroker’s agent or
an arranger for the investor. Thus, legally speaking, the stockbroker as a principal will
be responsible to the investor for a sub broker’s conduct if a sub broker acts as his or
her agent. However, the market practice is different from this legally defined
relationship. In reality, the stockbroker, in general, issues a contract note of a
transaction even to a registered sub broker, thus treating the latter as counterparty. This
implicitly denies the stockbroker’s privities with the investor. NSE does not officially
23

allow its members to transact with end-investors through a sub broker. This is probably
because NSE has liberal membership criteria
And its computerized trading network can easily provide geographically
scattered stockbrokers with direct access to trading on NSE. Nevertheless, many trading
members of NSE have been using registered and unregistered subbrokers. To sort out
this confusion, SEBI enforced the following measures in March 1997:
• Initiation of criminal actions on complaints received against unregistered sub-
brokers in suitable cases;
• Revival of the institution of “remises” under rules and by laws of the stock
exchanges;
• Prohibition of stockbrokers in dealing with unregistered sub brokers or
unregistered remise sifter 1 June 1997 (this deadline was later extended to 1 July
1997).In spite of these actions, the confusion has remained. There is a need to address
the basic issue of clarifying the role of the sub broker and to operationally define its
relationship with the stockbrokers.
Merchant Bankers
Under the old regulations, there were four categories of registered merchant
bankers with different minimum net worth requirements. Under the new regulations, the
categories were abolished. Among other provisions, a merchant banker applicant is
required to have a minimum net worth of Rs50 million. The new regulations have
drawn a clear-cut line between the merchant banker and the nonbanking finance
company (NBFC). Under the old regulations, a merchant banker is permitted to carry
out fund based activities such as deposit-taking, leasing, bill discounting and hire-
purchasing. The new regulations no longer allow a merchant banker to engage in these
fund-based activities except for those related exclusively to the capital market such as
underwriting. The merchant banker is required to cease such activities within two years.
Correspondingly, an existing NBFC performing merchant banking activities is required
to relinquish such activities after a certain period of time. The merchant banking
industry in India has many problems, the main ones being that there are too many
merchant bankers, and that they are considered to be relatively incompetent. Only 20
merchant bankers account for 60-85 per cent of the merchant banking business, while
148 of them are in business only on paper. In May 1997, a substantial number of
merchant bankers were found to be professionally imprudent or negligent (Endo 1998). 24

SEBI listed 134 merchant bankers of Categories I, II, and III who broke their
underwriting commitments for possible disciplinary actions. Of this number, 95 were in
Category I. Furthermore, there have been records of listing delay or rejection of initial
public offerings (IPOs) in the recent past.
Fragmentation of regulatory authorities
The present functions and powers of regulatory agencies for the securities
market seem to be fragmented. SEBI is the primary body responsible for regulation of
the securities market, deriving its powers of registration and enforcement primarily from
the SEBI Act. There was an existing regulatory framework for the securities market,
provided by the Securities Contract Regulation (SCR) Act and the Companies Act,
administered by the Ministry of Finance and the Department of Company Affairs
(DCA) of the Ministry of Law, respectively. SEBI has been delegated most of the
functions and powers under the SCR Act, and shares the rest with the Ministry of
Finance. It has also been delegated certain powers under the Companies Act. RBI also
has regulatory involvement in the capital market regarding foreign exchange control
liquidity support to market participants and debt management through primary dealers.
It is RBI and not SEBI that regulates primary dealers in the Government securities
market. However, securities transactions that involve a foreign exchange transaction
need the permission of RBI. So far, fragmentation of the regulatory authorities has not
been a major obstacle to effective regulation of the securities market. Rather, lack of
enforcement capacity by SEBI has been a more significant cause of poor regulation. But
since the Indian stock markets are rapidly being integrated, the authorities may follow
the global trend of consolidation of regulatory authorities or better coordination among
them.
Market Stock
Fragmented market
25
Of the 22 stock exchanges in the country, 17 have introduced screen-based
trading. With the expansion of trading networks of BSE and other stock exchanges
beyond their original jurisdictions, an increasing number of investors in different parts
of the country are within the reach of a national market system. This has raised
informational efficiency and helped rapid market integration. NSE, which provides a
screen-based order driven system, has already extended its network to more than 100
centers in the country that are connected to its central computer via its satellite network.
The Over-the-Counter Exchange of India (OTCEI)
Provides a nationwide electronic system for trading relatively smaller stocks.
BSE has introduced its own screen-based quote-driven trading system. However, the
market is still fragmented and needs further integration. The international trend is to
consolidate and merge existing stock exchanges rather than to set up new ones. In the
UK, there were about 20 stock exchanges
In the late 1960s, which were reduced to about half a dozen in 1972 and further
down to one, i.e., the London Stock Exchange, in 1986. NSE has already provided
connectivity to more than 100 cities, and other major stock exchanges are in the process
of extending their trading terminals outside their places of operation. Thus, it is
questionable whether India needs as many as 22 stock exchanges, even taking into
account the vastness of the country.
Transaction Costs in the Secondary Market
Screen-based trading introduces a greater degree of transparency and reduces
spreads. Market manipulation becomes more difficult with screen-based trading and
easier to investigate on account of the transparent audit trails that are established. As
estimated by Shah and Thomas (1997), the total transaction costs in India’s equity
market have been reduced by half, i.e., from 5 to 2.5 percent since the introduction of
screen-based trading (Table 8). But this is still high compared to advanced markets.
When depository, derivatives, and indexation are fully in place, the transaction costs of
the Indian equity market could be even lower than those of most advanced countries.
Debt Market
26
The debt market is not well developed in India. Even though the volume of
Government bonds outstanding is large, banks and other financial institutions hold a
substantial part of these bonds as liquidity requirement. The statutory liquidity
requirement (on top of cash requirement of 10 percent) has been reduced from 25 to 23
percent. But this is still high and should be further decreased to activate the private debt
market.
Mark-to-market
Banks tend to hold Government securities to maturity to avoid a capital loss on
the balance sheet. Until 1996, only 40 percent of the portfolio of Government securities
had to be marked-to-market. Starting fiscal year 1996/97, the requirement has been
raised to 50 percent for existing banks and 100 percent for the new private sector banks.
The pattern of ownership of Government securities is shown in Table 9. The biggest
holders of both central and state Government securities are commercial banks, with
more than two thirds of the total. Life insurance companies have also increased their
holdings of Government securities. Banks and life insurance companies are captive
markets for Government securities due to the portfolio restrictions imposed on them.
Meanwhile, the market for private companies’ debentures is not yet well developed.
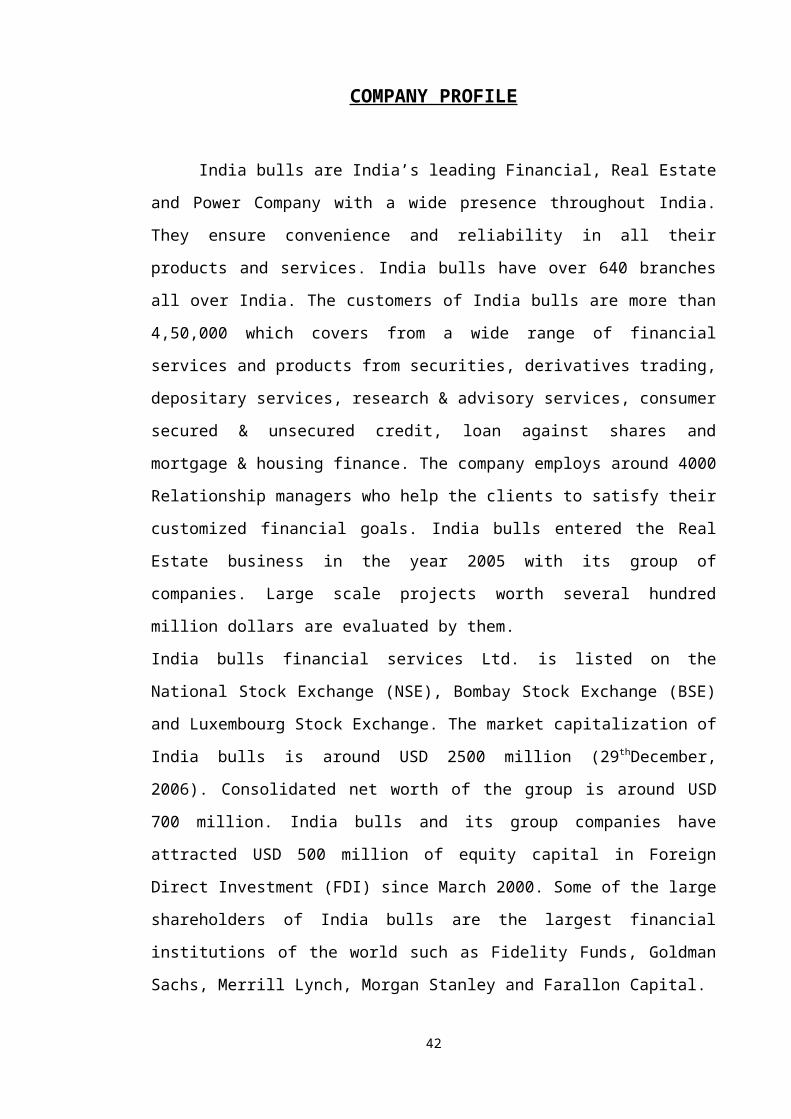
COMPANY PROFILE27
India bulls are India’s leading Financial, Real Estate and Power Company with a
wide presence throughout India. They ensure convenience and reliability in all their
products and services. India bulls have over 640 branches all over India. The customers
of India bulls are more than 4,50,000 which covers from a wide range of financial
services and products from securities, derivatives trading, depositary services, research
& advisory services, consumer secured & unsecured credit, loan against shares and
mortgage & housing finance. The company employs around 4000 Relationship
managers who help the clients to satisfy their customized financial goals. India bulls
entered the Real Estate business in the year 2005 with its group of companies. Large
scale projects worth several hundred million dollars are evaluated by them.
India bulls financial services Ltd. is listed on the National Stock Exchange (NSE),
Bombay Stock Exchange (BSE) and Luxembourg Stock Exchange. The market
capitalization of India bulls is around USD 2500 million (29thDecember, 2006).
Consolidated net worth of the group is around USD 700 million. India bulls and its
group companies have attracted USD 500 million of equity capital in Foreign Direct
Investment (FDI) since March 2000. Some of the large shareholders of India bulls are
the largest financial institutions of the world such as Fidelity Funds, Goldman Sachs,
Merrill Lynch, Morgan Stanley and Farallon Capital.
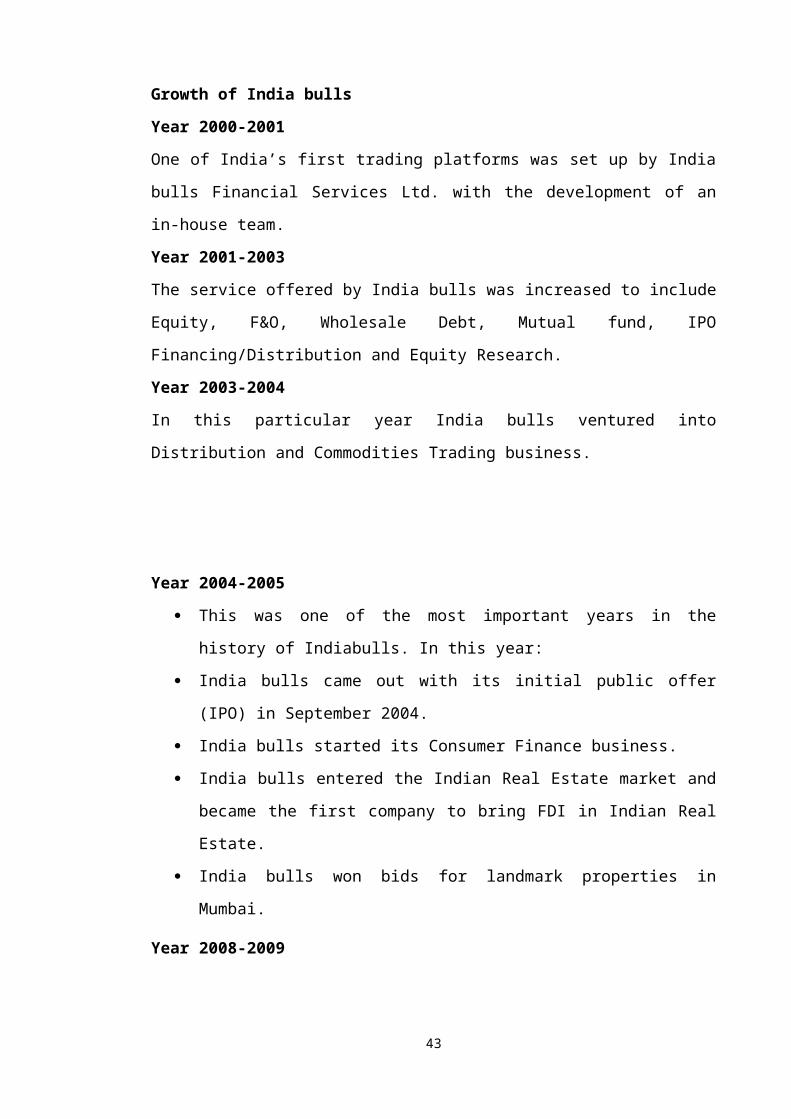
Growth of India bulls
Year 2000-2001
One of India’s first trading platforms was set up by India bulls Financial Services Ltd.
with the development of an in-house team.
Year 2001-2003
The service offered by India bulls was increased to include Equity, F&O, Wholesale
Debt, Mutual fund, IPO Financing/Distribution and Equity Research.
Year 2003-2004
In this particular year India bulls ventured into Distribution and Commodities Trading
business.
Year 2004-2005
28
This was one of the most important years in the history of Indiabulls. In this
year:
India bulls came out with its initial public offer (IPO) in September 2004.
India bulls started its Consumer Finance business.
India bulls entered the Indian Real Estate market and became the first company
to bring FDI in Indian Real Estate.
India bulls won bids for landmark properties in Mumbai.
Year 2008-2009
Several developments across its group companies have propelled India bulls
forward and are expected to continue to power the rise of this conglomerate. India bulls
financial services limited has recently signed a joint venture agreement with sogecap,
the insurance arm of Society General (SocGen) for its upcoming life insurance venture.
At the same time it has also signed a Memorandum of understanding with
MMTC.
On the asset management front, the company has received formal approval from SEBI
and is expected to shortly launch its first NFO.
India bulls enter in to Public issue for his India bulls power Ltd.
Promoters for India bulls
Sameer Gehlaut, Rajiv Rattan and Saurabh Mittal are the promoters of India bulls
Financial Services Ltd. While Sameer Gehlaut will have a 23.0% stake in the company
post the IPO, Rajiv Rattan and Saurabh Mittal will have a post issue holding of 11.5%
and 10.1% respectively.
All the three promoters of the company are engineering graduates while Saurabh
Mittal is a management graduate as well.
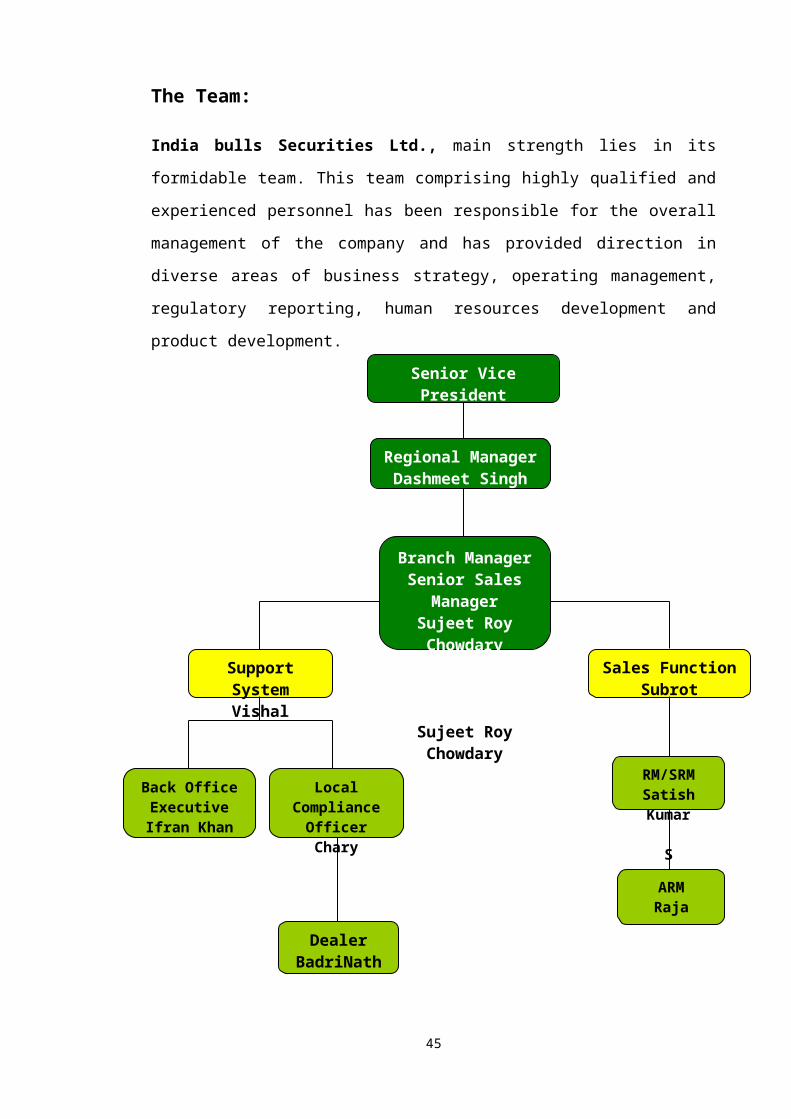
The Team:
29
Senior Vice PresidentYuv Raj Singh
Regional ManagerDashmeet Singh
Branch ManagerSenior Sales
ManagerSujeet Roy Chowdary
Sujeet Roy Chowdary
Support SystemVishal
Sales FunctionSubrot
RM/SRMSatish Kumar
S
ARMRaja
Local Compliance
OfficerChary
Back OfficeExecutive
Ifran Khan
DealerBadriNath
India bulls Securities Ltd., main strength lies in its formidable team. This team
comprising highly qualified and experienced personnel has been responsible for the
overall management of the company and has provided direction in diverse areas of
business strategy, operating management, regulatory reporting, human resources
development and product development.
30
Vision statement: To become the preferred long term financial partner to a wide base
of customers whilst optimizing stake holder’s value
Mission statement: To establish a base of 1 million satisfied customers by 2010. We
will create this by being a responsible and trustworthy partner
Corporate action: An Approach to Business that reflects Responsibility, Transparency
and Ethical Behavior. Respect for Employees, Clients & Stakeholder groups
India bulls Group entities in India
India bulls Capital Services Ltd.
India bulls Commodities Pvt. Ltd.
India bulls Credit Services Ltd.
India bulls Finance Co. Pvt. Ltd
India bulls Housing Finance Ltd.
India bulls Insurance Advisors Pvt. Ltd.
India bulls Resources Ltd.
India bulls Securities Ltd.
India bulls Power Ltd.31
Reasons to choose India bulls Securities Ltd:
The India bulls Financial Services stock is the best performing stock in the
MSCI Index – the global benchmark for equity investment person who bought India
bulls shares in the IPO at Rs. 19 (US$ 0.48) in September 2004 has been rewarded
almost 100 times in three and a half years – a feat unparalleled in the history of Indian
capital markets.
India bulls Real Estate Limited partnered Farallon Capital Management LLC of
the US to bring the first Foreign Direct Investment into real estate
Six Reasons why investing with India bulls Securities Limited is smarter
1) Customization: Formulates investment plans based on customer individual
requirements
2) Expertise: Brings within customer reach, about institutional expertise and companies
valuable understanding of the financial markets
3) One-stop shop: Caters to all customers’ investment needs under one roof.
4) Trust: Enjoys the pedigree of India bulls Securities Ltd and share its expertise in
financial services.
5) Personalized service: Helps customer through the entire investment process, step by
step, with innovative and efficient services.
6) Unbiased & Objective advice: We partner you in your investment process, with our
team of expert investment advisors
Products provided
Power India bulls
An online trading system designed for the high-volume trader. The platform provides
enhanced trade information and executes orders on an integrated software based trading
platform.
India bulls financial service offers:
32
SME finance
Mortgage loans
Commercial vehicle loans
Farm equipment loans
Commercial credit loans
Loan against shares and
Third part distribution of insurance products.
Broking: Equity, Derivatives, Commodities, Currency Derivatives.
Distribution: Mutual funds, IPO’s, Home loans, Insurance.
Divisions:
Investment Advisory and Broking? Division
Project Syndication Division?
Institutional Equity Broking? Division
Institutional Debt Broking? Division
Retail Offerings:
Wealth Management Services
Portfolio Management Services
Securities Broking-Equities and derivatives
Depository & Custodial Service & Distribution of financial Products.
Services:
India bulls securities provide a wide range of services that include:
33
Power India bulls: An online trading system designed for the high-volume trader. The
platform provides enhanced trade information and executes orders on an integrated
software based trading platform.
1) Equities,
2) Commodities,
3) Wholesale debts,
4) Futures and options,
5) Depository services,
6) Equity research services,
7) Post Trade – Custodian,
8) Depository Services,
9) Payment Gateway,
10) Other back office support,
Online Banks Tie-ups for trading:
Company having online transaction tie-ups with banks like,
HDFC BANK,
ICICI BANK,
IDBI BANK,
CITI BANK.
Company competitors
Kotak Securities Ltd,
ICICI Securities Ltd,
HDFC Securities Ltd,
Religare Securities Ltd,
34
Birla Money,
Indiainfoline Ltd
Company Achievements
The India bulls Group is one of the top fifteen conglomerates in the country with
businesses in several significant sectors.
The India bulls Financial Services stock is the best performing stock in the MSCI Index
– the global benchmark for equity investments.
India bulls Real Estate Limited partnered Farallon Capital Management LLC of the US
to bring the first Foreign Direct Investment into real estate.
India bulls Financial Services Limited was accorded the highest rating P1+ for
short term debt and the highest rating of AAA (SO) by CRISIL for loan receivables
securitization while India bulls Securities Limited is the only broker in India to be
assigned CRISIL’s highest broker quality grading of BQ1.
In December 2007, India bulls acquired Pyramid Retail including Piramyd
Megastores and Trumart, their chain of lifestyle and convenience outlets
The Board of Directors
Mr.SameerGehalaut Chairman & CEO
GaganBanga Executive Director
Rajiv Rattan CEO
Shamsher Singh Director
Aishwaryakatoch Director
Karan Singh Director
PremPrakashMird Director
Saurabh K Mittal Executive Director
Amith Jain Company Secretary
35
CHAPTER - IV36
DATA ANALYSISAND
PRESENTATION
DATA ANALYSIS & INTERPRETATION
Return
A major purpose of investment is to get a return or income on the funds
invested. On a bond an investor expects to receive interest. On a stock, dividends may
be anticipated. The investor may expect capital gains from some investments and rental
income from some investments and rental income from house property. Return may
take several forms.
Measurement of Return
The purpose of investment is to get a return or income on the funds invested in
different financial assets. The most important characteristics of financial assets are the
size and variability of their future returns. Since the return on years many methods were
adopted for quantifying returns.
In this study I considered only prices but not dividend in the calculation
return because the investor’s main motive to invest in shares is makes the profit from
37
changes in prices of shares. That’s why I calculated return from the prices of the shares
only.
Return = (P1 – P0)/P0
Where: P1 = Closing price of the share
P0 = Opening price of the share
In this Chapter I show the returns for each unit wise and industry wise
Returns for banking industry
Return = (P1 – P0)/P0
Where: P1 = Closing price of the share
P0 = Opening price of the share
In this Chapter I show the returns for each unit wise and industry wise
Table No. 1
Andhra Bank HDFC Bank Ltd. Oriental Bank of Commerce
Date Open Close Return Open Close Return Open Close Return
Jan-12 93 92.85 -0.16 710.9 762.55 7.27 271.5 250.45 -7.75
Feb-12 93.85 87.6 -6.66 767.9 736.05 -4.15 251.1 240.9 -4.06
Mar-12 87.9 80.8 -8.08 738 773.5 4.81 240 235.85 -1.73
Apr-12 81.15 80 -1.42 765 826.6 8.05 237.8 233.05 -2.00
May-12 83 72.25 -12.95 835 740.2 -11.35 234.9 202.15 -13.94
Jun-12 72.95 62.5 -14.32 740 791.15 6.91 200.9 170.4 -15.18
Jul-12 64.9 73.9 13.87 740 795.05 7.44 165 176.45 6.94
Aug-12 74.4 87.35 17.41 790.05 853.15 7.99 177 193.65 9.41
Sep-12 87.5 95.25 8.86 840 926 10.24 194 271.65 40.03
Oct-12 94.5 93.3 -1.27 912 1,004.05 10.09 270 257 -4.81
Nov-12 92.15 89.45 -2.93 1,017.00 1,118.40 9.97 258.95 245.5 -5.19
Dec-12 90 86.6 -3.78 1,122.00 1,069.75 -4.66 247 226.5 -8.3038
State Bank of India ICICI Bank Ltd. UTI Bank Ltd.
Date Open Close Return Open Close Return Open Close Return
Jan-12 909.8 886.8 -2.53 586.25 609.15 3.91 292.00 337.15 15.46
Feb-12 890 877.2 -1.44 610.00 615.10 0.84 334.05 328.35 -1.71
Mar-12 880 968.05 10.01 619.00 589.25 -4.81 327.00 356.35 8.98
Apr-12 968.5 913.65 -5.66 592.00 590.25 -0.30 330.05 347.05 5.15
May-12 917 831 -9.38 605.00 536.05 -11.40 355.00 285.80 -19.49
Jun-12 839 727.4 -13.30 545.00 487.40 -10.57 292.00 266.75 -8.65
Jul-12 734 810.05 10.36 488.05 554.05 13.52 272.00 297.85 9.50
Aug-12 800 930 16.25 551.00 596.50 8.26 298.50 342.90 14.87
Sep-12 928 1,028.30 10.81 585.10 699.05 19.48 342.00 379.20 10.88
Oct-12 1,011.00 1,095.50 8.36 700.00 776.85 10.98 380.10 433.75 14.11
Nov-12 1,095.00 1,314.00 20.00 777.00 871.45 12.16 436.00 474.05 8.73
Dec-12 1,314.00 1,245.90 -5.18 875.00 890.40 1.76 479.45 469.05 -2.17
Canara bank Vijaya bank Union bank
Date Open Close Return Open Close Return Open Close Return
Jan-12 243 249.15 2.53 61.4 61.25 -0.24 123.10 123.90 0.65
Feb-12 251 286.15 14.00 62.2 57.2 -8.04 125.00 122.20 -2.24
Mar-12 286.5 266.9 -6.84 57.5 52.55 -8.61 122.80 121.85 -0.77
Apr-12 267.95 254.1 -5.17 53 53.2 0.38 124.00 116.85 -5.77
May-12 256.3 229.25 -10.55 53.7 43.9 -18.25 119.80 107.00 -10.68
Jun-12 232 200.8 -13.45 45.8 39.5 -13.76 108.00 90.40 -16.30
Jul-12 201.1 196.65 -2.21 40 41.95 4.88 91.40 102.05 11.65
Aug-12 198.5 221.2 11.44 42 47.05 12.02 102.50 116.90 14.05
Sep-12 223 284.15 27.42 47.55 56.7 19.24 117.80 136.35 15.75
Oct-12 287.9 294 2.12 57 57.2 0.35 136.80 129.50 -5.34
Nov-12 297.8 297.75 -0.02 57.15 51.15 -10.50 130.70 128.65 -1.57
Dec-12 301 276.2 -8.24 52.45 47.1 -10.2 129.00 122.65 -4.92
39
Indian Overseas Bank Punjab National Bank Bank of Baroda
Date Open Close Return Open Close Return Open Close Return
Jan-12 94.00 111.85 18.99 468.8 465.55 -0.69 128.5 129.75 0.97
Feb-12 114.00 101.85 -10.66 466 441.3 -5.30 131 133.65 2.02
Mar-12 102.00 96.95 -4.95 441 471.2 6.85 132.55 132 -0.41
Apr-12 96.95 99.40 2.53 472 433.05 -8.25 133 124.1 -6.69
May-12 103.00 84.25 -18.20 437 405.4 -7.23 126 114.05 -9.48
Jun-12 86.00 84.10 -2.21 414.95 325.55 -21.55 115.4 101.9 -11.70
Jul-12 84.00 89.65 6.73 329.4 380.2 15.42 102 110.9 8.73
Aug-12 90.00 92.00 2.22 380 469.75 23.62 110.5 142.65 29.10
Sep-12 92.00 109.40 18.91 465 526.2 13.16 141 162.15 15
Oct-12 110.00 118.15 7.41 527 518.45 -1.62 162.15 173.6 7.06
Nov-12 118.50 118.15 -0.30 524.8 544.75 3.80 174 200.95 15.49
Dec-12 119.00 110.70 -6.97 552 506.95 -8.16 202.8 207.9 2.51
Bankex
Date Open Close Return
Jan-12 5,124.09 5,254.89 2.55
Feb-12 5,267.88 5,204.69 -1.20
Mar-12 5,180.14 5,265.24 1.64
Apr-12 5,269.08 5,245.79 -0.44
May-12 5,252.40 4,769.87 -9.19
Jun-12 4,772.41 4,348.79 -8.88
Jul-12 4,311.56 4,781.14 10.89
Aug-12 4,772.39 5,308.01 11.22
Sep-12 5,301.98 6,038.87 13.90
Oct-12 6,044.05 6,484.06 7.28
Nov-12 6,486.64 7,179.71 10.68
Dec-12 7,183.78 7,085.73 -1.3640
Table No. 2 (Averages)
Andhra Bank
Oriental Bank of Commerce
HDFC Bank
SBI Bank ICICI Bank
UTI Bank
Canara Bank
-0.95 -0.55 4.38 3.19 3.65 4.64 0.92Vijaya Bank
Indian Overseas Bank
Bank of Baroda
Union Bank
Punjab NationalBank Bankex
-2.73 1.12 -0.23 -0.46 0.84 3.09
By and large, this study relates to twelve companies with a period of twelve
months. The above table is particularly concerned with the returns of above –mentioned
companies.
In the course of the study it has been revealed that the highest return with respect
to Oriental Bank of Commerce took place in the month of September 2012 to the tune
of 40.02
In contrast to this the lowest return with respect of Punjab National Bank took
place in the month of June2012 to the tune of –21.55.
When overall performance i.e. average return is taken in to consideration UTI
Bank (4.64) reached the first position. When it comes to the lowest returns Vijaya Bank
(-2.73) remained in the forefront.
As per the BANKEX given by BSE, the returns remain highest in the month of
September 2012(13.90) and the lowest in the month of May 2012 (-9.19). The average
return of State Bank of India is closely related to the average return of BANKEX
average return. Totally eight banks are noted less average return than BANKEX and
remaining four banks are noted high average return than it
Returns for Automobile Industry
Return = (P1 – P0)/P0
Where: P1 = Closing price of the share
P0 = Opening price of the share
Table No. 3
41
Ashok Leyland Ltd. Bajaj Auto Ltd. Mahindra &Mahindra Ltd. Date Open Close Returns Open Close Return Open Close ReturnsJan-12 31.95 30.65 -4.07 2,015.00 2,154.25 6.91 512 558.5 9.08Feb-12 30.7 38.25 24.59 2,180.00 2,601.40 19.33 567.3 588.2 3.68Mar-12 38.5 40.25 4.55 2,625.00 2,746.85 4.64 590.15 627.1 6.26Apr-12 40.7 52.15 28.13 2,785.00 3,012.70 8.18 639.3 631.25 -1.26May-12 52.65 39.1 -25.74 3,040.00 2,744.90 -9.71 634 609.7 -3.83Jun-12 38 37.4 -1.58 2,825.00 2,736.85 -3.12 622 621.15 -0.14Jul-12 38.1 34.9 -8.4 2,736.00 2,473.65 -9.59 629 590.5 -6.12Aug-12 34.9 39.6 13.47 2,457.00 2,697.50 9.79 591 649.05 9.82Sep-12 39.9 45 12.78 2,700.00 2,998.20 11.04 652 680.5 4.37Oct-12 45.25 44 -2.76 3,014.00 2,751.05 -8.72 686 782.55 14.07Nov-12 44.2 42.55 -3.73 2,775.00 2,644.75 -4.69 790 821.05 3.93Dec-12 43 45.45 5.7 2,672.00 2,618.85 -1.99 826 905.85 9.67
Hero Honda Motors Tata Motor Ltd Punjab Tractors Ltd Date Open Close Returns Open Close Return Open Close ReturnsJan-12 860 856.15 -0.45 650 709.3 9.12 468.8 465.55 -0.69Feb-12 865 886.75 2.51 710 814.35 14.7 466 441.3 -5.3Mar-12 886 888.3 0.26 815 932.6 14.43 441 471.2 6.85Apr-12 899.9 844.9 -6.11 937 950.5 1.44 472 433.05 -8.25May-12 863 770.8 -10.68 959 789.7 -17.65 437 405.4 -7.23Jun-12 780 791.5 1.47 794.45 794.45 0 414.95 325.55 -21.55Jul-12 795 705.2 -11.3 801 739.75 -7.65 329.4 380.2 15.42Aug-12 709.7 720.3 1.49 737 845.15 14.67 380 469.75 23.62Sep-12 714.9 774.55 8.34 850 862.05 1.42 465 526.2 13.16Oct-12 778.5 756.15 -2.87 867.1 827.95 -4.52 527 518.45 -1.62Nov-12 762 742.65 -2.54 832 809.4 -2.72 524.8 544.75 3.8Dec-12 740 762.35 3.02 815 900.25 10.46 552 506.95 -8.16
42
Auto Industry
Date Open Close Returns
Jan-12 4,251.97 4,506.53 5.99
Feb-12 4,515.51 4,998.68 10.70
Mar-12 5,015.14 5,322.73 6.13
Apr-12 5,355.23 5,548.91 3.62
May-12 5,563.98 4,812.05 -13.51
Jun-12 4,837.71 4,753.58 -1.74
Jul-12 4,777.54 4,476.87 -6.29
Aug-12 4,477.06 4,944.95 10.45
Sep-12 4,949.63 5,365.72 8.41
Oct-12 5,380.05 5,357.22 -0.42
Nov-12 5,371.03 5,321.85 -0.92
Dec-12 5,321.75 5,518.50 3.70
Table No. 4 (Averages)
Ashok
Leyland
Ltd.
Bajaj Auto
Ltd.
Mahindra
&
Mahindra
Hero
Honda
Motors
Punjab
Tractors
Ltd.
Tata
Motors
Ltd.
Auto
index
3.57 1.83 4.13 -1.4 0.83 2.81 2.18
According to this industry six companies have been taken for the purpose of
analysis. Ashok Leyland has been seen as the only company to secure both highest and
lowest returns i.e.28.13 and-25.74 respectively.
When it comes to the average performance i.e. average returns Mahindra &
Mahindra (4.13) has the highest return and Hero Honda Motors (-1.4) hold the lowest.
Highest return of this industry for the taken period was in the month of February
2012 (10.70) and the lowest return was in the month of May 2012 (-13.51).
43

(This Industry returns are calculated from the auto index, which is maintaining by the
BSE.)
In the above table show that Bajaj auto average return is closely related to the
average return of Auto industry. Overall three companies are noted less average return
and two are noted high average return than industry average return.
Returns for I.T. Industry
Return = (P1 – P0)/P0
Where: P1 = Closing price of the share
P0 = Opening price of the share
Table No. 5
NIIT Wipro Infosystech.Ltd.Date Open Close Return Open Close Return Open Close ReturnJan-12 292.8 290.95 -0.63 464 529.9 14.2 3,000.00 2,879.70 -4.01Feb-12 297 252.15 -15.1 530 520.25 -1.84 2,890.00 2,828.60 -2.12Mar-12 250.5 296.4 18.32 520 558.55 7.41 2,825.00 2,980.85 5.52Apr-12 299.4 304.85 1.82 563 539 -4.26 3,006.00 3,177.50 5.71May-12 305.5 362.6 18.69 545 449.85 -17.46 3,185.00 2,908.05 -8.7Jun-12 366 367.35 0.37 452.8 513.75 13.46 2,950.00 3,077.55 4.32Jul-12 365 362.65 -0.64 514 491.3 -4.42 3,100.00 1,653.90 -46.65Aug-12 350.25 345.35 -1.4 490 517.9 5.69 1,660.00 1,808.80 8.96Sep-12 347 330.3 -4.81 516 525.1 1.76 1,807.00 1,847.90 2.26Oct-12 331 334 0.91 524.95 538.15 2.51 1,842.00 2,094.80 13.72Nov-12 339.75 444.3 30.77 540 598.95 10.92 2,109.70 2,180.45 3.35Dec-12 445.9 525.15 17.77 602 604.55 0.42 2,200.00 2,240.50 1.84
HCL Infosys Polaris software Ltd SatyamDate Open Close Return Open Close Return Open Close Return
44
Jan-12 274 244.25 -10.86 132.5 118.55 -10.53 740.7 746.65 0.8Feb-12 244 175.65 -28.01 119 109.2 -8.24 748 769.45 2.87Mar-12 176 183 3.98 109.3 117.2 7.23 768.5 849.2 10.5Apr-12 184 164.2 -10.76 117.65 109.9 -6.59 855 759.1 -11.22May-12 164 155.5 -5.18 111 85.95 -22.57 762.9 691.15 -9.4Jun-12 158 130.6 -17.34 89.75 73.95 -17.6 700 711.4 1.63Jul-12 131 141.7 8.17 74.5 98.2 31.81 715 755.25 5.63Aug-12 140.55 163.5 16.33 98.5 112 13.71 753 808.2 7.33Sep-12 163.55 144.45 -11.68 112.3 117.5 4.63 810 818.55 1.06Oct-12 146 129.1 -11.56 118.5 130.75 10.34 826 440.55 -46.67Nov-12 129.2 164.45 27.28 132 121.55 -7.92 441 459.25 4.14Dec-12 164.45 159.2 -3.19 122.95 172.85 40.59 460 483.95 5.21
I.T. Industry
Date Open Close Return
Jan-12 3,744.48 3,749.20 0.13
Feb-12 3,749.32 3,706.30 -1.15
Mar-12 3,702.89 4,030.29 8.84
Apr-12 4,048.39 4,034.92 -0.33
May-12 4,046.60 3,642.67 -9.98
Jun-12 3,674.89 3,743.32 1.86
Jul-12 3,750.71 3,951.13 5.34
Aug-12 3,943.91 4,286.42 8.68
Sep-12 4,277.66 4,393.56 2.71
Oct-12 4,408.61 4,821.98 9.38
Nov-12 4,828.75 5,107.22 5.77
Dec-12 5,130.37 5,272.56 2.77
45

Table No.6 (Averages)
NIIT Wipro Infosystech. Ltd. HCL Satyam Polaris Ltd. BSE I.T. Avg.
5.51 2.37 -1.32 -3.57 -2.34 2.90 2.84
According to this industry six companies have taken to analyze. Overall
Polaris Software Ltd. was noted higher return for the month of December 2012 as 40.59
and Satyam was noted lower return for the month of October 2012 as –46.67.
Highest return of this industry for the taken period was in the month of
October 2012 (9.38) and the lowest return was in the month of May 2012 (-9.98).
(This Industry returns are calculated from the IT INDEX, which is maintaining by the
BSE)
According to the average return NIIT was noted highest return as 5.51 and HCL
Infosystech Ltd. was noted lowest return as –3.57.
In the above table No. 6 show that Polaris average return is closely related to the
average return of IT INDUSTRY. Over all only two companies are more than the
Industry average returns.
Returns for Pharmaceutical Industry
Return = (P1 – P0)/P0
Where: P1 = Closing price of the share
P0 = Opening price of the share
Table No.7
Cipla Ltd. Ranbaxy Aurobindo pharma Ltd.Date Open Close Return Open Close Return Open Close ReturnJan-12 445 441.3 -0.83 364.4 399.1 9.52 413 538.45 30.37Feb-12 441 551.9 25.15 400 429.4 7.35 540 554.45 2.68Mar-12 552 661.95 19.92 431 431.6 0.14 560 682.75 21.92Apr-12 665 260.8 -60.78 435.95 472.6 8.4 682.5 723.9 6.07May-12 263.9 229.5 -13.04 504 411.5 -18.36 734 581.35 -20.8Jun-12 233 215.8 -7.38 412.5 356.4 -13.6 592 582.25 -1.65Jul-12 216.3 236 9.11 360 373.9 3.85 586 617.65 5.4Aug-12 236 249.95 5.91 374 406.8 8.77 626 624.8 -0.19Sep-12 251 262.25 4.48 406 439.9 8.34 625 628.4 0.54Oct-12 261.9 262.05 0.06 435.7 399.7 -8.26 630 609 -3.33
46
Nov-12 264 253.85 -3.84 401.15 372.3 -7.19 614.7 619.9 0.85Dec-12 257.15 250.7 -2.51 372.9 391.9 5.08 626 705.15 12.64
Dr. Reddy's Laboratories
Ltd. Sterl Biotech Work hard Ltd.Date Open Close Return Open Close Return Open Close ReturnJan-12 986 1,119.60 13.55 123.95 125.3 1.09 445.1 483.45 8.62Feb-12 1,125.00 1,302.85 15.81 125.1 120.4 -3.8 490 513.85 4.87Mar-12 1,299.55 1,420.30 9.29 122.5 124.7 1.76 515 506.65 -1.62Apr-12 1,435.00 1,431.85 -0.22 126 120.6 -4.29 510.95 446.25 -12.66May-12 1,450.00 1,357.40 -6.37 121.95 119.2 -2.26 446 360.15 -19.25Jun-12 1,389.95 1,274.00 -8.34 120 105.9 -11.75 364.8 380.1 4.19Jul-12 1,273.50 1,396.95 9.69 106 102.6 -3.25 388 342.7 -11.68Aug-12 1,375.05 720.5 -47.6 104 110.8 6.54 342.7 364.55 6.38Sep-12 723 731.3 1.148 111.15 145.4 30.77 368.95 401.5 8.82Oct-12 731 748.05 2.33 145.5 122.2 -16.01 404.8 388.95 -3.92Nov-12 709 750.8 5.9 123.9 167.7 35.35 390 372.2 -4.56Dec-12 755 811.2 7.44 166 192.5 15.96 376.5 350.4 -6.93
Pharma Index
Date Open Close Returns
Jan-12 3,103.76 3,290.65 6.02
Feb-12 3,290.95 3,553.78 7.99
Mar-12 3,549.54 3,858.10 8.69
Apr-12 3,867.08 3,894.84 0.72
May-12 3,973.37 3,387.94 -14.73
Jun-12 3,416.41 3,132.42 -8.31
Jul-12 3,136.32 3,227.22 2.90
Aug-12 3,234.52 3,538.50 9.40
Sep-12 3,543.77 3,684.44 3.97
Oct-12 3,680.87 3,641.60 -1.07
Nov-12 3,630.59 3,720.61 2.48
Dec-12 3,720.14 3,792.05 1.93
Table No .8 (Averages)
47
Cipla Ranbaxy Aurobhindo Dr. Reddy's Sterl biotech Work hard Index
-1.98 0.34 4.54 0.22 4.18 -2.31 1.67
According to this industry six companies have taken to analyze. Overall
STERL. Was noted highest return for the month of November 2012 as 35.35 and the
Cipla Ltd. was noted lowest return for the month of February 2012 as –60.78.
Highest return of this industry for the taken period was in the month of August
2012 (9.40) and the lowest was in the month of May 2012 (-14.73).
According to the average return AUROBINDO Pharma Ltd. was noted
highest return as 4.54 and Wockhardt was noted lowest return
Fluctuations in the prices of the selected shares in respect to industries
Market indexes have always been of great importance in the world of
security analysis and portfolio management. People from different walks of life use and
are affected by market indicators. Investors, both individual and institutional, use the
market index as a benchmark against which they evaluate the performance of their own
or Institutional portfolio. The technicians or the chartists often base their decisions to
buy and sell on the patterns emerging out of the time series data of market indexes.
Even the economists and statisticians use stock market indexes to study the trend of
growth patterns in the economy, to analyses as well as forecast business cycles and to
correlate stock market indexes to economic activities.
The index is just an indicator of market and did nothing to the formation of
decision of selecting the investment or portfolio. So the investor should have the highest
degree in analyzing this index. They simply not only tell the movement of share prices
but also reflected by the weight of those shares. So, a high increase in share price of a
minor share with a small share holding will not affect the market.
48
In this study to analysis the fluctuations in the prices of shares for selected
companies in the selected industries index has prepared in the simple average method
with the selected companies for the period of thirteen months.
In general stock exchanges are using some methods to construct indexes. Those
are
Simple average method
Market capitalization Method
Free-float Capitalization Method
The construction of index in simple average met
= (Simple average on the day of cons. /simple average on base day)*100
Example: DJIA
Securities Day1 (Rs) Day2 (Rs) Day3 (Rs) Day4 (Rs)A 100 150 180 130B 110 105 200 90C 85 80 130 90D 180 220 270 150 Average 119 139 195 115Index Points 100 117 164 97
The prepared industry indexes are based on the selected companies for the
selected period. Below mentioned indexes are prepared in this study.
(i) Banking Industry Index (Bank ex)
(ii) Auto Industry Index
49
Construction of Index for Banking Industry
The Base period of Banking index Jan-2012.
The base points of banking industry index are 100.
The Banks involved in the bank industry index are thirteen randomly
selected banks from BSE200 index.
Banking Index
Table No. 9
DateAndhra Bank HDFC OBC SBI ICICI UTI Canara
Jan-12 92.925 736.725 260.975 898.3 597.7 314.575 246.075Feb-12 260.975 751.975 246 883.6 612.6 331.2 268.575Mar-12 84.35 755.75 237.925 924.025 604.1 341.675 276.7Apr-12 80.575 795.8 235.425 941.075 591.1 338.55 261.025May-12 77.625 787.6 218.525 874 570.5 320.4 242.775Jun-12 67.725 765.575 185.65 783.2 516.2 279.375 216.4Jul-12 69.4 767.525 170.725 772.025 521.1 284.925 198.875Aug-12 80.875 821.6 185.325 865 573.8 320.7 209.85Sep-12 91.375 883 232.825 978.15 642.1 360.6 253.575Oct-12 93.9 958.025 263.5 1053.25 738.4 406.925 290.95Nov-12 90.8 1067.7 252.225 1204.5 824.2 455.025 297.775Dec-12 88.3 1095.88 236.75 1279.95 882.7 474.25 288.6
DateVijaya Bank IOB PNB
Union Bank BOB Avg.
Index point
Jan-12 61.325 102.925 467.175 123.5 246.3 345.71 100Feb-12 59.7 107.925 453.65 123.6 237.1 361.4 109.83Mar-12 55.025 99.475 456.1 122.325 227.6 348.76 105.99
50
Apr-12 53.1 98.175 452.525 120.425 231.8 349.96 106.36May-12 48.8 93.625 421.2 113.4 230 333.21 101.26Jun-12 42.65 85.05 370.25 99.2 212.7 301.99 91.779Jul-12 40.975 86.825 354.8 96.725 211 297.9 90.536Aug-12 44.525 91 424.875 109.7 235.8 330.25 100.37Sep-12 52.125 100.7 495.6 127.075 269.6 373.89 113.63Oct-12 57.1 114.075 522.725 133.15 287.5 409.96 124.59Nov-12 54.15 118.325 534.775 129.675 271.1 441.69 134.23Dec-12 49.775 114.85 529.475 125.825 251.9 451.52 137.22
Figure No. 1
In the diagram shown above months are (Jan-12 to Dec-12) shown on the x-axis.
Index points are shown on the y-axis.
During the initial period of the study that is Jan-12 to May-12 the index
points moved from 100 to 109 points. However during the period of June-12 to July–12
there is a drastic decrease in the index points they reached the lowest level of 90.536
soon there is an upturn in the index points by rising to the level of 100.37 points. This
time there is a standard increase in the index points in the next coming periods. In the
month of December the index points reached to the level of 137.22.
Construction of Index for Automobile Industry
The Base period of Automobile Industry index Jan-2012
The Base points of Automobile Industry index are 100
The Companies involved in the Automobile industry index are six randomly
selected companies from BSE200 index.
Automobile Index
Table No. 10
Date Ashok Bajaj M&M Hero Tata Punjab Avg. Index 51

Leyland
Ltd. Ltd Ltd.
Honda
Motors.
Motor
Ltd.
Tractors
Ltd. Point
Jan-12 31.3 2084.6 535.25 858.08 467 679.65 776 100
Feb-12 34.48 2390.7 577.75 875.88 454 762.175 849 109.42
Mar-12 39.38 2685.9 608.625 887.15 456 873.8 925 119.22
Apr-12 46.43 2898.9 635.275 872.4 453 943.75 975 125.63
May-12 45.88 2892.5 621.85 816.9 421 874.35 945 121.83
Jun-12 37.7 2780.9 621.575 785.75 370 794.45 898 115.78
Jul-12 36.5 2604.8 609.75 750.1 355 770.375 854 110.10
Aug-12 37.25 2577.3 620.025 715 425 791.075 861 110.94
Sep-12 42.45 2849.1 666.25 744.73 496 856.025 942 121.44
Oct-12 44.63 2882.5 734.275 767.33 523 847.525 967 124.55
Nov-12 43.38 2709.9 805.525 752.33 535 820.7 944 121.70
Dec-12 44.23 2645.4 865.925 751.18 529 857.625 949 122.29
Figure No. 2
In the diagram shown above months are (Jan-12 to Dec-12) shown on the x-axis.
Index points are shown on the y-axis.
During the initial period of the study that is Jan-12 to Apr-12 the index points
moved in upward trend at the level of 125.63 points, though there is a slight change.
However during the period of May-12to July–12 there is a down ward trend decrease in
the index points they reached the lowest level of 110.10. Soon there is an upturn in the
index points by rising to the level of 110.94 points and that has been followed by the
next months.
52

Construction of Index for I.T. Industry
The Base period of I.T. Industry index Jan-2006
The Base points of I.T. Industry index are 100
The Companies involved in the I.T. industry index are six randomly
selected companies from BSE200 SENSEX.
I.T. Industry Index
Table No. 11
Date NIIT Wipro Infosys HCL Polaris Satyam Avg.
Index
Point
Jan-12 291.875 728.95 4439.85 396.125 1114.025 191.775 1193.8 100
Feb-12 423.075 790.125 4304.3 331.825 1132.725 173.6 1192.6 99.90
Mar-12 398.7 799.275 4315.425 267.5 1193.1 167.9 1190.3 99.81
Apr-12 451.825 832.5 4594.75 266.1 1234.55 172.6 1258.7 105.75
May-12 486.8 769.925 4639.025 241.75 1108.475 153.975 1233.3 97.98
Jun-12 549.675 709.675 4488.775 223.3 1055.7 126.725 1192.3 96.67
Jul-12 546.325 759.65 3926.95 201.85 1092.625 123.6 1108.5 92.97
Aug-12 522.925 748.95 2564.4 222.3 1157.1 154.5 895.03 80.74
Sep-12 512.15 778.55 2730.95 235.775 1219.275 171.05 941.29 105.17
Oct-12 498 794.025 2889.4 210.55 1046.275 183.875 937.02 99.55
Nov-12 561.9 839.475 3199.925 211.425 670.625 192.775 946.02 100.96
Dec-12 708.475 904.275 3320.25 244.05 701.975 209.375 1014.7 107.26
53
Figure No. 3
In the diagram shown above months are (Jan-12 to Dec-12) shown on the x-axis.
Average points are shown on the y-axis.
From the stating to June they were standard and there is not that much
fluctuation in the index points they were moved in the range of 96 to 105. In the month
of July the index points were decreased to 92.97 and in the month of August they
reached the lowest range 80.74.
Later there was a huge increase in the points and reached to 105.17.
Construction of Index for Pharma Industry
The Base period of Pharma Industry index Jan-2012
The Base points of Pharma Industry index are 100
The Companies involved in the Pharma index are six randomly selected
companies from BSE200 SENSEX
Pharma Industry Index
Table No. 12
Date Cipla Ranbaxy
Glaxo
smith Aurobindo
Dr.
Reddy’s
Work
hard Ltd Avg.
Index
point
Jan-12 443.15 381.75 475.725 1052.8 124.625 464.275 490.39 100.00
Feb-12 496.45 414.7 547.225 1213.925 122.725 501.925 549.49 112.05
Mar-12 606.975431.3 621.375 1359.925 123.575 510.825 609.00 110.83
Apr-12 462.9 454.25 703.2 1433.425 123.3 478.6 609.28 100.05
May-12 246.7 457.725 657.675 1403.7 120.575 403.075 548.24 89.98
Jun-12 224.4 384.45 587.125 1331.975 112.95 372.45 502.23 91.61
Jul-12 226.15 366.925 601.825 1335.225 104.275 365.35 499.96 99.55
Aug-12 242.975390.4 625.4 1047.775 107.4 353.625 461.26 92.2654
Sep-12 256.625422.925 626.7 727.15 128.25 385.225 424.48 92.03
Oct-12 261.975417.7 619.5 739.525 133.85 396.875 428.24 100.89
Nov-12 258.925386.725 617.3 729.9 145.8 381.1 419.96 98.07
Dec-12 253.925382.375 665.575 783.1 179.25 363.45 437.95 104.28
Figure No. 4
In the above diagram shown months are (Jan-12 to Dec-12) shown on the x-axis.
Average points are shown on the y-axis.
During the initial period of the study that is Jan-12 to Apr-12 the index points
moved at the level around 100 points, though there is a slight change. However there is
a drastic decrease in the month of May-12 that is 89.98. And increase in June and July–
12 reached to 99.55.
Again decreased in the month of august and increased in the month of October.
It moved in the same range in the last three months i.e. October, November and
December.
Measurement of Coefficient of variation
The standard deviation discussed so far is an absolute measure of variation. The
corresponding relative measure is known as the coefficient of variation. This measure
developed by Karl Pearson is the most commonly used measure of relative variation. It
is used in such problems where we want to compare the variability of two or more than
two series.
That series or group for which the coefficient of variation is greater is said to be
more variable or conversely less consistent, less uniform, less stable or less
homogeneous. On the other hand, the series for which coefficient of variation is less is
55
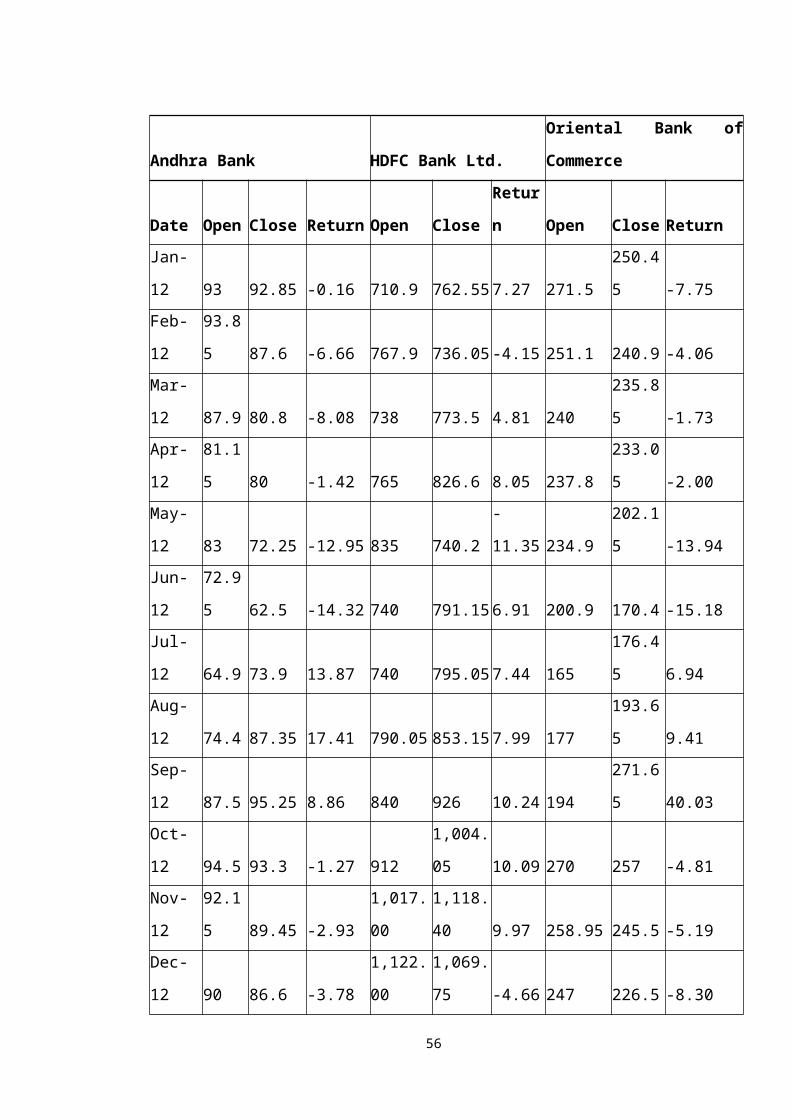
said to be less variable or more consistent, more uniform, more stable or more
homogeneous coefficient of variation denoted by C.V. is obtained as follows.
Coefficient of Variance = (/Avg.)*100
Comparison of unsystematic risk and return for the banking industry
To compare the banking industry return and risk this study is used coefficient of
variance.
It helps us to know how much return we are getting for the baring of that much
risk. On the basis of that this study gives ranks for the selected banking firms. It helps to
the investors to analyze the risks and returns involved in the banking industry.
Standard deviation
Square root of standard deviation gives variance.
Table No. 13
AB OBC HDFC SBI ICIC UTI
Average -0.95 -0.55 4.38 3.19 3.65 4.64
S.D 9.87 14.66 7.08 10.74 9.64 10.68
Variance 97.4 214.7 50.08 115.3 92.95 114.1
Coefficient
of Variation -10.36 -26.64 1.61 3.37 2.64 2.30
Rank I IV III II
The
above table
shows the
unsystematic risk and the return for each bank at the same times it also tells that what is
the coefficient of variance for each bank. In the above table ranking has given on the 56
Canara Vijaya IOB BOB UB PNB
Average 0.92 -2.073 1.12 -0.23 -0.46 0.84
S.D. 11.75 10.98 11.03 9.38 9.78 12.4
Variance 138.01 120.45 121.6 88.03 95.71 154.9
Coefficient
of variance 12.78 -4.02 9.81 -41.12 -21.38 14.8
Rank VII V V
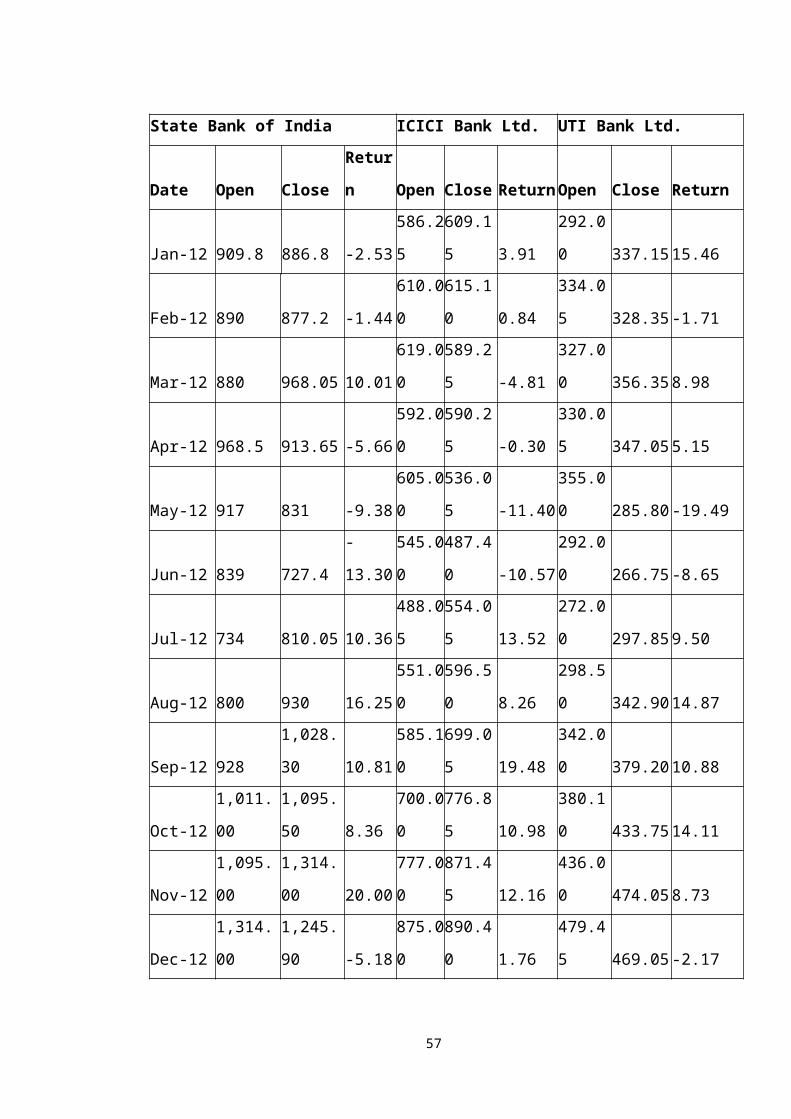
basis of coefficient of variance it gave the ranks for each bank. On the basis of ranks
HDFC Bank has got first rank for its best performance. Punjab National Bank has got
least rank for its least performance.
Comparison of unsystematic risk and return for the automobile industry
To compare the Automobile industry return and risk this study is used
coefficient of variance.
It helps us to know how much return we are getting for the baring of that much
risk. On the basis of that this study gives ranks for the selected Automobile firms. It
helps to the investors to analyze the risks and returns involved in the Automobile
industry.
Standard deviation
Square root of standard deviation gives variance.
Table No. 14
Ashok
Leyland
Ltd.
Bajaj
Ltd.
Mahindra
&
Mahindra
Hero Honda
Ltd.
Punjab
Tractors Ltd.
Tata Motors
Ltd
Average 3.58 1.84 4.13 -1.40 0.84 2.81
Standard
deviation 14.81 9.46 6.08 5.72 12.45 10.18
Variance 219.45 89.55 37.00 32.72 154.93 103.59
Coefficient
of variance 4.14 5.15 1.47 -4.08 14.87 3.62
Rank III IV I V II
The above table shows the unsystematic risk and the return for each company.
And it also tells that what the coefficient of variance for each company is. In the above
table ranks has given on the basis of coefficient of variance for each company.
According to the basis of ranking Mahindra & Mahindra Ltd. has got first rank for
57
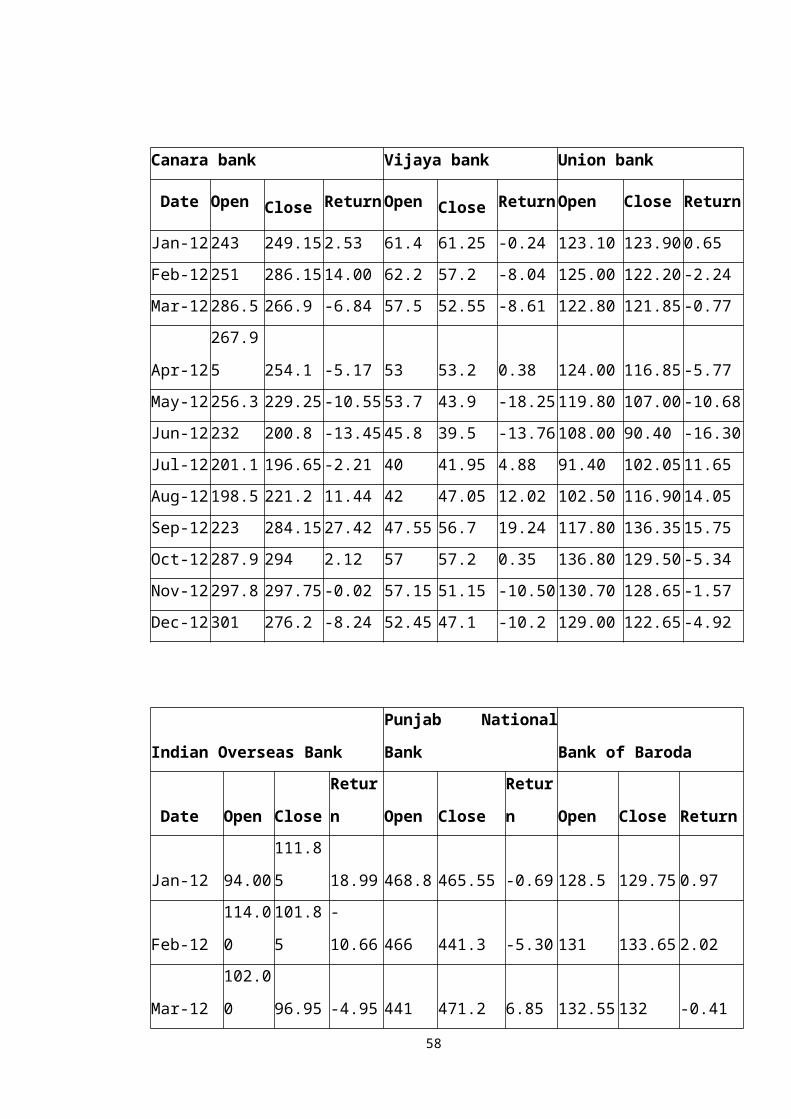
its best performance. Punjab Tractors has got last rank in the selected companies for
its least performance.
Comparison of unsystematic risk and return for the I.T. industry
To compare the I.T. industry return and risk this study is used coefficient of
variance.
It helps us to know how much return we are getting for the baring of that given
risk. On the basis of Co-efficient of variance, this study gives ranks for the selected I.T.
companies. It helps to the investors to analyze the risks and returns involved in the I.T.
industry.
Standard deviation
Square root of standard deviation gives variance.
Table No. 15
The above table shows the unsystematic risk and the return for each company.
And it also tells that what is the coefficient of variance for each company. In the above
table ranks has given on the basis of coefficient of variance for each company.
According to the basis of ranking NIIT has got first rank for its best performance.
Polaris Software Ltd has got last rank in the selected companies for its least
performance.
Comparision of unsystematic risk and return for the pharma industry
58
NIIT Wipro Inofsystech HCL Satyam Polaris
Average 5.51 2.37 -1.32 -3.57 -2.34 2.90
S.D. 12.94 8.93 15.44 15.28 15.31 19.14
Variance 167.49 79.79 238.33 233.37 234.41 366.39
C.V. 2.35 3.77 -11.73 -4.28 -6.53 6.59
Rank I II III
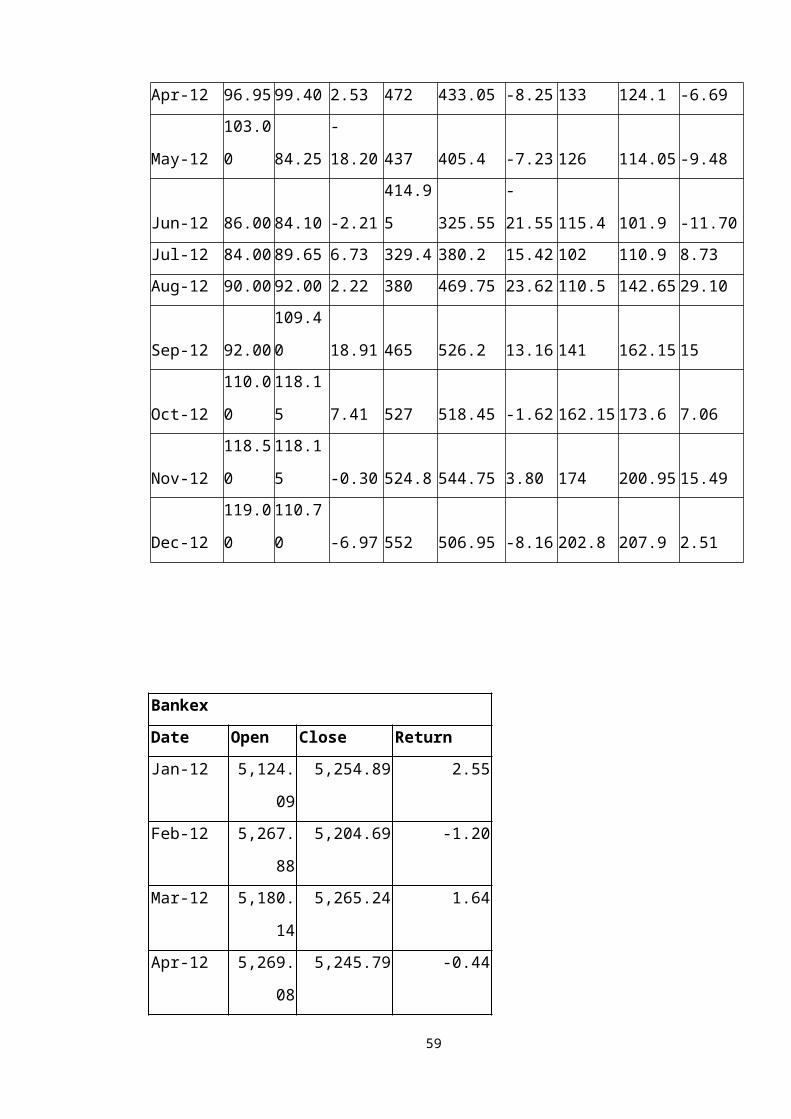
To compare the Pharma industry return and risk this study is used coefficient of
variance.
It helps us to know how much return we are getting for the baring of that much
risk. On the basis of that this study gives ranks for the selected Pharma firms. It helps to
the investors to analyze the risks and returns involved in the Pharma industry.
Standard deviation
Square root of standard deviation gives variance.
Table No. 16
CIPLA
LTD.
RANBAX
Y AURO
DR.REDD
Y'S
STERL
BIOTEC
WOCKHARDT
LT
Average -1.98 0.34 4.54 0.22 4.18 -2.31
SD 21.45 9.74 12.92 16.75 15.76 9.16
Variance 460.06 94.82 166.91 280.59 248.37 83.99
CV -10.83 29.02 2.84 76.89 3.77 -3.96
Rank III I IV II
The above table shows the unsystematic risk and the return for each company.
And it also tells that on what basis the coefficient of variance for each company is
calculated. In the above table ranks has given on the basis of coefficient of variance for
each company. According to the basis of ranking Aurobindo Pharma Ltd has got first
rank for its best performance. Dr. Reddy’s Lab has got last rank in the selected
companies for its least performance.
59
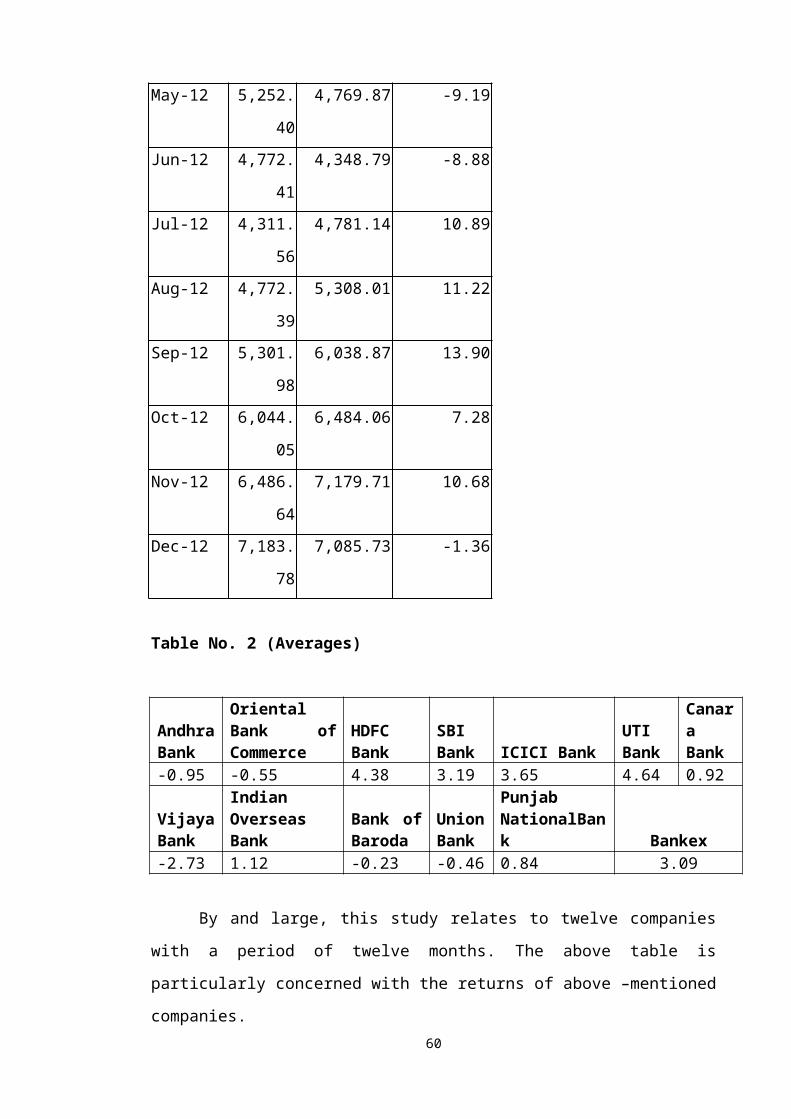
Comparison of unsystematic risk and return for the selected industries
wiseTo compare the selected industries return and risk this BSE200 the study is used
coefficient of variance.
It helps us to know how much return we are getting for the baring of that much
risk. On the basis of that this study gives ranks for the selected industries firms. It helps
to the investors to analyze the risks and returns involved in the selected industries.
Standard deviation
Square root of standard deviation gives variance.
Table No. 17
BSE-200 Bank IT Auto Pharma
Average 35.89 3.09 2.84 2.18 1.67
SD 57.31 7.78 5.45 7.16 7.09
Variance 3284.89 60.55 29.68 51.28 50.23
CV 1.60 2.52 1.92 3.29 4.26
Rank I III II IV V
The above table shows the unsystematic risk and the return for each company
BSE200. And it also tells that on what basis is the coefficient of variance for each
company. In the above table ranks has given on the basis of coefficient of variance for
each index. According to the basis of ranking BSE200 has got first rank in selected
indexes for its best performance and the lowest variability in the return it also tells that
lowest fluctuations in the prices. The last rank has noted by Pharma industry. For
highest fluctuations in the prices
60
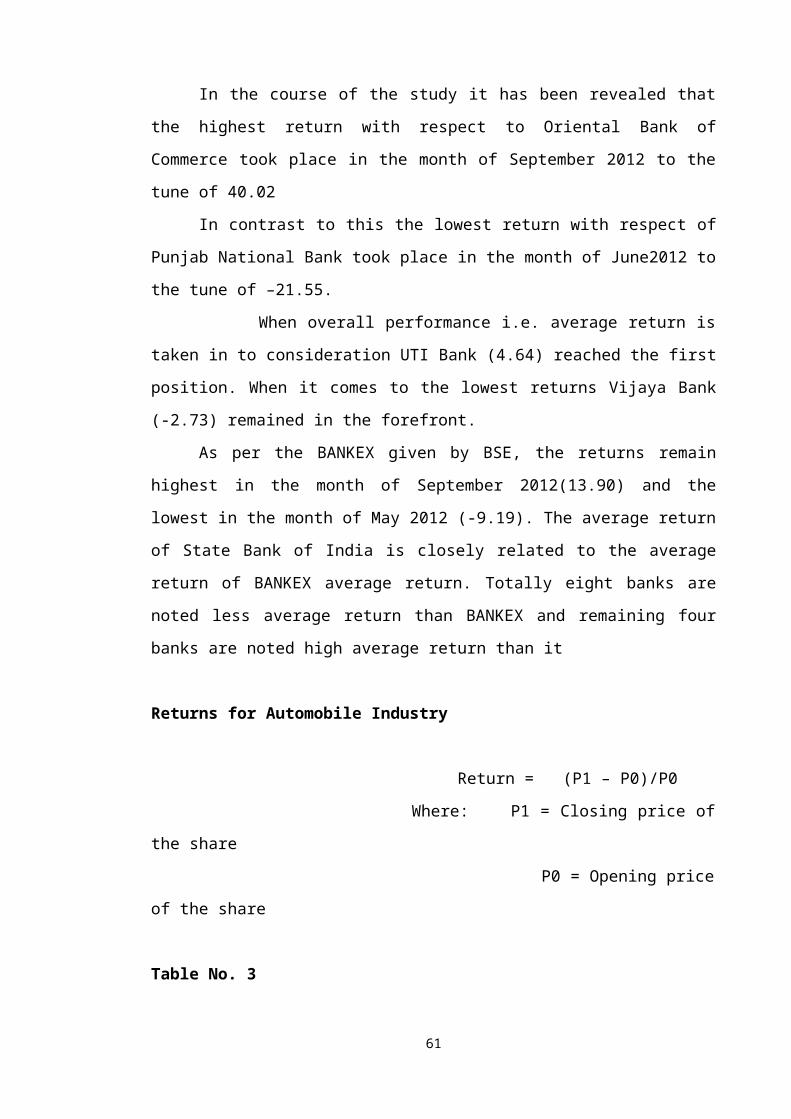
CHAPTER - V
FINDINGS, CONCLUSIONAND
SUGGESTIONS
61
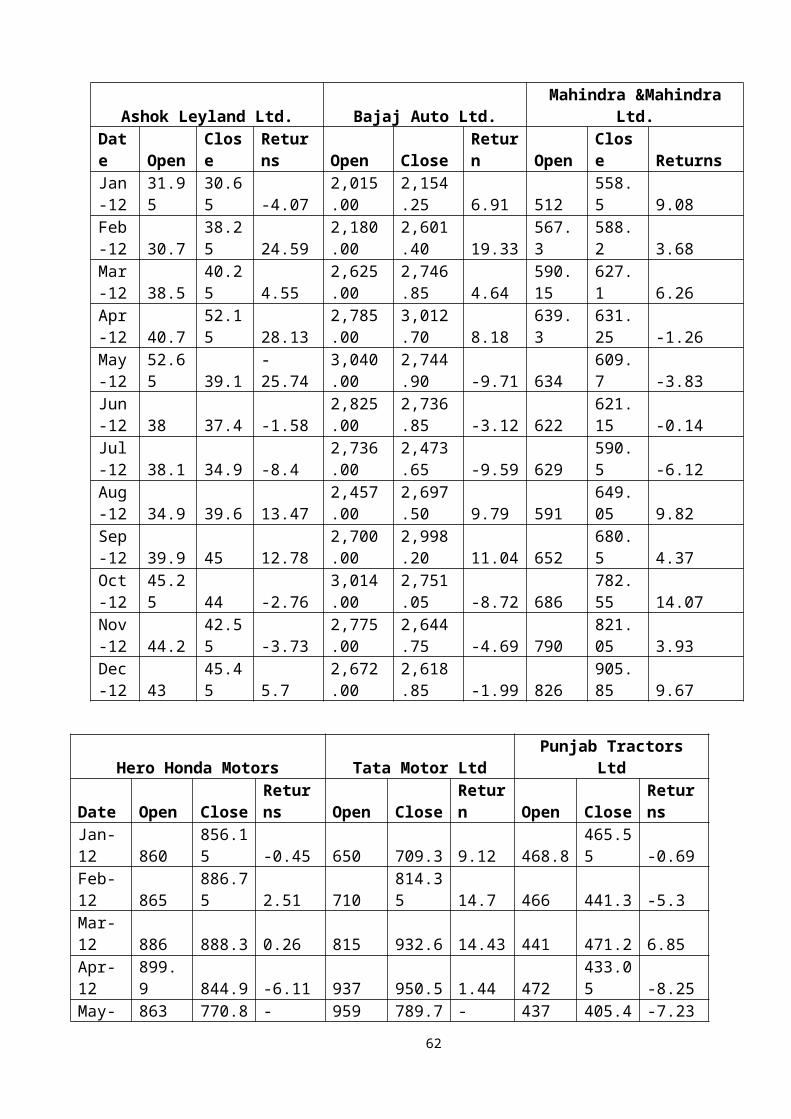
FINDINGS
After analyzing the selected companies from selected industries, this study
concludes returns, Unsystematic Risk, fluctuations in the share prices and co-
efficient of variations for the selected companies from the selected industries
In the area of Banking Industry, it can be concluded that only Four Banks from
selected twelve banks are noted High average return than the overall banking
industry average return (Calculated on the basis of BANKEX) for the period of
study. In case of less average return noted by eight banks in those four banks are
noted negative average returns for the period. According to the BANKEX, the
average return of the banking industry shows 3.09 % average return for twelve
months of study.
In the area of Automobile industry, only three companies was noted more average
return than the industry return (Calculated on the basis of the auto index maintaining
by BSE) from the selected six companies. Remaining three companies were noted
less than average returns. Hero Honda motors confined a negative return, as the
average return for the period of previous twelve months of the automobile industry
was 2.18%.
62
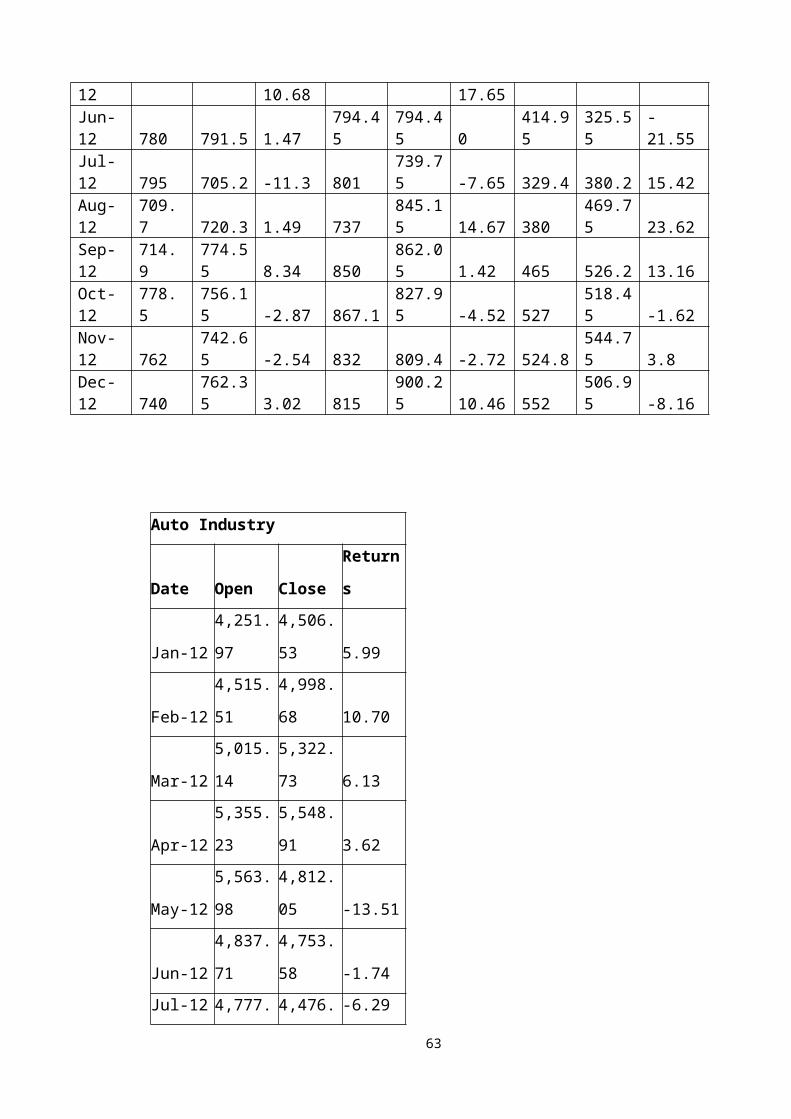
In the area of I.T. Industry, it can be concluded that only three companies were
registered positive average returns from the selected six companies. In the reaming
ones HCL was expressed the high negative return in the selected companies as -
3.57%. The average return of the I.T. Industry was 2.84% for the twelve months
period.
In the case of unsystematic risk Auto Industry was moving with the lowest risk as
7.16% than the other industries. And the BSE200 returns were moving with the high
variability (S.D.) as 57.31%than the other industries.
To know the fluctuations in the prices of the shares of selected companies in the
selected industries, this study constructed index in the simple average method. To
construct index this take only selected companies.
The index points of banking industry moved from around 90.54 to137.22 and as
such the fluctuations not that much high. But in the month of June there is a drastic
change in index points reached the level of 91.78. The highest points 137.22 were
noted the month of December 2012. This is industry follows the trend. It means it
has increased to one level and decreased. Again increased, can be expecting the
downward trend in the next future. We can apply the trend analysis for this industry.
The index points of Automobiles industry moved from around 100 to 125.63.Index
points were increased up to April and reached highest level of points as 125.63.
Then after the index points were decreased till July and then the index were moved
in upward trend till September. In the last three months there was not that much
change in the points.
The Index points of I.T. Industry are moved around from 80.74 to 107.26. The
points are not maintaining a trend. These industry index points are moving upward
and downward. There is not that much fluctuation in the index points. These points
reached in the month of December 2012 at higher level of 107.26 and noted lower
level in the month of August at 80.74.
The index points of Pharmaceutical Industry moved around from 89.98 to
112.05.The index points of this industry are fluctuating highly but not in the higher 63
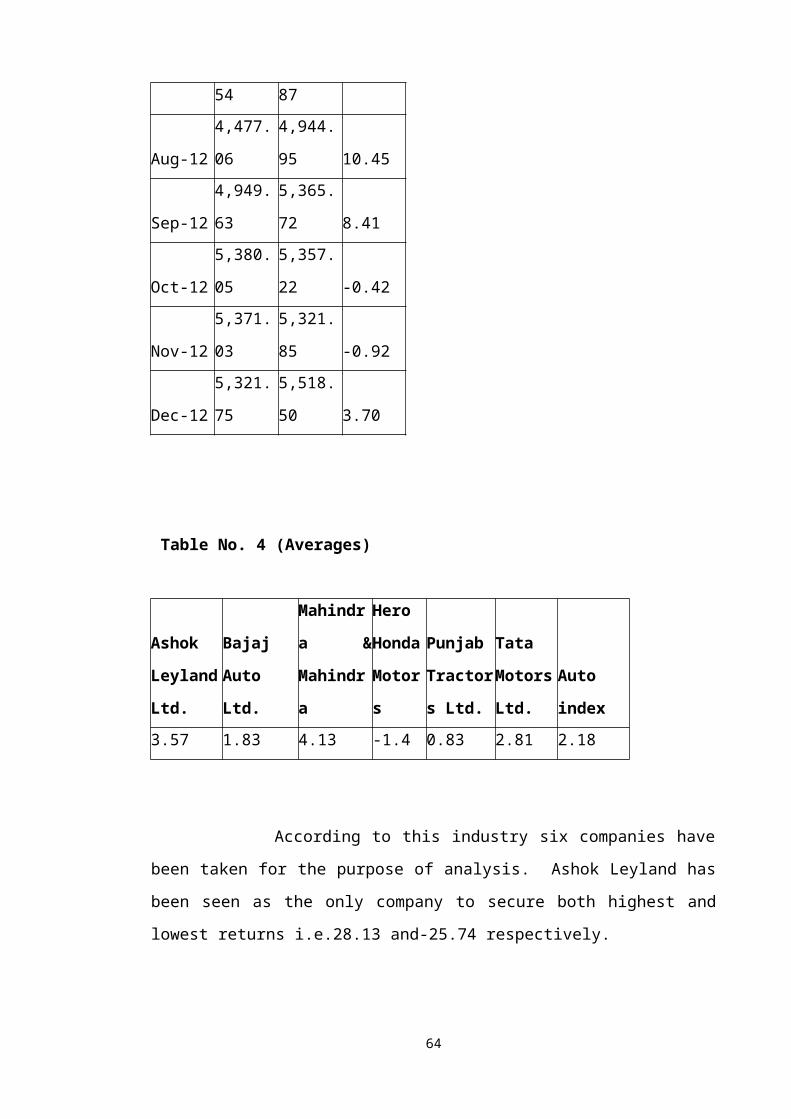
rate. These points are increasing and decreasing every month. This industry’s points
were ended with 104.28 in last month. Investor cannot assume the trend of this
industry. In this industry the index points are not following the trend. They are
fluctuating without any trend reached lowest level in the month of May and higher
level in the month of February.
SUGGESTIONS
This study recommended some companies and industries on the basis of coefficient
of variation. In the case of industries investor better to go for IT industry followed
by Banking Industry and if he want to diversify the risk he can go for automobile
industry then last preference shall given to Pharmaceutical Industry.
In the case of companies investor wants to invest in more industries and don’t want
to give preference for the specific industry. The investor needs to give the
preference to the companies on the basis of coefficient of variation.
First rank will be Mahindra and Mahindra from Auto industry and next HDFC from
Banking Industry. Then give the preference to UTI, NIIT, ICICI, Aurobindo, SBI,
TATA, WIPRO, and so on.
64
65
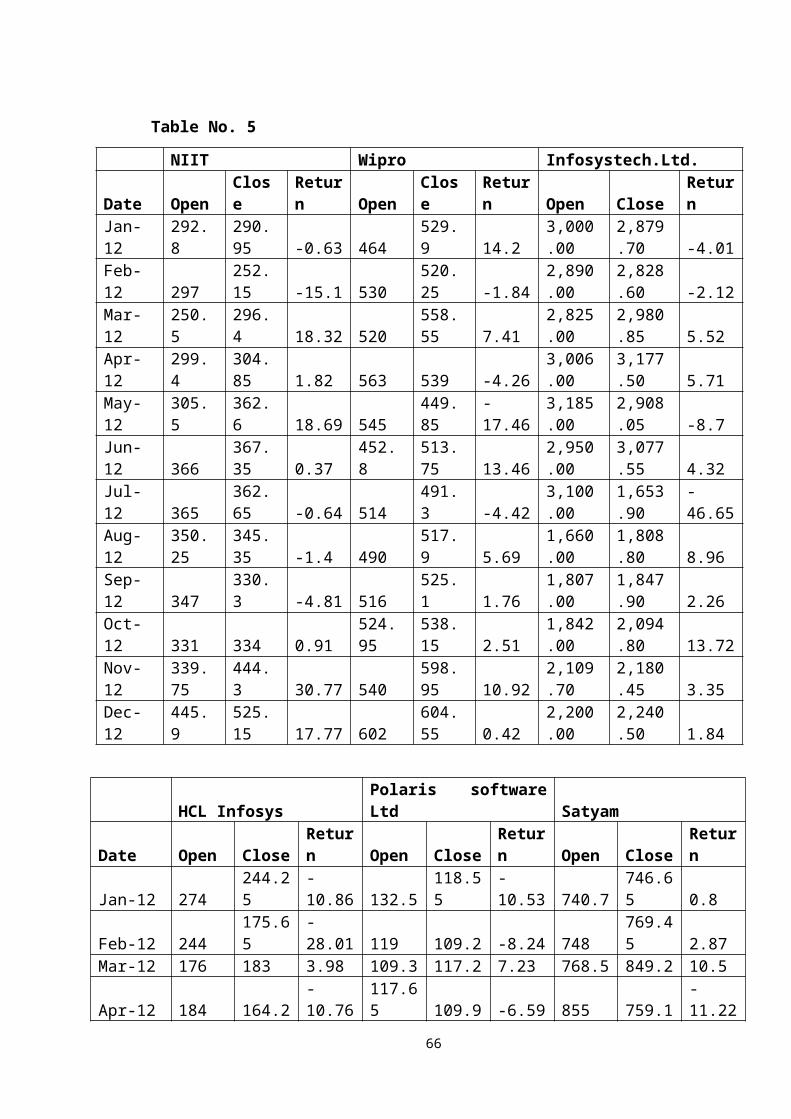
CONCLUSIONS
After analyzing the selected companies from selected industries, this study
concludes returns, unsystematic risk, fluctuations in the sharp prices and co-efficient
of varations of the selected industries.
In the area of banking industry, it can be concluded that only four banks from the
selected twelve banks are noted high average return than the overall banking
industry average return (calculated on the basis of bankex) for the period of study.
In case of less average return noted by eight banks in that four banks are noted
negative average returns for the period. According to the bankex, the average return
on the banking industry shows 3.09% average return for tweleve months of study.
In the area of automobile industry, only three companies was noted more average
return than the industry return (calculated on the basis of the auto index maintining
by BSE) from the selected six companies. Remaining three companies were noted
less than average return. Hero Honda motors confined a negative return, as the
average return for the period of previous twelve months of the automobile industry
was 2.18%.
To know the fluctuations in the prices of the shares of selected companies in the
selected industry, this study construted index in the simple average method. To
construct index this take only selected companies.
The index points of banking industry moved from around 90.54 to137.22 and as
such the fluctuations not that much high. But in the month of june there is a drastic
change in index points reached the level of 91.78.The highest points 137.22 were
noted the month of December 2012. This is industry follows the trends. It means it
has increased to one level and decreased. Again increased, can be expecting the
downward trend in the future. We can apply the trend analysis for this industry.
66
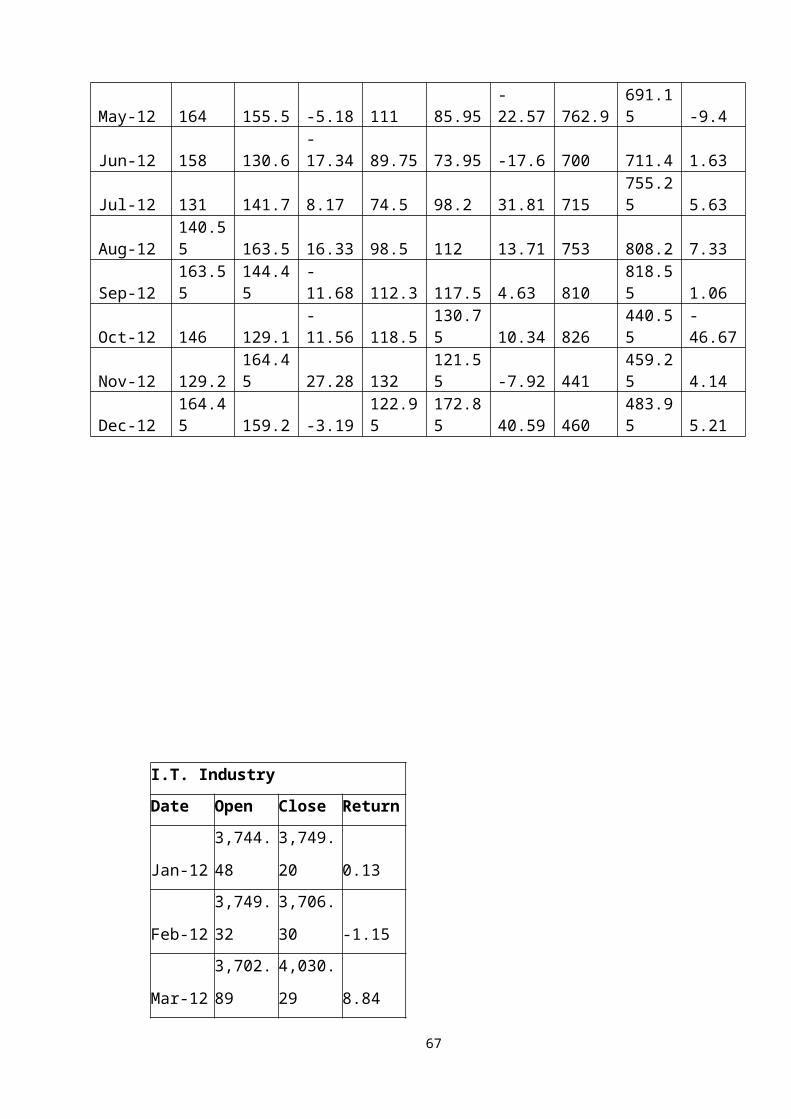
CHAPTER – VI
BIBLIOGRAPHY
67
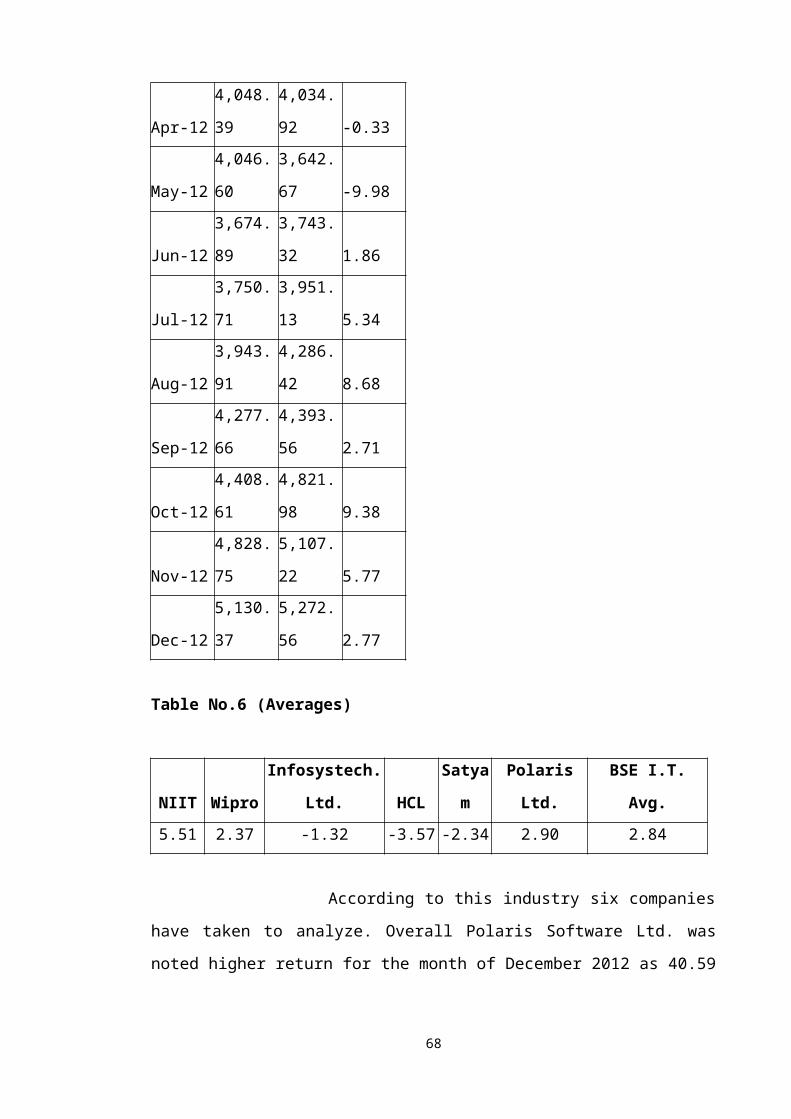
BIBLIOGRAPHY
Russell J.Fuller & L.Farell, jr “Modern Investments and Security Analysis” -
international edition 1987.
V. K. Bhalla “investment management (Security Analysis and Portfolio
Management)” 9th Edition.
Preeti Singh “Investment Management” Reprinted Edition in 1999.
S. Kevin “portfolio management” Second print, February, 2001.
Punithavathy Pandian “Security Analysis and Portfolio Management”
1. Alexander. G.J, Sharpe. W.F and Bailey. J.V, “Fundamentals of Investments”, PHI, 3rd Ed.2. Zvi Bodie, Alex Kane, Marcus.A.J, Pitabas Mohanty, “Investments”, TMH, 8th Ed.3. Prasanna Chandra, “Investment Analysis and Portfolio Management”, TMH, 3rd Ed.4. Charles.P.Jones, “Investments: Analysis and Management”, John Wiley &Sons, Inc. 9th Ed.5. Francis. J.C. & Taylor, R.W., “Theory and Problems of Investments”. Schaum’s Outline Series,McGraw Hill6. Herbert. B. Mayo, “Investments: an Introduction”, Thomson – South Western. 9th Ed.7. Peter L. Bernstein and Aswath Damodaran, “Investment Management”,Wiley Frontiers inFinance.8. Dhanesh Khatri, “Security Analysis and Portfolio Management”, 2010, Macmillan Publishers.
9. Sudhindra Bhat, “Security Analysis and Portfolio Management”, 2009, Excel
Books.
10. Preeti Singh, Investment Management, 2010, HPH, 17th Revised Edition.11. Stephen A. Ross, Randolph Westerfield, and Jeffrey Jaffe, “Corporate Finance”, TMH.12. S. Chand “Investment Management: Security Analysis & Portfolio Management”.13. S. Kevin, “Analysis and Portfolio Management”, PHI.14. Punithavathy Pandian, “Security Analysis and Portfolio Management”, Vikas Publishing House15. Donald E. Fisher and Ronald J. Jordan: “Securities Analysis and Portfolio Management”,Prentice Hall.16. Graham & Dodd, “Security Analysis and Portfolio Management”, McGraw Hill.
68
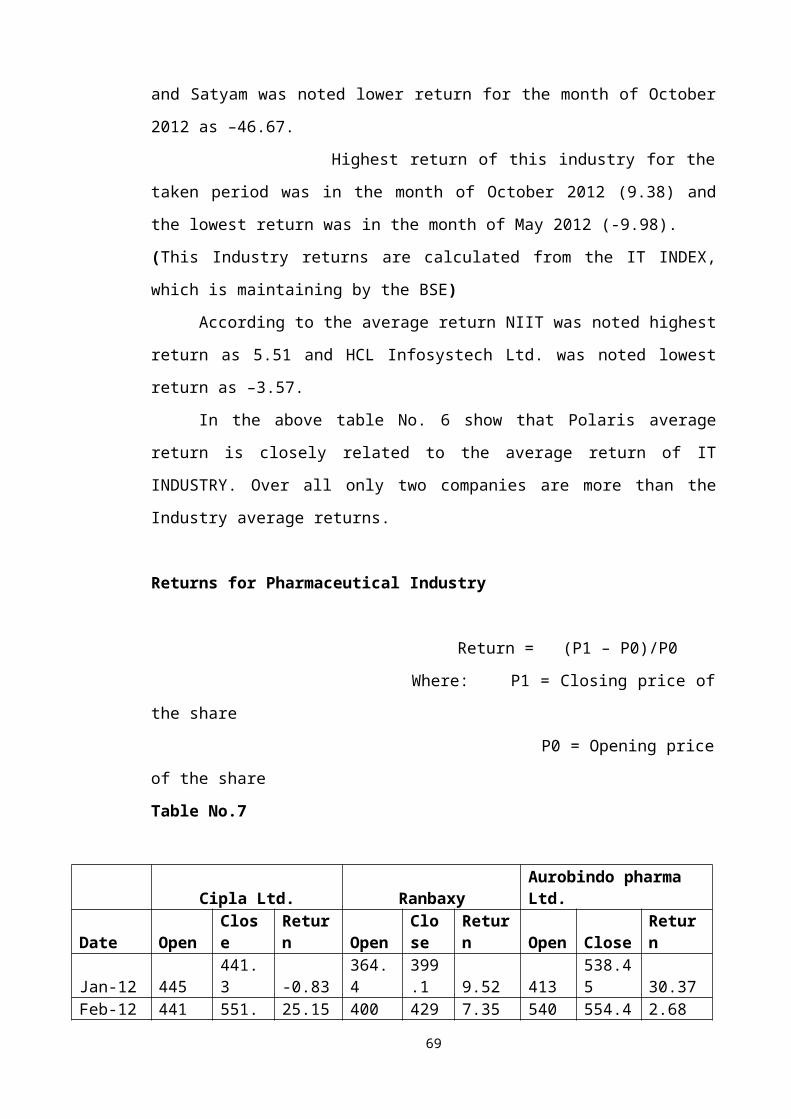
17. Jack Clark Francis, “Investment”, TMH, New Delhi.
Website:
www.bseindia.com
www.google.com
www.nseindia.com
69


![[ Rattan Agency]](https://img.pdfslide.us/doc/110x75/568144a1550346895db160a5/-rattan-agency.jpg)