Embed Size (px)
Citation preview
ORTHODONTIC NEEDS ASSESSMENT FOR
YORKSHIRE AND THE HUMBER 2016
1
Introduction Currently NHS England commissions primary care services including orthodontic services. Guidance issued by the Department of Health (DH) in 2010 suggested specific considerations to be taken into account by commissioners prior to making decisions on the future of these services. Many primary care trusts (PCTs) extended contracts and some procured services and they now have variable end dates but many will now expire in April 2017. Recent changes in procurement law mean that commissioners need to make long-term decisions on the future of these contracts. The majority of existing orthodontic services are delivered under time-limited contracts which are personal dental service (PDS) contracts. Over the past 10 years, the cost of orthodontic treatment in general and personal dental services has increased, 2.3% of the total primary care dental budget for England is accounted for by orthodontic related activity. In Y&H this is at a total cost of £17.6 million (excluding mixed contracts).
A key factor in determining the future of orthodontic capacity is an assessment of the level of services to be commissioned to meet population need. While the distribution of orthodontic services in NY&H is still mainly based on historical provision that existed prior to the 2006 dental contract, commissioners should be able to better target resources over time, based on needs and to ensure equity of orthodontic service provision.
General dental practitioners, dentists with enhanced skills and orthodontic specialists deliver primary care orthodontic services. They are, in some cases, supported by orthodontic therapists. Secondary care orthodontics is delivered by consultants and specialists assisted by orthodontic therapists and trainees. Secondary care orthodontists offer advice, training and usually treat the most complex (often multi-disciplinary) cases.
A pan Yorkshire & Humber approach is being adopted in commissioning of orthodontic services by NHS England. This report provides an assessment of the need for orthodontic services across Y&H. It describes estimates of normative need together with demand for orthodontic services. It provides information on current commissioned and delivered orthodontic activity, waiting times and examines orthodontic patient flows in and out of Y&H. The report concludes with an assessment of whether the services commissioned are meeting need.
PDS Orthodontic contracts March 2017 sees the expiry of a number of PDS Orthodontic contracts across England. NHS England has produced a guide for the consistent commissioning of orthodontic services based on the requirements of the Five Year Forward View. As a minimum, commissioners should ensure that they have completed a needs assessment and a review of current service provision. Patient engagement will need to be considered to ensure NHS England meets its 13Q (NHS Act 2006) requirements.
Health needs assessment for orthodontic care for Yorkshire and the Humber
Planning for procurement of orthodontic services for children requires three elements of assessment:
2
1. An estimate of the number of 12-year-old children who both need and demand intervention, added to the proportion of children who require orthodontic treatment before age 12 (interceptive orthodontics)
2. A view of the current quantity of provision and the degree to which investment meets need and expressed demand.
3. An assessment of how well current investment in existing orthodontic contracts and agreements is being utilised. The quality, value, outcomes and efficiency of current provision can be assessed using DAF, % PAR improvements (peer assessment rating) and transitional guidance (2014) which outlined an approach to assessing this in 5 domains. (Value of UOAs, numbers of assess/refuse and multiple assess/reviews on same patient, % PAR completed, numbers of abandoned cases and waiting times from referral to assessment/case start.) This exercise allows commissioners to identify potential efficiency savings to support procurement planning and to communicate commissioning intentions to contract holders.
Commissioners need to assess the context for re-procuring orthodontic services relative to other oral and wider health needs for the population they serve eg access to primary dental care as gatekeepers to specialist services. Consideration also needs to be given to stability of contracts due to length and the time needed for procurement cycles and the effects on patient continuity.
Background guidance Current arrangements for the commissioning of specialist orthodontic services in primary care came into operation in April 2006. A number of published documents recommended a range of actions for PCTs to establish a more strategic and effective approach to orthodontic commissioning. These documents suggested moving to a sector-wide approach, commissioning orthodontics across primary and secondary care pathways and assessing levels of orthodontic need as the basis for planning appropriate future capacity and developing clinical governance. Further guidance explored joint commissioning of orthodontics in line with local needs, issues concerning future UOA values and benchmarking ratios between assessments and case starts. ‘Quality assurance in NHS primary care orthodontics’ provided further details of the proposed quality assessment and outcome framework together with compliance required by national regulations. The most recent guidance supports the development of care pathways, and the development of Managed Clinical Networks.
Key policy documents related to orthodontic commissioning are: Department of Health (2005) guidance ‘Primary dental services: commissioning specialist dental services (revised version)’ gateway
58652 Department of Health (2006). ‘Strategic commissioning of primary care orthodontic services’, gateway 71053 Primary Care Contracting (2006). ‘New orthodontic contracts, hints and tips’ PCC guidance November 2007 ‘Quality assurance in NHS primary care orthodontics’ Securing excellence in commissioning NHS dental services 2013 Transitional commissioning of primary care orthodontic services 2012
3
NHS England Guide for commissioning Orthodontics, 2015
Estimate of orthodontic need & service provision for Yorkshire & the Humber 2016
PurposeThe purpose of this document is to provide a framework and assessment of the need for orthodontic treatment in Yorkshire and the Humber. It reviews the current provision of orthodontic services, use of available resources and offers recommendations to support future commissioning considerations and decisions. In producing the report, completed Orthodontic Needs Assessments in the North of England have been reviewed to identify good practice. This framework uses a variety of methodologies to inform an evidence-based approach to commissioning. The intention is to support NHS England to achieve best use of resources, improve quality, equitable access and ensure parity of outcome in orthodontic services in Yorkshire & the Humber.
IntroductionOrthodontics is the dental specialty concerned with facial growth, development of the dentition and occlusion, and the assessment, diagnosis, interception and treatment of malocclusions and facial irregularities.
The contractual situation for the provision of Orthodontic services is varied and there is pressure in many localities on waiting times. There are a mixture of GDS contracts and time-limited PDS agreements, which were either awarded following procurement or the contractual reforms in 2006. GDS contracts with an element of orthodontics are currently not time limited. However it should be noted that the Orthodontic Commissioning Guide 2015 recommends a minimum caseload of 50 cases per year which would equate to 1050 UOAs. Commissioners need to understand the impact of current service delivery and support orthodontic providers to identify areas where improvements to efficiency can be made. This needs assessment and review of existing contract delivery together with the NHS England’s Orthodontic Commissioning Guide 2015 will give commissioners assurance on direction and steps necessary to complete prior to decisions on future procurement.
Under the contract and agreements introduced in April 2006, Orthodontists or GDPs providing treatment on the NHS are paid an annual fee - the Calculated Annual Contract Value (CACV). This is to provide a complete orthodontic service to a group of patients over that period of time. The contract includes the provision of assessments, treatment starts, repairs, retainer checks and the continuing care of an on-going caseload. As a measure of activity, assessments and treatment starts trigger Units of Orthodontic Activity (UOAs) that are credited against the agreed contracted level of UOAs for the year.
4
A full orthodontic case assessment generates 1 UOA and applies only to patients seen on referral who are provided with a clinical examination (often involving radiographs and clinical photographs) designed to establish whether orthodontic treatment is necessary and if so, when it should be undertaken.
Units of Orthodontic Activity (UOAs) are attributed to an orthodontist as follows:
1 UOA – full and comprehensive orthodontic assessment21 UOAs – orthodontic assessment and case start (patient aged 10 -17)4 UOAs – orthodontic assessment and case start (patient aged below 10)23 UOAs – orthodontic assessment and case start (patient aged 18+)
Methodology
The first part of an orthodontic needs assessment is to identify ‘need’ in the population. There are two elements to orthodontic treatment need:
Normative need - the professionally judged need in a population cohort. Defined following a clinical examination using a standardized clinical index such as IOTN or benchmark and/ or need defined by applying a validated formula.
Demand – need perceived by the patient that is expressed and presented for treatment. This can also be considered as ‘patient willingness to undergo treatment’.
Estimated need in the population should then be viewed in light of existing service provision. The components of existing service provision that require review are:
Whether the volume of commissioned local orthodontic services (primary and secondary care) is sufficient to meet the identified population need.
Quality, outcomes and value of current service provision
If services are located in the right place to ensure equity of access taking into account transport links.
The purpose of assessing orthodontic treatment need is to determine if sufficient effective orthodontic care is currently commissioned for the local population. Consideration should also be given to whether population projections will alter this needs assessment over the coming years
5
Quantification of population need for orthodontic treatment (methodologies)
An assessment of the need for orthodontic services is necessary to inform long-term decisions on the future of orthodontic contracts. Data from the BASCD 12-year-old survey 2008/2009 suggests that there was variation across the region in terms of need and demand for treatment; however research has shown that orthodontic need is stable across populations and ethnic groups. There are various methods of determining orthodontic treatment need in a population:
The Nation Dental Epidemiological Programme (NDEP) method
Twelve-year-olds are used as the age group to define need, as orthodontic treatment is usually carried out when all the permanent teeth have erupted and the amount of orthodontic treatment in the younger and older age groups is low. In 2008/9 an NHS epidemiological oral health survey of 89,442 12-year-old children was undertaken across England. As well as a surveying oral health, orthodontic need was also assessed. This gave, for the first time an epidemiological orthodontic needs assessment that included:
Normative need and Demand (willingness to have treatment) Interceptive orthodontics (proportion of 12-year-olds already wearing an appliance).
Children with poor oral hygiene or active caries were not excluded from the assessment and so this treatment of the data will therefore overestimate those that are suitable for orthodontic treatment. Prior to the examination, the children in the survey were asked if they were wearing a brace. If they had a brace they were classified as already receiving orthodontic treatment and were not involved in the survey any more. The remainder were asked if they thought their teeth needed straightening. If they replied “yes”, they were asked if they would wear a brace. From this, estimates of patient perceived need (demand), can be made, giving an indication of how many of these children with clinical need might seek treatment. The examiners were all calibrated with a Regional and National standard and trained in Index of Orthodontic Treatment Need (IOTN) assessment. The threshold set for normative orthodontic need was a Dental Health Component (DHC) IOTN score of 4 or above (the same level used in the 2003 National Child Dental Health Survey) or an Aesthetic Component (AC) of 8 to 10 at lower DHC scores.
Orthodontic treatment is currently funded by the NHS for those patients with IOTN DHC 4 and 5, or and AC of 8-10. It is also funded for those patients who have IOTN DHC 3 if they also have an AC of 6 or above. Patients must also have excellent oral hygiene and no active oral disease. Whilst the NDEP 2008 estimate does not capture need for treatment as defined by an IOTN score between DHC 3 plus AC 6 up to
6
DHC 4, it also overestimates treatment need because it does not exclude those who are ineligible for orthodontic treatment due to poor oral hygiene or active oral disease.
Due to the small size of the sample for the survey in some areas of Y&H, conclusions drawn from the results are limited (YHPHO 2012). Caution should be exercised for using the findings of the survey as the sole method for needs assessment. In addition, demand for treatment may have changed since 2009 as social norms for acceptability of fixed appliances have changed. In addition not all data are readily available for the same geographical boundaries as currently used.
Holmes methodology
The prevalence of normative need for orthodontic treatment at a threshold of IOTN DHC and AC 6 or greater has been estimated to be 36.3% (95% C.I. 33.3 to 39.3) (Holmes A, 1992). This research used local population in South Yorkshire and is included for completeness.
National child dental health survey 2013The National Child Dental Health survey (CDH) 2013 showed 37% of 12 year-old children in the UK had unmet need (dental health component or aesthetic 8-10). However no account was taken of demand.
Stephen’s formula method
An alternative method to estimate population orthodontic need and demand is using Stephen’s formula which estimates that 1/3 rd of the 12 year old population have an IOTN DHC score of 4 or 5. This is then adjusted for those who require interceptive treatment before the age of 12, (9%) and for adult treatment (4%).
12 year old population/3 x 1.13 (to account for 9% interceptive and 4% adult orthodontics)
Stephen’s formula assumes that the proportion of patients who require treatment in DHC category 3 is largely offset by the proportion of cases in category 4 and 5 who, despite a normative need for Orthodontic treatment, decline care, i.e. no demand. However, Stephen’s formula is considered an overestimate because it does not consider demand and includes the ‘adult factor’ which will only apply to those being treated in hospital (as no adult orthodontic care is normally commissioned in primary care).
For completeness this needs assessment presents a range of methodologies applied to 2011 population census data. The NDEP methodology may be an underestimate as demand may have changed and Stephen’s formula is likely to be an overestimate as demand and suitability (eg oral hygiene) is not taken into account. Using a mean of the methodologies produced a very similar estimate to using a third of the population,
7
as illustrated in Table 1 in the appendix. Therefore it is proposed that a third of the population is used as a pragmatic estimate of orthodontic treatment need.
Understanding existing service provisionPrimary care orthodontic services
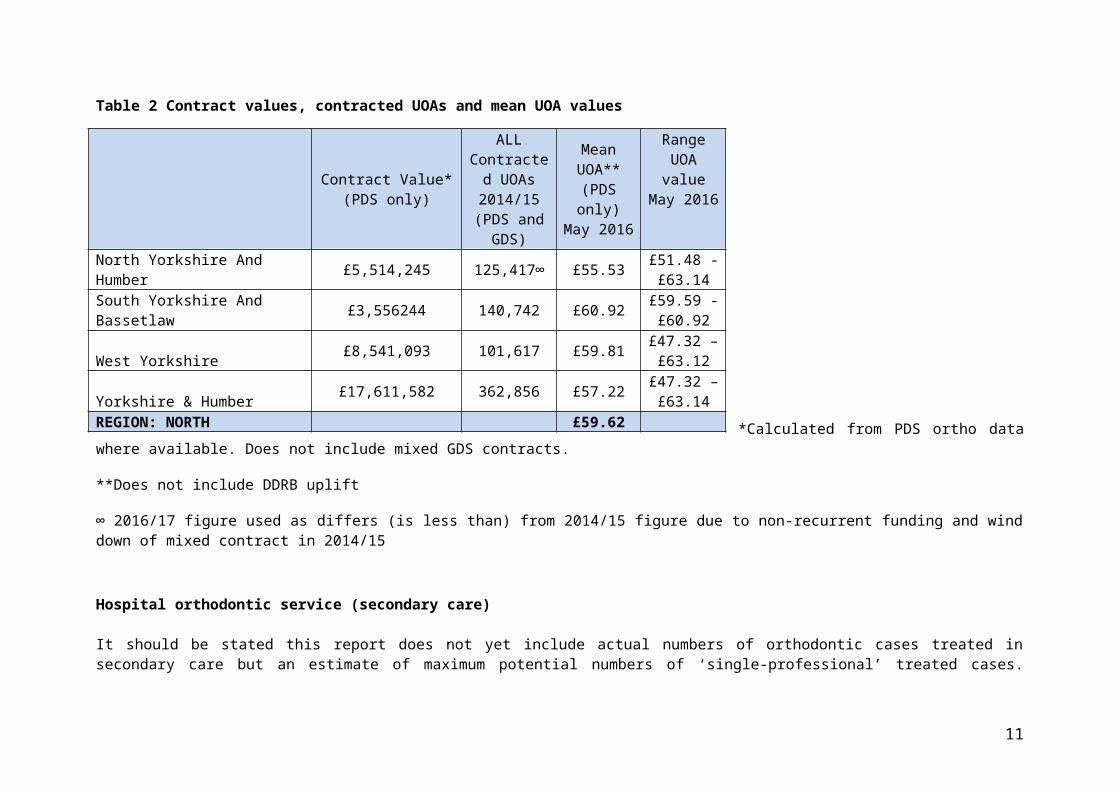
There were 80 primary care contracts open in Y&H during 2014/15 that included orthodontic activity. There was a blend of PDS orthodontic agreements and GDS general and orthodontic contracts. Table 2 illustrates the estimated budgets/contracted UOAs for primary care orthodontic services.
Table 2 Contract values, contracted UOAs and mean UOA values
*Calculated from PDS ortho data where available. Does not include mixed GDS contracts.
**Does not include DDRB uplift
∞ 2016/17 figure used as differs (is less than) from 2014/15 figure due to non-recurrent funding and wind down of mixed contract in 2014/15
8
Contract Value*(PDS only)
ALL Contracted
UOAs 2014/15
(PDS and GDS)
Mean UOA**(PDS only)
May 2016
Range UOA value
May 2016
North Yorkshire And Humber £5,514,245 125,417∞ £55.53 £51.48 - £63.14
South Yorkshire And Bassetlaw £3,556244 140,742 £60.92 £59.59 - £60.92
West Yorkshire £8,541,093 101,617 £59.81 £47.32 –£63.12
Yorkshire & Humber £17,611,582 362,856 £57.22 £47.32 –£63.14
REGION: NORTH £59.62
Hospital orthodontic service (secondary care)
It should be stated this report does not yet include actual numbers of orthodontic cases treated in secondary care but an estimate of maximum potential numbers of ‘single-professional’ treated cases. However a CQiN implemented from April 2016 should provide accurate numbers of cases assessed and treated going forwards.
Consultant Orthodontists based in secondary care provide a treatment service predominantly for multidisciplinary (those requiring a joint surgical and orthodontic approach) and complex cases. A number of units also provide training for orthodontic specialists and may take on a number of less complex cases for their trainees. There are currently 18 whole time equivalent higher trainees in Yorkshire & Humber. Hospital orthodontic services delivered by consultant led teams are commissioned as part of contracts with secondary care providers forming an established part of NHS England baseline funding for acute sector services. Most referrals to the hospital services are now through a referral pathway with referrals accepted from GDPs, Salaried Dental Services and from specialists for more complex care. There are twelve hospital trust providers of orthodontics in Y&H.
In addition to providing orthodontic care for patients who have IOTN 4 and 5, complex orthodontic services are provided in multi-disciplinary clinics. Training of orthodontic specialists is an important function presently carried out in these trusts. The estimated annual spend for orthodontics in secondary care is £1,935,624 million, 34.7 % of the total hospital dental spend for 2014/15 of £5,571,666. Other orthodontic needs assessments have estimated that 15% of orthodontic treatment is delivered by secondary care.
Estimate of hospital service cost per case and numbers treatedSecondary care dental services are commissioned for the resident population who may seek treatment at any provider trust, with a recharge back to the host NHS England on Payment by Results (PbR) tariff. Hospital tariffs for orthodontic treatment in secondary care are set at national level. The estimates for this work are based on first attendance and follow up attendance for a single professional. Some hospitals may use first and follow up tariffs for multi professional. Where this happens the cost per case in secondary care will be more expensive and the funding will pay for less cases.
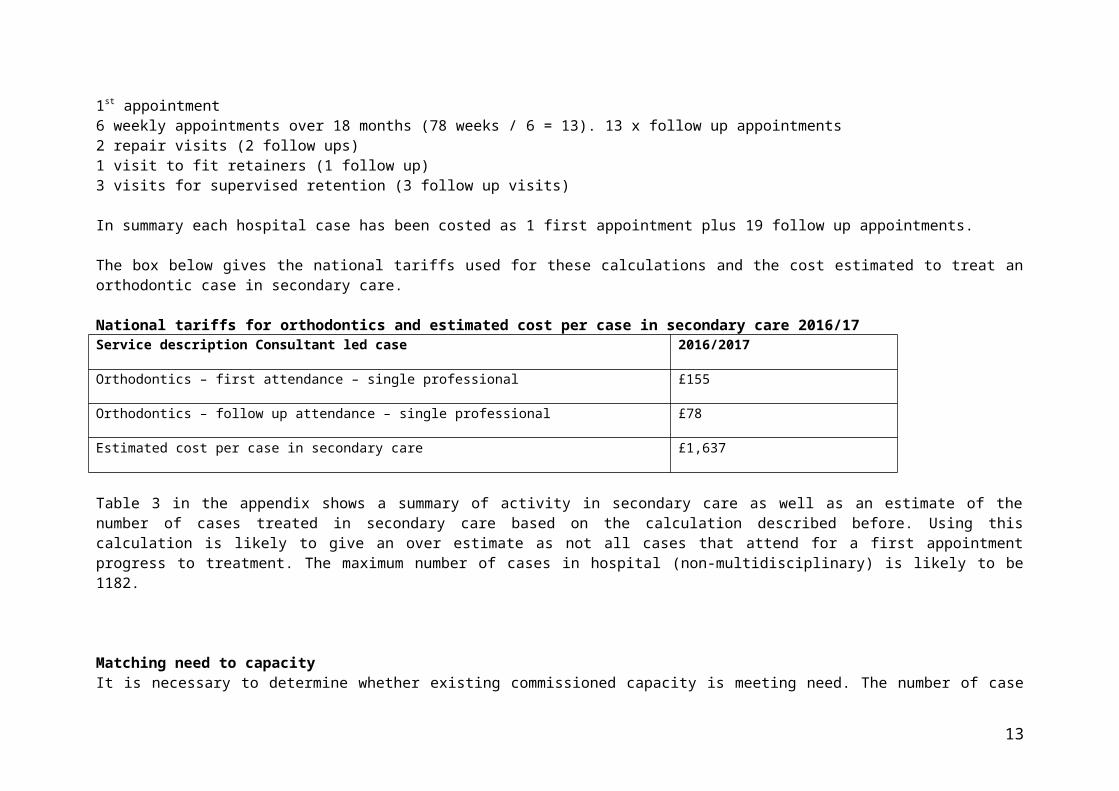
Orthodontic cases take approximately 18 months to treat. The cost estimates for this work are based on the following number of appointments:1st appointment6 weekly appointments over 18 months (78 weeks / 6 = 13). 13 x follow up appointments2 repair visits (2 follow ups)1 visit to fit retainers (1 follow up)3 visits for supervised retention (3 follow up visits)
In summary each hospital case has been costed as 1 first appointment plus 19 follow up appointments.
9
The box below gives the national tariffs used for these calculations and the cost estimated to treat an orthodontic case in secondary care.
National tariffs for orthodontics and estimated cost per case in secondary care 2016/17Service description Consultant led case 2016/2017
Orthodontics – first attendance – single professional £155
Orthodontics – follow up attendance – single professional £78
Estimated cost per case in secondary care £1,637
Table 3 in the appendix shows a summary of activity in secondary care as well as an estimate of the number of cases treated in secondary care based on the calculation described before. Using this calculation is likely to give an over estimate as not all cases that attend for a first appointment progress to treatment. The maximum number of cases in hospital (non-multidisciplinary) is likely to be 1182.
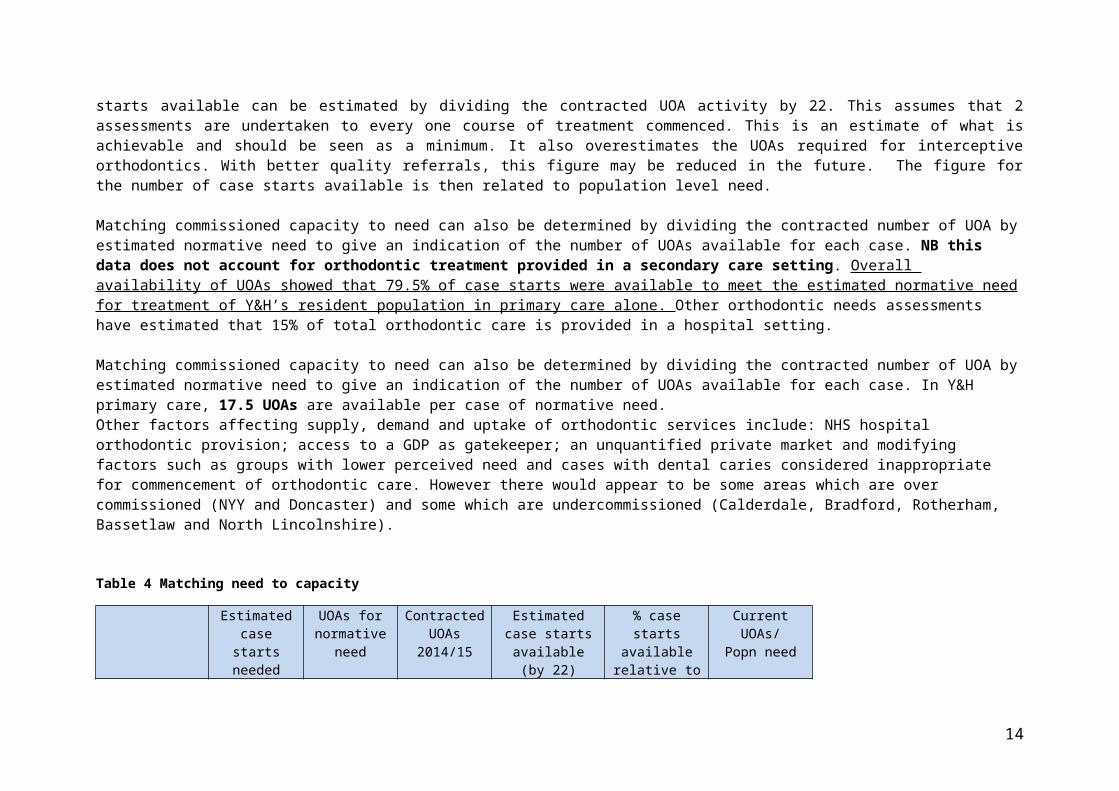
Matching need to capacityIt is necessary to determine whether existing commissioned capacity is meeting need. The number of case starts available can be estimated by dividing the contracted UOA activity by 22. This assumes that 2 assessments are undertaken to every one course of treatment commenced. This is an estimate of what is achievable and should be seen as a minimum. It also overestimates the UOAs required for interceptive orthodontics. With better quality referrals, this figure may be reduced in the future. The figure for the number of case starts available is then related to population level need.
Matching commissioned capacity to need can also be determined by dividing the contracted number of UOA by estimated normative need to give an indication of the number of UOAs available for each case. NB this data does not account for orthodontic treatment provided in a secondary care setting. Overall availability of UOAs showed that 79.5 % of case starts were available to meet the estimated normative need for treatment of Y&H’s resident population in primary care alone. Other orthodontic needs assessments have estimated that 15% of total orthodontic care is provided in a hospital setting.
Matching commissioned capacity to need can also be determined by dividing the contracted number of UOA by estimated normative need to give an indication of the number of UOAs available for each case. In Y&H primary care, 17.5 UOAs are available per case of normative need. Other factors affecting supply, demand and uptake of orthodontic services include: NHS hospital orthodontic provision; access to a GDP as gatekeeper; an unquantified private market and modifying factors such as groups with lower perceived need and cases with dental caries
10
considered inappropriate for commencement of orthodontic care. However there would appear to be some areas which are over commissioned (NYY and Doncaster) and some which are undercommissioned (Calderdale, Bradford, Rotherham, Bassetlaw and North Lincolnshire).
Table 4 Matching need to capacity
Estimated case starts
needed using third popn
UOAs for normative
needContracted
UOAs 2014/15
Estimated case starts available
(by 22)
% case starts available relative to
needCurrent UOAs/
Popn needNorth Yorkshire & Humber
6344 139568
125,417* 5701 90
20
Total N Yorks & York
2927 6439479a,414* 3610 123
27
Craven 240 52804002 182 76
16.5
Harrogate 607 1335413354 736 121
26.5
Hambleton 327 71947194 430 131.5
29
Richmondshire 200 44004400 0 0
0
Ryedale 204 44884488 0 0
0
Scarborough 355 78107810 591 166
36.5
Selby 331 72827282 358 108
23
York 663 1458614586 1174 177
38
E Riding 1237 27214 20,916* 951 77 17
Hull 933 20526 13,559* 616 66 14.5
NE Lincs 614 13508 8661* 394 64 14
N Lincs 633 13926 2,867* 130 21 4.5
11
South Yorkshire & Bassetlaw
5639 124058
101617 4618 82
18
Doncaster 1163 25586 39722 1805 155 34Bassetlaw 488 10736
2249 102 215
Barnsley 912 20064 13076594 65
14
Rotherham 1062 23364 8206 373 35 8
Sheffield 2014 44308 38,364 1743 87 19West
Yorkshire9063 199386
140742 6397 70.515.5
Bradford and Airedale
2468 5429629254 1329 54
12
Calderdale 852 18744 5608 254 30 6.5
Kirklees 1777 39094 30709 1395 79 17
Leeds 2713 59686 49467 2248 83 18Wakefield
District1253 27566 25504
1159 9220
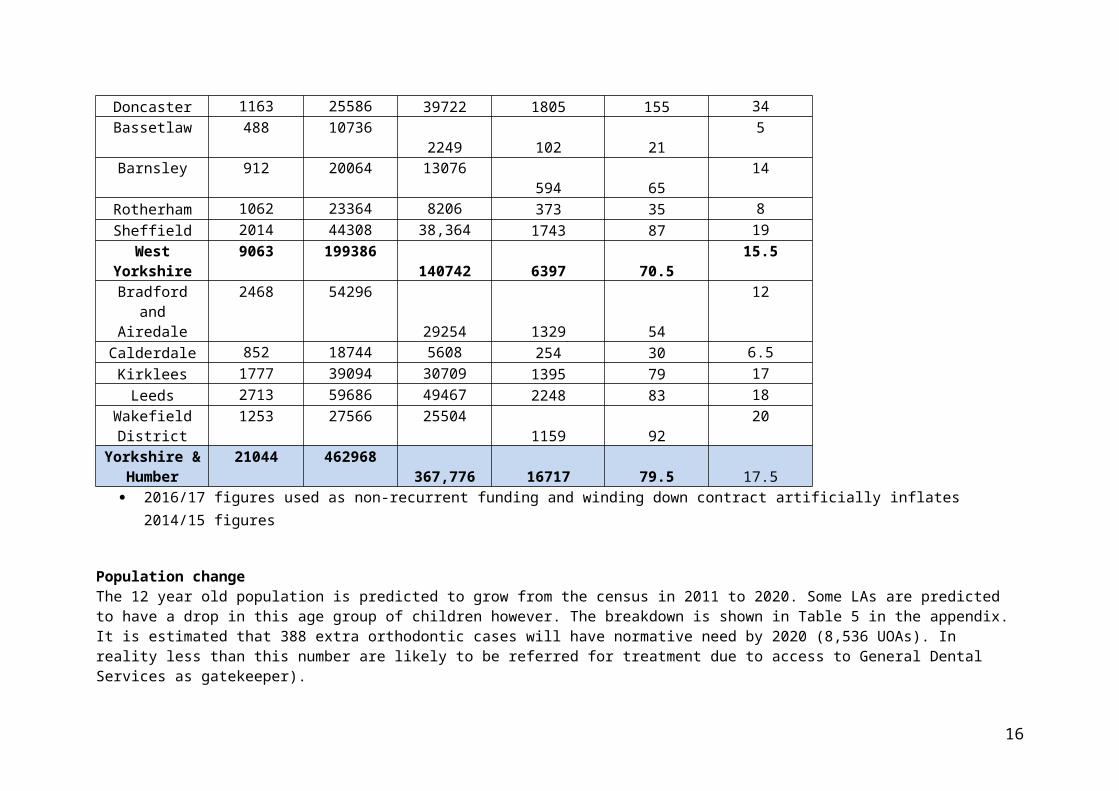
Yorkshire & Humber
21044 462968367,776 16717 79.5 17.5
2016/17 figures used as non-recurrent funding and winding down contract artificially inflates 2014/15 figures
Population change The 12 year old population is predicted to grow from the census in 2011 to 2020. Some LAs are predicted to have a drop in this age group of children however. The breakdown is shown in Table 5 in the appendix. It is estimated that 388 extra orthodontic cases will have normative need by 2020 (8,536 UOAs). In reality less than this number are likely to be referred for treatment due to access to General Dental Services as gatekeeper).
12
Other factors to consider in estimating orthodontic treatment needs Commissioners may want to consider the viability of a standalone orthodontic practice in terms of minimum of UOAs. Discussions with specialists have suggested 6500 UOAs to be a minimum but this is also dependent on the amount of private orthodontics that is provided as they are interdependent in running costs. Orthodontic services are mainly provided on a referral basis from General Dental Practitioners after assessment. In 2012/13, the percentage of 12-year-old children resident in Y&H who visited an NHS dentist had a wide variation between areas ranging between 42.5% and 100% at LA level. This year was selected as in the period to March 2015, fewer 12 year-old children on average visited a dentist. Therefore, not all children will be assessed and referred for orthodontic care if required. In addition, those attending may not perceive a need for treatment even if clinically indicated. Children who are referred for orthodontic treatment should be dentally fit, free from active decay and have good oral hygiene. In 2008 in Y&H, an average of 25% of 12-year olds had active and untreated tooth decay and may therefore be unsuitable for orthodontic treatment. Table 6 in the appendix shows a breakdown of how access to general dental services is likely to modify normative need in terms of referrals. The to tal UOAs needed for all orthodontic care is likely to be 416,174 based on GDP access (cf 367,776 UOAs currently commissioned = 88%).
Orthodontic service provision in Y&H Primary care orthodontic services in Y&H
In Y&H, there are 80 NHS primary care orthodontic contracts open; 38 are General Dental Services (GDS) mixed orthodontics contracts and 42 PDS contracts are limited to orthodontics. Primary care orthodontic contract spend (excluding the orthodontic component of mixed contracts) totalled £17,611,552, in 2015/16. However clawback on underperforming contracts for activity was £342,322 from activity in the year 2014/15. 462,968 UOAs would meet normative need but factoring in the percentage of children accessing general dental care as gatekeepers of referrals, this would reduce to 416,328 UOAs. 367,776 UOAs are currently contracted in primary care (88% of adjusted need for primary care access). This does not take into account hospital provision, private care or demand/suitability for orthodontic care. However the 12 year old population is predicted to grow.
Efficiency of use of UOAs in primary care
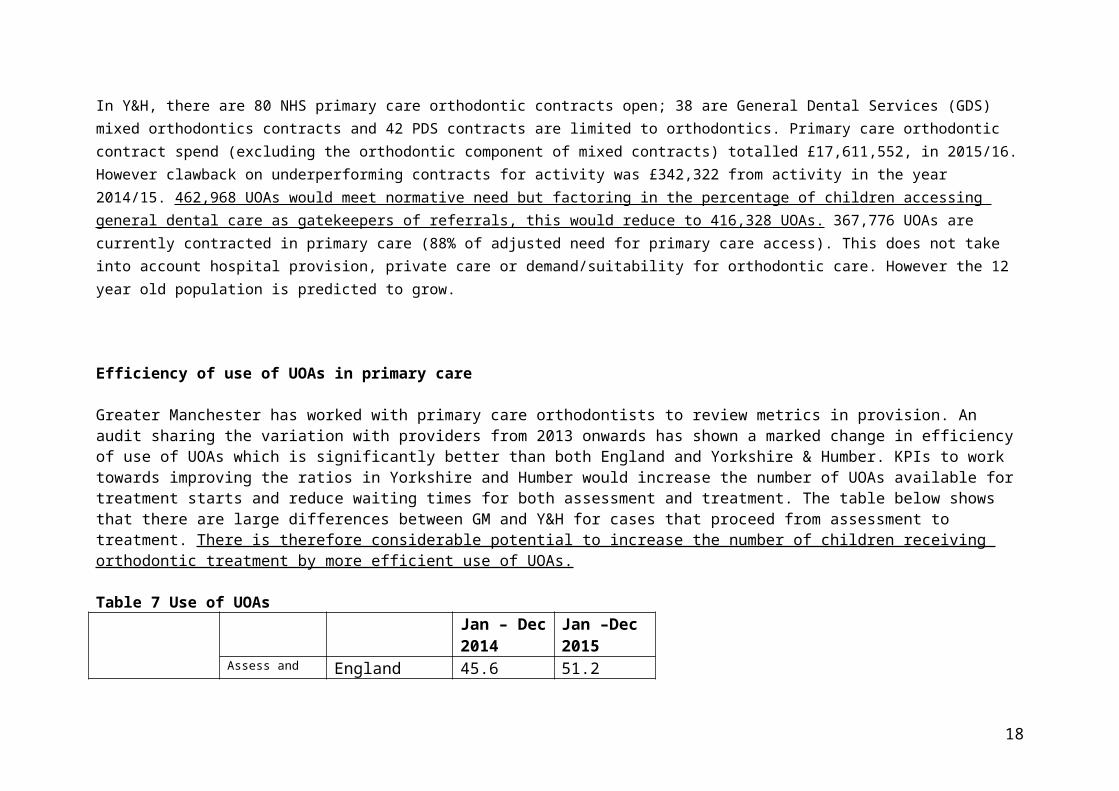
Greater Manchester has worked with primary care orthodontists to review metrics in provision. An audit sharing the variation with providers from 2013 onwards has shown a marked change in efficiency of use of UOAs which is significantly better than both England and Yorkshire & Humber. KPIs to work towards improving the ratios in Yorkshire and Humber would increase the number of UOAs available for treatment starts and reduce waiting times for both assessment and treatment. The table below shows that there are large
13
differences between GM and Y&H for cases that proceed from assessment to treatment. There is therefore considerable potential to increase the number of children receiving orthodontic treatment by more efficient use of UOAs.
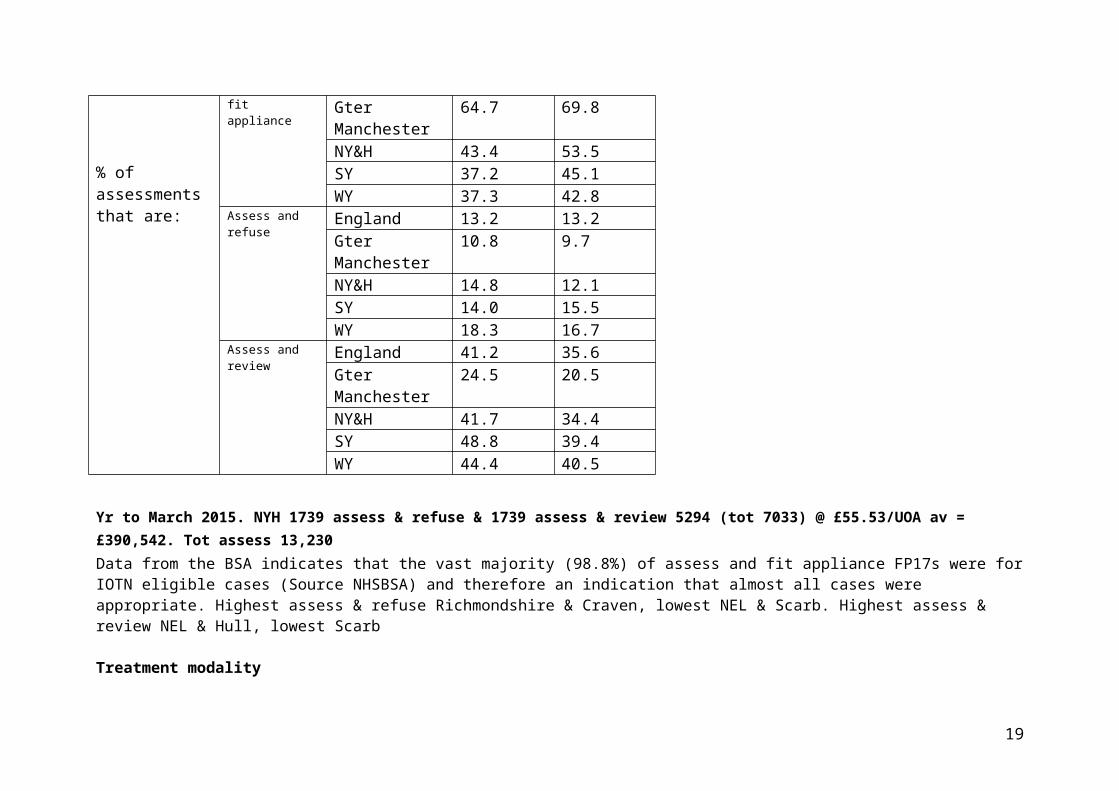
Table 7 Use of UOAs
% of assessments that are:
Jan – Dec 2014
Jan –Dec 2015
Assess and fit appliance
England 45.6 51.2Gter Manchester
64.7 69.8
NY&H 43.4 53.5SY 37.2 45.1WY 37.3 42.8
Assess and refuse
England 13.2 13.2Gter Manchester
10.8 9.7
NY&H 14.8 12.1SY 14.0 15.5WY 18.3 16.7
Assess and review
England 41.2 35.6Gter Manchester
24.5 20.5
NY&H 41.7 34.4SY 48.8 39.4WY 44.4 40.5
Yr to March 2015. NYH 1739 assess & refuse & 1739 assess & review 5294 (tot 7033) @ £55.53/UOA av = £390,542. Tot assess 13,230Data from the BSA indicates that the vast majority (98.8%) of assess and fit appliance FP17s were for IOTN eligible cases (Source NHSBSA) and therefore an indication that almost all cases were appropriate. Highest assess & refuse Richmondshire & Craven, lowest NEL & Scarb. Highest assess & review NEL & Hull, lowest Scarb
Treatment modality
14
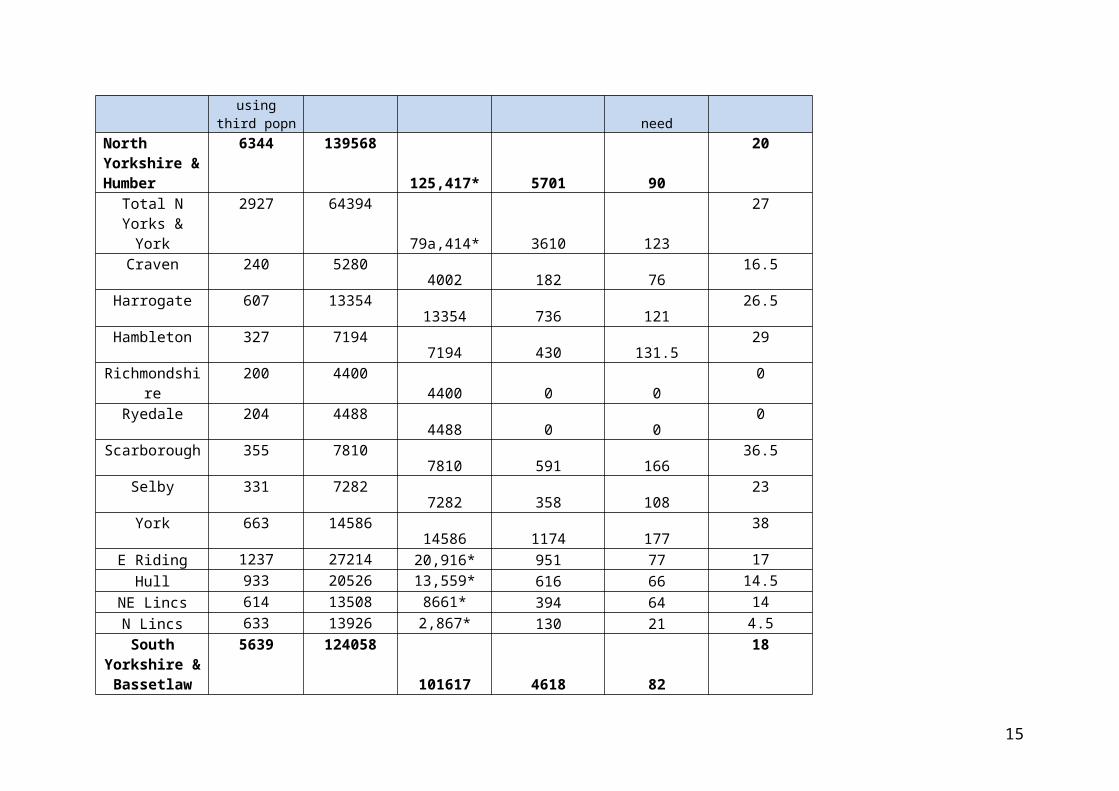
Table 8 in appendix demonstrates the amount of courses of treatment carried out with removable appliances only. It is widely accepted that in the majority of cases, fixed appliances provide more favourable outcomes. A high proportion may represent sub-optimal results for patients. Reasons needed to be explored with providers which are clearly above the national and area averages.
Patient flows Primary care dentistry, including orthodontic specialist services, is commissioned for patients choosing to attend a practice in that area and commissioning recognises the inflow of non-residents. However it is incumbent on commissioners to ensure they are commissioning services as locally as practical to centres of population, especially as children will be travelling every 6-8 weeks for approximately two years for orthodontic treatment. The cross border flow data for 2014/2015 has been investigated using data from the NHS BSA for each locality and are shown in tables 9-11 in the appendix. The highest flows were 4.5% into South Yorkshire from North Yorkshire & Humber and 4.3% into North Yorkshire & Humber from West Yorkshire
Waiting times In primary care waiting time data for orthodontic care is difficult to determine because there is no agreed methodology for assessing waiting times. As part of an audit, NHSE in Y&H asked for primary care orthodontic waiting times in early 2016 for a theoretical patient being referred that day for assessment or placed on a treatment waiting list. It was apparent that practices managed waiting lists in different ways (those that triaged patients and so had relatively short assessment numbers and longer treatment waiting times versus those who only saw patients when able to treat them if appropriate and therefore had relatively long assessment times and shorter treatment times). Some practices had also received non-recurrent funding for case starts which would impact on ratios.
Waiting times in Y&H for an assessment in primary care ranged from 1 to 176 weeks and 4 to 176 weeks for treatment (table 12, appendix). Data supplied by hospital trusts in 2016 showed that waiting times in secondary care for consultant led care were within 18 week targets.
Ethnicity Approximately 70% of primary care FP17(O) claim forms recorded ethnicity data across Y&H in 2014/15. The ethnic profile of people receiving NHS primary care orthodontic services in Y&H broadly matches the ethnic profile of the Y&H population, demonstrating equity of access to orthodontic services.
Deprivation and orthodontic need
15
The national Child Dental Health (CDH) survey (2003) examined orthodontic treatment needs among 12 to 15-year-olds and found that there was effectively no difference between children from deprived and less deprived areas in terms of need as the predisposing factors are more related to genetic predisposition, though this risk may be modified by disease or treatment. However, the 2013 CDH study showed that children in less deprived areas were more likely to use orthodontic services compared to children in more deprived areas. There are many possible reasons for a difference in uptake in areas such as attendance patterns of the child and parent, service provision, personal choice and personal health care priorities.
Referral management centres The current patient referral system works on market forces and historical choice of provider by the referring dental practitioner. This can lead to acceptance of unnecessary referrals, which may be inappropriate or ill-timed, multiple referrals, uneven waiting times and uneven distribution of service availability for patients. Referral management arrangements can monitor whether referral protocols have been followed and direct appropriate referrals to the most suitable. They can also prevent multiple referrals of the same patient and thus multiple assessments. However there are disadvantages in the cost of the service and may have limited benefit in rural areas where there is only one possible provider. Alternatively, commissioners should ensure that numbers of patient assessments per case start are kept under review so that resources are not disproportionately directed to multiple assessments on the same patient.
Referral letters including IOTN, details of motivation of the patient to have orthodontic treatment, caries levels and oral hygiene status have been developed between LDN and MCNs in Y&H, with a view to improving the quality of referrals. The adoption of these forms exclusively by orthodontic providers could be part of a service specification for primary care. Alternatively a fixed ratio of assessments to case starts could be considered.
Managed clinical networks Managed clinical networks (MCNs) should ensure that the highest standard of orthodontic care is provided by the local primary and secondary care workforce and co-ordinate the local provision of orthodontic care in conjunction with commissioners. MCNs can be instrumental in overseeing agreed care pathways, taking forward discussions and issues relating to referral management and developing further quality of outcome measures. They are crucial in the implementation of the new orthodontic commissioning guide but there are varying levels of engagement with orthodontists and MCNs across Y&H and they are at different stages of development. Consideration could be given to engagement with an MCN being a KPI.
16
Conclusion
An estimated £19.5 million is spent on orthodontic care in Y&H. Of this 9% (£1.9 million) is spent in hospital orthodontic services. Estimated need matched to capacity for primary care shows that there is 79.5% of case starts matched to need across Y&H. There are 17.5 UOAs available for each case start. 462,968 UOAs would meet normative need but factoring in percentage of children accessing general dental care as the interface for onward referrals, this would reduce to 416,328 UOAs ie 88% of cases of could potentially be treated. Factoring an un-quantified private market, cases with dental caries and hospital orthodontic service provision the data from this needs assessment suggests that the overall orthodontic activity contracted in Yorkshire and the Humber should meet identified need. However some areas may currently be over-commissioned eg Doncaster, North Yorkshire & York whereas North Lincs, Calderdale, Bassetlaw & Rotherham are significantly under-commissioned. The 12 year old population is predicted to grow slightly by 2020. There is also strong evidence that more effective use could be made of the available resources (contracted UOAs), enabling shorter waiting times and more people to receive orthodontic treatment. Efficient use of UOAs is key to securing sufficient treatment courses for the population. Quality is not simply related to the technical competence of treatment. It refers to whether care is relevant to need and to its effectiveness, efficiency, equity, acceptability and accessibility.
Recommendations NHS England should consider the following:
Redistribution of specialist primary care orthodontic services to a more equitable distribution based on child population and need Efficiency of use of UOAs is key to meeting need . Working with specialists and GDPs to improve the efficiency of UOA provision in
order to treat more cases and reduce waiting times Working with practices to validate waiting times and triage of waiting list Reporting on the CQiN methodology developed to determine how much orthodontic work is carried out in secondary care to further
inform provision of cases. Ensuring that primary and secondary care orthodontic contracts provide value for money and quality in outcomes Inclusion of key performance indicators (KPIs) in contracts across the area to improve the efficiency of UOA provision When contracts are reviewed, consideration needs to be given to a uniform price of UOA across Yorkshire and the Humber and that this
price reflects the best value for money. Encourage end of treatment claims by deferring 1 UOA to the end of treatment for best value
17
Consideration given to more specialist provision in primary care to avoid treatment planning costs in secondary care associated with GDP commissioning.
Removing activity from small contracts with less than 50 cases per year as per commissioning guide Consider different models of secondary care provision in primary care. Consider standard referral forms or a Referral Management System to improve appropriateness of referrals. Alternatively, ratio of
assessments to case starts could be at a fixed ratio which would avoid cost of RFM and still allow practices a flow of patients that could be offered private treatment if they did not meet NHS IOTN criteria for acceptance.
18
Support the further development of managed clinical networks in line with the orthodontic commissioning guide.
19
National or Regionally agreed PROMs & PREMs
20
Increased contract length for KPIs Commissioners in Yorkshire & the Humber could agree a consistent UOA price based on average figure so procurement exercises
could assess other quality measures to assess bids and award contracts. Average cost per case based on 22 UOAs in Y&H is £1258.84 compared to estimated cost of £1637 for secondary care provision (2016 prices and single disciplinary case.) Cost likely to be higher by non-specialist in primary care as will be additional treatment plan first appointment visit of £155 plus any additional interim reviews requested during treatment.
iPossible KPIs
ratio of assessments to case starts (consider 1.5:1) % of removable appliances Written consent to lifelong retention 100% PAR scores to BOS suggested standards Independent PAR scoring by calibrated examiner Random dipping of completed cases by MCN for PAR Fixed UOA cost as no treatment variation in historical patterns (cf UDA system) Abandoned/discontinued proportions Full completion of FP17O Min no of treatments 50 Completion of cases for new start up practices with no ongoing caseload at commencement Acceptance of referrals only via standard referral form or Triaged Referral System Re-treatment free if original treatment not satisfactory at completion (evidence study models) Treatment planning by specialist orthodontist Treatment overseen by specialist (frequency – at least once every two visits?) Active participation in MCN No less than amber score on BSA clinical monitoring report Innovation eg OH clinics, fluoride use, links to bullying prevention
Siobhán Grant, Consultant in Dental Public Health, Public Health England, Yorkshire & Humber CentreOctober 2016
21