Embed Size (px)
Citation preview
Online Repository, Kepert et al., 1
D-Tryptophan from probiotic bacteria influences the gut microbiome and allergic
airway disease
Inge Kepert PhD1, Juliano Fonseca PhD2, Constanze Müller PhD2, Katrin Milger MD1,
Kerstin Hochwind PhD3, Matea Kostric MSc4, Maria Fedoseeva MSc5, Caspar Ohnmacht
PhD5, Stefan Dehmel PhD1, Petra Nathan PhD1, Sabine Bartel PhD1,8, Oliver Eickelberg
MD1,6, Michael Schloter PhD4, Anton Hartmann PhD3, Philippe Schmitt-Kopplin PhD2,7
and Susanne Krauss-Etschmann MD1,6,8,9*
Materials and Methods
Reagents
L-Tryptophan and D-amino acids (A, F, H, I, L, M, P, S, T, V, W, Y) were purchased from
Carl Roth GmbH, Karlsruhe, Germany.
Growth conditions of bacteria and collection of supernatants
For the primary screen of bioactivity, probiotic strains were grown in complex de Man-
Rogosa-Sharpe (MRS) medium (Applichem, Darmstadt, Germany) at 37 oC under
microaerobic conditions in an Incubator (Thermo Fisher Scientific, Waltham, USA). For
metabolite analyses, the strains were grown in modified defined medium CDM1 (1)
which contains L-Tryptophan among 19 other L-amino acids, at 37 °C. In contrast to the
original medium, we omitted Tween 80, as it is known to interfere with mass
spectrometric analyses (2). E. Coli Nissle 1917 was grown aerobically in Luria-Bertani
(LB)-Medium on a rotary shaker (New Brunswick Scientific, Enfield, USA) (200 rpm) at
37 °C.
Generation of human monocyte-derived dendritic cells
1
12
1
2
3
4
5
6
7
8
9
10
11
12
13
14
15
16
17
18
19
20
21
22
23
24
34
Online Repository, Kepert et al., 2
Peripheral venous blood was obtained from healthy volunteers aged between 20 and 50
years after informed consent. Individuals with allergic disease, acute infection or taking
any medication 20 days prior to blood sampling or any history of smoking smokers
(personal interview) were excluded prior to blood sampling. All experiments were
conducted according to the principles expressed in the Declaration of Helsinki.
Peripheral blood mononuclear cells (PBMC) were isolated from heparinized whole blood
by density gradient centrifugation (2000 rpm, 22 °C, 20 min) (Biocoll, Biochrom AG,
Berlin, Germany). Adherent monocytes were obtained from PBMC via plastic adherence
in 12-well plates (Nunc, Wiesbaden, Germany) in 1.5 mL very low endotoxin (VLE)
RPMI 1640 medium (Biochrom AG, Berlin, Germany) supplemented with 5% human
serum type AB (CELLect®, MP Biomedicals™, Eschwege, Germany) and 1% glutamine
(Gibco® Invitrogen, Karlsruhe, Germany) for 1 h. Granulocyte macrophage colony-
stimulating factor (GM-CSF) and Interleukin (IL)-4 (CellGenix, Freiburg, Germany)
were added on days 1, 3, and 6 at 100 ng/mL and 20 ng/mL, respectively, yielding 2-3 x
106 immature DCs per well. Purity and viability of DCs was assessed by flow cytometry
(Fig E2A-C).
Human T cell line KM-H2
The human Hodgkin lymphoma T cell line (KM-H2) was purchased from the Leibniz
Institute DSMZ-German Collection of Microorganisms and Cell Cultures, Braunschweig,
Germany. 3-5 x 10⁶ KM-H2 cells were grown in 4 mL RPMI 1640 per well in 6-well-
plates (Nunc, Wiesbaden, Germany). All eukaryotic cells were cultured in 5% CO2 at 37
°C (HeraCell 240 and Heraeus BDD 6220, Thermo Fisher Scientific, Waltham, USA).
Viability of cells after treatment with bacterial supernatants was assessed by trypan blue,
7-AAD and CellTiter-Blue® staining. (Fig E2A-C)
2
56
25
26
27
28
29
30
31
32
33
34
35
36
37
38
39
40
41
42
43
44
45
46
47
48
49
50
51
78

Online Repository, Kepert et al., 3
Isolation of intestinal lamina propria cells
Total colons were excised from mice, removed from mesenteries, opened longitudinally
and cut into 2 cm long pieces that were incubated for 30 min in 30 mM EDTA in PBS on
ice and then shaken vigorously with PBS to remove epithelial cells. After further cutting
into small pieces with sharp scissors these were digested at 37 °C in RMPI supplemented
with 1 mg/mL collagenase D (Roche Diagnostics, Mannheim, Germany) and 10 mg/ml
DNAse I (Sigma-Aldrich, St. Louis, USA). Cells were separated by a 40/80% (w/v)
Percoll (GE Healthcare, Chalfont St. Giles, UK) density centrifugation step and washed
prior to staining for flow cytometry analysis.
Differentiation of murine primary T cells
Murine spleens from female Balb/c mice were filtered through a 40 µm filter to generate
single cell suspensions. These were then subjected to red blood cell lysis by using RBC
lysis buffer (Biolegend, San Diego, USA) according to the manufacturer’s
recommendations. Afterwards, naïve CD4+ T cells were isolated via magnetic-activated
cell sorting (MACS) using the naïve CD4+ T cell isolation kit (Miltenyi Biotec, Bergisch-
Gladbach, Germany). The resulting naïve CD4+ T cells were cultured in 96 wells plates
(1x10⁶ cells/ml Medium) in TexMACS medium supplemented with 10% FCS, 0.01 mM
2-Mercaptoethanol, rIL-2 (10 ng/ml) as well as MACSiBead particles with anti-CD3 and
anti-CD28 (1x10⁶ beads per 1x10⁶ cells) (all Miltenyi Biotec). Cells were differentiated
over a period of 6 days towards Th1 (10 ng/ml IL12 and 10 µg/ml anti-IL4, derived from
Cytobox Th1), Th2 (10 ng/ml Il4 and 10 µg/ml anti-Ifnγ, derived from Cytobox Th2) and
Treg (5 ng/ml) (all Miltenyi Biotec). Differentiation of cells was assessed by flow
cytometry (see Fig E8 for gating strategy), enhanced cytometric bead array (CBA) from
cell culture supernatants and qRT-PCR. Prior to CBA and flow cytometry, cells were
3
910
525354
55
56
57
58
59
60
61
62
63
64
65
66
67
68
69
70
71
72
73
74
75
76
77
1112
Online Repository, Kepert et al., 4
stimulated with monensin (0.7 µL/mL, BD Golgi Stop, BD Bioscience, Heidelberg,
Germany) for 4 h at 37 °C in the prescence of Ionomycin (500 ng/ml, Sigma Aldrich,
Missouri, USA) and PMA (5ng/ml, Sigma Aldrich, Missouri, USA).
Flow cytometry
Costimulatory molecules on human DCs
The following primary monoclonal antibodies were used: CD83 fluorescein
isothiocyanate (FITC); CD1a phycoerythrin (PE); CD86-FITC; CD80-PE; CD14
allophycocyanine (APC); CD40-APC; CD3-peridinin chlorophyll protein (PerCP); HLA-
DR-PerCP; mouse immunoglobulins G1 (IgG1) mouse immunoglobulins G1 (IgG1) κ were
used as isotype controls using the corresponding fluorochromes (all purchased from BD
Biosciences, Heidelberg, Germany). To account for donor dependent variability of DC
surface markers, all data were normalized to the expression induced by LPS which was
set to 100% after subtraction of background values (FACS Canto, FACS DIVA software,
Version 5.0.3, BD Biosciences, Heidelberg, Germany).
Murine DC subsets and CD4+ T cells
Single cell suspensions of splenocytes were obtained by filtering spleens through a 70 µm
strainer. Samples were stained with CD3-PB (1:200, Biolegend, San Diego, USA), CD4-
APC-H7 (BD, 1:400), CD11c- APC-Cy7 (1:100), Mhc-II-Percp-Cy5 (1:100), CD11b-
FITC (1:100), CD80-AF647, CD40-APC (1:100). For intracellular cytokines, total spleen
cells were stimulated with anti-CD3 (4 µg/mL, BD Bioscience, Heidelberg, Germany)
and anti-CD28 (30 ng/mL, BD Bioscience, Heidelberg, Germany) for 16 h. 1x10⁶ of total
lung cells were stimulated for 16h with MACSiBead particles coated with anti-CD3 and
anti-CD28 using the T cell activation/expansion kit (Miltenyi Biotec, Bergisch Gladbach,
Germany) in TexMACS medium (Miltenyi Biotec) according to the manufactures
4
1314
78
79
80
81
82
83
84
85
86
87
88
89
90
91
92
9394
95
96
97
98
99
100
101
102
103
1516
Online Repository, Kepert et al., 5
recommendations. Prior to staining, cells were treated with monensin (0.7 µL/mL, BD
Golgi Stop, BD Bioscience, Heidelberg, Germany) for 6 h at 37 °C and intracellularly
stained for Il-4-PE (1:100, eBioscience, Vienna, Austria according to the manufacturer’s
protocols. Intracellular staining for Foxp3 was performed by using the Foxp3/
Transcription Factor Staining buffer set (eBiosciences, Vienna, Austria) according to the
manufacturer’s recommendations.
The analysis was performed on an LSRII, with DIVA TM Software v8.0 (BD Bioscience,
Heidelberg, Germany), kindly provided by the core unit fluorescence cytometry of the
Research Center Borstel
Assessment of cytokines by cytometric bead array
Levels of Il4, Il5 and Il13 were analysed in BALF and cell culture supernatants using an
enhanced cytometric bead array (eCBA, Fex Set Kits, BD Biosciences, Franklin Lakes,
New Jersey, USA) according to the manufacturer’s guidelines.
Murine regulatory T cells
Cells were preincubated with Fc-Block (BD Bioscience, Heidelberg, Germany) for 5 min
and stained for 20 min with the following antibodies: FITC-conjugated anti-CD3, Alexa-
Fluor700-conjugated anti-CD4 and APC-eFluor780-conjugated CD45.2. For intracellular
staining, cells were fixed and permeabilized with a commercially available
fixation/permeabilization buffer (eBioscience, Vienna, Austria). LIVE/DEAD fixable
Aqua dead stain kit (Invitrogen, Carlsbad, USA) was used prior to fixation. Intracellular
staining was performed with PerCP-Cy5.5-conjugated anti-Foxp3 and Helios. Gates were
set on live CD45+CD3+CD4+ T cells. All antibodies were from eBioscience (Vienna,
5
1718
104
105
106
107
108
109
110
111
112
113
114
115
116
117
118119
120
121
122
123
124
125
126
127
1920
Online Repository, Kepert et al., 6
Austria). Cells were analyzed with a flow cytometer (Fortessa and LSRII, BD
Bioscience, Heidelberg, Germany) and analyzed with Flowjo software (Flowjo LLC,
Ashland, USA).
Quantification of CCL17 and cytokines in eukaryotic cell culture supernatants
CCL17 was quantified in cell culture supernatants of KM-H2 cells using ELISA reagent
Quantikine CCL17/TARC, (R&D Systems, Minneapolis, USA) according to the
manufacturer’s instructions (ELISA reader MRXII, Thermo Fisher Scientifc, Waltham,
USA).
For cytokine analyses, cell-free culture supernatants were collected from DCs after 24 h
incubation with either probiotic supernatants or D-Tryptophan, and were stored in
aliquots at −80 °C before analysis. For probiotic supernatants, blank CDM1 was used as
medium control. For D-Tryptophan we used L-Tryptophan, D- and L-Prolin as control.
IL-5, IFN-gamma, IL-12, and IL-10, were quantified by a multiplex assay (Milliplex
Human Cytokine Immunoassay, Millipore GMbH Schalbach, Germany) as described by
the manufacturer.
Bioassay-guided fractionation of probiotic supernatants and structural elucidation
of D-Tryptophan
Each fractionation step was controlled and driven by the results from the bioassays.
Fractionation according to polarity
Bioactive cell-free supernatants were first fractionated using stepwise gradient elution in
solid phase extraction cartridges. We applied 6 mL of bacteria free supernatants from
Lactobacillus casei W56 and Lactobacillus rhamnosus GG and CDM1 medium (control)
into SPE-C18 cartridges (1 g, Mega Bond Elut, Varian, Agilent Technologies, Santa Clara,
6
2122
128
129
130
131
132
133
134
135
136
137
138
139
140
141
142
143
144
145
146
147
148
149
150
151
2324

Online Repository, Kepert et al., 7
USA). We eluted in 10 steps using 2 mL of methanol/water solutions from 0% to 100%
MeOH. Each resulting eluate was divided in two equal volumes and dried in a SpeedVac
(SpeedVac Concentrator, Savant SPD 121P, Thermo Fisher Scientific, Waltham, USA)
for further bioassay experiments and chemical analyses. MeOH/water extracts that
showed bioactivity were resolved in 500 µL of 10% MeOH/water solution and further
subjected to a second fractionation using a pentafluorophenyl chromatographic column
(Kinetex PFP 1.7 μm, 2.1 x 150 mm, Phenomenex, Torrance, USA) in order to have a
complementary selectivity to C18 phase. A nonlinear gradient in 10 min from 5 to 25%
B, 14 min to 100% B at 40 °C with 0.180 mL/min flow rate (Mobile phase A: 10%
MeOH/H2O; B: 100% MeOH) was applied.
To this end, we coupled an Ultra Performance Liquid Chromatography system (UPLC-
PDA, Waters, UK) to an automatic fraction collector (TriVersa NanoMate, Advion
BioSciences, Ithaca, USA) to originate new sub-fractions, which were retested in our
bioassays. UPLC and collection methods were defined for the bioactive 20%
MeOH/water extract according to its chromatogram at λ=200nm in an attempt to collect
single peaks or at least, reduce the complexity present in each collected sub-fraction.To
obtain a large volume of each sub-fraction, the separation and collection process was
repeated 15 times. The results from the bioassays drove the chemical characterization of
the newly obtained bioactive sub-fractions.
Structural elucidation of the bioactive compound present in 20% MeOH extracts
The bioactive sub-fractions and their nearest neighbors collected from the second step
fractionation in PFP columns were reevaluated via UPLC (Acquity, Waters, Elstree, UK)
7
2526
152
153
154
155
156
157
158
159
160
161
162
163
164
165
166
167
168
169
170
171
172
173
174
2728
Online Repository, Kepert et al., 8
coupled to high resolution TOF Mass Spectrometer (maXis URH-TOF, Bruker Daltonics,
Bremen, Germany) to identify a candidate compound by comparing peak retention time
and m/z values between chromatograms. Here, we used reversed phase chromatography
(BEH-C18 1.7 μm, 2.1 x 150 mm, Waters) and gradient elution from 0 to 100% B in 8 min
at 40 °C (A: 10% MeOH / 0.1% formic acid / water; B: 0.1% formic acid / MeOH; flow
rate: 0.4 mL/min). Total Ion Chromatograms were obtained in electrospray ionization
(ESI) positive mode. We isolated the candidate compound by repeated chromatographic
runs followed by peak collection until 1 ml of volume was obtained to purify the
bioactive sub-fraction for further molecular formula assignment by high resolution FT-
ICR-MS in positive and negative ESI mode (APEX-Qe 12 Tesla, Bruker Daltonics,
Bremen, Germany) and for structural elucidation by proton NMR (UltraShield Plus 800
MHz, Bruker Biospin, Billerica, USA).
Chiral separation of amino acid enantiomers in fractionated supernatants
After chemical characterization of the bioactive sub-fraction, it was important to know
whether both isomers of Tryptophan were present in the solution. Therefore, we applied a
derivation technique using o-phthaldialdehyde (OPA) and N-isobutyryl-L-cysteine
(IBLC) (Sigma-Aldrich, St. Louis, USA) according to a previously described method(3)
(). Standard solutions containing D- and L-Tryptophan and our bioactive sub-fraction
were then analyzed by reversed phase chromatography using a small diameter UPLC
column (BEH-C18 1.7 μm, 1.0 x 150 mm, Waters, Elstree, UK) with isocratic elution at
45% B for 3 min at 60 ºC (A: 20 mM sodium acetate; B: 7% acetonitrile in MeOH; flow
rate: 0.1 mL/min) coupled to a fluorescence detector (λ=300 nm for the excitation; λ=
445 nm for the emission).
8
2930
175
176
177
178
179
180
181
182
183
184
185
186
187
188
189
190
191
192
193
194
195
196
197
198
199
3132
Online Repository, Kepert et al., 9
Enantiomeric separation of D-Tryptophan in murine sera
The investigator (C.M.) was blinded to the murine intervention groups. Due to the
abundance of interfering proteins a protein precipitation was done. For this purpose the
sera were thawed on ice and 20 µL of each sample were vigorously shaken with 80 µL 4
° C methanol (Chromasolve, Fluka, St. Louis, USA) and centrifuged (15,000 x g at 4 °C
for 15 min). The supernatants were taken, evaporated and resolved in water before
injection. The derivation was performed as described for bacterial supernatants with some
modifications as recently published (2). For quantification human serum was spiked with
different concentrations (0.005-0.15 µg/mL) of D-Tryptophan and randomly analyzed.
The enantiomeric ratio (peak area D-Tryptophan/peak area L-Tryptophan) was
calculated, and was observed to follow a linear regression (y=0.0406x+0.0102, R²>0.98).
Induction of allergic airway inflammation
Female 6-8 week old Balb/c mice (Charles River Laboratories, Wilmington, USA) were
sensitized i.p. using 10 µg of ovalbumin (grade VI; Sigma Aldrich, St. Louis, USA) or
PBS (controls) in alum (Pierce Chemical Co, Rockfort, USA) at day 0, 7 and 14 and
challenged intranasally under isoflurane narcosis with 10 µg of ovalbumin in 20 µl PBS
or PBS only (controls).
Lung Function
Animals were anesthetized i.p. with ketamine (140 mg/kg) and xylazine (7 mg/kg),
tracheostomized, intubated (18G tube), placed on a warming plate and ventilated with a
tidal volume of 10 mL/kg at a frequency of 150 breaths/minute and a positive end-
expiratory pressure of 2 cm H2O on a Buxco R/C system (Buxco Reseach Systems,
Wilmington, USA). To assess airway hyperreactivity, the mice were challenged with
9
3334
200
201
202
203
204
205
206
207
208
209
210
211
212
213
214
215
216
217
218
219
220
221
222
223
224
3536

Online Repository, Kepert et al., 10
metacholine in physiological saline generated with an in-line nebulizer and administered
directly with increasing concentrations (0, 12.5, 25, 50 mg/mL) by the ventilator for 20
seconds. Resistance (R) and Compliance (C) were measured continuously for 2 min and
the average was calculated and plotted against concentration.
Gene expression analysis in murine fetal lungs
Fetal lungs were collected from animals delivered via cesarean section at embryonic day
18.5 (Balb/c). Total RNA was isolated employing the miRNeasy Mini (Qiagen, Venlo,
Netherlands) including digestion of remaining genomic DNA. The Agilent 2100
Bioanalyzer (Agilent Technologies, Santa Clara, USA) was used to assess RNA quality
and only high quality RNA (RIN ≥ 8.7) was used for microarray analysis. For mRNA
profiling, 30 ng total RNA was amplified using the Ovation PicoSL WTA System V2 in
combination with the Encore Biotin Module (Nugen, San Carlos, USA). Amplified cDNA
was hybridized on an Affymetrix Mouse Gene ST 2.1 array plate. Staining and scanning
was done according to the Affymetrix expression protocol including minor modifications
as suggested in the Encore® Biotin protocol (NuGen, San Carlos, USA).
Bacterial 16S rRNA gene amplification and diversity analysis
Diversity analysis of 16S rRNA genes was performed by amplicon sequencing. In the
first PCR reaction, bacterial genomic DNA was subjected to 16S rRNA gene
amplifications using the primer S-D-Bact-0785-a-S-18[5'-GGMTTAGATACCCBDGTA-
3'] and S-*-Univ-1100-a-A-15 [5'-GGGTYKCGCTCGTTR-3'] as already mentioned.
The reaction mixture of 25 µL in total was composed of 5 ng x µL-1 template DNA, 10
µM of each primer, 10 mM dNTPs (Fermentas, Vilnius, Lithuania), 5% of dimethyl
10
3738
225
226
227
228
229230
231
232
233
234
235
236
237
238
239
240
241242
243
244
245
246
247
248
3940
Online Repository, Kepert et al., 11
sulfoxide (Sigma-Aldrich, St. Louis, USA), 5 U x µL-1 of FastStart High Fidelity
Polymerase (Roche Diagnostics, Mannheim, Germany), 10x FastStart Buffer, and
nuclease-free water (Life Technologies, Carlsbad, CA, USA). The PCR started with an
initialization at 95°C for 5 min, followed by 28 cycles of denaturation at 94°C for 45 sec,
annealing at 44°C for 45 sec, and elongation at 72°C for 45 sec. A final elongation step at
72°C for 5 min completed the PCR reaction. To minimize contamination with primer
dimers, generated fragments were cut out of the gel after standard agarose gel
electrophoresis and purified with the NucleoSpin Gel and PCR Clean-up Kit (Macherey-
Nagel, Düren, Germany).
During the second PCR, Illumina sequencing adapters as well as dual indices were
attached to the purified amplicons using the Nextera XT Index Kit (Illumina, San Diego,
CA, USA). The reaction volume was 50 µL in total and contained 5 µL of genomic DNA,
5 µL of each Nextera XT Index Primer, 25 µl 2x KAPA HiFi HotStart ReadyMix (Kapa
Biosystems, Wilmington, MA, USA), and 10 µL of nuclease-free water (Life
Technologies, Carlsbad, CA, USA). The PCR reaction was performed according to the
following thermal profile: 95°C for 3 min, followed by 8 cycles of 95°C for 30 sec, 55°C
for 30 sec, 72°C for 30 sec, and finalized by 72°C for 5 min. The PCR products were
cleaned up with the Agencourt AMPure XP system (Beckman Coulter, Brea, CA, USA),
DNA was quantified and the DNA quality was controlled using the 2100 Bioanalyzer
Instrument (Agilent Technologies, Santa Clara, CA, USA), and sequenced with the
MiSeq instrument (Illumina, San Diego, CA, USA).
Gene expression analysis
Total RNA was isolated from homogenized lung tissue or cell culture using the
11
4142
249
250
251
252
253
254
255
256
257
258
259
260
261
262
263
264
265
266
267
268
269
270
271
4344
Online Repository, Kepert et al., 12
miRNeasy Micro Kit according to manufacturer´s instructions (Qiagen, Venlo,
Netherlands). Concentrations were determined using a NanoDrop® ND-1000 (NanoDrop
Technologies, Erlangen, Germany) spectrophotometer. mRNA was transcribed to cDNA
with the QuantiTect Rev. Transcription kit (Qiagen, Venlo, Netherlands) and PCR for
specific genes was performed on a LightCycler 480 platform with Light Cycler 480
SYBR Green I Mastermix (Roche, Mannheim, Germany). Detailed qPCR primer
sequences are listed in table E3.
12
4546
272
273
274
275
276
277
278
279
280
281282
4748
Online Repository, Kepert et al., 13
References
1. Savijoki K, Suokko A, Palva A, Varmanen P. New convenient defined media for [(35)S]methionine labelling and proteomic analyses of probiotic lactobacilli. Lett Appl Microbiol. 2006 Mar;42(3):202–9.
2. Müller C, Fonseca JR, Rock TM, Krauss-Etschmann S, Schmitt-Kopplin P. Enan-tioseparation and selective detection of D-amino acids by ultra-high-performance liquid chromatography/mass spectrometry in analysis of complex biological sam-ples. J Chromatogr A. 2014 Jan 10;1324:109–14.
13
4950
283
284285286
287288289290
291
292
5152
Online Repository, Kepert et al., 14
Figure legends
Figure E1. Kinetic and volumes of supernatants from probiotic bacteria able to
lower CCL17 secretion from KM-H2 cells.
A, Capacity of supernatants from bacteria cultured in rich MRS medium to lower
CCL17 secretion of KM-H2 cells
B, Capacity of supernatants from bacteria cultured in restricted CDM1 medium to
lower CCL17 secretion of KM-H2 cells
(■2 h; ● 6 h; ▲ 12 h; ♦24 h; ▼48 h). Data are shown each from three independent
experiments in duplicate (mean percentages ± SD, relative to constitutive CCL17
secretion of untreated KM-H2).
Figure E2. Viability of KM-H2 cells and primary DCs
Viability analysis of KM-H2cells (upper panel) and primary DCs (lower panel) after
treatment with probiotic supernatants with trypanblue (A), 7-AAD staining (B) and
photometric analysis after treatment with CellTiter-Blue® reagent (C). D, Purity
assessment of primary DCs via flow cytometry before (left panel) and after LPS
stimulation (right panel) (representative image).(right panel)
Figure E3. UPLC-PDA chromatogram of 20% MeOH/H2O extract from L.
casei W56 supernatant
A, Sub-fractions and their time of collection were decided based on the peaks
observed in the chromatogram. B, Immune modulatory activity was observed for
sub-fractions 7, 8 and 9. Chromatographic conditions: Kinetex PFP column 1.7μm
particle size, 2.1 x 150mm. Nonlinear gradient in 10 min from 5 to 25% B, 14
min to 100% B at 40 °C with 0.180 mL/min flow rate (Mobile phase A: 10%
MeOH/H2O; B: 100% MeOH).
14
5354
293
294
295
296
297
298
299
300
301
302
303
304
305
306
307
308
309
310
311
312
313
314
315
316
317
318
5556
Online Repository, Kepert et al., 15
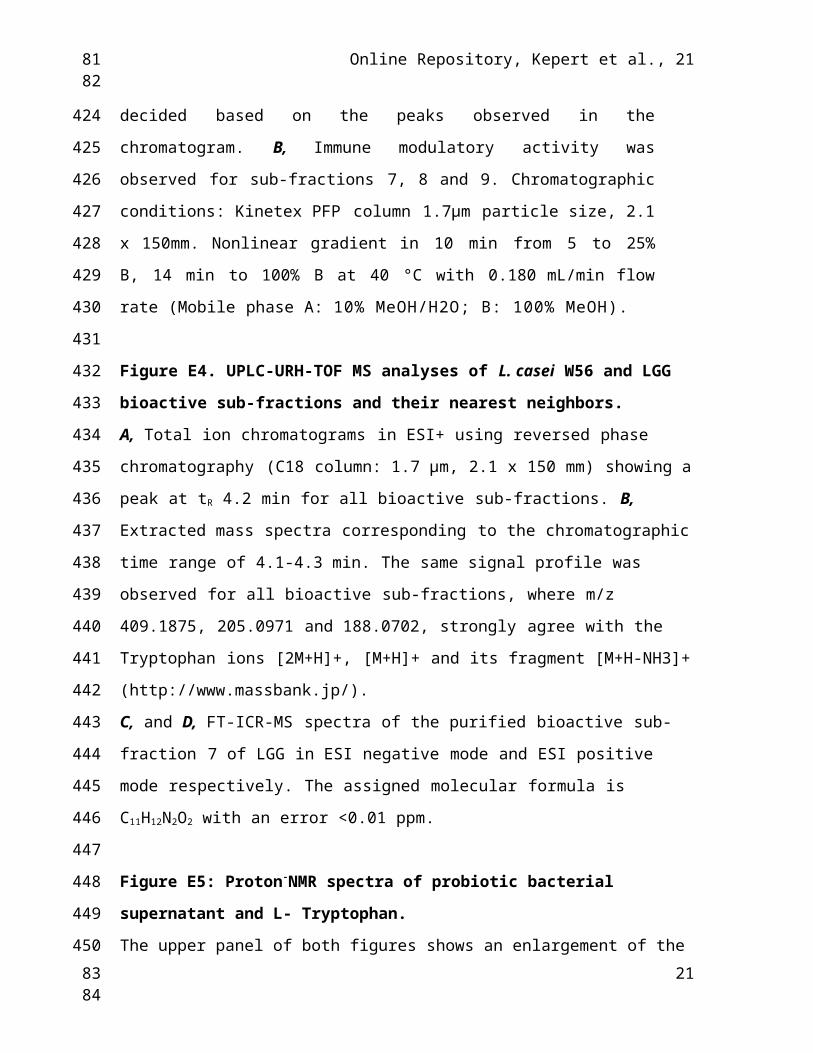
Figure E4. UPLC-URH-TOF MS analyses of L. casei W56 and LGG
bioactive sub-fractions and their nearest neighbors.
A, Total ion chromatograms in ESI+ using reversed phase chromatography (C18
column: 1.7 μm, 2.1 x 150 mm) showing a peak at tR 4.2 min for all bioactive sub-
fractions. B, Extracted mass spectra corresponding to the chromatographic time range of
4.1-4.3 min. The same signal profile was observed for all bioactive sub-fractions, where
m/z 409.1875, 205.0971 and 188.0702, strongly agree with the Tryptophan ions
[2M+H]+, [M+H]+ and its fragment [M+H-NH3]+ (http://www.massbank.jp/).
C, and D, FT-ICR-MS spectra of the purified bioactive sub-fraction 7 of LGG in ESI
negative mode and ESI positive mode respectively. The assigned molecular formula is
C11H12N2O2 with an error <0.01 ppm.
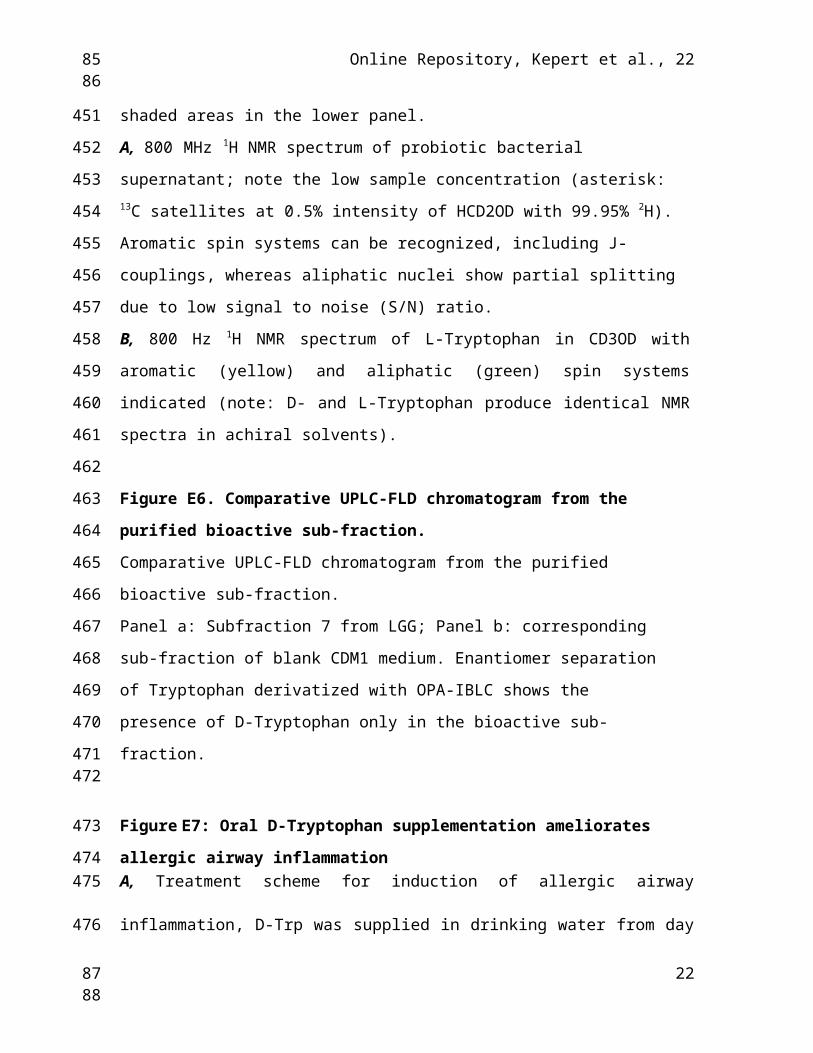
Figure E5: Proton-NMR spectra of probiotic bacterial supernatant and L-
Tryptophan.
The upper panel of both figures shows an enlargement of the shaded areas in the lower
panel.
A, 800 MHz 1H NMR spectrum of probiotic bacterial supernatant; note the low sample
concentration (asterisk: 13C satellites at 0.5% intensity of HCD2OD with 99.95% 2H).
Aromatic spin systems can be recognized, including J-couplings, whereas aliphatic nuclei
show partial splitting due to low signal to noise (S/N) ratio.
B, 800 Hz 1H NMR spectrum of L-Tryptophan in CD3OD with aromatic (yellow) and
aliphatic (green) spin systems indicated (note: D- and L-Tryptophan produce identical
NMR spectra in achiral solvents).
Figure E6. Comparative UPLC-FLD chromatogram from the purified bioactive
sub-fraction.
15
5758
319
320
321
322
323
324
325
326
327
328
329
330
331
332
333
334
335
336
337
338
339
340
341
342
343
344
345
5960
Online Repository, Kepert et al., 16
Comparative UPLC-FLD chromatogram from the purified bioactive sub-fraction.
Panel a: Subfraction 7 from LGG; Panel b: corresponding sub-fraction of blank
CDM1 medium. Enantiomer separation of Tryptophan derivatized with OPA-IBLC
shows the presence of D-Tryptophan only in the bioactive sub-fraction.
Figure E7: Oral D-Tryptophan supplementation ameliorates allergic airway
inflammationA, Treatment scheme for induction of allergic airway inflammation, D-Trp was supplied
in drinking water from day -3 in respective groups. B, Measurement of airway resistance
to increasing doses of methacholine. C, Percent Il-4+ and Il-13+ cells within spleen
CD3+CD4+ T cells. D, CD40+ and CD80+ on spleen CD11bhighDCs, Box and whisker
plots: Maximum and minimum values (whiskers), the upper and lower quartiles (boxes)
and median (horizontal line). (A) 7-8 mice/group, mean ± SD, Two-way ANOVA with
Bonferroni post-test. *p<0.05, ***p<0.001.
Figure E8. In vitro differentiation of primary T cellsMurine naïve CD4+ cells were differentiated in vitro for 6 days with respective cytokines.
Gating strategy for analysis of (A) Th1 & Th2 cells as assessed by CD4+Ifny+ or CD4+Il4+
, respectively, and induced Tregs as CD4+CD25+Foxp3+ cells (B). Representative images
of n=4 independent experiments.
Figure E9. Influences of D-Tryptophan supplementation on the intestinal bacterial
composition in healthy and diseased mice.
A, An unweighted UniFrac distance matrix based on OTU counts was used to perform
Principal Coordinate Analysis (PCoA). The generated scatterplot indicates dissimilarities
between individual samples. Statistical significance was determined with Student’s t test,
16
6162
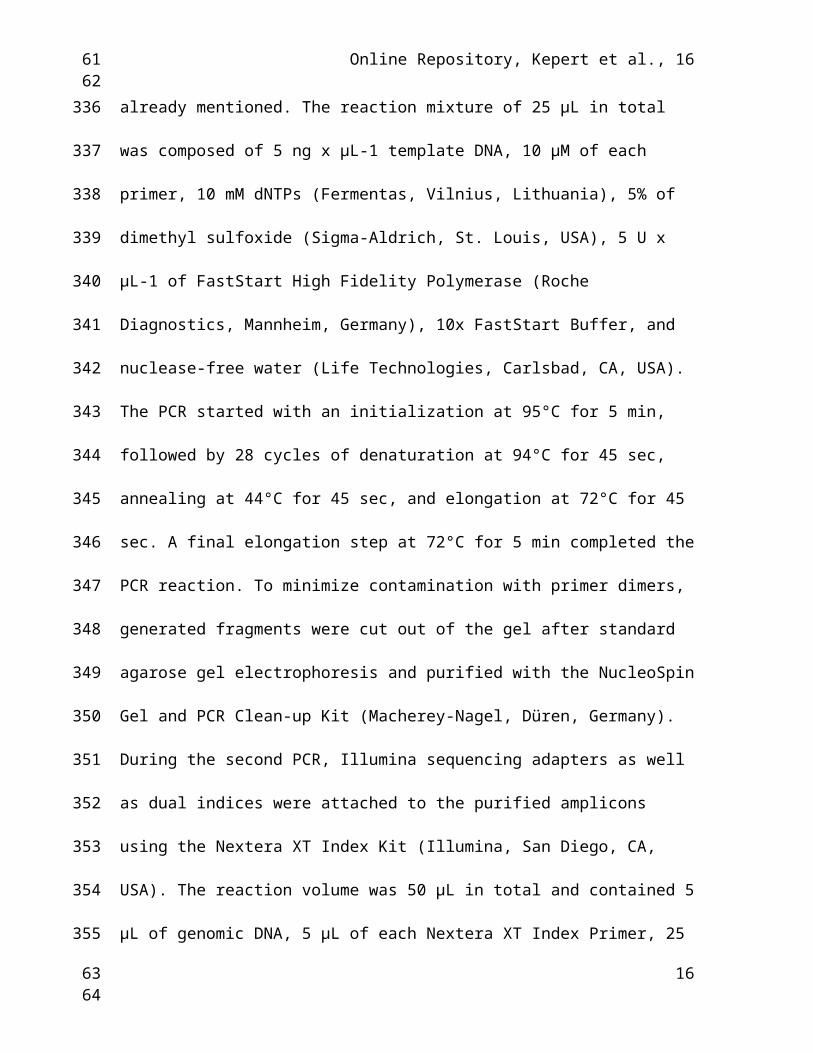
346
347
348
349350
351
352353
354
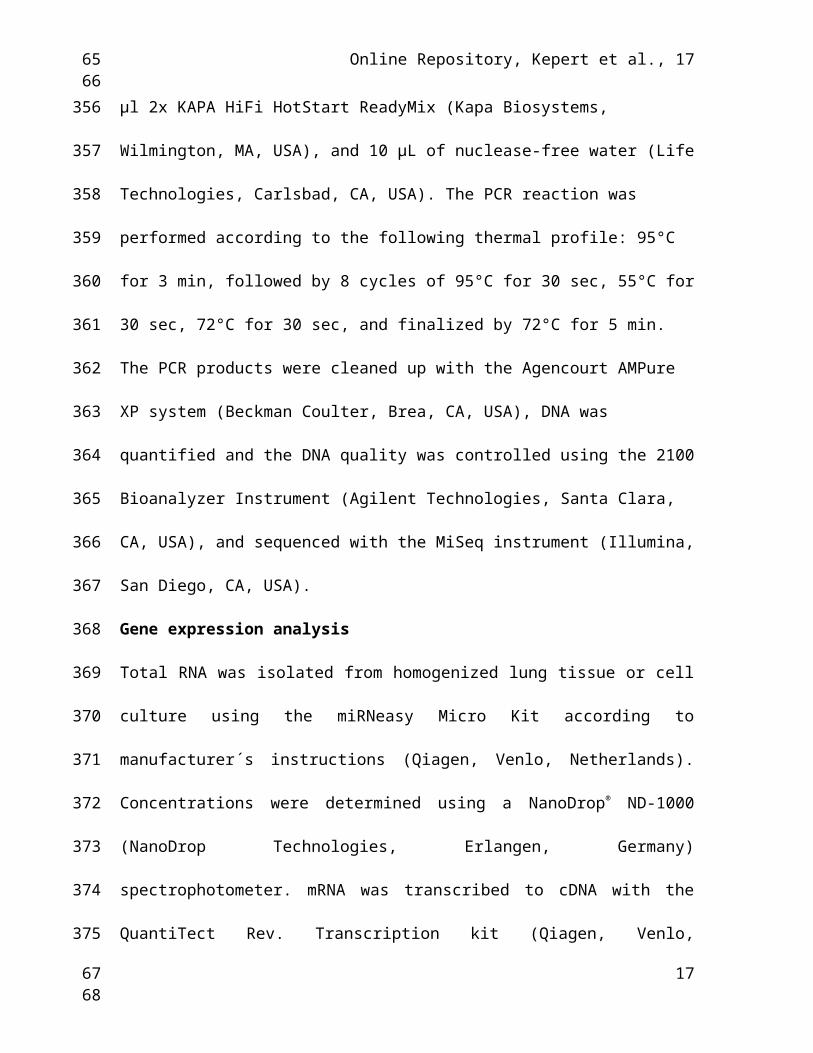
355
356
357
358
359
360361
362
363
364
365
366
367
368
369
370
6364
Online Repository, Kepert et al., 17
P=0.001. All results are based on 95%-similarity OTUs. OTU, operational taxonomic
unit. PC, principal coordinate. Ova, ovalbumin. PBS, phosphate buffered saline. B,
Proportion of dominant bacteria (>0.05% abundance) in the intestinal tract of healthy and
diseased mice. Pie charts were generated to visualize the relative distribution of the most
abundant bacteria at the family level.
Figure E10. Expression of Slc6a family members in lungs of neonatal mice.
Sketch-quantile normalized linear intensity (mean ± SD). Background levels (dashed
line). Male and female neonates (n=4 each).
17
6566
371
372
373
374
375
376
377
378
379
380
6768

Online Repository, Kepert et al., 18
TABLES
Table E1: Bacterial strains used in this study
Bacterial strain Provider Bioactivity on1
KM-H2 DC
Lactobacillus rhamnosus DSM-20021 Leibniz Institute DSMZ - -
Lactobacillus rhamnosus GG Valio Ltd, Helsinki, Finland + +
Lactobacillus acidophilus W22 Winclove Bioindustries BV + +
Lactobacillus acidophilus W37 Winclove Bioindustries BV - -
Lactobacillus acidophilus W50 Winclove Bioindustries BV - -
Lactobacillus acidophilus W74 Winclove Bioindustries BV - -
Lactobacillus acidophilus DSM-20079 Leibniz Institute DSMZ - -
Lactobacillus acidophilus LA-2 Chr. Hansen + +
Lactobacillus acidophilus LA-5 Chr. Hansen + +
Lactobacillus casei W56 Winclove Bioindustries BV + +
Lactobacillus casei W79 Winclove Bioindustries BV + +
Lactobacillus paracasei DSM-20312 Leibniz Institute DSMZ - -
Lactobacillus paracasei subsp. paracasei LC-
01
Chr. Hansen + +
Lactobacillus gasseri W44 Winclove Bioindustries BV - -
Lactobacillus gasseri DSM-20077 Leibniz Institute DSMZ - -
Lactobacillus helveticus W60 Winclove Bioindustries BV - -
Lactobacillus plantarum W21 Winclove Bioindustries BV - -
Lactobacillus plantarum W62 Winclove Bioindustries BV - -
Lactobacillus plantarum DSM-20174 Leibniz Institute DSMZ - -
Lactobacillus rhamnosus W102 Winclove Bioindustries BV - -
Lactobacillus salivarius W24 Winclove Bioindustries BV - -
Lactobacillus salivarius W57 Winclove Bioindustries BV - -
Bifidobacterium animalis subsp. lactis BB-12 Chr. Hansen, Horsholm,
Denmark
+ +
Bifidobacterium breve W25 Winclove Bioindustries BV,
Amsterdam, Netherlands
- -
18
6970
381
382
383
7172
Online Repository, Kepert et al., 19
Bacterial strain Provider Bioactivity on1
KM-H2 DC
Bifidobacterium breve DSM-20091 Leibniz Institute DSMZ-
German Collection of
Microorganisms and Cell
Cultures, Braunschweig,
Germany
- -
Bifidobacterium bifidum DSM-20456 Leibniz Institute DSMZ - -
Bifidobacterium lactis BB-420 Danisco, Niebüll, Germany + +
Bifidobacterium lactis W51 Winclove Bioindustries BV - -
Bifidobacterium lactis W52 Winclove Bioindustries BV + +
Bifidobacterium longum BB-46 Chr. Hansen + +
Bifidobacterium longum W108 Winclove Bioindustries BV + +
Bifidobacterium longum subsp. infantis DSM-
20088
Leibniz Institute DSMZ - -
Enterococcus faecium W54 Winclove Bioindustries BV - -
Lactococcus lactis W19 Winclove Bioindustries BV - -
Lactococcus lactis W32 Winclove Bioindustries BV - -
Lactococcus lactis W58 Winclove Bioindustries BV + +
Streptococcus thermophilus W69 Winclove Bioindustries BV - -
Escherichia coli Nissle 1917 Ardeypharm GMbH,
Herdecke, Germany
- -
1Ability of bacterial cell free supernatants to lower CCL17 secretion by KMH2 cells (left) and to
reduce LPS-induced up-regulation of costimulatory molecules on human monocyte derived dend-
ritic cells (DC, left)
19
7374
384
385
386
387
388
389
390
391
7576
Online Repository, Kepert et al., 20
20
7778
392
7980
Online Repository, Kepert et al., 21
Table E2:
21
Table E2. Regulation of GPR109B (NIACR2) in asthmatic or atopy subjects compared to controls*
foldchange
Airway epithelial cells from children with atopic asthma vs. healthy children
GSE18965 0.0447 -2.95
Airway epithelial cells 4hr after saline exposure - atopy and asthma subjects vs. control
GSE8190 0.0042 -1.53
CD4+ T cells isolated from blood of patients with non-severe asthma vs. healthy subjects
GSE31773 1.8E-5 -2.29
CD8+ T cells isolated from blood of patients with non-severe asthma vs. healthy subjects
GSE31773 0.0002 -1.91
* Data for GPR109B association with asthma was extracted from the Disease Atlas Database (www.nextbio.com).
Experimental conditions GEO Acc. p value
8182
393
395
396
397
398
399
400
401
402403
8384
Online Repository, Kepert et al., 22
Table E3: primer sequences used for qRT-PCR
22
Name fwd 5'-> 3' rev 5'-> 3'Gata 3 CTTATCAAGCCCAAGCGAAG CATTAGCGTTCCTCCTCCAG
IL4 GGATGCGACAAAAATCACTTG TTGGAAGCCCTACAGACGAGIL13Ifny AGGTCAACAACCCACAGGTC GAATCAGCAGCGACTCCTTT
Foxp3 TCAAGTACCACAATATGCGACC TAGGCGAACATGCGAGTAAAC
Mm_Il13_1_SG QuantiTect Primer Assay (Qiagen)
8586
404
405
406
8788


![CONSTANZE DIETRICH - RIPE 77 · The Human Factors of Security Misconfigurations Let’s Fix the Weakest Link. CONSTANZE DIETRICH LEXTA Consultants Group [@WeddingTrash // constanze.dietrich@lexta.com]](https://img.pdfslide.us/doc/110x75/5ed2f3ed3e92a05e0d15d5da/constanze-dietrich-ripe-77-the-human-factors-of-security-misconfigurations-letas.jpg)