Embed Size (px)
Citation preview
System Definition Review Team 330 March, 2010 . Team XG Itnl. Inc.
1 | P a g e
System Definition Review
March
System Definition Review Team 330 March, 2010 . Team XG Itnl. Inc.
C o n t e n t sC o n t e n t s.................................................................................................................................................2
Executive Summary.................................................................................................................................4
III. Mission Statement..........................................................................................................................6
IV. Review Major Design Requirements...............................................................................................6
V. Aircraft Concept Selection...............................................................................................................7
Pugh’s Method and the team process.....................................................................................................7
Further Analysis.....................................................................................................................................10
Concept 1:.........................................................................................................................................10
Concept 2:.........................................................................................................................................13
VI. Advanced Technologies and Concepts.........................................................................................14
VII. Constraint Analysis / Constraint Diagram....................................................................................15
Major performance constraints and basic assumptions for initial estimates........................................15
Top of climb.......................................................................................................................................16
Subsonic 2g maneuver 250kts at h = 10000ft....................................................................................17
Takeoff Ground Roll 4000ft at h = 5000ft with +15 Hot day..............................................................17
Landing Ground Roll 2500ft at h = 5000ft with +15 Hot day..............................................................17
Second-segment Climb Gradient above h = 5000ft, +15 Hot day......................................................17
Current Constraint Diagram...................................................................................................................18
VIII. Most Recent Sizing Studies.........................................................................................................19
Aircraft design mission..........................................................................................................................19
Current Sizing Approach........................................................................................................................21
Validation..............................................................................................................................................21
Current Status........................................................................................................................................24
Drag Prediction..................................................................................................................................24
Current description of aircraft concepts............................................................................................24
Takeoff Gross Weight, Weight Breakdown........................................................................................25
IX. Engine / Propulsion Selection.......................................................................................................28
2 | P a g e
System Definition Review Team 330 March, 2010 . Team XG Itnl. Inc.
Engine Modeling and Concept Descriptions and baseline designs:.......................................................28
Technology Factors:...............................................................................................................................32
X. Initial Center of Gravity, Stability and Control Estimates............................................................33
Center of Gravity for design condition...................................................................................................33
Estimate of static margin in representative cruise condition................................................................33
Approach for sizing surfaces, and current sizing estimates...................................................................34
XI. Summary of Aircraft Concepts......................................................................................................35
Current Compliance Estimates..............................................................................................................36
Next Steps.............................................................................................................................................38
XII. Appendix......................................................................................................................................40
Appendix A: Bibliography......................................................................................................................40
Appendix B: Auxiliary Images................................................................................................................41
Appendix C: Sizing Code samples..........................................................................................................43
Appendix D: Team Decided Merit Pool..................................................................................................49
Appendix E: Endnotes............................................................................................................................50
3 | P a g e
System Definition Review Team 330 March, 2010 . Team XG Itnl. Inc.
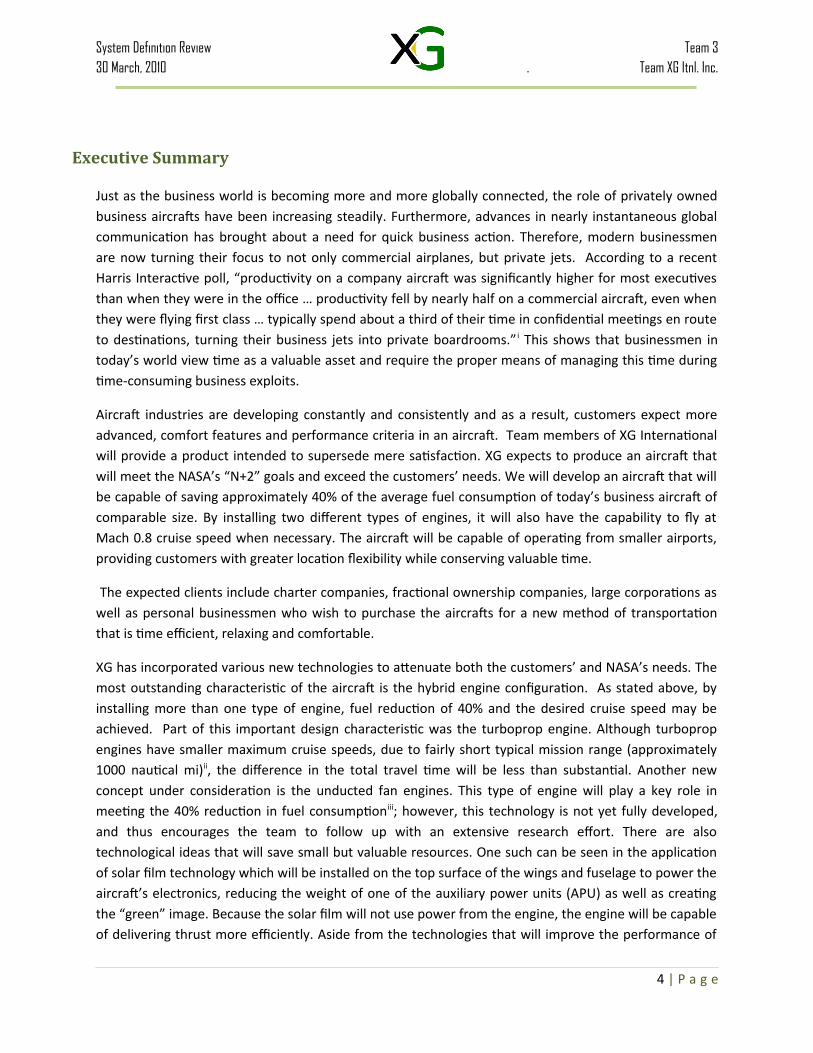
Executive Summary
Just as the business world is becoming more and more globally connected, the role of privately owned business aircrafts have been increasing steadily. Furthermore, advances in nearly instantaneous global communication has brought about a need for quick business action. Therefore, modern businessmen are now turning their focus to not only commercial airplanes, but private jets. According to a recent Harris Interactive poll, “productivity on a company aircraft was significantly higher for most executives than when they were in the office … productivity fell by nearly half on a commercial aircraft, even when they were flying first class … typically spend about a third of their time in confidential meetings en route to destinations, turning their business jets into private boardrooms.” i This shows that businessmen in today’s world view time as a valuable asset and require the proper means of managing this time during time-consuming business exploits.
Aircraft industries are developing constantly and consistently and as a result, customers expect more advanced, comfort features and performance criteria in an aircraft. Team members of XG International will provide a product intended to supersede mere satisfaction. XG expects to produce an aircraft that will meet the NASA’s “N+2” goals and exceed the customers’ needs. We will develop an aircraft that will be capable of saving approximately 40% of the average fuel consumption of today’s business aircraft of comparable size. By installing two different types of engines, it will also have the capability to fly at Mach 0.8 cruise speed when necessary. The aircraft will be capable of operating from smaller airports, providing customers with greater location flexibility while conserving valuable time.
The expected clients include charter companies, fractional ownership companies, large corporations as well as personal businessmen who wish to purchase the aircrafts for a new method of transportation that is time efficient, relaxing and comfortable.
XG has incorporated various new technologies to attenuate both the customers’ and NASA’s needs. The most outstanding characteristic of the aircraft is the hybrid engine configuration. As stated above, by installing more than one type of engine, fuel reduction of 40% and the desired cruise speed may be achieved. Part of this important design characteristic was the turboprop engine. Although turboprop engines have smaller maximum cruise speeds, due to fairly short typical mission range (approximately 1000 nautical mi)ii, the difference in the total travel time will be less than substantial. Another new concept under consideration is the unducted fan engines. This type of engine will play a key role in meeting the 40% reduction in fuel consumption iii; however, this technology is not yet fully developed, and thus encourages the team to follow up with an extensive research effort. There are also technological ideas that will save small but valuable resources. One such can be seen in the application of solar film technology which will be installed on the top surface of the wings and fuselage to power the aircraft’s electronics, reducing the weight of one of the auxiliary power units (APU) as well as creating the “green” image. Because the solar film will not use power from the engine, the engine will be capable of delivering thrust more efficiently. Aside from the technologies that will improve the performance of
4 | P a g e
System Definition Review Team 330 March, 2010 . Team XG Itnl. Inc.
the aircraft, several other advanced concepts are under consideration to provide ample comfort to the clients.
With the aforementioned technologies and comfort features, we are confident that our aircraft will impress any future client. Based on the current market share of the business aircrafts, the marketing goal is to gain an optimistic but feasible 7% of the market share in the United States business aircraft industry. We are proud to present to you, the next generation business aircraft, XG Endeavour.
- Team XG
5 | P a g e
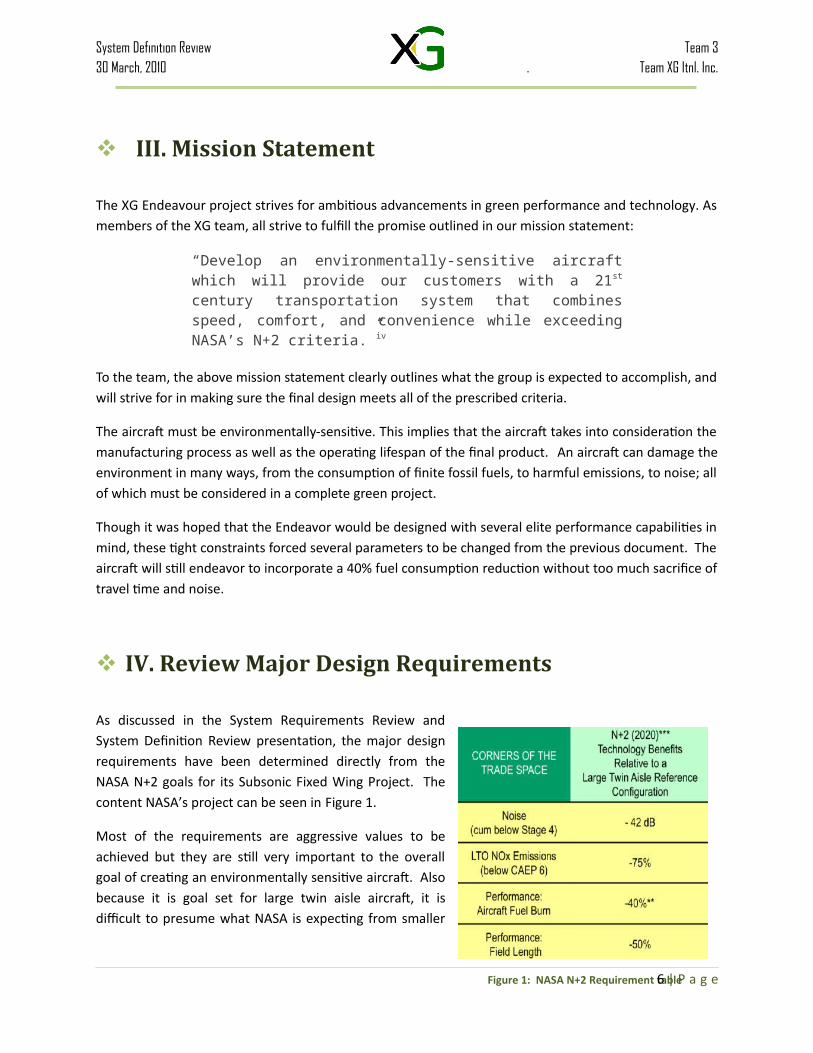
Figure 1: NASA N+2 Requirement table
System Definition Review Team 330 March, 2010 . Team XG Itnl. Inc.
III. Mission Statement
The XG Endeavour project strives for ambitious advancements in green performance and technology. As members of the XG team, all strive to fulfill the promise outlined in our mission statement:
“Develop an environmentally-sensitive aircraft which will provide our customers with a 21st century transportation system that combines speed, comfort, and convenience while exceeding NASA’s N+2 criteria.”iv
To the team, the above mission statement clearly outlines what the group is expected to accomplish, and will strive for in making sure the final design meets all of the prescribed criteria.
The aircraft must be environmentally-sensitive. This implies that the aircraft takes into consideration the manufacturing process as well as the operating lifespan of the final product. An aircraft can damage the environment in many ways, from the consumption of finite fossil fuels, to harmful emissions, to noise; all of which must be considered in a complete green project.
Though it was hoped that the Endeavor would be designed with several elite performance capabilities in mind, these tight constraints forced several parameters to be changed from the previous document. The aircraft will still endeavor to incorporate a 40% fuel consumption reduction without too much sacrifice of travel time and noise.
IV. Review Major Design Requirements
As discussed in the System Requirements Review and System Definition Review presentation, the major design requirements have been determined directly from the NASA N+2 goals for its Subsonic Fixed Wing Project. The content NASA’s project can be seen in Figure 1.
Most of the requirements are aggressive values to be achieved but they are still very important to the overall goal of creating an environmentally sensitive aircraft. Also because it is goal set for large twin aisle aircraft, it is difficult to presume what NASA is expecting from smaller aircrafts such as ours. However, our goal is to achieve N+2 goals compared to similar size business aircrafts of today.
6 | P a g e
System Definition Review Team 330 March, 2010 . Team XG Itnl. Inc.
Noise plays a vital role into what airports our designed aircraft can land at.v All airports have different specifications for noise level so it is important to keep the noise to a minimum to enable a wider variety of landing spots. This also goes for the field length of the runways. Designing an aircraft with a shorter landing and takeoff distance opens the doors for our aircraft to land at more airports. This is largely important because it would put the jet another step ahead of commercial aircraft along with other larger jets for the number of airports serviced. Also, referring to the environmentally sensitive aircraft movement, the goal is to attempt to drop NOx emissions by 75% and TSFC by 40%. iv This is a very aggressive goal which may be difficult to achieve given the constraints of this particular project. Nevertheless, the team plans to work through the challenge and satisfy these conditions by implementing hybrid engine system. The newly designed aircraft should be more economically sensitive than any current aircraft in the market using modern technology. While the requirements from NASA’s Subsonic Fixed Wing Project are not the only mentioned design requirements, they definitely are at the forefront of the design team’s interest.
V. Aircraft Concept Selection General overview
The team chose a basic aircraft body through a common decision making matrix most frequently called Pugh’s Method. Desired features established from the QFD found in the previous report were used to outline the aircraft qualities. In order to select the basic outline that would serve as a guide for future steps, XG focused on different concept sketches and compared each suggested option against a datum concept. This method of choosing the aircraft can also be applied to any other engineering design decisions.
Pugh’s Method and Team Process
Pugh’s method is a comparable technique used to evaluate different options in a design phase. vi Concepts that are evaluated are compared against a major concept option of which qualities are known. This major concept design is referred to as the datum concept. In the case of the XG Endeavor project, the datum concept would be an existing aircraft that is comparable size in today’s market. A list of the qualities desired in the final product are then weighed and applied to the decision making matrix. With a simple ‘plus’, ‘neutral’, and ‘negative’ point system, the features of each concept option are compared against the datum. If the quality of the listed feature of the concept option is better than that of the datum option, a plus is applied, if there is no significant change, a neutral is applied, if there is an obvious disadvantage over the concept item to the datum, then a negative is applied. From the final
7 | P a g e
System Definition Review Team 330 March, 2010 . Team XG Itnl. Inc.
Pugh’s method matrix, the points are then tallied and the concept options are then ranked from most beneficial to least beneficial based on the number of pluses applied. It is important to avoid getting too quantitative as to rule a concept completely out. Some complete concepts may not be well liked but the positives of the design may be able to be used in a newly designed concept for the next evaluation of Pugh’s method. This process can continue for several iterations until a solid design concept is established.
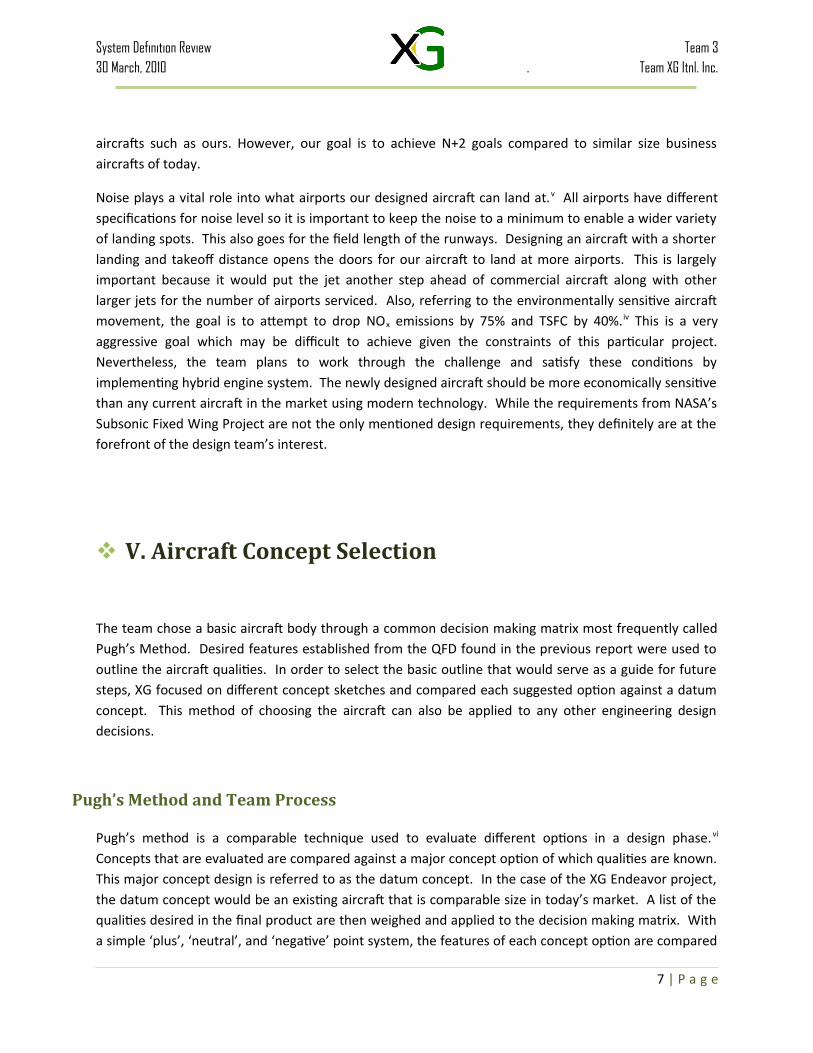
To subscribe to this method, members of the team produced aircraft designs to serve as the XG concepts. The available images of concepts developed by XG team members are shown below in Figure 2.
8 | P a g e
Figure 2: The team produced a total 6 concepts to evaluate. The above represent the four of which the team members themselves sketched. From left to right, top to bottom the designs are as follows: Concept a, Concept b, Concept c, Concept e
System Definition Review Team 330 March, 2010 . Team XG Itnl. Inc.
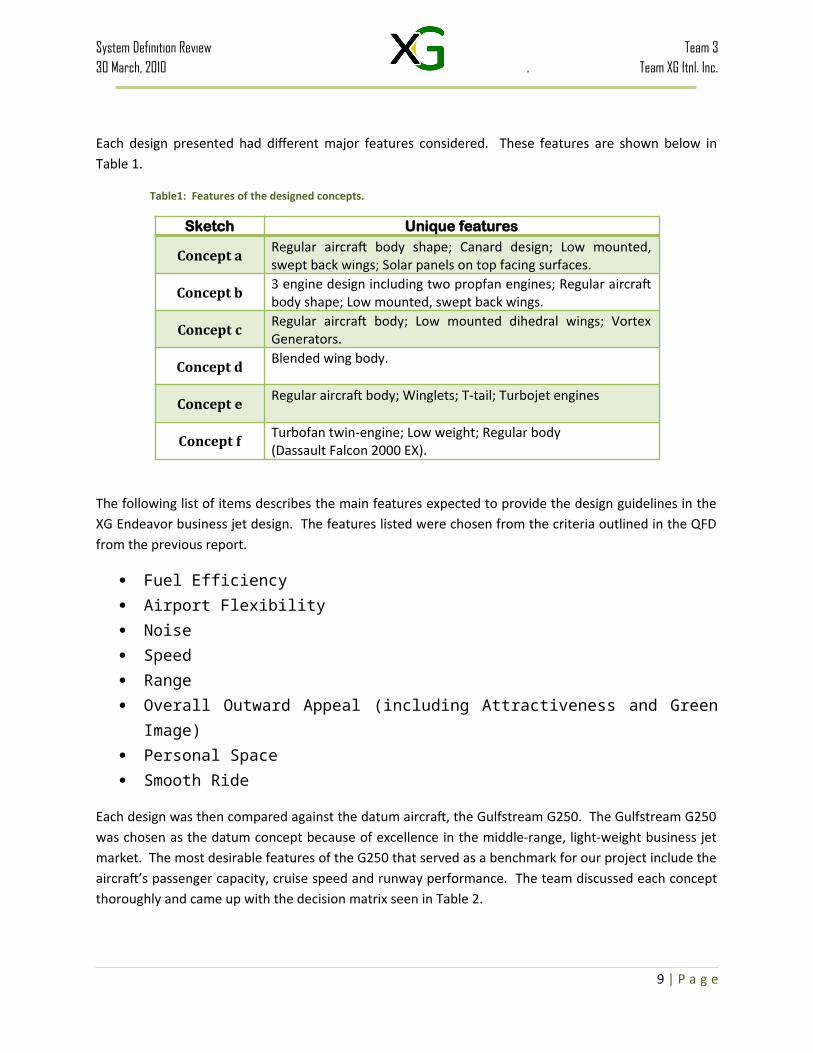
Each design presented had different major features considered. These features are shown below in Table 1.
Table1: Features of the designed concepts.
Sketch Unique features
Concept aRegular aircraft body shape; Canard design; Low mounted, swept back wings; Solar panels on top facing surfaces.
Concept b3 engine design including two propfan engines; Regular aircraft body shape; Low mounted, swept back wings.
Concept cRegular aircraft body; Low mounted dihedral wings; Vortex Generators.
Concept dBlended wing body.
Concept eRegular aircraft body; Winglets; T-tail; Turbojet engines
Concept fTurbofan twin-engine; Low weight; Regular body (Dassault Falcon 2000 EX).
The following list of items describes the main features expected to provide the design guidelines in the XG Endeavor business jet design. The features listed were chosen from the criteria outlined in the QFD from the previous report.
Fuel Efficiency Airport Flexibility Noise Speed Range Overall Outward Appeal (including Attractiveness and Green Image) Personal Space Smooth Ride
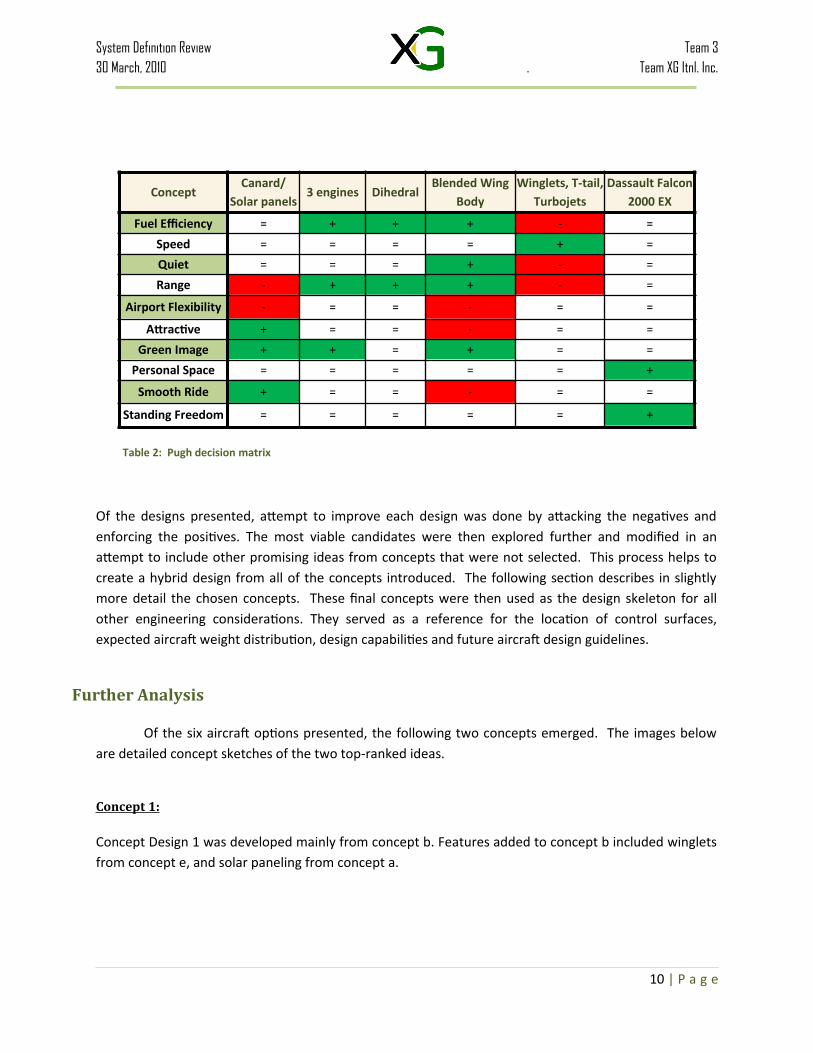
Each design was then compared against the datum aircraft, the Gulfstream G250. The Gulfstream G250 was chosen as the datum concept because of excellence in the middle-range, light-weight business jet market. The most desirable features of the G250 that served as a benchmark for our project include the aircraft’s passenger capacity, cruise speed and runway performance. The team discussed each concept thoroughly and came up with the decision matrix seen in Table 2.
9 | P a g e
System Definition Review Team 330 March, 2010 . Team XG Itnl. Inc.
Table 2: Pugh decision matrix
Of the designs presented, attempt to improve each design was done by attacking the negatives and enforcing the positives. The most viable candidates were then explored further and modified in an attempt to include other promising ideas from concepts that were not selected. This process helps to create a hybrid design from all of the concepts introduced. The following section describes in slightly more detail the chosen concepts. These final concepts were then used as the design skeleton for all other engineering considerations. They served as a reference for the location of control surfaces, expected aircraft weight distribution, design capabilities and future aircraft design guidelines.
Further Analysis
Of the six aircraft options presented, the following two concepts emerged. The images below are detailed concept sketches of the two top-ranked ideas.
Concept 1:
Concept Design 1 was developed mainly from concept b. Features added to concept b included winglets from concept e, and solar paneling from concept a.
10 | P a g e
ConceptCanard/
Solar panels3 engines Dihedral
Blended Wing Body
Winglets, T-tail, Turbojets
Dassault Falcon 2000 EX
Fuel Efficiency = + + + - =
Speed = = = = + =
Quiet = = = + - =
Range - + + + - =
Airport Flexibility - = = - = =
Attractive + = = - = =
Green Image + + = + = =
Personal Space = = = = = +
Smooth Ride + = = - = =
Standing Freedom = = = = = +
Turbofan
Solar film
Winglet
Duct
Turboprop
System Definition Review Team 330 March, 2010 . Team XG Itnl. Inc.
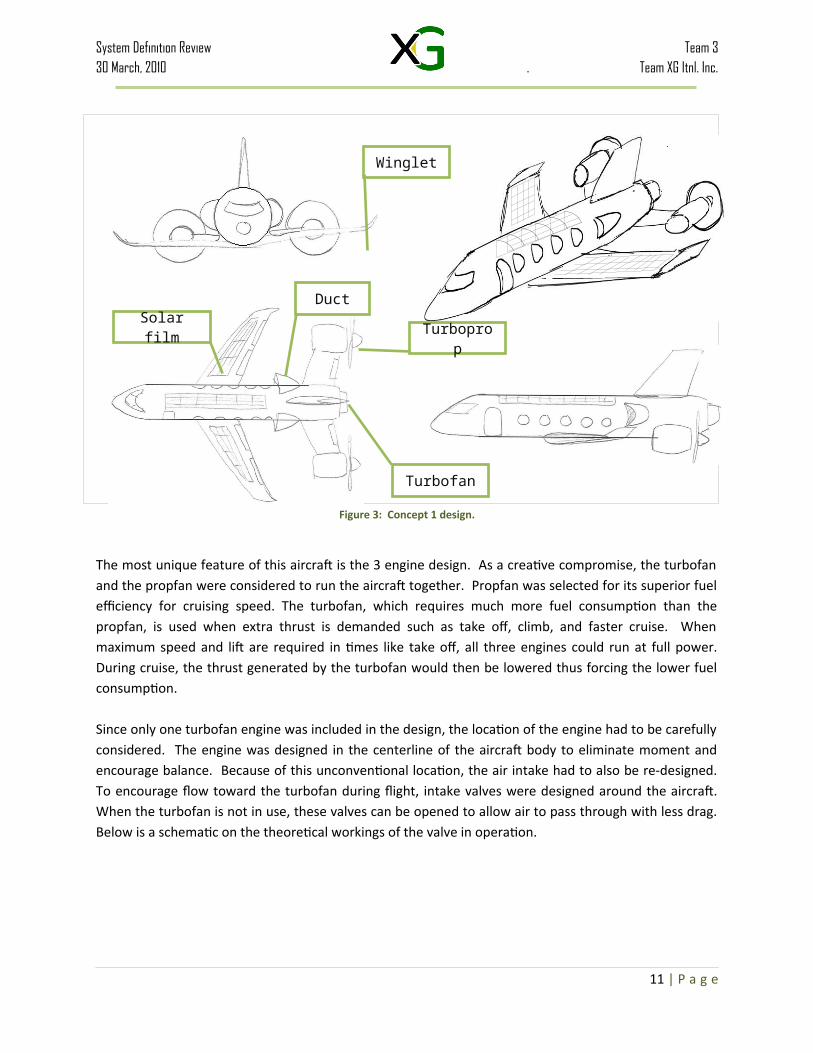
Figure 3: Concept 1 design.
The most unique feature of this aircraft is the 3 engine design. As a creative compromise, the turbofan and the propfan were considered to run the aircraft together. Propfan was selected for its superior fuel efficiency for cruising speed. The turbofan, which requires much more fuel consumption than the propfan, is used when extra thrust is demanded such as take off, climb, and faster cruise. When maximum speed and lift are required in times like take off, all three engines could run at full power. During cruise, the thrust generated by the turbofan would then be lowered thus forcing the lower fuel consumption.
Since only one turbofan engine was included in the design, the location of the engine had to be carefully considered. The engine was designed in the centerline of the aircraft body to eliminate moment and encourage balance. Because of this unconventional location, the air intake had to also be re-designed. To encourage flow toward the turbofan during flight, intake valves were designed around the aircraft. When the turbofan is not in use, these valves can be opened to allow air to pass through with less drag. Below is a schematic on the theoretical workings of the valve in operation.
11 | P a g e
System Definition Review Team 330 March, 2010 . Team XG Itnl. Inc.
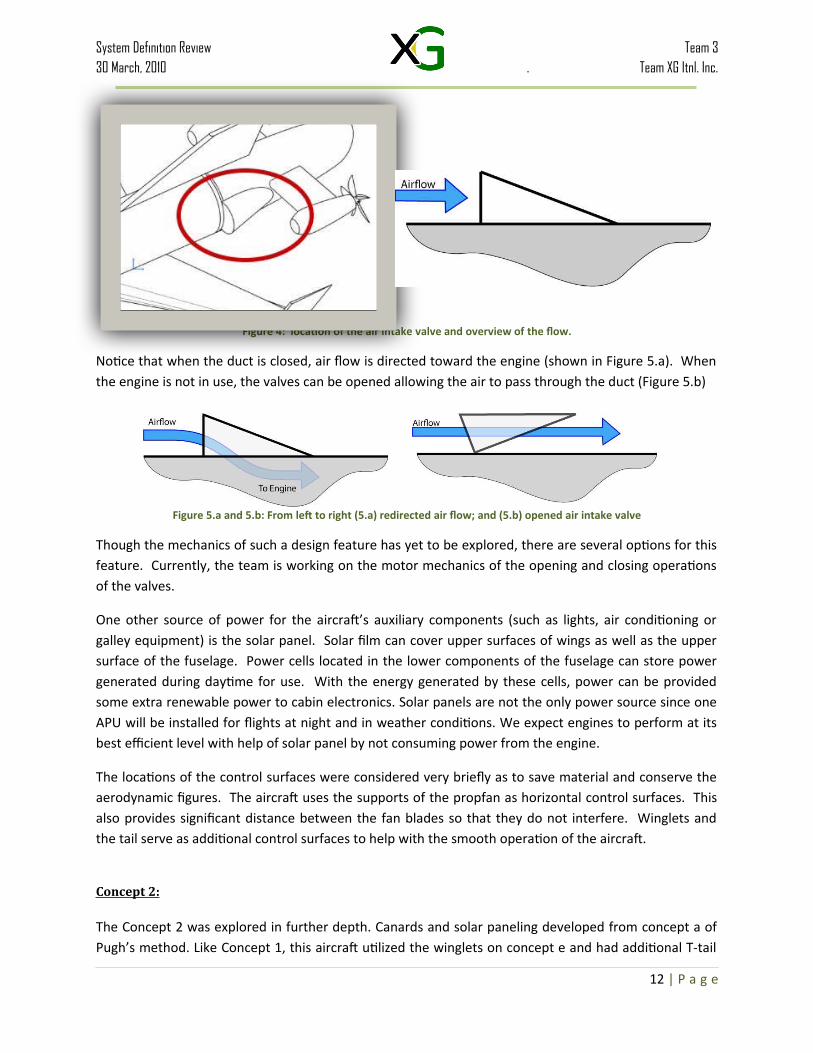
Figure 4: location of the air intake valve and overview of the flow.
Notice that when the duct is closed, air flow is directed toward the engine (shown in Figure 5.a). When the engine is not in use, the valves can be opened allowing the air to pass through the duct (Figure 5.b)
Figure 5.a and 5.b: From left to right (5.a) redirected air flow; and (5.b) opened air intake valve
Though the mechanics of such a design feature has yet to be explored, there are several options for this feature. Currently, the team is working on the motor mechanics of the opening and closing operations of the valves.
One other source of power for the aircraft’s auxiliary components (such as lights, air conditioning or galley equipment) is the solar panel. Solar film can cover upper surfaces of wings as well as the upper surface of the fuselage. Power cells located in the lower components of the fuselage can store power generated during daytime for use. With the energy generated by these cells, power can be provided some extra renewable power to cabin electronics. Solar panels are not the only power source since one APU will be installed for flights at night and in weather conditions. We expect engines to perform at its best efficient level with help of solar panel by not consuming power from the engine.
The locations of the control surfaces were considered very briefly as to save material and conserve the aerodynamic figures. The aircraft uses the supports of the propfan as horizontal control surfaces. This also provides significant distance between the fan blades so that they do not interfere. Winglets and the tail serve as additional control surfaces to help with the smooth operation of the aircraft.
Concept 2:
The Concept 2 was explored in further depth. Canards and solar paneling developed from concept a of Pugh’s method. Like Concept 1, this aircraft utilized the winglets on concept e and had additional T-tail
12 | P a g e
Duct
T-TailSolar film
Turbofan
UDF
Canard
System Definition Review Team 330 March, 2010 . Team XG Itnl. Inc.
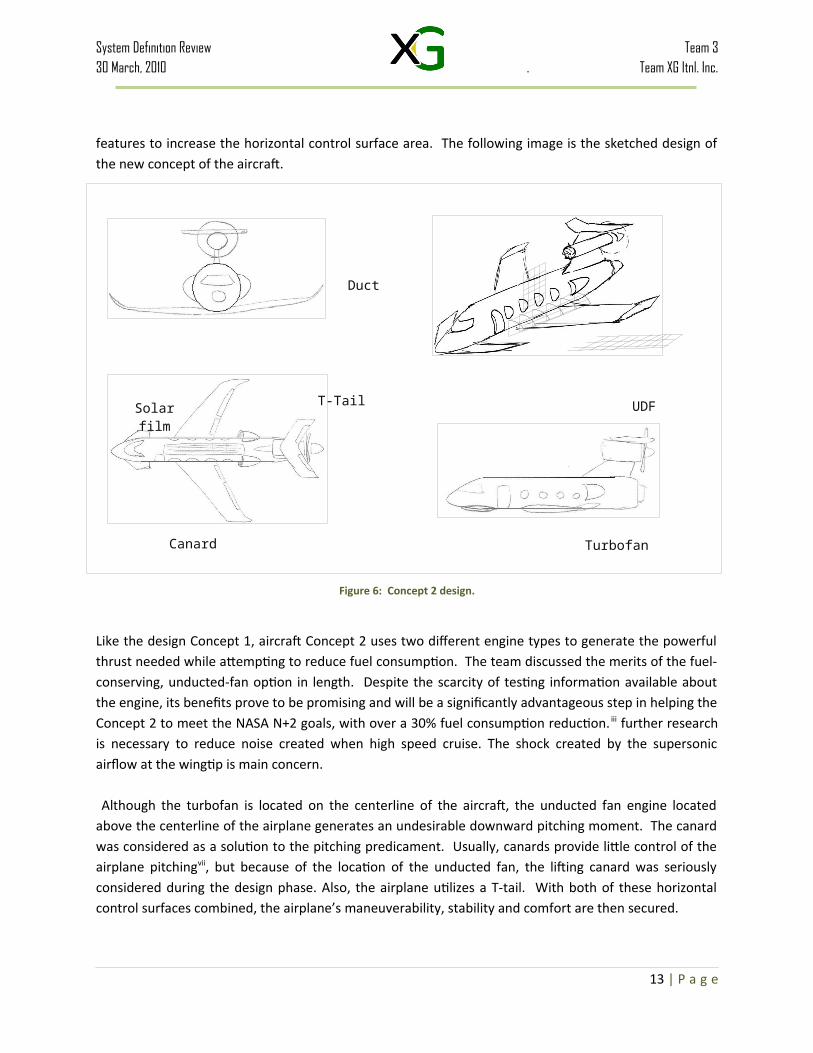
features to increase the horizontal control surface area. The following image is the sketched design of the new concept of the aircraft.
Figure 6: Concept 2 design.
Like the design Concept 1, aircraft Concept 2 uses two different engine types to generate the powerful thrust needed while attempting to reduce fuel consumption. The team discussed the merits of the fuel-conserving, unducted-fan option in length. Despite the scarcity of testing information available about the engine, its benefits prove to be promising and will be a significantly advantageous step in helping the Concept 2 to meet the NASA N+2 goals, with over a 30% fuel consumption reduction. iii further research is necessary to reduce noise created when high speed cruise. The shock created by the supersonic airflow at the wingtip is main concern.
Although the turbofan is located on the centerline of the aircraft, the unducted fan engine located above the centerline of the airplane generates an undesirable downward pitching moment. The canard was considered as a solution to the pitching predicament. Usually, canards provide little control of the airplane pitchingvii, but because of the location of the unducted fan, the lifting canard was seriously considered during the design phase. Also, the airplane utilizes a T-tail. With both of these horizontal control surfaces combined, the airplane’s maneuverability, stability and comfort are then secured.
13 | P a g e
System Definition Review Team 330 March, 2010 . Team XG Itnl. Inc.
This aircraft, like the Concept 1, would also utilize the assets of solar paneling, a center-mounted turbo fan engine with retractable ducts.
VI. Advanced Technologies and Concepts
Below is a list of the advanced concepts we are exploring to meet the N+2 guidelines and our own performance criteria. Most notably, we are seeking to reduce the burning of fossil fuels by designing the aircraft to generate and store all the electrical energy necessary to power its own internal systems. In order to cut NOx emissions, we are investigating a selective catalytic reduction system, which adds a reagent to the exhaust gases and combines them with NO x gases to produce nitrogen and water. In order to further reduce fuel consumption, we are resurrecting the unducted fan concept developed by GE and Alison engines in the early 1980s. We also intend to reduce the vibration and noise transmitted to the cabin by employing an active vibration control system.
Replacing the primary APU as a power source for the internal systems will be a block of lithium-ion batteries. Said batteries should charge quickly (so as not to delay the customers) and be capable of storing all the electrical power necessary for operations running the aircraft. Of course, a secondary APU will still be employed for starting the engines and to be used as a failsafe backup. Finally, the batteries will be directly chargeable via the backup APU, a ground power source, or the integrated solar film.
The solar film consists of a pliable thin-film material known as CIGS. It could easily be applied to any of the static surfaces of the aircraft with reasonable expected sunlight exposure, producing over 10 watts per square foot. It has been demonstrated in several aerospace applications and all-weather exposure conditions. Research has shown that, due to its cellular configuration, it could easily be maintained as individual cells could be replaced over the entire aircraft. At an average thickness of less than 3 millimeters, covering the entire upper surface of the wing and fuselage would only require about 200 lbs of film. Also notable is how the relatively even distribution would not significantly offset the location of the center of gravity.
We also intend to employ an Active Vibration Control System, a proven technology already in use on several in-service and prototype aircraft. By generating destructive interference based on an input signal, it can be designed to reduce both internal noise and vibration by use of mechanical and auditory feedback systems. One notable feature of the system is the ability to reduce the overall vibratory signature of the engines (or whatever input vibration that may be present) or tune the response to virtually eliminate all vibration in a particular section of the aircraft. With a 10:1 mechanical advantage, the weight of such a system would conservatively be less than a single passenger and luggage.
Several high lift devices planned to shorten the takeoff distance for the aircraft such as blown flaps, fowler flaps, and vortex generators were slated for implementation on the aircraft. However, after
14 | P a g e
System Definition Review Team 330 March, 2010 . Team XG Itnl. Inc.
research and quick drag prediction, the relative advantage of such systems would be negligible and for vortex generators, the disadvantages from the scrubbing drag was far greater than the induced drag assuming that aircraft will have laminar air flow over the wing. However, further investigation is being conducted on usage of flaps and other high lifting devices.
Lastly, in order to meet the N+2 criteria of reducing NO x emissions, we are researching a selective catalytic reduction system, which, to the best of our knowledge, has never been implemented on any aircraft. Essentially, SCR works by injecting a reactant into the exhaust stream which combines with the chemicals whose signature is to be reduced and results in inert products. In this case, the reactant is either ammonia or urea, and the products are nitrogen and water. To avoid releasing excess reagents into the atmosphere, it will be necessary to employ a robust dosing control unit, as well as maintain purity of the additives throughout their delivery, storage, and use. Of significant concern is thrust reduction from the engine by the system, increase of weight by the system and the weight of the additives, the temperature range at which the reactions take place, as this will have significant effect on the efficiency of the process and the reduction of NOx gases.
VII. Constraint Analysis / Constraint Diagram
Major performance Constraints and Basic Assumptions for Initial Estimates
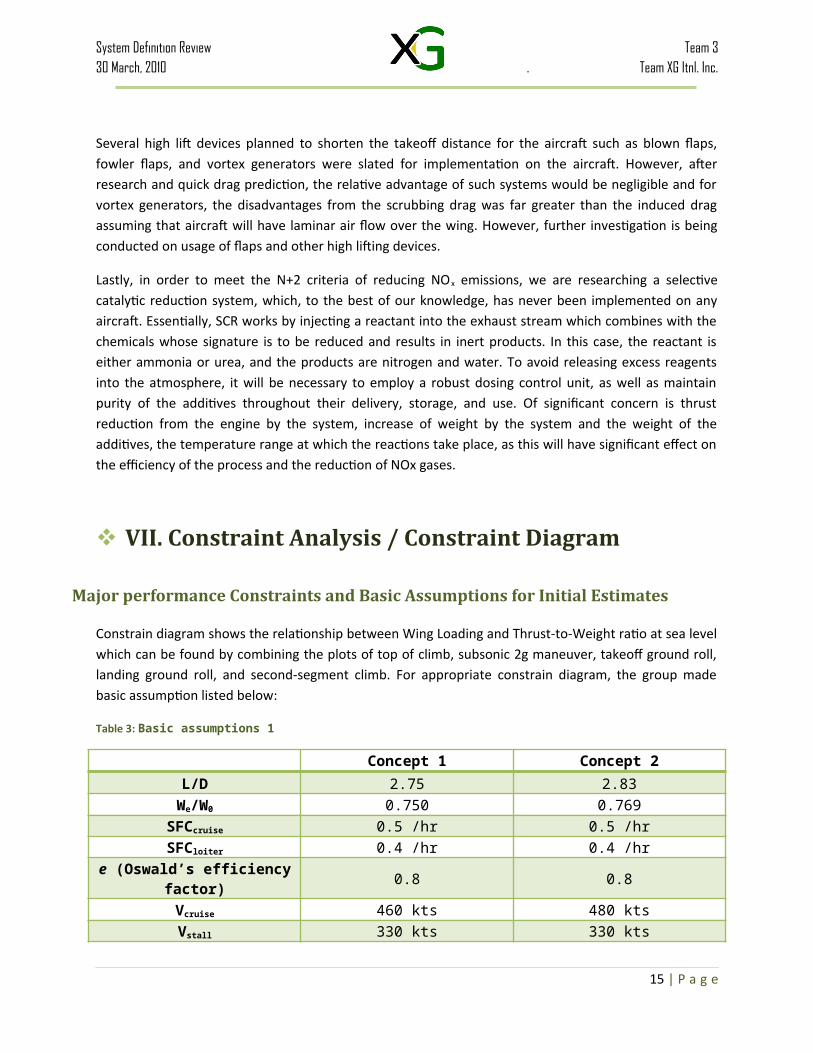
Constrain diagram shows the relationship between Wing Loading and Thrust-to-Weight ratio at sea level which can be found by combining the plots of top of climb, subsonic 2g maneuver, takeoff ground roll, landing ground roll, and second-segment climb. For appropriate constrain diagram, the group made basic assumption listed below:
Table 3: Basic assumptions 1
Concept 1 Concept 2L/D 2.75 2.83
We/W0 0.750 0.769SFCcruise 0.5 /hr 0.5 /hrSFCloiter 0.4 /hr 0.4 /hr
e (Oswald’s efficiency factor) 0.8 0.8Vcruise 460 kts 480 ktsVstall 330 kts 330 kts
Vtake-off 380 kts 450 ktsVapproach 380 kts 380 kts
15 | P a g e
System Definition Review Team 330 March, 2010 . Team XG Itnl. Inc.
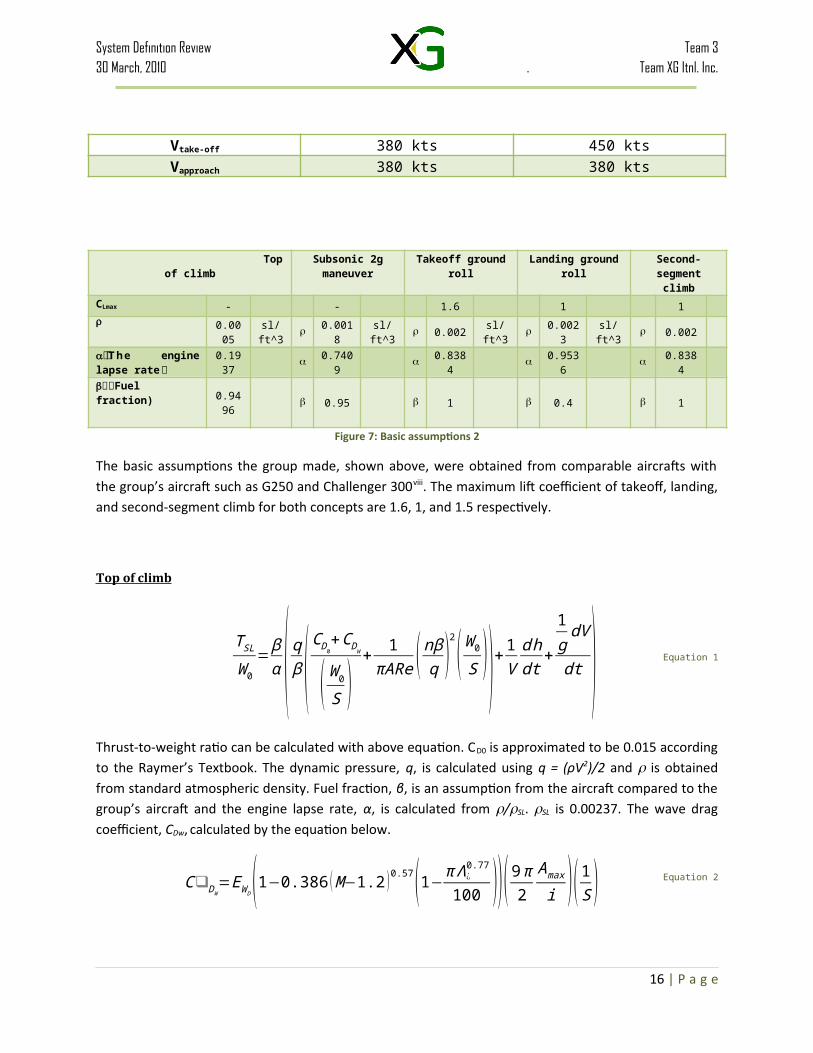
Top of climb Subsonic 2g maneuver
Takeoff ground roll Landing ground roll Second-segment climb
CLmax - - 1.6 1 1
0.0005 sl/ft^3
0.0018 sl/ft^3 0.002 sl/ft^3 0.0023 sl/ft^3 0.002
The engine lapse rate 0.1937 0.7409 0.8384 0.9536 0.8384
Fuel fraction) 0.9496 0.95 1 0.4 1
Figure 7: Basic assumptions 2
The basic assumptions the group made, shown above, were obtained from comparable aircrafts with the group’s aircraft such as G250 and Challenger 300viii. The maximum lift coefficient of takeoff, landing, and second-segment climb for both concepts are 1.6, 1, and 1.5 respectively.
Top of climb
T SL
W 0=βα ( qβ (CD0
+CDW
(W 0
S )+ 1πARe ( nβq )
2(W 0
S ))+ 1Vd hdt
+
1gdV
dt ) Equation 1
Thrust-to-weight ratio can be calculated with above equation. CD0 is approximated to be 0.015 according to the Raymer’s Textbook. The dynamic pressure, q, is calculated using q = (ρV2)/2 and is obtained from standard atmospheric density. Fuel fraction, β, is an assumption from the aircraft compared to the group’s aircraft and the engine lapse rate, α, is calculated from /SL. SL is 0.00237. The wave drag coefficient, CDw, calculated by the equation below.
C❑DW=EW D(1−0.386 (M−1.2 )0.57(1−π Λ¿
0.77
100 ))( 9 π2
Amax
i )( 1S ) Equation 2
The Mach numbers used for concept 1 is 0.75 and for concept 2 is 0.8.We assumed that concept 1 will have slower cruising Mach number from the result of using turboprop.
Subsonic 2g maneuver 250kts at h = 10000ft
The subsonic 2g maneuver is required for clearing air traffic within the vicinity of airports safely. Further research needs to be implemented in order to obtain more accurate data. Therefore, subsonic 2g maneuver will be the priority work in the next phase of the project.
16 | P a g e
System Definition Review Team 330 March, 2010 . Team XG Itnl. Inc.
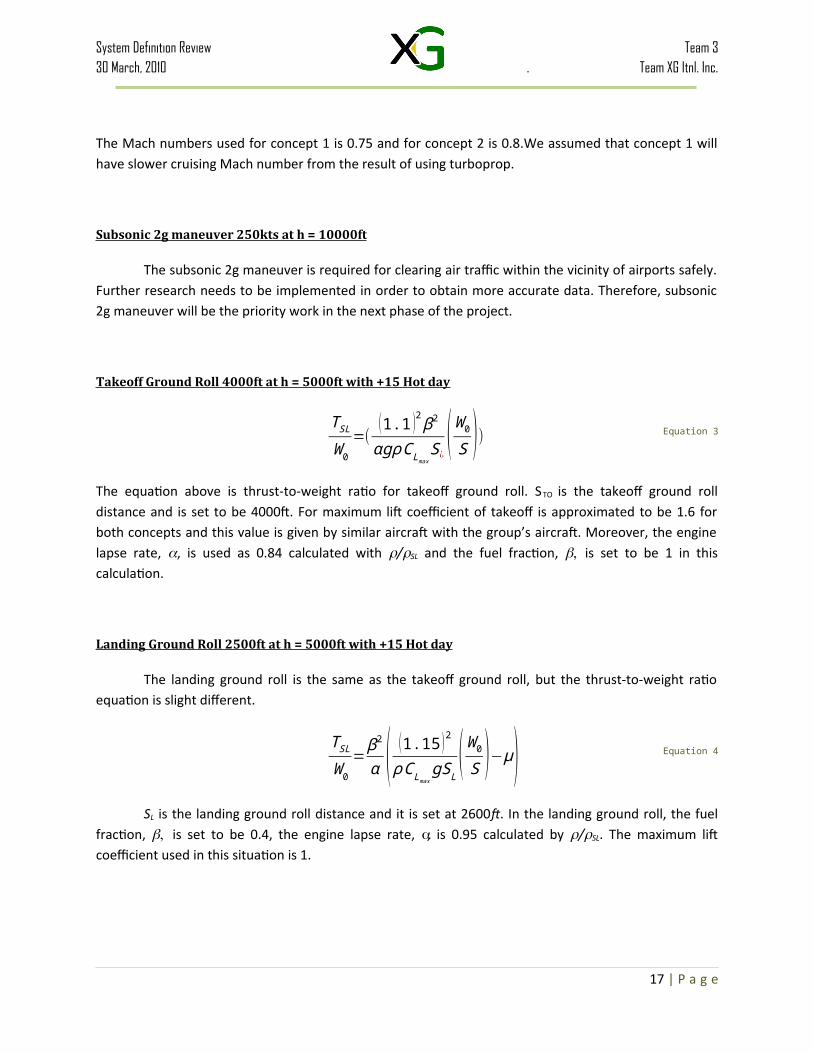
Takeoff Ground Roll 4000ft at h = 5000ft with +15 Hot day
T SL
W 0=(
(1.1 )2β2
αgρCLmaxS¿
(W 0
S )) Equation 3
The equation above is thrust-to-weight ratio for takeoff ground roll. STO is the takeoff ground roll distance and is set to be 4000ft. For maximum lift coefficient of takeoff is approximated to be 1.6 for both concepts and this value is given by similar aircraft with the group’s aircraft. Moreover, the engine lapse rate, , is used as 0.84 calculated with /SL and the fuel fraction, is set to be 1 in this calculation.
Landing Ground Roll 2500ft at h = 5000ft with +15 Hot day
The landing ground roll is the same as the takeoff ground roll, but the thrust-to-weight ratio equation is slight different.
T SL
W 0=β2
α ( (1.15 )2
ρCLmaxgSL (
W 0
S )−μ) Equation 4
SL is the landing ground roll distance and it is set at 2600ft. In the landing ground roll, the fuel fraction, is set to be 0.4, the engine lapse rate, , is 0.95 calculated by /SL. The maximum lift coefficient used in this situation is 1.
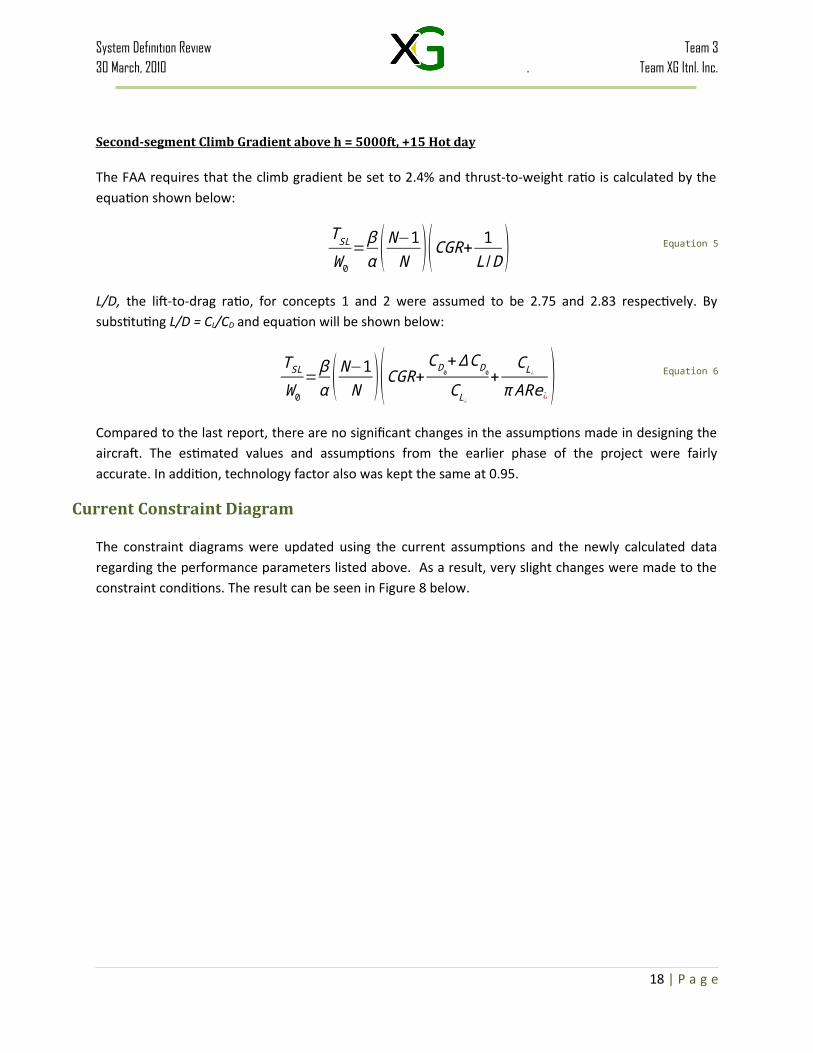
Second-segment Climb Gradient above h = 5000ft, +15 Hot day
The FAA requires that the climb gradient be set to 2.4% and thrust-to-weight ratio is calculated by the equation shown below:
T SL
W 0= βα (N−1
N )(CGR+ 1L /D ) Equation 5
L/D, the lift-to-drag ratio, for concepts 1 and 2 were assumed to be 2.75 and 2.83 respectively. By substituting L/D = CL/CD and equation will be shown below:
T SL
W 0=βα (N−1
N )(CGR+C D0
+ΔCD 0
C L¿
+CL¿
π ARe¿) Equation 6
17 | P a g e
System Definition Review Team 330 March, 2010 . Team XG Itnl. Inc.
Compared to the last report, there are no significant changes in the assumptions made in designing the aircraft. The estimated values and assumptions from the earlier phase of the project were fairly accurate. In addition, technology factor also was kept the same at 0.95.
Current Constraint Diagram
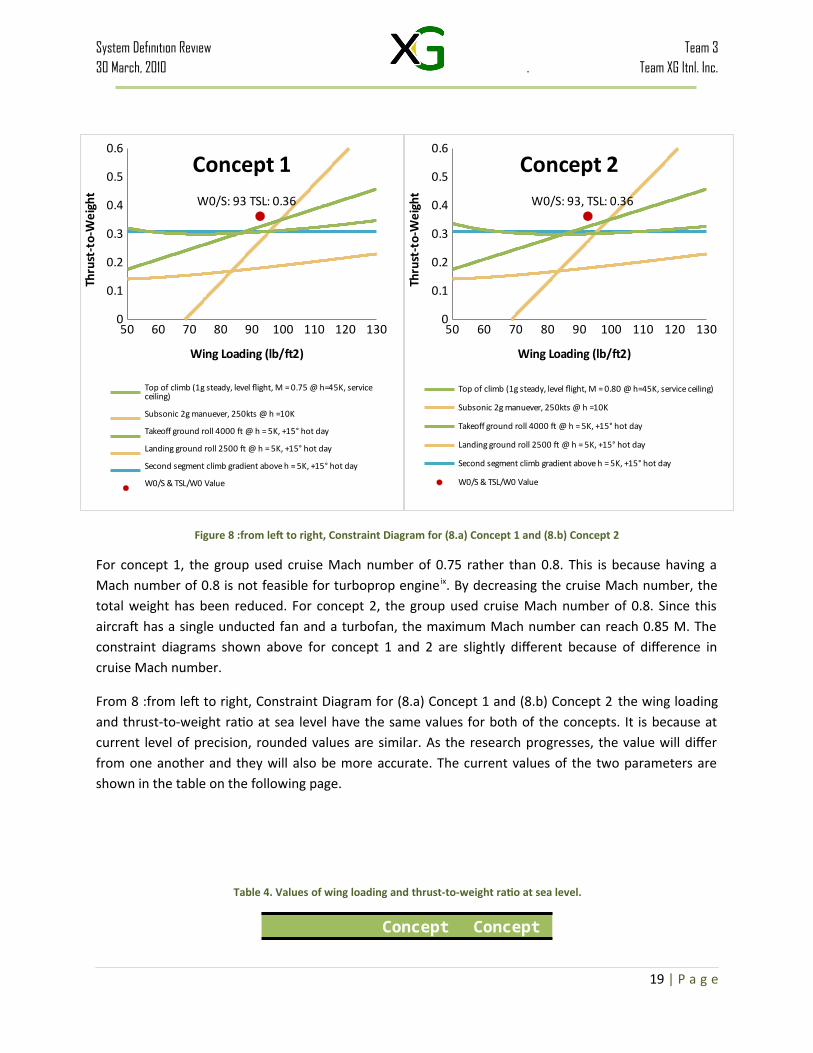
The constraint diagrams were updated using the current assumptions and the newly calculated data regarding the performance parameters listed above. As a result, very slight changes were made to the constraint conditions. The result can be seen in Figure 8 below.
50 60 70 80 90 100 110 120 1300
0.1
0.2
0.3
0.4
0.5
0.6
W0/S: 93 TSL: 0.36
Concept 1
Top of climb (1g steady, level flight, M = 0.75 @ h=45K, service ceil-ing)
Subsonic 2g manuever, 250kts @ h =10K
Takeoff ground roll 4000 ft @ h = 5K, +15° hot day
Landing ground roll 2500 ft @ h = 5K, +15° hot day
Second segment climb gradient above h = 5K, +15° hot day
W0/S & TSL/W0 Value
Wing Loading (lb/ft2)
Thru
st-t
o-W
eigh
t
50 60 70 80 90 100 110 120 1300
0.1
0.2
0.3
0.4
0.5
0.6
W0/S: 93, TSL: 0.36
Concept 2
Top of climb (1g steady, level flight, M = 0.80 @ h=45K, service ceiling)
Subsonic 2g manuever, 250kts @ h =10K
Takeoff ground roll 4000 ft @ h = 5K, +15° hot day
Landing ground roll 2500 ft @ h = 5K, +15° hot day
Second segment climb gradient above h = 5K, +15° hot day
W0/S & TSL/W0 Value
Wing Loading (lb/ft2)
Thru
st-t
o-W
eigh
t
Figure 8 :from left to right, Constraint Diagram for (8.a) Concept 1 and (8.b) Concept 2
For concept 1, the group used cruise Mach number of 0.75 rather than 0.8. This is because having a Mach number of 0.8 is not feasible for turboprop engine ix. By decreasing the cruise Mach number, the total weight has been reduced. For concept 2, the group used cruise Mach number of 0.8. Since this aircraft has a single unducted fan and a turbofan, the maximum Mach number can reach 0.85 M. The constraint diagrams shown above for concept 1 and 2 are slightly different because of difference in cruise Mach number.
From 8 :from left to right, Constraint Diagram for (8.a) Concept 1 and (8.b) Concept 2 the wing loading and thrust-to-weight ratio at sea level have the same values for both of the concepts. It is because at current level of precision, rounded values are similar. As the research progresses, the value will differ
18 | P a g e
System Definition Review Team 330 March, 2010 . Team XG Itnl. Inc.
from one another and they will also be more accurate. The current values of the two parameters are shown in the table on the following page.
Table 4. Values of wing loading and thrust-to-weight ratio at sea level.
Concept 1 Concept 2WO/S (lb/ft2) 93 93
TSL/WO 0.36 0.36
VIII. Most Recent Sizing Studies
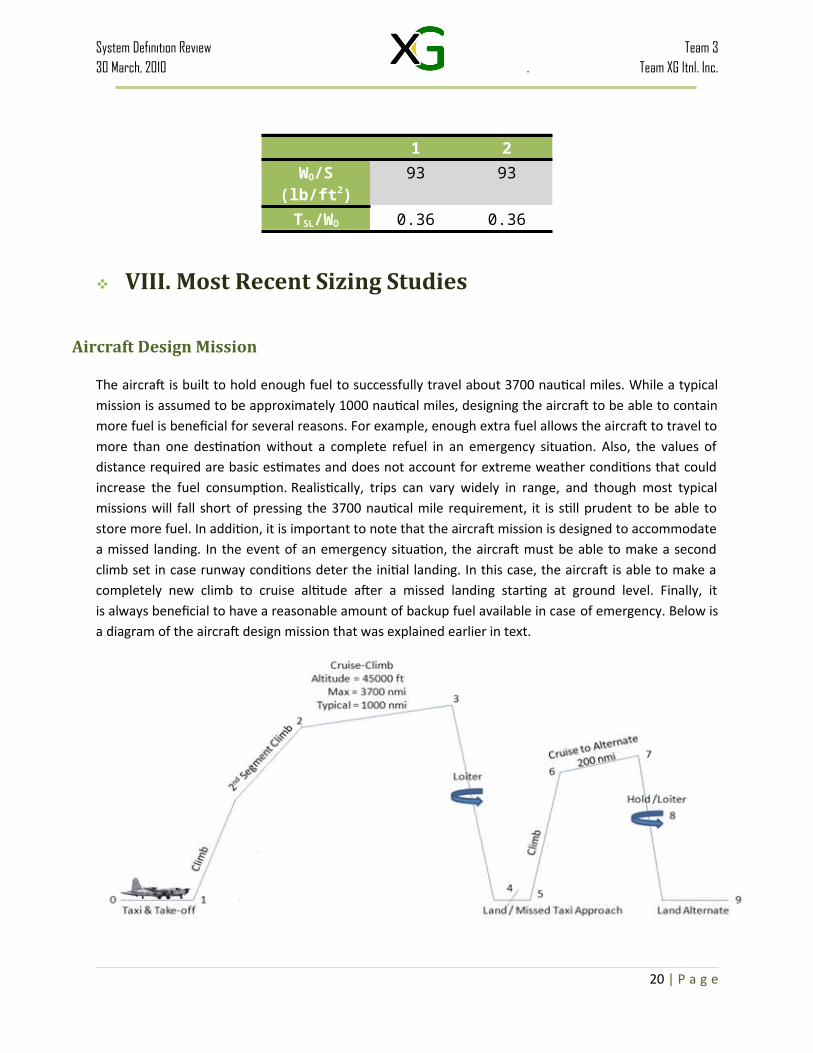
Aircraft Design Mission
The aircraft is built to hold enough fuel to successfully travel about 3700 nautical miles. While a typical mission is assumed to be approximately 1000 nautical miles, designing the aircraft to be able to contain more fuel is beneficial for several reasons. For example, enough extra fuel allows the aircraft to travel to more than one destination without a complete refuel in an emergency situation. Also, the values of distance required are basic estimates and does not account for extreme weather conditions that could increase the fuel consumption. Realistically, trips can vary widely in range, and though most typical missions will fall short of pressing the 3700 nautical mile requirement, it is still prudent to be able to store more fuel. In addition, it is important to note that the aircraft mission is designed to accommodate a missed landing. In the event of an emergency situation, the aircraft must be able to make a second climb set in case runway conditions deter the initial landing. In this case, the aircraft is able to make a completely new climb to cruise altitude after a missed landing starting at ground level. Finally, it is always beneficial to have a reasonable amount of backup fuel available in case of emergency. Below is a diagram of the aircraft design mission that was explained earlier in text.
19 | P a g e
2nd Segment
System Definition Review Team 330 March, 2010 . Team XG Itnl. Inc.
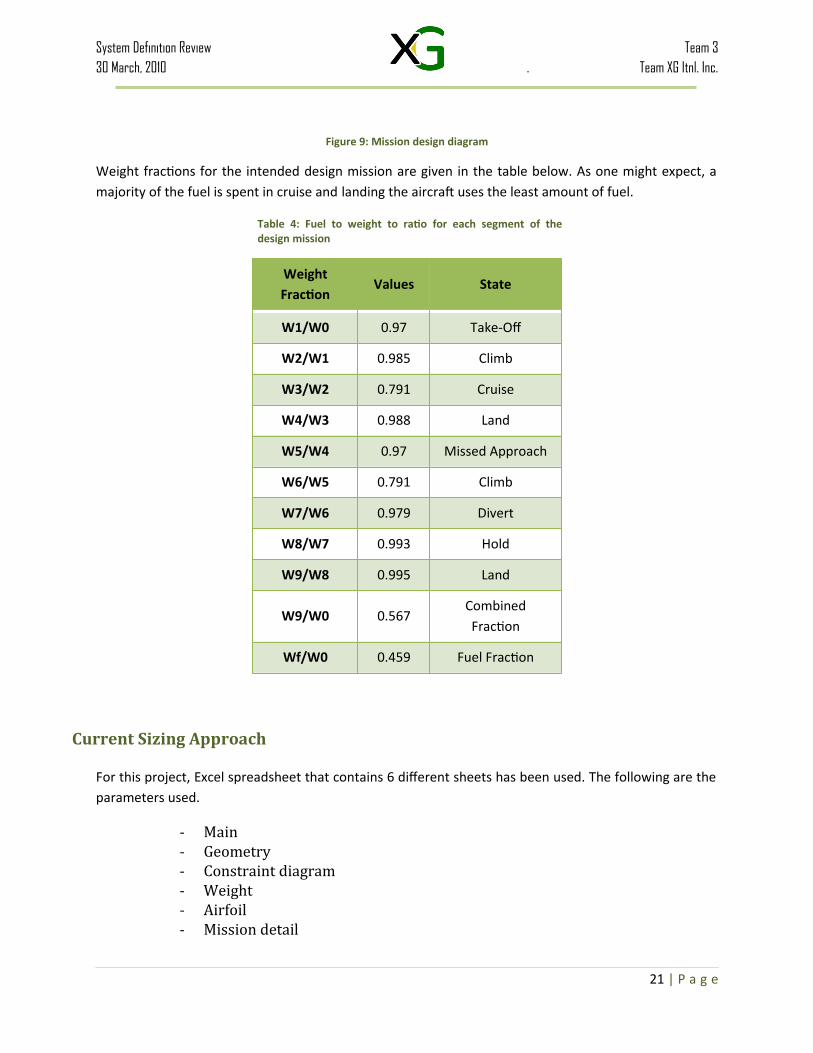
Figure 9: Mission design diagram
Weight fractions for the intended design mission are given in the table below. As one might expect, a majority of the fuel is spent in cruise and landing the aircraft uses the least amount of fuel.
Table 4: Fuel to weight to ratio for each segment of the design mission
Weight Fraction
Values State
W1/W0 0.97 Take-Off
W2/W1 0.985 Climb
W3/W2 0.791 Cruise
W4/W3 0.988 Land
W5/W4 0.97 Missed Approach
W6/W5 0.791 Climb
W7/W6 0.979 Divert
W8/W7 0.993 Hold
W9/W8 0.995 Land
W9/W0 0.567Combined Fraction
20 | P a g e
System Definition Review Team 330 March, 2010 . Team XG Itnl. Inc.
Wf/W0 0.459 Fuel Fraction
Current Sizing Approach
For this project, Excel spreadsheet that contains 6 different sheets has been used. The following are the parameters used.
- Main - Geometry- Constraint diagram- Weight- Airfoil- Mission detail
Dimensions and configurations of fuselage, wing, engine, and mission sketch were included on the main sheet of the sizing code because these values were subjected to change throughout the project. Compared to the previous sizing code, there were more specific details that have been added. For the main sheet, mission sketch section has been added and the sketch has been improved. For the geometry sheet, drag calculation has been added. For the weight sheet, component details have been developed while detailed fuel fraction has been developed.
Validation
Validation was done by inputting the data of existing aircrafts that are similar in design to the team’s aircraft into the team’s sizing code and comparing the output values with the aircraft’s real values. For this project, Bombardier Challenger 300 was used to validate the code. Basic dimensions such as lengths of the fuselage, height of the cabin and other general features could be found from Bombardier websitex. Specific dimensions were estimated by using the ratio of the picture and the real size of the aircraft. After the validation was completed, it was possible to find the fudge factor by using the following equation.
Fudge Factor=ActualWeight of Challenger 300
EstimatedWeight ¿the SizingCode ¿ Equation 7
Fudge factor can be substituted in the XG Endeavour to better predict the empty weight. Once the validation was complete, empty weight based on the sizing code was 17500lb and the actual empty weight of the Challenger 300 was 18500lb. Based on this data, fudge factor was calculated using equation 7.
21 | P a g e
System Definition Review Team 330 March, 2010 . Team XG Itnl. Inc.
Fudge Factor = 1850017500 = 1.05 Equation 7.b
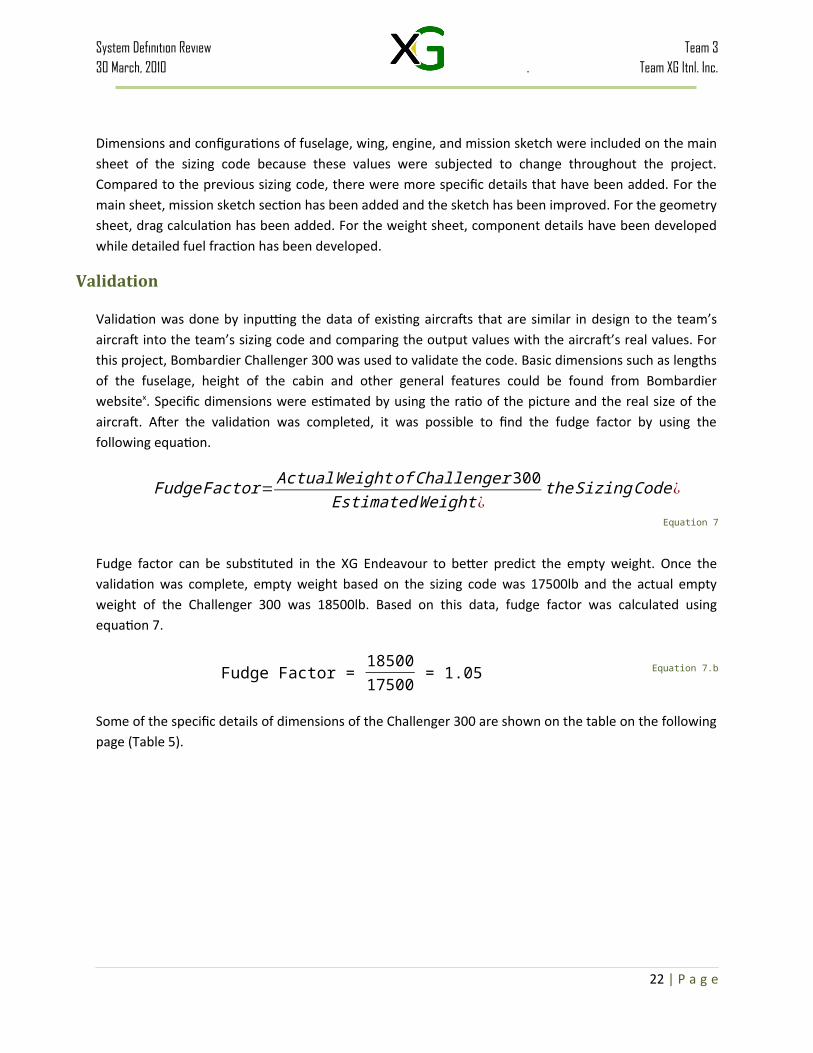
Some of the specific details of dimensions of the Challenger 300 are shown on the table on the following page (Table 5).
22 | P a g e
System Definition Review Team 330 March, 2010 . Team XG Itnl. Inc.
Table 5. Specific dimensions and features for Challenger 300
23 | P a g e
System Definition Review Team 330 March, 2010 . Team XG Itnl. Inc.
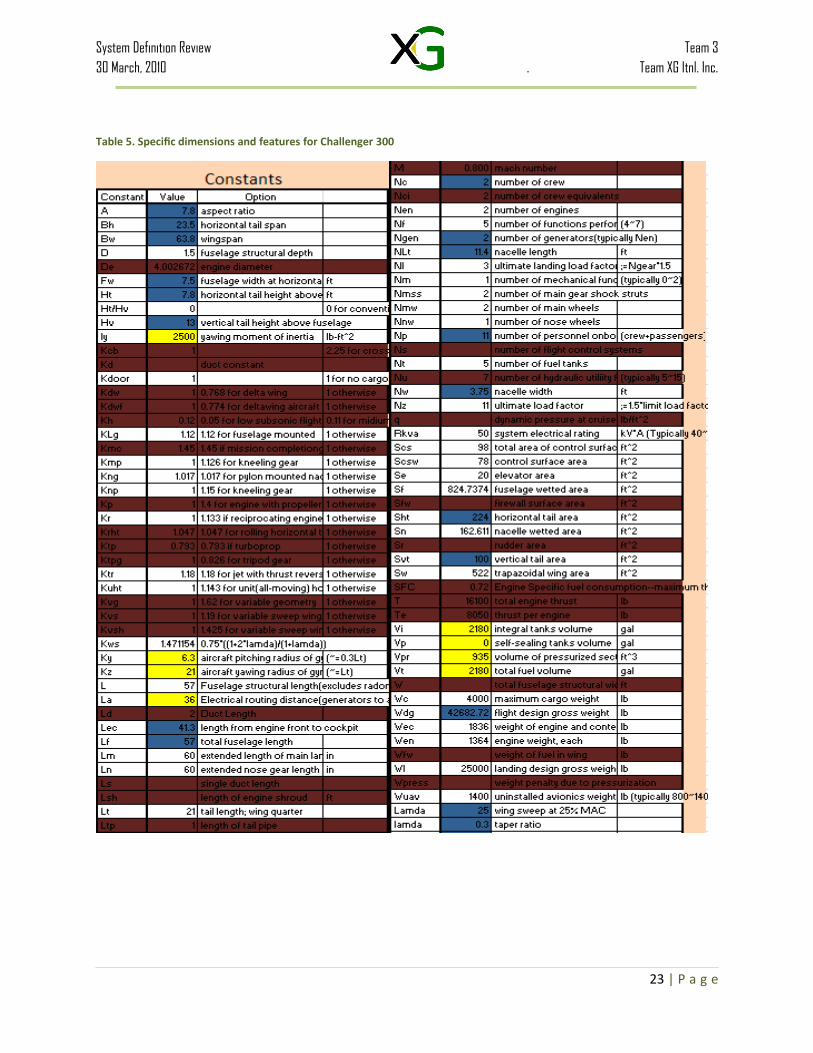
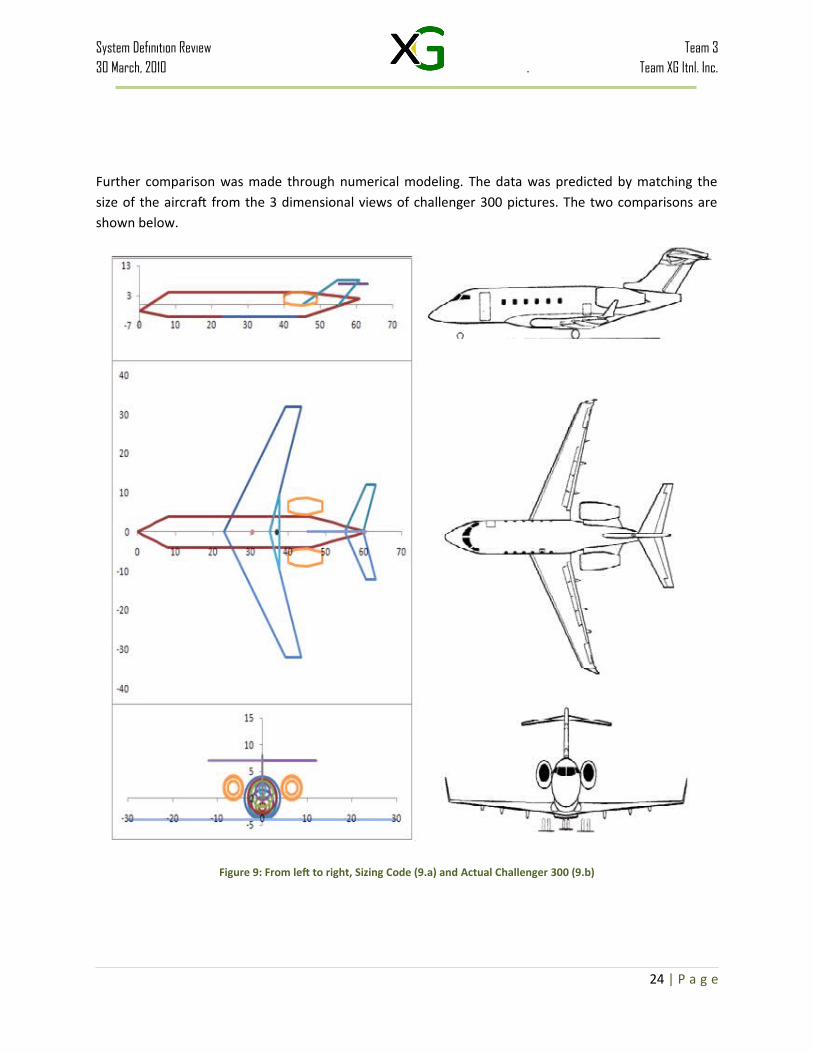
Further comparison was made through numerical modeling. The data was predicted by matching the size of the aircraft from the 3 dimensional views of challenger 300 pictures. The two comparisons are shown below.
Figure 9: From left to right, Sizing Code (9.a) and Actual Challenger 300 (9.b)
24 | P a g e
System Definition Review Team 330 March, 2010 . Team XG Itnl. Inc.
Current Status
Drag Prediction
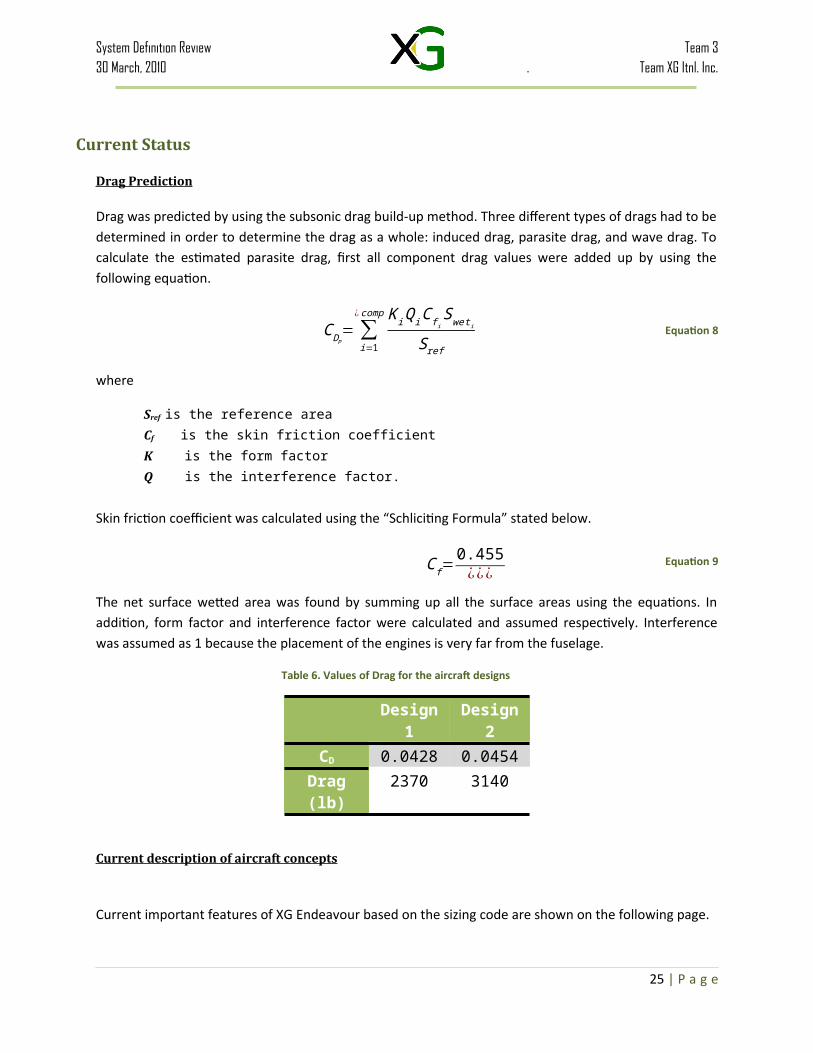
Drag was predicted by using the subsonic drag build-up method. Three different types of drags had to be determined in order to determine the drag as a whole: induced drag, parasite drag, and wave drag. To calculate the estimated parasite drag, first all component drag values were added up by using the following equation.
CDP= ∑
i=1
¿comp K iQiC f i Swe tiSref
Equation 8
where
Sref is the reference areaCf is the skin friction coefficientK is the form factorQ is the interference factor.
Skin friction coefficient was calculated using the “Schliciting Formula” stated below.
C f=0.455¿¿¿
Equation 9
The net surface wetted area was found by summing up all the surface areas using the equations. In addition, form factor and interference factor were calculated and assumed respectively. Interference was assumed as 1 because the placement of the engines is very far from the fuselage.
Table 6. Values of Drag for the aircraft designs
Design 1 Design 2CD 0.0428 0.0454
Drag (lb) 2370 3140
Current description of aircraft concepts
Current important features of XG Endeavour based on the sizing code are shown on the following page.
25 | P a g e

System Definition Review Team 330 March, 2010 . Team XG Itnl. Inc.
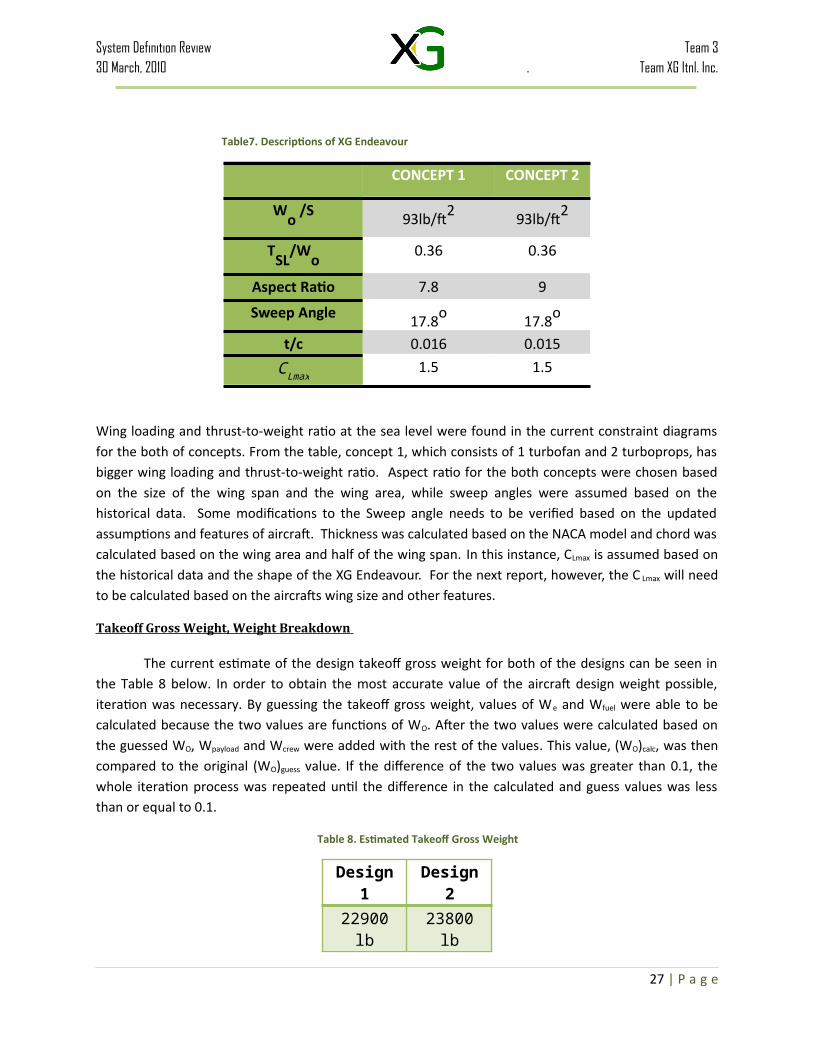
Table7. Descriptions of XG Endeavour
CONCEPT 1 CONCEPT 2
Wo
/S 93lb/ft2 93lb/ft2
TSL
/Wo
0.36 0.36
Aspect Ratio 7.8 9
Sweep Angle 17.8o 17.8o t/c 0.016 0.015 CLmax 1.5 1.5
Wing loading and thrust-to-weight ratio at the sea level were found in the current constraint diagrams for the both of concepts. From the table, concept 1, which consists of 1 turbofan and 2 turboprops, has bigger wing loading and thrust-to-weight ratio. Aspect ratio for the both concepts were chosen based on the size of the wing span and the wing area, while sweep angles were assumed based on the historical data. Some modifications to the Sweep angle needs to be verified based on the updated assumptions and features of aircraft. Thickness was calculated based on the NACA model and chord was calculated based on the wing area and half of the wing span. In this instance, CLmax is assumed based on the historical data and the shape of the XG Endeavour. For the next report, however, the C Lmax will need to be calculated based on the aircrafts wing size and other features.
Takeoff Gross Weight, Weight Breakdown
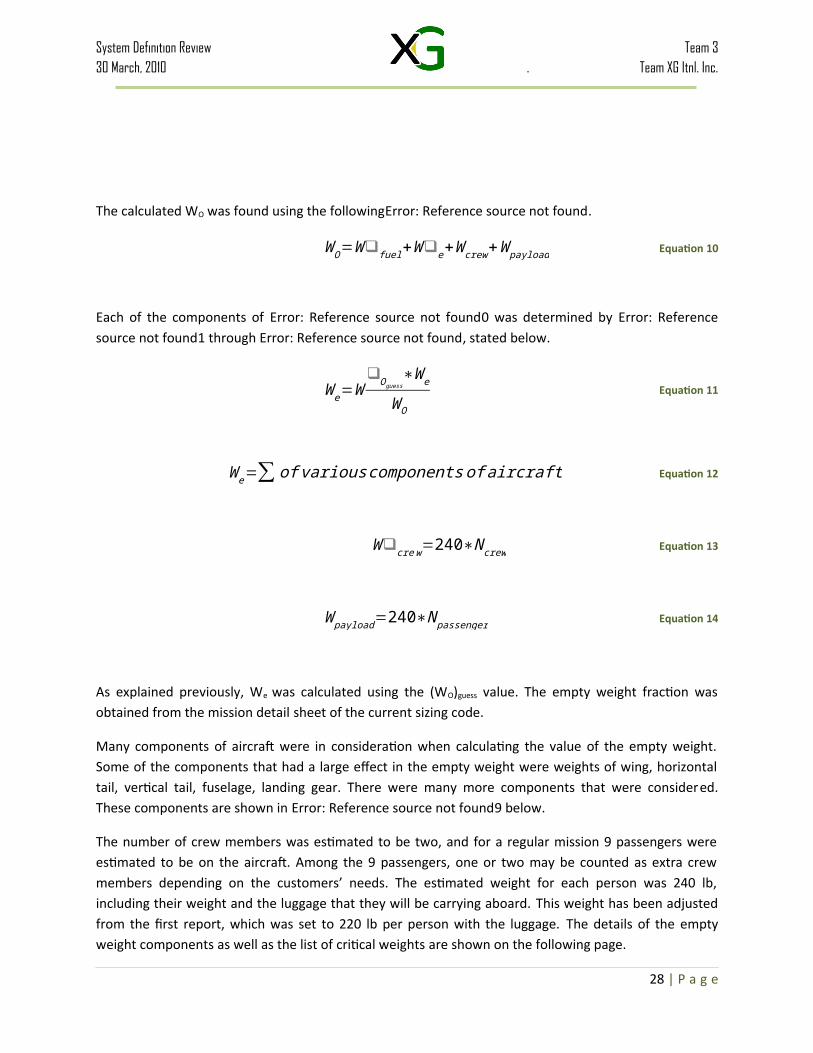
The current estimate of the design takeoff gross weight for both of the designs can be seen in the Table 8 below. In order to obtain the most accurate value of the aircraft design weight possible, iteration was necessary. By guessing the takeoff gross weight, values of W e and Wfuel were able to be calculated because the two values are functions of WO. After the two values were calculated based on the guessed WO, Wpayload and Wcrew were added with the rest of the values. This value, (WO)calc, was then compared to the original (WO)guess value. If the difference of the two values was greater than 0.1, the whole iteration process was repeated until the difference in the calculated and guess values was less than or equal to 0.1.
Table 8. Estimated Takeoff Gross Weight
Design 1 Design 222900 lb 23800 lb
26 | P a g e
System Definition Review Team 330 March, 2010 . Team XG Itnl. Inc.
The calculated WO was found using the followingError: Reference source not found.
WO=W❑fuel+W❑e+W crew+W payload Equation 10
Each of the components of Error: Reference source not found0 was determined by Error: Referencesource not found1 through Error: Reference source not found, stated below.
W e=W❑Oguess
∗W e
WO
Equation 11
W e=∑ of various components of aircraft Equation 12
W❑cre w=240∗N crew Equation 13
W payload=240∗N passenger Equation 14
As explained previously, We was calculated using the (WO)guess value. The empty weight fraction was obtained from the mission detail sheet of the current sizing code.
Many components of aircraft were in consideration when calculating the value of the empty weight. Some of the components that had a large effect in the empty weight were weights of wing, horizontal tail, vertical tail, fuselage, landing gear. There were many more components that were considered. These components are shown in Error: Reference source not found9 below.
The number of crew members was estimated to be two, and for a regular mission 9 passengers were estimated to be on the aircraft. Among the 9 passengers, one or two may be counted as extra crew members depending on the customers’ needs. The estimated weight for each person was 240 lb, including their weight and the luggage that they will be carrying aboard. This weight has been adjusted from the first report, which was set to 220 lb per person with the luggage. The details of the empty weight components as well as the list of critical weights are shown on the following page.
27 | P a g e
System Definition Review Team 330 March, 2010 . Team XG Itnl. Inc.
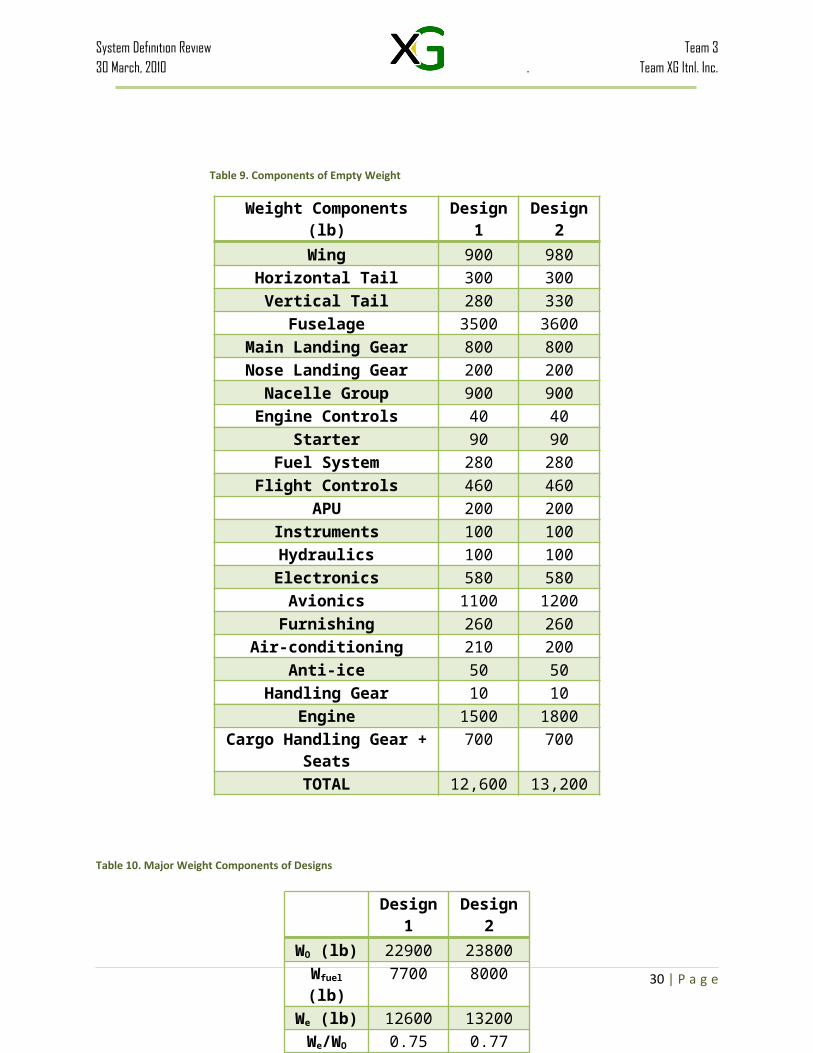
Table 9. Components of Empty Weight
Weight Components (lb) Design 1 Design 2Wing 900 980
Horizontal Tail 300 300Vertical Tail 280 330
Fuselage 3500 3600Main Landing Gear 800 800Nose Landing Gear 200 200
Nacelle Group 900 900Engine Controls 40 40
Starter 90 90Fuel System 280 280
Flight Controls 460 460APU 200 200
Instruments 100 100Hydraulics 100 100Electronics 580 580
Avionics 1100 1200Furnishing 260 260
Air-conditioning 210 200Anti-ice 50 50
Handling Gear 10 10Engine 1500 1800
Cargo Handling Gear + Seats 700 700TOTAL 12,600 13,200
Table 10. Major Weight Components of Designs
28 | P a g e
Design 1 Design 2WO (lb) 22900 23800Wfuel (lb) 7700 8000We (lb) 12600 13200We/WO 0.75 0.77
System Definition Review Team 330 March, 2010 . Team XG Itnl. Inc.
As made apparent by the two tables above, Concept 2 weighs more than Concept 1 does. Recall that design Concept 1 is a tri-engine aircraft composed of two turbo-prop engines and one turbo fan engine with no canard, and concept 2 is a twin engine aircraft composed of one turbofan and one UDF with a canard. The current weight estimate of concept 2 is not as accurate as design one, due to the lack of historical data on UDF engines. Because there is not enough data on UDF engines, estimating the weight of the UDF engine was a difficult process. Two options were available: one option was to estimate the weight based on a very few existing UDF engines that are not completely developed and the other option was to estimate the weight based on a comparison of a variety of turbofan engines that are being used today. The turbofan engine was chosen for comparison because the turbofans were the most similar to the UDF engines. The weight of the UDFs were replaced with current average weight of the turbofan. Mounting one of the engines on the vertical stabilizer requires for greater structural integrity, therefore additional components must be mounted on the aircraft. This predicament increases the weight estimate signficantly. In addition, the canard configuration increased the weight of Concept 2. Canards were necessary to cancel out the nose-down moment that will be created during flight due to the vertically aligned engines.
Although the aircraft concept 1 has three engines, it is believed that the two turboprop engines will be smaller in size compared to the UDF that will be installed on concept 2. As a result, concept 1 will be the overall lighter aircraft.
IX. Engine / Propulsion Selection
Engine Modeling and Concept Descriptions and baseline designs:
Due to the high fuel consumption and efficiency demands that the team faced, it was important to have an understanding of many types of engines that could be implemented. Then it would be easiest to select the engine type that would best fit the mission. The team’s two design concepts require three different engine types, a turbofan, a turboprop, and an unducted fan. For each type, an existing engine was chosen to be the baseline engine, and will be scaled to fit the concept’s needs. Using this approach along with estimated technology factors gives the team scaled concepts with performance estimates for the year 2020.
29 | P a g e
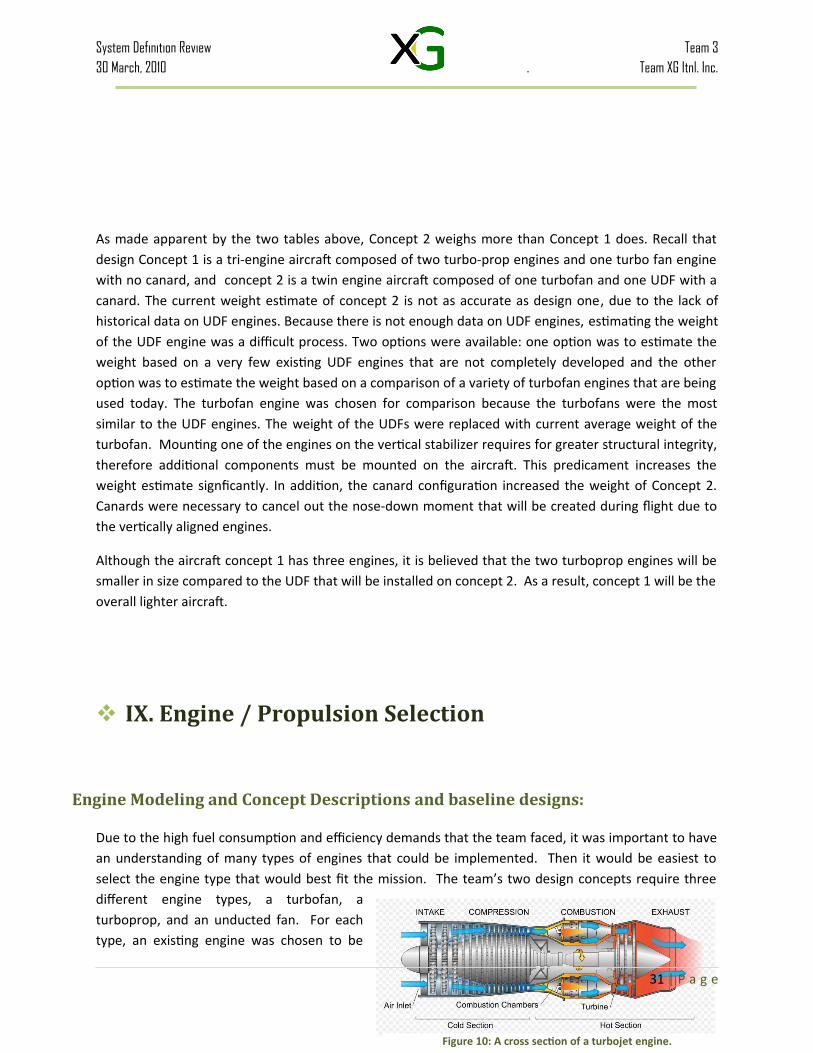
Figure 10: A cross section of a turbojet engine.
System Definition Review Team 330 March, 2010 . Team XG Itnl. Inc.
Through the group’s initial discussion and planning, it was apparent that a turbojet, turbofan, turboprop and propfan (or unducted fan) engine deserved further examination and research.xi
A turbojet engine (seen above in figure 10) is a relatively simple turbine engine. It is the oldest type of general-purpose jet engines. Its main advantage is the simplicity of its design, which consists on an air inlet, an air compressor, a combustion chamber, a gas turbine, and an exhaust nozzle. The air entering the inlet is compressed and forced into the combustion chamber. There, fuel combustion heats and expands the air, which then passes through the turbine and, in turn, powers the compressor. Finally the air expands and accelerates out of the nozzle, providing the engine’s thrust. Though the simplicity of the engine is its main advantage, it is also its greatest disadvantage. While a turbojet is very efficient at supersonic speeds, the basic design misses out on the major technological improvements in efficiency and power for flight less than Mach 2. Because of the turbojet’s inefficiency at this range of speed, which includes the target design mission speed, it was decided that this type of engine would not be utilized.
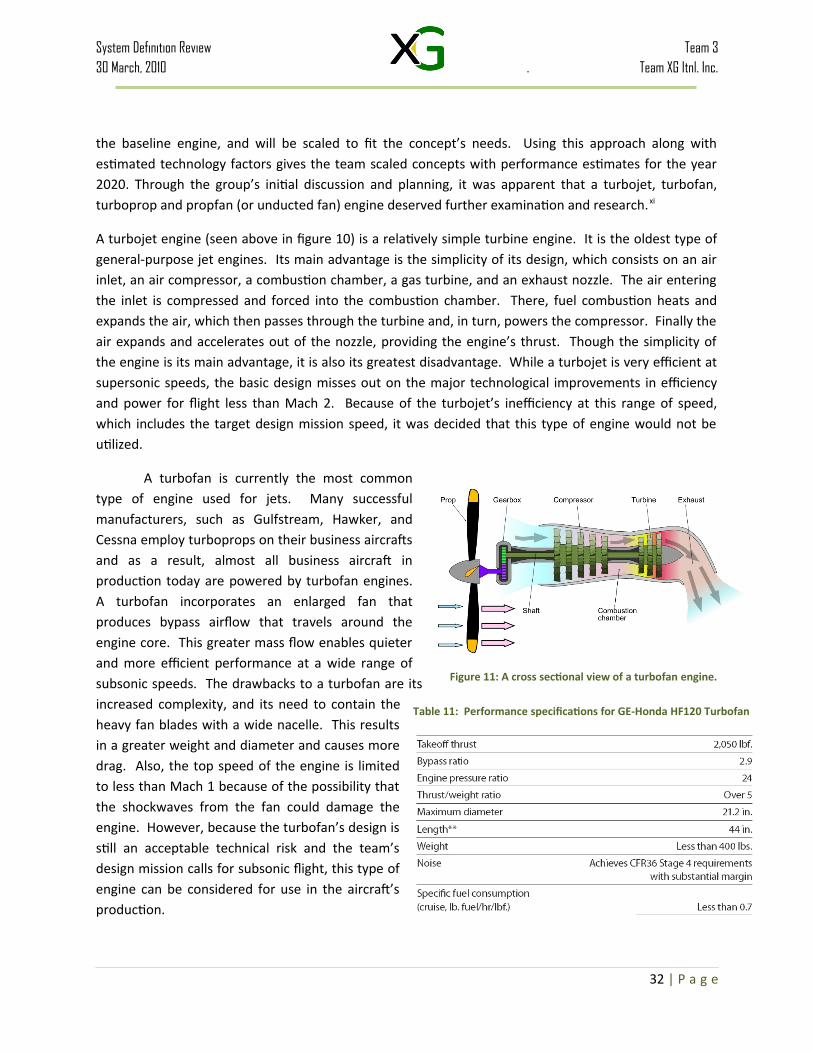
A turbofan is currently the most common type of engine used for jets. Many successful manufacturers, such as Gulfstream, Hawker, and Cessna employ turboprops on their business aircrafts and as a result, almost all business aircraft in production today are powered by turbofan engines. A turbofan incorporates an enlarged fan that produces bypass airflow that travels around the engine core. This greater mass flow enables quieter and more efficient performance at a wide range of subsonic speeds. The drawbacks to a turbofan are its increased complexity, and its need to contain the heavy fan blades with a wide nacelle. This results in a greater weight and diameter and causes more drag. Also, the top speed of the engine is limited to less than Mach 1 because of the possibility that the shockwaves from the fan could damage the engine. However, because the turbofan’s design is still an acceptable technical risk and the team’s design mission calls for subsonic flight, this type of engine can be considered for use in the aircraft’s
production.
For the team’s baseline turbofan engine, the HF120 turbofan was chosen. This engine was recently
30 | P a g e
Table 11: Performance specifications for GE-Honda HF120 Turbofan
Figure 11: A cross sectional view of a turbofan engine.
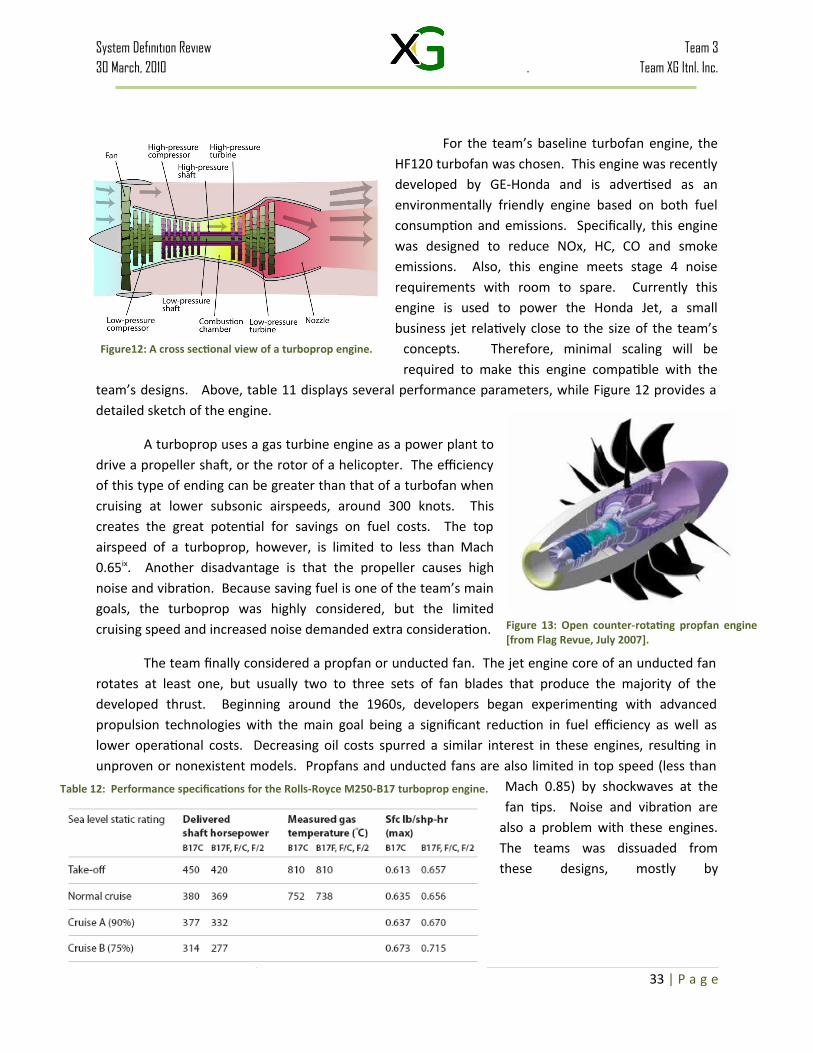
Figure12: A cross sectional view of a turboprop engine.
System Definition Review Team 330 March, 2010 . Team XG Itnl. Inc.
developed by GE-Honda and is advertised as an environmentally friendly engine based on both fuel consumption and emissions. Specifically, this engine was designed to reduce NOx, HC, CO and smoke emissions. Also, this engine meets stage 4 noise requirements with room to spare. Currently this engine is used to power the Honda Jet, a small business jet relatively close to the size of the team’s concepts. Therefore, minimal scaling will be required to make this engine compatible with the team’s designs. Above, table 11 displays several performance parameters, while Figure 12 provides a detailed sketch of the engine.
A turboprop uses a gas turbine engine as a power plant to drive a propeller shaft, or the rotor of a helicopter. The efficiency of this type of ending can be greater than that of a turbofan when cruising at lower subsonic airspeeds, around 300 knots. This creates the great potential for savings on fuel costs. The top airspeed of a turboprop, however, is limited to less than Mach 0.65ix. Another disadvantage is that the propeller causes high noise and vibration. Because saving fuel is one of the team’s main goals, the turboprop was highly considered, but the limited cruising speed and increased noise demanded extra consideration.
The team finally considered a propfan or unducted fan. The jet engine core of an unducted fan rotates at least one, but usually two to three sets of fan blades that produce the majority of the developed thrust. Beginning around the 1960s, developers began experimenting with advanced propulsion technologies with the main goal being a significant reduction in fuel efficiency as well as lower operational costs. Decreasing oil costs spurred a similar interest in these engines, resulting in unproven or nonexistent models. Propfans and unducted fans are also limited in top speed (less than
Mach 0.85) by shockwaves at the fan tips. Noise and vibration are
also a problem with these engines. The teams was dissuaded from these designs, mostly by unavailability of information and uncertainty of their performance, but still intrigued by the possibility for savings on fuel costs.
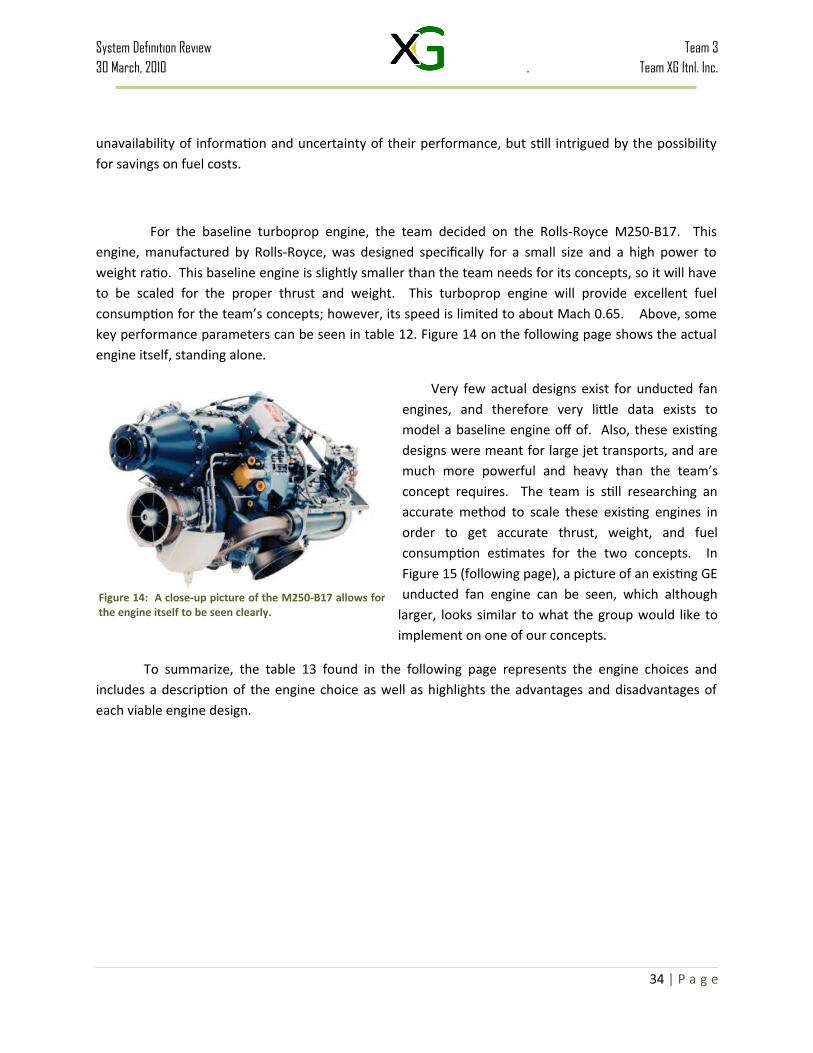
For the baseline turboprop engine, the team decided on the Rolls-Royce M250-B17. This engine, manufactured by Rolls-Royce, was designed specifically for a small size and a high power to weight ratio. This baseline engine is slightly smaller than the team needs for its concepts, so it will have to be scaled for the proper thrust and weight. This turboprop engine will provide excellent fuel
31 | P a g e
Figure 13: Open counter-rotating propfan engine [from Flag Revue, July 2007].
Table 12: Performance specifications for the Rolls-Royce M250-B17 turboprop engine.
System Definition Review Team 330 March, 2010 . Team XG Itnl. Inc.
consumption for the team’s concepts; however, its speed is limited to about Mach 0.65. Above, some key performance parameters can be seen in table 12. Figure 14 on the following page shows the actual engine itself, standing alone.
Very few actual designs exist for unducted fan engines, and therefore very little data exists to model a baseline engine off of. Also, these existing designs were meant for large jet transports, and are much more powerful and heavy than the team’s concept requires. The team is still researching an accurate method to scale these existing engines in order to get accurate thrust, weight, and fuel consumption estimates for the two concepts. In Figure 15 (following page), a picture of an existing GE unducted fan engine can be seen, which although
larger, looks similar to what the group would like to implement on one of our concepts.
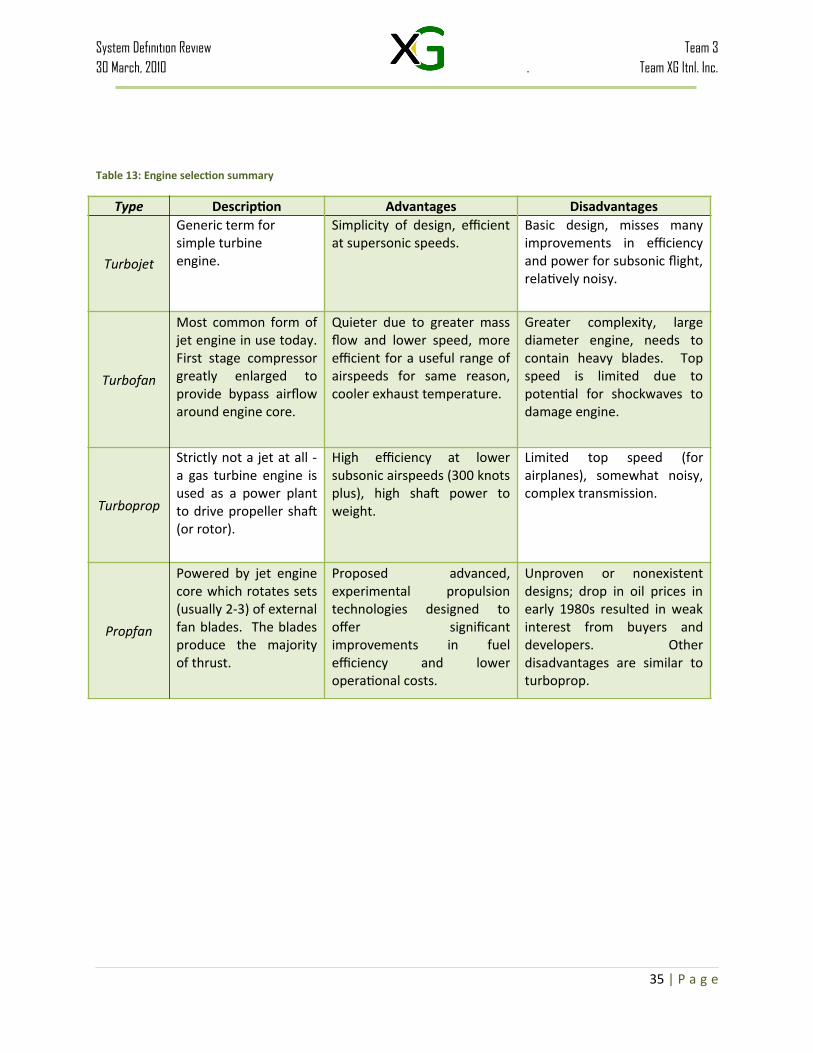
To summarize, the table 13 found in the following page represents the engine choices and includes a description of the engine choice as well as highlights the advantages and disadvantages of each viable engine design.
32 | P a g e
Figure 14: A close-up picture of the M250-B17 allows for the engine itself to be seen clearly.
System Definition Review Team 330 March, 2010 . Team XG Itnl. Inc.
Table 13: Engine selection summary
Type Description Advantages Disadvantages
Turbojet
Generic term forsimple turbineengine.
Simplicity of design, efficient at supersonic speeds.
Basic design, misses many improvements in efficiency and power for subsonic flight, relatively noisy.
Turbofan
Most common form of jet engine in use today. First stage compressor greatly enlarged to provide bypass airflow around engine core.
Quieter due to greater mass flow and lower speed, more efficient for a useful range of airspeeds for same reason, cooler exhaust temperature.
Greater complexity, large diameter engine, needs to contain heavy blades. Top speed is limited due to potential for shockwaves to damage engine.
Turboprop
Strictly not a jet at all - a gas turbine engine is used as a power plant to drive propeller shaft (or rotor).
High efficiency at lower subsonic airspeeds (300 knots plus), high shaft power to weight.
Limited top speed (for airplanes), somewhat noisy, complex transmission.
Propfan
Powered by jet engine core which rotates sets (usually 2-3) of external fan blades. The blades produce the majority of thrust.
Proposed advanced, experimental propulsion technologies designed to offer significant improvements in fuel efficiency and lower operational costs.
Unproven or nonexistent designs; drop in oil prices in early 1980s resulted in weak interest from buyers and developers. Other disadvantages are similar to turboprop.
33 | P a g e
System Definition Review Team 330 March, 2010 . Team XG Itnl. Inc.
Technology Factors:
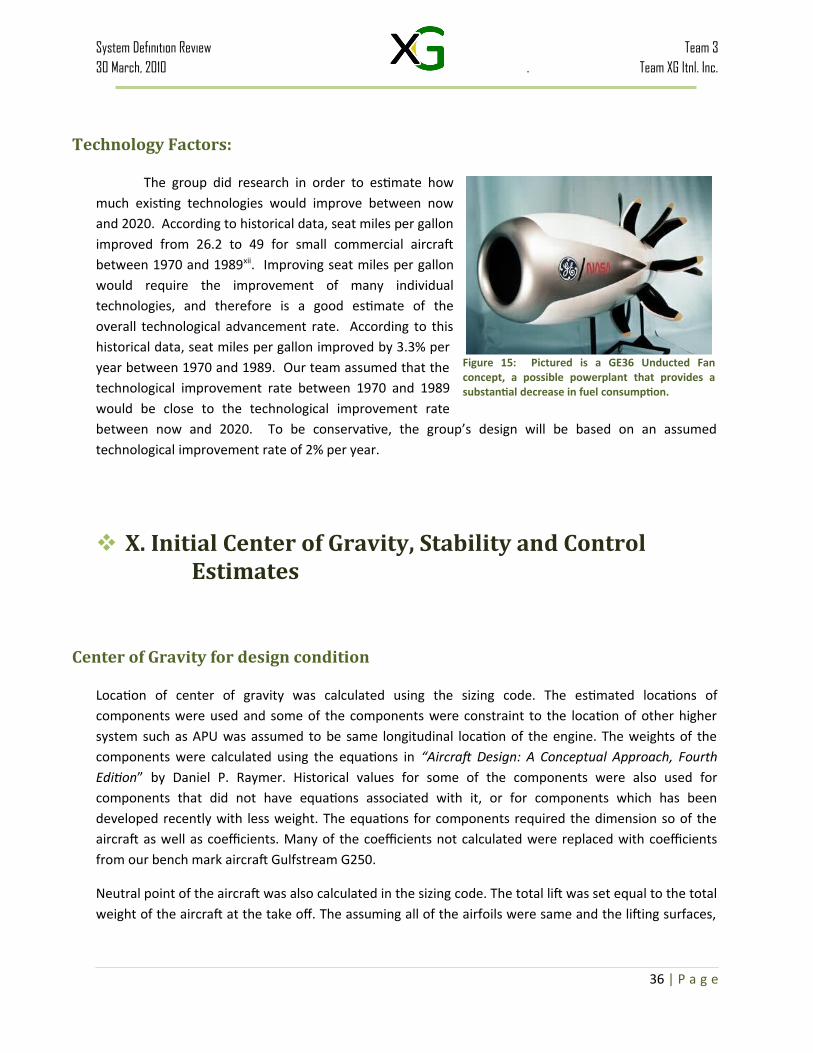
The group did research in order to estimate how much existing technologies would improve between now and 2020. According to historical data, seat miles per gallon improved from 26.2 to 49 for small commercial aircraft between 1970 and 1989xii. Improving seat miles per gallon would require the improvement of many individual technologies, and therefore is a good estimate of the overall technological advancement rate. According to this historical data, seat miles per gallon improved by 3.3% per year between 1970 and 1989. Our team assumed that the technological improvement rate between 1970 and 1989 would be close to the technological improvement rate between now and 2020. To be conservative, the group’s design will be based on an assumed technological improvement rate of 2% per year.
X. Initial Center of Gravity, Stability and Control Estimates
Center of Gravity for design condition
Location of center of gravity was calculated using the sizing code. The estimated locations of components were used and some of the components were constraint to the location of other higher system such as APU was assumed to be same longitudinal location of the engine. The weights of the components were calculated using the equations in “Aircraft Design: A Conceptual Approach, Fourth Edition” by Daniel P. Raymer. Historical values for some of the components were also used for components that did not have equations associated with it, or for components which has been developed recently with less weight. The equations for components required the dimension so of the aircraft as well as coefficients. Many of the coefficients not calculated were replaced with coefficients from our bench mark aircraft Gulfstream G250.
Neutral point of the aircraft was also calculated in the sizing code. The total lift was set equal to the total weight of the aircraft at the take off. The assuming all of the airfoils were same and the lifting surfaces,
34 | P a g e
Figure 15: Pictured is a GE36 Unducted Fan concept, a possible powerplant that provides a substantial decrease in fuel consumption.
System Definition Review Team 330 March, 2010 . Team XG Itnl. Inc.
total lift was distributed by the area of the lifting surfaces. The moment created by the lift was then calculated by the locations of the center of pressure.
Estimate of static margin in representative cruise condition
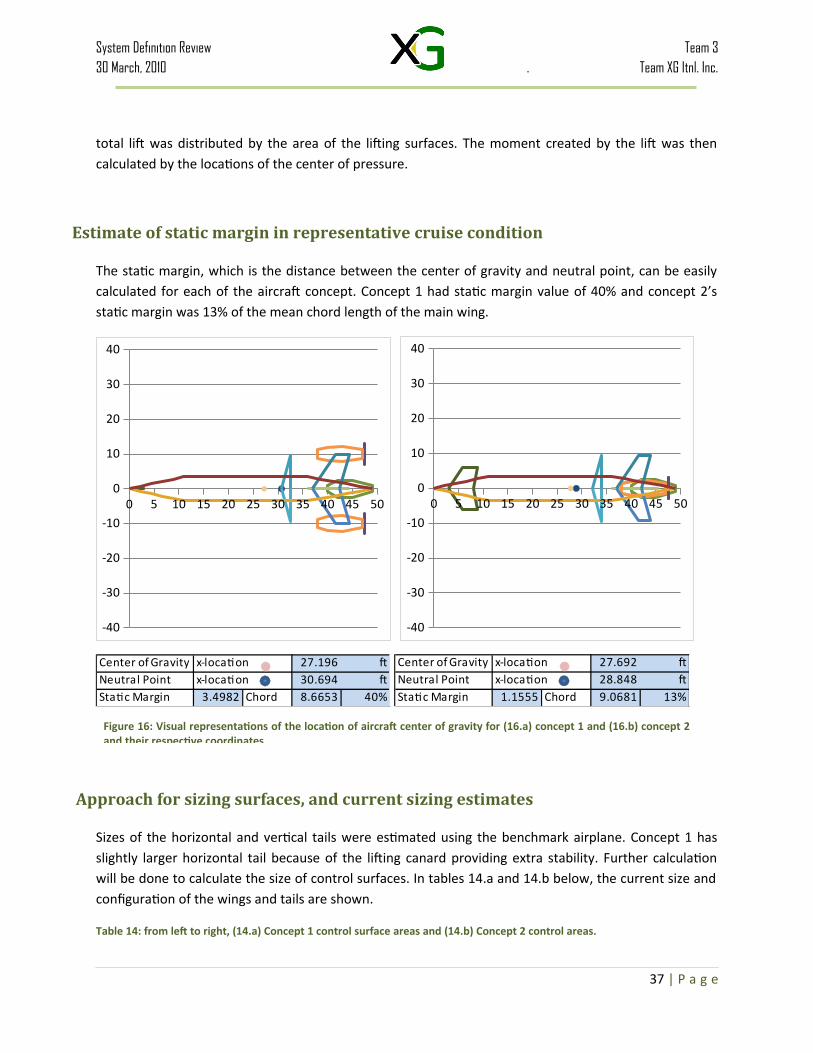
The static margin, which is the distance between the center of gravity and neutral point, can be easily calculated for each of the aircraft concept. Concept 1 had static margin value of 40% and concept 2’s static margin was 13% of the mean chord length of the main wing.
0 5 10 15 20 25 30 35 40 45 50
-40
-30
-20
-10
0
10
20
30
40
0 5 10 15 20 25 30 35 40 45 50
-40
-30
-20
-10
0
10
20
30
40
Center of Gravity x-location 27.196 ftNeutral Point x-location 30.694 ftStatic Margin 3.4982 Chord 8.6653 40%
Center of Gravity x-location 27.692 ftNeutral Point x-location 28.848 ftStatic Margin 1.1555 Chord 9.0681 13%
Approach for sizing surfaces, and current sizing estimates
Sizes of the horizontal and vertical tails were estimated using the benchmark airplane. Concept 1 has slightly larger horizontal tail because of the lifting canard providing extra stability. Further calculation will be done to calculate the size of control surfaces. In tables 14.a and 14.b below, the current size and configuration of the wings and tails are shown.
Table 14: from left to right, (14.a) Concept 1 control surface areas and (14.b) Concept 2 control areas.
35 | P a g e
Figure 16: Visual representations of the location of aircraft center of gravity for (16.a) concept 1 and (16.b) concept 2 and their respective coordinates
System Definition Review Team 330 March, 2010 . Team XG Itnl. Inc.
Wing Canard Yehudi Tail Vertical
Wing Area 329.45 0 30 80 80
Leading Edge Angle 20 25 10.925 25 25
Sweep Angle 17.809 #DIV/0! 6.2601 21.784 16.68
Taper Ratio 0.5 0.6 0 0.5 0.5
Aspect Ratio 7.8 3 12 5 2
Wing Canard Yehudi Tail Vertical
Wing Area 360.79 50 30 70 100
Leading Edge Angle 20 25 10.925 25 25
Sweep Angle 17.809 20.956 6.2601 21.784 16.68
Taper Ratio 0.5 0.6 0 0.5 0.5
Aspect Ratio 7.8 3 12 5 2
XI. Summary of Aircraft Concepts
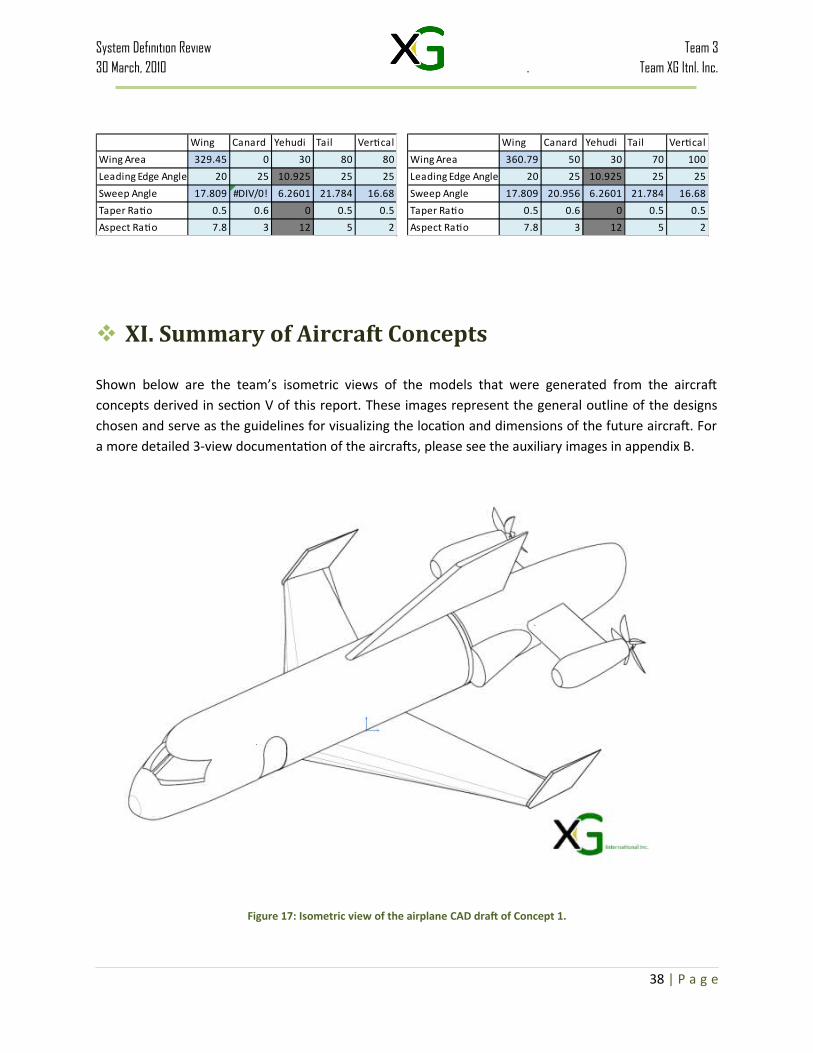
Shown below are the team’s isometric views of the models that were generated from the aircraft concepts derived in section V of this report. These images represent the general outline of the designs chosen and serve as the guidelines for visualizing the location and dimensions of the future aircraft. For a more detailed 3-view documentation of the aircrafts, please see the auxiliary images in appendix B.
Figure 17: Isometric view of the airplane CAD draft of Concept 1.
36 | P a g e
System Definition Review Team 330 March, 2010 . Team XG Itnl. Inc.
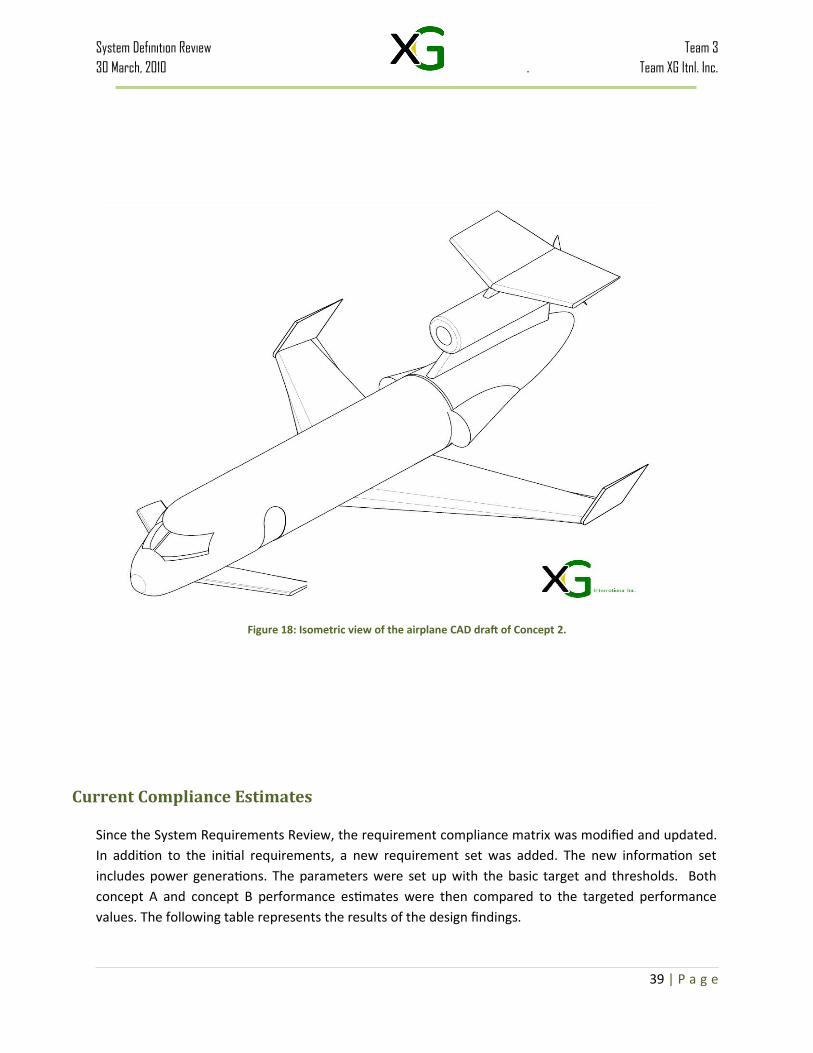
Figure 18: Isometric view of the airplane CAD draft of Concept 2.
Current Compliance Estimates
Since the System Requirements Review, the requirement compliance matrix was modified and updated. In addition to the initial requirements, a new requirement set was added. The new information set includes power generations. The parameters were set up with the basic target and thresholds. Both concept A and concept B performance estimates were then compared to the targeted performance values. The following table represents the results of the design findings.
37 | P a g e
System Definition Review Team 330 March, 2010 . Team XG Itnl. Inc.
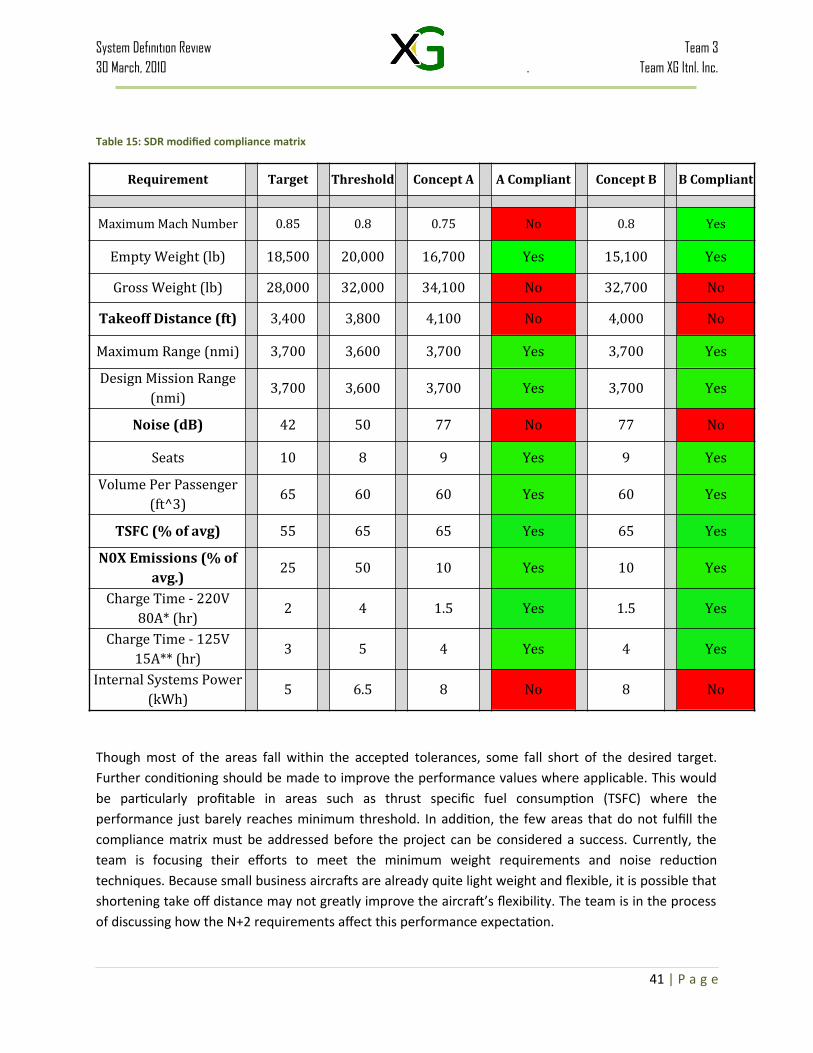
Table 15: SDR modified compliance matrix
Though most of the areas fall within the accepted tolerances, some fall short of the desired target. Further conditioning should be made to improve the performance values where applicable. This would be particularly profitable in areas such as thrust specific fuel consumption (TSFC) where the performance just barely reaches minimum threshold. In addition, the few areas that do not fulfill the compliance matrix must be addressed before the project can be considered a success. Currently, the team is focusing their efforts to meet the minimum weight requirements and noise reduction techniques. Because small business aircrafts are already quite light weight and flexible, it is possible that shortening take off distance may not greatly improve the aircraft’s flexibility. The team is in the process of discussing how the N+2 requirements affect this performance expectation.
38 | P a g e
Requirement Target Threshold Concept A A Compliant Concept B B Compliant
Maximum Mach Number 0.85 0.8 0.75 No 0.8 YesEmpty Weight (lb) 18,500 20,000 16,700 Yes 15,100 YesGross Weight (lb) 28,000 32,000 34,100 No 32,700 NoTakeoff Distance (ft) 3,400 3,800 4,100 No 4,000 NoMaximum Range (nmi) 3,700 3,600 3,700 Yes 3,700 YesDesign Mission Range (nmi) 3,700 3,600 3,700 Yes 3,700 Yes
Noise (dB) 42 50 77 No 77 NoSeats 10 8 9 Yes 9 YesVolume Per Passenger (ft^3) 65 60 60 Yes 60 YesTSFC (% of avg) 55 65 65 Yes 65 Yes
N0X Emissions (% of avg.)
25 50 10 Yes 10 YesCharge Time - 220V 80A* (hr) 2 4 1.5 Yes 1.5 YesCharge Time - 125V 15A** (hr) 3 5 4 Yes 4 YesInternal Systems Power (kWh) 5 6.5 8 No 8 No
System Definition Review Team 330 March, 2010 . Team XG Itnl. Inc.
Next Steps
The next steps to be completed in order to satisfy all requirements and goals for the conceptual design review begin with the selection of the final concept determined to be the best design. For this design, all of the significant features must be identified, as well as any advanced technologies that will be used or at least considered for production. Also, important design parameter values, such as wing loading, aspect ratio, wing sweep, etc., must be optimized. All of these characteristics must be identified in support of the “best concept design” decision.
Once a decision is made and rightly justified, the results of the sizing code and carpet plots must be given and explained. The actual code used to determine sizing parameters and the like must be explained, with the uses made clear as well as the origin of the scripts. Then, the assumptions and approaches utilized in modeling must be investigated in depth. More specifically, the general weight equation categories, or the combinations of equations used in finding specific component weights, significant fudge factors, values for fixed design parameters such as CL, t/c, etc., an approach to drag prediction, the method of tail sizing, way of engine modeling, as well as the mission modeling must all be made abundantly clear. In addition, the sizing code must be validated/calibrated using a similar existing business aircraft.
Then, the major benefits and drawbacks of the selected design must be weighed against each other. This may be done by explaining the selection of the best concept from the team’s other concepts previously in consideration. Using a summary of the carpet plot studies for the two preferred concepts and emphasizing the design constraints used to “size” the aircraft concept will help to solidify the decisions made in selecting the final concept design. A final carpet plot must then be used to select the desired design point of the best concept design. Some major design aspects that will yield substantial benefits as well as negative consequences may include tail, wing and canard placement/configuration, configuration of the power plants, as well as the cabin configuration.
Inherently, an aircraft description including a to-scale, dimensioned, three-view depiction of the aircraft in addition to diagrams providing the internal layout and cabin layout must be provided.
Next, the aerodynamic design parameters must be explored and justified. The airfoil selection for wings, tails, and canards must be presented and explained. High-lifting devices, drag build up, and aircraft drag polar at cruise must be documented. For aircraft performance, A V-n diagram will be required to illustrate load factors while maneuvering, and specifications such as stall speed, maximum speed at various points during the mission, takeoff distance, landing distance, etc., must be provided in the form of a performance summary.
In describing the aspects of propulsion design, an engine description containing helpful specifications such as by-pass ratio, sea-level static thrust, etc., must be supplied. Significant assumptions made
39 | P a g e

System Definition Review Team 330 March, 2010 . Team XG Itnl. Inc.
regarding losses, efficiency, and the like must be listed, and the amount of thrust available/required at various points during the mission should also be explicitly stated. The structural design elements can be best expressed by providing a diagram that illustrates important load paths, the appointment of the wings and fuselage, engine mounting, and landing gear configuration. Also, the materials used for the various aircraft components must be identified, and their uses justified.
Subsequently, other structural aspects, such as weights and balances, must be quantified and discussed. An aircraft group weights statement must be completed, the empty weight prediction method must be explicated, and the locations of the centers of gravity must be identified. Similarly, the stability and control aspects of the concept design should be clearly defined. The static, longitudinal stability of the aircraft, elevator size, and lateral stability of the aircraft must be elucidated, the lattermost of which can be broken down into the lateral trim with one-engine out, cross-wind landing condition, and aileron and rudder sizing.
Having identified, discussed, and justified the elementary design aspects of the aircraft concept, other characteristics such as noise and cost should be discussed. Design characteristics included in an effort to decrease internal/external noise must be declared, ways of distinguishing and quantifying this noise must be explained, and estimates of the certification noise values for the aircraft should be made where possible. The cost of developing, manufacturing, and certifying the aircraft must be made apparent, as well as the operating costs. The method used to compute these costs should be verified, and a business case must be used to estimate the number of aircraft anticipated in a production run.
After all of these steps are taken, a proper summary of the aforementioned points should be made, complete with a table of compliance. A conjecture regarding the possible expansion of the further research and design of environmentally-sensitive business aircraft concepts should be made, and any additional future efforts that can and should be made to improve the concept must be suggested.
Presently, all areas of research and development of the current concept designs are on time and on target, with the lone exception being the area of noise reduction. Current efforts to reduce noise have not yet provided the desired effect in meeting the noise reduction goals. However, it should be noted that satisfying noise reduction requirements is of a lower priority with respect to all other design parameters, so it follows that this is the last area to receive the necessary attention and research.
40 | P a g e
System Definition Review Team 330 March, 2010 . Team XG Itnl. Inc.
XII. Appendix
Appendix A: Bibliography
___ ‘Gulfstream raises the bar with the G250’, Flight International Magazine. 7-13 October, 2008, p.27
___“G250 overview”.” G200 Specifications”. Gulfstream. Available Online [http://www.gulfstream.com/downloads/_downloads/product_spec_sheets/G200%20Specifications.pdf ] Retrieved May 12, 2009.
‘Acoustic pressures on a prop-fan aircraft fuselage surface’ (1980): 11+. Print.
Anderson, J.A. Maximum lift coefficients Table 5.3 Aircraft Performance and Design
Clausing, D., "Selecting a Winning Concept," from Total Quality Development , ASME Press, New York, 1994, pp. 150-164.
Collier, Fay Dr., ‘Fundemental Aeronautics Program Subsonic Fixed Wing Project Reference Document.’. Available online [www.aeronautics.nasa.gov/nra_pdf/sfw_proposal_c1.pdf],. 2010.
Flight International (2007-07-12). "Whatever happened to propfans?". Avalaible online [http://www.flightglobal.com/articles/2007/06/12/214520/whatever-happened-to-propfans.html]. Retrieved 2010.
Frei, Stefan. Urban Mader. “Technology Speed of Civil Jet Engines”, Techzoom publications. 2006
Heet, Erika. ‘FrontRunners: Above and Beyond.’ Robb Report. Ed. April 01, 2010. New York, NY. pp 23-24
“Propfan Engines”. Aerospace Web Organization, 24 Feb. 2002. Web.. Available online [http://www.aerospaceweb.org/question/propulsion/q0067.shtml]. 11 Feb. 2010
“Sikorksy to test active vibration control for S-92 rotor hub”. Flight International, 16 Feb. 2009. Web. 11 Feb. 2010. Available online [http://www.flightglobal.com/articles/2009/02/16/322533/sikorksy-to-test-active-vibration-control-for-s-92-rotor.html], 2010
“Understanding the Cost of Solar Energy”. Green Econometrics, 13 Aug. 2007. Web. 11 Feb. Avalaible online.[http://greenecon.net/understanding-the-cost-of-solar-energy/energy_ economics.html] 2010.
U.S. Department of Transportation, Federal Aviation Administration. “Aircraft Weight and Balance Handbook: FAA-H-8083-1A”. U.S. Government Printing Office (GPO). Washington DC. 2007.
41 | P a g e
System Definition Review Team 330 March, 2010 . Team XG Itnl. Inc.
U.S. Department of Transportation, Federal Aviation Administration. “2009-2013 FAA Flight Plan”. U.S. Government Printing Office (GPO). Washington DC. 2007.
www.velocitybuilder.com. "What the heck is a 'Canard'?".. available online [http://www.velocitybuilder. com/about_canard_aircrafts.htm)Retrieved 2008-09-13.] 2010
42 | P a g e
System Definition Review Team 330 March, 2010 . Team XG Itnl. Inc.
43 | P a g e
System Definition Review Team 330 March, 2010 . Team XG Itnl. Inc.
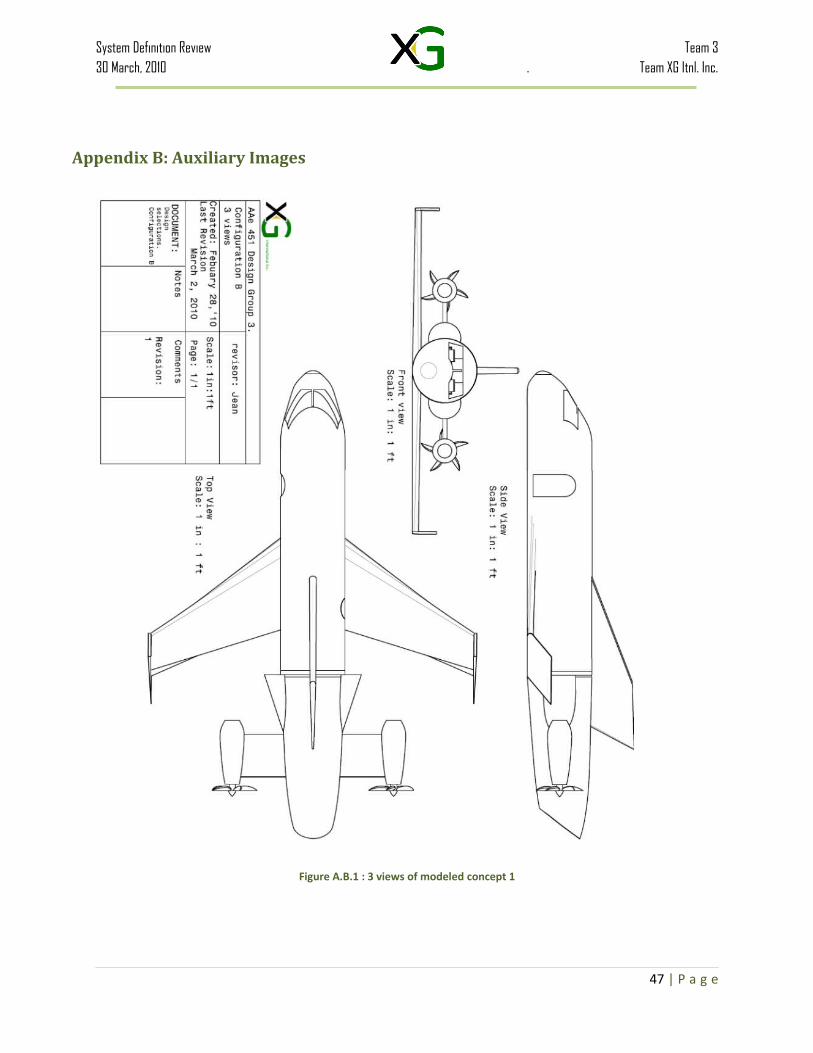
Appendix B: Auxiliary Images
Figure A.B.1 : 3 views of modeled concept 1
44 | P a g e

System Definition Review Team 330 March, 2010 . Team XG Itnl. Inc.
Figure A.B.2 : 3 views model of generated aircraft concept 2
45 | P a g e

System Definition Review Team 330 March, 2010 . Team XG Itnl. Inc.
Appendix C: Sizing Code samples
Table A.C.1: Main Code
Nose Fuselage EmpannageEnd Wing Canard Yehudi Tail Vertical 2
Length 11 25 13 0 Wing Area 329.45 0 30 80 80 Length 2 3 4 0 0.5
y-location -2 0 0 2 Leading Edge Angle 20 25 10.925 25 25 x-location 38 40 43 47 48
diameter 0 7 7 0 Sweep Angle 17.809 #DIV/0! 6.2601 21.784 16.68 y-location 0 0 0 0 0
Taper Ratio 0.5 0.6 0 0.5 0.5 z-location 10 10 10 10 10
Aspect Ratio 7.8 3 12 5 2 diameter 2.4 4 4.5 2.4 4
x-Location 22 3 30.665 37 36 lbf
Center of Gravity x-location 27.196 ft y-Location -2 -2 -2 0 lbs
Neutral Point x-location 30.694 ft ft^2Static Margin 3.4982 Chord 8.6653 40% ft
12585 lb ft22936 lb ft^3
0.3632 192.625 Length 2 3 4 0 0.5
x-location 40 42 45 49 50y-location 0 0 0 0 0z-location 6.5 6.5 6.5 6.5 6.5diameter 1.8 5 5 1.8 4
lbflbsft^2ftftft^3
lb/Gal
$/Gallon
$Fuel
Con
sum
ption
6.8
4.42
5012.234708
Fuel Density
Fuel Price
Mission Fuel Price
Thrust To Weight RatioWing Loading
Empty Weight Total Weight
Perf
orm
ance
Thrust 0Weight -240
Area 1.203Diameter 1.773
Length 3.31Volume -13.72
27.12Turbo Prop
Loca
tion
Number of Engine
4165
753
4.2402.432
Thrust
Weight
AreaDiameter
LengthVolume
5.29
Number of Engine
Main
20.750
NACA 2414
9
Fuselage Wing Engine
Loca
tion
Perf
orm
ance
Unducted Fan
Number of Passengers
Number of Flight Crew
Mcruise
-7
13
0 10 20 30 40 50
-5
5
15
-30 -10 10 30
-40
-30
-20
-10
0
10
20
30
40
0 20 40
0
0.1
0.2
0.3
0.4
0.5
0.6
50 70 90 110 130
Top of cli mb (1g steady, level flight, M = 0.80 @ h=45K,service ceili ng)
Subsonic 2g manuever, 250kts @ h =10K
Takeoff ground roll 4000 ft @ h = 5K, +15° hot day
Landing ground roll 2500 ft @ h = 5K, +15° hot day
Second segment climb gradient above h = 5K, +15° hot day
W0/S & TSL/W0 Value
-2
3
0 5 10
46 | P a g e
System Definition Review Team 330 March, 2010 . Team XG Itnl. Inc.
TableA.C.2: Geometry sizing code
Nose FuselageEmpannageEnd Wing Canard Yehudi Tail Vertical form factor wetted areainterference factorReynolds NumberSkin Friction Coeffi cientCoeffi cient Parasite DragParasite Drag
Length 11 25 13 0 49 Wing Area 329.4475 0 30 80 80 1 2 3 4 Prop Fuselage 1.192427114 878.6162 1 9.95E+07 0.002130 0.006773 375.928947
CenterLine x 0 11 36 49 7 Sweep Angle 20 25 10.92543 25 25 Length 2 3 4 0 0.5 Wing 1.031591485 672.0729 1 1.32E+07 0.002874 0.006049 335.731330
Start y -2 0 0 2 7 Taper Ratio 0.5 0.6 0 0.5 0.5 x 38 40 43 47 47.5 Canard #DIV/0! 0 1 #DIV/0! 0.000000 0.000000 0.000000diameter d 0 7 7 0 878.6 Aspect Ratio 7.8 3 12 5 2 y 0 0 0 0 0 Yehudi 1.034646215 61.2 1 3211275 0.003627 0.007655 38.692746
141.1 962.1 166.8 form factor 1.192 x-Location 22 3 30.66532 37 36 z 10 10 10 10 10 Horizontal Tail1.030059739 163.2 1 8.12E+06 0.003106 0.006527 87.967066126.9 549.8 148 interference factor 1 y-Location -2 -2 -2 0 0 diameter d 2.43 4 4.5 2.43 6 Vertical Tail1.031990517 163.2 1 1.28E+07 0.002887 0.006077 81.907651
0 b/2 25.34606 0 9.486833 10 6.324555 15.3 37.7 56.5 total 113 Nacelles 1.155555556 113.0973 1 1.83E+07 0.002732 0.001084 60.156008C1+C2 12.99798 #DIV/0! 3.162278 8 12.64911 1.16 total 0.034165 980.383747d 9.22521 0 1.831244 4.663077 2.949189 1C1 8.665319 #DIV/0! 3.162278 5.333333 8.43274 V 661.5104708 Viscosity 2.51E-07C2 4.332659 #DIV/0! 0 2.666667 4.21637 1 h 42000 Re/l 2.03E+06C1quarter 2.16633 #DIV/0! 0.790569 1.333333 2.108185 1 2 3 4 rho 0.000770014 q 168.4775C2quarter 1.083165 #DIV/0! 0 0.666667 1.054093 Length 2 3 4 0 a 882.013961C1qLocation 24.16633 #DIV/0! 31.45589 38.33333 38.10819 x 40 42 45 49C2qLoaction 32.30838 #DIV/0! 32.49656 42.32974 40.00328 y 0 0 0 0 Coeffi cient of Lift 0.413233Sweep angle 17.80885 #DIV/0! 6.26013 21.78367 16.68037 z 0 0 0 0 Coeffi cient of Induced Drag 0.008711angle 10.92543 diameter d 1.77 5 5 1.77Wetted Area 672.0729 0 61.2 163.2 163.2 4.94 58.9 78.5 total 141 Sum of CD 0.042875sweep correction1.954937 #DIV/0! 2.14401 1.86013 1.979636 Drag 2379.769 lbForm Factor 1.031591 #DIV/0! 1.034646 1.03006 1.031991 t/c 0.016156interference factor 1 1 1 1 1 MDD 0.865199Mean Chord Length6.498989 #DIV/0! 1.581139 4 6.324555 Mcr 0.765199Center of Pressure28.23735 #DIV/0! 31.97623 40.33154 0 L/D 9.638025Partial Lift 17195 0 1565.803 4175.475Moment 485541.2 0 50068.47 168403.3
CenterLinex y radius y-top y-bottomz-top z-bottom
0 0 -2 0 -2 -2 0 01 2.2 -1.6 0.7 -0.9 -2.3 0.7 -0.7 x y z neg-z2 4.4 -1.2 1.4 0.2 -2.6 1.4 -1.4 A 22 -2 0 03 6.6 -0.8 2.1 1.3 -2.9 2.1 -2.1 B 31.22521 -2 25.34606 -25.34614 8.8 -0.4 2.8 2.4 -3.2 2.8 -2.8 C 35.55787 -2 25.34606 -25.34615 11 0 3.5 3.5 -3.5 3.5 -3.5 D 30.66532 -2 0 06 11 0 3.5 3.5 -3.5 3.5 -3.5 x y z neg-z7 16 0 3.5 3.5 -3.5 3.5 -3.5 A 3 -2 0 08 21 0 3.5 3.5 -3.5 3.5 -3.5 B 3 -2 0 09 26 0 3.5 3.5 -3.5 3.5 -3.5 C #DIV/0! -2 0 0
10 31 0 3.5 3.5 -3.5 3.5 -3.5 D #DIV/0! -2 0 011 36 0 3.5 3.5 -3.5 3.5 -3.5 x y z neg-z12 36 0 3.5 3.5 -3.5 3.5 -3.5 A 30.66532 -2 0 013 38.6 0.4 2.8 3.2 -2.4 2.8 -2.8 B 32.49656 -2 9.486833 -9.4868314 41.2 0.8 2.1 2.9 -1.3 2.1 -2.1 C 32.49656 -2 9.486833 -9.4868315 43.8 1.2 1.4 2.6 -0.2 1.4 -1.4 D 32.49656 -2 0 016 46.4 1.6 0.7 2.3 0.9 0.7 -0.7 x y z neg-z x y z radiusy-top y-bottomz-top z-bottom17 49 2 0 2 2 0 0 A 37 0 0 0 38 0 # 0 0 0 10 10
B 41.66308 0 10 -10 38 0 # 1.22 1.22 -1.2 11.2 8.78radius 0 y -2 C 44.32974 0 10 -10 40 0 # 2 2 -2 12 8Point # Angle y-positionz-position D 42.33333 0 0 0 43 0 # 2.25 2.25 -2.3 12.3 7.75
0 0 0 -2 x y z 47 0 # 1.22 1.22 -1.2 11.2 8.781 0.393 0 -2 A 36 0 0 47 0 # 0 0 0 10 102 0.785 0 -2 B 38.94919 6.324555 0 38 0 # 0 0 0 -10 -103 1.178 0 -2 C 43.16556 6.324555 0 38 0 # 1.22 1.22 -1.2 -11 -8.784 1.571 0 -2 D 44.43274 0 0 40 0 # 2 2 -2 -12 -85 1.963 0 -2 43 0 # 2.25 2.25 -2.3 -12 -7.756 2.356 0 -2 47 0 # 1.22 1.22 -1.2 -11 -8.787 2.749 0 -2 47 0 # 0 0 0 -10 -108 3.142 0 -29 3.534 0 -2 radius 1 x y z
10 3.927 0 -2 Point # Anglex-positiony-positionz-positionneg-z11 4.32 0 -2 0 0 38 0 11.2 -1112 4.712 0 -2 1 0 38 0.47 11.1 -1113 5.105 0 -2 2 1 38 0.86 10.9 -1114 5.498 0 -2 3 1 38 1.12 10.5 -1015 5.89 0 -2 4 2 38 1.22 10 -1016 6.283 0 -2 5 2 38 1.12 9.53 -9.5
radius 0.7 y -1.6 6 2 38 0.86 9.14 -9.1Point # Angle y-positionz-position 7 3 38 0.47 8.88 -8.9
0 0 0 -0.9 8 3 38 0 8.78 -8.81 0.393 0.268 -0.953 9 4 38 -0.5 8.88 -8.92 0.785 0.495 -1.105 10 4 38 -0.9 9.14 -9.13 1.178 0.647 -1.332 11 4 38 -1.1 9.53 -9.54 1.571 0.7 -1.6 12 5 38 -1.2 10 -105 1.963 0.647 -1.868 13 5 38 -1.1 10.5 -106 2.356 0.495 -2.095 14 5 38 -0.9 10.9 -117 2.749 0.268 -2.247 15 6 38 -0.5 11.1 -118 3.142 9E-17 -2.3 16 6 38 -0 11.2 -119 3.534 -0.268 -2.247 radius 2
10 3.927 -0.495 -2.095 Point # Angle11 4.32 -0.647 -1.868 0 0 40 0 12 -1212 4.712 -0.7 -1.6 1 0 40 0.77 11.8 -1213 5.105 -0.647 -1.332 2 1 40 1.41 11.4 -1114 5.498 -0.495 -1.105 3 1 40 1.85 10.8 -1115 5.89 -0.268 -0.953 4 2 40 2 10 -1016 6.283 -2E-16 -0.9 5 2 40 1.85 9.23 -9.2
radius 1.4 y -1.2 6 2 40 1.41 8.59 -8.6Point # Angle y-positionz-position 7 3 40 0.77 8.15 -8.2
0 0 0 0.2 8 3 40 0 8 -81 0.393 0.536 0.093 9 4 40 -0.8 8.15 -8.22 0.785 0.99 -0.21 10 4 40 -1.4 8.59 -8.63 1.178 1.293 -0.664 11 4 40 -1.8 9.23 -9.24 1.571 1.4 -1.2 12 5 40 -2 10 -105 1.963 1.293 -1.736 13 5 40 -1.8 10.8 -116 2.356 0.99 -2.19 14 5 40 -1.4 11.4 -117 2.749 0.536 -2.493 15 6 40 -0.8 11.8 -128 3.142 2E-16 -2.6 16 6 40 -0 12 -129 3.534 -0.536 -2.493 radius 2
10 3.927 -0.99 -2.19 Point # Angle11 4.32 -1.293 -1.736 0 0 43 0 12.3 -1212 4.712 -1.4 -1.2 1 0 43 0.86 12.1 -1213 5.105 -1.293 -0.664 2 1 43 1.59 11.6 -1214 5.498 -0.99 -0.21 3 1 43 2.08 10.9 -1115 5.89 -0.536 0.093 4 2 43 2.25 10 -1016 6.283 -3E-16 0.2 5 2 43 2.08 9.14 -9.1
radius 2.1 y -0.8 6 2 43 1.59 8.41 -8.4Point # Angle z-position 7 3 43 0.86 7.92 -7.9
0 0 0 1.3 8 3 43 0 7.75 -7.81 0.393 0.804 1.14 9 4 43 -0.9 7.92 -7.92 0.785 1.485 0.685 10 4 43 -1.6 8.41 -8.43 1.178 1.94 0.004 11 4 43 -2.1 9.14 -9.14 1.571 2.1 -0.8 12 5 43 -2.3 10 -105 1.963 1.94 -1.604 13 5 43 -2.1 10.9 -116 2.356 1.485 -2.285 14 5 43 -1.6 11.6 -127 2.749 0.804 -2.74 15 6 43 -0.9 12.1 -128 3.142 3E-16 -2.9 16 6 43 -0 12.3 -129 3.534 -0.804 -2.74 radius 1
10 3.927 -1.485 -2.285 Point # Angle11 4.32 -1.94 -1.604 0 0 47 0 11.2 -1112 4.712 -2.1 -0.8 1 0 47 0.47 11.1 -1113 5.105 -1.94 0.004 2 1 47 0.86 10.9 -1114 5.498 -1.485 0.685 3 1 47 1.12 10.5 -1015 5.89 -0.804 1.14 4 2 47 1.22 10 -1016 6.283 -5E-16 1.3 5 2 47 1.12 9.53 -9.5
radius 2.8 y -0.4 6 2 47 0.86 9.14 -9.1Point # Angle z-position 7 3 47 0.47 8.88 -8.9
0 0 0 2.4 8 3 47 0 8.78 -8.81 0.393 1.072 2.187 9 4 47 -0.5 8.88 -8.92 0.785 1.98 1.58 10 4 47 -0.9 9.14 -9.13 1.178 2.587 0.672 11 4 47 -1.1 9.53 -9.54 1.571 2.8 -0.4 12 5 47 -1.2 10 -105 1.963 2.587 -1.472 13 5 47 -1.1 10.5 -106 2.356 1.98 -2.38 14 5 47 -0.9 10.9 -117 2.749 1.072 -2.987 15 6 47 -0.5 11.1 -118 3.142 3E-16 -3.2 16 6 47 -0 11.2 -119 3.534 -1.072 -2.987 radius 3
10 3.927 -1.98 -2.38 Point # Angle11 4.32 -2.587 -1.472 0 0 47.5 0 13 -1312 4.712 -2.8 -0.4 1 0 47.5 1.15 12.8 -1313 5.105 -2.587 0.672 2 1 47.5 2.12 12.1 -1214 5.498 -1.98 1.58 3 1 47.5 2.77 11.1 -1115 5.89 -1.072 2.187 4 2 47.5 3 10 -1016 6.283 -7E-16 2.4 5 2 47.5 2.77 8.85 -8.9
radius 3.5 y 0 6 2 47.5 2.12 7.88 -7.9Point # Angle z-position 7 3 47.5 1.15 7.23 -7.2
0 0 0 3.5 8 3 47.5 0 7 -71 0.393 1.339 3.234 9 4 47.5 -1.1 7.23 -7.22 0.785 2.475 2.475 10 4 47.5 -2.1 7.88 -7.93 1.178 3.234 1.339 11 4 47.5 -2.8 8.85 -8.94 1.571 3.5 2E-16 12 5 47.5 -3 10 -105 1.963 3.234 -1.339 13 5 47.5 -2.8 11.1 -116 2.356 2.475 -2.475 14 5 47.5 -2.1 12.1 -127 2.749 1.339 -3.234 15 6 47.5 -1.1 12.8 -138 3.142 4E-16 -3.5 16 6 47.5 -0 13 -139 3.534 -1.339 -3.234
10 3.927 -2.475 -2.475 x y z y-top z-top z-bottom11 4.32 -3.234 -1.339 40 0 0 0 0 0 0 012 4.712 -3.5 -6E-16 40 0 0 0.89 0.89 -0.9 0.89 -0.8913 5.105 -3.234 1.339 42 0 0 2.5 2.5 -2.5 2.5 -2.514 5.498 -2.475 2.475 45 0 0 2.5 2.5 -2.5 2.5 -2.515 5.89 -1.339 3.234 49 0 0 0.89 0.89 -0.9 0.89 -0.8916 6.283 -9E-16 3.5 49 0 0 0 0 0 0 0
Drag
total length
diameter
Fineness ratiowetted area
Engines
Engi
ne
Unducted Fan Number of Engine 2
Wetted Area
CenterLine
Fuselage Wing
VolumeWetted Area
Secti
on 3
Jet
Secti
on 2
Nos
eFu
sela
ge
Cana
rd
Tail
Secti
on 1
Win
gYe
hudi
Tail
Ver
tical
Secti
on 0
Secti
on 2
Secti
on 1
30.69430365704012.997922936.27527
Form Factorinterference factor
Number of Engine
Engi
ne
CenterLine
Wetted Area
Flight Conditions Atmosphere
Total Lift Total Moment AeroDynamic Center
-3
-2
-1
00 1
Series1
-4
-2
0-2 0 2
Series1
-4
-2
0
2
-5 0 5Series1
-5
0
5
-5 0 5
Series1
-5
0
5
-10 0 10
Series1
-5
0
5
-10 0 10
Series1
-40
-20
0
20
40
0 10 20 30 40 50
-10
0
10
0 10 20 30 40 50
-5
0
5
10
-30 -20 -10 0 10 20 30
-4
-2
0
2
4
-10 -5 0 5 10
-5
0
5
10
20 30 40 50 60
-20
-10
0
10
20
0 10 20 30 40 50
47 | P a g e
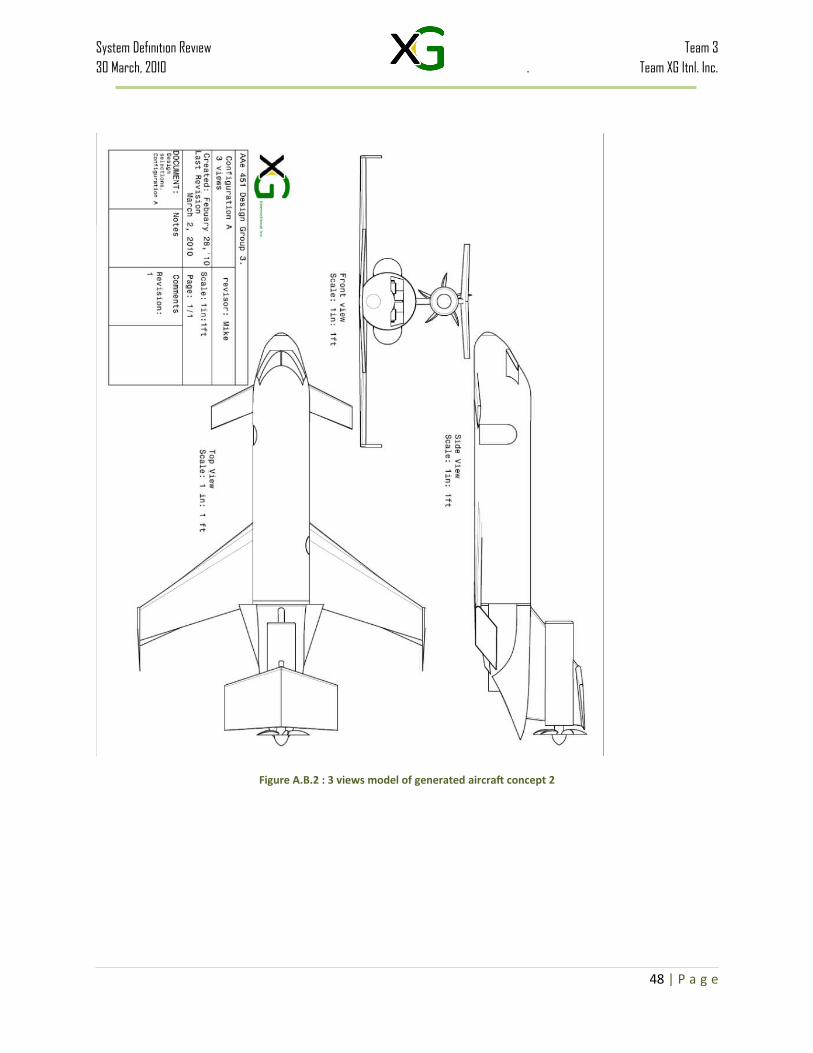
System Definition Review Team 330 March, 2010 . Team XG Itnl. Inc.
Table A.C.3: Constraint diagram
0.0005 sl/ft^3 0.0018 sl/ft^3 rho 0.002 sl/ft^3 rho 0.0023 sl/ft^3 rho 0.002
0.1937 0.7409 alpha 0.8384 alpha 0.9536 alpha 0.8384 Fudge Factor Included
0.9496 0.95 beta 1 alpha_rev 0.4 beta 1 W0/S 97.5 W0/S 92.625M 0.75 V 422 ft/s CL max TO 1.6 beta 1 CL max TO 1.5 TSL/W0 0.3302 TSL/W0 0.3632
V 726.08 ft/s CD0 0.015 g 32.17 ft/s^2 CL max land 1.6 g 32.17 ft/s^2CD0 0.015 AR 7.8 s_to 4000 ft g 32.17 ft/s^2 N 2AR 7.8 e 0.8 mu 0.3 CGR 2.4 %e 0.8 q 156.36 lb/ft^2 s_l 2600 ft CD0 0.0033K 0.051 n 2 AR 7.8CDC 0.002 dh/dt 0 ft/s e_TO 0.6q 120.99 lb/ft^2 g 32.17 ft/s^2 D CD0 0.0033n 1 dV/dt 0 ft/s^2dh/dt 1.6667 ft/sg 32.17 ft/s^2dV/dt 0 ft/s^2
W0/S TSL/W0 W0/S TSL/W0 CL checkW0/S TSL/W0 W0/S TSL/W0 W0/S TSL/W0 y50 0.3218 50 0.1428 0.6076 50 0.1764 50 -0.213 50 0.3111 5000 f t 5000 f t hot day (DT = +15)51 0.3196 51 0.1431 0.6197 51 0.1799 51 -0.202 51 0.3111 rho = 0.002 sl/f t3 0.002 sl/f t352 0.3176 52 0.1435 0.6319 52 0.1834 52 -0.19 52 0.3111 p = 1760.9 lb/f t2 1760.9 lb/f t253 0.3157 53 0.144 0.644 53 0.187 53 -0.179 53 0.3111 R = 1718 ft-lb/sl-ºR 1718 ft-lb/sl-ºR54 0.3139 54 0.1445 0.6562 54 0.1905 54 -0.167 54 0.3111 T = 500.86 ºR 515.86 ºR55 0.3123 55 0.145 0.6683 55 0.194 55 -0.156 55 0.3111
Average
W0/S & TSL/W0 Value
Top of climb (1g steady, level f light, M = 0.80 @ h=45K, service ceiling)
Subsonic 2g manuever, 250kts @ h =10K
Takeoff ground roll 4000 ft @ h = 5K, +15° hot
day
Landing ground roll 2500 ft @ h = 5K, +15° hot
day
Second segment climb gradient above h = 5K,
+15° hot day
0
0.1
0.2
0.3
0.4
0.5
0.6
0.7
0.8
0.9
1
50 70 90 110 130 150
Top of climb (1g steady,level flight, M = 0.80 @h=45K, service ceiling)Subsonic 2g manuever,250kts @ h =10K
Takeoff ground roll 4000ft @ h = 5K, +15° hot day
Landing ground roll 2500ft @ h = 5K, +15° hot day
48 | P a g e
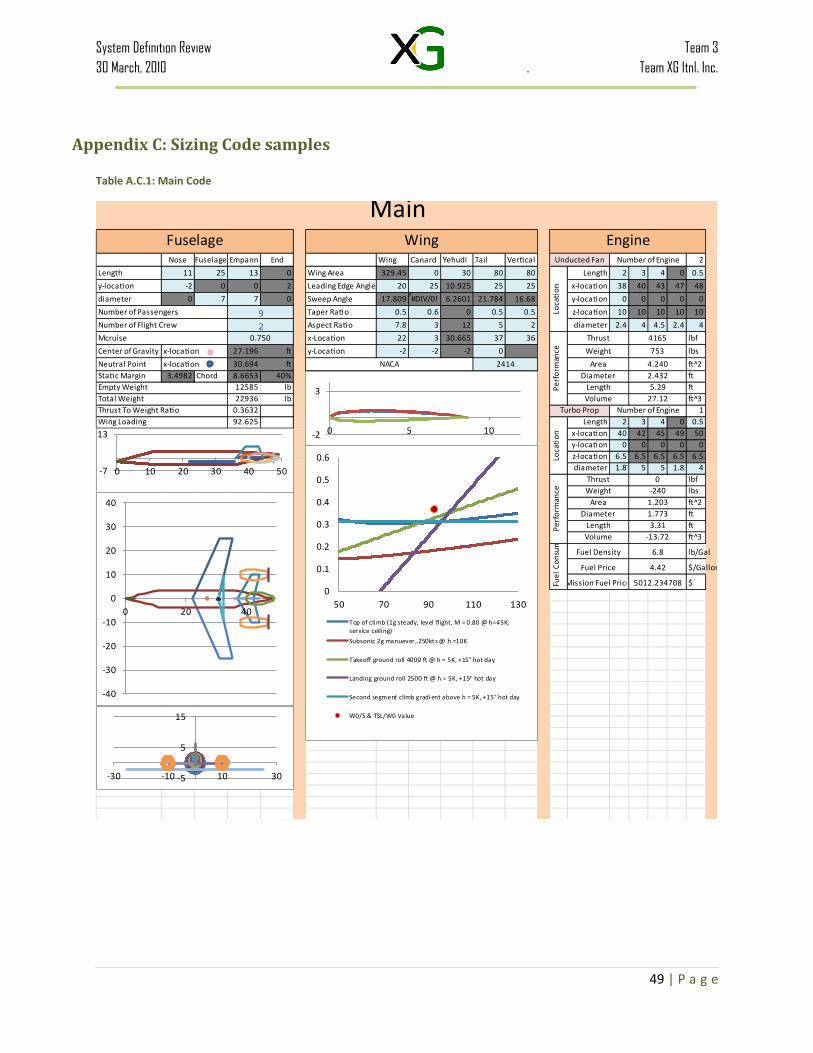
System Definition Review Team 330 March, 2010 . Team XG Itnl. Inc.
Table A.C.4: Weight sizing code
49 | P a g e
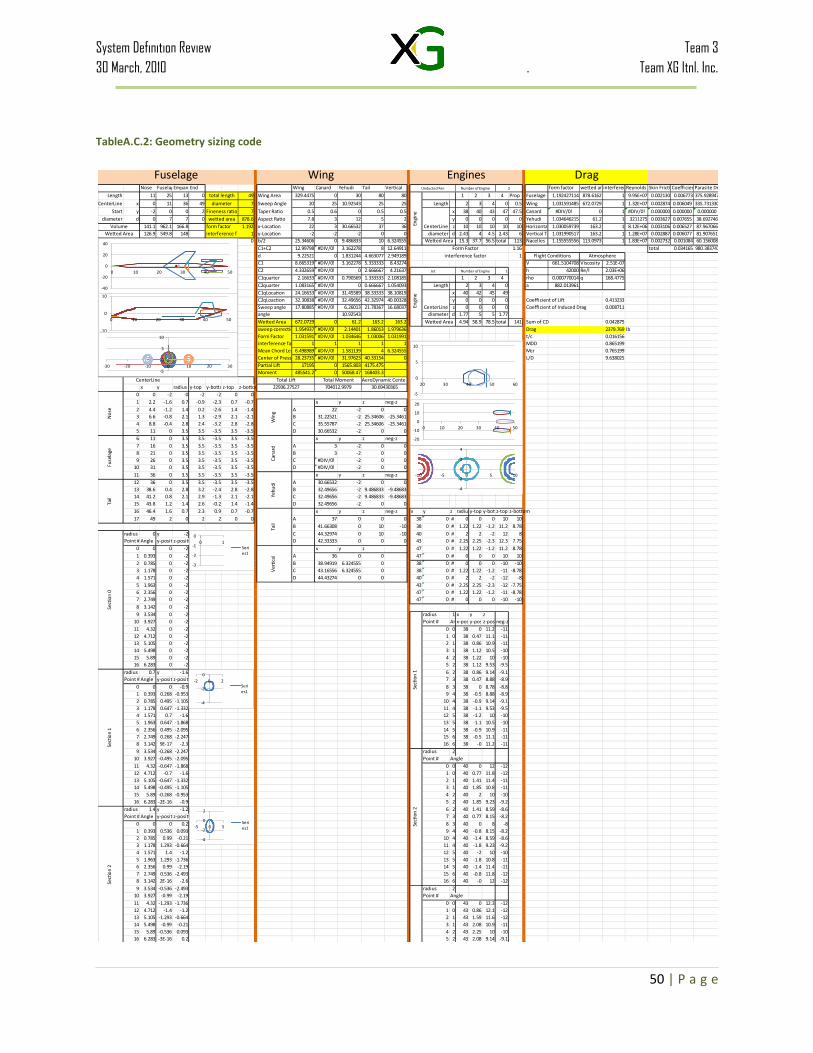
System Definition Review Team 330 March, 2010 . Team XG Itnl. Inc.
W0 guess 30515.07 lb Name # X- Weight Momen Constant Value Option W0 guess 22936.28number of passengers 9 Wwing 1 28.237 900.23 25420 A 7.8 aspect ratio W0 design 22936.28number of flight crew 2 Whorizo 1 37 308.84 11427 Bh 20 horizontal tail span Wf design 7711.13We/W0 0.5712616 empty weight fraction Wvertical 1 36 276.64 9959.1 Bw 50.69211 wingspan We/W0 0.750627583Wpayload 2160 lb Wfuselag 1 23.5 3533.6 83040 D 1.5 fuselage structural depth We 12585.14493Wcrew 480 lb Wmain 1 36 798.17 28734 De 2.432022 engine diameter Thrust 8330.800657W0 design 30515.07 lb Wnose 1 11 214.15 2355.7 Fw 7 fuselage width at horizontal tail intersectionft Wing Area 247.6251039We design 17432.09 lb Wnacelle 1 37 903.67 33436 Ht 0 horizontal tail height above fuselageft Wwing 900.2319347Wf design 10442.98 lb Wengine 1 43 40.4 1737.2 Ht/Hv 0 0 for conventional tail, 1 for "T" tailWhorizontaltail 308.8398651design mission range 3700 nmi Wstarter( 1 43 84.658 3640.3 Hv 3.524555 vertical tail height above fuselage Wverticaltail 276.6419677alternate airport range200 nmi Wfuel 1 28.237 283.58 8007.5 Iy 2500 yawing moment of inertia lb-ft^2 Wfuselage 3533.635881reserve loiter 0.6 hr Wflight 1 11 456.01 5016.2 Kcb 1 2.25 for cross-beam gear, 1 otherwiseWmain landing gear 798.1675227AR 7.8 Wapu 1 43 198 8514 Kdoor 1 1 for no cargo door, 1.06 for on side cargo door, 1.12 if twoside cargo door, 1.12 for aft clamshell door, 1.25 for two side cargo doors and aft clamshellWnose landing gear 214.1505036T/W0 0.3632151 Winstru 1 11 103.89 1142.8 Kdw 1 0.768 for delta wing 1 otherwise Wnacelle group 903.6658516W0/S 92.625 lb/ft2 Whydrau 1 28.237 99.704 2815.4 Kdwf 1 0.774 for deltawing aircraft1 otherwise Wengine controls 40.4Mmax 0.770 Welectric 1 28.237 575.39 16248 Kh 0.12 0.05 for low subsonic flight0.11 for midium subsonic flight, 0.12 for high subsonic flight, 0.013 for light planeWstarter(pneumatic) 84.65812091subsonic (L/D)max 18.02 Wavionic 1 11 1079.2 11872 KLg 1.12 1.12 for fuselage mounted1 otherwise Wfuel system 283.5794281subsonic (L/D)cruise15.6774 Wfurnish 2 28.237 259.86 7337.7 Kmc 1.45 1.45 if mission completiong required after failure1 otherwise Wflight controls 456.0146938subsonic (L/D)loiter 18.02 Waircond 2 37 209.88 7765.5 Kmp 1 1.126 for kneeling gear 1 otherwise Wapu installed 198SFCcruise 0.5 1/hr Wanti- 2 28.237 45.873 1295.3 Kng 1.017 1.017 for pylon mounted nacelle1 otherwise Winstruments 103.8893548Mcruise 0.750 Whandli 2 28.237 6.8809 194.3 Knp 1 1.15 for kneeling gear 1 otherwise Whydraulics 99.7043574Vcruise @ 42,000 ft429.88455 kts Wengine 1 43 1506.4 64777 Kp 1 1.4 for engine with propeller1 otherwise Welectrical 575.3939703SFCloiter 0.4 1/hr Wcargo 2 28.237 700 19766 Kr 1 1.133 if reciprocating engine1 otherwise Wavionics 1079.238856design mission Avionics 1 20 234 4680 Krht 1.047 1.047 for rolling horizontal tail1 otherwise Wfurnishing(does not include cargo handling gear or seats)259.8590278W1/W0 0.97 takeoff Seat1 1 16.7 34 567.8 Ktp 0.793 0.793 if turboprop 1 otherwise Wairconditioning 209.8772832W2/W1 0.980125 climb Seat2 1 17.7 34 601.8 Ktpg 1 0.826 for tripod gear 1 otherwise Wanti-ice 45.87255051W3/W2 0.75995 cruise Seat3 1 25.46 34 865.64 Ktr 1.18 1.18 for jet with thrust reversals1 otherwise Whandling gear 6.880882577W4/W3 0.995 land Seat4 1 30.335 34 1031.4 Kuht 1 1.143 for unit(all-moving) horizontal tail1 otherwise Wengine 1506W5/W4 0.97 missed approach (TO) Seat5 1 15.63 34 531.42 Kvg 1 1.62 for variable geometry1 otherwise Wcargo handling gear and seats 700W6/W5 0.980125 climb Seat6 1 30.335 34 1031.4 Kvs 1 1.19 for variable sweep wing1 otherwiseW7/W6 0.98527 divert to alternate Sofa 1 21.65 34 736.1 Kvsh 1 1.425 for variable sweep wing1 otherwiseW8/W7 0.98677 hold Laboratory 1 33.9 34 1152.6 KwsW9/W8 0.995 land Gally 1 0 34 0 Ky 4.5 aircraft pitching radius of gyration(~=0.3Lt)W9/W0 0.66116 Environmental Control1 20 30 600 Kz 15 aircraft yawing radius of gyration(~=Lt)Wf/W0 0.34222 fuel weight fraction APU 1 43 90 3870 L 46 Fuselage structural length(excludes radome cowling, tail cap)Thrust 11083.535 Pilot 2 20 234 4680 La 36 Electrical routing distance(generators to avionics to cockpit)S 329.44749 Passanger1 1 16.7 195 3256.5 Ld 2 Duct Length
Passanger2 1 17.7 195 3451.5 Lec 38 length from engine front to cockpitPassanger3 1 25.46 195 4964.7 Lf 49 total fuselage lengthPassanger4 1 30.335 195 5915.3 Lm 60 extended length of main landing gearinPassanger5 1 15.63 195 3047.9 Ln 60 extended nose gear lengthinPassanger6 1 30.335 195 5915.3 Lt 15 tail length; wing quarterPassanger7 1 21.65 195 4221.8 Ltp 1 length of tail pipePassanger8 1 21.65 195 4221.8 M 0.750 mach numberPassanger9 1 21.65 195 4221.8 Nc 2 number of crewLuggage 2 28.237 234 6607.5 Nci 2 number of crew equivalents
Total 0 27.196 15468 420673 Nen 2 number of enginesNf 5 number of functions performed by controls(4~7)Ngen 2 number of generators(typically Nen)NLt 9 nacelle length ftNl 3 ultimate landing load factor;=Ngear*1.5Nm 1 number of mechanical functions(typically 0~2)Nmss 2 number of main gear shock strutsNmw 2 number of main wheelsNnw 1 number of nose wheelsNp 11 number of personnel onboard(crew+passengers)Nt 5 number of fuel tanksNu 7 number of hydraulic utiliity functions(typically 5~15)Nw 4.5 nacelle width ftNz 5 ultimate load factor ;=1.5*limit load factorRkva 50 system electrical rating kV*A (Typically 40~50 for transports)Scs 70 total area of control surfacesft^2Scsw 78 control surface area ft^2Se 20 elevator area ft^2Sf 878.6162 fuselage wetted area ft^2Sht 80 horizontal tail area ft^2Sn 113.0973 nacelle wetted area ft^2Svt 80 vertical tail area ft^2Sw 329.4475 trapazoidal wing area ft^2SFC 0.5 Engine Specific fuel consumption--maximum thrustVi 2180 integral tanks volume galVp 0 self-sealing tanks volume galVpr 935 volume of pressurized section ft^3Vt 2180 total fuel volume galWc 4000 maximum cargo weight lbWdg 22936.28 flight design gross weight lbWec 1836 weight of engine and contentslbWen 1364 engine weight, each lbWl 25000 landing design gross weightlbWuav 697.2836 uninstalled avionics weightlb (typically 800~1400Lamda 17.80885 wing sweep at 25% MAClamda 0.5 taper ratiot/c 0.5Fw/Bh 0.138089Lamdaht 21.78367 horizontal tail wing sweep Ah 80 area of horizontal tailLamdavt 16.68037 Vertical tail wing sweepAv 80 area of vertical tail
0.5L/D 30.66667Vstall 88.636
Payl
oad
Constants Detailed Weight PredictionCenter of GravityInitial Weight Prediction
Inne
r Str
uctu
reO
uter
Str
uctu
re
Table A.C.5: Airfoil Sizing Code
50 | P a g e
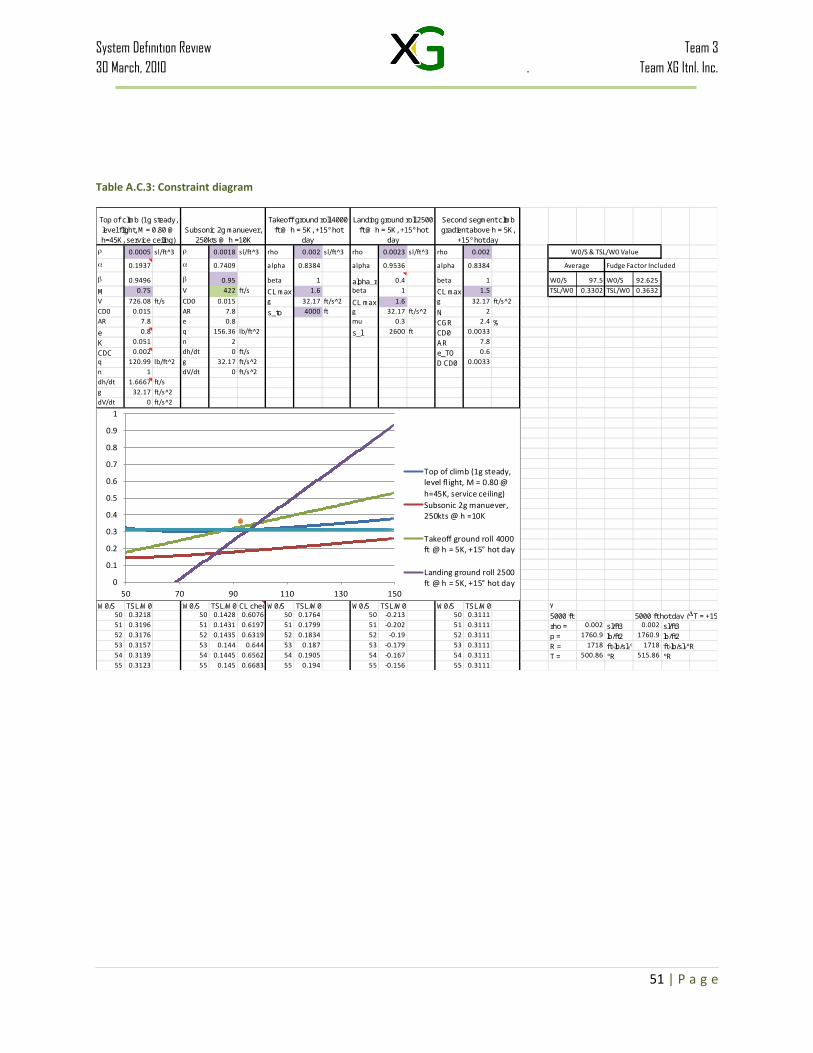
System Definition Review Team 330 March, 2010 . Team XG Itnl. Inc.
24140.020.400.14
Section x y yc xupper yupper xlower ylower theta0 0 0 0 0 0 0 0 0.0934767811 0.43326593 0.35936232 0.040618681 0.40416365 0.39880066 0.46236822 -0.3175633 0.0810719132 0.86653187 0.47340648 0.075821538 0.83406182 0.54811317 0.89900192 -0.3964701 0.0686419893 1.2997978 0.54037103 0.105608571 1.2694499 0.64512674 1.3301457 -0.4339096 0.0561907864 1.73306373 0.58003911 0.12997978 1.70771128 0.70946458 1.75841619 -0.449505 0.0437221195 2.16632967 0.60063216 0.148935165 2.14756907 0.74927427 2.18509027 -0.4514039 0.0312398336 2.5995956 0.60674686 0.162474725 2.5882211 0.76911496 2.61097011 -0.4441655 0.0187478037 3.03286154 0.60137785 0.170598461 3.029103 0.77196456 3.03662007 -0.4307676 0.0062499198 3.46612747 0.58665761 0.173306373 3.46775707 0.75996172 3.46449787 -0.413349 -0.0027777719 3.8993934 0.56418672 0.172102857 3.9040948 0.73626999 3.89469201 -0.3920643 -0.00833314
10 4.33265934 0.53520151 0.168492308 4.34009197 0.70364221 4.3252267 -0.3666576 -0.01388799611 4.76592527 0.50066758 0.162474725 4.77565863 0.66304768 4.75619191 -0.3380982 -0.01944199412 5.1991912 0.46133555 0.15405011 5.21072099 0.61524156 5.18766142 -0.3071413 -0.02499479413 5.63245714 0.41777629 0.143218461 5.64521657 0.56079986 5.61969771 -0.2743629 -0.03054605214 6.06572307 0.37040406 0.12997978 6.07909006 0.50014257 6.05235608 -0.240183 -0.03609542715 6.49898901 0.31949237 0.114334066 6.51228965 0.43354946 6.48568836 -0.2048813 -0.04164257916 6.93225494 0.26518512 0.096281319 6.94476363 0.36117126 6.91974625 -0.1686086 -0.04718716817 7.36552087 0.20750461 0.075821538 7.37645728 0.28303775 7.35458446 -0.1313947 -0.05272885518 7.79878681 0.14635753 0.052954725 7.80730984 0.19906388 7.79026377 -0.0931544 -0.05826730319 8.23205274 0.08153941 0.027680879 8.2372516 0.10905438 8.22685388 -0.0536926 -0.06380217420 8.66531867 0.01273802 0 8.66531867 0.01273802 8.66531867 -0.012738 0
c m p
0.14 8.66531867 0.02 0.40
NACA numberm (maximum chamber)
p (location of maximum chamber)maximum thickness
t
-3
-1
1
3
5
7
0 1 2 3 4 5 6 7 8 9 10
51 | P a g e
System Definition Review Team 330 March, 2010 . Team XG Itnl. Inc.
Table A.C.6: Mission Detail diagram
52 | P a g e
Misson
InitialTaxi
TakeoffClim
bCruise
LoiterAttept to Land
Climb
DivertLoiter
Land
Distance0
0.7575762
303449.803
00.94697
16200
00.492424
Altitude0
01000
4000042000
20002000
1000020000
200002000
Acculative Distance00.757576
2.75757632.75758
3482.5613482.561
3483.5083499.508
3699.5083699.508
3700
Distance4000
Distance2
Distance30
Distance3449.803
Distance0
Distance5000
Distance16
Distance200
Distance0
Distance2600
Runway 11
23
41
h0
h1000
h40000
h42000
h2000
h2000
h10000
h20000
h20000
h2000
x100
0-300
-180100
R1716
R1716
R1716
R1716
R1716
R1716
R1716
R1716
R1716
R1716
y0
-50000
30000
gamm
a1.4
gamm
a1.4
gamm
a1.4
gamm
a1.4
gamm
a1.4
gamm
a1.4
gamm
a1.4
gamm
a1.4
gamm
a1.4
gamm
a1.4
Runway 21
23
41
T0 518.69
T0 518.69
T0 518.69
T0 518.69
T0 518.69
T0 518.69
T0 518.69
T0 518.69
T0 518.69
T0 518.69
x3600
37004000
38803600
P02116.2
P02116.2
P02116.2
P02116.2
P02116.2
P02116.2
P02116.2
P02116.2
P02116.2
P02116.2
y2000
-30002000
50002000
rho00.002377
rho00.002377
rho00.002377
rho00.002377
rho00.002377
rho00.002377
rho00.002377
rho00.002377
rho00.002377
rho00.002377
Th_trop-0.00356
Th_trop-0.00356
Th_trop-0.00356
Th_trop-0.00356
Th_trop-0.00356
Th_trop-0.00356
Th_trop-0.00356
Th_trop-0.00356
Th_trop-0.00356
Th_trop-0.00356
7711.137479.8
7367.65637.8
5575.65408.3
Th_stra0.00164
Th_stra0.00164
Th_stra0.00164
Th_stra0.00164
Th_stra0.00164
Th_stra0.00164
Th_stra0.00164
Th_stra0.00164
Th_stra0.00164
Th_stra0.00164
00.7575758
2.757575832.757576
3482.56063482.5606
h_trop36152
h_trop36152
h_trop36152
h_trop36152
h_trop36152
h_trop36152
h_trop36152
h_trop36152
h_trop36152
h_trop36152
h_stra82346
h_stra82346
h_stra82346
h_stra82346
h_stra82346
h_stra82346
h_stra82346
h_stra82346
h_stra82346
h_stra82346
g32.2
g32.2
g32.2
g32.2
g32.2
g32.2
g32.2
g32.2
g32.2
g32.2
T1389.9889
T1389.9889
T1389.9889
T1389.9889
T1389.9889
T1389.9889
T1389.9889
T1389.9889
T1389.9889
T1389.9889
P1470.674
P1470.674
P1470.674
P1470.674
P1470.674
P1470.674
P1470.674
P1470.674
P1470.674
P1470.674
P250.98398
P250.98398
P250.98398
P250.98398
P250.98398
P250.98398
P250.98398
P250.98398
P250.98398
P250.98398
Drag Coeff.form factor
wetted areainterference factor
T518.69
T515.13
T320.5414
T323.8214
T511.57
T511.57
T483.09
T447.49
T447.49
T511.57
Fuselage1.1924271
878.616241
P2116.2
P2040.756
P480.74
P427.8793
P1967.507
P1967.507
P1454.758
P971.7615
P971.7615
P1967.507
Wing
1.0315915672.07289
1
rho0.002378
rho0.002309
rho0.000874
rho0.00077
rho0.002241
rho0.002241
rho0.001755
rho0.001265
rho0.001265
rho0.002241
Nacelles1.1555556
113.097341
a1116.289
a1112.451
a877.5356
a882.014
a1108.601
a1108.601
a1077.3
a1036.846
a1036.846
a1108.601
Ft to Miles
0.757576M
iles2
Miles
30M
iles3449.803
Miles
0Ft to M
iles0.94697
Miles
16M
iles200
Miles
0Ft to M
iles0.492424
Hour
Mach Num
ber
Velocity
Flgith Time
400035.83302
1056023.73137
158400257.865
1821496027535.41
00
50005.637737
84480156.8365
10560001273.091
00
26000.028924
ClW
f/W0
Fuel FractionW1/W
00.97
W2/W
10.985
W3/W
20.765221
W4/W
30.988963
W5/W
40.97
W6/W
50.985
W7/W
60.978473
W8/W
70.993363
W9/W
80.995
W9/W
00.682832
0.336198
Weight of Fuel
Total Weight
Climb
DivertLoiter
Land
Mission Detail
TaxiTake off
Climb
CruiseLoiter
Attempt to Land
0.80.4
0.10.4
0.70.75
0.80.8
0.50.3
1.02292E-05
89890829.4769344
829.4769344
0.2127602570.212760257
538.6500292
0.363830727
886.8806524
0.105083365
886.8806524
0.105083365
0.50.8
661.5104708
0.549776799
614.2749304
0.561725127
444.980595
0.4052463
111.6288877
6.252784639
7479.796401
22704.9
7367.599455
22592.7
5637.844854
20863.0
5575.617621
20800.8
5408.349092
20633.5
5152.057259
20377.2
3517.989858
18743.1
5327.223856
20552.4
5212.543394
20437.7
5177.946994
20403.1
-20000 0
20000
40000
60000-5000
5001000
15002000
25003000
35004000
02000400060008000
10000-5000
5001000
15002000
25003000
35004000
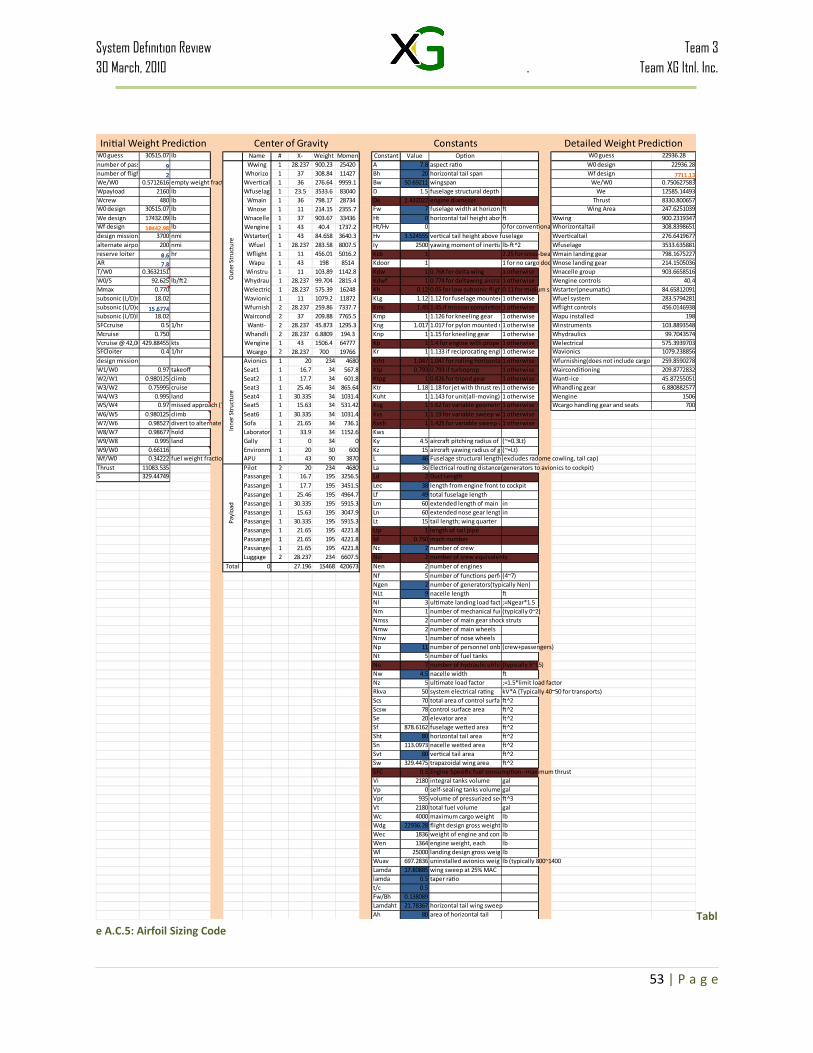
System Definition Review Team 330 March, 2010 . Team XG Itnl. Inc.
Appendix E: Endnotes
53 | P a g e
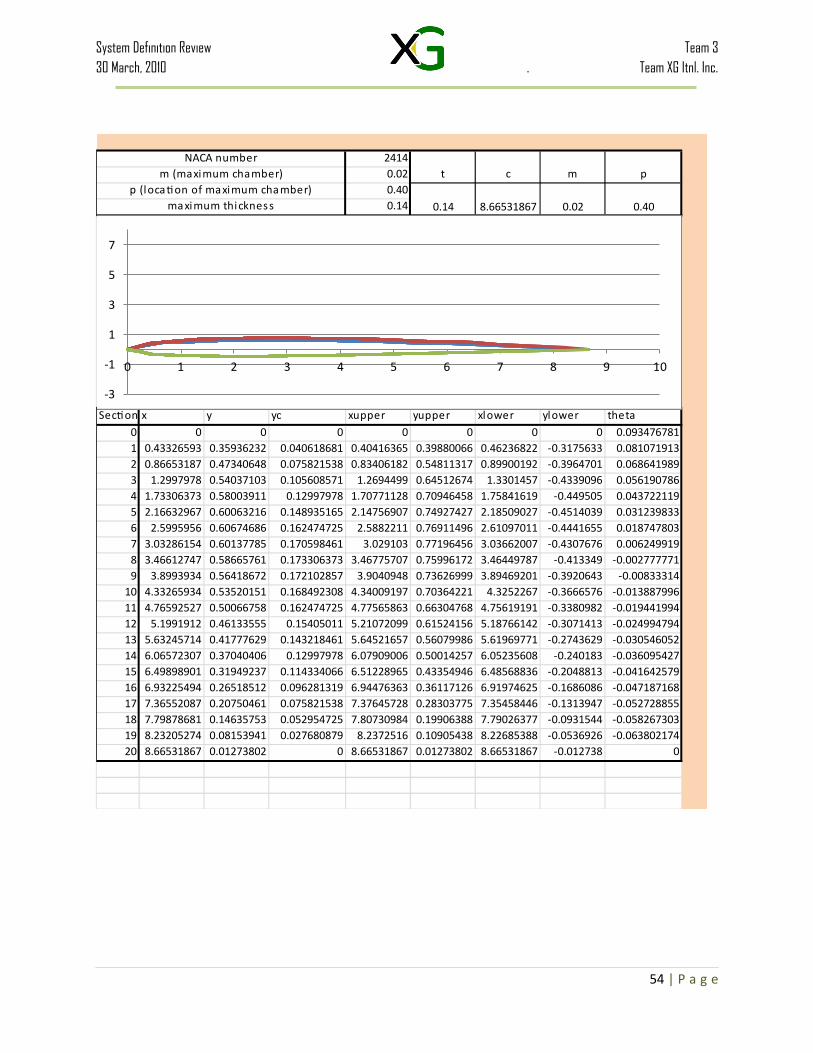
iI Robb Report, April 1, 2010ii Aerospace web organization. “Propfan Engines”,iiiFlight International, “Whatever Happened to Turbofans?”ivNASA N+2 Fix wing aircraft guidelinesv FAA journalvi Clausing, Selecting a Winning Concept.vii Celocity Builder “What the Heck is a Canard?”viiiJane’s “All the World’s Aircraft”ix Reason why the max speed of the aircraft thoruhg a turbo pro cannot exceed Mac 7.5x Bombardiers website that give the values and dimensions of their aircraft.xiWikipedia media images.xii Jane’s “All the World’s Aircraft”