Embed Size (px)
Citation preview

EFFECT OF RAP ON MIXTURE PROPERTIES
Rebecca McDaniel
North Central Superpave Center
Tennessee Quality Asphalt Initiative
Nashville
January 28, 2010

CONVENTIONAL WISDOM
RAP contains old, hardened binder that will stiffen the mix
This will help reduce rutting
May increase cracking tendencies
There is research and experience to support conventional wisdom

POSSIBLE EFFECTS OF RAP BINDER
RAP aggregate with oxidized binder film
POSSIBLE EFFECTS OF RAP BINDER
RAP aggregate with oxidized binder filmplus virgin binder film

POSSIBLE EFFECTS OF RAP BINDER
If RAP and virgin binders do not blend, effective binder properties will be those of the virgin binder only.

POSSIBLE EFFECTS OF RAP BINDER
If RAP and virgin binders blend or merge, effective binder properties will be determined by the amount of blending that occurs.

IMPACTS OF BLENDING ON PERFORMANCE
If we assume there is blending and there isn’t, virgin binder grade may be softer than desired.
Increased chance for rutting
Decreased chance for cracking
If we assume there is no blending and there is, effective binder grade may be stiffer than desired.
Decreased chance for rutting
Increased chance for cracking

RISKS OF FALSE ASSUMPTIONS
Assuming there is blending may be more conservative. Shouldn’t rely on binder to control rutting
Increased cracking can have performance and economic impacts
Current guidelines are a starting point, but not the definitive answer

CURRENT AASHTO TIERS
Up to 15% RAP, no change in binder grade.
16-25% RAP, lower binder grade by one increment.
More than 25%, create blending charts. Assumes linear blending
Extract, recover and test RAP binder
High, low and intermediate temperatures

AGGREGATE EFFECTS ON MIX
RAP Aggregate also has an effect, of course
Fineness of some RAPs can limit use
Fractionating can help
RAP aggregate should meet virgin shape requirements
RAP aggregate effects on friction?
Mixes with and without RAP should be held to same standards.

0
0*
E
DYNAMIC MODULUS TEST
Stress
Strain
Time
• Rutting
• Fatigue Cracking

9.5 MM WITH PG 64-22, BATCH PLANT
1.0E+00
1.0E+01
1.0E+02
1.0E+03
1.0E+04
1.0E+05
1.0E+06
1.0E-04 1.0E-02 1.0E+00 1.0E+02 1.0E+04 1.0E+06 1.0E+08
Reduced Frequency, rad/sec
Bin
der
G*,
kP
a
From Mix
Recovered Binder
Advanced Asphalt Technologies, LLC
“Engineering Services for the Asphalt Industry”

9.5 MM WITH PG 64-22 + 5% RAS, BATCH PLANT
1.0E+00
1.0E+01
1.0E+02
1.0E+03
1.0E+04
1.0E+05
1.0E+06
1.0E-04 1.0E-02 1.0E+00 1.0E+02 1.0E+04 1.0E+06 1.0E+08
Reduced Frequency, rad/sec
Bin
der
G*,
kP
a
From Mix
Recovered Binder
Advanced Asphalt Technologies, LLC
“Engineering Services for the Asphalt Industry”

9.5 MM WITH PG 64-22 + 35 % FRAP, DOUBLE BARREL
1.0E+00
1.0E+01
1.0E+02
1.0E+03
1.0E+04
1.0E+05
1.0E+06
1.0E-04 1.0E-02 1.0E+00 1.0E+02 1.0E+04 1.0E+06 1.0E+08
Reduced Frequency, rad/sec
Bin
der
G*,
kP
a
PG 64-22 With 35 % RAP
From Mix Modulus
PG 64-22 With 35% RAP
From Recovered Binder
Advanced Asphalt Technologies, LLC
“Engineering Services for the Asphalt Industry”

BONAQUIST APPROACH
Advantage – allows assessment of production variables
RAP processing
Production rates and temperatures
Additives
Storage time, etc.
More information Hot Mix Asphalt Technology, September/October 2007.
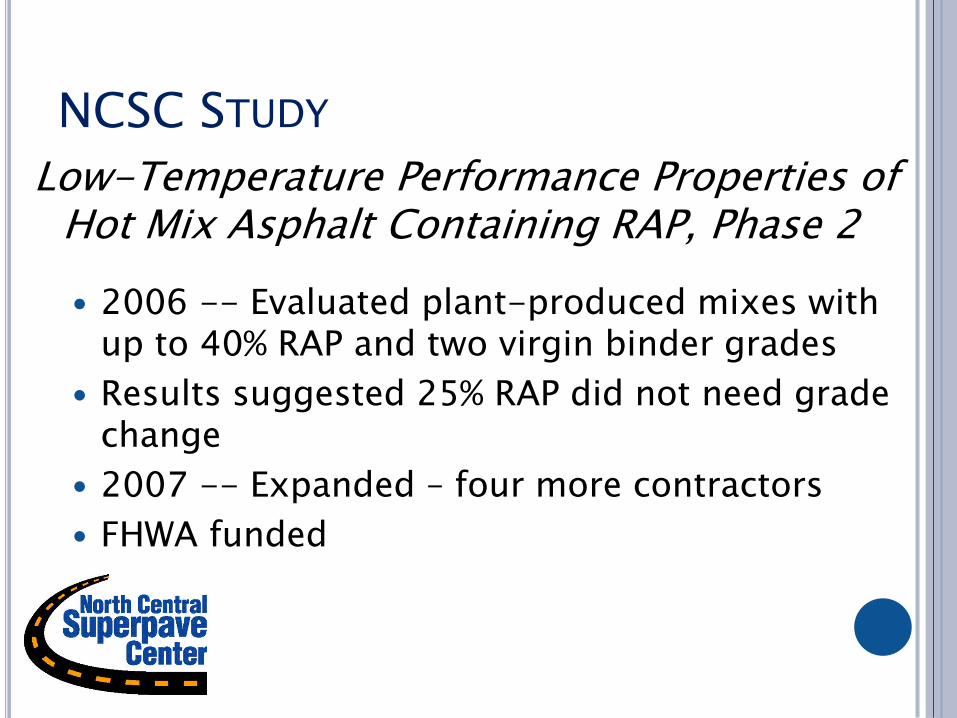
Low-Temperature Performance Properties of Hot Mix Asphalt Containing RAP, Phase 2
2006 -- Evaluated plant-produced mixes with up to 40% RAP and two virgin binder grades
Results suggested 25% RAP did not need grade change
2007 -- Expanded – four more contractors
FHWA funded
NCSC STUDY

EXPERIMENTAL DESIGN
Reclaimed Asphalt Pavement
Binder Grade 0% 15% 25% 40%
PG 58-28 X X
PG 64-22 X X X X
X = Replicated in 2006

100
1000
10000
100000
1.E-04 1.E-03 1.E-02 1.E-01 1.E+00 1.E+01 1.E+02 1.E+03 1.E+04 1.E+05 1.E+06 1.E+07
Lo
g |E
*|,
MP
a
Log Reduced Frequency, Hz
PG64-22
MixA (0%0 RAP)
MixB (15% RAP)
MixC (25% RAP)
MixD (40% RAP)
COMPARISON OF RAP CONTENTS

DRAFT, UNFILTERED DATA, MIX 1
0
5000
10000
15000
20000
25000
30000
35000
A (0%) B (15%) C (25%) D (40%) E (25%) F (40%)
Co
mp
lex D
yn
am
ic M
od
ulu
s (
MP
a)
Mix 1
4 C 21 C 37.8 C 54.4 C

ONE EXAMPLE - MIX |E*|
100
1000
10000
100000
1.E-04 1.E-03 1.E-02 1.E-01 1.E+00 1.E+01 1.E+02 1.E+03 1.E+04 1.E+05 1.E+06 1.E+07
Lo
g |E
*|,
MP
a
Log Reduced Frequency, Hz
Control versus PG58-28
MixA (0% RAP)
MixE (25% RAP)
MixF (40% RAP)

ONE EXAMPLE - MIX |E*|
100
1000
10000
100000
1.E-03 1.E-02 1.E-01 1.E+00 1.E+01 1.E+02 1.E+03 1.E+04 1.E+05 1.E+06 1.E+07
Lo
g |E
*|,
MP
a
Log Reduced Frequency, Hz
PG64-22 versus PG58-28
MixC (25% RAP)
MixE (25% RAP)
MixD (40% RAP)
MixF (40% RAP)

IDT STRENGTH EXAMPLE 1
-28
-22
-16
-10
2000
2500
3000
3500
JH-A JH-B JH-C JH-D JH-E JH-F
Pvm
t. Cra
ckin
g T
emp
eratu
re, C
Str
ength
, k
Pa
Mixes
Strength
Temperature

IDT STIFFNESS EXAMPLE 2
-22
-16
-10
20
30
40
EB-A EB-B EB-C EB-D EB-E EB-F
Pvm
t. Cra
ckin
g T
emp
eratu
re, C
Sti
ffn
ess,
GP
a
Mixes
Stiffness
Temperature

BASED ON THIS RESEARCH
And testing RAP sources from across the state
INDOT increased RAP contents to:
25% with no change in grade
40% with a grade change
Spec change has been adopted

BUT THAT IS JUST LAB DATA
How do these mixes perform in the real world?

26
Performance Studies of Asphalt Pavements with Greater than 25% RAP
Randy C. West, NCAT
October 7, 2009

27
A Performance Comparison of RAP vs. Virgin Mixes
• LTPP SPS-5 pavement sections
• 18 U.S. states and Canadian provinces
• At least 30% RAP used in recycled mixes
• Projects range in age from 6 to 17 yrs

28
LTPP SPS-5: RAP vs. Virgin
• Four comparison pairs per project (location)– 2” overlay, no mill and no mill
– 5” overlay, no mill and no mill
• Five performance measurements (annual)– Rutting, mm
– IRI, m/km
– Fatigue cracking, m2
– Transverse cracking, # per section
– Longitudinal cracking, m
• 340 comparisons: graphed, tabulated differences, statistical analyses

29
SPS-5 Project Locations

General Performance
30
Distress Parameter Threshold RAP Sections Virgin Sections
IRI 2.0 m/km 86% 89%
Rutting 10 mm 71% 78%
Fatigue Cracking 25% of WP area 60% 72%
Longtnl. Cracking 25% of section length 79% 86%
Transverse Cracking 20 cracks per section 47% 64%
Block Cracking 10% of section area 89% 94%
Raveling 10% of section area 75% 69%
Percentage of Sections Below General Pavement Performance Thresholds

Summary of Statistical Analyses
31
DistressParameter
Virgin Performed Better than RAP
RAP Performed Better than Virgin
Insignificant Difference Between RAP and Virgin
RAP Performed Equal to or Better Than Virgin
IRI 42 39 19 58
Rutting 33 29 38 67
Fatigue Cracking 29 10 61 71
Longtnl. Cracking 15 10 75 85
Transverse Cracking 32 15 53 68
Block Cracking 3 1 96 97
Raveling 7 15 78 93
>
>

Possible Causes of Higher Occurrence of Fatigue Cracking
in RAP Mixes
• Lower effective binder content
• Binder is more brittle
• Lower in-place density
• Higher dust contents
32

Possible Causes of More Fatigue Cracking in RAP Sections
State/Province # Pairs: Rec.>Vir.
Softer Vir. Binder in Rec. Mix?
Asphalt Content P200
Vir. Rec. Vir. Rec.
Alabama 2 Y 4.8 5.0 4.0 5.1
California 2 N 5.3 3.8 4.3 6.2
Mississippi 3 N 5.9 5.7 5 5
Montana 4 Y 4.8 3.7 5 7.8
New Jersey 2 Y 4.8 4.8 n.a. n.a.
Alberta 4 Y 5.4 5.4 8.6 10.5
Manitoba 2 N 5.9 5.9 5 6
33
√
√ √
√ √
√
√

CONCLUSIONSBased on the long-term performance of a large number of projects across North America…
• Pavements using ≥ 30% RAP perform equal or better than virgin pavements in most cases
• Transverse and fatigue cracking were observed more often in some pavements with RAP compared to pavements with all virgin materials
• Differences in cracking performance for several locations may have been due to lower asphalt contents and/or higher dust contents

OTHER WORK
NCHRP 9-46, Improved Mix Design, Evaluation and Materials Management of High RAP Content HMA (NCAT) -completion 2010
FHWA Funded, Development of High RAP Content Mix Guidelines and Informational Documents (NCAT/ NCSC/UNH) –completion 2010
FHWA HMA Recycling ETG – ongoing
Other state studies ongoing
All will offer more guidance.

HIGHER RAP CONTENTS
Can work – can perform – if properly designed, produced and constructed
But, need attention to detail
Some precautions are needed
Many of these are the same as for aggregate best practices

SOME KEYS TO SUCCESS
Processing the RAP
Stockpiling the RAP
Control during production

In GOK Pile
After
Processing

PROCESSING RAP
Mixed RAP can be variable
Crushing/Screening to break up clumps
Processing can improve uniformity
Uniformity essential to meet specifications

FRACTIONATING RAP
Can improve uniformity (remixes)
Allows use of different sizes to meet mix volumetrics
Allows better control of gradation (and binder content)

STOCKPILING PRACTICES
Avoid segregation
Avoid contamination
Reduce stockpile moisture

REDUCE STOCKPILE MOISTURE
Reduce fuel consumption and drying costs by keeping your materials dry
Lower moisture leads to increased production capacity
Lower maintenance and fuel costs for loaders
Lower paving costs

MORE INFO:
Rebecca S. McDaniel
Technical Director
North Central Superpave Center
765/463-2317 ext. 226
https://engineering.purdue.edu/NCSC/