Embed Size (px)
Citation preview

ArkansasLabor Market Report
November
2017

www.discover.arkansas.gov
ArkansasLabor Market
November
Table of ContentsMonthly Spotlight...............................2
Arkansas Labor Force Summary........3
Arkansas Nonfarm Payroll Jobs...........4
Arkansas Production Workers.............6
Metropolitan Statistical Areas............7
Micropolitan Statistical Areas/Cities.. 14
County Labor Force Statistics...........15
Local Workforce Development Areas.........................................................18
Technical NotesThe Arkansas Labor Market is prepared monthly in conjunction with the U.S. Department of Labor, Bu- reau of Labor Statistics (BLS). The current month’s estimates are preliminary, while previous month’s data is subject to revision.
Estimates of nonfarm payroll jobs show the num- ber of jobs by industry and reflect employment by place of work. Hours and earnings estimates are based on payroll and worker-hour data col- lected for production workers in manufacturing industries.
Industries are classified according to the North American Industry Classification System (NAICS). All estimates are based on a first quarter 2016 benchmark.
Explanation of Terms and
Concepts Monthly Business
Surv ey of Employ ers
A monthly sample survey designed to provide industry information on nonfarm payroll jobs. Data are compiled each month from mail surveys and telephone interviews conducted by the Bureau of Labor Statistics in cooperation with Department of Workforce Services. The data are based on establishment records and include all workers, full-or part-time, who received pay during the payroll period which includes the 12th of the
month. Approximately 5,000 Arkansas business establishments are surveyed.
Metropolitan Statistical Area (MSA)
A term applied by the U.S. Office of Management and Budget to counties that have one or more central cities and that meet specified criteria of population density, commuting patterns and social and economic integration.
Current Population Survey (CPS)
A monthly sample survey of the population 16 years of age and over, designed to provide data on the labor force, the employed and the unem- ployed. The survey is conducted each month by the Bureau of the Census for BLS. The information is collected by trained interviewers from a sample of about 60,000 households. The data collected are based on the activity reported for the calendar week including the 12th of the month. Approxi- mately 800 Arkansas households are represented in the sample survey.
Civilian Labor Force
The sum of all employed and unemployed persons 16 years of age or older. Members of the Armed Forces are
excluded.

ArkansasLabor Market
November
Employment
An estimate of the number of persons who worked any time for pay or profit or worked 15 hours or more as unpaid workers in a family business dur- ing the calendar week which includes the 12th of the month. Also included are those who, although not working, had some job attachment and were not looking for work, and persons involved in labor
management disputes.Unemployment
An estimate of the number of persons who did not have a job, but were available for work and actively seeking work during the calendar week which includes the 12th of the month.
Unemployment Rate
The number of unemployed as a
percentage of the civilian labor force. Unemployment rates are calculated from unrounded data.
Seasonal Adjustment
A statistical technique applied to monthly data to eliminate changes that normally occur during the year due to seasonal events such as weather, major holidays, schedule shifts, harvest times, and the opening/closing of schools.
www.discover.arkansas.gov

w 2
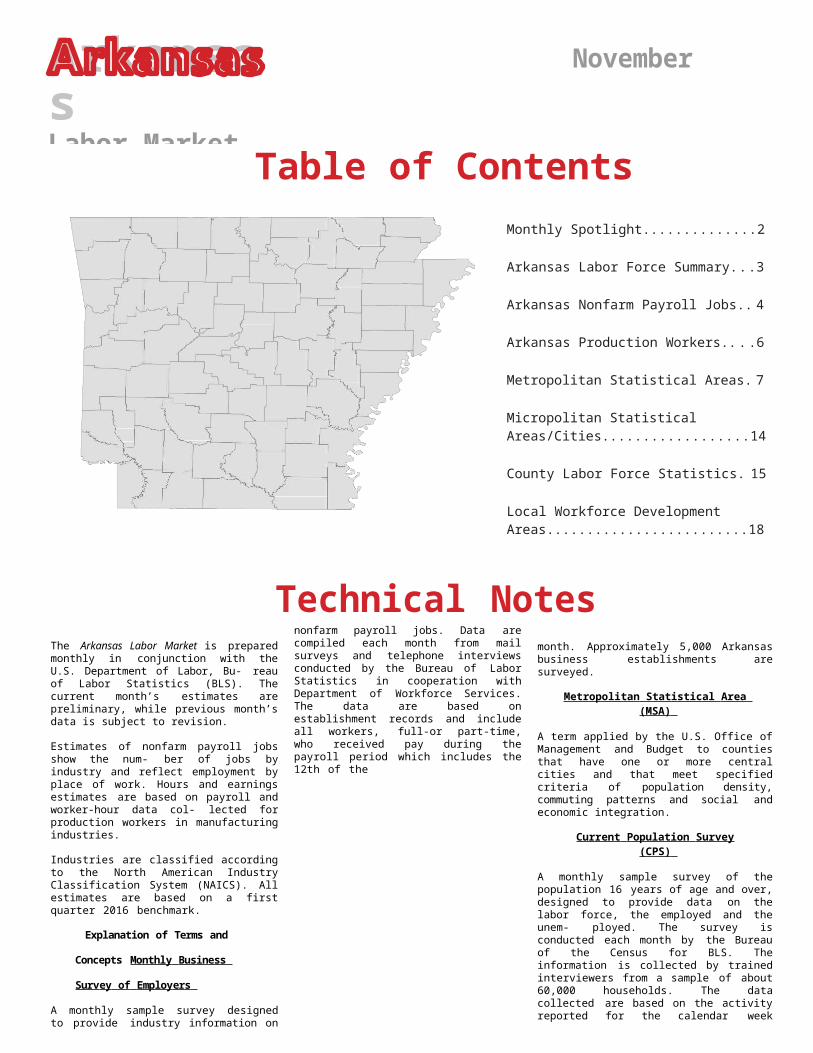
Gross Job Gains and Losses by Quarter (Private Sector)State of Arkansas (Seasonally Adjusted)
-------------------------------------------------------------------------------------------3 months ended
----------------------------------------------------------------------------------------------------Category| Mar 16| Jun 16 | Sep 16| Dec 16| Mar 17*
----------------------------------------------------------------------------------------------------Employment Levels
*Most recent BED data available is for 1st Quarter 2017
ArkansasLabor Market
November
November SpotlightBusiness Employment Dynamics (BED)
Business Employment Dynamics, also known as BED, tracks employment gains and losses at individual business locations. BED statistics are calculated from quarterly reports provided by employers to the Quarterly Census of Employment and Wages (QCEW) Program. Like QCEW data, BED statistics are pro- duced and published on a quarterly basis. At this time, BED data is only available at the national and statewide levels.The information produced from BED statistics includes gross job gains and losses at estab- lishments with changes in em- ployment. These employment changes occur when establish- ments open/expand or close/ contract. Gross job gains are a combination of jobs created from both openings of new businesses and expansions at existing businesses. Gross job losses are a combination of jobs lost from both exist- ing businesses that close and those that reduce their number of employees. The net change is the difference between gross job gains and gross job losses.
Arkansas’ Gross Job Gains vs. Gross Job Losses (Private Sector/Seasonally Adjusted)
1st Quarter 2015 - 1st Quarter 201765,000
63,000
61,000
59,000
57,000
55,000
53,000
51,000
49,000
Gross job gains.....
54,640 54,032 61,522 58,062 56,151
Gross job losses....
54,408 57,902 54,893 53,892 50,773
Net Change..........
232 -3,870 6,629 4,170 5,378
w 3
ArkansasLabor Market
November
47,000
45,000
Mar '15 Jun '15 Sep '15 Dec '15 Mar '16 Jun '16 Sep '16 Dec '16 Mar '17
Gross Job Gains Gross Job Losses

ArkansasLabor MarketReport
State of Arkansas
November
Seasonally Adjusted Not Seasonally Adjusted
w 4
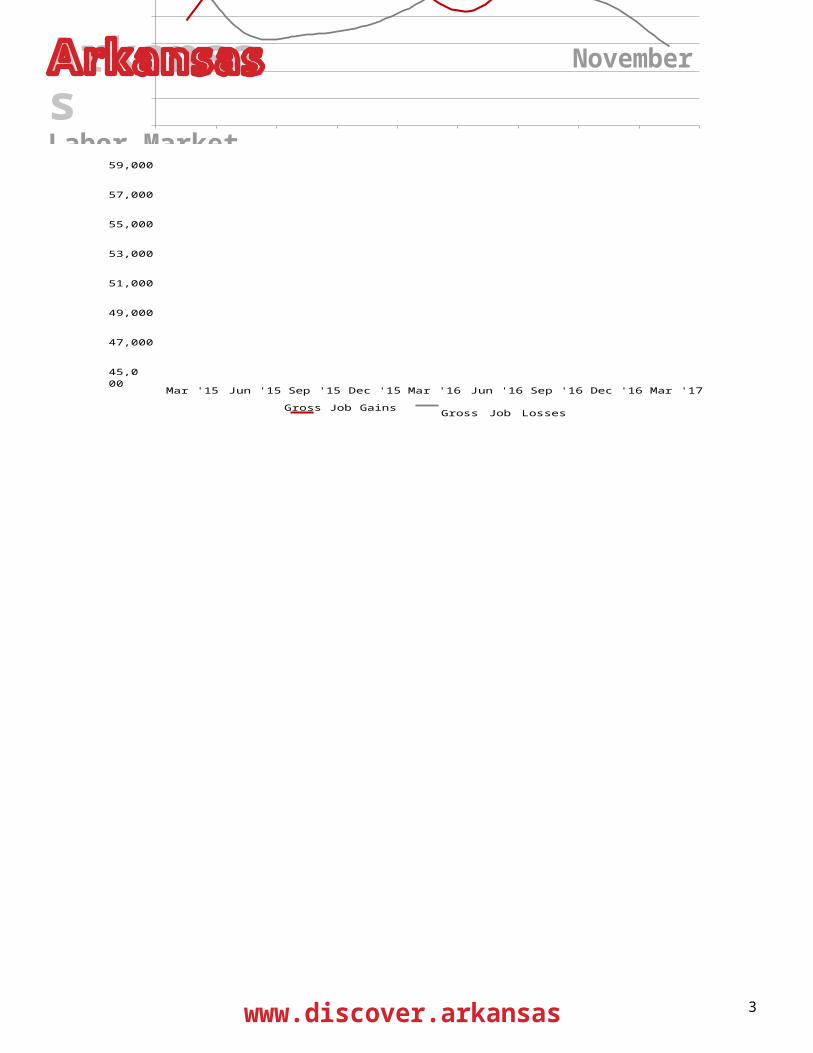
Civilian Labor Force SummaryLabor force data, produced by the U.S. Department of Labor, Bureau of Labor Statistics and released by the Arkansas Department of Workforce Services, show Arkansas’ seasonally adjusted unemployment rate increased one-tenth of a percentage point, from 3.6 percent in October to 3.7 percent in Novem- ber. Arkansas’ civilian labor force declined 6,248, a result of 6,784 fewer employed and 536 more un- employed Arkansans. The United States’ jobless rate was unchanged at 4.1 percent in November.BLS Program Operations Manager Susan Price said, “The unemployment rate in Arkansas rose slightly in November, brought on by a decline in employment and the size of the civilian labor force. Compared to November 2016, there are currently 36,308 more employed in the State.”
Civilian Labor Force Estimates
Civilian Labor ForceNov 17
1,372,006
Oct 17
1,378,254
Nov 16
1,338,739 Civilian Labor ForceNov 17
1,358,380
Oct 17
1,374,366
Nov 16
1,334,504Employment 1,321,879 1,328,663 1,285,571 Employment 1,313,197 1,330,120 1,288,668Unemployment 50,127 49,591 53,168 Unemployment 45,183 44,246 45,836Unemployment Rate
3.7 3.6 4.0 Unemployment Rate
3.3 3.2 3.4
U.S. Unemployment
4.1 4.1 4.6 U.S. Unemployment
3.9 3.9 4.4
5.0
Unemployment Rates (Seasonally Adjusted vs. Not Seasonally Adjusted)
November 2015 - November 2017
4.5
4.0
3.5
3.0
2.5
2.0Nov '15
May '16
Nov '16
May '17
Nov '17
Seasonally Adjusted Not Seasonally Adjusted

(NAICS) Nov 17 Oct 17 Nov 16 OTM OT Y
ArkansasLabor MarketReport
State of Arkansas
November
w 5
Nonfarm Payroll JobsNot Seasonally Adjusted
(In Thousands)
Total Nonfarm 1263.0 1264.8 1242.0 -1.8 21.0Goods Producing 220.0 220.8 212.2 -0.8 7.8Mining, Logging, and Construction 59.2 60.1 56.2 -0.9 3.0
Mining & Logging 6.1 6.0 6.1 0.1 0.0Construction 53.1 54.1 50.1 -1.0 3.0
Specialty Trade Contractors 33.7 34.3 31.4 -0.6 2.3Manufacturing 160.8 160.7 156.0 0.1 4.8
Durable Goods 73.7 73.6 73.6 0.1 0.1Nondurable Goods 87.1 87.1 82.4 0.0 4.7
Service Providing 1043.0 1044.0 1029.8 -1.0 13.2Trade, Transportation & Utilities 257.0 254.9 254.7 2.1 2.3
Wholesale Trade 47.9 47.8 46.2 0.1 1.7Retail Trade 144.2 142.2 143.4 2.0 0.8Transport, Warehousing & Utilities
64.9 64.9 65.1 0.0 -0.2Information 13.1 13.1 13.5 0.0 -0.4Financial Activities 51.2 51.0 51.3 0.2 -0.1
Finance & Insurance 38.1 37.9 38.2 0.2 -0.1Real Estate & Rental & Leasing 13.1 13.1 13.1 0.0 0.0
Professional & Business Services 149.9 149.9 146.2 0.0 3.7Professional, Scientific & Technical
45.3 44.4 42.9 0.9 2.4Management of Companies 33.8 33.8 35.7 0.0 -1.9Administrative & Support Services
70.8 71.7 67.6 -0.9 3.2Educational & Health Services 191.7 191.3 186.0 0.4 5.7
Educational Services 19.4 19.3 16.7 0.1 2.7Health Care & Social Assistance 172.3 172.0 169.3 0.3 3.0
Ambulatory Health Care 59.1 59.2 55.2 -0.1 3.9Social Assistance 39.0 38.7 39.9 0.3 -0.9
Leisure & Hospitality 115.7 119.5 114.1 -3.8 1.6Arts, Entertainment & Recreation 9.7 10.4 9.3 -0.7 0.4Accommodation & Food Services 106.0 109.1 104.8 -3.1 1.2
Accommodation Services 12.0 12.3 11.1 -0.3 0.9Food Services 94.0 96.8 93.7 -2.8 0.3
Other Services 49.2 50.0 48.0 -0.8 1.2Government 215.2 214.3 216.0 0.9 -0.8
Federal Government 20.2 20.2 20.4 0.0 -0.2State Government 80.4 80.1 80.0 0.3 0.4Local Government 114.6 114.0 115.6 0.6 -1.0

ArkansasLabor MarketReport
State of Arkansas
November
w 6
Nonfarm Payroll Job SummaryOctober 2017 - November 2017
Nonfarm payroll jobs in Arkansas declined 1,800 in November to total 1,263,000. Three major industry sectors posted losses, while six increased and two were unchanged. Employment in leisure and hospi- tality dropped 3,800. A majority of the decline occurred in food services (-2,800), attributed in part to reported staff reductions and closures at full service restaurants. Jobs in construction decreased 1,000, a typical seasonal loss. Trade, transportation, and utilities added 2,100 jobs. Most of the increase occurred in retail trade (+2,000), as stores began temporary hiring for the holiday shopping season.
November 2016 - November 2017Compared to November 2016, Arkansas’ nonfarm payroll employment is up 21,000. Growth was re- ported in seven major industry sectors, with four adding 3,000 or more jobs, each. Employment in educational and health services increased 5,700. Gains were posted in both health care and social assistance (+3,000) and educational services (+2,700). Manufacturing added 4,800 jobs, mostly in nondurable goods manufacturing (+4,700). Jobs in professional and business services rose 3,700. Increases occurred in administrative-support services (+3,200) and professional-scientific-technical ser- vices (+2,400). Construction reported moderate growth, up 3,000. A majority of the expansion was in specialty trade contractors (+2,300). Other notable gains were posted in trade-transportation- utilities (+2,300), leisure and hospitality (+1,600), and other services (+1,200).
180,000
Jobs in Health Care and Social Assistance (Not Seasonally Adjusted)November: 2007 - 2017
170,000
160,000
150,000
140,000
130,000
120,000

ArkansasLabor MarketReport
State of Arkansas
November
w 7
'07 '08'09
0 '112 '134 '156 '17
Manufacturing
Durable Goods Manufacturing Nondurable Goods ManufacturingNov 17Oct 17Nov 16
Average Weekly Hours42.341.1Average Hourly Earnings14.9714.77Average Weekly Earnings633.23607.05
39.214.04550.37
ArkansasLabor MarketReport
State of Arkansas
November
w 8
Production Workers- Hours and Earnings
Nov 17 Oct 17 Nov 16
Average Weekly Hours 42.7 41.2 40.6Average Hourly 16.17 16.13 15.57Average Weekly Earnings
690.46 664.56 632.14
Durable Goods and Nondurable Goods Manufacturing
Nov 17 Oct 17 Nov 16
Average Weekly Hours 43.2 41.4 42.1Average Hourly 17.65 17.85 17.17Average Weekly Earnings
762.48 738.99 722.86
$20.00
Average Hourly Earnings for Production WorkersDurable Goods Manufacturing vs Nondurable Goods
Manufacturing November: 2007 - 2017
$19.00
$18.00
$17.00
$16.00
$15.00
$14.00
$13.00
$12.00
$11.00
$10.00
'07 '08 '09 '10 '11 '12 '13 '14 '15 '16 '17
Durable Goods Nondurable Goods

ArkansasLabor MarketReport
Metropolitan Statistical
November
w 9
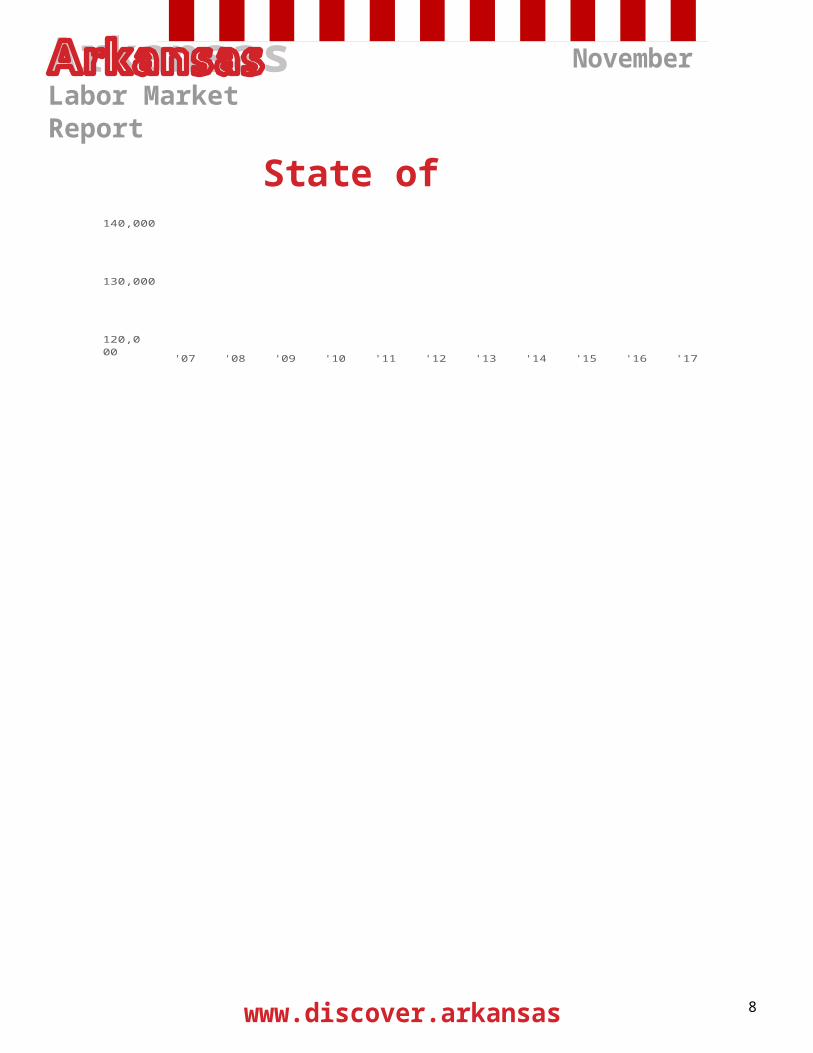
Little Rock-Nor th Little Rock-Conway MSAThe Little Rock-North Little Rock-Conway MSA= Faulkner, Grant, Lonoke, Perry, Pulaski, & Saline counties.
Civilian Labor Force Estimates (Not Seasonally Adjusted)
Nov 17 Oct 17 Nov 16 OTM OT Y Civilian Labor Force 353,321 357,970 346,511 -4,649 6,810Employment 342,653 347,449 335,738 -4,796 6,915Unemployment 10,668 10,521 10,773 147 -105Unemployment Rate 3.0 2.9 3.1 0.1 -0.1
Nonfarm Payroll Jobs (Not Seasonally Adjusted)(In Thousands)
NAICSTotal Nonfarm
Nov 17 357.7
Oct 17 357.7
Nov 16 355.8
OTM 0.0
OT Y 1.9
Goods Producing 38.4 38.4 36.6 0.0 1.8Mining, Logging & Construction
18.3 18.4 16.5 -0.1 1.8Manufacturing 20.1 20.0 20.1 0.1 0.0
Service Providing 319.3 319.3 319.2 0.0 0.1Trade, Transportation & Utilities
70.4 70.0 71.5 0.4 -1.1Wholesale Trade 14.8 14.9 15.0 -0.1 -0.2Retail Trade 39.5 39.1 40.5 0.4 -1.0Trans., Warehousing & Utilities
16.1 16.0 16.0 0.1 0.1Information 6.0 6.0 6.3 0.0 -0.3Financial Activities 20.5 20.5 20.4 0.0 0.1Professional & Business Services
47.4 47.1 47.8 0.3 -0.4Educational & Health Services
57.8 57.6 55.1 0.2 2.7Leisure & Hospitality 32.2 33.2 32.9 -1.0 -0.7Other Services 14.7 14.8 14.5 -0.1 0.2Government 70.3 70.1 70.7 0.2 -0.4
Federal Government 9.7 9.7 9.7 0.0 0.0State Government 35.5 35.4 35.3 0.1 0.2Local Government 25.1 25.0 25.7 0.1 -0.6
EmploymentJanuary 2015 - November 2017
360,000
Jobs in Goods Producing IndustriesNovember: 2007 - 2017
50,000
350,00045,000
340,000
40,000
330,000
35,000
320,000
30,000
310,000
25,000

ArkansasLabor MarketReport
Metropolitan Statistical
November
w 10
300,000 J F M A M J J A S O N
D
2015 2016 201720,000
'07 '08 '09 '10 '11 '12 '13 '14 '15 '16 '17
ArkansasLabor MarketReport
Metropolitan Statistical
November
w 11
Fayetteville-Springdale-Rogers MSAThe Fayetteville-Springdale-Rogers MSA= Benton, Madison, & Washington counties in Arkansas & McDonald county in Missouri.
Civilian Labor Force Estimates (Not Seasonally Adjusted)
Nov 17 Oct 17 Nov 16 OTM OT Y Civilian Labor Force 275,998 279,460 266,181 -3,462 9,817Employment 269,028 272,685 259,568 -3,657 9,460Unemployment 6,970 6,775 6,613 195 357Unemployment Rate 2.5 2.4 2.5 0.1 0.0
Nonfarm Payroll Jobs (Not Seasonally Adjusted)(In Thousands)
NAICSTotal Nonfarm
Nov 17 258.3
Oct 17 257.9
Nov 16 251.9
OTM 0.4
OT Y 6.4
Goods Producing 39.4 39.2 38.1 0.2 1.3Mining, Logging & Construction
11.1 11.0 10.4 0.1 0.7Manufacturing 28.3 28.2 27.7 0.1 0.6
Service Providing 218.9 218.7 213.8 0.2 5.1Trade, Transportation & Utilities
56.7 56.3 56.2 0.4 0.5Wholesale Trade 12.9 12.8 12.4 0.1 0.5Retail Trade 26.1 25.8 26.5 0.3 -0.4Trans., Warehousing & Utilities
17.7 17.7 17.3 0.0 0.4Information 1.9 1.9 1.9 0.0 0.0Financial Activities 8.0 8.0 7.8 0.0 0.2Professional & Business Services
52.5 52.5 51.7 0.0 0.8Educational & Health Services
29.0 28.9 27.9 0.1 1.1Leisure & Hospitality 25.9 26.4 24.8 -0.5 1.1Other Services 7.8 7.8 7.6 0.0 0.2Government 37.1 36.9 35.9 0.2 1.2
Federal Government 2.5 2.6 2.5 -0.1 0.0State Government 15.4 15.3 14.5 0.1 0.9Local Government 19.2 19.0 18.9 0.2 0.3
Nonfarm Payroll JobsNovember 2014 - November 2017
270,000
260,000
250,000
240,000
230,000
220,000
210,000

ArkansasLabor MarketReport
Metropolitan Statistical
November
w 12
Nov '14 May '15 Nov '15 May '16 Nov '16 May '17 Nov '17

Service ProvidingTrade, Transportation & UtilitiesWholesale Trade Retail TradeTrans., Warehousing & UtilitiesInformation Financial ActivitiesProfessional & Business Services Educational & Health Services Leisure & HospitalityOther Services GovernmentFederal Government State Government Local Government
91.523.24.012.76.51.33.813.716.99.54.318.81.33.214.3
91.222.94.012.46.51.33.813.716.89.64.318.81.33.214.3
91.223.83.913.26.71.23.813.116.89.54.318.71.33.214.2
0.30.30.00.30.00.00.00.00.1-0.10.00.00.00.00.0
0.3-0.60.1-0.5-0.20.10.00.60.10.00.00.10.00.00.1
ArkansasLabor MarketReport
Metropolitan Statistical
November
w 13
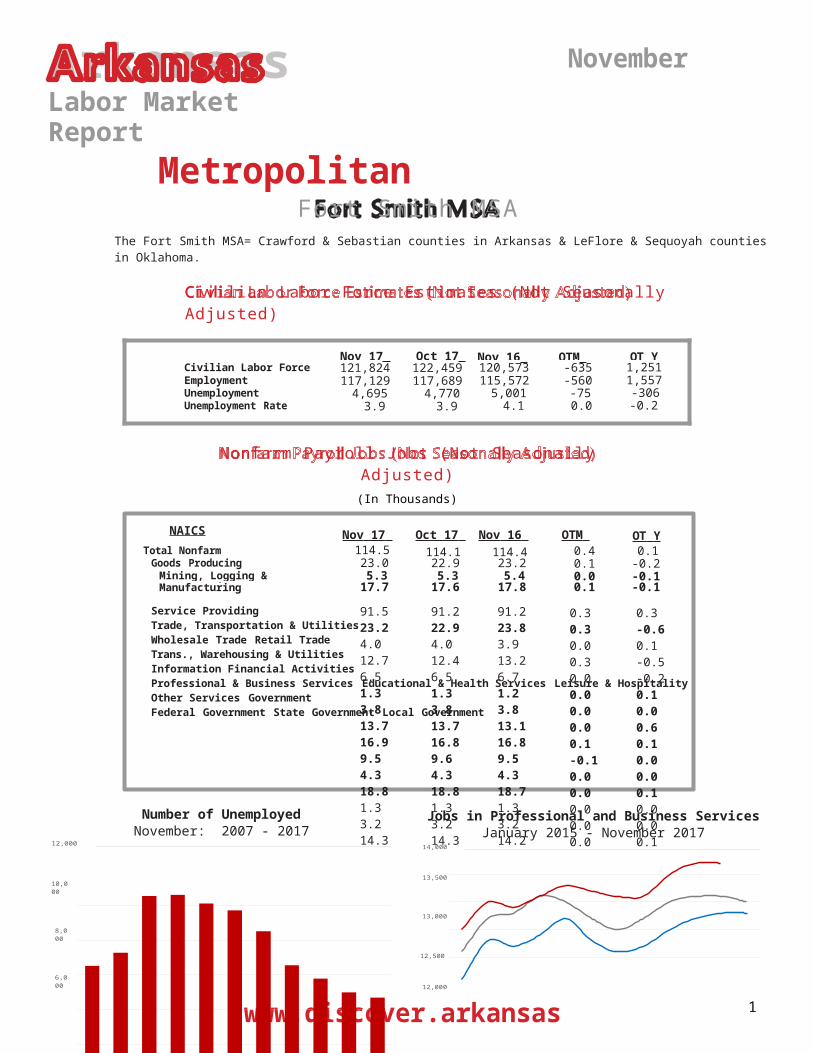
Fort Smith MSAThe Fort Smith MSA= Crawford & Sebastian counties in Arkansas & LeFlore & Sequoyah counties in Oklahoma.
Civilian Labor Force Estimates (Not Seasonally Adjusted)
Nov 17 Oct 17 Nov 16 OTM OT Y Civilian Labor Force 121,824 122,459 120,573 -635 1,251Employment 117,129 117,689 115,572 -560 1,557Unemployment 4,695 4,770 5,001 -75 -306Unemployment Rate 3.9 3.9 4.1 0.0 -0.2
Nonfarm Payroll Jobs (Not Seasonally Adjusted)(In Thousands)
NAICSTotal Nonfarm
Nov 17 Oct 17 Nov 16 OTM OT Y 114.5 114.1 114.4 0.4 0.1
Goods Producing 23.0 22.9 23.2 0.1 -0.2Mining, Logging & Construction
5.3 5.3 5.4 0.0 -0.1Manufacturing 17.7 17.6 17.8 0.1 -0.1
Number of UnemployedNovember: 2007 - 2017
12,000
Jobs in Professional and Business ServicesJanuary 2015 - November 2017
14,000
10,00013,500
8,000
13,000
12,500
6,00012,000
4,00011,500
2,00011,000
0'07 '08 '09 '10 '11 '12 '13 '14 '15 '16 '17
10,500 J F M A M J J A S O N D
2015 2016 2017

w 10
NAICSTotal Nonfarm Goods Producing Service Providing Government
ArkansasLabor MarketReport
Metropolitan Statistical
November
Hot Springs MSAThe Hot Springs MSA= Garland County.
Civilian Labor Force Estimates (Not Seasonally Adjusted)
Nov 17 Oct 17 Nov 16 OTM OT Y Civilian Labor Force 39,980 40,477 39,108 -497 872Employment 38,532 39,022 37,552 -490 980Unemployment 1,448 1,455 1,556 -7 -108Unemployment Rate 3.6 3.6 4.0 0.0 -0.4
Nonfarm Payroll Jobs (Not Seasonally Adjusted)(In Thousands)
Nov 17 Oct 17 Nov 16 OTM OT Y 37.7 37.9 37.3 -0.2 0.44.6 4.6 4.4 0.0 0.233.1 33.3 32.9 -0.2 0.24.5 4.4 4.6 0.1 -0.1
9.0
Unemployment RatesNovember: 1997 - 2017
8.0
7.0
6.0
5.0
4.0
3.0
2.0
1.0
0.0
'97 '98 '99 '00 '01 '02 '03 '04 '05 '06 '07 '08 '09 '10 '11 '12 '13 '14 '15 '16 '17
w 11
NAICSTotal Nonfarm Goods Producing Service Providing Government
ArkansasLabor MarketReport
Metropolitan Statistical
November
Jonesboro MSAThe Jonesboro MSA= Craighead & Poinsett counties.
Civilian Labor Force Estimates (Not Seasonally Adjusted)
Nov 17 Oct 17 Nov 16 OTM OT Y Civilian Labor Force 64,002 64,468 62,303 -466 1,699Employment 62,194 62,682 60,507 -488 1,687Unemployment 1,808 1,786 1,796 22 12Unemployment Rate 2.8 2.8 2.9 0.0 -0.1
Nonfarm Payroll Jobs (Not Seasonally Adjusted)(In Thousands)
Nov 17 Oct 17 Nov 16 OTM OT Y 57.7 57.4 56.8 0.3 0.99.5 9.4 9.2 0.1 0.348.2 48.0 47.6 0.2 0.69.3 9.3 9.2 0.0 0.1
60,000
Nonfarm Payroll JobsNovember 2014 - November
2017
59,000
58,000
57,000
56,000
55,000
54,000
53,000
52,000
51,000
50,000Nov '14 May '15 Nov '15 May '16 Nov '16 May '17 Nov '17
ArkansasLabor MarketReport
Metropolitan Statistical
November
NAICSTotal Nonfarm Goods Producing Service Providing Government
w 12
Pine Bluff MSAThe Pine Bluff MSA= Cleveland, Jefferson, & Lincoln counties.
Civilian Labor Force Estimates (Not Seasonally Adjusted)
Nov 17 Oct 17 Nov 16 OTM OT Y Civilian Labor Force 35,736 36,130 35,730 -394 6Employment 34,124 34,557 34,117 -433 7Unemployment 1,612 1,573 1,613 39 -1Unemployment Rate 4.5 4.4 4.5 0.1 0.0
Nonfarm Payroll Jobs (Not Seasonally Adjusted)(In Thousands)
Nov 17 Oct 17 Nov 16 OTM OT Y 33.3 33.3 33.8 0.0 -0.55.9 6.0 6.1 -0.1 -0.227.4 27.3 27.7 0.1 -0.39.6 9.5 9.7 0.1 -0.1
33,000
Jobs in Service Providing Industries
November: 2007 - 2017
32,000
31,000
30,000
29,000
28,000
27,000
26,000
25,000
24,000
23,000
'07 '08 '09 '10 '11 '12 '13 '14 '15 '16 '17

ArkansasLabor MarketReport
Metropolitan Statistical
November
w 13
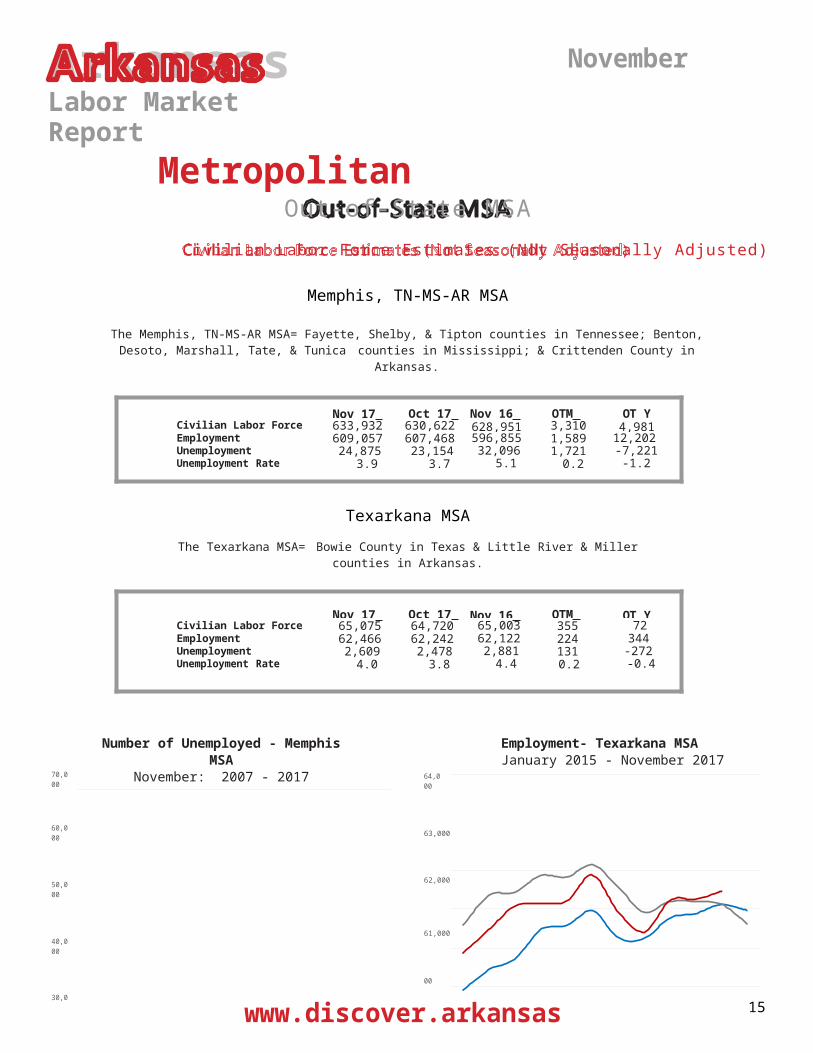
Out-of-State MSACivilian Labor Force Estimates (Not Seasonally Adjusted)
Memphis, TN-MS-AR MSAThe Memphis, TN-MS-AR MSA= Fayette, Shelby, & Tipton counties in Tennessee; Benton, Desoto, Marshall,
Tate, & Tunica counties in Mississippi; & Crittenden County in Arkansas.
Nov 17 Oct 17 Nov 16 OTM OT Y Civilian Labor Force 633,932 630,622 628,951 3,310 4,981Employment 609,057 607,468 596,855 1,589 12,202Unemployment 24,875 23,154 32,096 1,721 -7,221Unemployment Rate 3.9 3.7 5.1 0.2 -1.2
Texarkana MSAThe Texarkana MSA= Bowie County in Texas & Little River & Miller counties
in Arkansas.
Nov 17 Oct 17 Nov 16 OTM OT Y Civilian Labor Force 65,075 64,720 65,003 355 72Employment 62,466 62,242 62,122 224 344Unemployment 2,609 2,478 2,881 131 -272Unemployment Rate 4.0 3.8 4.4 0.2 -0.4
70,000
Number of Unemployed - Memphis MSA
November: 2007 - 2017 64,000
Employment- Texarkana MSAJanuary 2015 - November 2017
60,00063,000
50,000 62,000
40,00061,000
30,00060,000
20,000
59,000
10,000'07 '08 '09 '10 '11 '12 '13 '14 '15 '16 '17
58,000 J F M A M J J A S O N D
2015 2016 2017

ArkansasLabor MarketReport
Micropolitan Statistical Areas and Cities
November
November 2017 October 2017 November 2016
w 14
November 2017 October 2017 November 2016
Micropolitan Labor Force Estimates (Not Seasonally Adjusted)
Micro AreaArkadelphia Micro
CLF9,726
Emp 9,39
Unemp
333
Rate 3.4
CLF9,852
Emp 9,49
Unemp
354
Rate 3.6
CLF9,602
Emp 9,26
Unemp
342
Rate 3.6
Batesville Micro 16,333 15,72 610 3.7 16,450 15,852
598 3.6 15,819 15,157
662 4.2Blytheville Micro 18,098 17,24 856 4.7 18,490 17,67
3817 4.4 18,289 17,28
31,006 5.5
Camden Micro 12,172 11,672 500 4.1 12,344 11,847 497 4.0 12,067 11,554
513 4.3El Dorado Micro 16,028 15,26 760 4.7 16,202 15,46
4738 4.6 16,095 15,33
1764 4.7
Forrest City Micro 8,411 8,02 390 4.6 8,526 8,142
384 4.5 8,733 8,341
392 4.5Harrison Micro 19,220 18,59 628 3.3 19,338 18,74
1597 3.1 19,322 18,70
2620 3.2
Helena-West Helena 6,471 6,10 369 5.7 6,562 6,208
354 5.4 6,556 6,231
325 5.0Hope Micro 13,612 13,19 420 3.1 13,794 13,37
5419 3.0 13,578 13,13
9439 3.2
Magnolia Micro 9,173 8,76 404 4.4 9,271 8,884
387 4.2 9,212 8,743
469 5.1Malvern Micro 14,253 13,77 476 3.3 14,428 13,95
0478 3.3 13,991 13,51
6475 3.4
Mountain Home Micro 16,631 15,97 657 4.0 16,720 16,092
628 3.8 15,898 15,283
615 3.9Paragould Micro 19,932 19,28 643 3.2 20,153 19,51
9634 3.1 19,668 18,91
4754 3.8
Russellville Micro 38,576 37,08 1,490 3.9 39,033 37,614
1,419 3.6 38,022 36,576
1,446 3.8Searcy Micro 33,966 32,62
21,344 4.0 34,275 32,99
61,279 3.7 33,805 32,38
91,416 4.2
Arkadelphia Micro= Clark County Batesville Micro= Independence County Blytheville Micro= Mississippi CountyCamden Micro= Calhoun & Ouachita counties El Dorado Micro= Union County
Forrest City Micro= St. Francis County Harrison Micro= Boone & Newton counties Helena-West Helena Micro= Phillips County Hope Micro= Hempstead & Nevada counties Magnolia Micro= Columbia County
Malvern Micro= Hot Spring County Mountain Home Micro= Baxter County Paragould Micro= Greene County Russellville Micro= Pope & Yell counties Searcy Micro= White County
City Labor Force Statistics (Not Seasonally Adjusted)
CityBella Vista
CLF12,598
Emp
12,170
Unemp
428
Rate 3.4
CLF12,772
Emp
12,338
Unemp
434
Rate 3.4
CLF12,089
Emp
11,718
Unemp
371
Rate 3.1
Benton 16,482 16,023
459 2.8 16,667 16,242
425 2.5 16,154 15,69 461 2.9Bentonville 24,844 24,18
8656 2.6 25,197 24,52
1676 2.7 23,806 23,29 516 2.2
Blytheville 6,214 5,878
336 5.4 6,334 6,025
309 4.9 6,251 5,89 359 5.7Cabot 11,785 11,442 343 2.9 11,961 11,613 348 2.9 11,563 11,235 328 2.8Conway 33,378 32,33
91,039 3.1 33,758 32,77
6982 2.9 32,763 31,69 1,070 3.3
El Dorado 6,959 6,609
350 5.0 7,053 6,694
359 5.1 7,010 6,63 374 5.3Fayetteville 48,308 47,15
51,153 2.4 48,849 47,77
31,076 2.2 46,514 45,40 1,106 2.4
Fort Smith 40,515 39,172
1,343 3.3 40,906 39,591
1,315 3.2 39,869 38,61 1,256 3.2Hot Springs 13,955 13,39
9556 4.0 14,134 13,57
0564 4.0 13,647 13,05 588 4.3
Jacksonville 11,833 11,367 466 3.9 11,990 11,526 464 3.9 11,590 11,132 458 4.0Jonesboro 37,673 36,65
91,014 2.7 37,938 36,93
41,004 2.6 36,638 35,63 1,004 2.7
Little Rock 97,468 94,524
2,944 3.0 98,783 95,846
2,937 3.0 95,556 92,57 2,984 3.1North Little 30,166 29,14
81,018 3.4 30,559 29,55
61,003 3.3 29,526 28,54 980 3.3
Paragould 12,492 12,062
430 3.4 12,631 12,205
426 3.4 12,360 11,827 533 4.3Pine Bluff 17,023 16,12
2901 5.3 17,194 16,33
0864 5.0 16,978 16,10 874 5.1
Rogers 35,261 34,362
899 2.5 35,732 34,836
896 2.5 33,933 33,08 847 2.5Russellville 13,828 13,32
7501 3.6 13,986 13,511 475 3.4 13,574 13,12 445 3.3
Searcy 10,418 10,069
349 3.3 10,534 10,184
350 3.3 10,362 9,99 365 3.5Sherwood 15,694 15,28
5409 2.6 15,912 15,49
8414 2.6 15,398 14,96 429 2.8
Springdale 40,019 39,093
926 2.3 40,508 39,608
900 2.2 38,539 37,64 894 2.3Texarkana, AR 13,992 13,41
8574 4.1 14,014 13,44
4570 4.1 13,775 13,21 559 4.1
Van Buren 10,475 10,120
355 3.4 10,559 10,237
322 3.0 10,296 9,98 310 3.0

ArkansasLabor MarketReport
Micropolitan Statistical Areas and Cities
November
w 15
West Memphis 10,838 10,392
446 4.1 10,854 10,432
422 3.9 10,687 10,175
512 4.8
ArkansasLabor MarketReport
County Labor Force Statistics
November
Not Seasonally Adjusted
November 2017 October 2017 November 2016
w 16
CountyArkansas
CLF9,037
Emp 8,752
Unemp
285
Rate 3.2
CLF9,230
Emp 8,96
Unemp
267
Rate 2.9
CLF9,245
Emp 8,94
Unemp
300
Rate 3.2
Ashley 7,731 7,356 375 4.9 7,881 7,509
372 4.7 7,864 7,42 442 5.6Baxter 16,631 15,974 657 4.0 16,720 16,09
2628 3.8 15,898 15,28 615 3.9
Benton 132,575 129,004 3,571 2.7 134,345 130,782
3,563 2.7 127,465 124,21 3,250 2.5Boone 15,858 15,329 529 3.3 15,950 15,45
6494 3.1 15,919 15,41 505 3.2
Bradley 4,485 4,315 170 3.8 4,577 4,405
172 3.8 4,522 4,31 208 4.6Calhoun 2,374 2,287 87 3.7 2,410 2,32
585 3.5 2,355 2,27 82 3.5
Carroll 13,075 12,709 366 2.8 13,417 13,071
346 2.6 12,950 12,56 388 3.0Chicot 3,421 3,210 211 6.2 3,499 3,29
1208 5.9 3,508 3,30 205 5.8
Clark 9,726 9,393 333 3.4 9,852 9,498
354 3.6 9,602 9,26 342 3.6Clay 5,857 5,619 238 4.1 5,916 5,70
1215 3.6 5,939 5,66 274 4.6
Cleburne 9,357 8,954 403 4.3 9,448 9,041
407 4.3 9,371 8,91 453 4.8Cleveland 3,304 3,179 125 3.8 3,349 3,21
8131 3.9 3,319 3,18 130 3.9
Columbia 9,173 8,769 404 4.4 9,271 8,884
387 4.2 9,212 8,74 469 5.1Conway 8,259 7,932 327 4.0 8,361 8,03
3328 3.9 8,297 7,89 402 4.8
Craighead 53,576 52,147 1,429 2.7 53,938 52,537
1,401 2.6 52,108 50,68 1,420 2.7Crawford 26,889 26,000 889 3.3 27,161 26,30
1860 3.2 26,524 25,65 868 3.3
Crittenden 21,926 21,115 811 3.7 21,996 21,197
799 3.6 21,549 20,67 875 4.1Cross 7,731 7,450 281 3.6 7,852 7,58
5267 3.4 7,909 7,59 316 4.0
Dallas 2,934 2,818 116 4.0 2,967 2,848
119 4.0 2,922 2,80 122 4.2Desha 5,437 5,212 225 4.1 5,575 5,36
1214 3.8 5,450 5,19 254 4.7
Drew 7,963 7,608 355 4.5 8,062 7,723
339 4.2 8,008 7,61 391 4.9Faulkner 60,821 58,957 1,864 3.1 61,547 59,75
31,794 2.9 59,699 57,78 1,919 3.2
Franklin 7,476 7,239 237 3.2 7,552 7,326
226 3.0 7,227 6,98 246 3.4Fulton 4,709 4,531 178 3.8 4,696 4,53
0166 3.5 4,658 4,48 178 3.8
Garland 39,980 38,532 1,448 3.6 40,477 39,022
1,455 3.6 39,108 37,55 1,556 4.0Grant 8,357 8,111 246 2.9 8,481 8,24
8233 2.7 8,220 7,96 258 3.1
Greene 19,932 19,289 643 3.2 20,153 19,519
634 3.1 19,668 18,91 754 3.8Hempstead 9,929 9,627 302 3.0 10,068 9,76
5303 3.0 9,917 9,59 323 3.3
Hot Spring 14,253 13,777 476 3.3 14,428 13,950
478 3.3 13,991 13,51 475 3.4Howard 5,760 5,602 158 2.7 5,911 5,75
6155 2.6 5,777 5,60 170 2.9
Independence 16,333 15,723 610 3.7 16,450 15,852
598 3.6 15,819 15,15 662 4.2Izard 4,964 4,700 264 5.3 4,953 4,73
9214 4.3 5,015 4,76 246 4.9
Jackson 5,880 5,587 293 5.0 5,999 5,710
289 4.8 6,018 5,70 314 5.2Jefferson 28,401 27,067 1,334 4.7 28,713 27,41
71,296 4.5 28,352 27,03 1,315 4.6
Johnson 10,879 10,464 415 3.8 10,907 10,496
411 3.8 10,514 10,10 414 3.9Lafayette 2,498 2,382 116 4.6 2,502 2,38
7115 4.6 2,608 2,47 133 5.1
Lawrence 7,000 6,770 230 3.3 7,083 6,851
232 3.3 6,966 6,71 250 3.6Lee 2,975 2,852 123 4.1 3,044 2,91
7127 4.2 3,064 2,93 128 4.2
Lincoln 4,031 3,878 153 3.8 4,068 3,922
146 3.6 4,059 3,89 168 4.1Little River 5,700 5,434 266 4.7 5,712 5,46
0252 4.4 5,588 5,35 237 4.2
Logan 8,931 8,630 301 3.4 9,055 8,754
301 3.3 9,033 8,70 333 3.7Lonoke 33,514 32,514 1,000 3.0 33,978 33,00
2976 2.9 32,917 31,92 990 3.0
Madison 7,524 7,335 189 2.5 7,631 7,441
190 2.5 7,323 7,12 196 2.7Marion 6,537 6,302 235 3.6 6,564 6,34 221 3.4 6,486 6,25 233 3.6Miller 20,198 19,421 777 3.8 20,244 19,45
9785 3.9 19,888 19,12
9759 3.8
(continued on Page 16)

November 2017 October 2017 November 2016
ArkansasLabor MarketReport
County Labor Force Statistics
November
Not Seasonally Adjusted
w 17
(continued from Page 15)
CountyMississippi
CLF18,098
Emp
17,242
Unemp
856
Rate 4.7
CLF18,490
Emp
17,673
Unemp
817
Rate 4.4
CLF18,289
Emp
17,283
Unemp 1,006
Rate 5.5
Monroe 2,748 2,631
117 4.3 2,825 2,717
108 3.8 2,770 2,64 129 4.7Montgomery 3,075 2,94
1134 4.4 3,144 3,00
7137 4.4 2,847 2,71 136 4.8
Nevada 3,683 3,565
118 3.2 3,726 3,610
116 3.1 3,661 3,54 116 3.2Newton 3,362 3,26
399 2.9 3,388 3,28
5103 3.0 3,403 3,28 115 3.4
Ouachita 9,798 9,385
413 4.2 9,934 9,522
412 4.1 9,712 9,28 431 4.4Perry 4,211 4,04
9162 3.8 4,254 4,09
7157 3.7 4,146 3,98 166 4.0
Phillips 6,471 6,102
369 5.7 6,562 6,208
354 5.4 6,556 6,23 325 5.0Pike 4,262 4,09
6166 3.9 4,311 4,15
1160 3.7 4,148 3,98 163 3.9
Poinsett 10,426 10,047
379 3.6 10,530 10,145
385 3.7 10,195 9,81 376 3.7Polk 8,016 7,70
3313 3.9 8,013 7,70
4309 3.9 8,190 7,84 344 4.2
Pope 29,724 28,545
1,179 4.0 30,058 28,939
1,119 3.7 29,233 28,12 1,111 3.8Prairie 3,719 3,57
5144 3.9 3,774 3,64
2132 3.5 3,612 3,48 125 3.5
Pulaski 189,317 183,516
5,801 3.1 191,889 186,082
5,807 3.0 185,585 179,72 5,860 3.2Randolph 7,077 6,80
7270 3.8 7,146 6,88
9257 3.6 6,468 6,20 261 4.0
St. Francis 8,411 8,021
390 4.6 8,526 8,142
384 4.5 8,733 8,34 392 4.5Saline 57,101 55,50
61,595 2.8 57,821 56,26
71,554 2.7 55,944 54,36 1,580 2.8
Scott 4,512 4,354
158 3.5 4,570 4,413
157 3.4 4,416 4,28 135 3.1Searcy 2,881 2,75
5126 4.4 2,897 2,77
3124 4.3 3,039 2,91 121 4.0
Sebastian 58,179 56,237
1,942 3.3 58,741 56,838
1,903 3.2 57,281 55,43 1,846 3.2Sevier 5,687 5,44
6241 4.2 5,732 5,49
9233 4.1 5,665 5,40 256 4.5
Sharp 6,048 5,800
248 4.1 6,102 5,844
258 4.2 5,985 5,69 288 4.8Stone 4,788 4,58
6202 4.2 4,824 4,63
1193 4.0 4,712 4,49 222 4.7
Union 16,028 15,268
760 4.7 16,202 15,464
738 4.6 16,095 15,33 764 4.7Van Buren 5,902 5,61
2290 4.9 5,940 5,65
4286 4.8 5,880 5,54 339 5.8
Washington 125,168 122,291
2,877 2.3 126,682 123,896
2,786 2.2 120,534 117,76 2,773 2.3White 33,966 32,62
21,344 4.0 34,275 32,99
61,279 3.7 33,805 32,38 1,416 4.2
Woodruff 2,971 2,837
134 4.5 3,044 2,917
127 4.2 2,956 2,82 133 4.5Yell 8,852 8,54
1311 3.5 8,975 8,67
5300 3.3 8,789 8,45
4335 3.8
County Labor Force SummaryBetween October and November, unemployment rates increased in fifty-five of Arkansas’ 75 counties. Rates were stable in thirteen counties, while seven counties posted rate declines. Job- less rates ranged from a low of 2.3 percent in Washington County to a high of 6.2 percent in Chicot County.In November, forty-nine counties posted unemployment rates at or below four percent. That is down from 53 counties at or below four percent in October. For the 9th consecutive month, no county in Arkansas reported a jobless rate above eight percent.Compared to November 2016, unemployment rates are down in 47 counties. Fifteen counties reported higher rates over-the-year, while 13 counties were the same.

ArkansasLabor MarketReport
County Labor Force
November
Benton Carroll Fulton ClayBoone Randolph
Marion Baxter
SharpIzard Greene
MadisonWashington Lawrence
Newton SearcyStone Craighead Mississippi
Independence
Crawford Johnson Van Buren Jackson PoinsettFranklin Cleburne
Pope
Conway CrossSebastian Logan White
CrittendenFaulkner Woodruff
Yell St. FrancisPerry
Scott PrairiePulaskiLonoke Lee
Saline Monroe
Montgomery GarlandPolk
Phillips
Hot Spring Grant Jefferson Arkansas
PikeHoward
ClarkSevier Dallas Lincoln
ClevelandDesha
Little RiverHempstead NevadaOuachita Calhoun Drew
Unemployment Rates< or = 3.0% 3.1% - 5.0%
Bradley
MillerColumbia Chicot
Union Ashley5.1% - 7.0%> 7.0% [NONE]
Lafayette
w 18
Ranked by Unemployment RatesNovember 2017- Not Seasonally Adjusted
Rank1
CountyWashington
Rate 2.3
Rank25
CountyYell
Rate 3.5
Rank50
CountyDesha
Rate 4.1
2 Madison 2.5 27 Cross 3.6 50 Lee 4.13 Benton 2.7 27 Garland 3.6 50 Sharp 4.13 Craighead 2.7 27 Marion 3.6 54 Ouachita 4.23 Howard 2.7 27 Poinsett 3.6 54 Sevier 4.26 Carroll 2.8 31 Calhoun 3.7 54 Stone 4.26 Saline 2.8 31 Crittenden 3.7 57 Cleburne 4.38 Grant 2.9 31 Independenc 3.7 57 Monroe 4.38 Newton 2.9 34 Bradley 3.8 59 Columbia 4.410 Hempstead 3.0 34 Cleveland 3.8 59 Montgomery 4.410 Lonoke 3.0 34 Fulton 3.8 59 Searcy 4.412 Faulkner 3.1 34 Johnson 3.8 62 Drew 4.512 Pulaski 3.1 34 Lincoln 3.8 62 Woodruff 4.514 Arkansas 3.2 34 Miller 3.8 64 Lafayette 4.614 Franklin 3.2 34 Perry 3.8 64 St. Francis 4.614 Greene 3.2 34 Randolph 3.8 66 Jefferson 4.714 Nevada 3.2 42 Pike 3.9 66 Little River 4.718 Boone 3.3 42 Polk 3.9 66 Mississippi 4.718 Crawford 3.3 42 Prairie 3.9 66 Union 4.718 Hot Spring 3.3 45 Baxter 4.0 70 Ashley 4.918 Lawrence 3.3 45 Conway 4.0 70 Van Buren 4.918 Sebastian 3.3 45 Dallas 4.0 72 Jackson 5.023 Clark 3.4 45 Pope 4.0 73 Izard 5.323 Logan 3.4 45 White 4.0 74 Phillips 5.725 Scott 3.5 50 Clay 4.1 75 Chicot 6.2
ArkansasLabor Market
November
Benton Carroll Fulton ClayBoone Randolph
Marion Baxter
SharpIzard Greene
Madison LawrenceWashingtonNewton Searcy
Stone Craighead MississippiIndependence
Crawford Johnson Van Buren JacksonFranklin Cleburne Poinsett
Pope
Conway CrossWhiteSebastian Logan Crittenden
Faulkner Woodruff
Yell St. FrancisPerry
Scott PrairiePulaski Lonoke Lee
Saline Monroe
Montgomery GarlandPolk
Phillips
Hot Spring Grant Jefferson Arkansas
PikeHowardClark
Sevier Dallas LincolnCleveland
Desha
Little RiverHempstead NevadaOuachita Calhoun Drew
Bradley
MillerColumbia Chicot
Union AshleyLafayette
w 19
Local Workforce Development Areas
Civilian Labor Force EstimatesLWDA Labor Force Estimates (Not Seasonally Adjusted)
LWDANovember
2017 Emp Unemp
Rate CLF
October 2017 Emp Unemp
Rate November 2016
CLF Emp Unemp Rate Central (minus 249,752 242,175 7,577 3.0 253,051 245,617 7,434 2.9 244,971 237,352 7,619 3.1City of Little 97,468 94,524 2,944 3.0 98,783 95,846 2,937 3.0 95,556 92,572 2,984 3.1Eastern 47,514 45,540 1,974 4.2 47,980 46,049 1,931 4.0 47,811 45,775 2,036 4.3North Central 94,918 90,952 3,966 4.2 95,731 91,914 3,817 4.0 94,219 89,968 4,251 4.5Northeast 121,966 117,921 4,045 3.3 123,256 119,315 3,941 3.2 119,633 115,292 4,341 3.6Northwest 323,611 314,962 8,649 2.7 327,594 319,139 8,455 2.6 313,017 304,821 8,196 2.6Southeast 82,167 78,688 3,479 4.2 83,435 80,057 3,378 4.0 82,547 78,876 3,671 4.4Southwest 93,762 90,004 3,758 4.0 94,679 90,979 3,700 3.9 93,400 89,538 3,862 4.1West Central 133,221 128,270 4,951 3.7 134,767 129,868 4,899 3.6 130,675 125,575 5,100 3.9Western 114,003 110,163 3,840 3.4 115,092 111,336 3,756 3.3 112,671 108,899 3,772 3.3
Central (minus
LR) Eastern
North Central
Northeast
Northwest
Southeast
Southwest
West
Central
Western