Embed Size (px)
Citation preview
Slide [email protected] 11 June 12
Could Russia Dominate Commercial Uranium Enrichment?
Center for Strategic & International Studies 1800 K Street NW, Washington, DC
11 June 2012
Geoffrey Rothwell, PhD Department of Economics, Stanford University
under contract to the Pacific Northwest National Laboratory with DOE-NA through Battelle in Richland, Washington
Slide [email protected] 11 June 12
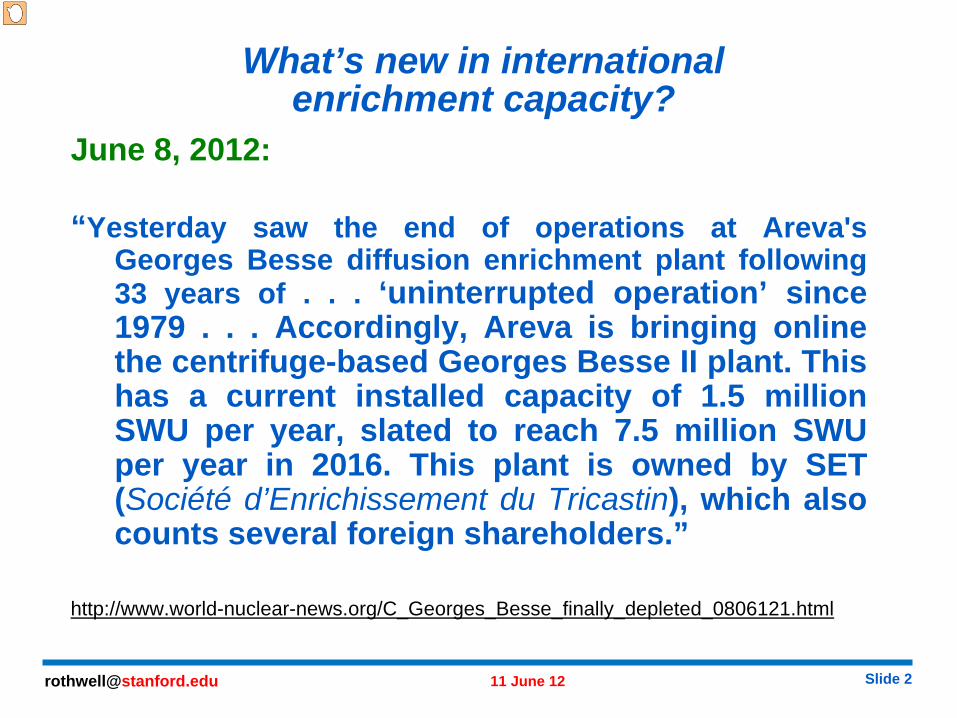
What’s new in international enrichment capacity?
June 8, 2012:
“Yesterday saw the end of operations at Areva's Georges Besse diffusion enrichment plant following 33 years of . . . ‘uninterrupted operation’ since 1979 . . . Accordingly, Areva is bringing online the centrifuge-based Georges Besse II plant. This has a current installed capacity of 1.5 million SWU per year, slated to reach 7.5 million SWU per year in 2016. This plant is owned by SET (Société d’Enrichissement du Tricastin), which also counts several foreign shareholders.”
http://www.world-nuclear-news.org/C_Georges_Besse_finally_depleted_0806121.html
Slide [email protected] 11 June 12
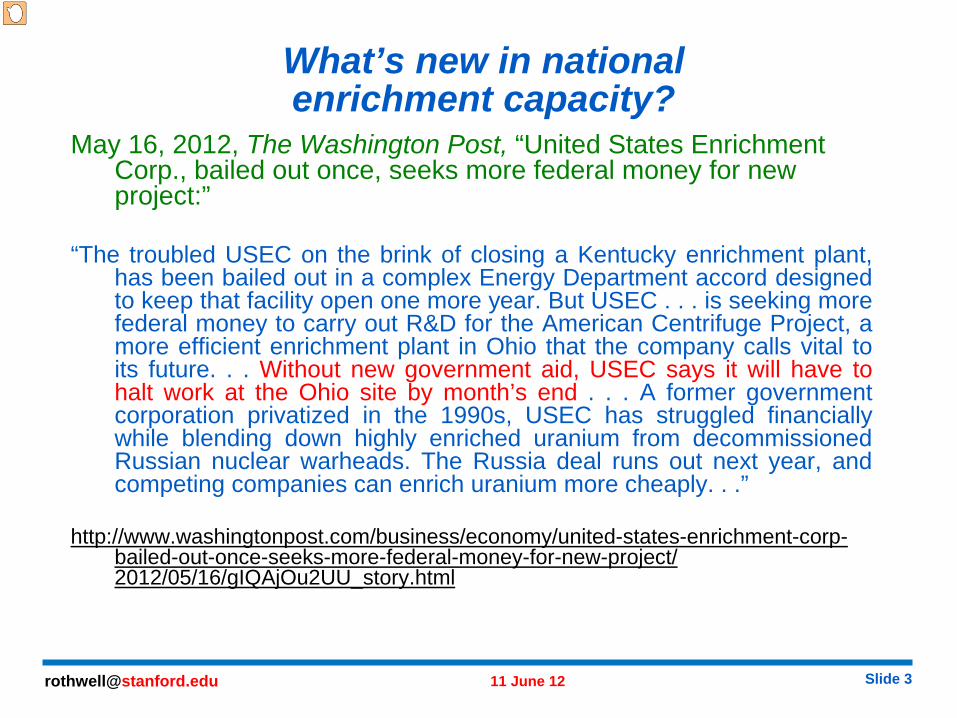
What’s new in national enrichment capacity?
May 16, 2012, The Washington Post, “United States Enrichment Corp., bailed out once, seeks more federal money for new project:”
“The troubled USEC on the brink of closing a Kentucky enrichment plant, has been bailed out in a complex Energy Department accord designed to keep that facility open one more year. But USEC . . . is seeking more federal money to carry out R&D for the American Centrifuge Project, a more efficient enrichment plant in Ohio that the company calls vital to its future. . . Without new government aid, USEC says it will have to halt work at the Ohio site by month’s end . . . A former government corporation privatized in the 1990s, USEC has struggled financially while blending down highly enriched uranium from decommissioned Russian nuclear warheads. The Russia deal runs out next year, and competing companies can enrich uranium more cheaply. . .”
http://www.washingtonpost.com/business/economy/united-states-enrichment-corp- bailed-out-once-seeks-more-federal-money-for-new-project/ 2012/05/16/gIQAjOu2UU_story.html
Slide [email protected] 11 June 12
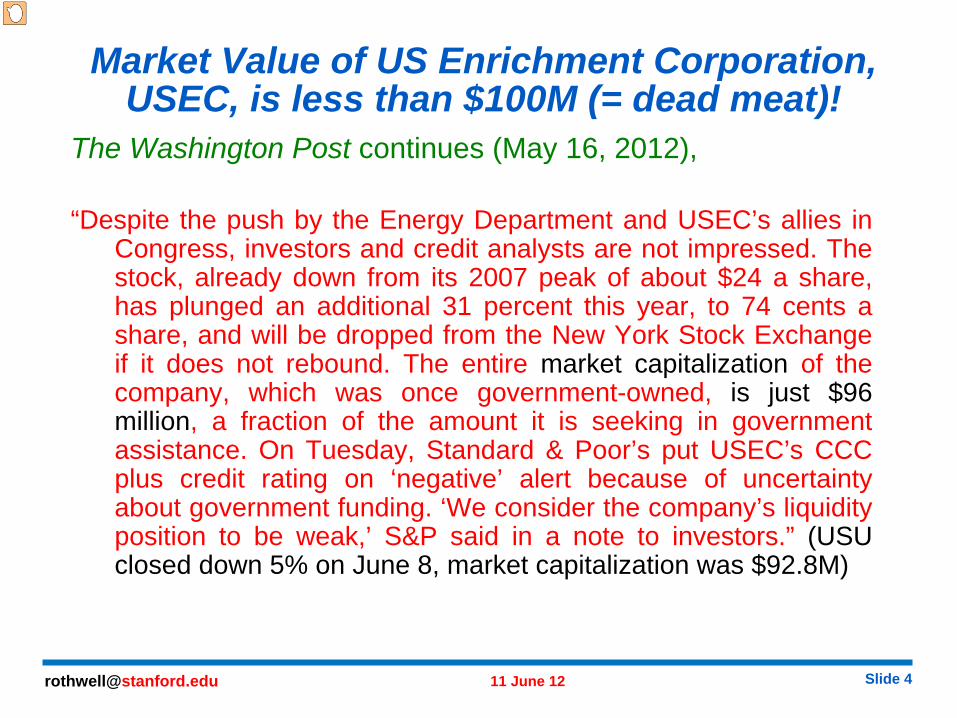
Market Value of US Enrichment Corporation, USEC, is less than $100M (= dead meat)!
The Washington Post continues (May 16, 2012),
“Despite the push by the Energy Department and USEC’s allies in Congress, investors and credit analysts are not impressed. The stock, already down from its 2007 peak of about $24 a share, has plunged an additional 31 percent this year, to 74 cents a share, and will be dropped from the New York Stock Exchange if it does not rebound. The entire market capitalization of the company, which was once government-owned, is just $96 million, a fraction of the amount it is seeking in government assistance. On Tuesday, Standard & Poor’s put USEC’s CCC plus credit rating on ‘negative’ alert because of uncertainty about government funding. ‘We consider the company’s liquidity position to be weak,’ S&P said in a note to investors.” (USU closed down 5% on June 8, market capitalization was $92.8M)
Slide [email protected] 11 June 12
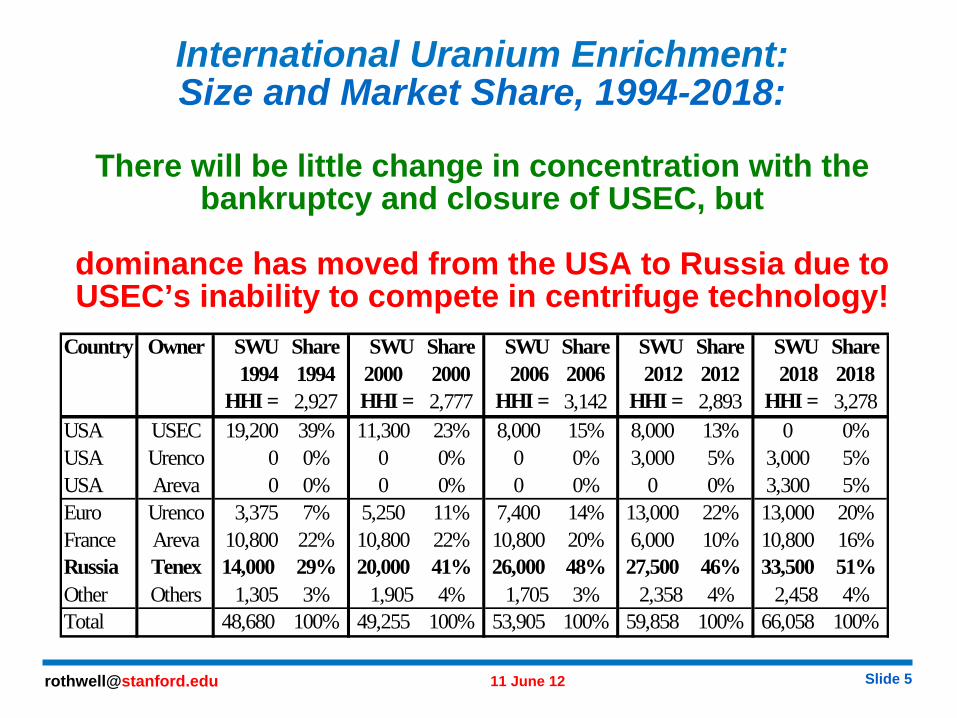
International Uranium Enrichment: Size and Market Share, 1994-2018:
There will be little change in concentration with the bankruptcy and closure of USEC, but
dominance has moved from the USA to Russia due to USEC’s inability to compete in centrifuge technology!
Country Owner SWU Share SWU Share SWU Share SWU Share SWU Share1994 1994 2000 2000 2006 2006 2012 2012 2018 2018
HHI = 2,927 HHI = 2,777 HHI = 3,142 HHI = 2,893 HHI = 3,278USA USEC 19,200 39% 11,300 23% 8,000 15% 8,000 13% 0 0%USA Urenco 0 0% 0 0% 0 0% 3,000 5% 3,000 5%USA Areva 0 0% 0 0% 0 0% 0 0% 3,300 5%Euro Urenco 3,375 7% 5,250 11% 7,400 14% 13,000 22% 13,000 20%France Areva 10,800 22% 10,800 22% 10,800 20% 6,000 10% 10,800 16%Russia Tenex 14,000 29% 20,000 41% 26,000 48% 27,500 46% 33,500 51%Other Others 1,305 3% 1,905 4% 1,705 3% 2,358 4% 2,458 4%Total 48,680 100% 49,255 100% 53,905 100% 59,858 100% 66,058 100%
Slide [email protected] 11 June 12
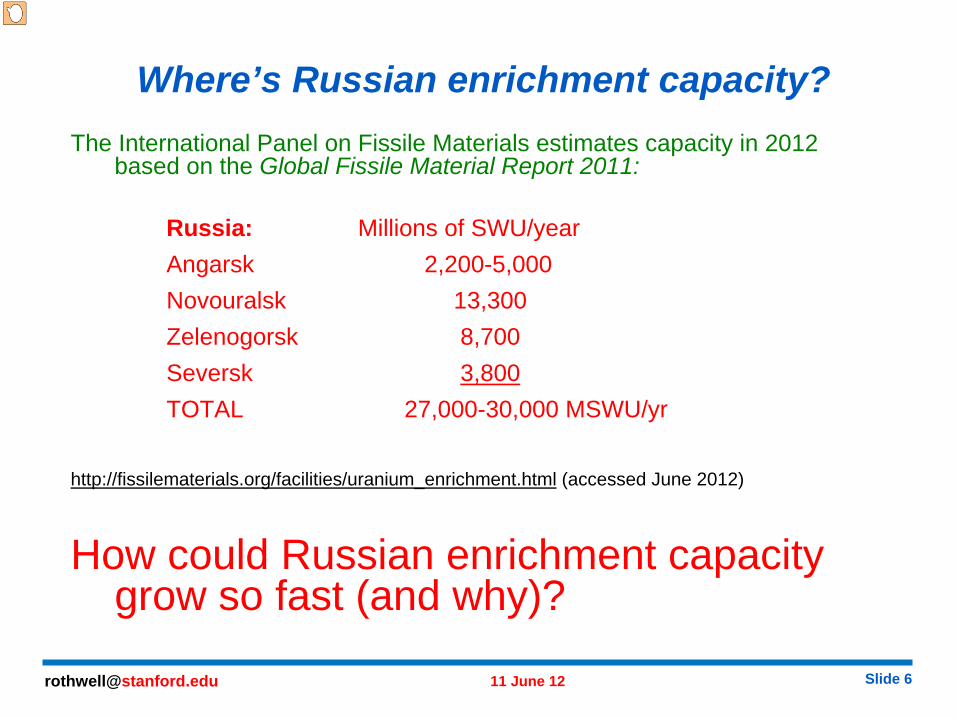
Where’s Russian enrichment capacity?The International Panel on Fissile Materials estimates capacity in 2012
based on the Global Fissile Material Report 2011:
Russia: Millions of SWU/yearAngarsk 2,200-5,000 Novouralsk 13,300 Zelenogorsk 8,700 Seversk 3,800TOTAL 27,000-30,000 MSWU/yr
http://fissilematerials.org/facilities/uranium_enrichment.html (accessed June 2012)
How could Russian enrichment capacity grow so fast (and why)?
Slide [email protected] 11 June 12
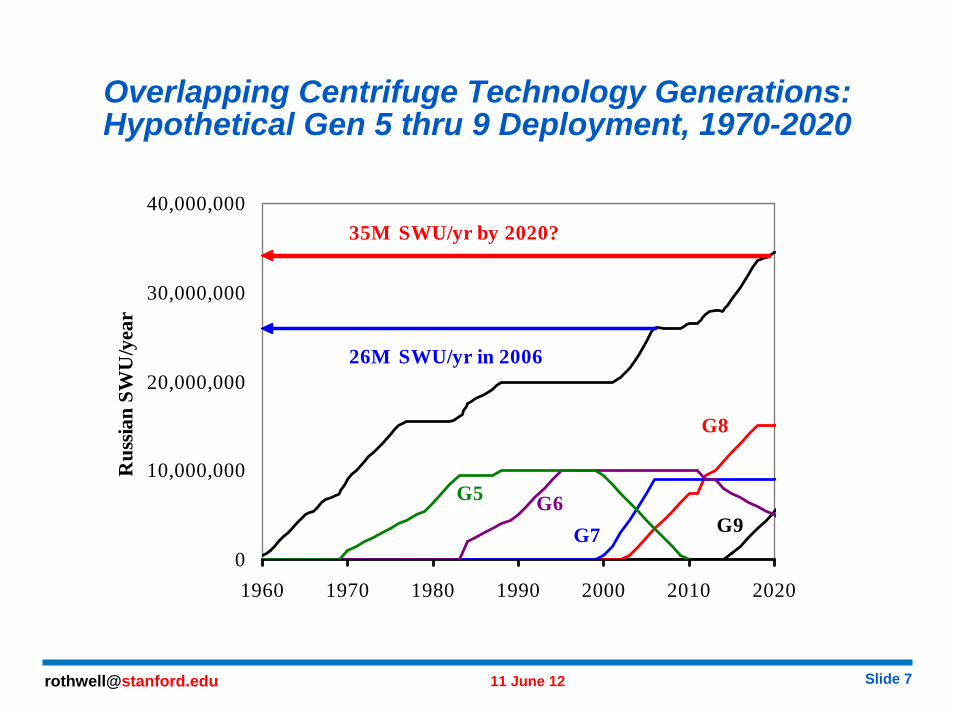
Overlapping Centrifuge Technology Generations: Hypothetical Gen 5 thru 9 Deployment, 1970-2020
0
10,000,000
20,000,000
30,000,000
40,000,000
1960 1970 1980 1990 2000 2010 2020
Rus
sian
SWU
/yea
r
G7
G8
G9
26M SWU/yr in 2006
35M SWU/yr by 2020?
G6G5
Slide [email protected] 11 June 12
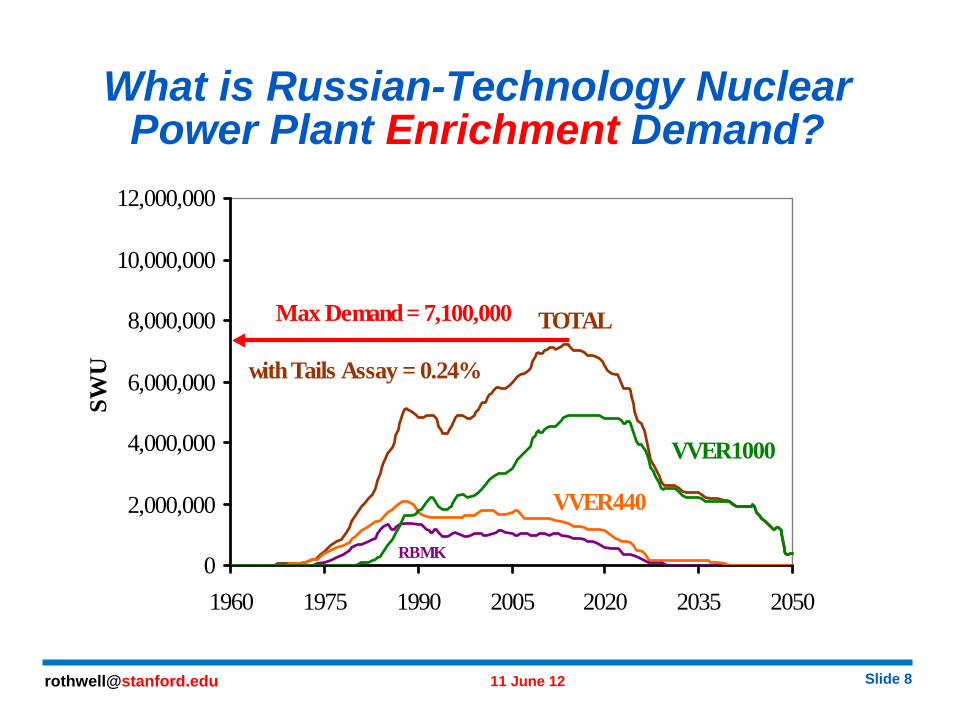
What is Russian-Technology Nuclear Power Plant Enrichment Demand?
0
2,000,000
4,000,000
6,000,000
8,000,000
10,000,000
12,000,000
1960 1975 1990 2005 2020 2035 2050
SWU
RBMK
VVER440
VVER1000
TOTAL
with Tails Assay = 0.24%
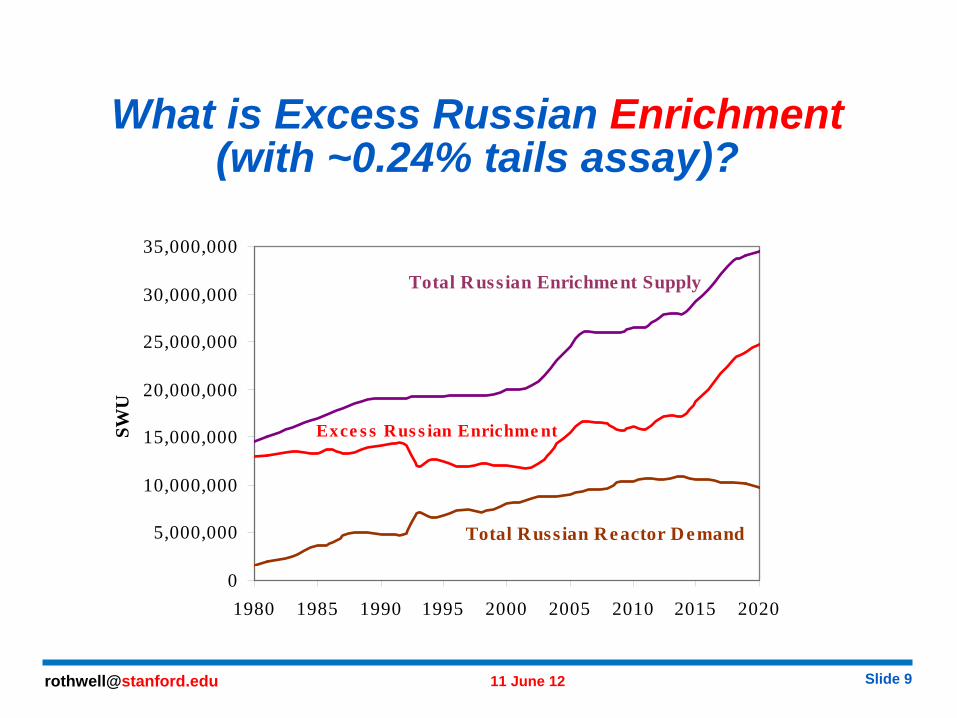
Max Demand = 7,100,000
Slide [email protected] 11 June 12
What is Excess Russian Enrichment (with ~0.24% tails assay)?
0
5,000,000
10,000,000
15,000,000
20,000,000
25,000,000
30,000,000
35,000,000
1980 1985 1990 1995 2000 2005 2010 2015 2020
SWU
Total Russian Enrichment Supply
Total Russian Reactor Demand
Exce s s Rus s ian Enrichme nt
Slide [email protected] 11 June 12
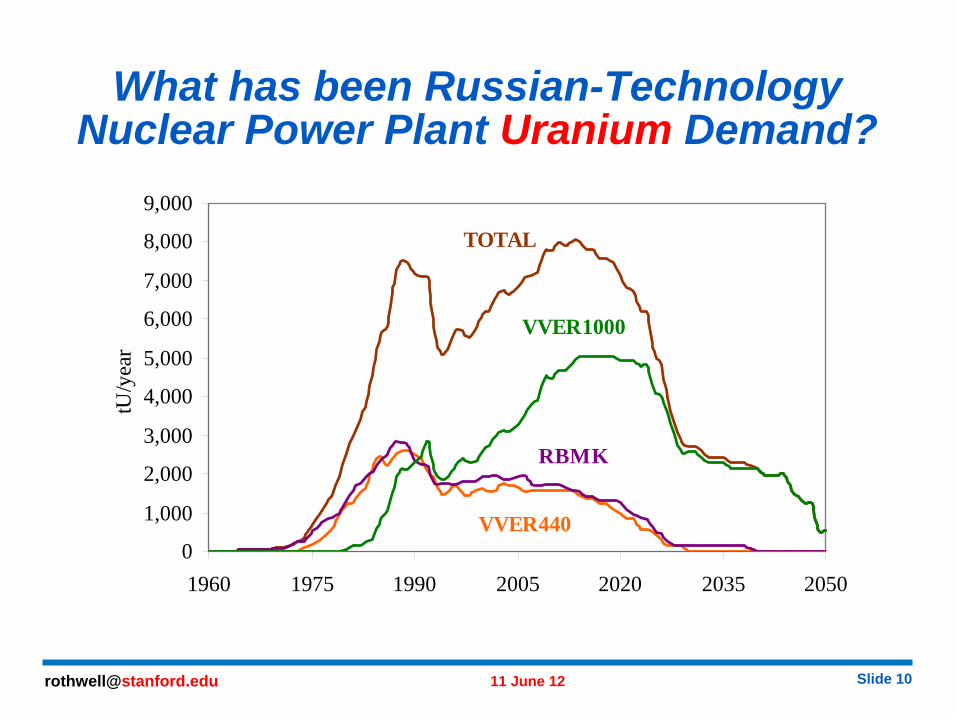
What has been Russian-Technology Nuclear Power Plant Uranium Demand?
0
1,000
2,000
3,000
4,000
5,000
6,000
7,000
8,000
9,000
1960 1975 1990 2005 2020 2035 2050
tU/y
ear
VVER440
RBMK
VVER1000
TOTAL
Slide [email protected] 11 June 12
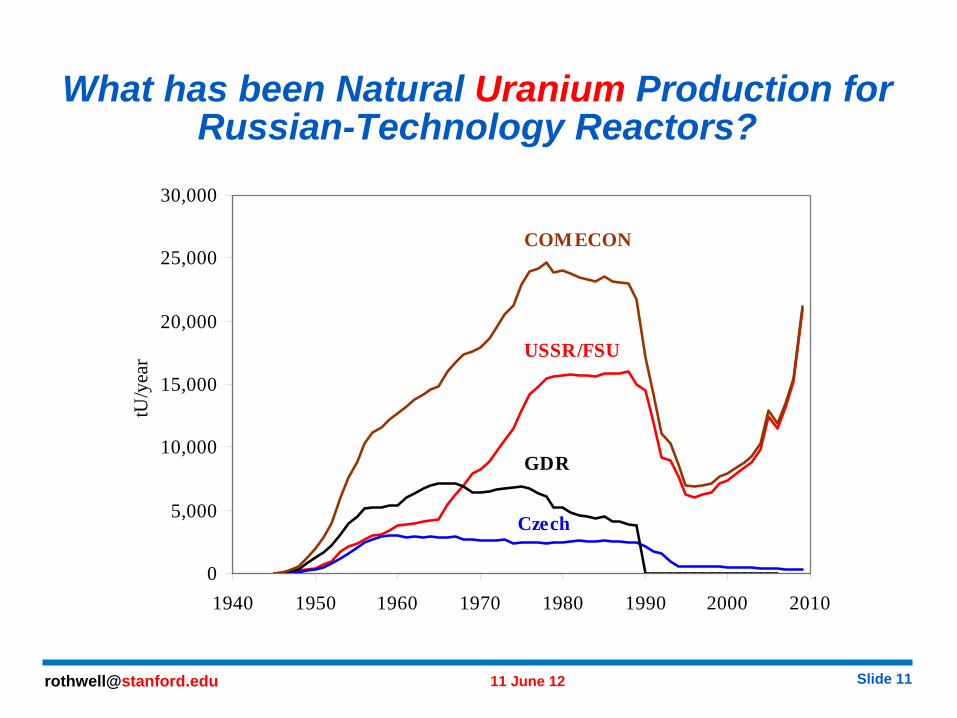
What has been Natural Uranium Production for Russian-Technology Reactors?
0
5,000
10,000
15,000
20,000
25,000
30,000
1940 1950 1960 1970 1980 1990 2000 2010
tU/y
ear
COMECON
USSR/FSU
GDR
Czech
Slide [email protected] 11 June 12
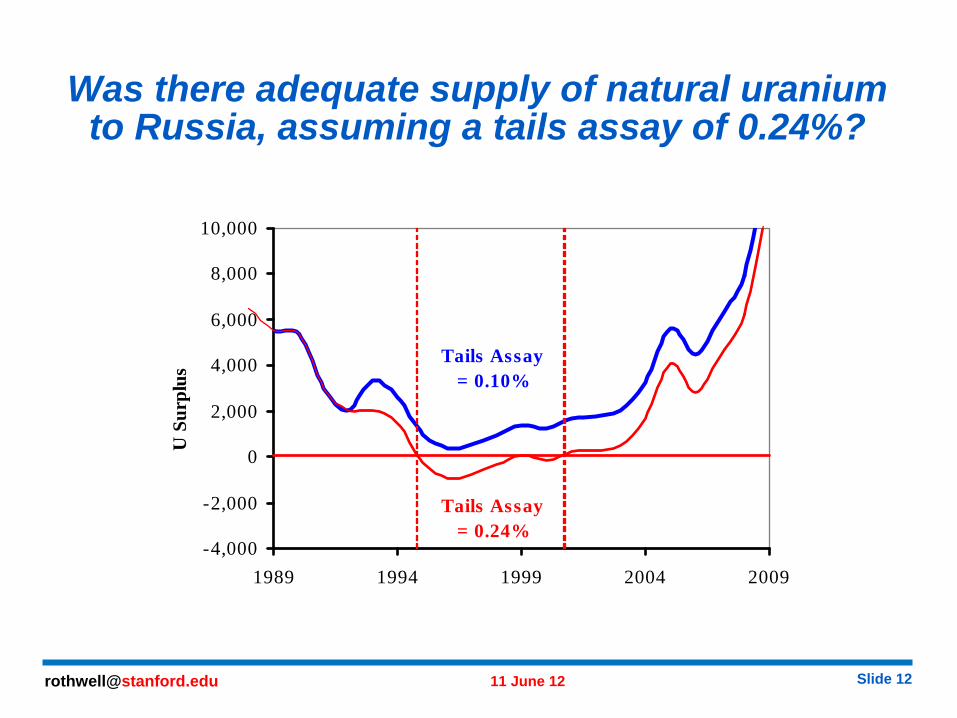
Was there adequate supply of natural uranium to Russia, assuming a tails assay of 0.24%?
-4,000
-2,000
0
2,000
4,000
6,000
8,000
10,000
1989 1994 1999 2004 2009
U S
urpl
us
Tails Assay = 0.24%
Tails Assay = 0.10%
Slide [email protected] 11 June 12
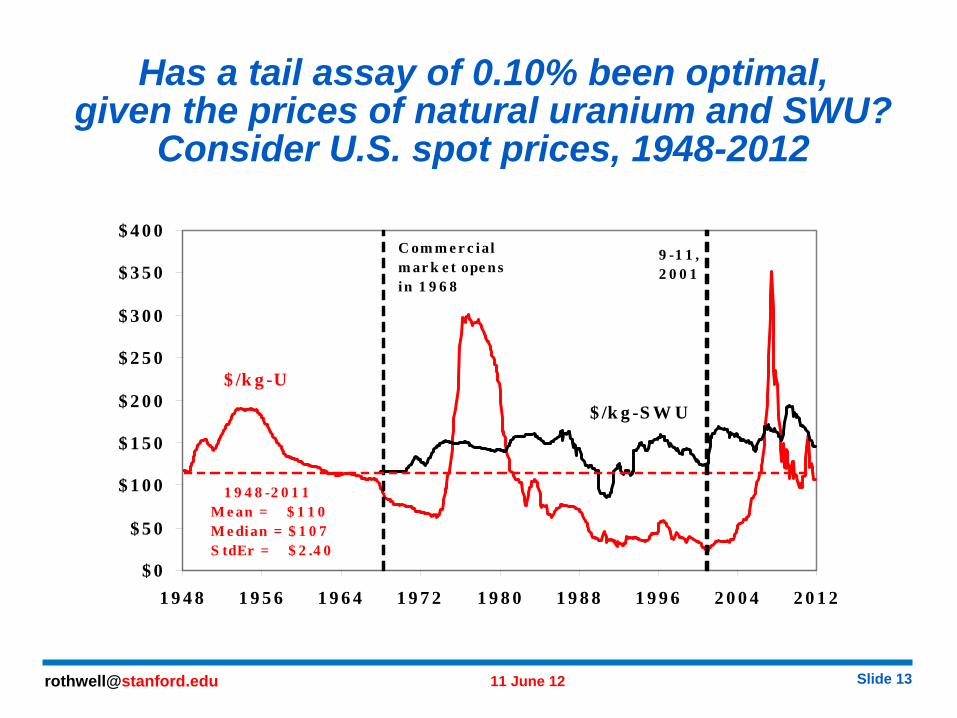
Has a tail assay of 0.10% been optimal, given the prices of natural uranium and SWU?
Consider U.S. spot prices, 1948-2012
$ 0
$ 5 0
$ 1 0 0
$ 1 5 0
$ 2 0 0
$ 2 5 0
$ 3 0 0
$ 3 5 0
$ 4 0 0
1 9 4 8 1 9 5 6 1 9 6 4 1 9 7 2 1 9 8 0 1 9 8 8 1 9 9 6 2 0 0 4 2 0 1 2
$ /k g -U
$ /k g -S W U
C om m e r c ial m ar k e t ope n s in 1 9 6 8
1 9 4 8 -2 0 1 1M e an = $ 1 1 0M e dian = $ 1 0 7S tdEr = $ 2 .4 0
9 -1 1 , 2 0 0 1
Slide [email protected] 11 June 12
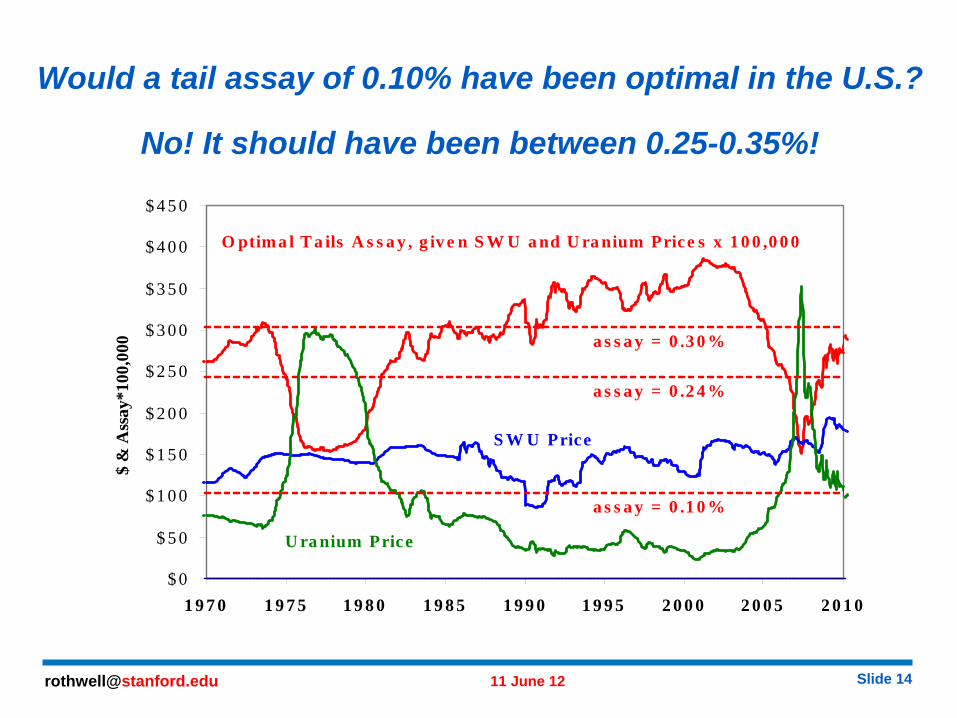
Would a tail assay of 0.10% have been optimal in the U.S.?
No! It should have been between 0.25-0.35%!
$ 0
$ 5 0
$ 1 0 0
$ 1 5 0
$ 2 0 0
$ 2 5 0
$ 3 0 0
$ 3 5 0
$ 4 0 0
$ 4 5 0
1 9 7 0 1 9 7 5 1 9 8 0 1 9 8 5 1 9 9 0 1 9 9 5 2 0 0 0 2 0 0 5 2 0 1 0
$ &
Ass
ay*1
00,0
00
S W U Price
U ra nium Price
O ptim a l T a ils A s s a y , g iv e n S W U a nd U ra nium Price s x 1 0 0 ,0 0 0
a s s a y = 0 .1 0 %
a s s a y = 0 .2 4 %
a s s a y = 0 .3 0 %
Slide [email protected] 11 June 12
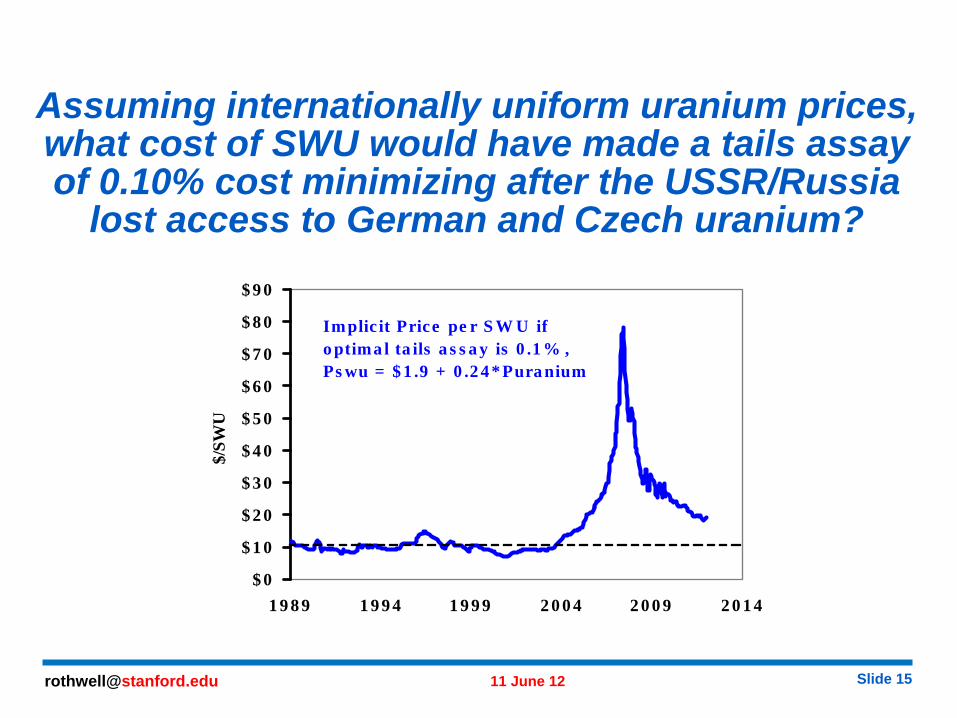
Assuming internationally uniform uranium prices, what cost of SWU would have made a tails assay of 0.10% cost minimizing after the USSR/Russia
lost access to German and Czech uranium?
$ 0
$ 1 0
$ 2 0
$ 3 0
$ 4 0
$ 5 0
$ 6 0
$ 7 0
$ 8 0
$ 9 0
1 9 8 9 1 9 9 4 1 9 9 9 2 0 0 4 2 0 0 9 2 0 1 4
$/SW
U
Implic it Price pe r S W U ifo ptima l ta ils a s s a y is 0 .1 % ,Ps wu = $ 1 .9 + 0 .2 4 * Pura nium
Slide [email protected] 11 June 12
Changes in assumptions in enrichment cost model from Rothwell, “Market Power in Uranium Enrichment,”
Science & Global Security (2009).
(1) Investment in capacity before 1989 (USSR) is written off
(2) Cost of new centrifuge capacity in Russia is half the cost of new capacity in Western Europe and the U.S.
(3) Annual burdened wage rate is $30,000 outside of Moscow and $60,000 inside Moscow
Slide [email protected] 11 June 12
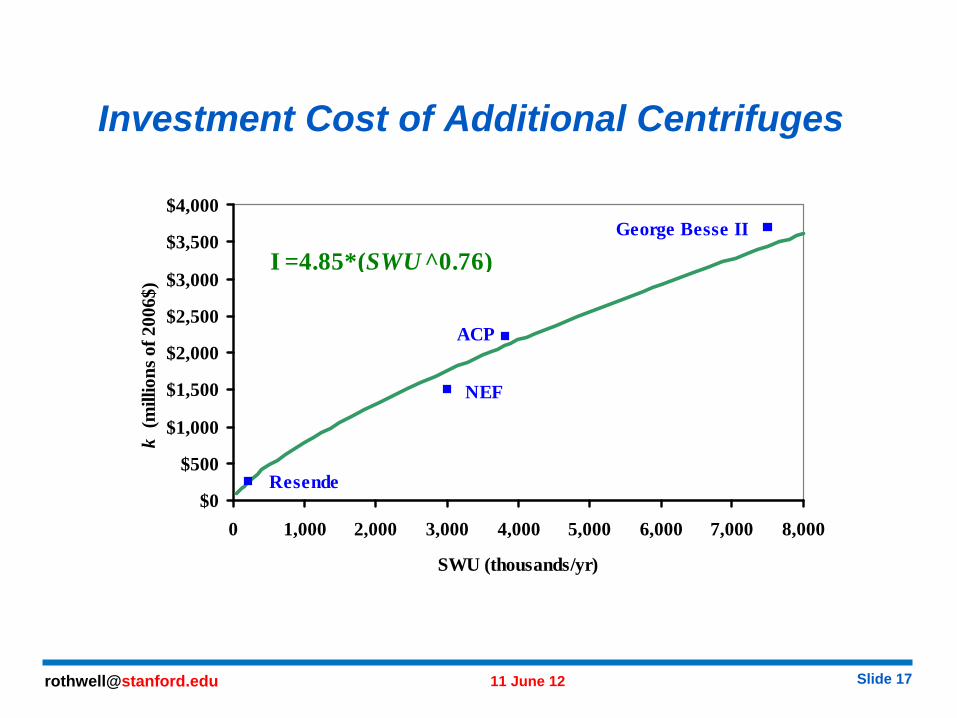
Investment Cost of Additional Centrifuges
$0
$500
$1,000
$1,500
$2,000
$2,500
$3,000
$3,500
$4,000
0 1,000 2,000 3,000 4,000 5,000 6,000 7,000 8,000
SWU (thousands/yr)
k (m
illio
ns o
f 200
6$)
George Besse II
ACP
NEF
Resende
I =4.85*(SWU ^0.76)
Slide [email protected] 11 June 12
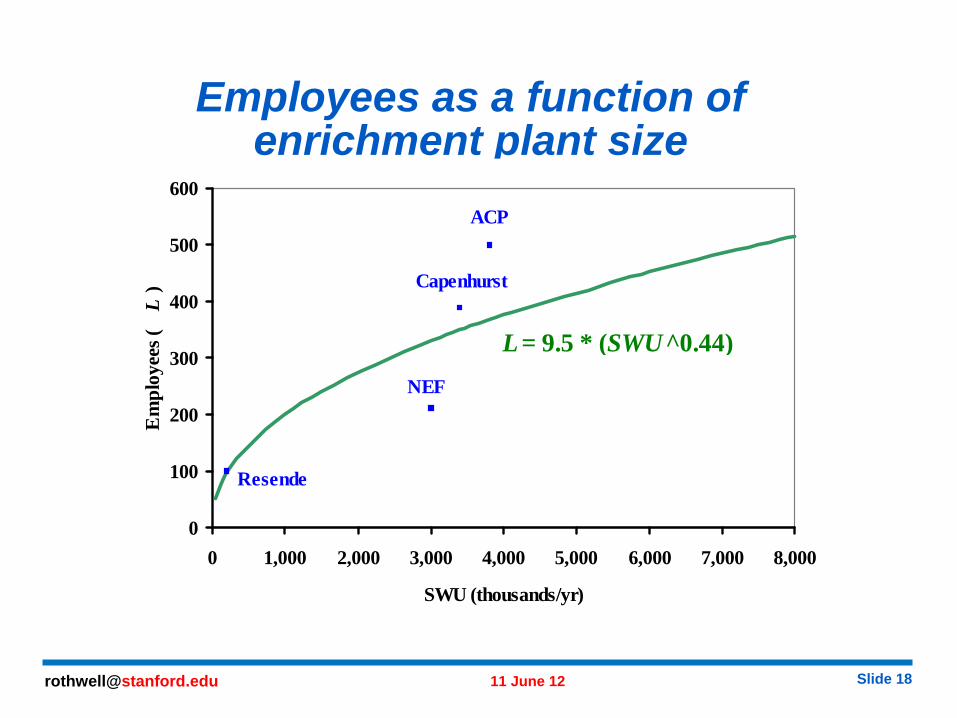
Employees as a function of enrichment plant size
0
100
200
300
400
500
600
0 1,000 2,000 3,000 4,000 5,000 6,000 7,000 8,000
SWU (thousands/yr)
Em
ploy
ees (
L)
Resende
NEF
ACP
Capenhurst
L= 9.5 * (SWU^0.44)
Slide [email protected] 11 June 12
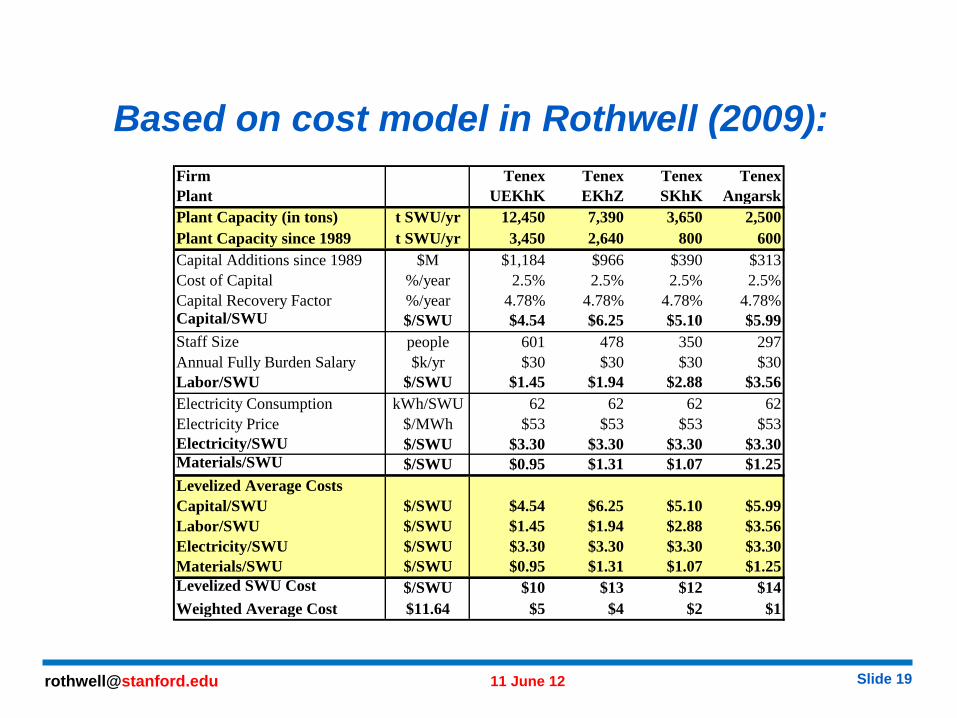
Based on cost model in Rothwell (2009): Firm Tenex Tenex Tenex TenexPlant (2008$) UEKhK EKhZ SKhK AngarskPlant Capacity (in tons) t SWU/yr 12,450 7,390 3,650 2,500Plant Capacity since 1989 t SWU/yr 3,450 2,640 800 600Capital Additions since 1989 $M $1,184 $966 $390 $313Cost of Capital %/year 2.5% 2.5% 2.5% 2.5%Capital Recovery Factor %/year 4.78% 4.78% 4.78% 4.78%Capital/SWU (K/SWU) $/SWU $4.54 $6.25 $5.10 $5.99Staff Size ( L ) people 601 478 350 297Annual Fully Burden Salary $k/yr $30 $30 $30 $30Labor/SWU $/SWU $1.45 $1.94 $2.88 $3.56Electricity Consumption kWh/SWU 62 62 62 62Electricity Price $/MWh $53 $53 $53 $53Electricity/SWU (E/SWU) $/SWU $3.30 $3.30 $3.30 $3.30Materials/SWU (M/SWU) $/SWU $0.95 $1.31 $1.07 $1.25Levelized Average CostsCapital/SWU $/SWU $4.54 $6.25 $5.10 $5.99Labor/SWU $/SWU $1.45 $1.94 $2.88 $3.56Electricity/SWU $/SWU $3.30 $3.30 $3.30 $3.30Materials/SWU $/SWU $0.95 $1.31 $1.07 $1.25Levelized SWU Cost (AC ) $/SWU $10 $13 $12 $14Weighted Average Cost $11.64 $5 $4 $2 $1
Slide [email protected] 11 June 12
Assuming uranium prices to be international, a cost of SWU of approximately $12
would have yielded an optimal tails assay of 0.10%
(1) Average enrichment costs across the TENEX enrichment enterprise could have been as low as $11.64/SWU in Russia between 1989 and 2004. Since 2004, centrifuge costs and wages could have increased, however, profits appear to be very high and can maintain investment in yet higher efficiency (supercritical?) centrifuges.(2) TENEX could have lowered its tails assay to 0.10% to avoid purchasing natural uranium to satisfy Russian fuel contracts. They used their extra SWU to mine the half billion tons of uranium tails stored at their enrichment sites and retiring capacity to reenriched reprocessed uranium.
Slide [email protected] 11 June 12
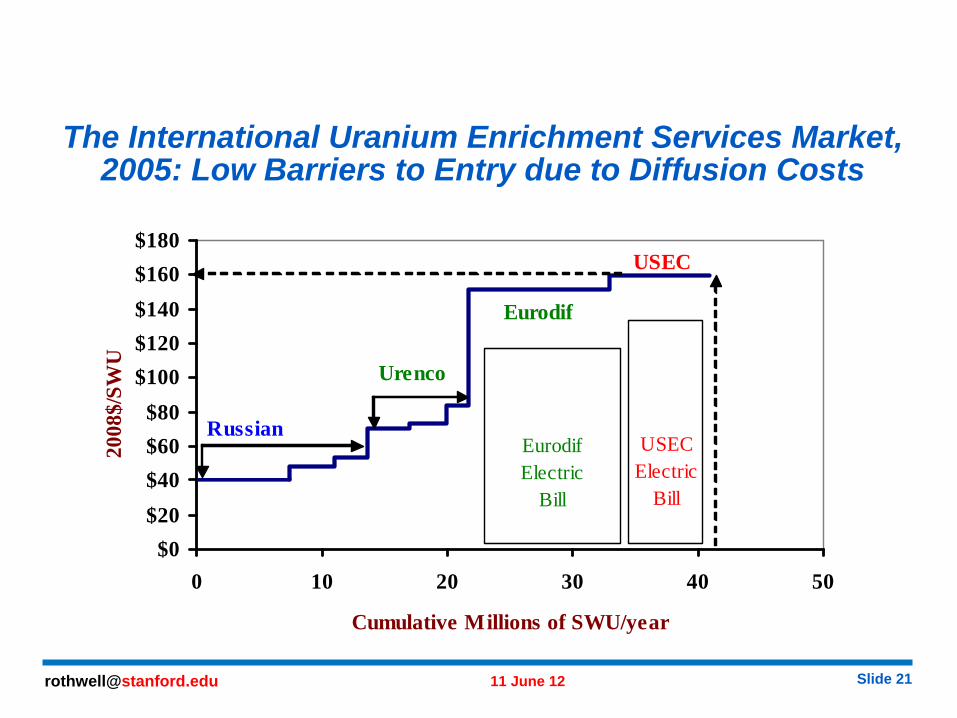
The International Uranium Enrichment Services Market, 2005: Low Barriers to Entry due to Diffusion Costs
$0$20$40$60$80
$100$120$140$160$180
0 10 20 30 40 50
Cumulative Millions of SWU/year
2008
$/SW
U
EurodifElectric
Bill
USECElectric
Bill
Russian
Urenco
Eurodif
USEC
Slide [email protected] 11 June 12
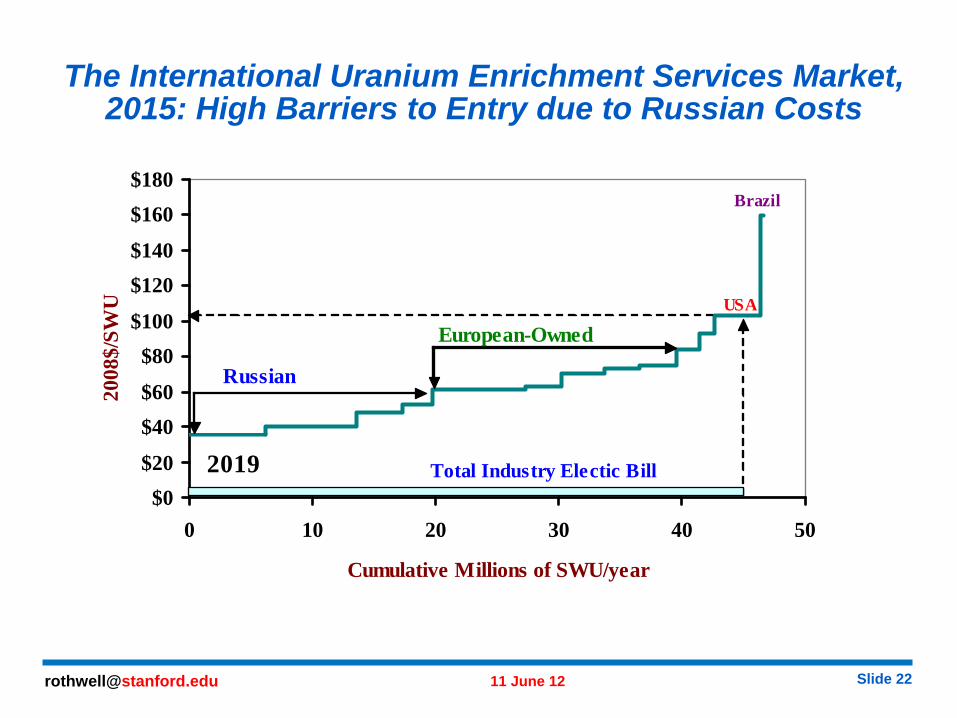
The International Uranium Enrichment Services Market, 2015: High Barriers to Entry due to Russian Costs
$0$20
$40$60
$80$100
$120$140
$160$180
0 10 20 30 40 50
Cumulative Millions of SWU/year
2008
$/SW
U
2019
USA
Brazil
Total Industry Electic Bill
Russian
European-Owned
Slide [email protected] 11 June 12
Could TENEX Dominate the Low Enriched Uranium Enrichment Services Market?
(1) Although centrifuge costs could have risen in the last 10 years in Russia, centrifuge manufacturing labor is still probably much cheaper than in Western Europe (there will NEVER be any centrifuge manufacturing in the U.S. because TENEX will always be cheaper).(2) TENEX has a huge excess capacity that could be dumped on the international market as soon as TENEX is able to sign up customers (or Russia is able to sell more reactors). USEC will NEVER be able to compete with Russian enrichment and will declare bankrupcy soon.(3) This huge Russian excess capacity in enrichment services, given the decrease in demand from Japan and German after Fukushima, should DISCOURAGE ALL NEW ENTRY, e.g., by Korea.
Slide [email protected] 11 June 12
REFERENCES
Bukharin, O. “Understanding Russia’s Uranium Enrichment Complex,” Science & Global Security 12: 193-218 (2004).
Rothwell, G.S. “Market Power in Uranium Enrichment,” Science & Global Security 17: 132-154 (2009).
Podvig, P. “History of Highly Enriched Uranium Production in Russia,” Science & Global Security 19: 46-67 (2011).
International Panel on Fissile Materials. Global Fissile Material Report 2011: Nuclear Weapons and Fissile Material Stockpiles and Production. www.fissilematerials.org

![Arizona State University€¦ · Web view[Put org name here] 2018-19 STRATEGIC PLAN [Put org name here] 2018-19 STRATEGIC PLAN [Put org name here] 2018-19 STRATEGIC …](https://img.pdfslide.us/doc/110x75/5f566800aa76784ede6176f9/arizona-state-university-web-view-put-org-name-here-2018-19-strategic-plan-put.jpg)