Embed Size (px)
Citation preview
HUNGERCOUNTA comprehensive report on hunger and food bank use in Canada, and recommendations for change
Food BanksCanada 20
11

2 • FOOD BANKS CANADA
Executive Summary ........................................................... 2
SECTION 1
Food bank use remains at recessionary levels ........ 4
1.1 Food bank use before and after the recession ..... 5
1.2 Age, family type, Aboriginal identity ...................... 6
1.3 Income ............................................................................... 8
1.4 Housing ............................................................................. 9
SECTION 2
Reducing the need for food banks in Canada ....... 10
Recommendations ............................................................. 12
SECTION 3
Detailed provincial findings .......................................... 17
Map: Food bank use in Canada by the numbers ..... 18
British Columbia .................................................................20
Alberta .................................................................................... 21
Saskatchewan .......................................................................22
Manitoba ...............................................................................23
Ontario ...................................................................................24
Quebec ...................................................................................25
New Brunswick ....................................................................26
Nova Scotia ...........................................................................27
Prince Edward Island..........................................................28
Newfoundland & Labrador ............................................29
SECTION 4
References ............................................................................30
Methodology ......................................................................32
Acknowledgements .........................................................33
About Food Banks Canada
Food Banks Canada is the national charitable organization representing and supporting the food bank
community across Canada. Our Members and their respective agencies serve approximately 85% of people
accessing food banks and food programs nationwide. Our mission is to help food banks meet the short-
term need for food, and to find long-term solutions to hunger. Please visit www.foodbankscanada.ca
for more information.
To obtain more information from the HungerCount survey, including multi-year tables and data not included in this report, please visit www.foodbankscanada.ca/HungerCount.
All photos used in this report are stock photography.

HUNGERCOUNT 2011 • 1
851,014 people received food from a food bank in March 2011. This is essentially unchanged from 2010,
and remains 26% above levels experienced before the 2008-2009 recession. It shows that the economic
recovery is in jeopardy, and far too many people continue to struggle to make ends meet. We provide
a snapshot of the problem, identify why Canada still needs food banks, and offer recommendations for
reducing the need.
851,014

2 • FOOD BANKS CANADA
EXECUTIVE SUMMARY
Fifteen months after the end of the
2008-09 recession, food bank use was
essentially unchanged from the same
period in 2010. Almost half of food banks
actually reported an increase in the number
of people they assisted in March 2011,
compared to the year before.
During the HungerCount survey period,
4,188 organizations participated in
collecting information. Their records show
that 93,085 people made the difficult
decision to ask for help from a food bank
for the first time. Requests for help came,
in every province and territory, from a
wide range of Canadians: people with
jobs, on social assistance, and on pensions;
single people and families with children;
renters, homeowners, and the homeless;
those whose families have lived here for
generations, and new Canadians.
Food Banks Canada, in partnership with
provincial associations, food banks, soup
kitchens, and other food programs, has
collected data on the need for charitable
food assistance annually since 1997. This
wealth of information allows us to see that
food bank use increases and decreases
with the health of the economy – for
example, the number of people helped by
food banks decreased steadily during the
economic boom of the mid-2000s, only
to shoot up during the recession, and stay
elevated in the current year.
The HungerCount survey also shows
that while food bank use moves with the
economy, there appears to be a stubborn
limit to how low the need for assistance
can fall. Food banks have been helping
more than 700,000 separate individuals
each month for the better part of a decade,
through good economic times and bad – a
fact of life that the majority of Canadians
find unacceptable.
This report provides a snapshot of
the problem, and offers constructive
recommendations that will improve the
economic health of people assisted by food
banks and drastically reduce the need for
food assistance.
LEVELS OF FOOD BANK USE• 851,014 separate individuals received
food from a food bank in March 2011;
while this is down 2% from 2010, it
remains 26% higher than in 2008 and
is the second highest level of use on
record.
• 93,085 people, or 11% of the total,
received help from a food bank
for the first time during the survey
period.
• In rural areas, 114,122 individuals – or
13% of the national total – received
food from food banks; 10% of them
were being helped for the first time.
• Food banks assisted 2.5% of the
Canadian population in March 2011,
compared to 2.6% in 2010 and 2.0%
in 2008.
• Food bank use in 2011 was 20%
higher than in 2001.
CHARACTERISTICS OF INDIVIDUALS ASSISTED• 38% of those receiving food were
children and youth under age 18.
• 47% were women and girls.
• 4.4% were seniors over age 65, rising
to 5.7% in rural areas.
• 10% self-identified as First Nations,
Métis, or Inuit.
• 11% were immigrants or refugees –
increasing to 18.5% in large cities.
• 4% were postsecondary students.
In March 2011, 851,014 people were assisted by food banks in Canada. Food bank use is 26% higher than
in 2008, and this fact sends a clear message: the effects of the recession are still being felt across the
country. As a result, a near record number of people are unable to afford enough food for themselves
and their families.
Key national findings

HUNGERCOUNT 2011 • 3
EXECUTIVE SUMMARY
Recommendations Low income, whether in the short or long term, is at the root of the persistent need for charitable food assistance in Canada.
Food banks began operating in the early 1980s, near the beginning of a long period of economic transformation that saw major
sectors of the Canadian economy – manufacturing, forestry, farming, fishing, mining – recede as sources of jobs and income. Public
supports for those in economic difficulty have been scaled back, with both social assistance and Employment Insurance becoming
more difficult to get, and providing less to those who are eligible. It has become harder to find and keep a good job, and nearly
impossible to afford even basic food, clothing, and adequate shelter, if one is receiving government assistance for any length of
time. It is an unfortunate reality that food banks have grown, by necessity, to fill the gap.
Our recommendations focus on the need for governments to provide adequate assistance to individuals and families during
times of need, and on how we can better support people to become resilient citizens. They include:
• Increasing federal and provincial support for the construction and rehabilitation of affordable housing, and the creation or
expansion of housing subsidies.
• Working with social assistance beneficiaries and other stakeholders to design an income support system of last resort that
helps our most vulnerable citizens become self-sufficient.
• Ensuring that Canada’s most vulnerable seniors are not left to live in poverty.
• Improving Employment Insurance to better recognize and support Canadians in non-standard forms of employment,
as well as older workers facing permanent layoff from long-tenure positions.
• Prioritizing, at the federal government level, the need to drastically improve the labour market outcomes of
disadvantaged workers.
• Investing in a system of high-quality, affordable, accessible early learning and child care.
CHARACTERISTICS OF HOUSEHOLDS HELPED BY FOOD BANKSThe 851,014 individuals who received food
in March 2011 were members of 349,842
households:
• 40% of these households were
composed of single people living
alone.
• 24% were single-parent families with
children.
• 23% were dual-parent families with
children.
• 12% were couples without children.
Household income came from a variety
of sources:
• 52% reported social assistance as
their primary source of income.
• 18% have earnings from current or
recent employment.
• 13% receive disability-related income
supports.
• 7% live primarily on pension benefits.
• 5% reported having no source of
income.
• 2% reported student loans and
scholarships as their major source of
income.
HOUSING AND FOOD BANK USE• The majority of those helped by food
banks are renters – 66% pay market
rent and 22% live in subsidized
housing.
• Nationally, 7% are homeowners – in
rural areas, this figure rises to 15%.
• 6% are homeless, i.e., living in an
emergency shelter, group home, on
the street, or temporarily with family
or friends.
• 2% live in band-owned housing,
increasing to 5% in rural areas.

4 • FOOD BANKS CANADA
RESULTS:
FOOD BANK USE REMAINS AT RECESSIONARY LEVELSFood bank use is currently 26% higher than it was prior to the onset of the recession, and is nearly unchanged from 2010 – the year that saw the highest level of food bank use on record. In March 2011, 851,014 people received food from a food bank in Canada. This section explores the situation of the people behind that number.

HUNGERCOUNT 2011 • 5
851,014 separate individuals were assisted
by a food bank in Canada in March 2011.
This figure is 2% lower than 2010 levels
– essentially unchanged – and remains
26% higher than in March 2008. It is also
the second highest level of food bank use
on record.
In March 2011, during the HungerCount
survey period:
• 93,085 people, or 10.9% of those
who received food, turned to a food
bank for the first time;
• 114,122 people (13% of the total) were
assisted by food banks in rural areas;1
• 49% of food banks reported an
increase in the number of people
helped compared to 2010;
• 77% of food banks reported that
food bank use in 2011 was higher
than in 2008.
The infographic below denotes the
number of individuals assisted by food
banks in the month of March, from 2001
to 2011. It also shows unemployment levels
for each year. This graph demonstrates
that the need for food banks changes in
near lockstep with the overall health of
the economy: after several years of decline
during the period of economic growth and
decreasing unemployment in the mid-
2000s, food bank use shot up as a result of
the recession, and has remained elevated in
subsequent years.
Canadian food banks provided help to
2.5% of the Canadian population in March,
compared to 2.3% in 2001, 2.0% in 2008,
and 2.6% in 2010.2
(For more information on levels of food
bank use, including data back to 1997, visit
www.foodbankscanada.ca/HungerCount.)
1.1 Food bank use before and after the recession
Number of People Assisted by Food Banks in Canada2001-2011
MARCH OF EACH YEAR
20022001 2003 2004 2005 2006 2007 2008 2009 2010 2011
800,
000
1,00
0,00
060
0,00
040
0,00
020
0,00
0
# OF
PEO
PLE
ASS
ISTE
D
24
68
UNEM
PLOY
MEN
T R
ATE
(%)
Unemployment
rate
# of children under 18 assisted
# of adults 18-64 assisted
# of seniors 65+ assisted
RESULTS: FOOD BANK USE 1

6 • FOOD BANKS CANADA
A SNAPSHOT OF PEOPLE HELPED BY FOOD BANKS
Food banks provide assistance to a wide
range of individuals and families. The
following provides a summary of some of
the key characteristics of those helped in
March 2011.
CHILDREN AND YOUTHAs has been the case for many years, more
than a third (38%) of people receiving
assistance from food banks in Canada are
children and youth under age 18. The
number of children and youth assisted
varies across the country, with British
Colombia and Nova Scotia serving the
lowest proportion of young people – who
nevertheless account for nearly a third of
the total – and Manitoba (50%) serving
the highest.
SENIORSAt the other end of the spectrum, 4.4% of
those assisted in March 2011 were over age
65. This figure increases slightly to 5.7%
in rural areas.3 Because the HungerCount
survey does not, for the most part,
collect information from subsidized meal
delivery services targeted to seniors, it is
likely that the need for assistance among
this population is higher than these
figures suggest.
Table 1 presents the total number of
individuals assisted by food banks in each
province for 2008, 2010, and 2011, as
well as the percentage of those assisted
in March 2011 who were under 18 years
of age. (For more detailed information at
the provincial level, please see section 3,
Detailed Provincial Findings.)
Of the 851,014 individuals assisted by food banks in March 2011:• 38% were under age 18;• 47% were women;• 4.4% were senior citizens age 65 and over;• 10% self-identified as First Nations, Métis, or Inuit in Canada overall;• 24% of those helped self-identified as First Nations, Métis, or Inuit in the four
western provinces;• 11.4% were recent immigrants or refugees in Canada overall;• 18.5% were immigrants or refugees in cities with populations of at least 300,000.
1.2 Age, family type, Aboriginal identity
TABLE 1: FOOD BANK USE IN CANADA, BY PROVINCE
Province/Territory Total Assisted, March 2011
Percent Children, March 2011
Total Assisted, March 2010
Total Assisted, March 2008
% Change, 2010-2011
% Change, 2008-2011
British Columbia 90,193 31.7% 94,359 78,101 -4.4% 15.5%
Alberta 58,735 43.7% 59,311 33,580 -1.0% 74.9%
Saskatchewan 20,665 43.0% 22,662 17,751 -8.8% 16.4%
Manitoba 55,575 50.4% 57,966 40,464 -4.1% 37.3%
Ontario 395,106 37.5% 402,056 314,258 -1.7% 25.7%
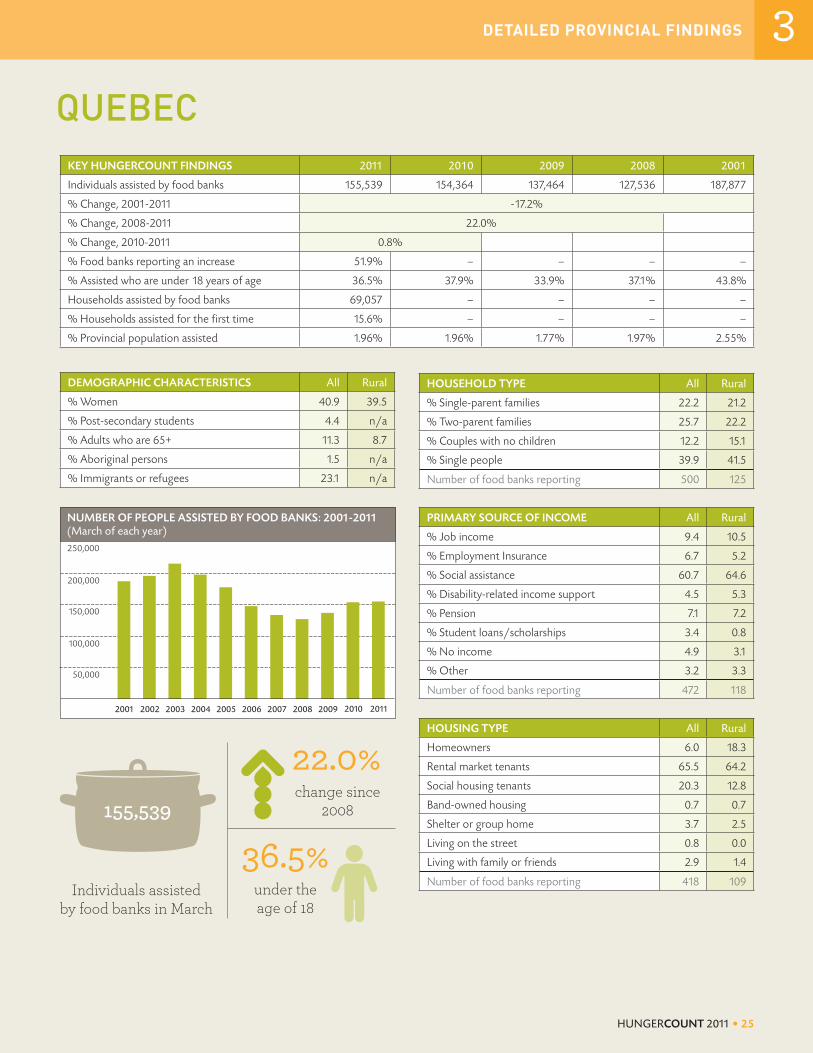
Quebec 155,539 36.5% 154,364 127,536 0.8% 22.0%
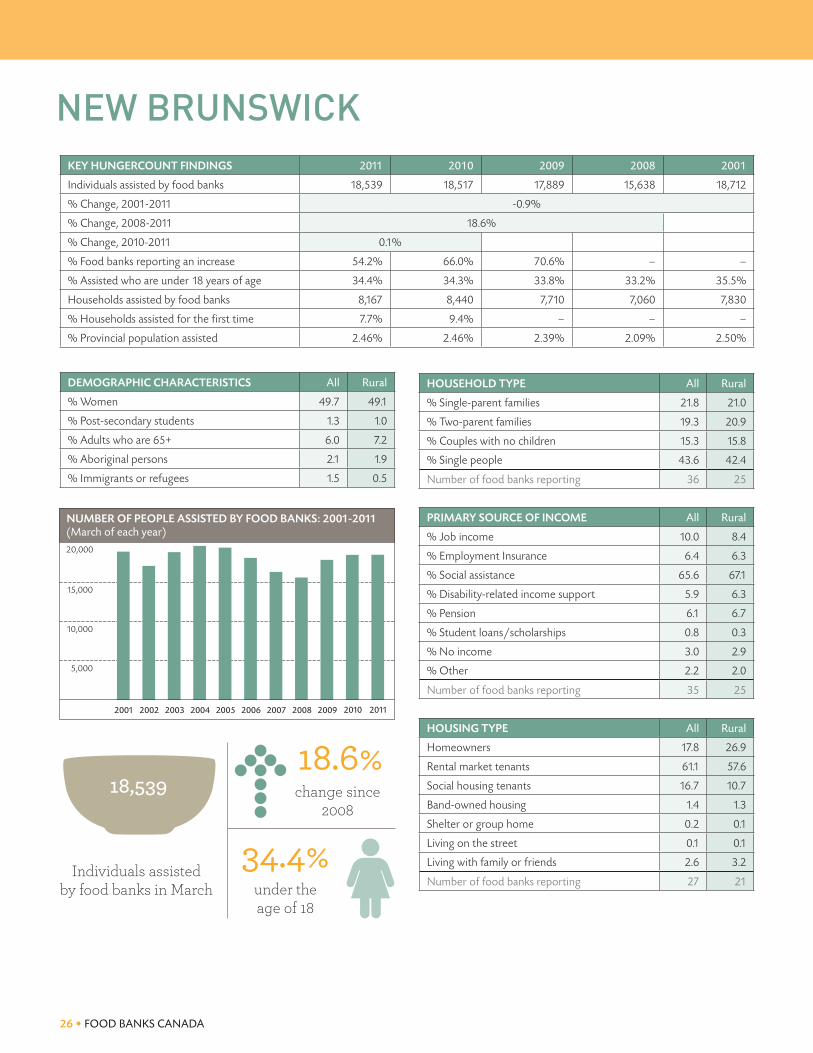
New Brunswick 18,539 34.4% 18,517 15,638 0.1% 18.6%
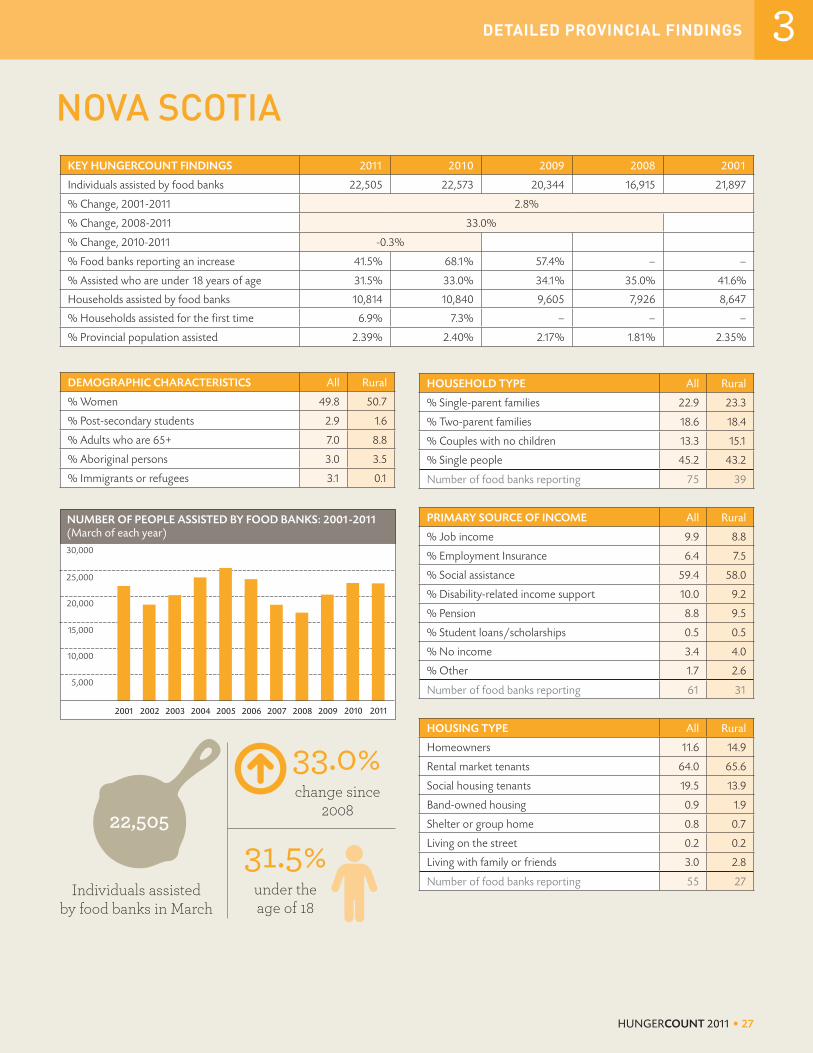
Nova Scotia 22,505 31.5% 22,573 16,915 -0.3% 33.0%
Prince Edward Island 3,095 35.3% 3,068 2,892 0.9% 7.0%
Newfoundland & Labrador 28,642 37.3% 30,800 27,260 -7.0% 5.1%
Territories 2,420 35.6% 2,272 1,340 6.5% 80.6%
Canada 851,014 37.9% 867,948 675,735 -2.0% 25.9%

HUNGERCOUNT 2011 • 7
TYPES OF HOUSEHOLDS Of the 349,842 households who turned
to food banks for help in March 2011,
almost half were families with children,
and these were almost evenly split
between dual-parent and single parent
families. Among households without
children, more than three quarters of
those assisted were single people, with
the remaining 23% made up of couples
without children.4
The household composition of those
helped in rural areas is fairly consistent
with overall national figures, with a
slightly higher percentage of couples
without children in rural Canada.5
FIRST NATIONS, MÉTIS, AND INUIT PEOPLE One in ten of those utilizing food
bank services identify as First Nations,
Métis, or Inuit. There is considerable
variation across the country, with a larger
proportion of those accessing food banks
identifying as Aboriginal in Western
Canada. In Saskatchewan, the majority
of people helped by food banks identify
as Aboriginal, accounting for 62% of the
provincial total in March 2011.6
In rural areas, one in six (16.4%) of
those helped identify as First Nations,
Métis, or Inuit. Again, rural food banks in
the four western provinces see higher-
than-average proportions of Aboriginal
people coming through their doors –
ranging from 27% of the total in British
Columbia to 64% in Saskatchewan.7
Table 2 provides detailed information
on Aboriginal people assisted by food
banks in each province.
RESULTS: AGE, FAMILY TYPE, ABORIGINAL IDENTITY
FOOD BANK USE IN THE TERRITORIES
A SNAPSHOT OF PEOPLE HELPED BY FOOD BANKS
There are a number of food banks located in Canada’s
three northern Territories. Some of these – for example, in
Whitehorse, Yellowknife, Hay River, Iqaluit, and Rankin Inlet –
have been operating for a number of years. In other regions,
the food bank concept is newer and concerned community
members are increasingly acquiring and sharing what food
they can, when they can, with their neighbours in need.
Food banks north of the 60th parallel tend to serve
predominantly Aboriginal populations; many do not have
permanent space to store food, utilizing community and
recreation centres as hubs when they have product to share.
With no food manufacturers and few retail outlets in the
north, in-kind donations can be scarce, and these food banks
tend to buy a significant amount of the food they distribute.
Territorial food banks that participated in HungerCount
assisted 7% more people in 2011 compared to 2010: 2,420
people turned to these food banks for help in March 2011.
Unfortunately, although HungerCount includes the largest
food banks in the territories, it does not incorporate
information from all food banks and likely underestimates
the magnitude of charitable food assistance provided in these
jurisdictions.
TABLE 2: SELF-IDENTIFIED FIRST NATIONS, MÉTIS, AND INUIT PEOPLE ASSISTED BY FOOD BANKS, MARCH 2011
Province/Territory Total Assisted Percent Identifying as Aboriginal
British Columbia 90,193 14.7%
Alberta 58,735 18.5%
Saskatchewan 20,665 62.4%
Manitoba 55,575 n/a
Ontario 395,106 5.9%
Quebec 155,539 1.5%
New Brunswick 18,539 2.1%
Nova Scotia 22,505 3.0%
Prince Edward Island 3,095 2.7%
Newfoundland & Labrador 28,642 0.1%
Territories 2,420 72.0%
Canada 851,014 9.7%
1

8 • FOOD BANKS CANADA
Nearly one in five of the households who
turned to food banks for assistance in
March 2011 reported that current or recent
employment was their primary source
of income – 12% were working, and 6%
were receiving Employment Insurance (EI).
Since the period just prior to the recession,
the percentage of assisted households
with jobs has decreased (from a high of
14.5% in 2008) in approximately the same
proportion as the percentage of those on
EI has risen (from a low of 4.8% in 2008).
More broadly, the primary sources of
income of those helped have remained
quite consistent over the past few years:
• Slightly more than half of households
served by food banks report living on
social assistance;
• 13% rely on disability-related income
supports;
• 7% receive the majority of their
income from pensions.8
In rural areas, households assisted by
food banks are more likely to be receiving
pension benefits; otherwise, sources of
income in rural Canada are remarkably
similar to overall national figures. A slightly
higher percentage (56%) rely on social
assistance, while a slightly lower proportion
are in receipt of Employment Insurance.9
The infographic below provides a
breakdown of the primary income sources
of households helped by food banks in
March 2011.
1.3 Income
Primary Source of Income of HouseholdsAssisted by Food Banks
Social Assistance
51.5%
Disability IncomeSupport
13.4%
Current or RecentEmployment
17.9%
Pension
6.8%
Student Loan/Scholarship
2%
No Income
5.3%
Other3.2%
Soup Kitchens and Other Meal ProgramsAcross Canada, a variety of organizations provide meals and snacks to diverse populations on a regular basis. For adults, soup kitchens, shelters, drop-in programs, and other venues provide regular hot meals. For children, schools and before- and after-school programs – often in partnership with NGOs including food banks – provide breakfast, lunch, and snack programs that are often targeted to low-income kids, though increasingly these are available to all young people enrolled in a particular school or extracurricular program.
In March 2011, 3,177,525 prepared meals were served by organizations across the country – down by 8% compared to 2010, but still 2.8% higher than in 2008.

HUNGERCOUNT 2011 • 9
The majority of households receiving
assistance from food banks are tenants.
Sixty-three percent live in market rental
accommodations, and another 22% live in
subsidized rental housing. Nationally, 2%
live in band-owned housing, with higher
numbers in provinces with larger First
Nations populations (e.g., 9% in Manitoba,
6% in Alberta, and 4% in Saskatchewan).
Nearly 6% of households helped by
food banks are homeless, whether living
temporarily with family or friends, in
a youth shelter or group home, at an
emergency shelter, or on the street. On
the other side of the coin, a surprising
7% report owning their homes, rising to
13% in Atlantic Canada.10
The housing situation of those assisted
is subtly different in rural areas of the
country. As with national figures, the
majority (60%) live in market rental
housing. Homeowners are the second
largest group at 15% of the total – double
the overall national rate, and again with
higher numbers in Atlantic Canada (19%).
A smaller proportion of those helped
in rural areas live in subsidized rental
housing (13%), while more live in band-
owned housing (5% compared to 2%
nationally). The proportion of homeless
clients is nearly identical in rural areas,
though people are more likely to report
living temporarily with family or friends.11
The infographic below provides
information nationally, and for rural
areas, on the housing arrangements of
households assisted by food banks in
March 2011.
1.4 Housing
Housing Situation of Households Assisted by Food Banks
ALL HOUSEHOLDS
Market Rental Housing
63.3%
Social/SubsidizedRental Housing
22.1%Homeowner7.2%
Temporarily withFamily or Friends
3.3%Shelter orGroup Home
1.8% Band-OwnedHousing1.7%On the Street
0.7%
RURAL HOUSEHOLDS
60.1%Market
Rental Housing
Homeowner
15%
13.3%
Social/SubsidizedRental Housing
Band-OwnedHousing
5.3% Temporarily withFamily or Friends
4.3%Shelter or
Group Home1.1% On the Street
0.9%
RESULTS: INCOME AND HOUSING 1

10 • FOOD BANKS CANADA
DISCUSSION AND POLICY:
REDUCING THE NEED FOR FOOD BANKS IN CANADAIt is a very unsettled time in the world, and in Canada. While the economic situation is not as dire as during the depths of the recession, there is a rising tide of uncertainty felt by millions of people around the globe. This has been caused by a number of factors, including the debt crises in the United States and Europe, persistent high unemployment around the world, and the struggle in high-income countries to adapt effectively to the decline of major sectors of the economy, particularly large-scale manufacturing.

HUNGERCOUNT 2011 • 11
We see global economic uncertainty
play out every day in the lives of
Canadians helped by food banks. It
is clear in regions where food bank use
has increased, as shown by the following
quotes from several staff and volunteers at
food banks:
“A lot of our new clients (I see on average three to four new clients per day) are hired only on a part time basis. I am seeing many clients who once lived here and decided to work in Alberta during the boom times returning home since there is no longer any work for them there. We also have a large population of seniors in our town and they are finding it hard to make it from one cheque to the next with the price of food so high.”12
“Two mills in the area have recently shut down, resulting in massive layoffs. This was the main source of income in town.”13
It is also reflected in areas where the
need for assistance from food banks has
decreased:
“The lumber and oilfield industry was hit hard in our region in 2009 and some people had to move on to look for work.”14
In many parts of the country, food
bank use is down because the economy
has improved. The fact that fewer people
have needed help from food banks over
the past year is extraordinarily positive.
This decline was not unexpected, as
food bank use has consistently shown
a clear correlation with the overall
health of the economy. If the economic
situation improves further, we can expect
the need for food banks to level off or
continue downward, as more Canadians
re-enter the workforce and find better-
paying employment.
At the same time, despite the small
decrease in food bank use since last
year, there are structural economic
factors that appear to prevent a truly
significant reduction in the need for
food banks. Through good economic
times and bad, food banks have been
helping more than 700,000 separate
individuals every month for the better
part of the past decade. This is a striking
sign that there are serious long-term
economic and social problems in
Canada for which we simply do not have
adequate solutions.
As further proof of these problems,
in 2009 more than 3 million Canadians
lived in families with incomes below
Canada’s unofficial poverty line, the
after-tax low income cut off (LICO-AT).15
In 2008, nearly 2 million Canadians
worried where their next meal would
come from, ate food that did not meet
their dietary or cultural preferences, or
skipped entire meals because of financial
hardship.16 These indicators of poverty
and vulnerability have almost certainly
been worsened by the recession.
Persistent levels of poverty, food
insecurity, and food bank use suggests
that our social policy fundamentals
need to be significantly improved. Over
the next few years, it is crucial that
social policy be a priority at the federal
and provincial levels of government –
something that we cannot take for
granted. As governments cut the size
of the public workforce, emphasize
low taxes, and restrict new spending,
social policy – and vulnerable
Canadians most affected by it – is at
risk of neglect.
A strong case can be made for
investing scarce resources in policies that
support vulnerable Canadians. There is,
first and foremost, the moral argument:
in a country as prosperous as Canada, it
is unacceptable that so many are unable
to afford the most basic needs. Second,
there is a growing body of research
that shows how much poverty costs us
as a nation,17 and that shows the broad
negative effects of growing inequality.18
Finally, with an aging population and its
consequences (including rising health
care costs19 and a slowdown in the
growth rate of the labour force20), it
simply makes sense to prioritize the full
participation of as many Canadians as
possible in our economy.
Our recommendations build on
these arguments, and propose seven
areas of focus for federal and provincial
governments. Strong efforts in these
areas will decrease the number of people
in need of help from food banks, and will
provide a basis for more Canadians to
live active, healthy, productive lives.
DISCUSSION AND POLICY 2
12 • FOOD BANKS CANADA
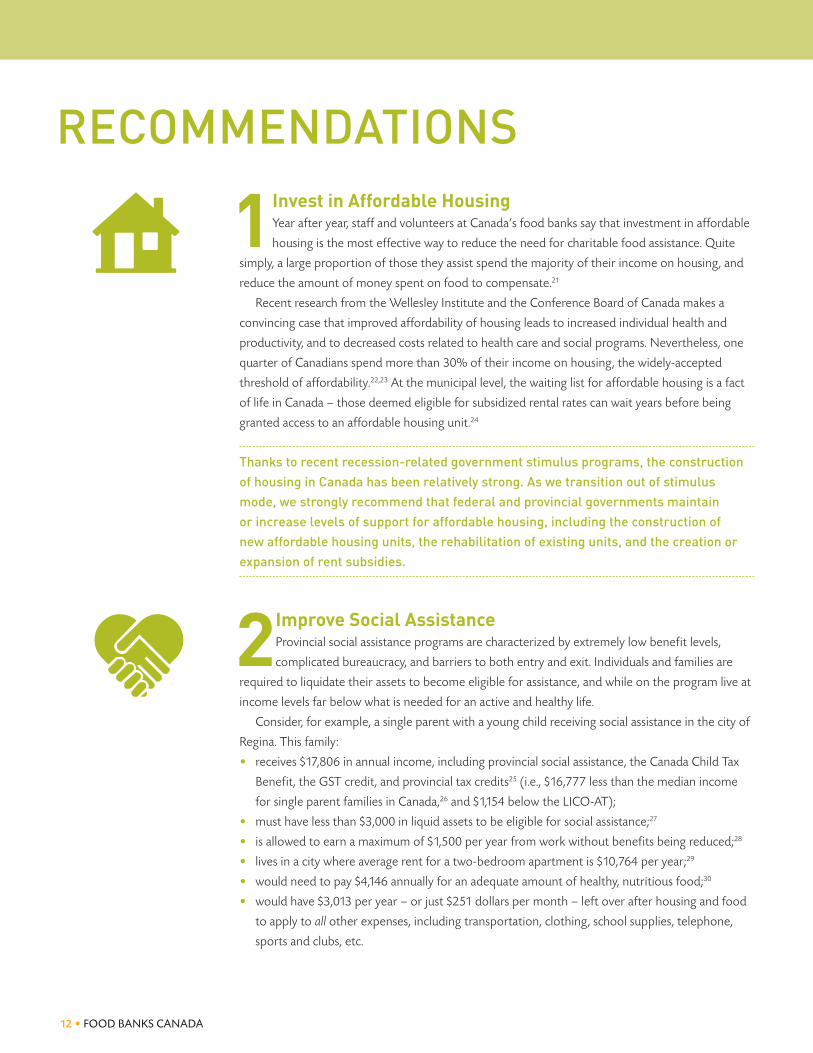
1 Invest in Affordable Housing
Year after year, staff and volunteers at Canada’s food banks say that investment in affordable
housing is the most effective way to reduce the need for charitable food assistance. Quite
simply, a large proportion of those they assist spend the majority of their income on housing, and
reduce the amount of money spent on food to compensate.21
Recent research from the Wellesley Institute and the Conference Board of Canada makes a
convincing case that improved affordability of housing leads to increased individual health and
productivity, and to decreased costs related to health care and social programs. Nevertheless, one
quarter of Canadians spend more than 30% of their income on housing, the widely-accepted
threshold of affordability.22,23 At the municipal level, the waiting list for affordable housing is a fact
of life in Canada – those deemed eligible for subsidized rental rates can wait years before being
granted access to an affordable housing unit.24
Thanks to recent recession-related government stimulus programs, the construction of housing in Canada has been relatively strong. As we transition out of stimulus mode, we strongly recommend that federal and provincial governments maintain or increase levels of support for affordable housing, including the construction of new affordable housing units, the rehabilitation of existing units, and the creation or expansion of rent subsidies.
2 Improve Social Assistance
Provincial social assistance programs are characterized by extremely low benefit levels,
complicated bureaucracy, and barriers to both entry and exit. Individuals and families are
required to liquidate their assets to become eligible for assistance, and while on the program live at
income levels far below what is needed for an active and healthy life.
Consider, for example, a single parent with a young child receiving social assistance in the city of
Regina. This family:
• receives $17,806 in annual income, including provincial social assistance, the Canada Child Tax
Benefit, the GST credit, and provincial tax credits25 (i.e., $16,777 less than the median income
for single parent families in Canada,26 and $1,154 below the LICO-AT);
• must have less than $3,000 in liquid assets to be eligible for social assistance;27
• is allowed to earn a maximum of $1,500 per year from work without benefits being reduced;28
• lives in a city where average rent for a two-bedroom apartment is $10,764 per year;29
• would need to pay $4,146 annually for an adequate amount of healthy, nutritious food;30
• would have $3,013 per year – or just $251 dollars per month – left over after housing and food
to apply to all other expenses, including transportation, clothing, school supplies, telephone,
sports and clubs, etc.
RECOMMENDATIONS

HUNGERCOUNT 2011 • 13
This example, by no means unusual, shows the extraordinary depth of poverty experienced by
Canadians on welfare. Individuals and families on social assistance are forced to live from day to day,
constantly worrying about how they are going to survive.
In the past few years, several provinces have marginally increased social assistance benefits,
and have increased some asset exemptions (e.g., allowing slightly higher maximum cash assets,
Registered Education Savings Plans, and the ownership of a modest vehicle and primary residence).
These changes make it more likely that people will get back into the labour force and off social
assistance. However, there is still much more to be done to change the system so that it supports
Canadians to become more self-sufficient.
We recommend that all provincial and territorial governments begin or continue to work with social assistance beneficiaries and other stakeholders to design an income support system that helps our most vulnerable citizens become self-sufficient.
3 Protect Canada’s Most Vulnerable Seniors
We welcomed the 2011 federal budget announcement of increases to the Guaranteed
Income Supplement (GIS) of up to $600 for single seniors and $840 for couples. This
$300 million investment acknowledges that, though great progress has been made in addressing
poverty among seniors, too many still cannot afford even basic needs.31
In our recent policy paper, Fairness for Canadian Seniors – A Reality Check on Pensions, we noted
that single seniors are much more likely than couples to have incomes below the after-tax low
income cut off (LICO-AT), Canada’s unofficial poverty line. This continues to be the case despite
the above-mentioned changes to the GIS. For single seniors living in urban areas with populations
above 30,000, the maximum OAS/GIS benefits remain below the LICO-AT. We suggest that this
problem stems from the fact that maximum OAS and GIS benefits for single seniors do not
fully take account of the costs of a single person living by themselves, relative to a couple in a
similar situation.
Currently, maximum OAS/GIS payments to single seniors sit at 64% of those for couples. We recommend that the federal government undertake research to examine whether this is an appropriate level, and to determine what level of payment relativity would result in approximately equal purchasing power for seniors living alone and in couples.
4Update Employment Insurance
Over the past decade, the nature of work in Canada has changed radically. Blue-collar jobs
accessible to people with low levels of education have steadily disappeared, replaced to a
large degree by service sector jobs that are more likely to be part-time, temporary, low-paid, and
with few non-wage benefits.32 Furthermore, our system of unemployment insurance exacerbated
the effects of these changes: in the mid-1990s, changes to Employment Insurance (EI) made it
more difficult for many Canadians to be eligible for the program, income replacement rates were
DISCUSSION AND POLICY: RECOMMENDATIONS 2
14 • FOOD BANKS CANADA
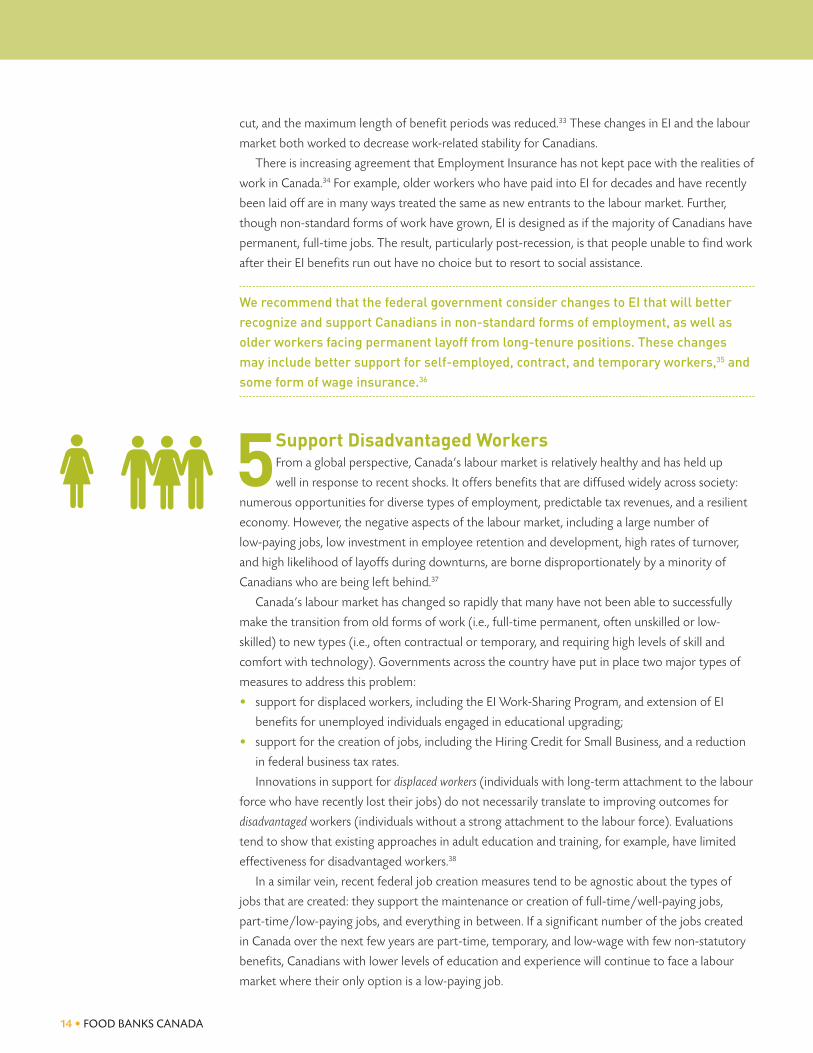
cut, and the maximum length of benefit periods was reduced.33 These changes in EI and the labour
market both worked to decrease work-related stability for Canadians.
There is increasing agreement that Employment Insurance has not kept pace with the realities of
work in Canada.34 For example, older workers who have paid into EI for decades and have recently
been laid off are in many ways treated the same as new entrants to the labour market. Further,
though non-standard forms of work have grown, EI is designed as if the majority of Canadians have
permanent, full-time jobs. The result, particularly post-recession, is that people unable to find work
after their EI benefits run out have no choice but to resort to social assistance.
We recommend that the federal government consider changes to EI that will better recognize and support Canadians in non-standard forms of employment, as well as older workers facing permanent layoff from long-tenure positions. These changes may include better support for self-employed, contract, and temporary workers,35 and some form of wage insurance.36
5 Support Disadvantaged Workers
From a global perspective, Canada’s labour market is relatively healthy and has held up
well in response to recent shocks. It offers benefits that are diffused widely across society:
numerous opportunities for diverse types of employment, predictable tax revenues, and a resilient
economy. However, the negative aspects of the labour market, including a large number of
low-paying jobs, low investment in employee retention and development, high rates of turnover,
and high likelihood of layoffs during downturns, are borne disproportionately by a minority of
Canadians who are being left behind.37
Canada’s labour market has changed so rapidly that many have not been able to successfully
make the transition from old forms of work (i.e., full-time permanent, often unskilled or low-
skilled) to new types (i.e., often contractual or temporary, and requiring high levels of skill and
comfort with technology). Governments across the country have put in place two major types of
measures to address this problem:
• support for displaced workers, including the EI Work-Sharing Program, and extension of EI
benefits for unemployed individuals engaged in educational upgrading;
• support for the creation of jobs, including the Hiring Credit for Small Business, and a reduction
in federal business tax rates.
Innovations in support for displaced workers (individuals with long-term attachment to the labour
force who have recently lost their jobs) do not necessarily translate to improving outcomes for
disadvantaged workers (individuals without a strong attachment to the labour force). Evaluations
tend to show that existing approaches in adult education and training, for example, have limited
effectiveness for disadvantaged workers.38
In a similar vein, recent federal job creation measures tend to be agnostic about the types of
jobs that are created: they support the maintenance or creation of full-time/well-paying jobs,
part-time/low-paying jobs, and everything in between. If a significant number of the jobs created
in Canada over the next few years are part-time, temporary, and low-wage with few non-statutory
benefits, Canadians with lower levels of education and experience will continue to face a labour
market where their only option is a low-paying job.

HUNGERCOUNT 2011 • 15
DISCUSSION AND POLICY: RECOMMENDATIONS
To address these issues, we recommend that the federal government: • Conductathoroughevaluationoffederallyfundedlabourmarketdevelopment
programs, including the Working Income Tax Benefit, the Hiring Credit for Small Business, and active labour market programs operated by private contractors. Do these programs lead to improved labour market participation and income levels for disadvantaged workers?
• Fundresearchand/ordemonstrationprojectsfocusedonthecreationofwell-payingjobsthatareopentothoseatriskofpoorlabourmarketoutcomes.Focusonthe program and legislative changes necessary for federal government engagement with non-profit and for-profit social enterprises (i.e., organizations that combine market-optimization with social/philanthropic goals).
• Instituteandleadafederal/provincial/territorial/FirstNationsworkinggroup to examine and address the inefficiencies, overlaps, and lack of coordination among the various funders and providers of active labour market programming in Canada.39
6 Invest in Early Learning and Child Care
The links between social and economic policy in this area are clear: every $1 invested in
early learning and care will boost the economy in the long run by $2.40. Early learning and
care, like affordable housing, is an investment in the well-being of Canadians that has real benefits
for the nation as a whole. Affordable, high-quality, accessible, publicly funded early learning and
care has multiple benefits: it supports parents to enter or remain in the workforce and increase
their income, or to upgrade their education and skills; and it decreases school drop-out rates
among children and youth and improves post-secondary educational participation.40
While wide availability of affordable child care is particularly beneficial for parents who have
low attachment to the labour force, and who may be working in low-paying, part-time, and/or
temporary jobs, it is a boon to parents at all income levels. In an era when the majority of parents work,
with a rapidly changing labour market and a shrinking labour force, it is simply good economics to
invest in early learning and child care.
Apart from cash transfers to provincial governments and families, the current federal
government has decisively removed itself from involvement in early learning and care. It is
therefore the responsibility of provincial governments to work with Canadian municipalities and
other stakeholders to design and implement innovative early learning and care programming and
funding models. Without concerted efforts to achieve these ends, parents will continue to spend
precious time and resources cobbling together a combination of family-based, before- and after-
school, publicly funded, and private arrangements. Many parents will choose to stay out of the
labour force because care for their children is unaffordable.
We recommend that provincial and municipal governments increase investment in a system of high-quality, affordable, accessible early learning and child care.
2

16 • FOOD BANKS CANADA
DISCUSSION AND POLICY: RECOMMENDATIONS
7 Maintain a Strong Canada Social Transfer
The Canada Social Transfer (CST) is a federal cash transfer to provincial governments that is
meant to support post-secondary education, social assistance, social services, early child-
hood development, early learning, and child care. Providing a total of $11.5 billion to the provinces
in 2011-12, it is a major funding base for social programs.41
During the 2011 federal election campaign, the Conservative Party promised to increase the
annual value of the Canada Health Transfer by 6% annually until 2016, but made no specific
mention of the future of the Canada Social Transfer after the current agreement expires in 2014.
The evolution of the Canada Assistance Plan into the Canada Health and Social Transfer in
the early-to-mid 1990s, which included significant reductions in transfer payments, was a major
factor in cuts to benefit levels and restrictions on eligibility to social assistance programs in many
provinces. These changes created significant hardship for hundreds of thousands of Canadians,
particularly single parents, people with low levels of education, and people with difficult-to-
diagnose or intermittent chronic health problems.42
Any reductions in the CST would negatively affect programs supporting the health and
well-being of Canadians, and would be counterproductive in the broader effort to reign in ever-
expanding health care expenditures. Continued investment in the CST is an investment in the
health of Canadians.
We recommend that the federal government commit to maintaining the current annual increase of 3% to the Canada Social Transfer to provincial governments.
There are solutions – if we have the willThe need for food banks in Canada will not decrease significantly without a change in the status quo.
The policy environment at the provincial/territorial and federal levels has undoubtedly seen progress in the past few years:
poverty reduction strategies in various jurisdictions; the introduction of the Working Income Tax Benefit; a focus on economic
development, education, and training, with particular efforts in regions with large First Nations, Métis, and Inuit populations;
and ongoing support for affordable housing, including supportive housing for seniors and people with disabilities. While this
progress is important, it is nevertheless the product of relatively small-scale policy changes, and for the most part has not had a
transformative impact on the difficulties that lead Canadians to ask for help from food banks.
With a federal election just completed, seven provincial/territorial elections set for 2011, and two more in 2012, we are faced
with a period of potential political stability that could set the stage for significant policy change. If governments have the desire and
will, the recommendations made above, as well as those currently proposed by other stakeholders, could be implemented on a
wide scale.
We have the opportunity to create real change in the lives of vulnerable Canadians, and to help those currently being left
behind to become healthy, productive, full members of society. To turn away from this challenge will be a wasted opportunity.
2

DETAILED PROVINCIAL FINDINGSBetween 2008 and 2010, changes in food bank use were remarkably similar across jurisdictions. From 2008 to 2009, all but one province experienced a marked increase in the need for food assistance, and every jurisdiction saw an increase from 2009 to 2010. This year, the picture is slightly different.
HUNGERCOUNT 2011 • 17

18 • FOOD BANKS CANADA
FOOD BANK USE IN CANADA BY THE NUMBERSMARCH, 2011
Changes in food bank usage levels for 2011 hover within a narrow band: from an
increase of 1% in Quebec, to a decrease of 9% in Saskatchewan (where 52% of food
banks nevertheless saw an increase). Food bank use in all but one province remains
higher than levels seen in 2008 and 2009.
When looking at who is helped by food banks, there is considerable variation
in Canada’s different regions. In Alberta, Saskatchewan, and Prince Edward Island,
for example, working households make up nearly a third (29%) of those assisted,
compared to the national average of 18%. Food banks in provinces west of Ontario
provide food and other assistance to a much higher proportion of Aboriginal people,
with First Nations, Métis, and Inuit peoples accounting for a quarter of individuals
helped. Thanks to their large urban populations, Ontario and Quebec assist an
elevated percentage of immigrants and refugees, accounting for approximately 86% of
new Canadians helped across the country.
This information is essential – to truly understand why people need food banks and
how this need can be reduced, one must engage with the problem at the national,
regional, provincial, and community levels. To this end, a number of Food Banks
Canada Member provincial associations have authored provincial reports that
offer greater detail and context than can be included in this national report.
These reports can be accessed at www.foodbankscanada.ca/HungerCount.
Additionally, the following section provides a wealth of provincial data, so that
readers can more fully understand who is being assisted by food banks in different
parts of the country.

HUNGERCOUNT 2011 • 19
ABSK
MB
ON
QC
NB
NL
PE
NS
BC
NUNT
DETAILED PROVINCIAL FINDINGS
YT
BRITISH COLUMBIA 90,193 people assisted31.7% are children-4.4% change, 2010 to 2011+15.5% change, 2008 to 2011
ALBERTA 58,735 people assisted43.7% are children-1.0% change, 2010 to 2011+74.9% change, 2008 to 2011
MANITOBA 55,575 people assisted50.4% are children-4.1% change, 2010 to 2011+37.3% change, 2008 to 2011
QUEBEC 155,539 people assisted36.5% are children+0.8% change, 2010 to 2011+22.0% change, 2008 to 2011
SASKATCHEWAN 20,665 people assisted43.0% are children-8.8% change, 2010 to 2011+16.4% change, 2008 to 2011
ONTARIO 395,106 people assisted37.5% are children-1.7% change, 2010 to 2011+25.7% change, 2008 to 2011
NOVA SCOTIA 22,505 people assisted31.5% are children-0.3% change, 2010 to 2011+33.0% change, 2008 to 2011
NEW BRUNSWICK 18,539 people assisted34.4% are children+0.1% change, 2010 to 2011+18.6% change, 2008 to 2011
PRINCE EDWARD ISLAND 3,095 people assisted35.3% are children+0.9% change, 2010 to 2011+7.0% change, 2008 to 2011
NEWFOUNDLAND & LABRADOR 28,642 people assisted37.3% are children-7.0% change, 2010 to 2011+5.1% change, 2008 to 2011
YUKON, NORTHWEST TERRITORIES, NUNAVUT2,420 people assisted35.6% are children+6.5% change, 2010 to 2011+80.6% change, 2008 to 2011
3

20 • FOOD BANKS CANADA
BRITISH COLUMBIAKEY HUNGERCOUNT FINDINGS 2011 2010 2009 2008 2001
Individuals assisted by food banks 90,193 94,359 89,866 78,101 67,237
% Change, 2001-2011 34.1%
% Change, 2008-2011 15.5%
% Change, 2010-2011 -4.4%
% Food banks reporting an increase 53.0% 60.2% 80.8% – –
% Assisted who are under 18 years of age 31.8% 29.7% 31.4% 31.2% 35.3%
Households assisted by food banks 42,465 45,196 44,206 35,005 23,664
% Households assisted for the first time 6.9% 6.5% – – –
% Provincial population assisted 1.98% 2.10% 2.03% 1.77% 1.66%
DEMOGRAPHIC CHARACTERISTICS All Rural
% Women 45.1 47.0
% Post-secondary students 1.6 1.5
% Adults who are 65+ 7.2 12.8
% Aboriginal persons 14.7 26.8
% Immigrants or refugees 3.4 0.3
HOUSEHOLD TYPE All Rural
% Single-parent families 21.8 20.2
% Two-parent families 19.6 16.0
% Couples with no children 12.6 13.0
% Single people 46.0 50.8
Number of food banks reporting 57 31
PRIMARY SOURCE OF INCOME All Rural
% Job income 11.3 12.2
% Employment Insurance 5.1 4.4
% Social assistance 43.1 51.0
% Disability-related income support 24.5 15.2
% Pension 7.2 8.1
% Student loans/scholarships 0.8 0.5
% No income 4.9 5.7
% Other 3.1 3.0
Number of food banks reporting 54 30
HOUSING TYPE All Rural
Homeowners 5.2 7.6
Rental market tenants 76.1 64.0
Social housing tenants 10.8 6.9
Band-owned housing 2.7 9.9
Shelter or group home 0.6 0.6
Living on the street 1.6 4.6
Living with family or friends 2.9 6.3
Number of food banks reporting 49 29
NUMBER OF PEOPLE ASSISTED BY FOOD BANKS: 2001-2011(March of each year)
2002 2003 2004 2005 2006 2007 2008 2009 2010 20112001
20,000
40,000
60,000
80,000
100,000
90,193
Individuals assisted by food banks in March
change since 2008
under the age of 18
15.5%
31.8%

HUNGERCOUNT 2011 • 21
ALBERTA
DETAILED PROVINCIAL FINDINGS
KEY HUNGERCOUNT FINDINGS 2011 2010 2009 2008 2001
Individuals assisted by food banks 58,735 59,311 53,976 33,580 44,868
% Change, 2001-2011 30.9%
% Change, 2008-2011 74.9%
% Change, 2010-2011 -1.0%
% Food banks reporting an increase 35.6% 72.5% 78.4% – –
% Assisted who are under 18 years of age 43.7% 43.1% 43.1% 42.0% 42.0%
Households assisted by food banks 21,556 19,798 20,815 12,031 16,412
% Households assisted for the first time 17.7% 10.0% – – –
% Provincial population assisted 1.57% 1.60% 1.40% 0.96% 1.48%
DEMOGRAPHIC CHARACTERISTICS All Rural
% Women 52.8 48.1
% Post-secondary students 4.8 0.6
% Adults who are 65+ 5.7 7.8
% Aboriginal persons 18.5 46.5
% Immigrants or refugees 12.8 1.1
HOUSEHOLD TYPE All Rural
% Single-parent families 28.5 35.6
% Two-parent families 24.0 26.0
% Couples with no children 11.2 13.4
% Single people 36.2 25.0
Number of food banks reporting 44 31
PRIMARY SOURCE OF INCOME All Rural
% Job income 27.3 27.5
% Employment Insurance 5.8 4.8
% Social assistance 32.9 28.7
% Disability-related income support 12.2 9.9
% Pension 6.2 12.6
% Student loans/scholarships 2.2 0.8
% No income 9.8 14.4
% Other 3.6 1.3
Number of food banks reporting 32 21
HOUSING TYPE All Rural
Homeowners 7.2 12.3
Rental market tenants 66.3 38.4
Social housing tenants 14.7 10.5
Band-owned housing 6.1 22.3
Shelter or group home 0.5 0.4
Living on the street 0.3 0.1
Living with family or friends 4.8 16.0
Number of food banks reporting 36 26
NUMBER OF PEOPLE ASSISTED BY FOOD BANKS: 2001-2011(March of each year)
2002 2003 2004 2005 2006 2007 2008 2009 2010 20112001
10,000
20,000
30,000
40,000
50,000
60,000
70,000
58,735
Individuals assisted by food banks in March
change since 2008
under the age of 18
74.9%
43.7%
3

22 • FOOD BANKS CANADA
SASKATCHEWANKEY HUNGERCOUNT FINDINGS 2011 2010 2009 2008 2001
Individuals assisted by food banks 20,665 22,662 18,875 17,751 13,065
% Change, 2001-2011 58.2%
% Change, 2008-2011 16.4%
% Change, 2010-2011 -8.8%
% Food banks reporting an increase 52.0% 52.0% 78.0% – –
% Assisted who are under 18 years of age 43.0% 44.1% 44.4% 45.6% 47.9%
Households assisted by food banks 7,740 8,355 7,063 5,819 4,971
% Households assisted for the first time 8.6% 7.8% – – –
% Provincial population assisted 1.96% 2.18% 1.80% 1.73% 1.30%
DEMOGRAPHIC CHARACTERISTICS All Rural
% Women 48.8 51.9
% Post-secondary students 2.6 1.3
% Adults who are 65+ 7.3 5.7
% Aboriginal persons 62.4 63.7
% Immigrants or refugees 8.0 0.7
HOUSEHOLD TYPE All Rural
% Single-parent families 24.2 35.4
% Two-parent families 21.1 23.0
% Couples with no children 9.6 10.4
% Single people 45.1 31.3
Number of food banks reporting 20 15
PRIMARY SOURCE OF INCOME All Rural
% Job income 14.7 8.2
% Employment Insurance 3.8 4.2
% Social assistance 57.6 66.8
% Disability-related income support 4.1 4.7
% Pension 6.3 6.1
% Student loans/scholarships 3.0 2.8
% No income 6.2 4.7
% Other 4.4 2.6
Number of food banks reporting 20 14
HOUSING TYPE All Rural
Homeowners 6.0 11.0
Rental market tenants 68.4 46.1
Social housing tenants 9.7 13.7
Band-owned housing 3.6 22.1
Shelter or group home 0.8 0.8
Living on the street 0.4 1.6
Living with family or friends 11.1 4.6
Number of food banks reporting 18 15
NUMBER OF PEOPLE ASSISTED BY FOOD BANKS: 2001-2011(March of each year)
2002 2003 2004 2005 2006 2007 2008 2009 2010 20112001
5,000
10,000
15,000
20,000
25,000
30,000
20,665
Individuals assisted by food banks in March
change since 2008
under the age of 18
16.4%
43.0%

HUNGERCOUNT 2011 • 23
DETAILED PROVINCIAL FINDINGS
MANITOBAKEY HUNGERCOUNT FINDINGS 2011 2010 2009 2008 2001
Individuals assisted by food banks 55,575 57,966 47,925 40,234 42,625
% Change, 2001-2011 30.4%
% Change, 2008-2011 37.3%
% Change, 2010-2011 -4.1%
% Food banks reporting an increase 42.4% 73.0% 66.0% – –
% Assisted who are under 18 years of age 50.4% 50.5% 48.7% 45.7% 46.6%
Households assisted by food banks 18,620 – – – –
% Households assisted for the first time 3.3% – – – –
% Provincial population assisted 4.47% 4.72% 3.89% 3.30% 3.67%
DEMOGRAPHIC CHARACTERISTICS All Rural
% Women 59.3 59.7
% Post-secondary students 3.2 3.3
% Adults who are 65+ 13.0 13.1
% Aboriginal persons n/a 36.5
% Immigrants or refugees 3.8 3.9
HOUSEHOLD TYPE All Rural
% Single-parent families 24.1 33.1
% Two-parent families 27.8 23.6
% Couples with no children 12.8 11.3
% Single people 35.3 31.9
Number of food banks reporting 28 25
PRIMARY SOURCE OF INCOME All Rural
% Job income 12.4 11.6
% Employment Insurance 5.4 4.9
% Social assistance 48.5 60.1
% Disability-related income support 4.4 11.3
% Pension 10.2 8.6
% Student loans/scholarships 2.6 0.0
% No income 10.3 2.9
% Other 6.1 0.6
Number of food banks reporting 19 16
HOUSING TYPE All Rural
Homeowners 11.9 14.9
Rental market tenants 56.4 41.1
Social housing tenants 13.4 18.0
Band-owned housing 8.8 14.5
Shelter or group home 2.5 3.6
Living on the street 0.6 0.9
Living with family or friends 6.6 7.1
Number of food banks reporting 18 15
NUMBER OF PEOPLE ASSISTED BY FOOD BANKS: 2001-2011(March of each year)
2002 2003 2004 2005 2006 2007 2008 2009 2010 20112001
10,000
20,000
30,000
40,000
50,000
60,000
55,575
Individuals assisted by food banks in March
change since 2008
under the age of 18
37.3%
50.4%
3

24 • FOOD BANKS CANADA
ONTARIOKEY HUNGERCOUNT FINDINGS 2011 2010 2009 2008 2001
Individuals assisted by food banks 395,106 402,056 374,230 314,258 278,543
% Change, 2001-2011 41.8%
% Change, 2008-2011 25.7%
% Change, 2010-2011 -1.7%
% Food banks reporting an increase 42.3% 73.6% 76.2% – –
% Assisted who are under 18 years of age 37.5% 37.1% 37.6% 37.6% 41.2%
Households assisted by food banks 157,973 160,402 148,660 137,491 115,930
% Households assisted for the first time 10.0% 10.4% – – –
% Provincial population assisted 2.97% 3.06% 2.90% 2.40% 2.37%
DEMOGRAPHIC CHARACTERISTICS All Rural
% Women 48.0 47.2
% Post-secondary students 3.5 3.5
% Adults who are 65+ 5.1 7.3
% Aboriginal persons 5.9 8.5
% Immigrants or refugees 11.9 1.1
HOUSEHOLD TYPE All Rural
% Single-parent families 28.4 26.2
% Two-parent families 22.0 25.6
% Couples with no children 11.0 13.3
% Single people 38.6 34.9
Number of food banks reporting 191 68
PRIMARY SOURCE OF INCOME All Rural
% Job income 10.5 12.1
% Employment Insurance 5.0 4.0
% Social assistance 44.5 41.1
% Disability-related income support 27.5 29.4
% Pension 4.9 7.7
% Student loans/scholarships 1.0 0.4
% No income 4.1 2.3
% Other 2.6 3.0
Number of food banks reporting 155 53
HOUSING TYPE All Rural
Homeowners 6.5 13.1
Rental market tenants 62.7 65.3
Social housing tenants 24.6 15.9
Band-owned housing 1.1 3.3
Shelter or group home 1.7 0.1
Living on the street 0.4 0.0
Living with family or friends 3.1 2.2
Number of food banks reporting 159 55
NUMBER OF PEOPLE ASSISTED BY FOOD BANKS: 2001-2011(March of each year)
2002 2003 2004 2005 2006 2007 2008 2009 2010 20112001
100,000
200,000
300,000
400,000
500,000
395,106
Individuals assisted by food banks in March
change since 2008
under the age of 18
25.7%
37.5%
HUNGERCOUNT 2011 • 25
DETAILED PROVINCIAL FINDINGS
QUEBECKEY HUNGERCOUNT FINDINGS 2011 2010 2009 2008 2001
Individuals assisted by food banks 155,539 154,364 137,464 127,536 187,877
% Change, 2001-2011 -17.2%
% Change, 2008-2011 22.0%
% Change, 2010-2011 0.8%
% Food banks reporting an increase 51.9% – – – –
% Assisted who are under 18 years of age 36.5% 37.9% 33.9% 37.1% 43.8%
Households assisted by food banks 69,057 – – – –
% Households assisted for the first time 15.6% – – – –
% Provincial population assisted 1.96% 1.96% 1.77% 1.97% 2.55%
DEMOGRAPHIC CHARACTERISTICS All Rural
% Women 40.9 39.5
% Post-secondary students 4.4 n/a
% Adults who are 65+ 11.3 8.7
% Aboriginal persons 1.5 n/a
% Immigrants or refugees 23.1 n/a
HOUSEHOLD TYPE All Rural
% Single-parent families 22.2 21.2
% Two-parent families 25.7 22.2
% Couples with no children 12.2 15.1
% Single people 39.9 41.5
Number of food banks reporting 500 125
PRIMARY SOURCE OF INCOME All Rural
% Job income 9.4 10.5
% Employment Insurance 6.7 5.2
% Social assistance 60.7 64.6
% Disability-related income support 4.5 5.3
% Pension 7.1 7.2
% Student loans/scholarships 3.4 0.8
% No income 4.9 3.1
% Other 3.2 3.3
Number of food banks reporting 472 118
HOUSING TYPE All Rural
Homeowners 6.0 18.3
Rental market tenants 65.5 64.2
Social housing tenants 20.3 12.8
Band-owned housing 0.7 0.7
Shelter or group home 3.7 2.5
Living on the street 0.8 0.0
Living with family or friends 2.9 1.4
Number of food banks reporting 418 109
NUMBER OF PEOPLE ASSISTED BY FOOD BANKS: 2001-2011(March of each year)
2002 2003 2004 2005 2006 2007 2008 2009 2010 20112001
50,000
100,000
150,000
200,000
250,000
155,539
Individuals assisted by food banks in March
change since 2008
under the age of 18
22.0%
36.5%
3
26 • FOOD BANKS CANADA
NEW BRUNSWICKKEY HUNGERCOUNT FINDINGS 2011 2010 2009 2008 2001
Individuals assisted by food banks 18,539 18,517 17,889 15,638 18,712
% Change, 2001-2011 -0.9%
% Change, 2008-2011 18.6%
% Change, 2010-2011 0.1%
% Food banks reporting an increase 54.2% 66.0% 70.6% – –
% Assisted who are under 18 years of age 34.4% 34.3% 33.8% 33.2% 35.5%
Households assisted by food banks 8,167 8,440 7,710 7,060 7,830
% Households assisted for the first time 7.7% 9.4% – – –
% Provincial population assisted 2.46% 2.46% 2.39% 2.09% 2.50%
DEMOGRAPHIC CHARACTERISTICS All Rural
% Women 49.7 49.1
% Post-secondary students 1.3 1.0
% Adults who are 65+ 6.0 7.2
% Aboriginal persons 2.1 1.9
% Immigrants or refugees 1.5 0.5
HOUSEHOLD TYPE All Rural
% Single-parent families 21.8 21.0
% Two-parent families 19.3 20.9
% Couples with no children 15.3 15.8
% Single people 43.6 42.4
Number of food banks reporting 36 25
PRIMARY SOURCE OF INCOME All Rural
% Job income 10.0 8.4
% Employment Insurance 6.4 6.3
% Social assistance 65.6 67.1
% Disability-related income support 5.9 6.3
% Pension 6.1 6.7
% Student loans/scholarships 0.8 0.3
% No income 3.0 2.9
% Other 2.2 2.0
Number of food banks reporting 35 25
HOUSING TYPE All Rural
Homeowners 17.8 26.9
Rental market tenants 61.1 57.6
Social housing tenants 16.7 10.7
Band-owned housing 1.4 1.3
Shelter or group home 0.2 0.1
Living on the street 0.1 0.1
Living with family or friends 2.6 3.2
Number of food banks reporting 27 21
NUMBER OF PEOPLE ASSISTED BY FOOD BANKS: 2001-2011(March of each year)
2002 2003 2004 2005 2006 2007 2008 2009 2010 20112001
5,000
10,000
15,000
20,000
18,539
Individuals assisted by food banks in March
change since 2008
under the age of 18
18.6%
34.4%
HUNGERCOUNT 2011 • 27
DETAILED PROVINCIAL FINDINGS
NOVA SCOTIAKEY HUNGERCOUNT FINDINGS 2011 2010 2009 2008 2001
Individuals assisted by food banks 22,505 22,573 20,344 16,915 21,897
% Change, 2001-2011 2.8%
% Change, 2008-2011 33.0%
% Change, 2010-2011 -0.3%
% Food banks reporting an increase 41.5% 68.1% 57.4% – –
% Assisted who are under 18 years of age 31.5% 33.0% 34.1% 35.0% 41.6%
Households assisted by food banks 10,814 10,840 9,605 7,926 8,647
% Households assisted for the first time 6.9% 7.3% – – –
% Provincial population assisted 2.39% 2.40% 2.17% 1.81% 2.35%
DEMOGRAPHIC CHARACTERISTICS All Rural
% Women 49.8 50.7
% Post-secondary students 2.9 1.6
% Adults who are 65+ 7.0 8.8
% Aboriginal persons 3.0 3.5
% Immigrants or refugees 3.1 0.1
HOUSEHOLD TYPE All Rural
% Single-parent families 22.9 23.3
% Two-parent families 18.6 18.4
% Couples with no children 13.3 15.1
% Single people 45.2 43.2
Number of food banks reporting 75 39
PRIMARY SOURCE OF INCOME All Rural
% Job income 9.9 8.8
% Employment Insurance 6.4 7.5
% Social assistance 59.4 58.0
% Disability-related income support 10.0 9.2
% Pension 8.8 9.5
% Student loans/scholarships 0.5 0.5
% No income 3.4 4.0
% Other 1.7 2.6
Number of food banks reporting 61 31
HOUSING TYPE All Rural
Homeowners 11.6 14.9
Rental market tenants 64.0 65.6
Social housing tenants 19.5 13.9
Band-owned housing 0.9 1.9
Shelter or group home 0.8 0.7
Living on the street 0.2 0.2
Living with family or friends 3.0 2.8
Number of food banks reporting 55 27
NUMBER OF PEOPLE ASSISTED BY FOOD BANKS: 2001-2011(March of each year)
2002 2003 2004 2005 2006 2007 2008 2009 2010 20112001
5,000
10,000
15,000
20,000
25,000
30,000
22,505
Individuals assisted by food banks in March
change since 2008
under the age of 18
33.0%
31.5%
3

28 • FOOD BANKS CANADA
PRINCE EDWARD ISLANDKEY HUNGERCOUNT FINDINGS 2011 2010 2009 2008 2001
Individuals assisted by food banks 3,095 3,068 2,706 2,892 2,657
% Change, 2001-2011 16.5%
% Change, 2008-2011 7.0%
% Change, 2010-2011 0.9%
% Food banks reporting an increase 66.7% 100.0% 50.0% – –
% Assisted who are under 18 years of age 35.3% 35.5% 35.8% 35.4% 37.4%
Households assisted by food banks 1,231 1,238 1,083 1,155 873
% Households assisted for the first time 7.0% 7.3% – – –
% Provincial population assisted 2.16% 2.17% 1.93% 1.95% 1.95%
DEMOGRAPHIC CHARACTERISTICS All Rural
% Women 53.5 56.9
% Post-secondary students 0.6 0.9
% Adults who are 65+ 4.9 3.9
% Aboriginal persons 2.7 0.2
% Immigrants or refugees 5.6 0.0
HOUSEHOLD TYPE All Rural
% Single-parent families 21.3 25.5
% Two-parent families 27.3 29.3
% Couples with no children 16.8 12.0
% Single people 34.6 33.2
Number of food banks reporting 5 2
PRIMARY SOURCE OF INCOME All Rural
% Job income 19.6 16.8
% Employment Insurance 21.8 25.0
% Social assistance 39.3 40.9
% Disability-related income support 5.0 9.2
% Pension 10.8 6.3
% Student loans/scholarships 0.2 0.0
% No income 2.4 1.0
% Other 0.9 1.0
Number of food banks reporting 4 2
HOUSING TYPE All Rural
Homeowners 16.6 25.1
Rental market tenants 59.0 39.8
Social housing tenants 19.5 25.5
Band-owned housing 0.8 0.4
Shelter or group home 0.8 2.3
Living on the street 0.4 0.0
Living with family or friends 3.0 6.9
Number of food banks reporting 5 3
NUMBER OF PEOPLE ASSISTED BY FOOD BANKS: 2001-2011(March of each year)
2002 2003 2004 2005 2006 2007 2008 2009 2010 20112001
1,000
2,000
3,000
4,000
3,095
Individuals assisted by food banks in March
change since 2008
under the age of 18
7.0%
35.3%

HUNGERCOUNT 2011 • 29
DETAILED PROVINCIAL FINDINGS
NEWFOUNDLAND AND LABRADORKEY HUNGERCOUNT FINDINGS 2011 2010 2009 2008 2001
Individuals assisted by food banks 28,642 30,800 30,014 27,260 29,231
% Change, 2001-2011 -2.0%
% Change, 2008-2011 5.1%
% Change, 2010-2011 -7.0%
% Food banks reporting an increase 40.7% 67.9% 70.4% – –
% Assisted who are under 18 years of age 37.3% 37.3% 37.4% 38.4% 37.5%
Households assisted by food banks 9,090 9,003 9,235 8,037 –
% Households assisted for the first time 4.8% 5.4% – – –
% Provincial population assisted 5.63% 6.03% 5.90% 5.36% 5.56%
DEMOGRAPHIC CHARACTERISTICS All Rural
% Women 55.5 48.2
% Post-secondary students 1.2 1.4
% Adults who are 65+ 5.2 6.6
% Aboriginal persons 0.1 1.3
% Immigrants or refugees 0.7 0.0
HOUSEHOLD TYPE All Rural
% Single-parent families 35.0 25.4
% Two-parent families 26.5 29.6
% Couples with no children 12.2 18.3
% Single people 26.4 26.7
Number of food banks reporting 25 20
PRIMARY SOURCE OF INCOME All Rural
% Job income 8.4 4.2
% Employment Insurance 13.2 8.1
% Social assistance 71.7 74.2
% Disability-related income support 0.4 3.2
% Pension 6.1 7.8
% Student loans/scholarships 0.1 0.5
% No income 0.1 0.8
% Other 0.1 1.1
Number of food banks reporting 19 16
HOUSING TYPE All Rural
Homeowners 11.8 16.3
Rental market tenants 20.9 49.3
Social housing tenants 66.8 30.6
Band-owned housing 0.0 0.0
Shelter or group home 0.0 0.0
Living on the street 0.0 0.3
Living with family or friends 0.5 3.5
Number of food banks reporting 23 18
NUMBER OF PEOPLE ASSISTED BY FOOD BANKS: 2001-2011(March of each year)
2002 2003 2004 2005 2006 2007 2008 2009 2010 20112001
10,000
20,000
30,000
40,000
28,642
Individuals assisted by food banks in March
change since 2008
under the age of 18
5.1%
37.3%
3

30 • FOOD BANKS CANADA
REFERENCES1 Rural areas are defined as those with Census 2006 populations of less than
10,000.
2 Figures were calculated using Statistics Canada postcensal estimates of
population for January of each year.
3 Based on surveys from 945 food banks and food programs.
4 Based on surveys from 978 food banks and food programs.
5 Based on surveys from 379 food banks and food programs.
6 Based on surveys from 640 food banks and food programs.
7 Based on surveys from 296 food banks and food programs.
8 Based on surveys from 868 food banks and food programs.
9 Based on surveys from 325 food banks and food programs.
10 Based on surveys from 806 food banks and food programs.
11 Based on surveys from 316 food banks and food programs.
12 Penticton, BC.
13 Lillooet, BC.
14 High Prairie, AB.
15 Statistics Canada (2011). Income in Canada 2009, Table 2020802. Ottawa:
Government of Canada.
16 Health Canada (2010). Household food insecurity in Canada in 2007-2008: Key
statistics and graphics. Ottawa: Government of Canada.
17 N. Laurie (2008). The cost of poverty: An analysis of the economic cost of poverty
in Ontario. Toronto: Ontario Association of Food Banks. See also: I. Ivanova
(2011). The cost of poverty in BC. Vancouver: Canadian Centre for Policy
Alternatives BC Office.
18 R.G. Wilkinson & K. Pickett (2009). The spirit level: Why equality is better for
everyone. Toronto: Penguin.
19 D. Drummond & G. Bishop (2010). An economist’s case for income security in
the 21st century. TD Economics Special Report, August 18.
20 Statistics Canada (2011). Study: Projected trends to 2031 for the Canadian labour
force. Ottawa: Government of Canada.
21 Food Banks Canada (2010). Policies that reduce hunger: What would decrease the
need for food banks in Canada? Toronto: Food Banks Canada.
22 Wellesley Institute (2006). Framework for the Blueprint to end homelessness in
Toronto. Toronto: Wellesley Institute.
23 Conference Board of Canada (2010). Building from the ground up: Enhancing
affordable housing in Canada. Toronto: Conference Board of Canada.
24 See, for example:
Ontario Non-Profit Housing Association (2011). Waiting lists survey 2011.
Toronto: ONPHA.
J. Lavoie (2006). “Thousands wait for subsidized housing.” Victoria Times
Colonist, October 4, 2006. Available: www.vitalsignscanada.ca/
news-judithOct04-e.html.
City of Calgary (2011). Waiting list for housing. Available: calgary.ca/CS/
OLSH/Pages/Calgary-Housing-Company/Applicant%20information/
Waiting-list-for-housing.aspx.
25 National Council of Welfare (2011). Welfare incomes 2010. Ottawa:
Government of Canada.
26 Statistics Canada (2011). Income in Canada, Table 2020605. Ottawa:
Government of Canada.
27 National Council of Welfare (2010). Welfare incomes 2009. Ottawa:
Government of Canada.
28 Saskatchewan Ministry of Social Services (2011). Saskatchewan assistance rates,
April 1, 2011. Saskatoon: Government of Saskatchewan.
29 Canada Mortgage and Housing Corporation (2011). Rental market statistics,
Spring 2011. Ottawa: CMHC.
30 Assumes female head of household age 31-50, and son age 2 years or less.
See: Public Health Nutritionists of Saskatchewan Working Group (2010).
The cost of healthy eating in Saskatchewan 2009: Impact on food security.
Saskatoon: Public Health Nutritionists of Saskatchewan Working Group.
31 Department of Finance Canada (2011). Budget 2011. Ottawa: Government of
Canada.
32 L.F. Vosko (2011). The challenge of expanding EI coverage. Toronto: Mowat
Centre for Policy Innovation.
33 Service Canada (2007). Archived Employment Insurance Act (1996). Ottawa:
Government of Canada.

HUNGERCOUNT 2011 • 31
REFERENCES AND METHODOLOGY
34 See, for example:
M. Gunderson (2011). Employment Insurance in the new world of work. Toronto:
Mowat Centre for Policy Innovation.
M. Mendelson, K. Battle & S. Torjman (2009). Canada’s shrunken safety net:
Employment Insurance in the great recession. Ottawa: Caledon Institute for Social
Policy.
M. Townson & K. Hayes (2007). Women and the Employment Insurance
program. Toronto: Canadian Centre for Policy Alternatives.
35 M. Gunderson (2011).
36 R. Finnie & D. Gray (2011). Labour-force participation of older displaced
workers in Canada. Montreal: Institute for Research on Public Policy. See
also: W.C. Riddell (2009). Economic change and worker displacement in Canada:
Consequences and policy responses. Canadian Labour Market and Skills
Researcher Network.
37 Vosko (2011); Finnie & Gray (2011). See also: S. Butterwick (2010).
Meaningful training programs for BC welfare recipients with multiple barriers: Help
first, not work first. Vancouver: Canadian Centre for Policy Alternatives
BC Office.
38 D. Card, J. Kluve & A. Weber (2009). Active labour market policy evaluations: A
meta-analysis. Available: www.politiquessociales.net/IMG/pdf/dp4002.pdf.
39 For a more detailed analysis of this issue, see: Food Banks Canada (2011).
Creating quality sustainable jobs and a resilient workforce in Canada. Toronto:
Food Banks Canada.
40 Centre for Spatial Economics (2010). Early learning and care impact analysis.
Toronto: Centre for Spatial Economics.
41 Department of Finance Canada (2010). Canada Social Transfer. Available:
www.fin.gc.ca/fedprov/cst-eng.asp.
42 D. Raphael (2011). Poverty in Canada. Toronto: Canadian Scholars’ Press Inc.
4

32 • FOOD BANKS CANADA
METHODOLOGY
REFERENCES AND METHODOLOGY
The primary purpose of the annual
HungerCount survey is to provide a
national and provincial snapshot of food
bank use in Canada. This is accomplished
by counting the number of individuals
who receive groceries from food banks
and their affiliated agencies during the
month of March. Information is collected
on the number of unique individuals
that receive food, as well as on the
total number of visits to food banks
and affiliated agencies. March has been
chosen as the study period because it
is an unexceptional month, without
predictable high or low use patterns.
Since March is used consistently, we are
able to make relevant comparisons in use
patterns over time.
The survey also records information
on several characteristics of those
assisted by food banks, including
age category, gender, student status,
citizenship status, and Aboriginal identity
at the individual level, and primary source
of income, household composition, and
housing type at the household level. As
well, the survey measures volunteer and
paid staff hours worked at participating
organizations, number of prepared meals
and snacks served, and coping strategies
used when food banks risk running out
of food.
Surveys were sent to all known
Canadian food banks in February 2011.
When necessary, HungerCount Provincial
Coordinators contacted food banks prior
to the submission deadline to ensure a
high response rate and to clarify survey
questions. Completed surveys were
returned to Provincial Coordinators,
who checked responses for accuracy and
completeness before forwarding copies
to Food Banks Canada.
Throughout the summer, Food Banks
Canada staff and volunteers worked with
HungerCount Provincial Coordinators to
collect outstanding surveys and resolve
any inconsistencies in responses. Survey
data were entered into a database,
checked for accuracy, and analyzed by
Food Banks Canada staff. In cases where
surveys were not completed by operating
food banks, conservative estimates were
produced in consultation with Provincial
Coordinators, using 2010 figures as a
guide.
TABLE 3: HUNGERCOUNT SURVEY PARTICIPATION, 2011
Province/Territory No. of Known Food Banks
No. of Participating Food Banks
% of Food Banks
Participating
No. of Agencies Included
British Columbia 91 91 100% 365
Alberta 103 70 68% 300
Saskatchewan 28 25 89% 210
Manitoba 50 42 84% 339
Ontario 368 331 90% 1139
Quebec 1041 910 87% 0
New Brunswick 59 56 95% 42
Nova Scotia 157 153 97% 5
Prince Edward Island 6 6 100% 8
Newfoundland & Labrador 33 33 100% 57
Territories 7 6 86% 0
Canada 1,943 1,723 89% 2,465
4

HUNGERCOUNT 2011 • 33
HUNGERCOUNT 2011 PROVINCIAL COORDINATORS
Arlene Kravitz, Food Banks British
Columbia (British Columbia)
Marjorie Bencz, CM, Edmonton’s Food
Bank (Alberta)
Richard Le Sueur, Alberta Food Banks
(Alberta)
Linda Robinson, ACERT, Regina and District
Food Bank (Saskatchewan)
Karen Flett, Winnipeg Harvest Food Bank
(Manitoba)
Debra Hubner, Ontario Association of
Food Banks (Ontario)
Carolyn Stewart, Ontario Association of
Food Banks (Ontario)
Zakary O. Rhissa, Food Banks Quebec
(Quebec)
George Piers, Fredericton Community
Kitchen Inc. (New Brunswick)
Julianne Acker-Verney, FEED NOVA
SCOTIA (Nova Scotia)
Becky Mason, FEED NOVA SCOTIA
(Nova Scotia)
Dianne Swinemar, FEED NOVA SCOTIA
(Nova Scotia)
Mike MacDonald, Upper Room Food Bank
(Prince Edward Island)
Eg Walters, Community Food Sharing
Association (Newfoundland & Labrador)
TRANSLATIONCILFO Translations
EDITING AND DESIGN Cheryl Carter, Wordslinger Inc.
Meredith MacKinlay, Egg Design
Jill Hansen, Hansen Design
HUNGERCOUNT WAS PREPARED BYShawn Pegg and Cherry Marshall
ACKNOWLEDGEMENTSFood Banks Canada thanks the
hundreds of thousands of people
accessing food bank services,
and the thousands of food bank
staff and volunteers who, every
year, contribute information to
the HungerCount report. Without
their efforts and participation this
research would not be possible.
Copyright © 2011 Food Banks Canada. All rights
reserved.
ISBN: 978-0-9813632-6-4
Please cite as: Food Banks Canada (2011).
HungerCount 2011. Toronto: Food Banks Canada.

2150 Lake Shore Blvd. W
Toronto, Ontario M8V 1A3
Tel: 416-203-9241
Toll-free: 1-877-535-0958
Fax: 416-203-9244
www.foodbankscanada.ca
facebook.com/FoodBanksCanada
twitter.com/foodbankscanada
Our Members
P.E.I. Association of Food Banks
Manitoba Association of
Food Banks