Embed Size (px)
Citation preview
Video force microscopy reveals the mechanicsof ventral furrow invagination in DrosophilaG. Wayne Brodlanda,b,1, Vito Contec, P. Graham Cranstona, Jim Veldhuisa, Sriram Narasimhana, M. Shane Hutsond,Antonio Jacintoe, Florian Ulrichf, Buzz Baumg, and Mark Miodownikc
aDepartment of Civil and Environmental Engineering, University of Waterloo, Waterloo, ON, Canada N2L 3G1; bDepartment of Biology, University ofWaterloo, Waterloo, ON, Canada N2L 3G1; cPhysics Department, King’s College London, London WC2R 2LS, United Kingdom; dDepartment of Physics andAstronomy, Vanderbilt University, Nashville, TN 37235; eInstituto de Medicina Molecular, 1649-028 Lisbon, Portugal; fSkirball Institute of BiomolecularMedicine, New York Hospital, New York, NY 10016; and gMRC Laboratory for Molecular Cell Biology, University College London, London WC1E 6BT,United Kingdom
Edited by William A. Eaton, National Institutes of Health-National Institute of Diabetes and Digestive and Kidney Diseases, Bethesda, MD, and approvedOctober 20, 2010 (received for review May 13, 2010)
The absence of tools for mapping the forces that drive morphoge-netic movements in embryos has impeded our understanding ofanimal development. Here we describe a unique approach, videoforce microscopy (VFM), that allows detailed, dynamic force mapsto be produced from time-lapse images. The forces at work in anembryo are considered to be decomposed into active and passiveelements, where active forces originate from contributions (e.g.,actomyosin contraction) that do mechanical work to the systemand passive ones (e.g., viscous cytoplasm) that dissipate energy.In the present analysis, the effects of all passive components areconsidered to be subsumed by an effective cytoplasmic viscosity,and the driving forces are resolved into equivalent forces alongthe edges of the polygonal boundaries into which the region ofinterest is divided. Advanced mathematical inverse methods areused to determine these driving forces. When applied to multipho-ton sections of wild-type and mutant Drosophila melanogasterembryos, VFM is able to calculate the equivalent driving forcesacting along individual cell edges and to do so with subminutetemporal resolution. In thewild type, forces along the apical surfaceof the presumptive mesoderm are found to be large and to varyparabolically with time and angular position, whereas forces alongthebasal surfaceof theectoderm, forexample, are foundtobesmal-ler and nearly uniform with position. VFM shows that in mutantswith reduced junction integrity and myosin II activity, the drivingforces are reduced, thus accounting for ventral furrow failure.
embryo morphogenesis ∣ tissue mechanics ∣ biomechanics ∣cinemechanometry
Intense study has been directed at the forces that drive specificmorphogenetic movements in embryos. Although atomic force
microscopy can measure surface forces in single cells or cell doub-lets (1, 2) and laser microsurgery provides information about theforces carried by ablated structures (3), comprehensive maps ofdriving forces have remained elusive. Computational modeling,an important complement to experiments, can rigorously proposespatial and temporal maps of forces sufficient to account formorphogenetic movements, but uniqueness issues remain (4, 5).Here, we detail a previously undescribed, noninvasive method,video force microscopy or VFM, that combines dynamic imagingwith computational mechanics to spatially and temporally mapthe forces that drive morphogenetic movements. The detail avail-able in such maps is limited only by image resolution, capturefrequency, and noise. The method has the potential to becomea standard tool for biologists studying forces within tissues.
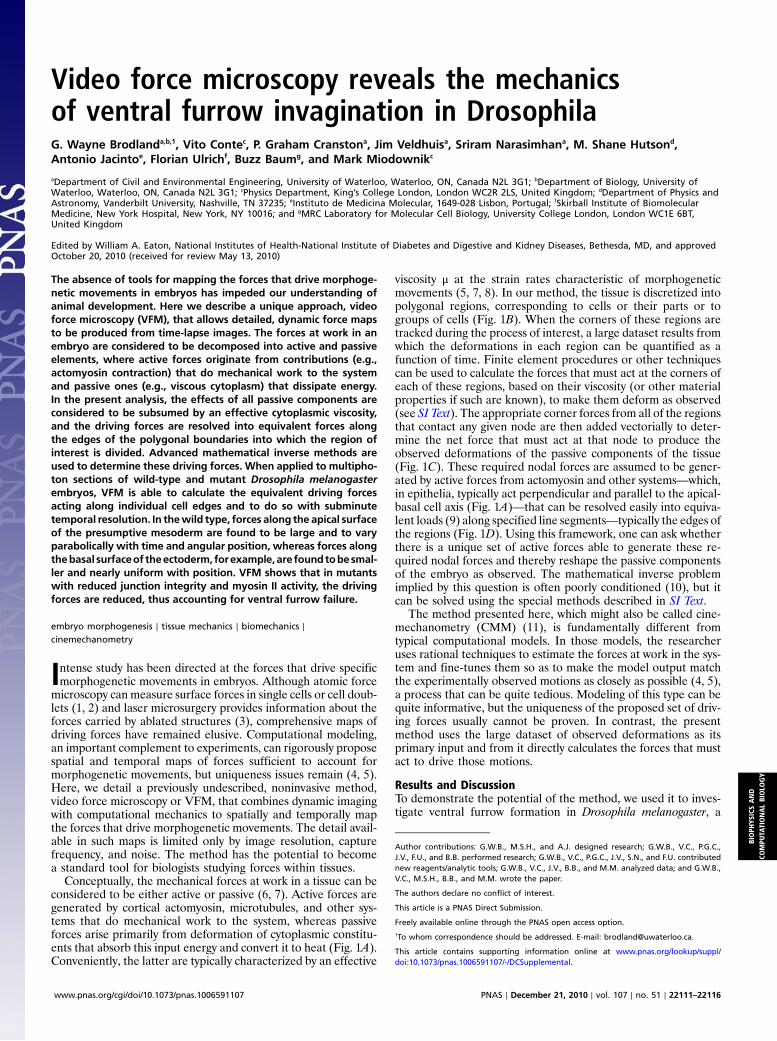
Conceptually, the mechanical forces at work in a tissue can beconsidered to be either active or passive (6, 7). Active forces aregenerated by cortical actomyosin, microtubules, and other sys-tems that do mechanical work to the system, whereas passiveforces arise primarily from deformation of cytoplasmic constitu-ents that absorb this input energy and convert it to heat (Fig. 1A).Conveniently, the latter are typically characterized by an effective
viscosity μ at the strain rates characteristic of morphogeneticmovements (5, 7, 8). In our method, the tissue is discretized intopolygonal regions, corresponding to cells or their parts or togroups of cells (Fig. 1B). When the corners of these regions aretracked during the process of interest, a large dataset results fromwhich the deformations in each region can be quantified as afunction of time. Finite element procedures or other techniquescan be used to calculate the forces that must act at the corners ofeach of these regions, based on their viscosity (or other materialproperties if such are known), to make them deform as observed(see SI Text). The appropriate corner forces from all of the regionsthat contact any given node are then added vectorially to deter-mine the net force that must act at that node to produce theobserved deformations of the passive components of the tissue(Fig. 1C). These required nodal forces are assumed to be gener-ated by active forces from actomyosin and other systems—which,in epithelia, typically act perpendicular and parallel to the apical-basal cell axis (Fig. 1A)—that can be resolved easily into equiva-lent loads (9) along specified line segments—typically the edges ofthe regions (Fig. 1D). Using this framework, one can ask whetherthere is a unique set of active forces able to generate these re-quired nodal forces and thereby reshape the passive componentsof the embryo as observed. The mathematical inverse problemimplied by this question is often poorly conditioned (10), but itcan be solved using the special methods described in SI Text.
The method presented here, which might also be called cine-mechanometry (CMM) (11), is fundamentally different fromtypical computational models. In those models, the researcheruses rational techniques to estimate the forces at work in the sys-tem and fine-tunes them so as to make the model output matchthe experimentally observed motions as closely as possible (4, 5),a process that can be quite tedious. Modeling of this type can bequite informative, but the uniqueness of the proposed set of driv-ing forces usually cannot be proven. In contrast, the presentmethod uses the large dataset of observed deformations as itsprimary input and from it directly calculates the forces that mustact to drive those motions.
Results and DiscussionTo demonstrate the potential of the method, we used it to inves-tigate ventral furrow formation in Drosophila melanogaster, a
Author contributions: G.W.B., M.S.H., and A.J. designed research; G.W.B., V.C., P.G.C.,J.V., F.U., and B.B. performed research; G.W.B., V.C., P.G.C., J.V., S.N., and F.U. contributednew reagents/analytic tools; G.W.B., V.C., J.V., B.B., and M.M. analyzed data; and G.W.B.,V.C., M.S.H., B.B., and M.M. wrote the paper.
The authors declare no conflict of interest.
This article is a PNAS Direct Submission.
Freely available online through the PNAS open access option.1To whom correspondence should be addressed. E-mail: [email protected].
This article contains supporting information online at www.pnas.org/lookup/suppl/doi:10.1073/pnas.1006591107/-/DCSupplemental.
www.pnas.org/cgi/doi/10.1073/pnas.1006591107 PNAS ∣ December 21, 2010 ∣ vol. 107 ∣ no. 51 ∣ 22111–22116
BIOPH
YSICSAND
COMPU
TATIONALBIOLO
GY
relatively simple and well-understood system that can be imagedat high spatial and temporal resolution (Fig. 2, first column ofFig. 3, and Movies S1–S4). A multiphoton microscope was usedto image WTembryos expressing Sqh (myosin II)-GFP. Embryoswere mounted end on, and optical cross-sections were imagedevery 45 s during the course of ventral furrow formation. Becausecell neighbor changes do not occur (12) and tissue motionsnormal to the image plane are negligible, individual cells remainessentially confined to the imaging plane.
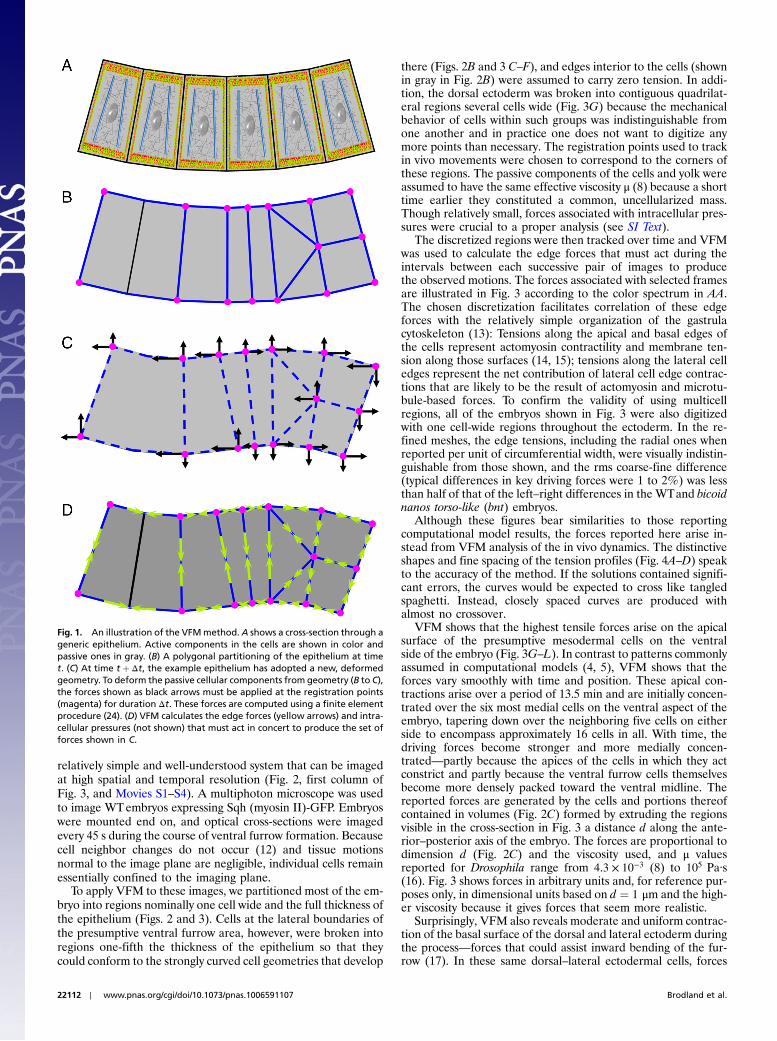
To apply VFM to these images, we partitioned most of the em-bryo into regions nominally one cell wide and the full thickness ofthe epithelium (Figs. 2 and 3). Cells at the lateral boundaries ofthe presumptive ventral furrow area, however, were broken intoregions one-fifth the thickness of the epithelium so that theycould conform to the strongly curved cell geometries that develop
there (Figs. 2B and 3 C–F), and edges interior to the cells (shownin gray in Fig. 2B) were assumed to carry zero tension. In addi-tion, the dorsal ectoderm was broken into contiguous quadrilat-eral regions several cells wide (Fig. 3G) because the mechanicalbehavior of cells within such groups was indistinguishable fromone another and in practice one does not want to digitize anymore points than necessary. The registration points used to trackin vivo movements were chosen to correspond to the corners ofthese regions. The passive components of the cells and yolk wereassumed to have the same effective viscosity μ (8) because a shorttime earlier they constituted a common, uncellularized mass.Though relatively small, forces associated with intracellular pres-sures were crucial to a proper analysis (see SI Text).
The discretized regions were then tracked over time and VFMwas used to calculate the edge forces that must act during theintervals between each successive pair of images to producethe observed motions. The forces associated with selected framesare illustrated in Fig. 3 according to the color spectrum in AA.The chosen discretization facilitates correlation of these edgeforces with the relatively simple organization of the gastrulacytoskeleton (13): Tensions along the apical and basal edges ofthe cells represent actomyosin contractility and membrane ten-sion along those surfaces (14, 15); tensions along the lateral celledges represent the net contribution of lateral cell edge contrac-tions that are likely to be the result of actomyosin and microtu-bule-based forces. To confirm the validity of using multicellregions, all of the embryos shown in Fig. 3 were also digitizedwith one cell-wide regions throughout the ectoderm. In the re-fined meshes, the edge tensions, including the radial ones whenreported per unit of circumferential width, were visually indistin-guishable from those shown, and the rms coarse-fine difference(typical differences in key driving forces were 1 to 2%) was lessthan half of that of the left–right differences in the WTand bicoidnanos torso-like (bnt) embryos.
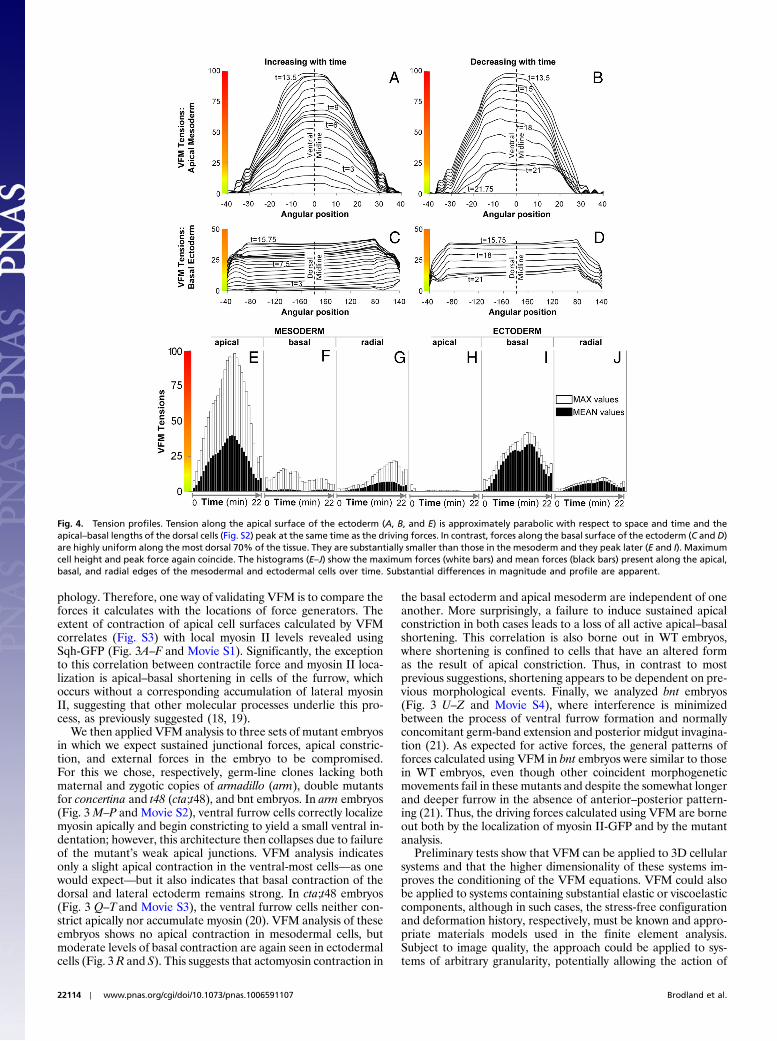
Although these figures bear similarities to those reportingcomputational model results, the forces reported here arise in-stead from VFM analysis of the in vivo dynamics. The distinctiveshapes and fine spacing of the tension profiles (Fig. 4A–D) speakto the accuracy of the method. If the solutions contained signifi-cant errors, the curves would be expected to cross like tangledspaghetti. Instead, closely spaced curves are produced withalmost no crossover.
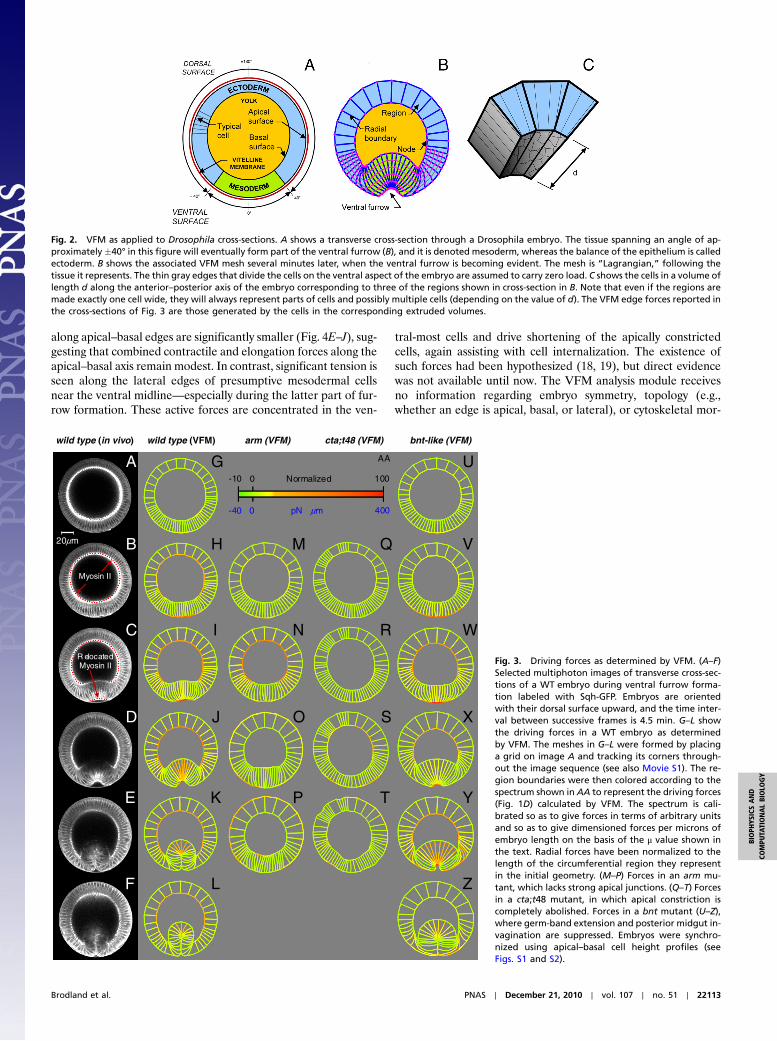
VFM shows that the highest tensile forces arise on the apicalsurface of the presumptive mesodermal cells on the ventralside of the embryo (Fig. 3G–L). In contrast to patterns commonlyassumed in computational models (4, 5), VFM shows that theforces vary smoothly with time and position. These apical con-tractions arise over a period of 13.5 min and are initially concen-trated over the six most medial cells on the ventral aspect of theembryo, tapering down over the neighboring five cells on eitherside to encompass approximately 16 cells in all. With time, thedriving forces become stronger and more medially concen-trated—partly because the apices of the cells in which they actconstrict and partly because the ventral furrow cells themselvesbecome more densely packed toward the ventral midline. Thereported forces are generated by the cells and portions thereofcontained in volumes (Fig. 2C) formed by extruding the regionsvisible in the cross-section in Fig. 3 a distance d along the ante-rior–posterior axis of the embryo. The forces are proportional todimension d (Fig. 2C) and the viscosity used, and μ valuesreported for Drosophila range from 4.3 × 10⁻³ (8) to 105 Pa·s(16). Fig. 3 shows forces in arbitrary units and, for reference pur-poses only, in dimensional units based on d ¼ 1 μm and the high-er viscosity because it gives forces that seem more realistic.
Surprisingly, VFM also reveals moderate and uniform contrac-tion of the basal surface of the dorsal and lateral ectoderm duringthe process—forces that could assist inward bending of the fur-row (17). In these same dorsal–lateral ectodermal cells, forces
Fig. 1. An illustration of the VFMmethod.A shows a cross-section through ageneric epithelium. Active components in the cells are shown in color andpassive ones in gray. (B) A polygonal partitioning of the epithelium at timet. (C) At time t þ Δt, the example epithelium has adopted a new, deformedgeometry. To deform the passive cellular components from geometry (B to C),the forces shown as black arrows must be applied at the registration points(magenta) for duration Δt. These forces are computed using a finite elementprocedure (24). (D) VFM calculates the edge forces (yellow arrows) and intra-cellular pressures (not shown) that must act in concert to produce the set offorces shown in C.
22112 ∣ www.pnas.org/cgi/doi/10.1073/pnas.1006591107 Brodland et al.
along apical–basal edges are significantly smaller (Fig. 4E–J), sug-gesting that combined contractile and elongation forces along theapical–basal axis remain modest. In contrast, significant tension isseen along the lateral edges of presumptive mesodermal cellsnear the ventral midline—especially during the latter part of fur-row formation. These active forces are concentrated in the ven-
tral-most cells and drive shortening of the apically constrictedcells, again assisting with cell internalization. The existence ofsuch forces had been hypothesized (18, 19), but direct evidencewas not available until now. The VFM analysis module receivesno information regarding embryo symmetry, topology (e.g.,whether an edge is apical, basal, or lateral), or cytoskeletal mor-
Fig. 2. VFM as applied to Drosophila cross-sections. A shows a transverse cross-section through a Drosophila embryo. The tissue spanning an angle of ap-proximately�40° in this figure will eventually form part of the ventral furrow (B), and it is denoted mesoderm, whereas the balance of the epithelium is calledectoderm. B shows the associated VFM mesh several minutes later, when the ventral furrow is becoming evident. The mesh is “Lagrangian,” following thetissue it represents. The thin gray edges that divide the cells on the ventral aspect of the embryo are assumed to carry zero load. C shows the cells in a volume oflength d along the anterior–posterior axis of the embryo corresponding to three of the regions shown in cross-section in B. Note that even if the regions aremade exactly one cell wide, they will always represent parts of cells and possibly multiple cells (depending on the value of d). The VFM edge forces reported inthe cross-sections of Fig. 3 are those generated by the cells in the corresponding extruded volumes.
wild type (in vivo) wild type (VFM) arm (VFM) cta;t48 (VFM) bnt-like (VFM)
20µm
K
L
E
F
T Y
Z
P
A G
H
N
J
B
C
D
M Q
RI
O S
U
V
X
W
Myosin II
100Normalized0-10
R elocatedMyosin II
pN µm
AA
4000-40
Fig. 3. Driving forces as determined by VFM. (A–F)Selected multiphoton images of transverse cross-sec-tions of a WT embryo during ventral furrow forma-tion labeled with Sqh-GFP. Embryos are orientedwith their dorsal surface upward, and the time inter-val between successive frames is 4.5 min. G–L showthe driving forces in a WT embryo as determinedby VFM. The meshes in G–L were formed by placinga grid on image A and tracking its corners through-out the image sequence (see also Movie S1). The re-gion boundaries were then colored according to thespectrum shown in AA to represent the driving forces(Fig. 1D) calculated by VFM. The spectrum is cali-brated so as to give forces in terms of arbitrary unitsand so as to give dimensioned forces per microns ofembryo length on the basis of the μ value shown inthe text. Radial forces have been normalized to thelength of the circumferential region they representin the initial geometry. (M–P) Forces in an arm mu-tant, which lacks strong apical junctions. (Q–T) Forcesin a cta;t48 mutant, in which apical constriction iscompletely abolished. Forces in a bnt mutant (U–Z),where germ-band extension and posterior midgut in-vagination are suppressed. Embryos were synchro-nized using apical–basal cell height profiles (seeFigs. S1 and S2).
Brodland et al. PNAS ∣ December 21, 2010 ∣ vol. 107 ∣ no. 51 ∣ 22113
BIOPH
YSICSAND
COMPU
TATIONALBIOLO
GY
phology. Therefore, one way of validating VFM is to compare theforces it calculates with the locations of force generators. Theextent of contraction of apical cell surfaces calculated by VFMcorrelates (Fig. S3) with local myosin II levels revealed usingSqh-GFP (Fig. 3A–F and Movie S1). Significantly, the exceptionto this correlation between contractile force and myosin II loca-lization is apical–basal shortening in cells of the furrow, whichoccurs without a corresponding accumulation of lateral myosinII, suggesting that other molecular processes underlie this pro-cess, as previously suggested (18, 19).
We then applied VFM analysis to three sets of mutant embryosin which we expect sustained junctional forces, apical constric-tion, and external forces in the embryo to be compromised.For this we chose, respectively, germ-line clones lacking bothmaternal and zygotic copies of armadillo (arm), double mutantsfor concertina and t48 (cta;t48), and bnt embryos. In arm embryos(Fig. 3M–P and Movie S2), ventral furrow cells correctly localizemyosin apically and begin constricting to yield a small ventral in-dentation; however, this architecture then collapses due to failureof the mutant’s weak apical junctions. VFM analysis indicatesonly a slight apical contraction in the ventral-most cells—as onewould expect—but it also indicates that basal contraction of thedorsal and lateral ectoderm remains strong. In cta;t48 embryos(Fig. 3 Q–T and Movie S3), the ventral furrow cells neither con-strict apically nor accumulate myosin (20). VFM analysis of theseembryos shows no apical contraction in mesodermal cells, butmoderate levels of basal contraction are again seen in ectodermalcells (Fig. 3 R and S). This suggests that actomyosin contraction in
the basal ectoderm and apical mesoderm are independent of oneanother. More surprisingly, a failure to induce sustained apicalconstriction in both cases leads to a loss of all active apical–basalshortening. This correlation is also borne out in WT embryos,where shortening is confined to cells that have an altered formas the result of apical constriction. Thus, in contrast to mostprevious suggestions, shortening appears to be dependent on pre-vious morphological events. Finally, we analyzed bnt embryos(Fig. 3 U–Z and Movie S4), where interference is minimizedbetween the process of ventral furrow formation and normallyconcomitant germ-band extension and posterior midgut invagina-tion (21). As expected for active forces, the general patterns offorces calculated using VFM in bnt embryos were similar to thosein WT embryos, even though other coincident morphogeneticmovements fail in these mutants and despite the somewhat longerand deeper furrow in the absence of anterior–posterior pattern-ing (21). Thus, the driving forces calculated using VFM are borneout both by the localization of myosin II-GFP and by the mutantanalysis.
Preliminary tests show that VFM can be applied to 3D cellularsystems and that the higher dimensionality of these systems im-proves the conditioning of the VFM equations. VFM could alsobe applied to systems containing substantial elastic or viscoelasticcomponents, although in such cases, the stress-free configurationand deformation history, respectively, must be known and appro-priate materials models used in the finite element analysis.Subject to image quality, the approach could be applied to sys-tems of arbitrary granularity, potentially allowing the action of
Fig. 4. Tension profiles. Tension along the apical surface of the ectoderm (A, B, and E) is approximately parabolic with respect to space and time and theapical–basal lengths of the dorsal cells (Fig. S2) peak at the same time as the driving forces. In contrast, forces along the basal surface of the ectoderm (C and D)are highly uniform along the most dorsal 70% of the tissue. They are substantially smaller than those in the mesoderm and they peak later (E and I). Maximumcell height and peak force again coincide. The histograms (E–J) show the maximum forces (white bars) and mean forces (black bars) present along the apical,basal, and radial edges of the mesodermal and ectodermal cells over time. Substantial differences in magnitude and profile are apparent.
22114 ∣ www.pnas.org/cgi/doi/10.1073/pnas.1006591107 Brodland et al.
single cytoskeletal components, the forces relieved by laserablation experiments, or the bulk forces in whole tissues to bedetermined.
As this study illustrates, video force microscopy is able to re-solve forces that drive morphogenetic movements with subcellu-lar spatial detail and subminute temporal resolution. VFMmakesit possible to identify force irregularities in single cells, quantifycell-to-cell variability, and correlate force generation with cell-level gene expression. This information has the potential tochange the way morphogenetic movements associated with em-bryogenesis, wound healing, and tissue engineering are studiedand the way that computational models are applied. As the pre-sent analysis of ventral furrow formation suggests, VFM has thepotential to become an important biomechanical tool for mode-lers and biologists alike.
Methods and MaterialsAt midcellularization stage, embryos were dechorionated for2 min at room temperature in 50% bleach, followed by severalwashes with PBS. They were kept in PBS for several hours with-out apparent developmental delays or problems. To geneticallyabolish anterior–posterior polarity, germ-band extension, andposterior midgut invagination, we used the stock w; Sqh-GFP42;bicoidE1 nanosL7 torso-like146∕TM3 Sb and analyzed progenyfrom mothers homozygous for bicoidE1 nanosL7 torso-like146 (inshort: Sqh-GFP; bnt embryos). To specifically block apical con-striction, we used w, Sqh-GFP42; ctaR10∕CyO; Dfð3RÞCC1.2∕TM3 Sb stocks. The Df(3R)CC1.2 deletion uncovers the t48locus. Twenty-five percent of progeny from homozygous ctaR10
parents showed a complete absence of apical constriction as de-scribed by ref. 20 and were thus assumed to be Sqh-GFP; cta;t48embryos. We generated armadillo germ-line clones using theFlipase-Recombination-Target Dominant-Female Sterile (FLP-DFS) system (22). By crossing arm043A01 FRT101/FM7; Sqh-GFP42
females to w ovoD FRT101∕Y; flp-138 males, we obtainedarm043A01FRT101∕w ovoD FRT101; flp-138∕þ females. Thesefemales were heat shocked as larvae for 2 h at 37 °C to inducemitotic recombination in the germ line and crossed to FM7∕þ;flp-138∕þ males.
Transgenic Sqh-GFP embryos were mounted vertically in 1%agarose in PBS on Mattek culture dishes, with the posteriorend facing the objective. They were imaged on a custom-builttwo-photon microscope, using a Nikon 40× NA 0.8 objectiveand simultaneous epi- and transdetection as described in ref. 23.We used laser lines between 890 and 910 nm. A 488-nm laser withan output power of 15W generated 150-mW laser pulses between890 and 910 nm at the level of the objective. Embryos imagedunder these conditions were able to develop normally afterward.Imaging depth was 110 μm from the posterior end of the embryo,and images were acquired every 45 s with MATLAB. Note thatthe furrow is extended in bnt embryos.
Custom software was used to generate a reference grid thatwas adjusted manually to fit the first image of each set. A com-
bination of automated and manual methods was used to track theregistration points from image to image. Custom software wasused to play multiple frames forward and back so that the loca-tion of the registration points could be placed with precision.Many of the tracked points fell at the corners of cells. The spacingof multiple points along radial edges was kept even with the aid ofsoftware. Constant-volume algorithms facilitated placement ofbasal registration points when the basal edge of the cell wasdifficult to discern.
To calculate the forces needed to deform the passive compo-nents of the cells, a finite element procedure based on the ap-proach of Brodland et al. (24) was used. Because the contentsof the epithelial and mesodermal cells were still contiguous withthe yolk, the cells and the yolk were assumed to have the sameviscosity μ. These forces f i at time step i were assumed to be equalto the matrix product ½Ci�f _uig, where Ci is a finite element-baseddamping matrix based on μ and the current geometry of each re-gion, and _ui is the vector of nodal velocities between successiveimages. The strain rates are assumed to be sufficiently low thatinertial and elastic forces can be ignored (7, 17). Further details ofthe calculations are given in SI Text and in ref. 11. To determinethe active forces acting along each region boundary, matrix equa-tions relating edge forces and intracellular pressures to nodalforces were written. These took the general form
½GðTÞi jGðPÞ
i ��tipi
�¼ f i; [1]
whereGðTÞi is a matrix of direction cosines that converts ti a vector
of edge tensions into equivalent nodal loads, whereas GðPÞi is a
matrix that calculates the equivalent joint (nodal) loads producedby the intracellular pressures pi. In essence, VFM determines thetensions ti and pressures pi, given the current geometry—fromwhich the G matrices are calculated—and the viscous nodalforces f i. To improve the quality of the solutions to these equa-tions, they were solved over multiple steps using a variable for-getting factor approach (10, 25, 26).
ACKNOWLEDGMENTS. We thank Adam Martin (Massachusetts Institute ofTechnology, Boston, MA) for providing Sqh-GFP arm GLC embryos and MariaLeptin (Cologne University, Cologne, Germany) for providing w; ctaR10∕CyO;Df(3R)CC1.2 stocks. We also thank Eric Wieschaus (Princeton University, Prin-ceton, NJ) in whose lab the biological data were collected and the HowardHughes Medical Institution and National Institutes of Health that fundedthat work. Stephan Thiberge (Princeton University, Princeton, NJ) assistedwith obtaining the time-lapse images and some of the images were digitizedby Jordan Lui and Marianella Cascante (University of Waterloo, Waterloo,ON, Canada). Funding was provided by the Human Frontiers Science Program(to G.W.B., W.S.H., and A.J.), by the Natural Sciences and EngineeringResearch Council of Canada (to G.W.B. and S.N.), by the Engineering andPhysical Science Research Council of the United Kingdom (to M.M. andV.C.), by the New Jersey Commission of Cancer Research (to F.U.), and bythe Royal Society (to B.B.).
1. Puech P, et al. (2005) Measuring cell adhesion forces of primary gastrulating cells from
zebrafish using atomic force microscopy. J Cell Sci 118:4199–4206.
2. Krieg M, et al. (2008) Tensile forces govern germ-layer organization in zebrafish. Nat
Cell Biol 10:429–436.
3. HutsonMS, et al. (2009) Combining laser microsurgery and finite element modeling to
assess cell-level epithelial mechanics. Biophys J 97:3075–3085.
4. Conte V, Muñoz JJ, Baum B, Miodownik M (2009) Robust mechanisms of ventral
furrow invagination require the combination of cellular shape changes. Phys Biol
6:016010, 10.1088/1478-3975/6/1/016010.
5. Chen X, BrodlandGW (2008)Multi-scale finite elementmodeling allows themechanics
of amphibian neurulation to be elucidated. Phys Biol 5:015003 10.1088/1478-3975/5/1/
015003.
6. Brodland GW, Chen DI, Veldhuis JH (2006) A cell-based constitutive model for embryo-
nic epithelia and other planar aggregates of biological cells. Int J Plasticity 22:965–995.
7. Lecuit T, Lenne P (2007) Cell surface mechanics and the control of cell shape, tissue
patterns and morphogenesis. Nat Rev Mol Cell Bio 8:633–644.
8. Gregor T, Bialek W, de Ruyter van Steveninck RR, Tank DW, Wieschaus EF (2005)Diffusion and scaling during early embryonic pattern formation. Proc Natl Acad SciUSA 102:18403–18407.
9. Brodland GW, Clausi DA (1994) Embryonic tissue morphogenesis modeled by FEM.J Biomech Eng 116:146–155.
10. Lin J, Betti R (2003) On-line identification and damage detection in non-linearstructural systems using a variable forgetting factor approach. Earthq Eng Struct D33:419–444.
11. Cranston PG, Veldhuis JH, Narasimhan S, Brodland GW (2010) Cinemechanometry(CMM): A method to determine the forces that drive morphogenetic movements fromtime-lapse images. Ann Biomed Eng 38:2937–2947.
12. Blankenship JT, Backovic ST, Sanny JS, Weitz O, Zallen JA (2006) Multicellular rosetteformation links planar cell polarity to tissue morphogenesis. Dev Cell 11:459–470.
13. Young PE, Pesacreta TC, Kiehart DP (1991) Dynamic changes in the distribution ofcytoplasmic myosin during drosophila embryogenesis. Development 111:1–14.
14. Royou A, Field C, Sisson JC, Sullivan W, Karess R (2004) Reassessing the role anddynamics of nonmuscle myosin II during furrow formation in early drosophilaembryos. Mol Biol Cell 15:838–850.
Brodland et al. PNAS ∣ December 21, 2010 ∣ vol. 107 ∣ no. 51 ∣ 22115
BIOPH
YSICSAND
COMPU
TATIONALBIOLO
GY
15. Dawes-Hoang RE, et al. (2005) Folded gastrulation, cell shape change and the controlof myosin localization. Development 132:4165–4178.
16. Bittig T, Wartlick O, Kicheva A, Gonzalez-Gaitan M, Julicher F (2008) Dynamics ofanisotropic tissue growth. New J Phys 10:063001.
17. Clausi DA, Brodland GW (1993)Mechanical evaluation of theories of neurulation usingcomputer simulations. Development 118:1013–1023.
18. Costa M, Sweeton D, Wieschaus E (1993) The Development of Drosophila melanoga-ster, eds Bate Michael and Alfonso Martinez Arias (Cold Spring Harbor Lab, ColdSpring Harbor, NY) p 425.
19. Leptin M (1999) Gastrulation in drosophila: The logic and the cellular mechanisms.EMBO J 18:3187–3192.
20. Kolsch V, Seher T, Fernandez-Ballester GJ, Serrano L, Leptin M (2007) Control ofdrosophila gastrulation by apical localization of adherens junctions and RhoGEF2.Science 315:384–386.
21. Desprat N, Supatto W, Pouille PA, Beaurepaire E, Farge E (2008) Tissue deformationmodulates twist expression to determine anterior midgut differentiation in drosophilaembryos. Dev Cell 15:470–477.
22. Chou TB, Perrimon N (1992) Use of a yeast site-specific recombinase to produce femalegermline chimeras in drosophila. Genetics 131:643–653.
23. Helmchen F, Denk W (2005) Deep tissue two-photon microscopy. Nat Methods2:932–940.
24. BrodlandGW, Viens D, Veldhuis JH (2007) A new cell-based FEmodel for themechanicsof embryonic epithelia. Comp Met Biomech Biomed Eng 10:121–128.
25. Fortescue TR, Kershenbaum LS, Ydstie BE (1981) Implementation of self-tuningregulators with variable forgetting factors. Automatica 17:831–835.
26. Paleologu C, Benesty J, Ciochina S (2008) A robust variable forgetting factor recursiveleast-squares algorithm for system identification. IEEE Signal Proc Let 15:597–600.
22116 ∣ www.pnas.org/cgi/doi/10.1073/pnas.1006591107 Brodland et al.