Embed Size (px)
Citation preview

VIDEO BASED DETECTION OF DRIVER FATIGUE
byESRA VURAL
Submitted to the Graduate School of Engineering and NaturalSciences
in partial fulfillment ofthe requirements for the degree of
Doctor of Philosophy
Sabanci UniversitySpring 2009

VIDEO BASED DETECTION OF DRIVER FATIGUE
APPROVED BY
Assist. Prof. Dr. Mujdat CETIN ..............................................(Thesis Supervisor)
Prof. Dr. Aytul ERCIL ..............................................(Thesis Co-Advisor)
Prof. Dr. Javier MOVELLAN ..............................................
Prof. Dr. Marian Stewart BARTLETT ..............................................
Assist. Prof. Dr. Hakan ERDOGAN ..............................................
Assist. Prof. Dr. Selim BALCISOY ..............................................
DATE OF APPROVAL: ..............................................

c!Esra Vural 2009All Rights Reserved

To the memory of Erdal Inonu
Acknowledgments
There are many people who have contributed to this work and have supportedme throughout this journey. Thus my sincere gratitude goes to my advisers,mentors, all my friends and my family for their love, support, and patienceover the last few years.
I am grateful to my supervisor Mujdat Cetin for his helpful discussions,motivating suggestions and guidance throughout the thesis. I would like toalso thank him for being very patient, supportive and helpful throughout mygraduate years. I would like to express my special thanks to my co-adviserAytul Ercil for her support and guidance. I would like to also thank herfor initiating Drive-Safe project and supporting me throughout this process.I am grateful to her for accepting me to the friendly and encouraging en-vironment of Computer Vision and Pattern Analysis Laboratory, SabanciUniversity.
I would like to express my deep gratitude to my mentor Javier Movel-lan for his guidance, suggestions, invaluable encouragement and generositythroughout the development of the thesis. I owe acknowledgement to himfor welcoming me to the Machine Perception Laboratory, University of Cali-fornia San Diego and making me feel at home. I am very grateful to him forbeing very generous of his time and energy for the project regardless of hisvery busy schedule. His enthusiasm, positiveness and great ideas made thisjourney a fascinating experience.
I would like to express my special thanks to my mentor Marian StewartBartlett for her kind suggestions, guidance and brilliant ideas in developingthe thesis. I owe gratitude to her for guiding me in writing publications andfor showing infinite patience in correcting many of my mistakes through-out the process. This work uses the output from the Computer ExpressionRecognition Toolbox (CERT) which is developed by Machine Perception Labresearchers as a result of many years of research and hard work. I would like
v

to especially thank her and all the colleagues in Machine Perception Lab forbuilding CERT and making this work possible.
Many thanks to my committee members Hakan Erdogan and Selim Bal-cisoy for reviewing the thesis and providing very useful feedback.
I am grateful to my friends from Computer Vision and Pattern AnalysisLaboratory for being very supportive. Many thanks to Rahmi Ficici andGulbin Akgun for their support and help. I would like to thank my friendsDiana Florentina Soldea, Soldea Octavian, Ozben Onhon, Serhan Cosar,Ozge Batu for their kindness.
I am grateful to my colleagues from Machine Perception Laboratory forbeing so helpful and nice. I would like to thank Gwen Littlewort for here!ort in improving CERT and her great discussions and friendly approach.I warmly thank Tingfan Wu for his valuable advice and friendly help. Hisextensive discussions around my work and interesting explorations have beenvery helpful for this study. Many thanks to Luis Palacious for his great help insystem administration and patient approach to my questions. I would like tothank Andrew Salamon for making CERT a reality. I would also like to thankNick Butko, Paul Ruvolo and Jacob Whitehill for their helpful discussions.Finally I would like to thank Kelly Hudson in making my experience withadministrative issues very smooth.
My biggest gratitude is to my family. I am grateful to my parents andsister for their infinite moral support and help throughout my life. I owe ac-knowledgment to them for their encouragement, and love throughout di"culttimes in my graduate years.
vi
Abstract
This thesis addresses the problem of drowsy driver detection using com-puter vision techniques applied to the human face. Specifically we explorethe possibility of discriminating drowsy from alert video segments using fa-cial expressions automatically extracted from video. Several approaches werepreviously proposed for the detection and prediction of drowsiness. Therehas recently been increasing interest in computer vision approaches as it isa potentially promising approach due to its non-invasive nature for detect-ing drowsiness. Previous studies with vision based approaches detect driverdrowsiness primarily by making pre-assumptions about the relevant behavior,focusing on blink rate, eye closure, and yawning. Here we employ machinelearning to explore, understand and exploit actual human behavior duringdrowsiness episodes. We have collected two datasets including facial and headmovement measures. Head motion is collected through an accelerometer forthe first dataset (UYAN-1) and an automatic video based head pose detectorfor the second dataset (UYAN-2). We use outputs of the automatic classifiersof the facial action coding system (FACS) for detecting drowsiness. Thesefacial actions include blinking and yawn motions, as well as a number of otherfacial movements. These measures are passed to a learning-based classifierbased on multinomial logistic regression. In UYAN-1 the system is able topredict sleep and crash episodes during a driving computer game with 0.98performance area under the receiver operator characteristic curve for acrosssubjects tests. This is the highest prediction rate reported to date for detect-ing real drowsiness. Moreover, the analysis reveals new information abouthuman facial behavior during drowsy driving. In UYAN-2 fine discrimina-tion of drowsy states are also explored on a separate dataset. The degree towhich individual facial action units can predict the di!erence between mod-erately drowsy to acutely drowsy is studied. Signal processing techniquesand machine learning methods are employed to build a person independentacute drowsiness detection system. Temporal dynamics are captured using abank of temporal filters. Individual action unit predictive power is exploredwith an MLR based classifier. Best performing five action units have beendetermined for a person independent system. The system is able to obtain

0.96 performance of area under the receiver operator characteristic curve fora more challenging dataset with the combined features of the best performing5 action units. Moreover the analysis reveals new markers for di!erent levelsof drowsiness.
Keywords: Fatigue Detection, Driver Drowsiness Detection, ComputerVision, Automatic Facial Expression Recognition, Machine Learning, Multi-nomial Logistic Regression, Gabor Filters, Temporal Analysis, Iterative Fea-ture Selection, Facial Action Coding System (FACS), Head Motion
viii

ÖzetBu doktora tezinde yüze uygulanan bilgisayar görü teknikleri kullanılarak
sürücüde uykululu#un sezimi problemi ele alınmı$tır. Özellikle uykulu görüntükesitlerinin uykusuz görüntü kesitlerinden yüz ifadeleri aracılı#ıyla ayrıla-bilirli#i ke$fedilmeye çalı$ılmı$tır. Geçmi$te uykululu#un sezimi ve tahminiicin ce$itli yakla$ımlar önerilmi$tir. Uykulu sürücü seziminde bilgisayarlagörü yakla$ımlarının umut vaad eden ve müdehaleci olmayan özellikleri sonyıllarda bu yakla$ımlara ilgiyi arttırmaktadır. Bilgisayar görü yakla$ımıylaçalı$an önceki calı$malar uykulu sürücü seziminde ba$lıca varsayımlar olangöz kırpma hızı, göz kapama, ve esneme gibi uygun davranı$lara odaklan-maktadır. Burada makine ö#renme tekniklerini kullanarak uykululuk kesit-lerinde gerçek insan davranı$ını ara$tırmayı, anlamayı ve kullanmayı hede-flemekteyiz. Bu çalı$ma icin yüz ölçümleri ve ba$ hareketleri ölçümleriniiçeren iki veri kümesi toplanmı$tır. Ba$ hareketi verileri ilk veri kümesindebir ivmeölçer cihazi ile ikinci veri kümesinde ise otomatik görüntü tabanlıba$ pozisyonu sezici yardımıyla toplanmı$tır. Yüz hareket kodlama sistemi(FACS) otomatik sınıflandırıcılarının çıktıları uykulu sürücü seziminde kul-lanılmaktadır. Bu hareket birimleri göz kapama esneme ve de birkaç ek yüzhareketini barındırmaktadır. Bu ölçüler ö#renme tabanlı sınıflandırıcı olanLojistik Ba#lanım Sınıflandırıcılarına (MLR) geçirilmi$tir. Sistem birinci verikümesi icin bir bilgisayar sürü$ simülasyonu kullanan deneklerin uykulu veuykusuz kesitlerini ki$i ba#ımsız testler icin ROC (Receiver Operating Char-acteristics) e#risi altında kalan alan hesabında 0.98 ba$arı elde etmi$tir. Buuykululu#un seziminde en yüksek tahmin oranıdır. Ayrıca analiz uykululuktainsan yüz davranı$ı icin yeni bilgiler ortaya koymaktadır. Uykulu hallerinince ayrımı iki veri kümesinde ara$tırılmı$tır. Bireysel yüz hareket birim-lerinin ne derecede orta ve ileri dereceli uykululuk farkını tespit edebilece#içalı$ılmı$tır. Sinyal i$leme teknikleri ve makina ö#renme yontemleri kul-lanılarak ki$i ba#ımsız ileri derecede uykululuk sezim sistemi kurulmustur.Zamandaki dinamik bilgi zamansal filtre bankası kullanılarak çıkarılmı$tır.Bireysel hareket ünitelerinin tahmin gücü MLR tabanlı sınıflandırıcılar kul-lanılarak ara$tırılmıstır. En iyi performansı veren be$ hareket birimi insan

ba#ımsız bir sistem icin belirlenmi$tir. Sistem 5 hareket ünitesinin öznite-liklerini birle$tiren bir sınıflandırıcı için daha zorlu bir veri kümesinde ROC(Receiver Operating Characteristics) e#risi altında kalan alan hesabında 0.96ba$arı göstermektedir. Ayrıca analiz de#i$ik seviyelerdeki uykululuk için yenibelirteçler ortaya koymaktadır.
Anahtar Sozcükler : Yorgunlu#un Sezimi, Sürücüde Uykululu#un Sezimi,Bilgisayar Görü Sistemleri, Otomatik Yüz %fadeleri Tanıma Sistemi, MakinaÖ#renmesi, Lojistik Ba#lanım Sınıflandırıcıları, Gabor Filtreleri, ZamansalAnaliz, Öznitelik Seçimi, Yüz Hareket Kodlama Sistemi, Ba$ Hareketleri
x

Contents
Acknowledgments v
Abstract vii
Ozet ix
1 Introduction 21.1 Problem Definition . . . . . . . . . . . . . . . . . . . . . . . . 21.2 Solution Approach . . . . . . . . . . . . . . . . . . . . . . . . 31.3 Significance of the Problem . . . . . . . . . . . . . . . . . . . 31.4 Contributions . . . . . . . . . . . . . . . . . . . . . . . . . . . 61.5 Outline . . . . . . . . . . . . . . . . . . . . . . . . . . . . . . . 7
2 Background 82.1 Background on Fatigue Detection and Prediction Technologies 8
2.1.1 Fitness for Duty Technologies . . . . . . . . . . . . . . 82.1.2 Ambulatory Alertness Prediction Technologies . . . . . 92.1.3 Vehicle-based Performance Technologies . . . . . . . . 92.1.4 In-vehicle, On-line, Operator Status Monitoring Tech-
nologies : Behavioral Studies using Physiological Signals 112.1.5 In-vehicle, On-line, Operator Status Monitoring Tech-
nologies : Behavioral Studies using Computer VisionSystems . . . . . . . . . . . . . . . . . . . . . . . . . . 122.1.5.1 Facial Action Coding System . . . . . . . . . 152.1.5.2 Spontaneous Expressions . . . . . . . . . . . . 162.1.5.3 The Computer Expression Recognition Tool-
box (CERT) . . . . . . . . . . . . . . . . . . 172.2 Background on Machine Learning Techniques . . . . . . . . . 19
xi

2.2.1 System Evaluation : Receiver operating characteristic(ROC) . . . . . . . . . . . . . . . . . . . . . . . . . . . 19
2.2.2 Signal Processing . . . . . . . . . . . . . . . . . . . . . 212.2.2.1 Gabor Filter . . . . . . . . . . . . . . . . . . 21
2.2.3 Adaboost . . . . . . . . . . . . . . . . . . . . . . . . . 232.2.4 Support Vector Machines (SVM) . . . . . . . . . . . . 242.2.5 Multinomial Logistic Regression (MLR) . . . . . . . . 24
3 Study I : Detecting Drowsiness 263.1 UYAN-1 Dataset . . . . . . . . . . . . . . . . . . . . . . . . . 273.2 Head movement measures . . . . . . . . . . . . . . . . . . . . 273.3 Facial Action Classifiers . . . . . . . . . . . . . . . . . . . . . 273.4 Facial action signals . . . . . . . . . . . . . . . . . . . . . . . . 313.5 Drowsiness prediction . . . . . . . . . . . . . . . . . . . . . . . 34
3.5.1 Within subject drowsiness prediction. . . . . . . . . . . 343.5.2 Across subject drowsiness prediction. . . . . . . . . . . 35
3.6 Coupling of Steering and Head Motion . . . . . . . . . . . . . 383.7 Coupling of eye openness and eyebrow raise. . . . . . . . . . 393.8 Conclusion . . . . . . . . . . . . . . . . . . . . . . . . . . . . . 40
4 Study II : Fine Discrimination of Fatigue States 414.1 UYAN-2 Dataset . . . . . . . . . . . . . . . . . . . . . . . . . 42
4.1.1 Experimental Setup . . . . . . . . . . . . . . . . . . . . 424.1.2 Measures of Drowsiness . . . . . . . . . . . . . . . . . . 434.1.3 Subject Variability . . . . . . . . . . . . . . . . . . . . 434.1.4 Extraction of Facial Expressions . . . . . . . . . . . . . 43
4.2 Discriminating Acute versus Moderate Drowsiness Using RawAction Unit Output . . . . . . . . . . . . . . . . . . . . . . . . 50
4.3 Discriminating Acute versus Moderate Drowsiness Using Tem-poral Gabor Filter Output . . . . . . . . . . . . . . . . . . . . 61
4.4 Predictive Power of Individual Gabor Filters . . . . . . . . . . 674.5 Feature Selection . . . . . . . . . . . . . . . . . . . . . . . . . 71
4.5.1 Eye Closure (AU45) . . . . . . . . . . . . . . . . . . . 714.5.2 Lip Pucker (AU18) . . . . . . . . . . . . . . . . . . . . 744.5.3 Head Roll (AU55-AU56) . . . . . . . . . . . . . . . . . 774.5.4 Lid Tighten (AU7) . . . . . . . . . . . . . . . . . . . . 804.5.5 Nose Wrinkle (AU9) . . . . . . . . . . . . . . . . . . . 83
4.6 Combining Multiple Action Units . . . . . . . . . . . . . . . . 86
xii

4.7 Conclusions . . . . . . . . . . . . . . . . . . . . . . . . . . . . 89
5 Conclusions and Future Work 915.1 Conclusions . . . . . . . . . . . . . . . . . . . . . . . . . . . . 915.2 Future Work . . . . . . . . . . . . . . . . . . . . . . . . . . . . 92
Bibliography 95
Bibliography 95
xiii
List of Figures
1.1 The figure displays the relationship between number of hoursdriven and the percent of crashes related to driver fatigue [4]. 5
2.1 AAlert wristband driver drowsiness detection device developedby Dan Ru&e. The device uses motion combined with reactiontime to determine whether or not the driver is in a drowsystate. . . . . . . . . . . . . . . . . . . . . . . . . . . . . . . . 10
2.2 Driver State Sensor (DSS) device developed by SeeingMa-chines. DSS uses eyelid opening as a measure to infer thedrowsiness state. . . . . . . . . . . . . . . . . . . . . . . . . . 13
2.3 Example facial action decomposition from the Facial ActionCoding System [23]. . . . . . . . . . . . . . . . . . . . . . . . . 16
2.4 Overview of fully automated facial action coding system . . . 172.5 The true positive rate (TPR) and false positive rate (FPR) of
positive and negative instances for a certain threshold. ROCplot is obtained by plotting true positives against false posi-tives as the decision threshold shifts from 0 to 100% detections. 21
3.1 Outline of the Fatigue Detection System . . . . . . . . . . . . 263.2 Driving simulation task . . . . . . . . . . . . . . . . . . . . . . 283.3 An Improved version of CERT is used for this study. The
figure displays the sample facial actions from the Facial ActionCoding System incorporated in CERT . . . . . . . . . . . . . 31
3.4 Histograms for blink and Action Unit 2 in alert and non-alertstates. A’ is area under the ROC. . . . . . . . . . . . . . . . . 32
3.5 Performance for drowsiness detection in novel subjects overtemporal window sizes. . . . . . . . . . . . . . . . . . . . . . . 38
xiv

3.6 Head motion and steering position for 60 seconds in an alertstate (left) and 60 seconds prior to a crash (right). Head mo-tion is the output of the roll dimension of the accelerometer. . 39
3.7 Action Unit Intensities for Eye Openness (red/black) and EyeBrow Raises (AU2) (Blue/gray) for 10 seconds in an alert state(left) and 10 seconds prior to a crash (right). . . . . . . . . . 40
4.1 In this task samples of real sleep episodes were collected from11 subjects while they were performing a driving simulatortask at midnight for an entire 3 hour session. . . . . . . . . . . 43
4.2 Facial expressions are measured automatically using the Com-puter Expression Recognition Toolbox (CERT). 22 Action Unitsfrom the Facial Action Coding System (Ekman & Friesen,1978) are measured. Head and body motion are measuredusing the motion capture facility, as well as the steering sig-nal. Measures of alertness include EEG, distance to the roadcenter, and simulator crash. For the context of the thesis sim-ulator crash is being used as a measure of drowsiness.. . . . . . 44
4.3 Figure displays the histograms of eye closure (AU45) signal forindividual subjects summed over 10 second segments of acutedrowsy and moderate drowsy samples. The red histogram cor-responds to the acute drowsy samples and the blue histogramcorresponds to moderately drowsy samples. Here 9 subjectsare plotted as 2 subjects do not have either AD or MD sam-ples. The A’ here is computed using the samples of the subjectwithout multiplying with training weight. . . . . . . . . . . . 54
4.4 Figure displays the histograms of head roll signal for individualsubjects summed over 10 second segments of acute drowsy andmoderate drowsy samples. The red histogram corresponds tothe acute drowsy samples and the blue histogram correspondsto moderately drowsy samples. Here 9 subjects are plottedas 2 subjects do not have either AD or MD samples. TheA’ here is computed using the samples of the subject withoutmultiplying with training weight. . . . . . . . . . . . . . . . . 55
xv

4.5 Figure displays the histograms of lip pucker (AU18) signal forindividual subjects summed over 10 second segments for acutedrowsy and moderate drowsy samples. The red histogram cor-responds to the acute drowsy samples and the blue histogramcorresponds to moderately drowsy samples. Here 9 subjectsare plotted as 2 subjects do not have either AD or MD sam-ples. The A’ here is computed using the samples of the subjectand without using a training weight. . . . . . . . . . . . . . . 56
4.6 Figure displays the histograms of summed lid tighten (AU7)signal for individual subjects summed over 10 second segmentsof acute drowsy and moderate drowsy samples. The red his-togram corresponds to the acute drowsy samples and the bluehistogram corresponds to moderately drowsy samples. Here 9subjects are plotted as 2 subjects do not have either AD orMD samples. The A’ here is computed using the samples ofthe subject without multiplying with a training weight. . . . 57
4.7 Figure displays the histograms of summed nose wrinkle (AU9)signal for individual subjects summed over 10 second segmentsof acute drowsy and moderate drowsy samples. The red his-togram corresponds to the acute drowsy samples and the bluehistogram corresponds to moderately drowsy samples. Here 9subjects are plotted as 2 subjects do not have either AD orMD samples. The A’ here is computed using the samples ofthe subject without multiplying with a training weight. . . . 58
4.8 Figure displays the histograms of upper lid raiser (AU10) sig-nal for individual subjects summed over 10 second segmentsfor acute drowsy and moderate drowsy samples. The red his-togram corresponds to the acute drowsy samples and the bluehistogram corresponds to moderately drowsy samples. Here 9subjects are plotted as 2 subjects do not have either AD orMD samples. The A’ here is computed using the samples ofthe subject without multiplying with training weight. . . . . 59
xvi
4.9 Figure displays the histograms of eye brow raise (AU2) sig-nal for individual subjects summed over 10 second segmentsof acute drowsy and moderate drowsy samples. The red his-togram corresponds to the acute drowsy samples and the bluehistogram corresponds to moderately drowsy samples. Here 9subjects are plotted as 2 subjects do not have either AD orMD samples. The A’ here is computed using the samples ofthe subject without multiplying with training weight. . . . . 60
4.10 MLR model performances for the combined 5 most informativeaction units by performing leave-one-out cross validation . . . 61
4.11 This figure displays a case where temporal dynamics plays animportant role in discriminating two cases. The first case (fig-ure on the top) corresponds to a AD. The subject’s eyes areopen all the time except towards the end of the clip. The sec-ond case (figure on the bottom) demonstrates an moderatelydrowsy (MD) clip from another subject. These two eye closuresignals have approximately the same mean. The output wouldnot be able to tell apart which of these two clips belongs tothe AD or MD episode . . . . . . . . . . . . . . . . . . . . . . 63
4.12 Top: An input signal. Second: Output of Gabor filter (cosinecarrier). Third: Output of Gabor Filter in quadrature (sinecarrier); Fourth: Output of Gabor Energy Filter [43] . . . . . 64
4.13 Filtered version of the signals in Figure 4.11 where the appliedfilter is a magnitude Gabor Filter with frequency 1.26 andbandwidth 1.26. The AD signal has a mean of 0.11 and theMD signal has a mean of 0.36. . . . . . . . . . . . . . . . . . . 66
4.14 A’ performances of Real Gabor Filters for the Eye Closure(AU45) action unit. The horizontal axis represents the fre-quency (0-8Hz), vertical axis represents the bandwidth (0-8Hz) and the color denotes the A’ value. Note that the A’values are represented between 0 and 1 for this figure. Herevalues more than 0.5 closer to 1 indicate prominent filters of asubject independent system. A’ values that are less than 0.5and closer to 0 may indicate prominent filters that are subjectdependent. . . . . . . . . . . . . . . . . . . . . . . . . . . . . . 69
xvii

4.15 A’ performances of individual Gabor Filters for all the actionunits. Each of the 66 (22x3) boxes above represent the A’performances for a specific action unit for either magnitudereal or imaginary filter sets. For each box the horizontal axisrepresents the frequency (0-8Hz), vertical axis represents thebandwidth (0-8Hz) and the color denotes the A’ value. Notethat the A’ values are represented between 0 and 1 for thisfigure. Here values more than 0.5 and closer to 1 indicateprominent filters a subject independent system. A’ values thatare less than 0.5 and closer to 0 may indicate prominent filtersthat are subject dependent. . . . . . . . . . . . . . . . . . . . 70
4.16 A’ performance for Action Unit 45 (eye closure) versus regular-ization constant for di!erent number of features selected withan iterative feature selection policy. The vertical axis displaysthe A’ and the horizontal axis displays the regularization con-stant. Each colored graph displays di!erent number of bestfeatures selected with iterative feature selection. Best A’ isobtained with regularization constant zero and 10 features. . . 72
4.17 Features selected for the best model for eye closure action unit(AU45) . . . . . . . . . . . . . . . . . . . . . . . . . . . . . . 73
4.18 The blue line represent the best average A’ among test subjectsachieved for di!erent number of features. Each point (reddot) on the blue line displays the average A’ over test subjectswith the best performing regularization constant for a certainnumber of features. The green dots represent the standarderror over the test subjects. . . . . . . . . . . . . . . . . . . . 74
4.19 A’ performance for Action Unit 18 (Lip Pucker) versus reg-ularization constant for di!erent number of features selectedwith an iterative feature selection policy. The vertical axisdisplays the A’ and the horizontal axis displays the regular-ization constant. Each colored graph shows di!erent numberof best features selected with iterative feature selection. BestA’ is obtained with regularization constant 0.1 and 10 features. 75
4.20 Set of features selected for the best model of lip pucker actionunit (AU18). For the best model the regularization constantis 0.1. . . . . . . . . . . . . . . . . . . . . . . . . . . . . . . . 76
xviii

4.21 Best A’ achieved as a function of di!erent number of featuresfor Lip Pucker action unit (AU18). The blue line representthe best average A’ among test subjects achieved for di!er-ent number of features. Each point (red dot) on the blue lineshows the average A’ over test subjects with the best perform-ing regularization constant for a certain number of features.The green lines represent the standard error over the test sub-jects. . . . . . . . . . . . . . . . . . . . . . . . . . . . . . . . 77
4.22 A’ performance for Head Roll versus regularization constantfor di!erent number of features selected with an iterative fea-ture selection policy. The vertical axis displays the A’ andthe horizontal axis displays the regularization constant. Eachcolored graph shows di!erent number of best features selectedwith iterative feature selection. Best A’ performance of 0.81is obtained with regularization constant 0.5 and 8 features. . . 78
4.23 Selected features for the best model for Head Roll (AU55-AU56) action unit. . . . . . . . . . . . . . . . . . . . . . . . . 79
4.24 Best A’ achieved with di!erent number of features for HeadRoll. The blue line represent the best average A’ among testsubjects achieved for di!erent number of features. Each point(red dot) on the blue line shows the average A’ over test sub-jects with the best performing regularization constant for acertain number of features. The green lines represent the stan-dard error over the test subjects. . . . . . . . . . . . . . . . . 80
4.25 A’ performance for Action Unit 7 (Lid Tighten) versus reg-ularization constant for di!erent number of features selectedwith an iterative feature selection policy. The y axis showsthe A’ and the x axis shows the regularization constant. Eachcolored graph shows di!erent number of best features selectedwith iterative feature selection. Best A’ of 0.74 is obtainedwith regularization constant 2 and 10 features. . . . . . . . . . 81
4.26 Best set of features selected for Lid Tighten (AU7) with regu-larization constant 2 . . . . . . . . . . . . . . . . . . . . . . . 82
xix

4.27 Best average A’ (for the optimal regularization parameter) as afunction of the number of features for Lid Tighten action unit(AU7). The blue line represent the best average A’ amongtest subjects achieved for di!erent number of features. Eachpoint (red dot) on the blue line shows the average A’ over testsubjects with the best performing regularization constant fora certain number of features. The green lines represent thestandard error over the test subjects. . . . . . . . . . . . . . . 83
4.28 A’ performance for Action Unit 9 (Nose Wrinkle) versus reg-ularization constant for di!erent number of features selectedwith an iterative feature selection policy. The vertical axisshows the A’ and the horizontal axis shows the regularizationconstant. Each colored graph shows di!erent number of bestfeatures selected with iterative feature selection. Best A’ isobtained with regularization constant 0.001 and 10 features. . 84
4.29 Features selected for the best model for Nose Wrinkle (AU9)action unit. . . . . . . . . . . . . . . . . . . . . . . . . . . . . 85
4.30 Best A’ achieved with di!erent number of features for NoseWrinkle (AU9). The blue line represent the best average A’among test subjects achieved for di!erent number of features.Each point (red dot) on the blue line shows the average A’ overtest subjects with the best performing regularization constantfor a certain number of features. The green lines represent thestandard error over the test subjects. . . . . . . . . . . . . . . 86
4.31 A’ performance for 5 best action units combined versus reg-ularization constant for di!erent number of features selectedwith an iterative feature selection policy. The vertical axisshows the A’ and the horizontal axis shows the regularizationconstant. Each colored graph shows di!erent number of bestfeatures selected with iterative feature selection. Best A’ of0.96 is achieved with regularization constant 0.01 and 10 fea-tures. . . . . . . . . . . . . . . . . . . . . . . . . . . . . . . . . 88
4.32 Bar graph displaying the performances for 5 best performingaction units with the raw action unit output and the bestmodel of Gabor Filter outputs. . . . . . . . . . . . . . . . . . 90
xx

List of Tables
3.1 Full set of action units used for predicting drowsiness in Study I 303.2 The top 5 most discriminant action units for discriminating
alert from non-alert states for each of the four subjects. A’ isarea under the ROC curve. . . . . . . . . . . . . . . . . . . . 33
3.3 Performance for drowsiness prediction, within subjects. Meansand standard deviations are shown across subjects. . . . . . . 35
3.4 MLR model for predicting drowsiness across subjects. Predic-tive performance of each facial action individually is shown. . 36
3.5 Drowsiness detection performance for novel subjects, usingan MLR classifier with di!erent feature combinations. Theweighted features are summed over 12 seconds before comput-ing A’. . . . . . . . . . . . . . . . . . . . . . . . . . . . . . . . 37
4.1 A list of 22 action unit outputs from CERT toolbox that arechosen for the analysis. . . . . . . . . . . . . . . . . . . . . . 45
4.2 The mean and standard deviation of time to crash for oneminute segments of moderate drowsiness (MD) and acute drowsi-ness (AD). . . . . . . . . . . . . . . . . . . . . . . . . . . . . 47
4.3 Table displays the mean and standard deviation of the time tothe first crash for the alert and moderately drowsy segments ofthe UYAN-1 and UYAN-2 datasets respectively. Notice thatthe two datasets have di!erent set of subjects. . . . . . . . . . 48
4.4 The number of 10 second segments for acute drowsiness (AD)and moderate drowsiness (MD) is listed in the table. Thesesegments are obtained by partitioning one minute alert anddrowsy episodes into six 10 second patches. Note that Subject7 and 8 do not not have any MD and AD segments respectively.Temporal dynamics are captured by employing temporal filtersover these 10 second CERT action unit signals. . . . . . . . . 49
xxi

4.5 ROC performance results for the output of the raw action unitoutputs over individual action units. . . . . . . . . . . . . . . 52
1

Chapter 1
Introduction
1.1 Problem DefinitionThis thesis addresses the problem of drowsy driver detection using computervision techniques applied to the human face. Specifically we explore thepossibility of discriminating drowsy from alert video segments using facialexpressions automatically extracted from video. In order to objectively cap-ture the richness and complexity of facial expressions, behavioral scientistshave found it necessary to develop objective coding standards. The facialaction coding system (FACS)[23] is the most widely used expression codingsystem in the behavioral sciences. A human coder decomposes facial expres-sions in terms of 46 component movements or action units which roughlycorrespond to the individual facial muscle movements. FACS provides anobjective and comprehensive way to analyze all the di!erent facial expres-sions that a human face can make into elementary components, analogousto decomposition of speech into phonemes. Because it is comprehensive,FACS has proven useful for discovering facial movements that are indicativeof cognitive and a!ective states [22]. In this thesis facial expressions in avideo segment are extracted using an automated facial expression recogni-tion toolbox, called Computer Expression Recognition Toolbox (CERT) [10],that operates in real-time and is robust to the video conditions in real ap-plications. CERT codes facial expressions in terms of 30 actions from thefacial action coding system (FACS). CERT assigns a continuous value foreach of the 30 action units it considers. These continuous values representthe estimated intensities (muscle activations) of the action units observed in
2

that frame.In this thesis we use the CERT system to address several questions: First
we investigate the hypothesis of whether or not automatically detected facialbehaviour is a good source of information for detecting drowsiness. If so, oursecond goal is to investigate what aspects of the morphology and dynamics offacial expressions are indicative of drowsiness. Our third goal is to understandthe possibilities and challenges of automatic drowsiness detection based onfacial expression analysis and develop classification algorithms. Finally ourfourth goal is to understand the facial expressions occurring at fine states ofdrowsiness such as moderate drowsiness and acute drowsiness.
1.2 Solution ApproachThe approach we take to answer this problem is as follows.
(1) Data sets are collected from subjects showing spontaneous facial ex-pressions during the state of fatigue.
(2) We analyze the degree to which individual facial action units canpredict the di!erence between alert and drowsy or moderately drowsy andacutely drowsy
(3) Temporal dynamics are captured using a bank of temporal filters.How to extract the relevant feature set of filters for a person independentdrowsiness detector is studied.
1.3 Significance of the ProblemThe US National Highway Tra"c Safety Administration (NHTSA) estimatesthat in the US alone approximately 100,000 crashes each year are caused pri-marily by driver drowsiness or fatigue [36][5]. According to statistics gatheredby the federal government each year, at least 1500 people die and 40,000 peo-ple get injured in crashes related to sleepy, fatigued or drowsy drivers in theUnited States of America. These numbers are most likely an underestimate.Unless someone witnesses or survives the crash and can testify the driver’scondition, it is di"cult to determine if the driver fell asleep[5]. In a 2003interview with 4010 drivers in the U.S.A., 37% of the drivers reported havingnodded o! while driving at some point in their lives and 29% of these driversreported having experienced this problem within the past year [20][32]. Sim-
3

ilarly in a 2006 survey with 750 drivers in the province of Ontario, Canada,nearly 60% of the drivers admitted driving while drowsy or fatigued at leastsometimes, and 15% reported falling asleep while driving during the pastyear[32] [55]. A questionnaire study participated by 154 truck drivers toassess the relationship between prior sleep, work and individual characteris-tics and drowsiness found out that prior sleep aspects contributed the mostto sleepiness while driving [52]. The National Safety Tra"c Board (NTSB)concluded that 52 % of 107 single-vehicle accidents involving heavy truckswere fatigue-related; in nearly 18 per cent of the cases, the driver admittedto falling asleep [1].
Tiredness and fatigue can often a!ect a person’s driving ability long beforehe/she even notices that he/she is getting tired. Fatigue related crashes areoften more severe than others because driver’s reaction times are delayed orthe drivers have failed to make any maneuvers to avoid a crash. The numberof hours spent driving has a strong correlation to the number of fatigue-related accidents. Figure 1.1 displays the relationship between number ofhours driven and the percent of crashes related to driver fatigue [4]. A studyconducted by the Adelaide Centre for Sleep Research has shown that driverswho have been awake for 24 hours have an equivalent driving performanceto a person who has a BAC (blood alcohol content) of 0.1 g/100ml, and isseven times more likely to have an accident[1]. In fact, NHTSA has concludedthat drowsy driving is just as dangerous as drunk driving. Thus methods toautomatically detect drowsiness may help save many lives and contribute tothe well-being of the society.
4

Figure 1.1: The figure displays the relationship between number of hoursdriven and the percent of crashes related to driver fatigue [4].
Current state of the art technologies focus on behavioral cues to detectdrowsiness. Behavioral technologies detect drowsiness based on physiologicalsignals or computer vision methods. Brain waves, heart rate and respira-tion rate are some of the physiological signals exploited for the detection ofdrowsiness[14][38][34]. Physiological signals usually require physical contactwith the driver and may cause disturbance. Hence there has recently beenincreasing interest in computer vision as it is a prominent and a non-invasiveapproach for detecting drowsiness. Computer vision approaches use facialexpressions to infer drowsiness[30][58]. Previous approaches to drowsinessdetection primarily make pre-assumptions about the relevant behavior, fo-cusing on blink rate, eye closure, and yawning [30] [48]. Here we employmachine learning methods to explore actual human behavior during drowsi-ness episodes. Computer vision based expression analysis systems can useseveral inputs ranging from low-level inputs such as raw pixels, to higherlevel inputs i.e facial action units or basic facial expressions to detect thefacial appearance changes. For drowsiness detection since large sets of datafrom di!erent subjects is not available, using higher levels of input such asaction units helps to increase the performance of the system. FACS also
5

provides versatile representations of the face. FACS does not apply interpre-tive labels to expressions but rather a description of physical changes in theface. This enables studies of new relationships between facial movement andinternal state, such as the facial signals of stress or drowsiness[9]. Develop-ing technologies and methods to automatically recognize internal states, likedrowsiness, from objective behavior, has a revolutionary e!ect in the brainand behavioral sciences. Moreover, the problem of automatic recognition offacial behavior from video is currently a recognized research area within themachine perception and computer vision communities[41][40].
This thesis contributes to understand how to build better vision machineswith potential practical applications. It also helps us understand from acomputational point of view the problems that the human visual systemsolves seamlessly.
.
1.4 ContributionsA common dataset of non-posed, spontaneous facial expressions during drowsi-ness is not available for the research community. Hence for this thesis wecreated our own spontaneous drowsiness dataset. Capturing spontaneousdrowsiness behavior is a challenging and laborious task. We preferred tocollect drowsiness data during midnight as it is of lesser chance to observedrowsiness during the day. A unique dataset of spontaneous facial expressionsare collected from 20 subjects during driving in alert and drowsy conditions.Spontaneous facial expressions have not been studied for drowsiness untilnow and this is the first study that explores spontaneous facial expressionsoccurring during drowsiness to our knowledge. We analyzed what aspectsof the morphology and dynamics of facial expressions are informative aboutdrowsiness and to what degree. Machine learning methods are developedand evaluated for a person independent drowsiness detection system. Dif-ferent classification and feature extraction methods are explored for a moreaccurate drowsiness detector. How to detect fine states of drowsiness likeacute and moderate drowsiness is also explored in this thesis. Facial expres-sions informative about these two states are explored. Our analysis withthis limited dataset discovered new expressions indicative of acute and mod-erate drowsiness states. We also obtained a better performing classifier byincluding features capturing temporal dynamics of facial expressions.
6

1.5 OutlineIn Chapter 2 we describe prior work on fatigue detection and predictiontechnologies. We also introduce some of the methods employed for process-ing the signal, developing automatic classifiers, and evaluating performance: e.g. ROC, Adaboost, Multinomial Logistic Regression, Gabor Filters. InChapter 3 we describe Study I that predicts sleep versus crash episodes fromfacial expressions of subjects performing a driving simulator task. We alsodescribe some preliminary results obtained from head movement measures.In Chapter 4 we present the results for detecting fine states of drowsinesslike acute drowsiness and moderate drowsiness. A new dataset, UYAN-2,has been collected for this study which consists of 11 subjects using thedriving simulator while their faces are captured with a DV Camera and thebrain dynamics and upper torso movements are measured using EEG andMotion Capture facilities respectively. The details about the experimentalsetup and the subject-wise di!erences in comparison with the UYAN-1 arealso presented in Chapter 4. We discuss how di!erent signal processing ap-proaches and machine learning methods perform on generalization to novelsubjects. The discriminative power of individual filters for predicting drowsi-ness is studied and how to select the prominent features is analyzed in thesame chapter. Finally in Chapter 5 we present our conclusions together withsome potential topics for future work.
7

Chapter 2
Background
2.1 Background on Fatigue Detection and Pre-diction Technologies
Dinges and Mallis [18] identified 4 di!erent categories of fatigue detectiontechnologies : (1) Fitness for Duty Technologies, (2) Ambulatory AlertnessPrediction Technologies, (3) Vehicle-based Performance Technologies and (4)In-vehicle Online Operator Status technologies.
2.1.1 Fitness for Duty TechnologiesThe goal of fitness-for-duty technologies is to assess the vigilance or alertnesscapacity of an operator before a high risk type of work such as mining ordriving is performed. Performance of the subject at a chosen task is usedas a measure to detect existing fatigue impairment. Eye hand coordination[45] or driving simulator tasks are some of the previously used methods indetecting fatigue using this approach. This technology is potentially usefulfor measuring existing fatigue impairment [33]: an operator who fails thechosen test task lacks the vigilance for the work. Note that even if theoperator passes the test, his/her state will change during the course of duty.The predictive validity, the task’s predictive power of future fatigue, is stillnot well established[33]: it is not known how long an operator, that passesthe test at a chosen task, will keep vigilant during work.
8

2.1.2 Ambulatory Alertness Prediction TechnologiesThe goal of ambulatory alertness prediction technologies is to predict oper-ator alertness/performance at di!erent times based on interactions of sleep,circadian rhythm, and related temporal antecedents of fatigue. Note thatthese technologies are di!erent from our work as they do not assess fitnessonline as the work is performed. This technology predicts alertness usingdevices that monitor sources of fatigue, such as how much sleep an operatorhas obtained (via wrist activity monitor, defined below), and combine thisinformation with mathematical models that predict performance and fatigueover future periods of time[33]. As an example to such a system US Armymedical researchers have developed a mathematical model to predict humanperformance on the basis of prior sleep [11]. They integrated this model intoa wrist-activity monitor based sleep and performance predictor system called”Sleep Watch”. The Sleep Watch system includes a wrist-worn piezo electricchip activity monitor and recorder which will store up records of the wearer’sactivity and sleep obtained over several days. While this technology showspotential to predict fatigue in operators, more data and possible fine tuningof the models are needed before they can be fully accepted [33].
2.1.3 Vehicle-based Performance TechnologiesVehicle-based performance technologies place sensors on standard vehiclecomponents, e.g., steering wheel, gas pedal, and analyzes the signals sentby these sensors to detect drowsiness [51]. Some of the previous studies usedriver steering wheel movements and steering grip as an indicator of fatigueimpairment. Microcorrections for steering are necessary for environmentalfactors and the reduction in number of microcorrections to steering indi-cate an impaired state [9]. Some car companies, Nissan[56] and Renault[7],adopted this technology however the main problem with steering wheel inputis that it works in very limited situations [37]. Such monitors are too depen-dent on the geometric characteristics of the road (and to a lesser extent thekinetic characteristics of the vehicle), thus they can only function reliably onmotorways [7].
Simple systems that purport to measure fatigue through vehicle-basedperformance are currently commercially available. However, their e!ective-ness in terms of reliability, sensitivity and validity is uncertain (i.e. formalvalidation tests either have not been undertaken or at least have not been
9
made available to the scientific community) [33].A commercial product, AAlert (AA), is a flexible rubber device that uses
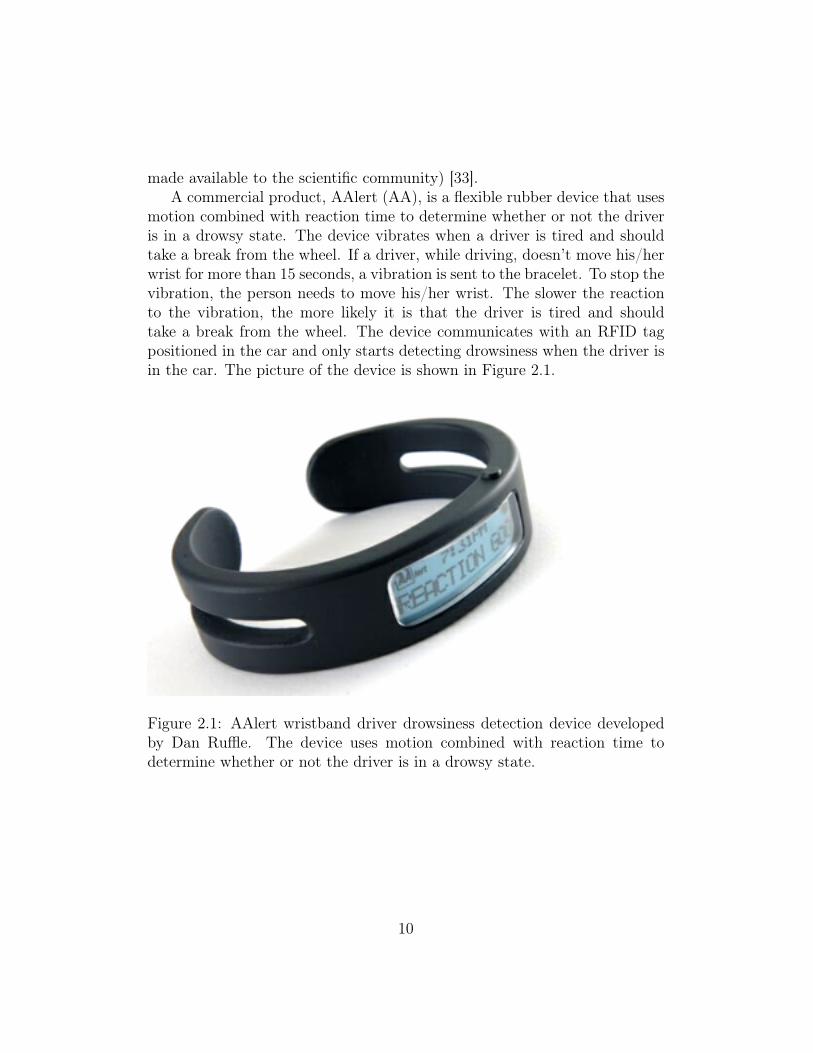
motion combined with reaction time to determine whether or not the driveris in a drowsy state. The device vibrates when a driver is tired and shouldtake a break from the wheel. If a driver, while driving, doesn’t move his/herwrist for more than 15 seconds, a vibration is sent to the bracelet. To stop thevibration, the person needs to move his/her wrist. The slower the reactionto the vibration, the more likely it is that the driver is tired and shouldtake a break from the wheel. The device communicates with an RFID tagpositioned in the car and only starts detecting drowsiness when the driver isin the car. The picture of the device is shown in Figure 2.1.
Figure 2.1: AAlert wristband driver drowsiness detection device developedby Dan Ru&e. The device uses motion combined with reaction time todetermine whether or not the driver is in a drowsy state.
10

2.1.4 In-vehicle, On-line, Operator Status MonitoringTechnologies : Behavioral Studies using Physio-logical Signals
These techniques estimate fatigue based on physiological signals such as heartrate variability (HRV), pulse rate, breathing and Electroencephalography(EEG) [15][57] measures. Time series of heart beat pulse signal can be usedto calculate the heart rate variability (HRV) – the variations of beat-to-beatintervals in the heart rate [6], and HRV has established di!erences betweenwaking and sleep stages from previous psycho-physiological studies [24][57].The frequency domain spectral analysis of HRV shows that typical HRV inhuman has three main frequency bands: high frequency band (HF) that liesin 0.15 – 0.4 Hz, low frequency band (LF) in 0.04 – 0.15 Hz, and very low fre-quency (VLF) in 0.0033 – 0.04 Hz [6] [57]. A number of psycho-physiologicalresearches have found that the LF to HF power spectral density ratio (LF/HFratio) decreases when a person changes from waking into drowsiness/sleepstage, while the HF power increases associated with this status change [24][57].
EEG is the recording of electrical activity along the scalp produced bythe firing of neurons within the brain. In clinical contexts, EEG refers tothe brain’s spontaneous electrical activity as recorded from multiple elec-trodes placed on the scalp. There are five major brain waves distinguishedby their di!erent frequency ranges. These frequency bands from low to highfrequencies respectively are called alpha, theta, beta, delta and gamma. Thealpha and beta waves lie between 8-12 Hz and 12-30 Hz respectively (Bergeret al. 1929). Alpha waves tend to occur during relaxation or keeping theeyes closed. Beta is the dominant wave representing alertness, anxiety oractive concentration. Gamma refers to the waves of above 30 Hz (Jasperand Andrews (1938)). Gamma waves are thought to represent binding ofdi!erent populations of neurons together into a network for the purpose ofcarrying out a certain cognitive or motor function[3]. The delta waves desig-nate all frequencies between 0-4 Hz (Walter et al, 1936). Theta waves havefrequencies within the range of 4-7.5 Hz. Theta waves represent drowsinessin adults.
In the literature power spectrum of EEG brain waves is used as a measureto detect drowsiness [38]. It has been reported by researchers that as thealertness level decreases EEG power of the alpha and theta bands increases
11

[34]. Hence providing indicators of drowsiness. However using EEG as ameasure of drowsiness has drawbacks in terms of practicality since it requiresa person to wear an EEG cap while driving. Moreover motion related artifactsare still an unsolved research problem.
One important problem in EEG is that it is very easy to confuse artifactsignals caused by the large muscles in the neck and jaw with the genuine deltaresponse [49]. This is because the muscles are near the surface of the skinand produce large signals, whereas the signal that is of interest originatesfrom deep within the brain and is severely attenuated in passing throughthe skull [49]. In general EEG recordings are extremely sensitive to motionartifacts. Motion related signals are actually 3 orders of magnitude largerthan signals due to neural activity and this is still a big unsolved problemfor EEG analysis.
2.1.5 In-vehicle, On-line, Operator Status MonitoringTechnologies : Behavioral Studies using ComputerVision Systems
Computer vision is a prominent technology in monitoring the human be-havior. The advantage of computer vision techniques is that they are non-invasive, and thus are more amenable to use by the general public. In recentyears machine learning applications to computer vision had a revolution-ary e!ect in building automatic behavior monitoring systems. The currenttechnology provides us imperfect but reasonable tools to build computer vi-sion systems that can detect and recognize the facial motion and appearancechanges occurring during drowsiness [30] [58].
Most of the published research on computer vision approaches to detec-tion of fatigue has focused on the analysis of blinks [53]. Percent closure(PERCLOS), which is the percentage of eyelid closure over the pupil overtime and reflects slow eyelid closures (“droops”) rather than blinks, is ana-lyzed in many studies [16] [28]. Some of these studies used infrared cameras toestimate the PERCLOS measure [16]. It is worth pointing out that infraredtechnology for PERCLOS measurement works fairly well at night, but notvery well in daylight, because ambient sunlight reflections make it impracti-cal to obtain retinal reflections of infrared waves[33]. Other studies used thevideo frames for estimating the PERCLOS measure [50]. One example ofsuch commercial products is the Driver State Sensor (DSS) device developed
12

by SeeingMachines [2]. DSS is a robust, automatic and nonintrusive sensorplatform that uses cutting edge face tracking techniques to deliver informa-tion on operator fatigue and operator distraction. In cars DSS is located onthe dashboard and it uses the eyelid opening and Percent Closure (PERC-LOS), which is the the percentage of eyelid closure over the pupil over time,as a measure to derive the drowsiness state. A snapshot of the system isdisplayed in Figure 2.2.
Figure 2.2: Driver State Sensor (DSS) device developed by SeeingMachines.DSS uses eyelid opening as a measure to infer the drowsiness state.
Head nodding [48] and eye closure[50][48] have been studied as indicatorsof fatigue but there are other facial expressions and not much is known aboutfacial behavior during the state of fatigue. Until now tools have not beenavailable to study these expressions and manual coding of facial expressionsis extremely di"cult.
Computer vision has advanced to the point that scientists are now be-ginning to apply automatic facial expression recognition systems to impor-tant research questions in behavioral science: Lie detection, di!erentiatingreal pain from faked pain, understanding emotions such as happiness, sur-prise etc are all possible applications of facial expression recognition systems
13

[40][8][39].Gu & Ji [31] presented one of the first fatigue studies that incorporated
certain facial expressions other than blinks. Their study fed action unit in-formation as an input to a dynamic Bayesian network. The network wastrained on subjects posing a state of fatigue. The video segments were clas-sified into three stages: inattention, yawn, or falling asleep. For predictingfalling-asleep, head nods, blinks, nose wrinkles and eyelid tighteners wereused. While this was a pioneering study, its value is limited by the useof posed expressions. Spontaneous expressions have a di!erent brain sub-strate than posed expressions. They also typically di!er in dynamics andmorphology in that di!erent action unit combinations occur for posed andspontaneous expressions. In addition, as we have observed during the work,it is very di"cult for people to guess the expressions they would actuallymake when drowsy or fatigued. Using spontaneous behavior for developingand testing computer vision systems is highly important given the fact thatthe spontaneous and posed expressions have very di!erent brain substrate,morphology and dynamics [22]
Previous approaches to drowsiness detection primarily make pre-assumptionsabout the relevant behavior, focusing on blink rate, eye closure, and yawn-ing. Here we employ machine learning methods to data-mine actual humanbehavior during drowsiness episodes. The objective of this thesis is to inves-tigate whether there are facial expression configurations or facial expressiondynamics that are predictors of fatigue and to explain methods for analyz-ing automatic facial expression signals to e!ectively extract this information.In this thesis, facial motion was analyzed automatically from video using afully automated facial expression analysis system based on the Facial ActionCoding System (FACS) [10]. In addition to the output of the automaticFACS recognition system we also collected head motion data either throughan accelerometer placed on the subject’s head, or a computer vision-basedhead pose tracking system, as well as steering wheel data.
Computer vision based expression analysis systems can use several inputsranging from low-level inputs such as raw pixels to higher level inputs i.e fa-cial action units or basic facial expressions to detect the facial appearancechanges. For special purpose systems designed to detect only a particular ex-pression or a particular state it may be beneficial to avoid intermediate repre-sentations such as FACS, provide a large database is available. For exampleWhitehill et. al presents a smile analyzer system [54] that can discern smilesfrom non-smiles by training the system with a set of 20,000 di!erent subject’s
14

face data. The system is able to detect smile versus non-smiles with a highperformance. On the other hand when the dataset is relatively small, it maybe beneficial to use systems that provided a rich intermediate representation,such as FACS codes. In addition the use of a FACS based representation hasthe advantage of being anatomically interpretable. For drowsiness detectionlarge sets of data from di!erent subjects is not available as capturing sponta-neous drowsiness behavior is a challenging and laborious task. Hence usinghigher levels of input such as action units might increase the performance ofthe system. FACS also provides versatile representations of the face. Thusfor all the above reasons action unit outputs from CERT[10], which is a userindependent fully automatic system for real time recognition of facial actionsfrom the Facial Action Coding System (FACS), is used as an input to theautomated drowsiness detector.
2.1.5.1 Facial Action Coding System
The facial action coding system (FACS) [23] is one of the most widely usedmethods for coding facial expressions in the behavioral sciences. The sys-tem describes facial expressions in terms of 46 component movements, whichroughly correspond to the individual facial muscle movements. An exampleis shown in Figure 2.3. FACS provides an objective and comprehensive wayto analyze expressions into elementary components, analogous to decomposi-tion of speech into phonemes. Because it is comprehensive, FACS has provenuseful for discovering facial movements that are indicative of cognitive anda!ective states. See Ekman and Rosenberg (2005) [22] for a review of facialexpression studies using FACS. The primary limitation to the widespread useof FACS is the time required to code. FACS was developed for coding byhand, using human experts. It takes over 100 hours of training to becomeproficient in FACS, and it takes approximately 2 hours for human expertsto code each minute of video. Researchers have been developing methodsfor fully automating the facial action coding system [10][19]. In this thesiswe apply a computer vision system trained to automatically detect FACS todata mine facial behavior under driver fatigue.
15

Figure 2.3: Example facial action decomposition from the Facial Action Cod-ing System [23].
2.1.5.2 Spontaneous Expressions
The machine learning system presented in this thesis was trained on sponta-neous facial expressions. The importance of using spontaneous behavior fordeveloping and testing computer vision systems becomes apparent when weexamine the neurological substrate for facial expression. There are two dis-tinct neural pathways that mediate facial expressions, each one originatingin a di!erent area of the brain. Volitional facial movements originate in thecortical motor strip, whereas spontaneous facial expressions originate in thesub-cortical areas of the brain (see [47], for a review). These two pathwayshave di!erent patterns of innervation on the face, with the cortical systemtending to give stronger innervation to certain muscles primarily in the lowerface, while the sub-cortical system tends to more strongly innervate musclesprimarily in the upper face [42]. The facial expressions mediated by these twopathways have di!erences both in which facial muscles are moved and in their
16

dynamics [21][22]. Subcortically initiated facial expressions (the spontaneousgroup) are characterized by synchronized, smooth, symmetrical, consistent,and reflex-like facial muscle movements whereas cortically initiated facial ex-pressions (posed expressions) are subject to volitional real-time control andtend to be less smooth, with more variable dynamics [47]. Given the twodi!erent neural pathways for facial expressions, it is reasonable to expect tofind di!erences between genuine and posed expressions of states such as painor drowsiness. Moreover, it is crucial that the computer vision model for de-tecting states such as genuine pain or driver drowsiness be based on machinelearning of expression samples when the subject is actually experiencing thestate in question. It is very di"cult for people to imagine and produce theexpressions they would actually make when they are tired or drowsy.
2.1.5.3 The Computer Expression Recognition Toolbox (CERT)
This study uses the output of CERT as an intermediate representation tostudy fatigue and drowsiness. CERT, developed by researchers at MachinePerception Laboratory UCSD [10], is a user independent fully automatic sys-tem for real time recognition of facial actions from the Facial Action CodingSystem (FACS). The system automatically detects frontal faces in the videostream and codes each frame with respect to 20 Action units. An overviewof the system can be found in Figure 2.4.
Figure 2.4: Overview of fully automated facial action coding system
17

Real Time Face and Feature Detection CERT uses a real-time facedetection system that uses boosting techniques in a generative framework(Fasel et al.) and extends work by Viola and Jones (2001). Enhance-ments to Viola and Jones include employing Gentleboost instead of Ad-aBoost, smart feature search, and a novel cascade training procedure, com-bined in a generative framework. Source code for the face detector is freelyavailable at http://kolmogorov.sourceforge.net. Accuracy on the CMU-MITdataset, a standard public data set for benchmarking frontal face detectionsystems (Schneiderman & Kanade, 1998), is 90% detections and 1/millionfalse alarms, which is state-of-the-art accuracy. The CMU test set has uncon-strained lighting and background. With controlled lighting and background,such as the facial expression data employed here, detection accuracy is muchhigher. The system presently operates at 24 frames/second on a 3 GHz Pen-tium IV for 320x240 images. The automatically located faces are rescaled to96x96 pixels. The typical distance between the centers of the eyes is roughly48 pixels. Automatic eye detection [26](Fasel et al., 2005) is employed toalign the eyes in each image. In the CERT system the images are thenpassed to a filtering stage through a bank of 72 Gabor filters 8 orientationsand 9 spatial frequencies (2:32 pixels per cycle at 1/2 octave steps). Outputmagnitudes are then passed to the action unit classifiers.
Automatic Facial Action Classification The AU classifiers in the CERTsystem were trained using three posed datasets and one dataset of sponta-neous expressions. The facial expressions in each dataset were FACS codedby certified FACS coders. The first posed dataset was the Cohn- KanadeDFAT-504 dataset [35] (Kanade, Cohn & Tian, 2000). This dataset consistsof 100 university students who were instructed by an experimenter to performa series of 23 facial displays, including expressions of seven basic emotions.The second posed dataset consisted of directed facial actions from 24 sub-jects collected by Ekman and Hager. Subjects were instructed by a FACSexpert on the display of individual facial actions and action combinations,and they practiced with a mirror. The resulting video was verified for AUcontent by two certified FACS coders. The third posed dataset consisted ofa subset of 50 videos from 20 subjects from the MMI database (Pantic etal., 2005). The spontaneous expression dataset consisted of the FACS-101dataset collected by Mark Frank (Bartlett et. al. 2006). 33 subjects under-went an interview about political opinions on which they felt strongly. Two
18

minutes of each subject were FACS coded. The total training set consistedof posed databases and 3000 from the spontaneous set.
Twenty linear Support Vector Machines were trained for each of 20 facialactions. Separate binary classifiers, one for each action, were trained to detectthe presence of the action in a one versus all manner. Positive examplesconsisted of the apex frame for the target AU. Negative examples consistedof all apex frames that did not contain the target AU plus neutral imagesobtained from the first frame of each sequence. Eighteen of the detectors werefor individual action units, and two of the detectors were for specific browregion combinations: fear brow (1+2+4) and distress brow (1 alone or 1+4).All other detectors were trained to detect the presence of the target actionregardless of co-occurring actions. A list is shown in Table 1A. Thirteenadditional AU’s were trained for the Driver Fatigue Study. These are shownin Table 1B.
In general the output of a classifier is thought as discrete, rather thanreal-valued. Here the output of the system is the distance to the separatinghyperplane of an SVM classifier. The distance is a real number representingthe output of an AU classifier. Previous work showed that the distance to theseparating hyperplane (the margin) contained information about action unitintensity [10](e.g. Bartlett et al., 2006). A vector of real-valued numbers isoutput by the system each number representing the output of an AU classifier.
In this thesis we will be using the output of CERT as our basic repre-sentation of facial behavior. Classifiers will be built on top of the CERToutput to investigate which facial expressions and facial expression dynamicsare informative of driver drowsiness.
2.2 Background on Machine Learning TechniquesHere we will give a brief introduction to machine learning concepts that havebeen used for the context of this thesis.
2.2.1 System Evaluation : Receiver operating charac-teristic (ROC)
In signal detection theory, a receiver operating characteristic (ROC), or sim-ply ROC curve, is a graphical plot of the sensitivity vs. (1 - specificity) fora binary classifier system as its discrimination threshold is varied [29]. In
19

this thesis, area under the ROC curve (A’) used to assess performance mostfrequently rather than overall percent correct, since percent correct can bean unreliable measure of performance, as it depends on the proportion oftargets to non-targets, and also on the decision threshold. Notice that A’will refer to the area under the ROC curve for the context of the thesis. Sim-ilarly, other statistics such as true positive and false positive rates depend ondecision threshold, which can complicate comparisons across systems. TheROC curve is obtained by plotting true positives against false positives asthe decision threshold shifts from 0 to 100% detections. The area under theROC (A’) ranges from 0.5 (chance) to 1 (perfect discrimination). Figure 2.5shows the true positive rate (TPR) and false positive rate (FPR) for positiveand negative instances for a certain threshold. The figure also shows a plotfor the ROC curve. A’ is equivalent to the theoretical maximum percentcorrect achievable with the information provided by the system when using a2-Alternative Forced Choice testing and paradigm [13]. 2-Alternative ForcedChoice (abbreviated to 2AFC) testing is a psycho-physical method for elicit-ing responses from a person about his or her experiences of a stimulus. Forexample, a researcher might want to decide on every trial which of two lo-cations A or B contains the stimulus [25]. On any trial, the stimulus mightbe presented at location A or location B. The subject then has to choosewhether the stimulus appeared in location A or B. The subject is allowedonly to choose two of these locations; he or she is not allowed to say "Notsure", or "I don’t know". Thus the subject’s choice is forced in this sense.The area below an ROC curve corresponds to the fraction of correct decisionsin a two-alternative forced choice task. For this thesis we will use the term“A”’ to refer to the area under the response operating curve.
20

Figure 2.5: The true positive rate (TPR) and false positive rate (FPR) ofpositive and negative instances for a certain threshold. ROC plot is obtainedby plotting true positives against false positives as the decision thresholdshifts from 0 to 100% detections.
2.2.2 Signal Processing2.2.2.1 Gabor Filter
A Gabor filter is a linear filter whose impulse response is defined by a complexsinusoid multiplied by a Gaussian function [43]. In this thesis, we use twodi!erent types for Gabor Filters. Spatial Gabor filters are used by the CERTsystem to extract features from images to detect facial action units. A bankof 72 Gabor filters 8 orientations and 9 spatial frequencies (2:32 pixels percycle at 1/2 octave steps) are employed for filtering face images. Outputmagnitudes are then passed to the action unit classifiers. In this thesis we areemploying temporal Gabor filters to analyze the temporal patterns of actionunits. A set of complex Gabor [17] filters is used for analyzing temporalpatterns of action unit signals. Gabor filters can serve as excellent band-pass
21

filters for uni-dimensional signals (e.g., speech). Uni-dimensional temporalGabor Filters are employed for capturing temporal properties of the actionunit signals for detecting drowsiness. A complex Gabor filter is defined asthe product of a Gaussian kernel times a complex sinusoid, i.e.
g(t) = kej!w(at)s(t) (2.1)
where
w(t) = e!"t2 (2.2)
s(t) = ej2"fot (2.3)
ej!s(t)ej2"fot+! = (sin(2!fot + "), jcos(2!fot + ")) (2.4)
Here a, k, ", fo are filter parameters that correspond to a bandwidth, ampli-tude constant, phase and peak frequency respectively. We can think of thecomplex Gabor filter as two out-of-phase filters conveniently allocated in thereal and complex part of a complex function, the real part holds the filter inequation 5[43].
gr(t) = w(t)sin(2!fot + ") (2.5)
and the imaginary part holds the filter
gi(t) = w(t)cos(2!fot + ") (2.6)
Frequency Response
Frequency response is obtained by taking the Fourier Transform,
g(f) = kej!! "
!"e!j2"ftw(at)s(t) dt = kej!
! "
!"e!j2"(f!fo)tw(at)dt (2.7)
=k
aej!w(
f " fo
a) (2.8)
where
w(f) = F{w(t)} = e!"f2 (2.9)
22

Gabor Energy Filters
The real and imaginary components of a complex Gabor filter are phasesensitive, i.e., as a consequence their response to a sinusoid is another sinusoid[43]. By getting the magnitude of the output (square root of the sum ofsquared real and imaginary outputs) we can get a response that is phaseinsensitive and thus gives unmodulated positive response to a target sinusoidinput . In some cases it is useful to compute the overall output of the twoout-of-phase filters. One common way of doing so is to add the squaredoutput (the energy) of each filter, equivalently we can get the magnitude.This corresponds to the magnitude (more precisely the squared magnitude)of the complex Gabor filter output. In the frequency domain, the magnitudeof the response to a particular frequency is simply the magnitude of thecomplex Fourier transform, i.e.
#g(f)# =k
aw(
f " fo
a) (2.10)
Note this is a Gaussian function centered at fo and with width proportionalto a.
Bandwidth and Peak Response
Thus the peak filter response is at fo. To get the half-magnitude bandwidth!f note
w(f " fo
a) = e!" f!fo
a2 = 0.5 (2.11)
Thus the half peak magnitude is achieved for
f " fo ±"
a2 log 2! = 0.4697a $ 0.5a (2.12)
Thus the half-magnitude bandwidth is (2)(0.4697)a which is approxi-mately equal to a. Thus a can be interpreted as the half-magnitude filterbandwidth.
2.2.3 AdaboostAdaBoost calls a weak classifier repeatedly in a series of rounds . For each calla distribution of weights is updated such that it indicates the importance of
23
examples in the data set for the classification. On each round, the weights ofeach incorrectly classified example are increased (or alternatively, the weightsof each correctly classified example are decreased), so that the new classifierfocuses more on those examples. It is shown that Adaboost can be interpretedas a method of sequential maximum likelihood estimation [27].
In this thesis AdaBoost is used only for within subject drowsiness pre-diction of the UYAN-1 dataset. For this study AdaBoost selected the facialaction detector among a set of 30 Facial Action units that minimized thetraining error. Since multinomial logistic regression (MLR) obtained betterperformance MLR was employed for the rest of the thesis.
2.2.4 Support Vector Machines (SVM)Support vector machines (SVMs) [12] are supervised learning methods usedfor classification and regression. Viewing input data as two sets of vectorsin an n-dimensional space, an SVM will construct a separating hyperplanein that space, one which maximizes the margin between the two data sets.To calculate the margin, two parallel hyperplanes are constructed, one oneach side of the separating hyperplane, that maximixes the minimum dis-tance from the hyperplane to the closest training point. Intuitively, a goodseparation is achieved by the hyperplane that has the largest distance to theneighboring datapoints of both classes, since in general the larger the marginthe lower the generalization error of the classifier. In this thesis Support Vec-tor Machines are used by the CERT system as a classifier for determining theaction unit intensity value. In general the output of a classifier is thoughtas discrete, rather than real-valued. Here the output of the system is thedistance to the separating hyperplane of an SVM classifier. The distance isa real number representing the output of an AU classifier.
2.2.5 Multinomial Logistic Regression (MLR)In statistics, logistic regression is used for prediction of the probability ofoccurrence of an event by fitting data to a logistic curve. Multinomial logisticregression (MLR) is an extension of logistic regression with two or moreclasses. Our goal is to train a well defined model based on examples ofinput-output pairs. For this thesis we use MLR with two classes (drowsyand alert) of dependents. The inputs to MLR are n-dimensional vectors andthe outputs are 2-dimensional vectors representing drowsy and alert classes.
24

The training samples consist of m input output pairs. We organize theexample inputs as an m% n matrix x. The corresponding example outputsare organized as a 2%m matrix y. The rows in y matrix add up to 1. Forexample for a given training sample the first row may have the value of 0and the second row has the value of 1 for a drowsy sample or vice verse foran alert sample. The MLR makes predictions h(y) where h is defined inequation 2.15 and y is a linear transformation of the data y= !x, and ! isa 2% n weight matrix.
The optimality of y, and thus of ", is evaluated using the following cri-terion in L2 regularization norm [44]. L2 imposes a Gaussian prior over theweights and forces the weights to be small.
"(") = "m#
j=1
#(yj, $yj) +$
2
2#
k=1
!Tk !k (2.13)
Informally in the above formula, the first term can be seen as a negativelog-likelihood function, capturing the degree of match between the data andthe model, the second term can be interpreted as a negative log prior over ![44].
#(yj, $yj) =2#
k=1
yjk log hk(yj) (2.14)
wherehk(yj) =
eyjk
%2i=1 eyji
(2.15)
Newton Raphson algorithm is employed to minimize " [44]. There aremany possible solutions to !, we choose the one for which the last row isall zeros. For this thesis MLR training algorithm was used with di!erentL2 regularization parameters (weight decay parameter). Once the model istrained and the weight vector is found the weighted data, $yj1 =
%nl=1 "1lxjl,
is used as a measure to estimate the area under the ROC curve A’ for thetwo classes.
25

Chapter 3
Study I : Detecting Drowsiness
The goal in this study is to investigate whether or not automatically detectedfacial behaviour is a reliable source of information for detecting drowsiness.We employ machine learning methods to datamine actual human behaviorduring drowsiness episodes. Automatic classifiers for 30 facial actions fromthe Facial Action Coding system were passed to classifiers such as Adaboostand Multinomial Logistic Regression(MLR). A block diagram of the systemis shown in Figure 3.1. The system was able to predict sleep and crashepisodes during a driving computer game with 98% accuracy across subjects.Moreover, the analysis revealed new information about human facial behaviorduring drowsy driving.
Figure 3.1: Outline of the Fatigue Detection System
26

3.1 UYAN-1 DatasetSubjects were asked to drive a virtual car simulator. The simulator displayedthe driver’s view of a car through a computer terminal. The interface withthe simulator was a steering wheel 1 and an open source multi-platform videogame2 (See Figure 3.2). The windows version of the video game was main-tained such that at random times, a wind e!ect was applied that dragged thecar to the right or left, forcing the subject to correct the position of the car.This type of manipulation had been found in the past to increase fatigue [46].Driving speed was held constant. Four subjects performed the driving taskover a three hour period beginning at midnight. During this time subjects fellasleep multiple times thus crashing their vehicles. Episodes in which the carleft the road (crash) were recorded. Video of the subjects face was recordedusing a DV camera for the entire 3 hour session. Subject data was parti-tioned into drowsy (non-alert) and alert states as follows. The one minutepreceding a sleep episode or a crash was identified as a non-alert state. Therewas a mean of 24 non-alert episodes per subject with a minimum of 9 anda maximum of 35. Fourteen alert segments for each subject were collectedfrom the first 20 minutes of the driving task.3
3.2 Head movement measuresHead movement was measured using an accelerometer that has three onedimensional accelerometers mounted at right angles measuring accelerationsin the range of 5g to +5g where g represents earth gravitational force. Apreliminary analysis of the correlation between head movement measure andthe steering signal is employed.
3.3 Facial Action ClassifiersIn this chapter we investigate whether there are action units that are predic-tive of the levels of drowsiness observed prior to the subjects falling sleep.
1ThrustMaster steering wheel2Torcs3Several of the drivers became drowsy very quickly which prevented extraction of more
alert segments.
27

Figure 3.2: Driving simulation task
28

In Chapter 2 a computer expression recognition toolbox, named CERT,is presented for fully automated detection of facial actions from the facialaction coding system [10]. Previously for 20 facial action units, a mean of93% correct detection under controlled posed conditions, and 75% correctfor less controlled spontaneous expressions with head movements and speechwas reported for CERT.
For this study an improved version of CERT is used which was retrainedon a larger dataset of spontaneous as well as posed examples. In addition,the system was trained to detect an additional 11 facial actions for a totalof 31 (See Table 3.1 ). The facial action set includes blink (action unit 45),as well as facial actions involved in yawning (action units 26 and 27). Theselection of this set of 31 out of 46 total facial actions was based on theavailability of labeled training data. Figure 3.3 shows sample facial actionsfrom the Facial Action Coding System incorporated in CERT.
29

Table 3.1: Full set of action units used for predicting drowsiness in Study IAU Name1 Inner Brow Raise2 Outer Brow Raise4 Brow Lowerer5 Upper Lid Raise6 Cheek Raise7 Lids Tight8 Lip Toward9 Nose Wrinkle10 Upper Lip Raiser11 Nasolabial Furrow Deepener12 Lip Corner Puller13 Sharp Lip Puller14 Dimpler15 Lip Corner Depressor16 Lower Lip Depress17 Chin Raise18 Lip Pucker19 Tongue show20 Lip Stretch22 Lip Funneller23 Lip Tightener24 Lip Presser25 Lips Part26 Jaw Drop27 Mouth Stretch28 Lips Suck30 Jaw Sideways32 Bite38 Nostril Dilate39 Nostril Compress45 Eye Closure
30

Figure 3.3: An Improved version of CERT is used for this study. The figuredisplays the sample facial actions from the Facial Action Coding Systemincorporated in CERT
3.4 Facial action signalsOur initial analysis focused on drowsiness prediction within-subjects. Theoutput of the facial action detector consisted of a continuous value for eachframe which was the distance to the separating hyperplane, i.e., the margin.Histograms for two of the action units in alert and non-alert states for twodi!erent subjects are shown in Figure 3.4. ROC curve was obtained byplotting false positive versus true positive rate for the intensity of an actionunit for a subject. The area under the ROC (A’) was computed for theoutputs of each facial action detector to see to what degree the alert andnon-alert output distributions were separated for all possible thresholds. TheA’ measure is derived from signal detection theory and characterizes thediscriminative capacity of the signal, independent of decision threshold. Areaunder the ROC A’, as discussed in the previous chapter, can be interpretedas equivalent to the theoretical maximum percent correct achievable withthe information provided by the system when using a 2-Alternative ForcedChoice testing paradigm. Table 3.2 shows the actions with the highest A’
31

for each subject. As expected, the blink/eye closure measure was overall themost discriminative for most subjects. However note that for Subject 2, theouter brow raise (Action Unit 2) was the most discriminative.
Figure 3.4: Histograms for blink and Action Unit 2 in alert and non-alertstates. A’ is area under the ROC.
32
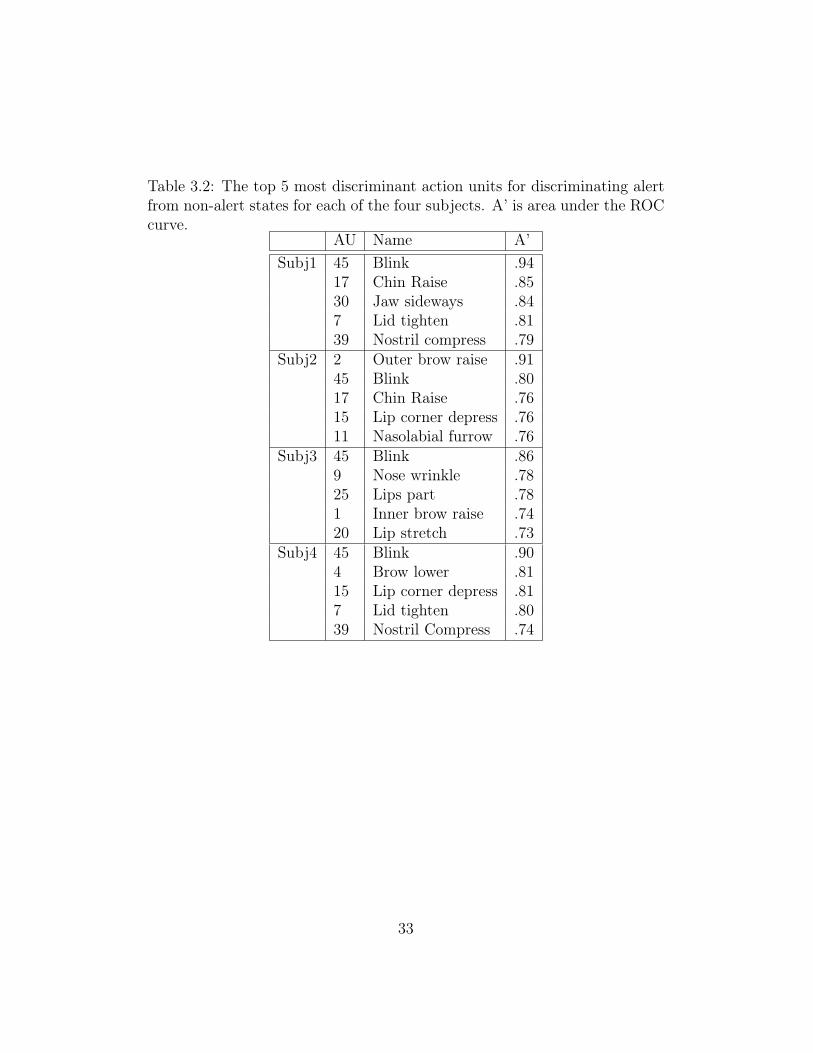
Table 3.2: The top 5 most discriminant action units for discriminating alertfrom non-alert states for each of the four subjects. A’ is area under the ROCcurve.
AU Name A’Subj1 45 Blink .94
17 Chin Raise .8530 Jaw sideways .847 Lid tighten .8139 Nostril compress .79
Subj2 2 Outer brow raise .9145 Blink .8017 Chin Raise .7615 Lip corner depress .7611 Nasolabial furrow .76
Subj3 45 Blink .869 Nose wrinkle .7825 Lips part .781 Inner brow raise .7420 Lip stretch .73
Subj4 45 Blink .904 Brow lower .8115 Lip corner depress .817 Lid tighten .8039 Nostril Compress .74
33

3.5 Drowsiness predictionThe facial action outputs were passed to a classifier for predicting drowsinessbased on the automatically detected facial behavior. Two learning-based clas-sifiers, Adaboost and multinomial logistic regression are compared. Within-subject prediction of drowsiness and across-subject (subject independent)prediction of drowsiness were both tested.
3.5.1 Within subject drowsiness prediction.
For the within-subject prediction, 80% of the alert and non-alert episodeswere used for training and the other 20% were reserved for testing. Thisresulted in a mean of 19 non-alert and 11 alert episodes for training, and 5non-alert and 3 alert episodes for testing per subject.
The features for the Adaboost classifier consisted of each of the 30 FacialAction units of each frame of video. The classifier was trained to predict alertor non-alert from each frame of video. There was a mean of 43,200 trainingsamples, (24 + 11) % 60 % 30, and 1440 testing samples, (5 + 3) % 60 % 30,for each subject. On each training iteration, Adaboost selected the facialaction detector that minimized prediction error given the previously selecteddetectors. Adaboost obtained 92% correct accuracy for predicting driverdrowsiness based on the facial behavior.
Classification with Adaboost was compared to that using multinomiallogistic regression (MLR). Performance with MLR was slightly better, ob-taining 94% correct prediction of drowsy states. The facial actions that weremost highly weighted by MLR also tended to be the facial actions selected byAdaboost. 85% of the top ten facial actions as weighted by MLR were amongthe first 10 facial actions to be selected by Adaboost. Table 3.3 shows thewithin subject drowsiness prediction performances for Adaboost and MLR.Means and standard deviations in this table are shown across subjects. Forthe rest of the study we continued with MLR for the classification task.
34

Table 3.3: Performance for drowsiness prediction, within subjects. Meansand standard deviations are shown across subjects.
Classifier Percent Correct Hit Rate False Alarm RateAdaboost .92 ±.03 .92±.01 .06±.1MLR .94 ±.02 .98±.02 .13±.02
3.5.2 Across subject drowsiness prediction.
The ability to predict drowsiness in novel subjects was tested by using aleave-one-out cross validation procedure. The data for each subject was firstnormalized to zero-mean and unit standard deviation before training the clas-sifier. MLR was trained to predict drowsiness from the AU outputs severalways. Performance was evaluated in terms of area under the ROC. For allof the novel subject analysis, the MLR output for each feature was summedover a temporal window of 12 seconds (360 frames) before computing A’.MLR trained on all features obtained an A’ of .90 for predicting drowsinessin novel subjects.
Action Unit Predictiveness: In order to understand the action unitpredictiveness in drowsiness MLR was trained on framewise outputs of eachfacial action individually. Examination of the A’ for each action unit revealsthe degree to which each facial movement is associated with drowsiness inthis study. The A’s for the drowsy and alert states are shown in Table 3.4.Performance was evaluated in terms of area under the ROC. For all of thenovel subject analysis, the MLR output for each feature was summed overa temporal window of 12 seconds (360 frames) before computing A’. Crossvalidation was performed with with MLR trained on 3 subjects and testedon 1 subject at a time. The average of the five facial actions that were themost predictive of drowsiness by increasing in drowsy states were 45, 2 (outerbrow raise), 15 (frown), 17 (chin raise), and 9 (nose wrinkle). The five actionsthat were the most predictive of drowsiness by decreasing in drowsy stateswere 12 (smile), 7 (lid tighten), 39 (nostril compress), 4 (brow lower), and26 (jaw drop). The high predictive ability of the blink/eye closure measurewas expected. However the predictability of the outer brow raise (AU 2) waspreviously unknown.
35
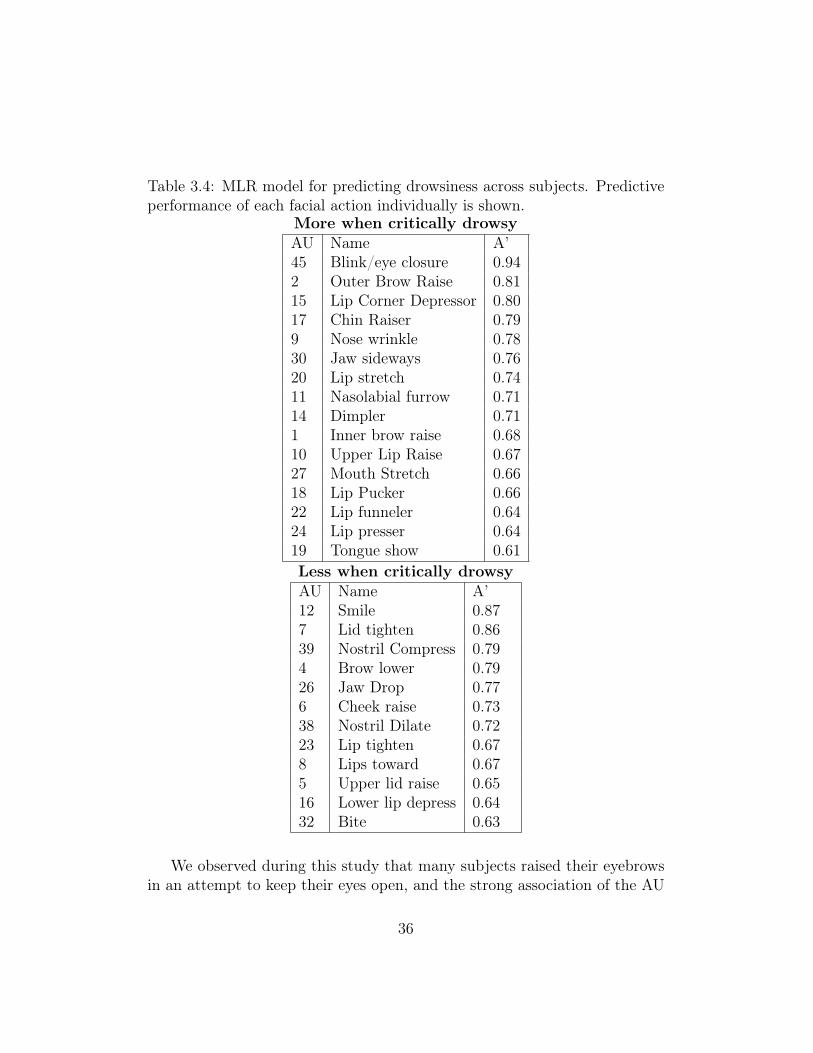
Table 3.4: MLR model for predicting drowsiness across subjects. Predictiveperformance of each facial action individually is shown.
More when critically drowsyAU Name A’45 Blink/eye closure 0.942 Outer Brow Raise 0.8115 Lip Corner Depressor 0.8017 Chin Raiser 0.799 Nose wrinkle 0.7830 Jaw sideways 0.7620 Lip stretch 0.7411 Nasolabial furrow 0.7114 Dimpler 0.711 Inner brow raise 0.6810 Upper Lip Raise 0.6727 Mouth Stretch 0.6618 Lip Pucker 0.6622 Lip funneler 0.6424 Lip presser 0.6419 Tongue show 0.61Less when critically drowsyAU Name A’12 Smile 0.877 Lid tighten 0.8639 Nostril Compress 0.794 Brow lower 0.7926 Jaw Drop 0.776 Cheek raise 0.7338 Nostril Dilate 0.7223 Lip tighten 0.678 Lips toward 0.675 Upper lid raise 0.6516 Lower lip depress 0.6432 Bite 0.63
We observed during this study that many subjects raised their eyebrowsin an attempt to keep their eyes open, and the strong association of the AU
36

2 detector is consistent with that observation. Also of note is that action 26,jaw drop, which occurs during yawning, actually occurred less often in thecritical 60 seconds prior to a crash. This study suggests the prediction thatyawning does not tend to occur in the final moments before falling asleep.
Finally, a new MLR classifier was trained using a sequential feature se-lection approach, starting with the most discriminative feature (AU 45), andthen iteratively adding the next most discriminative feature given the fea-tures already selected. These features are shown at the bottom of Table 3.5.Best performance of .98 was obtained with five features: 45, 2, 19 (tongueshow), 26 (jaw drop), and 15. This five feature model outperformed theMLR trained on all features. Note that using all features did not improvethe performance.
Table 3.5: Drowsiness detection performance for novel subjects, using anMLR classifier with di!erent feature combinations. The weighted featuresare summed over 12 seconds before computing A’.
Feature A’AU45 .9468AU45,AU2 .9614AU45,AU2,AU19 .9693AU45,AU2,AU19,AU26 .9776AU45,AU2,AU19,AU26,AU15 .9792all the features .8954
E!ect of Temporal Window Length: We next examined the e!ectof the size of the temporal window on performance. The five feature modelwas employed for this analysis. The performances shown to this point inthis chapter were for temporal windows of one frame, with the exception ofthe novel subject analysis (Tables 3.4 and 3.5), which employed a temporalwindow of 12 seconds. The MLR output in the 5 feature model was summedover windows of N seconds, where N ranged from 0.5 to 60 seconds. Figure 3.5shows the area under the ROC for drowsiness detection in novel subjects overtime periods. Performance saturates at about 0.99 as the window size exceeds30 seconds. In other words, given a 30 second video segment the system candiscriminate sleepy versus non-sleepy segments with 0.99 accuracy acrosssubjects.
37

Figure 3.5: Performance for drowsiness detection in novel subjects over tem-poral window sizes.
3.6 Coupling of Steering and Head MotionObservation of the subjects during drowsy and nondrowsy states indicatedthat the subjects head motion di!ered substantially when alert versus whenthe driver was about to fall asleep. Here the accelerometer’s z axis is alignedwith the gravitational force and the subject’s face is looking towards the ydirection of the accelerometer. Thus roll is measured as the accelerometer’smeasure in the x direction (roll direction). Surprisingly, head motion in-creased as the driver became drowsy, with large roll motion coupled with thesteering motion as the driver became drowsy. Just before falling asleep, thehead would become still.
We also investigated the coupling of the head and arm motions. Steeringwheel motion is measured as a continuous value ranging between (-1,+1)corresponding to angular values (-pi,0). Correlations between head motionas measured by the roll dimension ( of the accelerometer output and thesteering wheel motion are shown in Figure 3.6. For this subject (subject2), the correlation between head motion and steering increased from 0.33 inthe alert state to 0.71 in the non-alert state. For subject 1, the correlationbetween head motion and steering similarly increased from 0.24 in the alertstate to 0.43 in the non-alert state. The other two subjects showed a smaller
38

coupling e!ect. Future work includes combining the head motion measuresand steering correlations with the facial movement measures in the predictivemodel. Next chapter describes a predictive model that also includes headmovement measures combined with the other action units.
Figure 3.6: Head motion and steering position for 60 seconds in an alert state(left) and 60 seconds prior to a crash (right). Head motion is the output ofthe roll dimension of the accelerometer.
3.7 Coupling of eye openness and eyebrow raise.We observed that for some of the subjects coupling between eye brow raiseand eye openness increased in the drowsy state. In other words subjects triedto open their eyes using their eyebrows in an attempt to keep awake. SeeFigure 3.7.
39

Figure 3.7: Action Unit Intensities for Eye Openness (red/black) and EyeBrow Raises (AU2) (Blue/gray) for 10 seconds in an alert state (left) and 10seconds prior to a crash (right).
3.8 ConclusionThis chapter presented a system for automatic detection of driver drowsinessfrom video. A system for automatically measuring facial expressions wasemployed to explore spontaneous behavior during real drowsiness episodes.This is the first work to our knowledge to reveal significant associationsbetween facial expression and fatigue beyond eyeblinks. The project alsorevealed a potential association between head roll and driver drowsiness, andthe coupling of head roll with steering motion during drowsiness. Of note isthat a behavior that is often assumed to be predictive of drowsiness, yawn,was in fact a negative predictor of the 60-second window prior to a crash.It appears that in the moments before falling asleep, drivers yawn less, notmore, often. The pilot study reveals that facial expression information isThis highlights the importance of using examples of fatigue and drowsinessconditions in which subjects actually fall sleep.
40
Chapter 4
Study II : Fine Discrimination ofFatigue States
In this chapter we explore the fine discrimination of fatigue states usingfacial expressions automatically extracted from video. We discriminate mod-erate drowsiness from acute drowsiness in the UYAN-2 dataset. In particularthe degree to which individual facial action units can predict the di!erencebetween moderately drowsy to acutely drowsy is studied. Signal process-ing techniques and machine learning methods are employed on the UYAN-2dataset to build a person independent acute drowsiness detection system.Temporal dynamics are captured using a bank of temporal filters. How toextract the prominent set of features for individual action units is analyzed.A person independent acute drowsiness detector was built by selecting andcombining relevant features of all the action units.
For this study in order to increase the set of subjects for drowsiness andto expand the drowsiness measures a new dataset is collected. In this chap-ter we describe the “UYAN-2” dataset which consists of 11 subjects usingthe driving simulator while their faces are captured with a DV Camera andthe brain dynamics and upper torso movements are measured through EEGand Motion Capture facilities respectively. Prior to the collection of 11 sub-jects an additional 6 subject data were collected under di!erent illuminationconditions. However these subjects are not included in the dataset as the il-lumination was not su"cient for the CERT system to operate. In the futurelow-lighting conditions can be explored using near infra-red (NIR) technol-ogy. The UYAN-2 dataset di!ers from the UYAN-1 dataset in two ways: (1)It is a larger dataset (2) It includes an expanded set of measures including
41

brain dynamics (EEG), upper torso and head movements through a motioncapture. The head movement measures are also captured using a computervision based head tracking system.
4.1 UYAN-2 Dataset
4.1.1 Experimental SetupSubjects were asked to drive a virtual car simulator on a Windows machineusing a steering wheel and an open source multi-platform video game. Sameexperimental setup is being used as in UYAN-1 dataset with the followingdi!erences: Subjects arrived at the motion capture and brain dynamics labat 11:00 pm. Preparation of the EEG and motion capture setup took overan hour. Eleven subjects performed the driving task beginning at 12:30 amover a three hour period.
For the “UYAN-2” dataset brainwaves were measured through an EEGfacility 1 that records 64 channels of brainwaves with a rate of 512 Hz. Uppertorso and head movements are measured through a Motion Capture facility.In order to measure body and head movements subjects wear an led sensora"xed jacket and a head band. The the led sensor positions are captured bya set of 12 infrared cameras 2 and recorded at a rate of 480 Hz. In Figure 4.1the subject is displayed wearing an EEG cap for the measurement of brainwaves and a motion capture jacket and a hat for the analysis of body andhead movements.
The motion capture and EEG facilities are run on Windows and Unixservers respectively using di!erent sampling rates. Similarly the driving gameis run on a di!erent Windows server recording driving signals at a 30 fpssampling rate. The synchronization of the signals is a crucial step for thisexperimental setup. For the synchrony of these three signals a hardwaresolution was installed. The three signals were synchronized with the help ofthe trigger port of the box that converts optical data to USB2 output (USB2Box of EEG Biosemi device). The driving simulator and the motion capturefacilities sent a trigger signal for each sample that is being recorded. Thetrigger channel of EEG device was decoded in an o&ine manner for matchingthe time steps of the signals.
1Biosemi Instrumentation Inc2PhaseSpace Inc
42
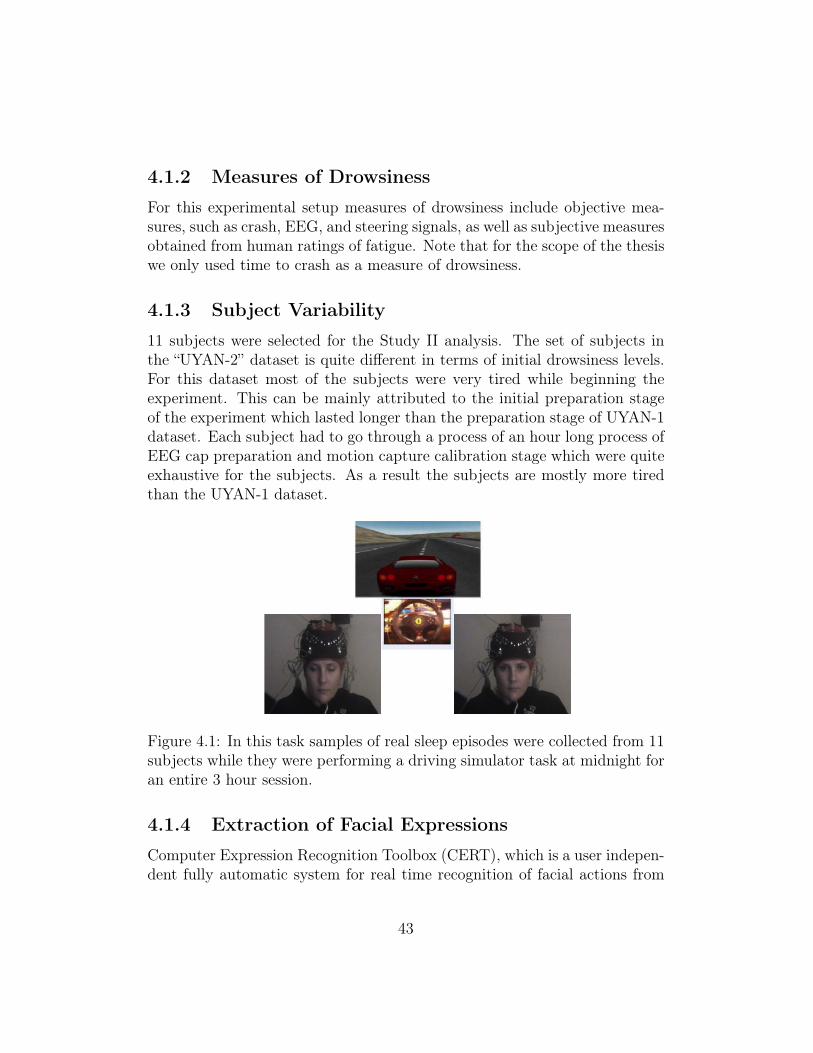
4.1.2 Measures of DrowsinessFor this experimental setup measures of drowsiness include objective mea-sures, such as crash, EEG, and steering signals, as well as subjective measuresobtained from human ratings of fatigue. Note that for the scope of the thesiswe only used time to crash as a measure of drowsiness.
4.1.3 Subject Variability11 subjects were selected for the Study II analysis. The set of subjects inthe “UYAN-2” dataset is quite di!erent in terms of initial drowsiness levels.For this dataset most of the subjects were very tired while beginning theexperiment. This can be mainly attributed to the initial preparation stageof the experiment which lasted longer than the preparation stage of UYAN-1dataset. Each subject had to go through a process of an hour long process ofEEG cap preparation and motion capture calibration stage which were quiteexhaustive for the subjects. As a result the subjects are mostly more tiredthan the UYAN-1 dataset.
Figure 4.1: In this task samples of real sleep episodes were collected from 11subjects while they were performing a driving simulator task at midnight foran entire 3 hour session.
4.1.4 Extraction of Facial ExpressionsComputer Expression Recognition Toolbox (CERT), which is a user indepen-dent fully automatic system for real time recognition of facial actions from
43

the Facial Action Coding System (FACS), is again used for the analysis of thefully automated extracted facial actions. The system automatically detectsfrontal faces in the video stream and codes each frame with respect to 36Action units. For this analysis we work on 22 Action units including a set ofpromising action units of Study I. While choosing these CERT AUs we alsoconsidered the criteria of having enough training samples for reliable CERToutputs. A snapshot of the CERT system running on one of the subjectsfrom UYAN-2 dataset is shown in Figure 4.2.
Figure 4.2: Facial expressions are measured automatically using the Com-puter Expression Recognition Toolbox (CERT). 22 Action Units from theFacial Action Coding System (Ekman & Friesen, 1978) are measured. Headand body motion are measured using the motion capture facility, as well asthe steering signal. Measures of alertness include EEG, distance to the roadcenter, and simulator crash. For the context of the thesis simulator crash isbeing used as a measure of drowsiness..
A list of these 22 action units can be found in the following table. Notethat head movement action units such as Head Pitch, Head Roll and HeadYaw are also included as part of the analysis. These measure are outputthrough CERT toolbox. For this analysis CERT outputs a single signal
44

output for AU 53 (Head Up) and AU54 (Head Down) which are treated partof the head pitch signal. Similarly AU 55 and AU 56 are treated as the headroll signal. Lastly AU 51 (Head Turn Left) or AU 52 (Head Turn Right) aretreated as the head yaw signal.
Action Unit Action Unit NameAU 1 Inner Brow RaiseAU 2 Outer Brow RaiseAU 4 Brow LowererAU 5 Upper Lid RaiseAU 6 Cheek RaiseAU 7 Lids TightAU 9 Nose WrinkleAU 10 Upper Lip RaiseAU 12 Lip Corner PullerAU 14 DimplerAU 15 Lip Corner DepressorAU 17 Chin RaiseAU 18 Lip PuckererAU 20 Lip StretchAU 23 Lip TightenerAU 24 Lip PresserAU 26 Jaw DropAU 28 Lip Suck
AU 53 or AU 54 Head PitchAU 55 or AU 56 Head RollAU 51 or AU 52 Head Yaw
AU45 Eye Closure
Table 4.1: A list of 22 action unit outputs from CERT toolbox that arechosen for the analysis.
As in Study I we use time to crash crash as a measure of drowsiness forthis analysis and the goal is to predict acutely drowsy (60 second window be-fore crash) versus moderately drowsy episodes. The Study I analysis revealedthat 10 seconds is a satisfactory temporal duration for predicting drowsiness.Therefore in this study we employ temporal analysis over 10 seconds. Con-trary to the subjects in the UYAN-1 dataset, some subjects in the UYAN-2
45

dataset are already quite drowsy at the beginning of the driving task. Thisis due to the fact that prior to the driving task subjects had to go through a1 hour period to set the EEG cap and the motion capture system. Most ofthe subjects for the UYAN-2 dataset crash within 25 minutes after startingthe experiment. Hence we call the initial state of the subjects in UYAN-2dataset “moderately drowsy (MD)” rather than “alert”. Table 4.3 displays themean and standard deviation of the time to the first crash for the alert andmoderately drowsy segments of the UYAN-1 and UYAN-2 datasets respec-tively. Notice that the two datasets have di!erent set of subjects. For thisanalysis five one minute non-overlapping moderately drowsy episodes wereselected per subject from the first 10 minutes of the driving task based onthe criteria of being as far away from the crash point as possible. First theone minute episode that is as far away from a crash point is chosen from thefirst 10 minutes of the driving task and then the next one minute episodethat is the second furthest episode from a crash point and not necessarilyconsecutive to the previous episode is selected and the iteration continues inthis fashion. Similar to study I one minute before crash points were taken asdrowsy episodes and this state is called “acute drowsiness (AD)”. In UYAN-2dataset the two classes are in close proximity. The A’ for some action unitssuch as eye closure also supports this fact. In UYAN-1 across subjects A’for eye closure was .94 whereas here the A’ for eye closure action unit aswill be shown later in the chapter (See Table4.5) is .83. Table 4.2 displayssome statistics for the average duration in minutes to the initial and nextcrash after an MD and AD episode respectively. 5 subjects crashed within20 minutes after an MD episode. Two subjects crashed within the first 10minutes after an MD episode. The duration in minutes to the next crashpoint after an AD episode is less than 5 minutes for 7 subjects.
46

time to first crash for MD time to first crash for ADSubject: mean standard deviation mean standard deviationSubject 1 16.35 1.58 1.0 0.0Subject 2 24.86 1.58 1.0 0.0Subject 3 56.32 1.58 1.0 0.0Subject 4 21.43 1.58 1.0 0.0Subject 5 16.27 1.58 1.0 0.0Subject 6 48.46 1.58 1.0 0.0Subject 7 - - 1.0 0.0Subject 8 42.53 1.51 - -Subject 9 2.87 1.40 1.0 0.0Subject 10 8.74 1.64 1.0 0.0Subject 11 13.98 1.61 1.0 0.0
time to second crash for MD time to second crash for ADSubject: mean standard deviation mean standard deviationSubject 1 28.07 1.58 5.23 4.60Subject 2 31.08 1.58 1.93 4.22Subject 3 66.32 1.58 19.78 20.67Subject 4 31.90 1.58 1.84 3.16Subject 5 41.90 1.58 0.73 2.49Subject 6 64.60 1.58 4.39 9.81Subject 7 - - 26.92 18.50Subject 8 72.53 1.51 - -Subject 9 7.98 1.40 1.24 1.67Subject 10 15.93 1.64 3.02 3.15Subject 11 17.02 1.61 1.83 2.32
Table 4.2: The mean and standard deviation of time to crash for one minutesegments of moderate drowsiness (MD) and acute drowsiness (AD).
47

time to first crash for MD UYAN-2Subject: mean standard deviationSubject 1 16.35 1.58Subject 2 24.86 1.58Subject 3 56.32 1.58Subject 4 21.43 1.58Subject 5 16.27 1.58Subject 6 48.46 1.58Subject 7 - -Subject 8 42.53 1.51Subject 9 2.87 1.40Subject 10 8.74 1.64Subject 11 13.98 1.61
time to first crash for Alert UYAN-1Subject: mean standard deviationSubject 1 49.6 4.18Subject 2 71.89 34.83Subject 3 33.31 4.18Subject 4 90.35 4.18
Table 4.3: Table displays the mean and standard deviation of the time to thefirst crash for the alert and moderately drowsy segments of the UYAN-1 andUYAN-2 datasets respectively. Notice that the two datasets have di!erentset of subjects.
The selected episodes are segmented into non-overlapping 10 second videopatches. CERT action unit outputs are obtained over each of these patches.The UYAN-2 dataset contains data from 11 subjects. 9 subjects have bothcrash and alert episodes. One subject does not have any alert segments asthe first hour of the driving task is lost accidentally by the subject. Oneother subject’s data for crash episodes is lost therefore the subject’s crashdata is not included. For some of the 10 second segments the face could notbe located due to occlusion or false alarms in CERT face detection module.The 10 second segments that have more than 30 video frames with occlusionsor false alarms for the face ( assuming the video is 30 fps this correspondsto 1 second ) were eliminated. Here false alarms in face detection were de-tected using the measure of distance between the eyes. Usually the subject’s
48
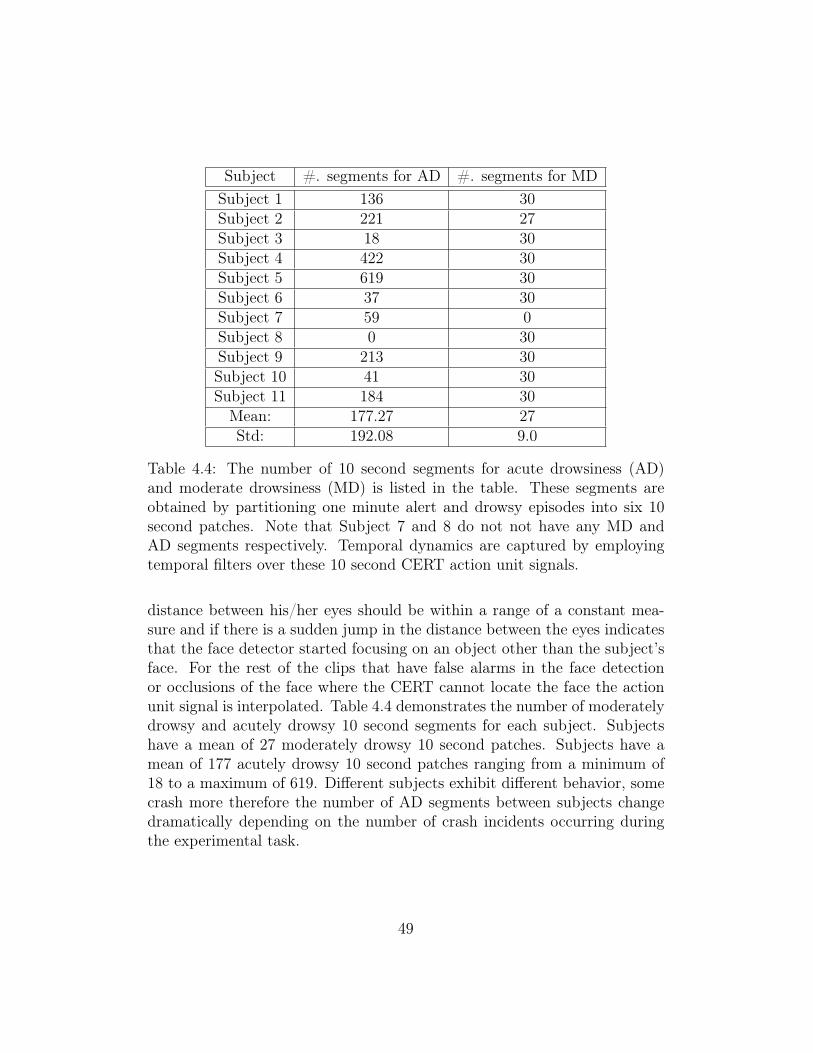
Subject #. segments for AD #. segments for MDSubject 1 136 30Subject 2 221 27Subject 3 18 30Subject 4 422 30Subject 5 619 30Subject 6 37 30Subject 7 59 0Subject 8 0 30Subject 9 213 30Subject 10 41 30Subject 11 184 30
Mean: 177.27 27Std: 192.08 9.0
Table 4.4: The number of 10 second segments for acute drowsiness (AD)and moderate drowsiness (MD) is listed in the table. These segments areobtained by partitioning one minute alert and drowsy episodes into six 10second patches. Note that Subject 7 and 8 do not not have any MD andAD segments respectively. Temporal dynamics are captured by employingtemporal filters over these 10 second CERT action unit signals.
distance between his/her eyes should be within a range of a constant mea-sure and if there is a sudden jump in the distance between the eyes indicatesthat the face detector started focusing on an object other than the subject’sface. For the rest of the clips that have false alarms in the face detectionor occlusions of the face where the CERT cannot locate the face the actionunit signal is interpolated. Table 4.4 demonstrates the number of moderatelydrowsy and acutely drowsy 10 second segments for each subject. Subjectshave a mean of 27 moderately drowsy 10 second patches. Subjects have amean of 177 acutely drowsy 10 second patches ranging from a minimum of18 to a maximum of 619. Di!erent subjects exhibit di!erent behavior, somecrash more therefore the number of AD segments between subjects changedramatically depending on the number of crash incidents occurring duringthe experimental task.
49

4.2 Discriminating Acute versus Moderate Drowsi-ness Using Raw Action Unit Output
The goal in this analysis is to explore the predictive power of the individualfacial action units. Averages of raw action unit outputs are computed over 10second patches of individual CERT action unit outputs. Separability of theaveraged raw action unit outputs is analyzed. We perform a leave-one-outcross validation training procedure. A subject was left out for testing andthe model was trained with the rest of the subjects. MLR classifier is trainedwith 10 training subjects at a time and tested with a novel test subject. Fortraining averaged 10 second patches of an individual action unit are passedto an MLR classifier. The training data has a single feature which is theaverage of the action unit for a 10 second patch. The data points are equalto the number of 10 second patches of 10 subjects. Similarly the test datahas a single feature which is the 10 second average of an action unit and thedata points are equal to the number of 10 second patches of the test subject.Since this is a single feature model, the only parameter that can changethe A’ value for the test subject is the sign assigned by the MLR model tothe AU under consideration. For example based on 10 training subjects theMLR model may assign a positive weight to a particular AU. This meansthat most of the training subjects have increasing intensity value for thisparticular AU as the subject gets more drowsy under the assumption thatthe acute drowsiness state is assigned to a positive class. For each test subjectMLR weight obtained from training was multiplied with the test feature toestimate the A’ over the test outputs. While for training an A’ below 0.5 isnot possible, for an actual system that is required to generalize to new peoplethe test subject A’s may take values less than 0.5. For testing 9 test subjectswere tested as two subjects did not have either drowsy or alert episodes.Individual action unit discriminability measure is estimated by averaging 9test subject’s A’s. Note that the number of crashes across subjects changeddramatically and this way of calculation helps the performance measure suchthat it is not biased for subjects having a large number of drowsy patches.Using this method we can highlight the action units that are informative fora person independent system. This analysis is repeated for all the actionunits. Table 4.5 displays the individual action unit mean A’ estimates overall subjects. The 5 most informative units were (1) Eye Closure (AU45) withan A’ of 0.83 (2) Lip Puckerer (AU18) with an A’ of 0.82 (3) Head Roll with
50
an A’ of 0.77 (4) Lid Tightener (AU7) with an ROC of 0.71 (5) Nose Wrinkle(AU9) with an A’ of 0.69.
In this study we found that brow raise(AU2) increases in drowsy condi-tions in some subjects. As these subjects get more drowsy they raise their eyebrows. However as displayed in Figure 4.9 for one subject (subject 3) AU2decreased dramatically in acute drowsiness and increased (the subject raisedhis brows) in the moderately drowsy condition. As this subject contradictswith the rest of the subjects for this action unit, the A’ value is less than 0.5and closer to 0. This results in AU2 to be a non-informative action unit for asubject independent system due to the cancelling e!ect of the decrease andincrease and neutral state of the intensity values. In the UYAN-1 datasetall of the 4 subjects have increasing AU2 intensity values as they are get-ting more drowsy. With UYAN-2 dataset we are seeing variabilities amongsubjects for AU2.
51

Action Unit A’ Standard ErrorAU 45 0.8346 0.0587AU 18 0.8247 0.0367
Head Roll 0.7761 0.0723AU 7 0.7175 0.0884AU 9 0.6951 0.0702AU 14 0.6402 0.0943AU 23 0.6315 0.0857AU 26 0.6233 0.0728AU 12 0.5920 0.0971
Head Pitch 0.5665 0.1033AU 1 0.5632 0.0973AU 28 0.5368 0.0755AU 4 0.5035 0.0735AU 2 0.4758 0.0938AU 15 0.4684 0.1346AU 20 0.4629 0.0880
Head Yaw 0.4543 0.0830AU 17 0.4393 0.0918AU 6 0.3457 0.0765AU 24 0.3150 0.0494AU 10 0.2787 0.0777AU 5 0.2514 0.0602
Table 4.5: ROC performance results for the output of the raw action unitoutputs over individual action units.
To illustrate how the subjects di!er from each other for certain actionunits we display the histograms of action unit output values for individ-ual subjects summed over 10 second segments. Figure 4.3 displays the his-tograms over sums of eye closure action unit for 10 second segments of theacute drowsy and moderate drowsy cases. The red histogram correspondsto the acute drowsy samples and the blue corresponds to moderately drowsysamples. Here 9 subjects are plotted as 2 subjects do not have AD or MDsamples. The A’ here is computed using the samples of the subject withoutmultiplying with the training weight. Eye closure (AU45) is discriminativefor 7 of the test subjects. Similarly 4.4 displays the histograms for the head
52

roll action unit. This action unit is discriminative for all the subjects. Exceptfor one subject the head roll average intensity value increases as the subjectgets more drowsy. Figure 4.5 displays the histogram for the lip pucker (AU18)action unit. Except for one subject this action unit is discriminative for allsubjects in the increasing direction as the subject gets more drowsy. Figure4.6 displays the histograms for the lid tighten (AU7) action unit. For 7 sub-jects this action unit looks discriminative and for 6 subjects it is increasing asthe subject gets more drowsy. We also analyzed subjectwise discriminabilityof some of the action units that do not perform well for a subject indepen-dent test. Figure 4.8 displays the histograms for the upper lip raiser (AU10)action unit. This action unit is discriminative for 2 subjects in the increasingdirection as the subject gets more drowsy and for 3 subjects in the decreasingdirection as the subject gets more drowsy. For the rest of the subjects thisaction unit is not discriminative. Similarly Figure 4.9 displays the histogramsfor the action unit eye brow raise (AU2). For 4 of the subjects this action isdiscriminative. For 3 subjects this action unit increases as the subject getsmore drowsy and for one subject the intensity value decreases as the subjectgets more drowsy.
53

Figure 4.3: Figure displays the histograms of eye closure (AU45) signal for in-dividual subjects summed over 10 second segments of acute drowsy and mod-erate drowsy samples. The red histogram corresponds to the acute drowsysamples and the blue histogram corresponds to moderately drowsy samples.Here 9 subjects are plotted as 2 subjects do not have either AD or MD sam-ples. The A’ here is computed using the samples of the subject withoutmultiplying with training weight.
54

Figure 4.4: Figure displays the histograms of head roll signal for individualsubjects summed over 10 second segments of acute drowsy and moderatedrowsy samples. The red histogram corresponds to the acute drowsy samplesand the blue histogram corresponds to moderately drowsy samples. Here 9subjects are plotted as 2 subjects do not have either AD or MD samples. TheA’ here is computed using the samples of the subject without multiplyingwith training weight.
55

Figure 4.5: Figure displays the histograms of lip pucker (AU18) signal for in-dividual subjects summed over 10 second segments for acute drowsy andmoderate drowsy samples. The red histogram corresponds to the acutedrowsy samples and the blue histogram corresponds to moderately drowsysamples. Here 9 subjects are plotted as 2 subjects do not have either AD orMD samples. The A’ here is computed using the samples of the subject andwithout using a training weight.
56

Figure 4.6: Figure displays the histograms of summed lid tighten (AU7) sig-nal for individual subjects summed over 10 second segments of acute drowsyand moderate drowsy samples. The red histogram corresponds to the acutedrowsy samples and the blue histogram corresponds to moderately drowsysamples. Here 9 subjects are plotted as 2 subjects do not have either ADor MD samples. The A’ here is computed using the samples of the subjectwithout multiplying with a training weight.
57

Figure 4.7: Figure displays the histograms of summed nose wrinkle (AU9) sig-nal for individual subjects summed over 10 second segments of acute drowsyand moderate drowsy samples. The red histogram corresponds to the acutedrowsy samples and the blue histogram corresponds to moderately drowsysamples. Here 9 subjects are plotted as 2 subjects do not have either ADor MD samples. The A’ here is computed using the samples of the subjectwithout multiplying with a training weight.
58

Figure 4.8: Figure displays the histograms of upper lid raiser (AU10) signalfor individual subjects summed over 10 second segments for acute drowsyand moderate drowsy samples. The red histogram corresponds to the acutedrowsy samples and the blue histogram corresponds to moderately drowsysamples. Here 9 subjects are plotted as 2 subjects do not have either ADor MD samples. The A’ here is computed using the samples of the subjectwithout multiplying with training weight.
59

Figure 4.9: Figure displays the histograms of eye brow raise (AU2) signalfor individual subjects summed over 10 second segments of acute drowsyand moderate drowsy samples. The red histogram corresponds to the acutedrowsy samples and the blue histogram corresponds to moderately drowsysamples. Here 9 subjects are plotted as 2 subjects do not have either ADor MD samples. The A’ here is computed using the samples of the subjectwithout multiplying with training weight.
60

Finally MLR model is trained with the combined 5 most informative ac-tion units by performing leave-one-out cross validation. At each trainingiteration one subjects was left out. The model was trained with di!erentregularization constants. The MLR combined model achieved 0.92 perfor-mance. Figure 4.10 displays the A’ performances in the vertical axis and theregularization constant in the horizontal axis for the combined model.
Figure 4.10: MLR model performances for the combined 5 most informativeaction units by performing leave-one-out cross validation
4.3 Discriminating Acute versus Moderate Drowsi-ness Using Temporal Gabor Filter Output
Analysis of some video clips from the UYAN-2 dataset revealed the fact thataveraging the AU outputs over 10 second segments may lose important infor-
61

mation about dynamics. Consider for example, the data displayed in Figure4.11. The figure displays the output of AU 45 over two di!erent 10 secondepisodes, one from the MD condition and the other one from the AD condi-tion. These two figures have the same mean action unit output value over10 seconds. Thus the mean filter approach would not be able to di!erentiatethese two episodes. However the temporal analysis of these segments canbring additional information for discriminating the two episodes.
The approach we have used to capture temporal dynamics is to processthe AU outputs using a bank of temporal Gabor Filters. Gabor filters aresine wave gratings modulated by a Gaussian and they model the simple cellsin the mammalian visual system. Daugman showed that for 2D banks ofGabor filters at multiple scales and orientations model the response proper-ties of primary visual cortical cells in primates (Daugman 1988) . 2D Gaborfilters have been used in the literature to extract the spatial information inimages. Here we use Gabor filters on uni-dimensional action unit signal to ex-tract temporal information. For this analysis Gabor filters are applied to 10second patches of unsmoothed CERT action unit outputs to get periodicityinformation.
For capturing the temporal dynamics we applied Gabor energy (Magni-tude Gabor), Gabor sine carrier (Real Gabor) and Gabor cosine (ImaginaryGabor) carrier filters to CERT action unit outputs. Figure 4.12 displays asinusoidal sample signal convolved with these three types of filters. The realand imaginary components of a complex Gabor filter are phase sensitive, i.e.,as a consequence their response to a sinusoid is another sinusoid. By gettingthe magnitude of the output (square root of the sum of squared real andimaginary outputs) we can get a response that is phase insensitive and thusunmodulated positive response to a target sinusoid input. Note that the realand imaginary Gabor filters are linear filters whereas the magnitude Gaborfilter is a nonlinear filter. For all of the filters the output response magni-tudes are half the magnitude of the input signal. The real and imaginaryfilter input with a sinusoid input outputs a sinusoidal output with half mag-nitude. However the magnitude filter basically outputs the location of thesinusoid but does not keep the sinusoidal properties of the signal. For thisstudy we found that both Gabor energy and Gabor sine and cosine carrierfilters were informative for discriminating subject state. Therefore we usedall three outputs for our feature analysis.
For this analysis di!erent bandwidth and frequency temporal Gabor fil-ters have been applied to ten second segments of an action unit signal for
62

Figure 4.11: This figure displays a case where temporal dynamics plays animportant role in discriminating two cases. The first case (figure on the top)corresponds to a AD. The subject’s eyes are open all the time except towardsthe end of the clip. The second case (figure on the bottom) demonstrates anmoderately drowsy (MD) clip from another subject. These two eye closuresignals have approximately the same mean. The output would not be ableto tell apart which of these two clips belongs to the AD or MD episode
63

Figure 4.12: Top: An input signal. Second: Output of Gabor filter (cosinecarrier). Third: Output of Gabor Filter in quadrature (sine carrier); Fourth:Output of Gabor Energy Filter [43]
64

individual subjects. The Gabor representations of temporal action unit sig-nals were obtained by convolving the temporal signal with a bank of 306Gabor filters consisting of 18 frequency components ranging from 0 to 8 Hzand 17 bandwidths ranging from 0 to 8 Hz. The Gabor filter frequencies usedfor the analysis have the following values : 8.0, 7.0, 6.0, 5.0, 4.0, 3.0, 2.25,1.6875, 1.2656, 0.9492, 0.7119, 0.5339, 0.4005, 0.3003, 0.2253, 0.1689, 0.010. The bandwidths have the same values excluding zero frequency. Figure4.13 displays filtered version of the signals in Figure 4.11 where the appliedfilter is a magnitude Gabor Filter with frequency 1.26 and bandwidth 1.26.The AD signal has a mean of 0.11 and the MD signal has a mean of 0.36.The magnitude filter can discriminate the two signals whereas the mean filterapproach was not able to discriminate the two signals.
65

Figure 4.13: Filtered version of the signals in Figure 4.11 where the appliedfilter is a magnitude Gabor Filter with frequency 1.26 and bandwidth 1.26.The AD signal has a mean of 0.11 and the MD signal has a mean of 0.36.
66

4.4 Predictive Power of Individual Gabor Fil-ters
The goal in this analysis is to understand which Gabor filters have predictivepower at discriminating moderately drowsy from acutely drowsy segments fora person independent system. For individual action units Gabor filter out-puts were obtained by convolving 10 second moderately drowsy and acutelydrowsy patches with each of the 918 Filters where these filters were Gaborenergy (Absolute Gabor -306 filters 18 frequencyx 17 bandwidth), Gaborsine carrier (Real Gabor- 306 filters 18 frequencyx17 bandwidth) and Gaborcosine carrier filters (Imaginary Gabor- 306 filters- 18 frequencyx17 band-width). In order to estimate each individual Gabor filter’s predictive powerfor an action unit, averages of individual Gabor filter outputs are used as aninput to a single feature MLR model by leaving one subject out at a time.For the magnitude filter output averaging operation outputs the average en-ergy over the temporal signal. For linear filters such as real and imaginaryGabor filters averaging is basically the operation of compounding two filters:the Gabor filter and the averaging filter (lowpass). Here we could have alsoused other statistics such as median, percentiles, range or other filters for thelinear filter output that might keep more information about the linear filteroutput. As a future work we are planning to explore more of these filtersinstead of using the simple averaging. The training data has single featurewhich is the average of the Gabor filter output for 10 second patches andthe number of data points is equal to the total number 10 second AD andMD patches of 10 training subjects. Similarly the test data have a singlefeature which is again the 10 second average of the Gabor filter output foran action unit and the number of data points is equal to the number of 10second AD and MD patches of the test subject. For each test subject, MLRweight obtained from training was multiplied with test data points. Fromthese weighted outputs an A’ was estimated for each test subject. Individualaction unit discriminability for each Gabor Filter is estimated by averaging9 test subject’s A’s. Since this is a single feature model training has no e!ectother than changing the sign of the A’ value. Figure 4.14 displays the A’ foreye closure action unit (AU45) of the Real filter for a set of 18 frequencies and17 bandwidths. The horizontal axis displays the frequency and the verticalaxis displays the bandwidth whereas the color denotes the A’ value. No-tice that low frequencies with all the bandwidths are discriminative of acute
67

drowsiness for this action unit. As the frequency increases low bandwidthsbecome less discriminative. One reason for this could be due to not capturingthe negative frequencies with smaller bandwidths.
In general the Real filter for the eye closure action unit (AU45) is verydiscriminative of acute drowsiness. Similarly Figure 4.15 displays the A’ ofindividual Gabor Filters for all the action units. Each of the 66 (22x3) boxesabove represent the A’ performances for a specific action unit for either abso-lute real or imaginary filter sets. For each box the horizontal axis representsthe frequency (0-8Hz), vertical axis represents the bandwidth (0-8Hz) and thecolor denotes the A’ value. Note that the A’ values are represented between0 and 1 for this figure. Here values less than 0.5 indicate that this is not aprominent filter for subject independent drowsiness. This shows that thereare variabilities in the way the Gabor filter outputs increase or decrease withacute drowsiness. If all the subjects have an increasing value for a Gaborfilter output the A’ will have a value higher than 0.5. If all the Gabor filteroutputs for an action unit have a decreasing value then the A’ will be againhigher than 0.5. However if it is less than 0.5 and a value closer to 0 thanthe the feature might be a prominent feature for a subject dependent system.This can happen if the direction of increase or decrease of the filter outputfor the test subject is di!erent from the increase or decrease direction of trainsubjects. Notice that here head roll (AU55, AU56), eye closure (AU45) andlip puckerer (AU18), (nose wrinkle) AU9 and (lid tightener) AU 7 are someof the most important action units in predicting acute drowsiness. The realfilter looks the most prominent for these action units. One reason for thismight be due to the shape of the real filter. While convolving filters we alignthe middle point of the filter with the time point t of the action unit signal.The real filter’s shape in some frequencies and bandwidths look similar to theonset apex and o!set transition of an action unit signal. In these cases thereal filter looks like an averaging filter whereas the imaginary filter is similarto a di!erence filter. Imaginary and magnitude filters were also prominentwith certain frequencies and bandwidths for the eye closure (AU45) actionunit.
68

Figure 4.14: A’ performances of Real Gabor Filters for the Eye Closure(AU45) action unit. The horizontal axis represents the frequency (0-8Hz),vertical axis represents the bandwidth (0-8Hz) and the color denotes the A’value. Note that the A’ values are represented between 0 and 1 for this figure.Here values more than 0.5 closer to 1 indicate prominent filters of a subjectindependent system. A’ values that are less than 0.5 and closer to 0 mayindicate prominent filters that are subject dependent.
69

Figure 4.15: A’ performances of individual Gabor Filters for all the actionunits. Each of the 66 (22x3) boxes above represent the A’ performances fora specific action unit for either magnitude real or imaginary filter sets. Foreach box the horizontal axis represents the frequency (0-8Hz), vertical axisrepresents the bandwidth (0-8Hz) and the color denotes the A’ value. Notethat the A’ values are represented between 0 and 1 for this figure. Herevalues more than 0.5 and closer to 1 indicate prominent filters a subjectindependent system. A’ values that are less than 0.5 and closer to 0 mayindicate prominent filters that are subject dependent.
70

4.5 Feature SelectionThe goal for this analysis is to select relevant features from the 918 Gaborfilter possibilities for each of the 22 action units. The number of data pointsfor training a classifier for each subject is equal to the number of 10 secondAD and MD segments and for nearly for all of the subjects there are morefeature points than data points (See Table 4.4). The following scheme isfollowed: First the best feature was selected that has the best A’ performanceand then the next feature that achieves the best performance combined withthe previous feature is chosen and the iteration continues in this fashionand chooses the next feature performing best combined with the previouslyselected features. All possible feature sets were trained with MLR by leavingone subject out at a time and using cross validation with generalization tonovel test subjects. The obtained weights are tested on the test subject toestimate the predictive power of this features set on the test subject. Anaverage of the test subject A’s determined the dicriminability power of thisfeature set. At each iteration of the feature selection the feature that hasthe highest discriminability power combined with the previous features isincluded as a prominent feature. We tried 1 to 10 features with di!erentregularization constants.
4.5.1 Eye Closure (AU45)The results obtained with the eye closure action unit (AU45) are displayed inFigure 4.16. As the performance saturates with 10 features we stopped afterpicking 10 features for all of the action units. In the figure the horizontal axisrepresents the regularization constant for an L2 MLR model. The verticalaxis displays the average A’ over all test subjects for a specific feature countand regularization constant. The highest discriminability for eye closure wasobtained with regularization constant 0 and using 10 features. Notice that theaverage filter was able to obtain an average A’ of 0.83 for eye closure (AU45)whereas here the performance is higher approximately 0.90 with temporalGabors using regularization 0 and 10 features.
71

Figure 4.16: A’ performance for Action Unit 45 (eye closure) versus regu-larization constant for di!erent number of features selected with an iterativefeature selection policy. The vertical axis displays the A’ and the horizontalaxis displays the regularization constant. Each colored graph displays di!er-ent number of best features selected with iterative feature selection. Best A’is obtained with regularization constant zero and 10 features.
The features selected by the best model is displayed in Figure 4.17.
72

Figure 4.17: Features selected for the best model for eye closure action unit(AU45)
Figure 4.18 displays the best average A’ (for the optimal regularizationparameter) for eye closure as a function of the number of features. Each point(red dot) on the blue line displays the average A’ over test subjects with thebest performing regularization constant for a certain number of features. Thegreen dots represent the standard error over the test subjects. The standarderror is computed by dividing the standard deviation of subject performances
73

s with the square root of number of subjects n as displayed below.
SE =s&n
(4.1)
As displayed in the figure the performance saturates towards 10 features.Therefore for this analysis we stopped the iteration for feature search at thetenth round.
Figure 4.18: The blue line represent the best average A’ among test subjectsachieved for di!erent number of features. Each point (red dot) on the blueline displays the average A’ over test subjects with the best performing regu-larization constant for a certain number of features. The green dots representthe standard error over the test subjects.
4.5.2 Lip Pucker (AU18)We next report the results for the second best action unit Lip Pucker (AU18).The A’ performance averaged over test subjects for the Lip Pucker action
74

unit (AU18) is displayed in Figure 4.19. In the figure the horizontal axisrepresents the regularization constant for an L2 MLR model. The verticalaxis displays the average A’ over all test subjects for a specific feature countand regularization constant. The highest A’ obtained for lip pucker (AU18) is0.84 with regularization constant 0.1 and using 10 best features. Notice thatthe average filter is able to obtain an average A’ of 0.82 for lip pucker (AU18)whereas here the performance is approximately 0.84 with regularization 0 and10 features. The features selected by the best model is displayed in Figure4.20.
Figure 4.19: A’ performance for Action Unit 18 (Lip Pucker) versus regu-larization constant for di!erent number of features selected with an iterativefeature selection policy. The vertical axis displays the A’ and the horizontalaxis displays the regularization constant. Each colored graph shows di!erentnumber of best features selected with iterative feature selection. Best A’ isobtained with regularization constant 0.1 and 10 features.
75
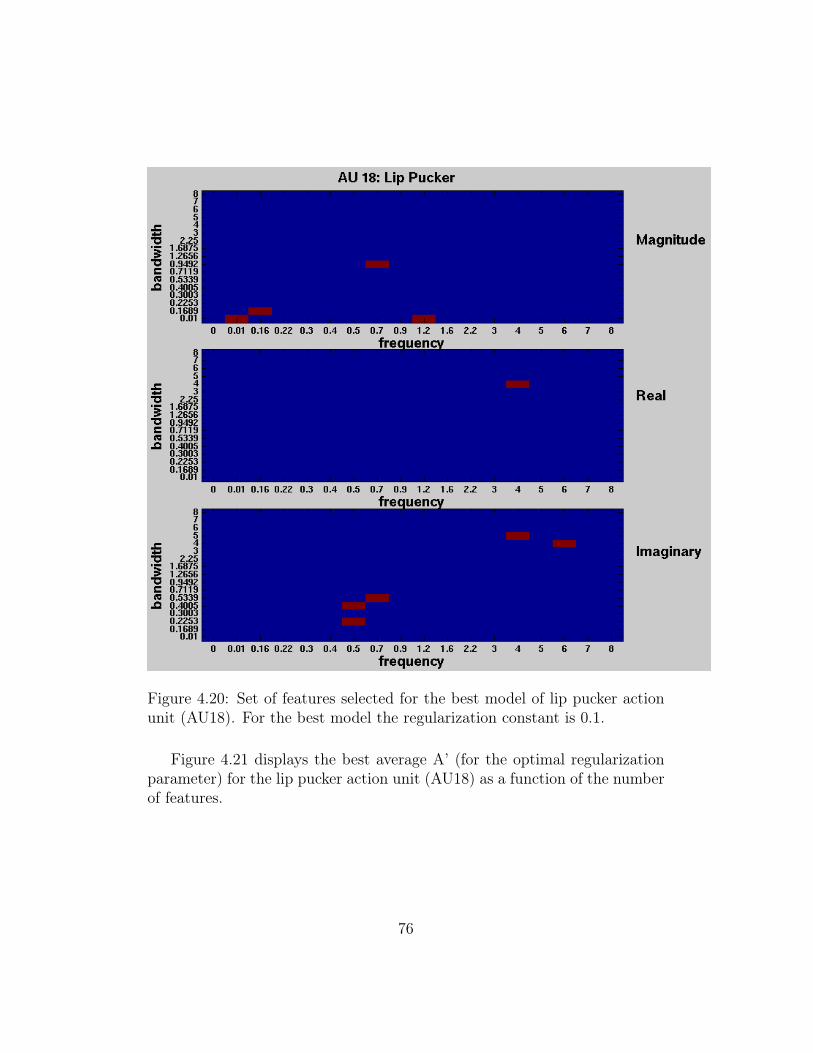
Figure 4.20: Set of features selected for the best model of lip pucker actionunit (AU18). For the best model the regularization constant is 0.1.
Figure 4.21 displays the best average A’ (for the optimal regularizationparameter) for the lip pucker action unit (AU18) as a function of the numberof features.
76

Figure 4.21: Best A’ achieved as a function of di!erent number of featuresfor Lip Pucker action unit (AU18). The blue line represent the best averageA’ among test subjects achieved for di!erent number of features. Each point(red dot) on the blue line shows the average A’ over test subjects with thebest performing regularization constant for a certain number of features. Thegreen lines represent the standard error over the test subjects.
4.5.3 Head Roll (AU55-AU56)We next report the results for the third best action unit Head Roll (AU55-AU56). The results obtained with the Head Roll action unit (AU55-AU56) fora person independent action unit is reported in Figure 4.22. In the figure thehorizontal axis represents the regularization constant for an L2 MLR model.The vertical axis shows the average A’ over all test subjects for a specificfeature count and regularization constant. The highest A’ performance forhead roll was 0.81 obtained with a regularization constant term of 0.5 and 8features. The figure displays the results with 1 to 10 features. Notice that
77

the average filter for Head Roll was able to obtain an average A’ of 0.77whereas here the performance is approximately 0.81 with regularization 0.5and 8 features. The selected 8 best features is displayed in Figure 4.23.
Figure 4.22: A’ performance for Head Roll versus regularization constantfor di!erent number of features selected with an iterative feature selectionpolicy. The vertical axis displays the A’ and the horizontal axis displays theregularization constant. Each colored graph shows di!erent number of bestfeatures selected with iterative feature selection. Best A’ performance of 0.81is obtained with regularization constant 0.5 and 8 features.
78

Figure 4.23: Selected features for the best model for Head Roll (AU55-AU56)action unit.
Figure 4.24 displays the best average A’ (for the optimal regularizationparameter) for head roll as a function of the number of features.
79

Figure 4.24: Best A’ achieved with di!erent number of features for Head Roll.The blue line represent the best average A’ among test subjects achieved fordi!erent number of features. Each point (red dot) on the blue line shows theaverage A’ over test subjects with the best performing regularization constantfor a certain number of features. The green lines represent the standard errorover the test subjects.
4.5.4 Lid Tighten (AU7)We next report the results for the fourth best action unit Lid Tighten (AU 7)for a person independent action unit. The A’ performance results averagedover test subjects for the Lid Tighten (AU7) is displayed in Figure 4.25. Inthe figure the horizontal axis represents the regularization constant for anL2 MLR model. The vertical axis shows the average A’ over all test subjectsfor a specific feature count and regularization constant. The highest A’ per-formance for lid tighten was 0.74 with temporal Gabors using regularizationconstant 2 and 10 features. Notice that the average filter for Lid Tighten was
80

able to obtain an average A’ of 0.71 whereas here the performance is approx-imately 0.75 with regularization constant 2 and 10 features. The selectedfeatures for the best model is displayed in Figure 4.26.
Figure 4.25: A’ performance for Action Unit 7 (Lid Tighten) versus regu-larization constant for di!erent number of features selected with an iterativefeature selection policy. The y axis shows the A’ and the x axis shows theregularization constant. Each colored graph shows di!erent number of bestfeatures selected with iterative feature selection. Best A’ of 0.74 is obtainedwith regularization constant 2 and 10 features.
81
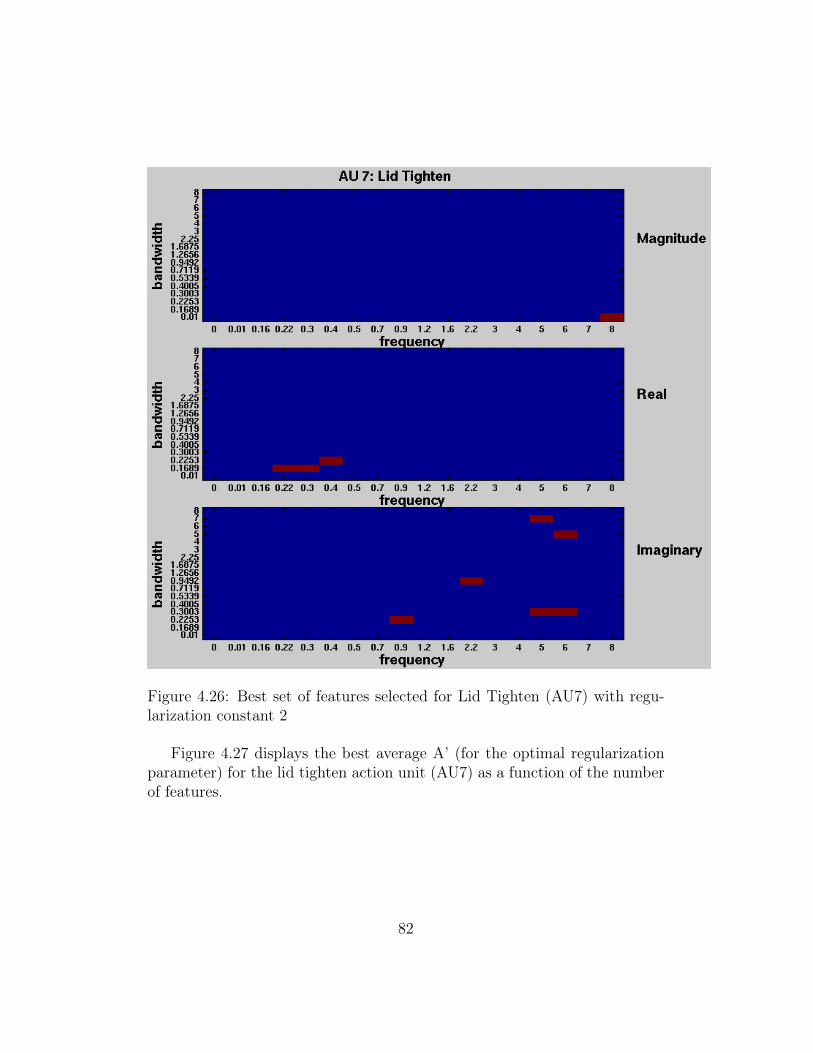
Figure 4.26: Best set of features selected for Lid Tighten (AU7) with regu-larization constant 2
Figure 4.27 displays the best average A’ (for the optimal regularizationparameter) for the lid tighten action unit (AU7) as a function of the numberof features.
82

Figure 4.27: Best average A’ (for the optimal regularization parameter) asa function of the number of features for Lid Tighten action unit (AU7).The blue line represent the best average A’ among test subjects achieved fordi!erent number of features. Each point (red dot) on the blue line shows theaverage A’ over test subjects with the best performing regularization constantfor a certain number of features. The green lines represent the standard errorover the test subjects.
4.5.5 Nose Wrinkle (AU9)We next report the results for the fifth best action unit Nose Wrinkle (AU9).The A’ performance results averaged over test subjects for the Nose Wrinkleis reported in Figure 4.28. In the figure the horizontal axis represents theregularization constant for an L2 MLR model. The vertical axis shows theaverage A’ over all test subjects for a specific feature count and regularizationconstant. The highest A’ performance for nose wrinkle (AU 9) was 0.80obtained with a regularization constant term of 0.001 and 10 features. Notice
83

that the average filter for Head Roll was able to obtain an average A’ of 0.69whereas here the performance is approximately 0.81 with temporal Gaborsusing regularization 0.001 and 10 features. The features selected for the bestmodel is displayed in Figure 4.29.
Figure 4.28: A’ performance for Action Unit 9 (Nose Wrinkle) versus regu-larization constant for di!erent number of features selected with an iterativefeature selection policy. The vertical axis shows the A’ and the horizontalaxis shows the regularization constant. Each colored graph shows di!erentnumber of best features selected with iterative feature selection. Best A’ isobtained with regularization constant 0.001 and 10 features.
84
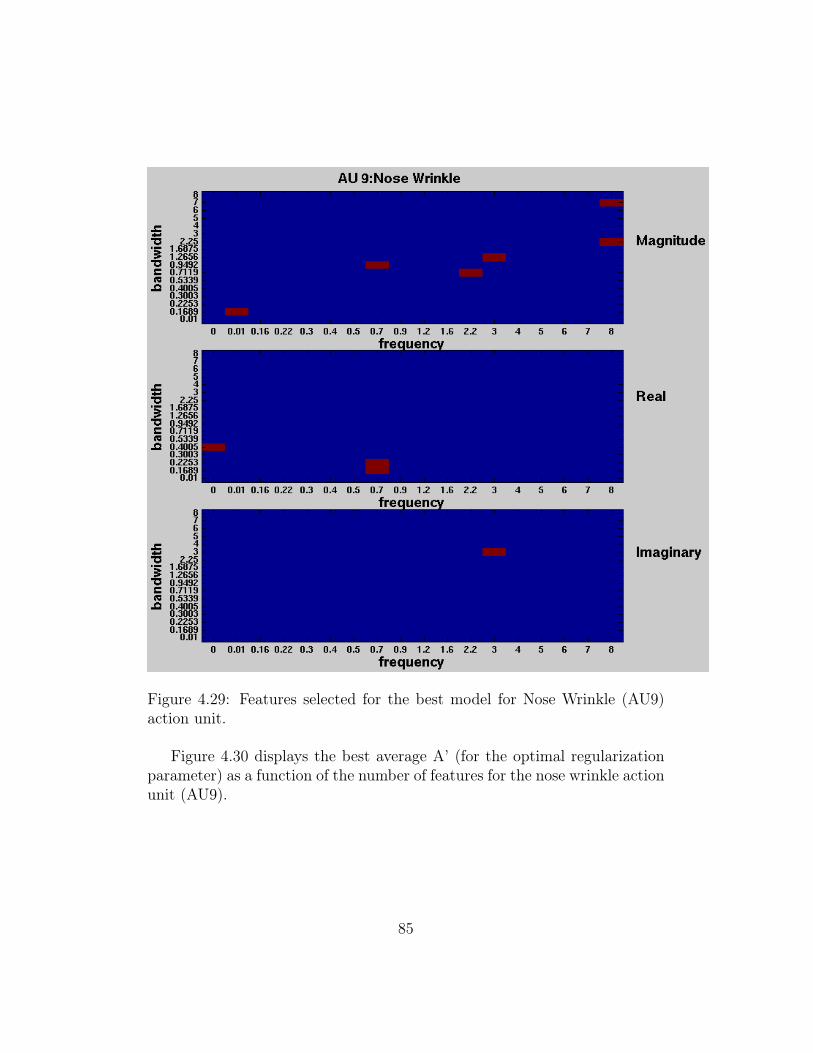
Figure 4.29: Features selected for the best model for Nose Wrinkle (AU9)action unit.
Figure 4.30 displays the best average A’ (for the optimal regularizationparameter) as a function of the number of features for the nose wrinkle actionunit (AU9).
85

Figure 4.30: Best A’ achieved with di!erent number of features for NoseWrinkle (AU9). The blue line represent the best average A’ among testsubjects achieved for di!erent number of features. Each point (red dot) onthe blue line shows the average A’ over test subjects with the best performingregularization constant for a certain number of features. The green linesrepresent the standard error over the test subjects.
4.6 Combining Multiple Action UnitsFor this analysis the features of best performing five action units were com-bined to build a person independent drowsiness detector. These action unitswere as follows : Eye Closure (AU45), Lip Pucker (AU18), Head Roll (AU55-AU56), Lid Tighten (AU7), Nose Wrinkle (AU9). The best performing fea-tures for these action units obtained in the single AU models were combinedto train a classifier. Except Head Roll achieving the best performance with 8features all the other four action units had a set of 10 best features resultingin a total of 48 features. Iterative feature selection was performed over these
86

48 features. The following procedure was followed: First the best featurewas selected that has the best A’ performance and then the next featurethat achieved the best performance combined with the previous feature waschosen and the next iteration continued in this fashion and chose the nextfeature performing best combined with the previously selected features. Upto 10 best features for 8 regularization constant ranging from 0 to 3 wereexplored with an L2 MLR model. All possible feature sets were trained withMLR by leaving one subject out at a time and using cross validation withgeneralization to novel test subjects. The obtained MLR weights for a trainset are tested on the test subject to estimate the predictive power of this fea-ture set on the test subject. An average of the test subject A”s determinedthe dicriminability power of this feature set. At each iteration of the itera-tive feature selection the feature that has the highest discriminability powercombined with the previous features is included as a prominent feature. Wetried feature counts from 1 to 10 with di!erent regularization constants. Theresults for the selected best feature sets from a set of 48 possible featuresis displayed in Figure 4.31. As the performance mostly begins saturatingwith 10 features we stopped after picking 10 features for all of the actionunits. In the figure the horizontal axis represents the regularization constantfor an L2 MLR model. The vertical axis shows the average A’ over all testsubjects for a specific feature count and regularization constant. The highestdiscriminability A’ performance of .96 was obtained for the combined actionunits with temporal Gabors using regularization constant 0.01 and using 10features. Note that the highest A’ performance of .96 cuts the error in halfwhen compared with the highest A’ performance of .90 for eye closure actionunit (AU 45). Hence combining other action units helps to build a moreaccurate person independent drowsiness detector.
87

Figure 4.31: A’ performance for 5 best action units combined versus regu-larization constant for di!erent number of features selected with an iterativefeature selection policy. The vertical axis shows the A’ and the horizontalaxis shows the regularization constant. Each colored graph shows di!erentnumber of best features selected with iterative feature selection. Best A’ of0.96 is achieved with regularization constant 0.01 and 10 features.
88

4.7 ConclusionsIn this study we notice that the markers for di!erent levels of drowsinesschange. When di!erentiating acute drowsiness from moderate drowsinessthe most discriminative action units are: Eye Closure (AU45), Head Roll(AU55-AU56), Lip Pucker (AU18), Lid Tightener (AU7) and Nose Wrinkle(AU9). We found that some features are good at discriminating both alertfrom acutely drowsy and moderately drowsy from acutely drowsy. For ex-ample eye closure is one of these action units. However some features aregood at discriminating alert from acutely drowsy but are not good at dis-criminating moderately drowsy from acutely drowsy. Yawning (AU26) andSmile (AU12) are examples of these action units. For this study head roll(AU55-AU56) was a good predictor for drowsiness supporting the prelim-inary study results in Study I. The subjects move their heads in the rolldimension as they get more drowsy. In this study consistent with Study Ibrow raise (AU2) increases in drowsy conditions in some subjects. Howeverfor this study one subject lowered his eyebrows dramatically ( AU2 intensitydecreased) in acute drowsiness state and raised his eyebrows in the moder-ate drowsiness condition. This resulted in AU2 to be non-informative for aperson independent system. With UYAN-2 dataset we saw that there existsvariabilities among subjects for the eye brow raise (AU2) signal. Using tem-poral properties of the signal and employing a Gabor representation increasedthe performance. Figure 4.32 displays a bar graph for the performance gainof Gabor filter outputs in comparison with raw action unit outputs for the5 best performing action units . In this figure the red bars indicate the Ga-bor Filter output performances. For all the action units the performancewith temporal Gabors was higher in comparsion with the raw action unitoutputs. For example eye closure action unit performance A’ increased from.83 to .90 after employing temporal Gabors. Finally by combining other ac-tion units the error could be cut in half in comparison to using only singleaction unit, eye closure (AU45), even for a harder task of discrimination offine drowsiness. The performance increased from .90 using temporal Gabors(Eye closure) to .96 by employing all 5 action units using temporal Gabors.Temporal Gabor model achieved .96 A’ by employing 5 action units whereasthe raw action unit model achieved .92 A’ with the same 5 action units. Thusthe temporal Gabors increased the overall performance.
89

Figure 4.32: Bar graph displaying the performances for 5 best performingaction units with the raw action unit output and the best model of GaborFilter outputs.
90

Chapter 5
Conclusions and Future Work
5.1 ConclusionsThis is the first study that uses a large set of spontaneous facial expressionsfor the detection of drowsiness. Previous approaches to drowsiness detec-tion primarily make pre-assumptions about the relevant behavior, focusingon blink rate, eye closure, and yawning. Here we employ machine learn-ing methods to datamine actual human behavior during drowsiness episodes.Spontaneous expressions have a di!erent brain substrate than posed expres-sions. They also typically di!er in morphology and dynamics. This studyreveals that facial expressions are very reliable indicators of driver drowsinessand facial expressions can be used to do fine discrimination in the di!erentlevels of drowsiness and reliably predict the time to crash. In laboratoryconditions computer vision expression recognition systems can be used to re-liably detect drowsiness and predict crash with high reliability. Field studiesare needed to evaluate the performance of these systems in actual drivingenvironments. Spontaneous facial expressions under drowsiness are very dif-ferent from posed expressions of drowsiness. We confirmed that some facialbehavior previously reported in the literature (e.g., eye closure) is a reliableindicator of fatigue. However there are other expressions that are as reliableas eye closure and can be combined to improve detection. For discriminationof alertness vs drowsiness we found out that the Nose Wrinkle (AU 9), Eye-brow Raise (AU2), Eye Closure (AU 45), Chin Raise (AU 17), Yawn (AU 26),Head Roll were some of the most discriminative action units. When com-bined these facial expressions can discriminate alert from drowsiness with
91

0.98 area under the ROC curve performance for a temporal window of 12seconds and saturates to 0.99 for 30 seconds or above. Yawning, actuallyoccurred less often in the critical 60 seconds prior to a crash. We found thatyawning does not tend to occur in the final moments before falling asleep.Finer discrimination, di!erentiating moderately drowsy from acutely drowsy,is a much more challenging task than di!erentiation of alert from drowsy. Wefound that the markers for di!erent levels of drowsiness change : Notice thatsome of these markers may also be related to subject-wise di!erences as thetwo studies use di!erent set of subjects. When di!erentiating acutely drowsyfrom moderately drowsy the most discriminative action units are :Eye Clo-sure, Head Roll, Lip Puckerer, Lid Tightener, Nose Wrinkle. Some featuresare good at discrimination of both alert from acutely drowsy and moderatelydrowsy from acutely drowsy. For example eye closure is one of these actionunits. However some features are good at discriminating alert from acutelydrowsy but are not good at discriminating moderately drowsy from acutelydrowsy. Smile and yawning are examples of these action units. There are alsosubject-wise di!erences. In discriminating acutely drowsy from moderatelydrowsy brow raise(AU2) increases in acutely drowsy conditions in some sub-jects decreases in one subject and is neutral in others. With UYAN-2 datasetwe saw that there are variabilities among subjects for the AU2. In the firststudy preliminary results indicated that Head Roll is an important measurefor some subjects in discriminating alert from drowsy. For Study II headroll was a good predictor of drowsiness consistent with the finding that mostsubjects move their heads in the roll dimension as they get more drowsy. ForStudy II using temporal properties of the signal and using Gabor representa-tion increased the performance. By combining other action units in additionto eye closure (AU45) the error can be cut in half even for a harder task ofdiscrimination of fine drowsiness. Combining other action units also providesextra information for the detection of drowsiness in the case of occlusions ofthe eye such as sun-glasses.
5.2 Future WorkIn this study we built reasonable classifiers using feature extraction methodssuch as Gabor features and iterative feature selection approaches. Here Ga-bor filters are used to analyze temporal structure but other methods such asICA or power spectrum could also be used instead. In addition other feature
92

selection methods such as PCA could have been used instead of iterative fea-ture selection method. In the future these feature extraction and selectionmethods are planned to be further explored.
This study indicates that some of the action units like AU2 and AU10 isdiscriminative in increasing or decreasing intensity value directions for somesubjects and non-discriminative for others. This information is planned tobe used in the future for a person dependent system. We do not report theresults of our study for adaptive drowsiness detection however person depen-dent approach was explored in a preliminary study. Individual di!erences inthe way drowsiness is expressed are investigated and how to automaticallyadapt detection of drowsiness to individual drivers is researched partially. Inthe future the analysis will be further extended to understand the pros andcons of a person dependent, adaptive and a person independent drowsinessdetection system.
We reported some preliminary results for coupling between eye closureand eye brow raise and head movement and steering signals for Study I.Coupling of behaviours is not studied for Study II. This is planned be ex-plored in a future study.
In study I we classified segments into two classes such as acutely drowsyversus alert. In the future classes in Study II and Study I can be expandedinto three classes as alert, moderately drowsy, and acutely drowsy and thusthe two studies can be further compared. In addition for both studies theproblem can be further extended and handled as a regression problem. Thuswe plan to predict continuous measure such as time to crash using facial andmovement measures.
The results obtained for both studies in this thesis might be subject ordataset dependent. In the future both studies need to be repeated with anexpanded set of subjects to verify these results.
Although it is not reported in this thesis we also worked on brain wavesand we could predict fatigue based on raw EEG signal. However we discov-ered that we are actually using the motion artifacts to predict drowsiness.Motion artifacts are a big unsolved problem in EEG. In the future new tech-niques can be explored to eliminate motion artifacts from EEG.
For the UYAN-2 upper torso movement measures are collected as a sep-arate measure. This measure is planned to be analyzed in detail as a futurework.
For the UYAN-2 dataset subjective measures of drowsiness is collectedfrom two human labelers labeling the video in a continuous manner. The
93

video clips are labeled by two labelers by moving the sliding bar using arrowkey while watching the video at full speed. The labels were discrete andranged from -5 (very alert) to 5 (very drowsy). In the future, how humansperceive fatigue and how the human labels correlate with the the action unitsis planned to be investigated.
94

Bibliography
[1] Driver fatigue is an important cause of road crashes.http://www.smartmotorist.com/tra!c-and-safety-guideline/driver-fatigue-is-an-important-cause-of-road-crashes.html.
[2] Driver State Sensor developed by seeingmachines Inc.http://www.seeingmachines.com/product/DSS.
[3] Electroencephalogram (eeg). http://weirddreams.net/electroencephalogram-eeg/.
[4] Regulatory impact and small business analysis for hours of service op-tions. Federal Motor Carrier Safety Administration. Retrieved on 2008-02-22.
[5] Statistics related to drowsy driver crashes.http://www.americanindian.net/sleepstats.html.
[6] Heart rate variability: standards of measurement, physiological interpre-tation and clinical use. task force of the european society of cardiologyand the north american society of pacing and electrophysiology. Circu-lation, 93(5):1043–1065, March 1996.
[7] Planque S. Lavergne C. Cara H. de Lepine P. Tarriere C. Artaud, P.An on-board system for detecting lapses of alertness in car driving. In14th E.S.V. conference, session 2 - intelligent vehicle highway systemand human factors Vol 1, Munich, Germany, 1994.
[8] M.S. Bartlett, G. Donato, J.C. Hager, P. Ekman, and T.J. Sejnowski.Face image analysis for expression measurement and detection of deceit.In Proceedings of the 6th joint symposium on Neural Computation, pages8–15, 1999.
95

[9] M.S. Bartlett, G. Littlewort, B. Braathen, T.J. Sejnowski, and J.R.Movellan. A prototype for automatic recognition of spontaneous facialactions. In S. Becker, S. Thrun, and K. Obermayer, editors, Advancesin Neural Information Processing Systems, volume 15, pages 1271–1278,Cambridge, MA, 2003. MIT Press.
[10] M.S. Bartlett, G.C. Littlewort, M.G. Frank, C. Lainscsek, I. Fasel, andJ.R. Movellan. Automatic recognition of facial actions in spontaneousexpressions. Journal of Multimedia., 1(6) p. 22-35.
[11] G. Belenky, T.J. Balkin, D.P. Redmond, H.C. Sing, M.L. Thomas, D.R.Thorne, and N.J. Wesensten. Sustained performance during continuousoperations, The US army’s sleep management system. Elsevier ScienceLtd In Hartley, L.R. (Ed.) Managing Fatigue in Transportation. Pro-ceedings of the Third International Conference on Fatigue and Trans-portation, Fremantle, Western Australia., Oxford, UK, 1998.
[12] Bernhard E. Boser, Isabelle M. Guyon, and Vladimir N. Vapnik. Atraining algorithm for optimal margin classifiers. In Proceedings of the5th Annual ACM Workshop on Computational Learning Theory, pages144–152. ACM Press, 1992.
[13] A. E. Burgess. Comparison of receiver operating characteristic andforced choice observer performance measurement methods. Medicalphysics, 22(5):643–655, May 1995.
[14] Mi-Kyeong Byeon, Sang-Whi Han, Hong-Ki Min, Yo-Seop Wo, Young-Bae Park, and Woong Huh. A study of hrv analysis to detect drowsinessstates of drivers. In BioMed’06: Proceedings of the 24th IASTED in-ternational conference on Biomedical engineering, pages 153–155, Ana-heim, CA, USA, 2006. ACTA Press.
[15] W.A. Cobb. Recommendations for the practice of clinical neurophysiol-ogy. Elsevier, 1983.
[16] C. Cudalbu, B. Anastasiu, R. Radu, R. Cruceanu, E. Schmidt, andE. Barth. Driver monitoring with a single high-speed camera and IRillumination. Signals, Circuits and Systems, 2005. ISSCS 2005. Inter-national Symposium on, 1:219–222 Vol. 1, July 2005.
96

[17] J. Daugman. Two-dimensional spectral analysis of cortical receptivefield profiles. Vision Research, 20(10):847–856, 1980.
[18] D F Dinges and M M Mallis. Managing fatigue by drowsiness detection:Can technological promises be realised. In Proceedings of the Third Inter-national Conference on Fatigue and Transportation, Fremantle, WesternAustralia. Elsevier Science Ltd, pages 15–17. Elsevier, 1998.
[19] G. Donato, M. Bartlett, J. Hager, P. Ekman, and T. Sejnowski. Classify-ing facial actions. IEEE Transactions on Pattern Analysis and MachineIntelligence, 21(10):974–989, 1999.
[20] D.Royal. National survey of distracted and drowsy driving attitudes andbehavior: 2002 Volume I Findings Report. The Gallup Organization,2003.
[21] P. Ekman. Telling Lies: Clues to Deceit in the Marketplace, Politics,and Marriage. W.W. Norton, New York, 3rd edition, 2001.
[22] P. Ekman and Rosenberg E.L. What the face reveals: Basic and ap-plied studies of spontaneous expression using the Facial Action CodingSystem. Oxford University Press, New York, 2005.
[23] P. Ekman and W. Friesen. Facial Action Coding System: A Techniquefor the Measurement of Facial Movement. Consulting PsychologistsPress, Palo Alto, CA, 1978.
[24] S. Elsenbruch, M. J. Harnish, and W. C. Orr. Heart rate variabilityduring waking and sleep in healthy males and females. Sleep, 22:1067–1071, Dec 1999.
[25] J. C. Falmagne. Elements of psychophysical theory. Oxford: OxfordUniversity Press„ 1985.
[26] Movellan J.R. Fasel I., Fortenberry B. A generative framework for real-time object detection and classification. Computer Vision and ImageUnderstanding., 98, 2005.
[27] Jerome Friedman, Trevor Hastie, and Robert Tibshirani. Additive lo-gistic regression: a statistical view of boosting. Annals of Statistics,28:2000, 1998.
97

[28] R. Grace, V.E. Byrne, D.M. Bierman, J.-M. Legrand, D. Gricourt, B.K.Davis, J.J. Staszewski, and B. Carnahan. A drowsy driver detectionsystem for heavy vehicles. Digital Avionics Systems Conference, 1998.Proceedings., 17th DASC. The AIAA/IEEE/SAE, 2:I36/1–I36/8 vol.2,Oct-7 Nov 1998.
[29] David Marvin Green and John A. Swets. Signal detection theory andpsychophysics [by] David M. Green [and] John A. Swets. Wiley NewYork„ 1966.
[30] Haisong Gu and Qiang Ji. An automated face reader for fatigue detec-tion. In FGR, pages 111–116, 2004.
[31] Haisong Gu, Yongmian Zhang, and Qiang Ji. Task oriented facial be-havior recognition with selective sensing. Comput. Vis. Image Underst.,100(3):385–415, 2005.
[32] Riad I. Hammoud and Harry Zhang. Alertometer: Detecting and miti-gating driver drowsiness and fatigue using an integrated human factorsand computer vision approach. In Passive Eye Monitoring, Signals andCommunication Technology, pages 301–321. Springer Berlin Heidelberg,2008.
[33] L. Hartley, T. Horberry, N. Mabbott, and G P. Krueger. Review offatigue detection and prediction technologies. Technical report, NationalRoad Transport Commission, 2000.
[34] Kim Hong, Chung. Electroencephalographic study of drowsiness in sim-ulated driving with sleep deprivation. International Journal of IndustrialErgonomics., Volume 35, Issue 4, April 2005, Pages 307-320.
[35] T. Kanade, J.F. Cohn, and Y. Tian. Comprehensive database for facialexpression analysis. In Proceedings of the fourth IEEE Internationalconference on automatic face and gesture recognition (FG’00), pages46–53, Grenoble, France, 2000.
[36] Wang J.S. Knipling, R.R. Revised estimates of the US drowsy drivercrash problem based on general estimates system case reviews. In Pro-ceedings of the 39th Annual Association for the Advancement of Au-tomative Medicine, pages 451–466, Chicago, IL, 1995.
98
[37] C. Lavergne, P. De Lepine, P. Artaud, S. Planque, A. Domont, C. Tar-riere, C. Arsonneau, X. Yu, A. Nauwink, C. Laurgeau, J.M. Alloua,R.Y. Bourdet, J.M. Noyer, S. Ribouchon, and C. Confer. Results of thefeasibility study of a system for warning of drowsiness at the steeringwheel based on analysis of driver eyelid movements. In Proceedings ofthe Fifteenth International Technical Conference on the Enhanced Safetyof Vehicles, Melbourne, Australia, 1996.
[38] Chin-Teng Lin, Ruei-Cheng Wu, Tzyy-Ping Jung, Sheng-Fu Liang, andTeng-Yi Huang. Estimating driving performance based on EEG spec-trum analysis. EURASIP J. Appl. Signal Process., 2005:3165–3174,2005.
[39] G. Littlewort, M.S. Bartlett, I. Fasel, J. Susskind, and J.R. Movellan.Dynamics of facial expression extracted automatically from video. InIEEE Conference on Computer Vision and Pattern Recognition, Work-shop on Face Processing in Video, 2004.
[40] Gwen C. Littlewort, Marian Stewart Bartlett, and Kang Lee. Facesof pain: automated measurement of spontaneousallfacial expressions ofgenuine and posed pain. In ICMI ’07: Proceedings of the 9th interna-tional conference on Multimodal interfaces, pages 15–21, New York, NY,USA, 2007. ACM.
[41] G. Littlewort-Ford, M.S. Bartlett, and J.R. Movellan. Are your eyessmiling? detecting genuine smiles with support vector machines andgabor wavelets. In Proceedings of the 8th Joint Symposium on NeuralComputation, 2001.
[42] Stilwell-Morecraft KS Louie JL, Herrick JL. Cortical innervation of thefacial nucleus in the non-human primate: a new interpretation of thee!ects of stroke and related subtotal brain trauma on the muscles offacial expression. Brain, 124(1):176–208, January 2001.
[43] Javier R. Movellan. Tutorial on gabor filters.http://mplab.ucsd.edu/tutorials/gabor.pdf .
[44] Javier R. Movellan. Tutorial on multinomial logistic regression.http://mplab.ucsd.edu/tutorials/MultivariateLogisticRegression.pdf .
99

[45] J.F. O’Hanlon, B.J. Oborne, and J.A. Levis (Eds). Critical TrackingTask (CTT) Sensitivity to Fatigue in Truck Drivers. Academic PressInc., London, MA, 1981.
[46] Karl F. Van Orden, Tzyy-Ping Jung, and Scott Makeig. Combined eyeactivity measures accurately estimate changes in sustained visual taskperformance. Biological Psychology, 2000 Apr;52(3):221-40.
[47] W. E. Rinn. The neuropsychology of facial expression: A review of theneurological and psychological mechanisms for producing facial expres-sions. Psychological Bulletin, 95(1):52–77, 1984.
[48] A.; Senaratne-R.; Halgamuge S. Saeed, I.; Wang. Using the active ap-pearance model to detect driver fatigue. In Information and Automationfor Sustainability, 2007. ICIAFS 2007. Third International Conference,pages 124–128, 4-6 Dec. 2007.
[49] Saeid Sanei and J. A. Chambers. EEG Signal Processing. Wiley-Interscience, September 2007.
[50] Rajinda Senaratne, David Hardy, Bill Vanderaa, and Saman Halgamuge.Driver fatigue detection by fusing multiple cues. In Advances in Neu-ral Networks ISNN 2007, volume 4492 of Lecture Notes in ComputerScience, pages 801–809. Springer Berlin / Heidelberg, 2007.
[51] Y. Takei, Y. Furukawa. Estimate of driver’s fatigue through steeringmotion. In Man and Cybernetics, 2005 IEEE International Conference,Volume: 2, On page(s): 1765- 1770 Vol. 2.
[52] Johannes van den Berg and Ulf Landstrom. Symptoms of sleepinesswhile driving and their relationship to prior sleep, work and individualcharacteristics. Transportation Research Part F: Tra!c Psychology andBehaviour, 9(3):207 – 226, 2006.
[53] Eric Wahlstrom, Osama Masoud, Nikos Papanikolopoulos, and SeniorMember. Vision-based methods for driver monitoring. In IEEE Intelli-gent Transportation Systems Conf, pages 903–908, 2003.
[54] Jacob Whitehill, Gwen Littlewort, Ian Fasel, Marian Bartlett, and JavierMovellan. Toward practical smile detection. IEEE Transactions onPattern Analysis and Machine Intelligence, 99(2), 5555.
100

[55] D.Mayhew W.Vanlaar, H.Simpson and R. Robertson. Fatigued anddrowsy driving: Attitudes, concern and practices of Ontario Drivers.Technical Report. Tra"c Injury Research Foundation, 2007.
[56] Iizuka H. Yanagishima-T. Kataoka Y. Seno T. Yabuta, K. The devel-opment of drowsiness warning devices. In Proceedings 10th Interna-tional Technical Conference on Experimental Safety Vehicles, Washing-ton, USA., 1985.
[57] Xun Yu. Real-time nonintrusive detection of driver drowsiness. Tech-nical Report CTS 09-15, Intelligent Transportation Systems Institute,2009.
[58] Zutao Zhang and Jia shu Zhang. Driver fatigue detection based intelli-gent vehicle control. In ICPR ’06: Proceedings of the 18th InternationalConference on Pattern Recognition, pages 1262–1265, Washington, DC,USA, 2006. IEEE Computer Society.
101


![Driver Alertness Detection System [DADS.] executive presentation](https://img.pdfslide.us/doc/110x75/547ac4c8b4af9f66518b45ce/driver-alertness-detection-system-dads-executive-presentation.jpg)