Embed Size (px)
Citation preview

Safety IDEA Program
Non-Contact Driver Drowsiness Detection System Final Report for Safety IDEA Project 17 Prepared by: Dr. Xiong (Bill) Yu, P.E. Case Western Reserve University Cleveland, OH July 2012

Innovations Deserving Exploratory Analysis (IDEA) Programs Managed by the Transportation Research Board This IDEA project was funded by the Safety IDEA Program. The TRB currently manages the following three IDEA programs: • NCHRP IDEA Program, which focuses on advances in the design, construction, and
maintenance of highway systems, is funded by American Association of State Highway and Transportation Officials (AASHTO) as part of the National Cooperative Highway Research Program (NCHRP).
• The Safety IDEA Program currently focuses on innovative approaches for improving railroad safety or performance. The program is currently funded by the Federal Railroad Administration (FRA). The program was previously jointly funded by the Federal Motor Carrier Safety Administration (FMCSA) and the FRA.
• The Transit IDEA Program, which supports development and testing of innovative concepts and methods for advancing transit practice, is funded by the Federal Transit Administration (FTA) as part of the Transit Cooperative Research Program (TCRP).
Management of the three IDEA programs is coordinated to promote the development and testing of innovative concepts, methods, and technologies. For information on the IDEA programs, check the IDEA website (www.trb.org/idea). For questions, contact the IDEA programs office by telephone at (202) 334-3310. IDEA Programs Transportation Research Board 500 Fifth Street, NW Washington, DC 20001
The project that is the subject of this contractor-authored report was a part of the Innovations Deserving Exploratory Analysis (IDEA) Programs, which are managed by the Transportation Research Board (TRB) with the approval of the Governing Board of the National Research Council. The members of the oversight committee that monitored the project and reviewed the report were chosen for their special competencies and with regard for appropriate balance. The views expressed in this report are those of the contractor who conducted the investigation documented in this report and do not necessarily reflect those of the Transportation Research Board, the National Research Council, or the sponsors of the IDEA Programs. This document has not been edited by TRB. The Transportation Research Board of the National Academies, the National Research Council, and the organizations that sponsor the IDEA Programs do not endorse products or manufacturers. Trade or manufacturers' names appear herein solely because they are considered essential to the object of the investigation.

SAFETY IDEA PROGRAM COMMITTEE CHAIR ROBERT E. GALLAMORE The Gallamore Group, LLC MEMBERS STEPHEN A. KEPPLER Commercial Vehicle Safety Alliance HENRY M. LEES, JR. Burlington Northern Santa Fe Railway (BNSF) TOM MOORE National Private Truck Council DONALD A. OSTERBERG Schneider National, Inc. STEPHEN M. POPKIN Volpe National Transportation Systems Center CONRAD J. RUPPERT, JR, University of Illinois at Urbana-Champaign FMCSA LIAISON ALBERT ALVAREZ Federal Motor Carrier Safety Administration FRA LIAISON KEVIN KESLER Federal Railroad Administration TRB LIAISON RICHARD PAIN Transportation Research Board
IDEA PROGRAMS STAFF STEPHEN R. GODWIN, Director for Studies and Special
Programs JON M. WILLIAMS, Program Director, IDEA and Synthesis
Studies HARVEY BERLIN, Senior Program Officer DEMISHA WILLIAMS, Senior Program Assistant EXPERT REVIEW PANEL SAFETY IDEA PROJECT 17 KINGMAN STROHL, Veterans Administration. Medical Research PINGFU FENG, Case Western Reserve University STEVEN DUFFY, Cleveland State University AL SMITH, Greyhound Inc. MONIQUE EVANS, Ohio Department of Transportation

Non-Contact Driver Drowsiness Detection System
Final Report
Safety IDEA Project 17
Prepared for
Safety IDEA Program
Transportation Research Board
National Research Council
Prepared by
Dr. Xiong (Bill) Yu, P.E.
Department of Civil Engineering
Case Western Reserve University
Cleveland, OH
July 2012

i
Acknowledgements The support and guidance from the expert review panel for this project is highly appreciated. The panel
contained a number of experts and project partners in the field, including Kingman Strohl, Professor and
Director, Center for Sleep Disorders Research, Veterans Administration Medical Research; Pingfu Feng,
Assistant Professor of Medicine and of Psychiatry, Case Western Reserve University; Steven Duffy,
Professor and Director of University Transportation Center on Work Zone Safety, Cleveland State
University; Al Smith, Director of Safety/Security, Greyhound Inc.; and Monique Evans, former
administrator of the Research Division, the Ohio Department of Transportation; The researchers would
like to thank Harvey Berlin, Safety IDEA program officer, for his support and help during the course of
this project.

ii
TABLE OF CONTENTS
Executive Summary ··························································································1 1. IDEA Product ······························································································2 2. Concept and Innovation ···················································································2 3. Investigation ································································································2 Task 1: Develop the drowsiness detection sensor system ················································3
a) Design of sensor system 3
b) Evaluation of sensor performance 5
Task 2: Develop a robust drowsiness indicator ························································· 11 Task 3: Evaluation of countermeasures ·································································· 13 Task 4: Conduct laboratory evaluation ··································································· 14
4.1 Evaluation under laboratory conditions 14
4.2 Evaluation in a high fidelity driving simulator 17
4.3 Comparison with current clinic device 19
Task 5: Conduct field testing ·············································································· 21 Task 6: Prepare draft final report and final report ······················································ 23 4. Plans for Implementation ·············································································· 23 5. Conclusions ······························································································ 24 Investigator Profile ························································································· 26 Glossary ······································································································ 27 References ··································································································· 28

1
EXECUTIVE SUMMARY The goal of this Safety IDEA project was to develop a non-contact sensing platform to monitor the
physiological signals of drivers such as the electrocardiography (ECG) and/or electroencephalography
(EEG), from which the on-set and extent of drowsiness can be detected. Clinical research has found
physiological signals are good indicators of drowsiness. Conventional bioelectrical signal
measurement system requires the electrodes to be in contact with the human body. That not only
interferes with the normal driver operation, but also is not feasible for long term monitoring
purposes. Therefore, a non-contact physiological signal sensing platform as developed in this project
will be very helpful to detect driver drowsiness and reduce crashes. Such sensors can be integrated
readily into a wireless health monitoring system for drivers.
In this project, we designed a non-contact ECG sensor based on high input impedance circuitry.
With delicate sensor electronics design, the bioelectrical signals associated with electrocardiography
(ECG), breathing, and eye blinking can be measured. This sensor package can detect the ECG signals
with an effective distance of up to 30 cm (11.81 inch) away from the body. It also provides sensitive
measurement of physiological signals such as heart rate, breathing, eye blinking etc. The sensor
performance was validated on a high fidelity driving simulator. Digital signal processing algorithms were
developed to remove the signal noise and simultaneously automate signal analyses. The characteristics of
physiological signals indicative of driver fatigue, i.e., the heart rate (HR), heart rate variability (HRV),
breath frequency and eye blinking frequency, can be determined. A drowsiness indicator was developed
by coupling the multiple physiological parameters to achieve high reliability in drowsiness detection.
Evaluation of sensor performance was conducted under various conditions in this project. These
include evaluation under ordinary laboratory and office environmental conditions. Sensor performance
was also evaluated in a high fidelity driving simulator as well as an operational truck. The sensor would
have applications for railroad train operators and truck drivers. Results of the evaluation indicate that the
sensor is accurate, robust, and easily deployed. All of these evaluations point to great promise for this
technology.
This project showed that the proposed sensing concept is feasible. Recommendations are made
for further development of the sensor prototype.

2
1. IDEA PRODUCT
The anticipated product of this project is a non-contact physiological signal sensing system that can be
integrated into vehicles to detect driver drowsiness and provide driver assistance under naturalistic
driving conditions. The non-contact sensing system will monitor vital physiological signals such as ECG,
EEG, breathing, and eye blinking, with a goal to detect drowsiness and provide warning (Figure 1).
Non-contact ECG and EEG system (focus of this study)
Measurement ofdriver performance
Processingunit/decisionalgorithm
Warning/alerting system
Psychologicalmeasures
Figure 1 Schematic of sensing system integration for driver drowsiness detection and assistance
2. CONCEPT AND INNOVATION
Physiological signals (i.e., ECG, EEG, eye blinking, breathing, etc) have been commonly used to
study drowsiness and sleep disorders. A conventional clinic measurement system requires the
electrodes to be in contact with the human body by use of coupling gel. This not only interferes
with the normal driver operation, but also is not feasible for long term monitoring purposes. The
innovation of this project is a non-contact sensing system that monitors these physiological signals of
drivers. The system sensing principle is based on accurately detecting the bioelectricity associated with
neural activities. The system can be deployed in a vehicular environment to provide driver assistance.
While drowsiness detection was the primary goal of this project, such a system can also be utilized for
other beneficial purpose, e.g., health monitoring of drivers.
3. INVESTIGATION
The project included five tasks that were accomplished in two major stages. The first stage
included three tasks: Task 1) Develop the drowsiness detection sensor system; Task 2) Develop a

3
robust drowsiness indicator; Task 3) Evaluate countermeasures. The second stage included: Task
4) Conduct laboratory evaluation on a driving simulator; Task 5) Conduct field testing;
Task 6) Prepare draft final report and final report.
The following provides a description of work conducted to accomplish these tasks.
Task 1: Develop the drowsiness detection sensor system 1.a) Design of sensor system
In this research we developed a sensor that can detect the ECG signal 20 cm to 30 cm away through cloth.
Such high sensitivity makes it possible for practical implementation for driver physiological signal
monitoring purpose. Our non-contact ECG sensor detects the potential of on the human body caused by
neural activities through capacitive coupling. Figure 2 (a) shows the mechanism in the generation of
bioelectrical current, and (b) expresses the mechanism of sensing via the induced current.
The conductive plate of the sensor, which is made of metal or conductive polymer, and the human
surface act as a coupling capacitor. In practice, the dielectric spacer is air layer, thus the sensor is a remote
detecting device. Due to capacitive coupling, the charges on the conductive plate remain the same amount
as the effective area parallel to the human body. Moreover, our device can also be used to detect the EMG
associated with eye blinking, which is another good indicator of fatigue. The induced signals can be
detected by designing high impedance and high quality signal amplification systems elaborated in the
following sessions.
Current I1 due to bioelectricity
Dentrites
Electrical Impulse
Neuron
Dentrites
Electrical Impulse
Neuron
Electrical current due to neural activities
Current I1
Induced current I1’
Conductive plate
Current I1 due to bioelectricity
Dentrites
Electrical Impulse
Neuron
Dentrites
Electrical Impulse
Neuron
Electrical current due to neural activities
Current I1
Induced current I1’
Conductive plate
Dentrites
Electrical Impulse
Neuron
Dentrites
Electrical Impulse
Neuron
Electrical current due to neural activities
Current I1
Induced current I1’
Conductive plate
(a) (b)
Figure 2 Principle of non-contact ECG sensor. (a) The generation of bioelectrical current caused by neural activities; (b) principle of induced current.

4
The preamplifier is a circuit that processes the bioelectrical signal detected on the human surface.
Table 1 shows the magnitude and frequency of typical bioelectrical signals. In this paper, ECG and EMG
signals are detected to evaluate fatigue. Therefore the preamplifier is configured with a gain of 10V/V.
Table 1 Magnitude and frequency range of main bioelectrical signals
Bioelectrical Signal Magnitude Frequency
Electrocardiogram (ECG) 50μV-50mV 0.05Hz-100Hz
Electroencephalography
(EEG) 2μV-10μV 10Hz-2kHz
Electromyography (EMG) 20μV-10mV 10Hz-10kHz
Electrooculography (EOG) 10μV-4mV 0.1Hz-100Hz
Electrogastrogram (EGG) 10μV-80mV 0Hz-1Hz
The circuit contains an amplifier and a filter. To obtain high input impedance and low noise, an
instrument amplifier (INA116, Texas Instrument Inc.) was used for amplification. The input impedance of
amplifier is around 1018 Ω. Due to the impedance matching, the common mode rejection ratio (CMRR)
of the instrument amplifier can be ideally infinite, which means the circuit can achieve high SNR, since
the noise is considered to couple into the circuit as the common mode signal. The block diagram is
outlined in Figure 3. The bioelectrical signal is first coupled to the conductive electrode through
capacitance. For ECG detection, a conductive plate is used as the electrode; while for the eye blinking
detection, an electrode is fabricated and connected using extension cable (Figure 5 (b)). The signal then
acts as a potential at the input of the amplifier via current bias component. In practice, the first signal
amplification is completed with CMRR of 90dB at 0-1kHz at gain of 10V/V. The next stage is a lowpass
filter with a cutoff frequency of 45Hz. The shielding package is accomplished by a metal box covering
the printed circuit board (PCB).

5
Figure 3 Block Diagram of the non-contact ECG sensor preamplifier.
1.b) Evaluation of sensor performance
Evaluation of sensor performance was carried out in stages. The first stage was in an electromagnetic
shielded room, the second stage under ordinary lab conditions, in the third stage, experiments were
conducted on driving simulators located in Haptic Interface Laboratory, Case Western Reserve
University, which is an unshielded room. Sensor design has been further improved with experience from
each evaluation stage. Only example data in the third stage are reported in this paper.
a) ECG Detection
Figure 4 Detection system setup for ECG signal
During the experiment, the subject was seated in the driving simulator which was located in an
unshielded room, and the sensor was placed off body in front of left chest at distances of up to 30 cm
(11.81 inch). Photos of experimental set up are shown in Figure 4. A sensitivity study was conducted
where the human body was in different distances away from the body. The signals from 10cm (3.94
Instrument Amplifier
Human Body
Electrode
Current Bias Path
Filter
Output
Shielding Package
Sensor

6
inch), 20cm (7.87 inch) and 30cm (11.81 inch) away were detected and the raw data are displayed in
Figure 5. From this figure, the SNR decreases apparently with the distance from body. At the distance
less than 20cm (7.87 inch), the sensor can clearly detect the ECG signal (Figure 5 (a) (b)). When the
distance is between 25cm (9.84 inch) and 30cm (11.81 inch), the signal is detectable but rather vague
(Figure 5 (c)). This might imply that 30cm (11.81 inch) is the upper bound for re the sensor can detect
the ECG signal.
0 0.5 1 1.5 2 2.5 3 3.5 4 4.5 5-1
-0.5
0
0.5
1
Time(s)
Pote
ntial
(V)
ECG signal at the distance of 10cm (3.94 inch).
0 0.5 1 1.5 2 2.5 3 3.5 4 4.5 5-500
0
500
Time(s)
Pote
ntia
l (m
V)
ECG signal at the distance of 20cm (7.87 inch).
0 0.5 1 1.5 2 2.5 3 3.5 4 4.5 5-500
0
500
Time(s)
Pote
ntia
l (m
V)
ECG signal at the distance of 30cm (11.81 inch)
Figure 5 ECG signal detected off body through clothing at different distance.

7
b) Breathing Signal Detection
When the subject breathed during signal acquisition, the baseline of ECG signal fluctuated
(Figure 6). From this, the breathing frequency can be detected. As shown in Figure 6b, when the subject
breathed, a pulse will arise clearly in the signal. From this, the breathing frequency can be real time
determined. Generally, drowsiness is accompanied with slower than normal breathing frequency. It can
provide independent detection of driver fatigue.
(a)
0 0.5 1 1.5 2 2.5 3 3.5 4 4.5 5-400
-300
-200
-100
0
100
200
300
400
500
Time(s)
Pote
ntia
l (m
V)
(b)
0 0.5 1 1.5 2 2.5 3 3.5 4 4.5 5-3
-2
-1
0
1
2
3
Time(s)
Volta
ge (m
V)
Figure 6 a) The baseline fluctuates during breathing; b) Breathing pulse after de-noising.
Baseline fluctuation caused by breathing
Heartbeat cycle

8
c) Eye Blinking Detection
Drowsy drivers typically have problems to control their eyes. Physiologically this demonstrates
as rapid blinking at the on-set of drowsiness and slow blinking as the drivers are deeply affected. This
experiment aims to evaluate the capability of our sensor to detect the eye blinking, which might reflect the
degree of drowsiness. In the experiment, a soft conductive plate was attached to the frame of glasses and
acted as a detection element, as shown in Figure 7. The electrode was connected to the system via an
extension cable. The subject was allowed to breathe and move close to normal while driving a high
fidelity driving simulator.
(a) (b)
Figure 7 Driving fatigue detection: (a) High fidelity driving simulator; (b) photo of subject driving the
driving simulator while being monitored by the eye blinking detection sensor.
d) Experimental results
d.1) Heart Rate (HR) and Heart Rate Variability (HRV) According to Table 1, the frequency components of normal ECG signal ranges from 0.01 to 100Hz with
energy concentrates in 5-45Hz. During the experiments, several sources of noise can interfere with the
original bioelectrical signal, such as EMG, power line interference, electronic noise and baseline drifts.
EMG signal is caused by human motion and muscle contraction, which typically ranges between 2-5kHz;
power line generates 60Hz noise; and baseline drift caused by low frequency interference, such as the
movement of electrode and breathing, is usually 0.05~2Hz. Therefore, besides the hardware filer, a digital
bandpass filer with bandwith bwtween 0.5-30Hz was introduced to recover the ECG signal from noise.
Figure 8 (a) shows a typical raw signal collected during the experiments. Figure 8 (b) shows the signal
after processed with digital filtering. It is clear enough to detect the heart beating cycle, and therefore

9
compute the Heart Rate (HR) and Heart Rate Variability (HRV). As described in the literature review,
there were a strong link between the physiological parameters HR and HRV and fatigue.
To detect HR and HRV automatically, an algorithm was developed to pick the peak of the wave
and determine HR and HRV in real time. The algorithm identifies the peaks according to the threshold
magnitude. Figure 9 (b) illustrates the performance of the algorithm. From this figure we can see that the
algorithm has good performance in peak detection. From the peaks, HR can be determined with easiness.
From the experimental ECG signals shown in Figure 4 (which was collected during Experiment 1), the
heart rates measured were 78.425 bpm, 78.301 bpm, 76.033 bpm respectively. For the signal shown in
Figure 8, the HR was found to be 78.907 bpm. All these results were reasonable, as the common heart
rate is round 60-90 bpm under normal circumstances according to clinic record.
0 0.5 1 1.5 2 2.5 3 3.5 4 4.5 5-0.1
-0.05
0
0.05
0.1
Time (s)
Volta
ge (V
)
(a)
0.5 1 1.5 2 2.5 3 3.5 4 4.5-0.05
0
0.05
Time (s)
Vol
tage
(V
)
(b)

10
0.5 1 1.5 2 2.5 3 3.5 4 4.5-0.08
-0.06
-0.04
-0.02
0
0.02
0.04
0.06
0.08
Time (s)
Vol
tage
(V)
(c) Breathing detection
Figure 8 Examples on the performance of sensor and signals: (a) Raw data; (b) ECG signal after digital
filtering and peak identifying algorithm; (c) Breathing signal
From the time variation of HR, HRV can be easily calculated. The average and variance of HRV
in per minute is computed to estimate the spectrum and distribution of HRV. Thresholds of HR and HRV
can be established and used for warning of fatigue onset.
d.2) Breathing Detection
It was observed during experiments that the baseline variation corresponded to the breathing activities.
Moreover, the frequency of baseline fluctuating and the breathing rhythm of the subject coincided very
well. When the subject breathes, rising pulses in the baseline were clearly observed. Since the frequency
of breathing is low, a highpass filter with cutoff frequency of 2Hz was applied. Figure 8 (c) shows the
filtered signal. The breathing pulse is clearly seen from this figure. With the digital filtering and peak
identification algorithms, the breathing frequency can be instantly determined. In this case, the breathing
frequency was found to be 26 per min. It is generally known that during sleep, the breathing rate is
typically lower than under normal awake conditions. Drowsiness is accompanied with slower than
normal breathing frequency. This can potentially provide another independent indicator for driver fatigue
detection.
d.3) Eye Blinking Detection
The frequency of eye blinking has been used by several researchers as drowsiness indictor (Edwards et
al., 2007). Common method for eye blinking detection involves the use of a monitoring camera. The
frequency of eye blinking is determined based on image analyses. Typically, people blink more
frequently at the onset of drowsiness. Eye blinking results in facial muscle contracts and can be detected

11
as bioelectrical pulse. This can be detected with our bioelectricity based system. The detected signal in
Experiment 2 is displayed in Figure 9. It can be seen that eye blinking causes distinctive pulse responses
in the bioelectrical signals. Using the developed peak identification algorithm, the frequency of eye
blinking can be determined in the real time. This physiological parameter provides another independent
indicator for drowsiness.
0 0.5 1 1.5 2 2.5 3 3.5 4 4.5 5
-80
-60
-40
-20
0
20
40
60
80
Time (s)
Pote
ntia
l (m
V)
Figure 9 Example of recorded bioelectrical signal with responses to eye blinking marked
Task 2: Develop a robust drowsiness indicator To evaluate the performance of our system for driver fatigue signal extraction, controlled fatigue
experiments was conducted on a high fidelity driving simulator (Figure 7 (a)). The driving simulator has
six-screen displays for the scenery around the driver, which emulate the driving experience on the road.
During this experiment, a high-way scenario was programmed with moderate traffic. The subject was
seated in the simulator and equipped with the bioelectrical measurement based system developed in this
study (Figure 7 (b)).
Prior to the testing, the subject was subjected to slight sleep deprivation until he indicated he felt
sleepy. The ECG signal and the eye blinking information were detected and recorded for 15 minutes.
Chalder subjective scale (Chalder et al., 1993) was used before and after driving to estimate the fatigue
degree of subjects. In the scale, fourteen questions are listed and answered by the driver. Four options
were “better than usual”, “no more than usual”, “worse than usual”, “much worse than usual”, and scoring
of the questionnaire was carried as 1-4. The average of score reflects the fatigue level. 1 refers to non-
fatigue; 2-4 are mild, moderate and severe fatigue. The subject reported score of 1 (non-fatigue) at the
beginning and reported score of 3 (mild drowsy) around the end of the experiment.

12
For the experiment conducted on the driving simulator, the subject underwent a sleep deprival
procedure. ECG signal and the eye blinking signal were recorded for 15 minutes while the subject was
driving a high fidelity driving simulator. The status of driver was assessed based on driver’s self-
assessment using the Chalder subjective scale. The signals were analyzed using the developed algorithm.
The physiological parameters before and after the driving test are summarized in Table 2.
In brief, the HR was 68.2 bpm at the beginning of the experiment when the subject was non-
fatigue; while the HR was 65.6 bpm when the subject felt mild fatigue at the end of the experiment.
Figure 10 shows the heart rate recorded during the experiment, which clearly show the trend that
corresponds to the variation from non-fatigue to fatigue status. During the experiment, there was a
decreasing trend of HR overall. Moreover, the spectrum of HRV reduced slightly (Table 2) when the
driver became fatigue. The average of HRV proliferated while the variance decline apparently. There
were apparent increase in the frequency of eye blinking when the driver felt drowsy. Using the same
sensor with multiple electrodes, the system we developed can simultaneously provide four independent
physiological indicators of fatigue, i.e., HR, HRV, breathing frequency and eye blinking frequency. The
fusion of these four independent information can further improve the reliability of drowsiness indicator.
Therefore, it will help reduce the chance of false detection. A sensor data fusion strategy is being
developed as we continue our investigation.
0 2 4 6 8 10 12 14 165052545658606264666870727476
Hear
t Rat
e (b
pm)
Time (min)
Heart Rate
Figure 10 Heart rate during experiment

13
Table 2 Physiological parameters before and after driving test
Non-fatigue Mild fatigue
Heart Rate (HR) 68.2124 per min 65.5805 per min
HRV-average 3.1ms 6.4ms
HRV-variance 14.1ms 7.4ms
Eye blinking frequency Relatively low Relatively high
Breath frequency No apparent change
Task 3: Evaluate countermeasures
In addition to the ability of drowsiness detection, another important question we tried to answer is
what countermeasures are desirable, practical and useful. These countermeasures include, for example,
behavioral intervene, medical intervene, alerting devices, and switching of driving schedule. Based on
the literature investigation as well as consulting experts in sleep sciences, it was found that
countermeasures other than sleep have been found ineffective or effective for only short periods of time
(Mallis et al, 2000). It is also known (Brown 1997) that self-assessment of drowsiness is unreliable and a
driver may decide to disregard the warning based on his/her own perception.
User-centered interfaces and corresponding interactions for warning systems should enable
drivers to understand the severity of the warning and adjust their behavior accordingly. This has to
consider a number of cognitive and psychological factors (Figure 11). A haptic interface design protocol
will be proposed to ensure the most effective delivery of drowsiness warning information to the driver.
Psychologist
Engineering
Vehicle industry
Distraction Drowsiness
Prot
otyp
esM
etho
dsH
uman
be
havi
ors
Psychologist
Engineering
Vehicle industry
Distraction Drowsiness
Prot
otyp
esM
etho
dsH
uman
be
havi
ors
Psychologist
Engineering
Vehicle industry
Distraction Drowsiness
Prot
otyp
esM
etho
dsH
uman
be
havi
ors
Figure 11 A multidisciplinary view of driver drowsiness detection and accident

14
Interviews were conducted with sleep scientists and drivers on drowsiness countermeasures.
Existing literature was also surveyed. Table 3 summarizes common types of drowsy countermeasures
based on their different categories. Noteworthily, sleep scientists believe that sleep is the most effective
drowsiness countermeasures. Timely detecting and counteracting drowsiness is important to effectively
reduce the problem of drowsy driving.
Table 3 Summary of common drowsiness countermeasures
Category Countermeasures
Drowsiness Prevention
(1a) get at least nine hours sleep in the 48 hours before a trip;
(1b) avoid driving long distances by sharing the driving or
interrupting the trip;
Measure to maintain vigilance
(2a) Drink coffee;
(2b) Turn on a radio;
(2c) Play unpleasant music;
(2c) Open window to blow fresh air;
(2d) Blow pepper powder to the driver;
etc
Ultimate drowsiness alleviation
(3a) Stop driving if they feel they are falling asleep;
(3b) use highway rest stops;
Task 4: Conduct laboratory evaluation Laboratory programs were developed to evaluate the performance of this non-contact physiological signal
based drowsiness detection system. With the progress in the technology development, the sensor has
become robust and immune to various sources of electromagnetic wave interference (such as produced by
power line, computer, car engine, etc). At the initial stage of this technology, the sensor system has to be
evaluated inside an electromagnetic shielded room. Otherwise, the signals will be buried under the
electromagnetic (EM) noise. By applying dedicate noise cancellation method and noise filters, the
present sensor has become very robust. The signals presented in this report were all acquired under
regular laboratory or office environments. No special measures were taken to shield EM noise, except the
built-in electronic modules in the sensing system. The following summarizes the observations based on
the results of laboratory evaluations.
4.1 Evaluation under laboratory conditions
The laboratory evaluation was conducted at the PI’s research laboratory. Figure 12 shows photos of the
sensor box and its interior deployments. The metallic detector maps the charges associated with neural

15
activities inside the body. It can be replaced with other types of detectors, such as electrically conductive
polymer. The use of conductive polymer makes it easily integrated into wearing clothes.
Figure 12 a) Appearance of the sensor and detector; b) the electrical element and circuit board
The non-contact ECG sensing system was evaluated in different stages during laboratory evaluations.
1) The subject was seated in front of the detector and sensor box (Figure 13).
2) The detector was attached to the cloth of the subject and connected to the sensor box via cable
connection (Figure 14)
Clear ECG signals are obtained in both testing conditions, as shown in the signals displayed on the
computer screen in these figures. These indicate that the ECG sensing system achieved high sensitivity in
non-contact measurement of ECG signals.

16
Figure 13 The subject is seated in front of the detector. Peaks in the screen show the heart beating
Figure 14 The detector is attached to the cloth of subject via a connection cable. Peaks in the displayed
screen show the heart beating signals.

17
The performance of this sensor for non-contact measurement of eye blinking was also evaluated. For
evaluation purpose, the detector was mounted close to the head of the subject via a pole fixture (Figure
15). The bioelectricity associated with eye blinking was clearly detected as shown in Figure 15.
Figure 15 The detector is attached to a mounting pole for noncontact detection of eye blinking. Peaks in
the displayed screen show the eye blinking activities.
4.2 Evaluation in a high fidelity driving simulator
The second stage of the evaluation was conducted on a high fidelity driving simulator at the Haptic
Interface Laboratory managed by the PI. For evaluation of the non-contact ECG sensing capability, the
detector was attached to the cloth of the subject (Figure 16). Examples of monitored ECG signals while
driving the driving simulator are displayed in Figure 17. The heart beating rhythms can be clearly seen in
the displayed signals.
Figure 16 Detector glued to the cloth of driver who is seated in a high fidelity driving simulator

18
Figure 17 Measured ECG signal of subject while driving a driving simulator
For evaluation of the remote eye blinking detection, the detector was mounted on the internal handle
inside the car with an offset of around 10 cm (3.94 inch) away from the driver’s head. Clear eye blinking
signals were obtained (Figure 18).
Figure 18 Example of detected eye blinking while the subject drove the driving simulator
19
4.3 Comparison with current clinic device
Testing was conducted under clinical conditions with the assistance of professional clinicians at the
Cardiovascular Institute of the University Hospitals, Case School of Medicine. This was used for a side-
to-side comparison of non-contact ECG sensor with clinic ECG system.
The comparison was conducted at a clinic bed. Figure 19 shows the subject wired with
traditional ECG system. The electrodes were glued to the skin of the subject. Therefore, the subject has
to be undressed. The 12 lead ECG requires 12 cables to be connected to the body of the subject. Figure
20 shows when the subject is also simultaneously monitored with the non-contact ECG sensor.
Figure 19 Photo of clinic ECG device (electrodes are glued to the skin and cable-connected)

20
Figure 20 Comparison of non-contact ECG and clinic ECG The following observations were made during the preliminary clinic comparison:
1) The testing subject has to remove the clothes to glue the ECG electrodes on the skin to use the
traditional clinic ECG.
2) Clinic device typically measures 12 channels of ECG signals and use the polarity for diagnostic
purpose.
3) Cables have constraint on the mobility of the subject.
4) It is much faster to use non-contact ECG sensor in obtaining ECG signals and crucial parameters (such
as heart beating rate) compared with the traditional clinic device.
5) The information such as heart beating rate obtained from non-contact ECG is as accurate as the clinic ECG system. However, no compensation was provided to the clinician for interrupting their work and for the use of a
clinic bed. Therefore, the amount of clinic comparison study was limited. More extensive comparison in
the future with existing clinic device could provide a way to further evaluate the performance of this new
sensor.

21
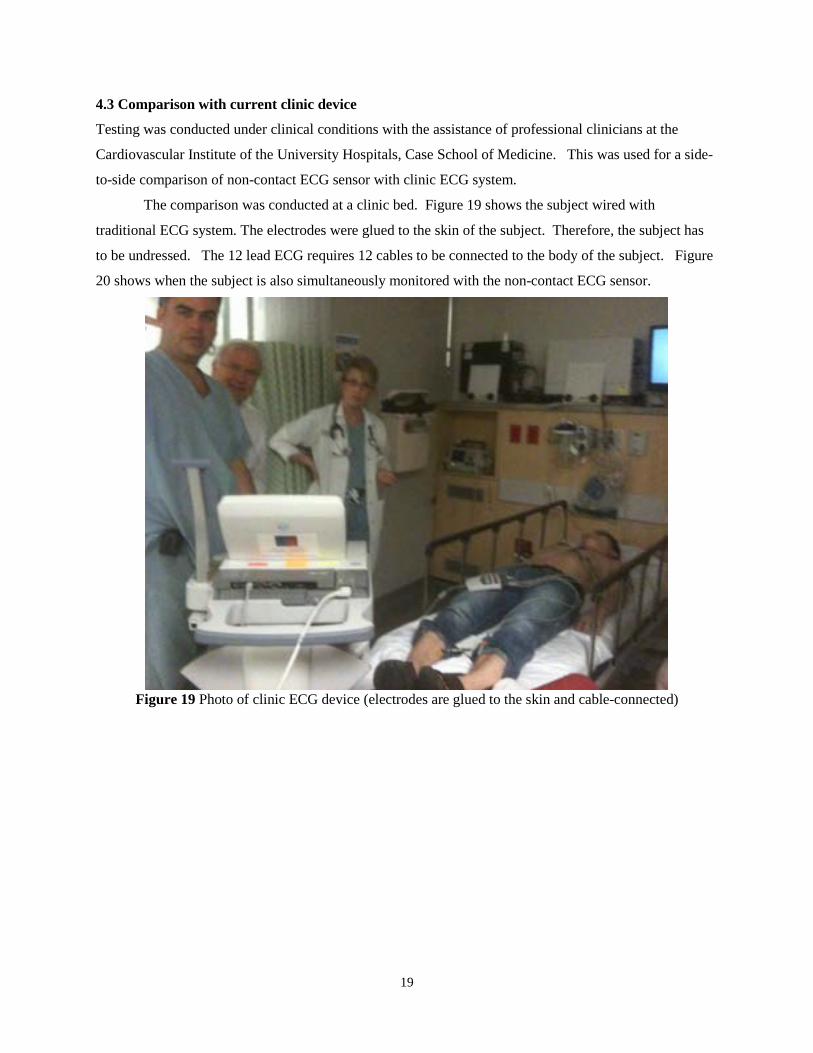
Task 5: Conduct field testing Field testing was conducted on a department service truck (Figure 21). The purpose of the field
evaluation was to validate the sensor performance in close to realistic driving conditions. The ECG
sensor was attached to the safety belt at the location close to the heart (Figure 22). The sensor signals
were continuously monitored and recorded by use of a computer based signal recording unit.
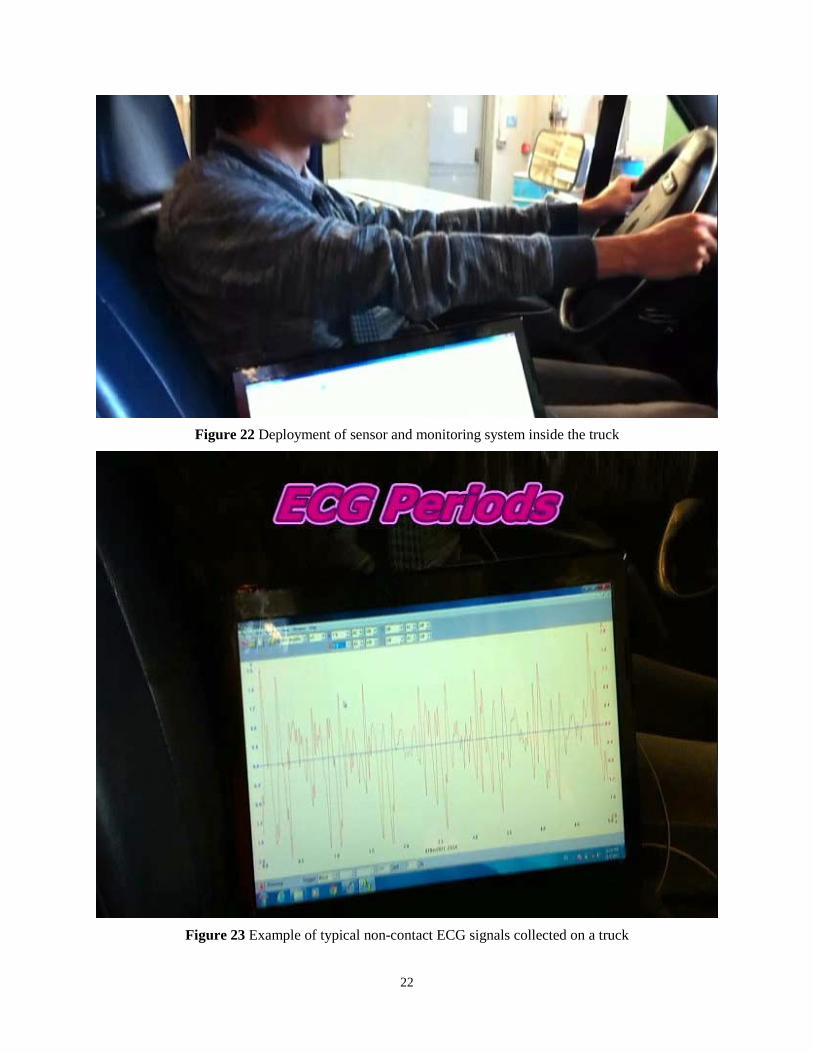
Figure 23 shows example of ECG sensor signal monitored on driver driving a truck. The ECG
signal corresponding to heart beating is clearly seen in the signal. This is an indication that the sensor
achieved good performance in non-contact monitor of the ECG signals.
Further testing of the system is planned with participation of Greyhound, an industry supporter of
this project.
Figure 21 Truck used in this field evaluation
22
Figure 22 Deployment of sensor and monitoring system inside the truck
Figure 23 Example of typical non-contact ECG signals collected on a truck

23
Task 6: Prepare draft final report and final report The draft final report was reviewed by the expert review panel for this project and comments have been
addressed in this revised final report. Table 4 shows the work tasks of this project. Work done by task is discussed in the previous pages.
Table 4 Work Tasks
Tasks Stage I
1. Develop sensor system
2. Study drowsiness indicator
3. Evaluate countermeasures
Stage II 4. Conduct laboratory evaluation
5. Conduct field testing
6. Prepare draft final and final reports
4. PLANS FOR IMPLEMENTATION
A provisional patent application was filed through the Office of Technology Transfer, Case Western
Reserve University in spring 2011. The product from this project was evaluated by a commercialization
specialist as part of the Partnership for Innovation activities funded by an on-going National Science
Foundation project. The project team has engaged in dialogue with business to develop biocompatible
polymeric detectors that can replace the current metallic based sensor. The project partner also expressed
interest to continue to evaluate this sensor product.
In addition to monitor the physiological signals (ECG, breathing, eye blinking, etc.) and detect
the drowsiness, another important aspect that evolves from this project is the concept of tele-health
monitoring of drivers. As schematically shown in Figure 24, the non-contact ECG/EEG sensor provides
a conveniently way to monitor the driver’s physiological signals. This information can be integrated with
a wireless data transmission module that allows for remote diagnose of the health conditions of drivers.
This is another important aspect of the sensor developed from this project, which can add to the benefits
to drivers.

24
non-contact remote ECG / EEG monitoring module
Wireless datatransmission
Figure 24 The concept of tele-health monitoring for drivers
5. CONCLUSIONS AND RECOMMENDATIONS
This project developed an innovative non-invasive bioelectrical measurement system. The system features
high sensitivity in non-contact measurement of vital physiological signals on human body. For example,
the sensor prototype was able to detect the ECG signal at a distance of up to 30 cm (11.81 inch). By use
of a developed signal processing algorithm, the heart rate, heart rate viability and breath frequency can be
obtained in real time. Moreover, the system also detects the eye blinking, another good indicator of
fatigue. Experiments were conducted on a high-fidelity driving simulator to evaluate the performance of
this sensor and signal processing algorithm. The performance of this sensor has also been evaluated in an
operational truck. The sensor would have application for railroad train operators and large truck and bus
drivers. The results are encouraging. By monitoring the four independent physiological indicators of
drowsiness under holistic driving conditions, the sensor data provided important input for sensor fusion
and the drowsiness detection algorithm.
Our long term goal is to develop this technology into a robust in-vehicle drowsiness monitoring
system to improve operator safety. We are working with the University Office of Technology Transfer
and industry to plan for future introduction of the results of this work into the railroad industry and
trucking industry.

25
This Safety IDEA project successfully showed the concept of non-contact sensing physiological signals
for drowsiness detection. A robust drowsiness indicator was developed by fusion of multi-modality
measurements of heart rate, heart rate variability, breathing, eye blinking, etc. The technology has great
potentials to reduce the drowsiness-related crashes and improve the health of railroad operators and truck
drivers.
Possible Future Research
Due to the pilot nature of the system that was investigated in this project, some aspects are
suggested for further development. In the further technology development aspects, this could include the
use of advanced fabrication technology, i.e., Integrated Circuit (IC) design, to significantly reduce the size
of this sensor (i.e. to the size of a cloth button). The reduced size would allow for more flexibility in
sensor deployments. For example, the sensor could be integrated into a “smart cloth button” that
continuously monitors the physiological status of truck driver. In the performance validation aspects, a
more extensive comparison with a clinical ECG device could provide a quantitative assessment of the
resolution, accuracy, and reliability of non-contact sensors. An extended future field testing program
could investigate the sensor functionality under various conditions. Feedback from field evaluation study
would also be used to further improve the deployment of this technology.

26
INVESTIGATOR PROFILE
Principal Investigator:
Dr. Xiong (Bill) Yu, Ph.D., P.E.
Associate Professor
Department of Civil Engineering
Case Western Reserve University
2104 Adelbert Road, Bingham 206
Cleveland, OH 44106
Phone: 216-368-6247
E-mail: [email protected]

27
GLOSSARY
ECG- electrocardiography
EEG- electroencephalography
HR- Heart rate
HRV- Heart rate variability
EM- Electromagnetic

28
REFERENCES
Ayoob, E.M., Steinfeld, A.M. and Grace, R. (2003), Identification of an appropriate drowsy driver detection interface for commercial vehicle operations, Proceedings of the Human Factors and Ergonomics Society 47th Annual Meeting, 2003, pp. 1840-1844.
The Economic Impact of Motor Vehicle Crashes (2000), National Highway Traffic Safety Administration. May 2002. DOT HS 809 446.
Dinges, D. F., & Mallis, M. M. (2001), Managing Fatigue by Drowsiness Detection: Can Technological Promises be Realized? In Hartley, L. (Ed.) Coping with the 24 Hour Society: Fatigue Management Alternatives to Prescriptive Hours of Service. Bristol, PA: Taylor & Francis.
Federal Highway Administration (FHWA) (2005), Saving Lives Through Advanced Vehicle Safety Technology: Intelligent Vehicle Initiative Final Report December 2005 Publication No. FHWA-JPO-05-057
Federal Highway Administration (FHWA) (1998), Crash Problem Size Assessment: Large Truck Crashes Related Primarily to Driver Fatigue. Washington, D.C.
Grace, R., & Steward, S. (2003), Drowsy driver monitor and warning system. In Proceedings of the 2003 Driving Assessment Conference.
Mallis, M. M., Maislin, G., Konowal, N., Bierman, D. M., Byme, V. E., Davis, R. K., Grace, R., & Dinges, D. F. (2000), Biobehavioral Responses to Drowsy Driving Alarms and Alerting Stimuli. Final Report. (DOT Contract No. DTNH22-93 -D-07007). Washington, D.C. U.S. Department of Transportation.
Sun, Y., Yu, X., Berilla, J., Liu, Z. and Wu, G.X. (2011). An in-vehicle physiological signal monitoring system for driver fatigue detection. The 3rd International Conference on Road Safety and Simulation Conference, Sep 14-16, Indianapolis, IN.
Sun, Y., Yu, X., Berilla, J., and Liu, Z. (2011). An innovative non-contact electrocardiography sensor for driver fatigue detection, 6th International Driving Symposium on Human Factors in Driver Assessment, Training and Vehicle Design, June 27-30, Lake Tohoe, CA.
Sun, Y., Yu, X., Berrila, J., Liu, Z. and Wu, G.X. (2011). An Innovative Physiological Signal Monitoring System for Driving Fatigue Detection, Submitted to the 2012 TRB annual conference, Washington, DC.