Embed Size (px)
Citation preview

INFORMAT IONAL PACKET | MARCH 31, 2017
Vident Core U.S. Equity Fund | VUSE®
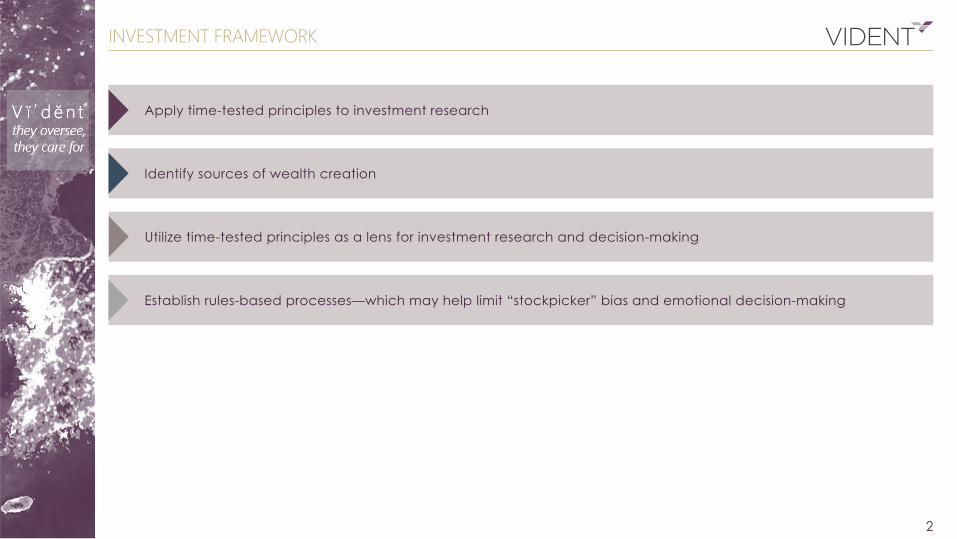
Apply time-tested principles to investment research
Identify sources of wealth creation
Utilize time-tested principles as a lens for investment research and decision-making
Establish rules-based processes—which may help limit “stockpicker” bias and emotional decision-making
INVESTMENT FRAMEWORK
2
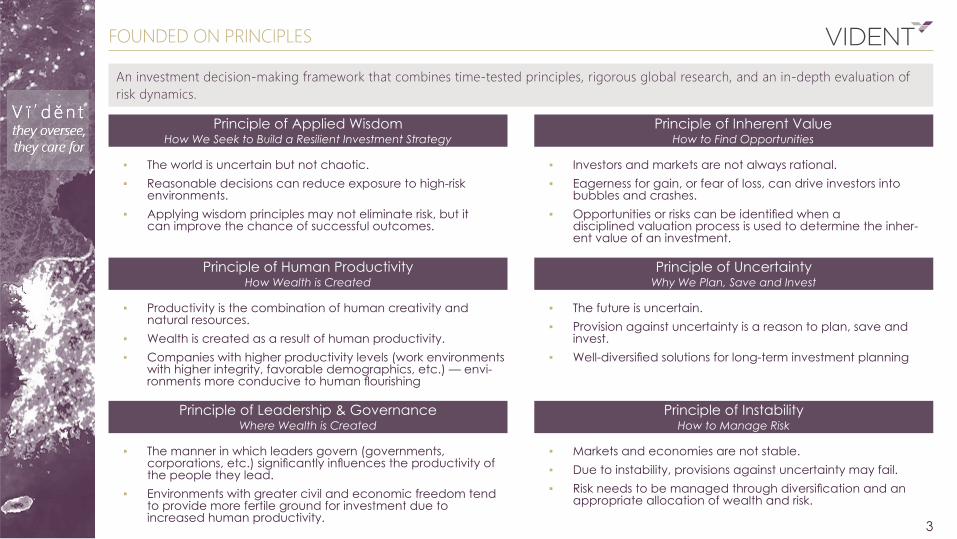
An investment decision-making framework that combines time-tested principles, rigorous global research, and an in-depth evaluation of risk dynamics.
▪ The world is uncertain but not chaotic. ▪ Reasonable decisions can reduce exposure to high-risk
environments. ▪ Applying wisdom principles may not eliminate risk, but it
can improve the chance of successful outcomes.
Principle of Applied Wisdom How We Seek to Build a Resilient Investment Strategy
▪ Investors and markets are not always rational. ▪ Eagerness for gain, or fear of loss, can drive investors into
bubbles and crashes. ▪ Opportunities or risks can be identified when a
disciplined valuation process is used to determine the inher-ent value of an investment.
Principle of Inherent Value How to Find Opportunities
▪ Productivity is the combination of human creativity and natural resources.
▪ Wealth is created as a result of human productivity. ▪ Companies with higher productivity levels (work environments
with higher integrity, favorable demographics, etc.) — envi-ronments more conducive to human flourishing
▪ The future is uncertain. ▪ Provision against uncertainty is a reason to plan, save and
invest. ▪ Well-diversified solutions for long-term investment planning
Principle of Human Productivity How Wealth is Created
Principle of Uncertainty Why We Plan, Save and Invest
▪ The manner in which leaders govern (governments, corporations, etc.) significantly influences the productivity of the people they lead.
▪ Environments with greater civil and economic freedom tend to provide more fertile ground for investment due to increased human productivity.
▪ Markets and economies are not stable. ▪ Due to instability, provisions against uncertainty may fail. ▪ Risk needs to be managed through diversification and an
appropriate allocation of wealth and risk.
Principle of Leadership & Governance Where Wealth is Created
Principle of Instability How to Manage Risk
FOUNDED ON PRINCIPLES
3
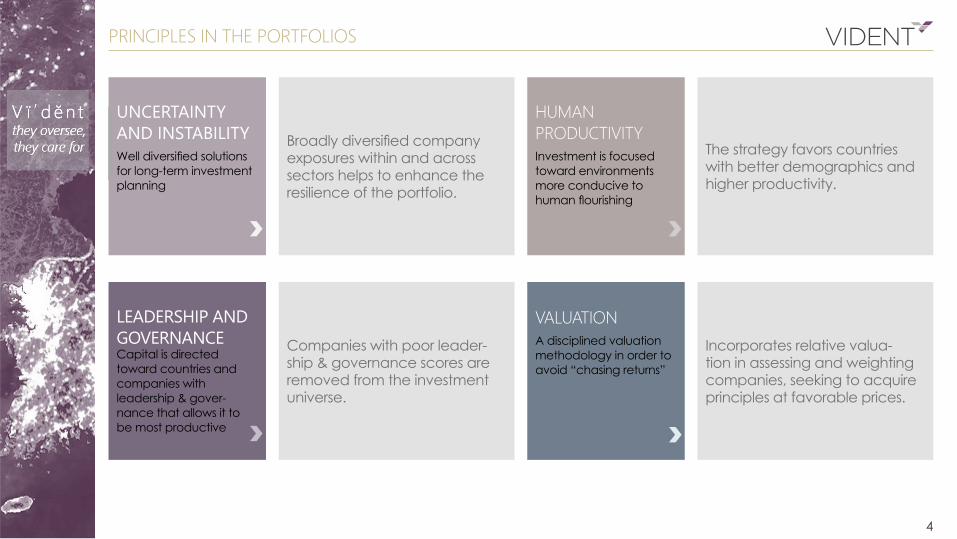
PRINCIPLES IN THE PORTFOLIOS
LEADERSHIP AND GOVERNANCE Capital is directed toward countries and companies with leadership & gover-nance that allows it to be most productive
Companies with poor leader-ship & governance scores are removed from the investment universe.
VALUATIONA disciplined valuation methodology in order to avoid “chasing returns”
Incorporates relative valua-tion in assessing and weighting companies, seeking to acquire principles at favorable prices.
HUMAN PRODUCTIVITYInvestment is focused toward environments more conducive to human flourishing
UNCERTAINTY AND INSTABILITYWell diversified solutions for long-term investment planning
Broadly diversified company exposures within and across sectors helps to enhance the resilience of the portfolio.
The strategy favors countries with better demographics and higher productivity.
4
VCUSX: OVERVIEW
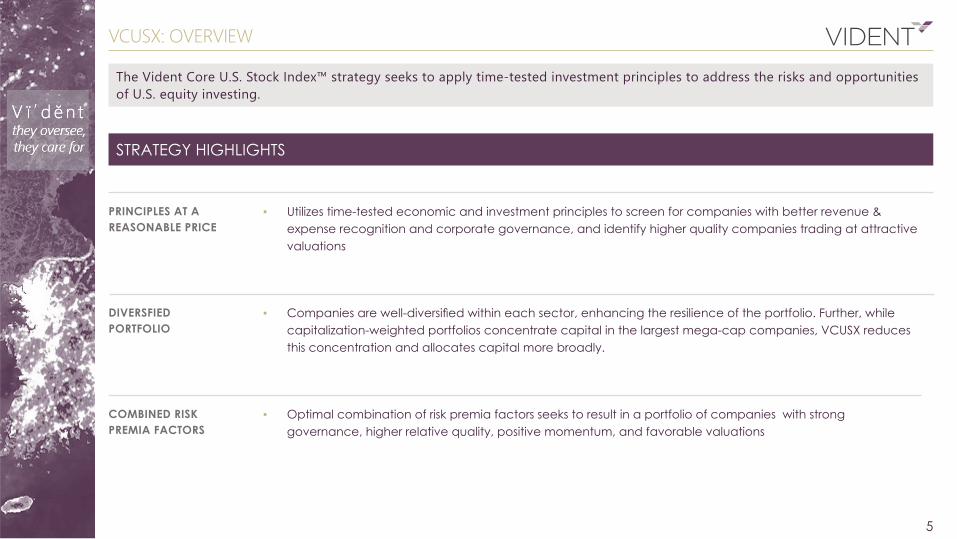
The Vident Core U.S. Stock Index™ strategy seeks to apply time-tested investment principles to address the risks and opportunities of U.S. equity investing.
PRINCIPLES AT A REASONABLE PRICE
▪ Utilizes time-tested economic and investment principles to screen for companies with better revenue & expense recognition and corporate governance, and identify higher quality companies trading at attractive valuations
DIVERSFIED PORTFOLIO
▪ Companies are well-diversified within each sector, enhancing the resilience of the portfolio. Further, while capitalization-weighted portfolios concentrate capital in the largest mega-cap companies, VCUSX reduces this concentration and allocates capital more broadly.
COMBINED RISK PREMIA FACTORS
▪ Optimal combination of risk premia factors seeks to result in a portfolio of companies with strong governance, higher relative quality, positive momentum, and favorable valuations
STRATEGY HIGHLIGHTS
5
INVESTMENT PROCESS
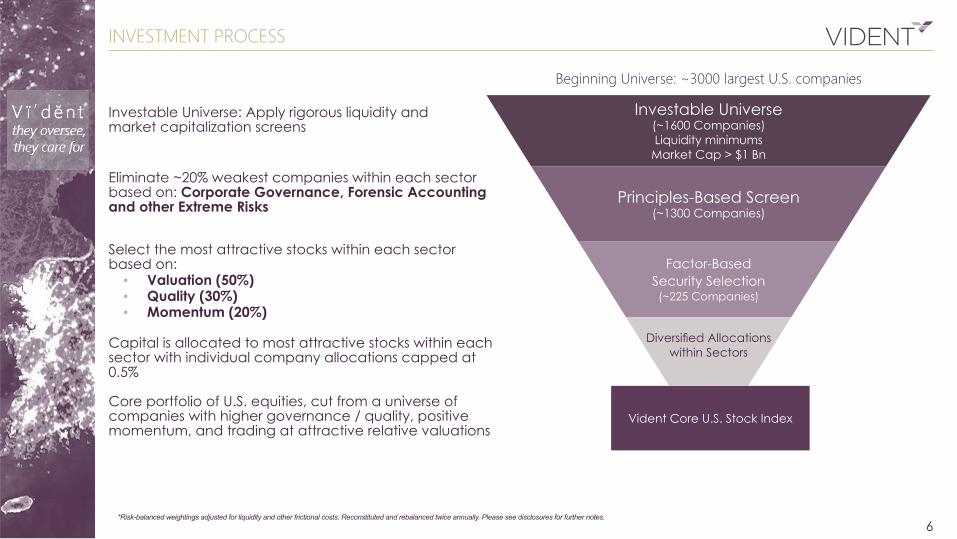
Beginning Universe: ~3000 largest U.S. companies
Investable Universe: Apply rigorous liquidity and market capitalization screens
Eliminate ~20% weakest companies within each sector based on: Corporate Governance, Forensic Accounting and other Extreme Risks
Select the most attractive stocks within each sector based on:
▪ Valuation (50%) ▪ Quality (30%) ▪ Momentum (20%)
Capital is allocated to most attractive stocks within each sector with individual company allocations capped at 0.5% Core portfolio of U.S. equities, cut from a universe of companies with higher governance / quality, positive momentum, and trading at attractive relative valuations
Investable Universe (~1600 Companies) Liquidity minimums
Market Cap > $1 Bn
Principles-Based Screen (~1300 Companies)
Factor-BasedSecurity Selection(~225 Companies)
Diversified Allocations within Sectors
Vident Core U.S. Stock Index
*Risk-balanced weightings adjusted for liquidity and other frictional costs. Reconstituted and rebalanced twice annually. Please see disclosures for further notes.6
PRINCIPLES BASED SCREEN
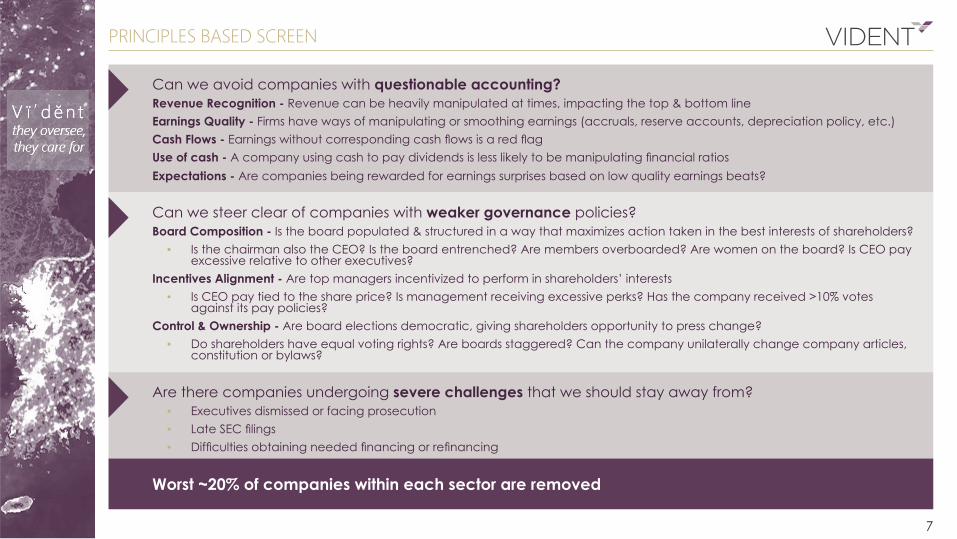
Can we avoid companies with questionable accounting?Revenue Recognition - Revenue can be heavily manipulated at times, impacting the top & bottom lineEarnings Quality - Firms have ways of manipulating or smoothing earnings (accruals, reserve accounts, depreciation policy, etc.)Cash Flows - Earnings without corresponding cash flows is a red flagUse of cash - A company using cash to pay dividends is less likely to be manipulating financial ratiosExpectations - Are companies being rewarded for earnings surprises based on low quality earnings beats?
Can we steer clear of companies with weaker governance policies?Board Composition - Is the board populated & structured in a way that maximizes action taken in the best interests of shareholders?
▪ Is the chairman also the CEO? Is the board entrenched? Are members overboarded? Are women on the board? Is CEO pay excessive relative to other executives?
Incentives Alignment - Are top managers incentivized to perform in shareholders’ interests ▪ Is CEO pay tied to the share price? Is management receiving excessive perks? Has the company received >10% votes
against its pay policies? Control & Ownership - Are board elections democratic, giving shareholders opportunity to press change?
▪ Do shareholders have equal voting rights? Are boards staggered? Can the company unilaterally change company articles, constitution or bylaws?
Are there companies undergoing severe challenges that we should stay away from? ▪ Executives dismissed or facing prosecution ▪ Late SEC filings ▪ Difficulties obtaining needed financing or refinancing
Worst ~20% of companies within each sector are removed
7
STOCK SELECTION BASED ON PRINCIPLES
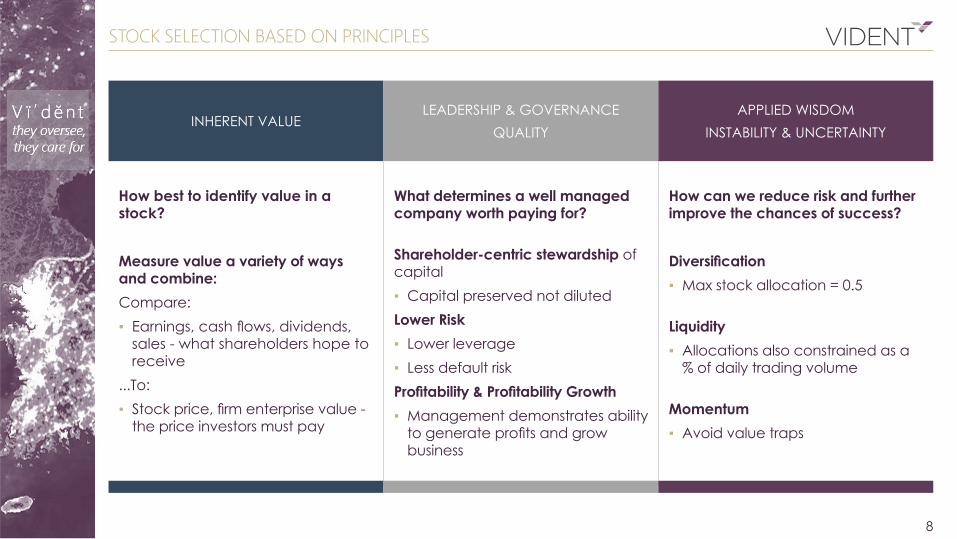
How best to identify value in a stock?
Measure value a variety of ways and combine:Compare: ▪ Earnings, cash flows, dividends,
sales - what shareholders hope to receive
...To: ▪ Stock price, firm enterprise value -
the price investors must pay
What determines a well managed company worth paying for?
Shareholder-centric stewardship of capital ▪ Capital preserved not diluted
Lower Risk ▪ Lower leverage ▪ Less default risk
Profitability & Profitability Growth ▪ Management demonstrates ability
to generate profits and grow business
How can we reduce risk and further improve the chances of success?
Diversification ▪ Max stock allocation = 0.5
Liquidity ▪ Allocations also constrained as a
% of daily trading volume
Momentum ▪ Avoid value traps
INHERENT VALUELEADERSHIP & GOVERNANCE
QUALITYAPPLIED WISDOM
INSTABILITY & UNCERTAINTY
8

PRINCIPLES IN PERSPECTIVE
U N C E RTA I N T Y & I N S TA B I L I T Y Greater diversification across stocks can reduce concentration risks relative to cap-weighted indices
*This data does not include historical performance from any fund. These are simply some of the characteristics within the composition of the VUSE as of 3/31/2017. Please see disclosures for further notes. Source data provided by Bloomberg and MSCI.
MSCI IMI’s Top Ten Stock Allocation = 15.2%
VUSE’s Top Ten Stock Allocation =6.1%
9
0%
1%
1%
2%
2%
3%
3%
4%
Top 50 Stock Allocations
MSCI USA IMI VUSE
TOP TEN POSITIONS
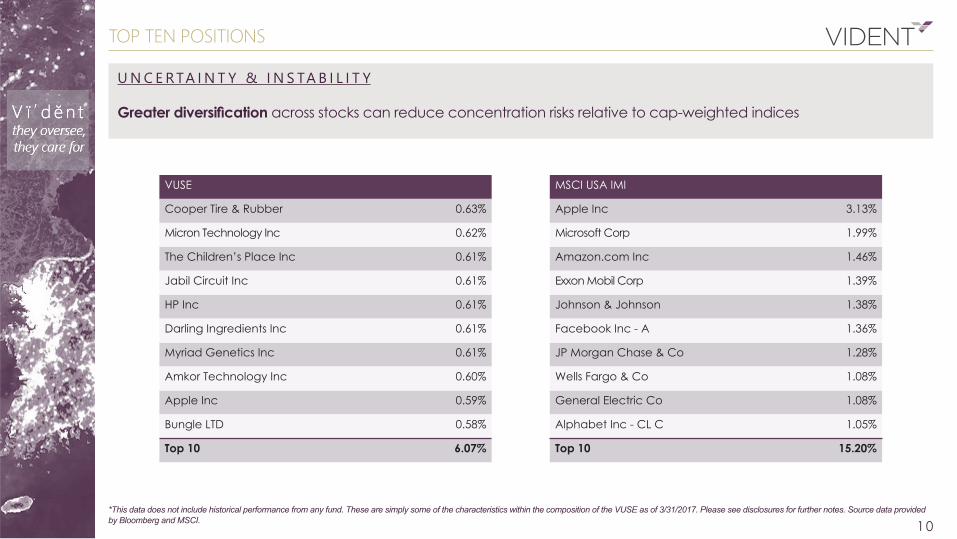
U N C E RTA I N T Y & I N S TA B I L I T Y Greater diversification across stocks can reduce concentration risks relative to cap-weighted indices
*This data does not include historical performance from any fund. These are simply some of the characteristics within the composition of the VUSE as of 3/31/2017. Please see disclosures for further notes. Source data provided by Bloomberg and MSCI. 10
VUSE
Cooper Tire & Rubber 0.63%
Micron Technology Inc 0.62%
The Children’s Place Inc 0.61%
Jabil Circuit Inc 0.61%
HP Inc 0.61%
Darling Ingredients Inc 0.61%
Myriad Genetics Inc 0.61%
Amkor Technology Inc 0.60%
Apple Inc 0.59%
Bungle LTD 0.58%
Top 10 6.07%
MSCI USA IMI
Apple Inc 3.13%
Microsoft Corp 1.99%
Amazon.com Inc 1.46%
Exxon Mobil Corp 1.39%
Johnson & Johnson 1.38%
Facebook Inc - A 1.36%
JP Morgan Chase & Co 1.28%
Wells Fargo & Co 1.08%
General Electric Co 1.08%
Alphabet Inc - CL C 1.05%
Top 10 15.20%
0.7
PRINCIPLES IN PERSPECTIVE
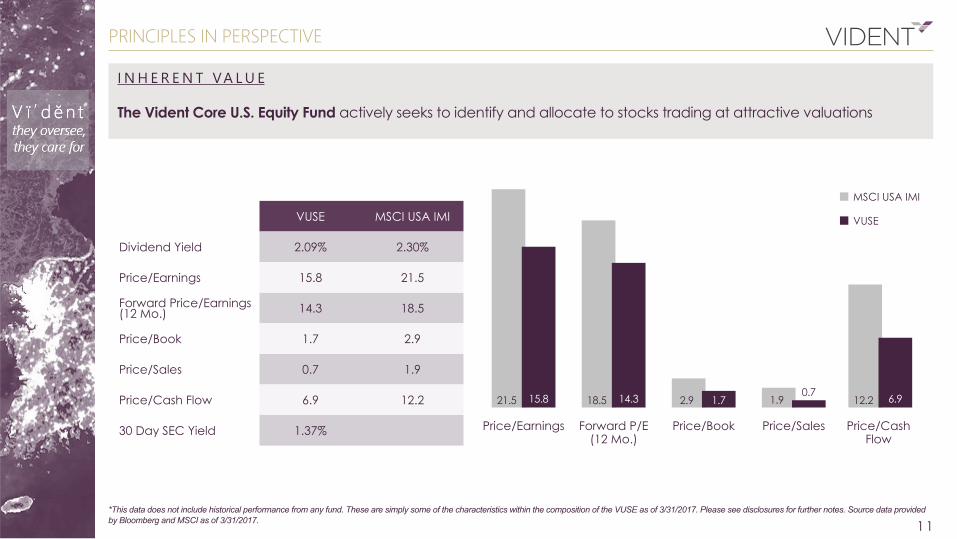
I N H E R E N T VA L U E The Vident Core U.S. Equity Fund actively seeks to identify and allocate to stocks trading at attractive valuations
*This data does not include historical performance from any fund. These are simply some of the characteristics within the composition of the VUSE as of 3/31/2017. Please see disclosures for further notes. Source data provided by Bloomberg and MSCI as of 3/31/2017.
MSCI USA IMI
VUSE
11
VUSE MSCI USA IMI
Dividend Yield 2.09% 2.30%
Price/Earnings 15.8 21.5
Forward Price/Earnings (12 Mo.) 14.3 18.5
Price/Book 1.7 2.9
Price/Sales 0.7 1.9
Price/Cash Flow 6.9 12.2
30 Day SEC Yield 1.37%
21.5 15.8
Price/Earnings
18.5 14.3 2.9 1.7 1.9 12.2 6.9
Forward P/E (12 Mo.)
Price/Book Price/Sales Price/Cash Flow
PRINCIPLES IN PERSPECTIVE
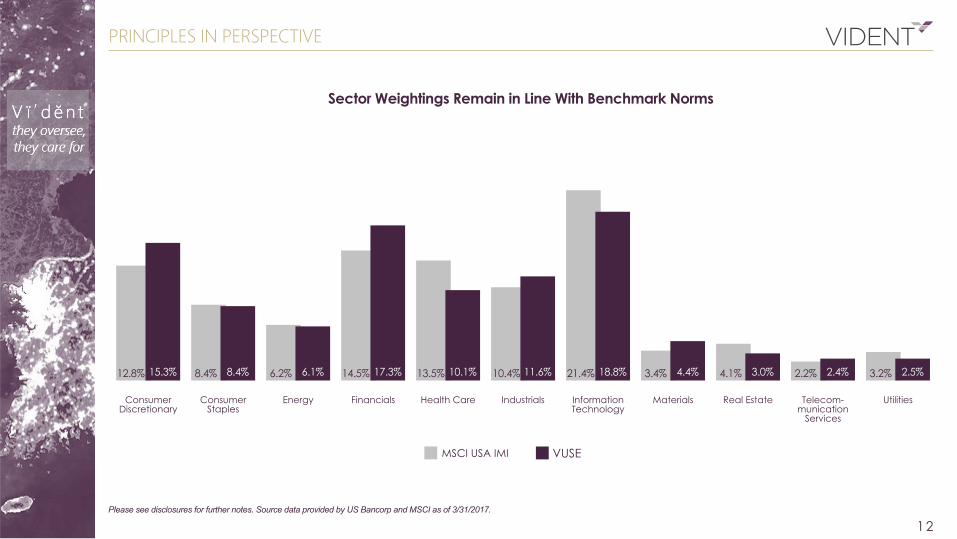
Please see disclosures for further notes. Source data provided by US Bancorp and MSCI as of 3/31/2017.
12
Sector Weightings Remain in Line With Benchmark Norms
VUSEMSCI USA IMI
12.8% 15.3% 8.4% 8.4% 6.2% 6.1% 14.5% 17.3% 13.5% 10.1% 10.4% 11.6% 21.4% 18.8% 3.4% 4.4% 4.1% 3.0% 2.2% 2.4%
Consumer Discretionary
Consumer Staples
Energy Financials Health Care Industrials Information Technology
Materials Real Estate Telecom-munication
Services
3.2% 2.5%
Utilities
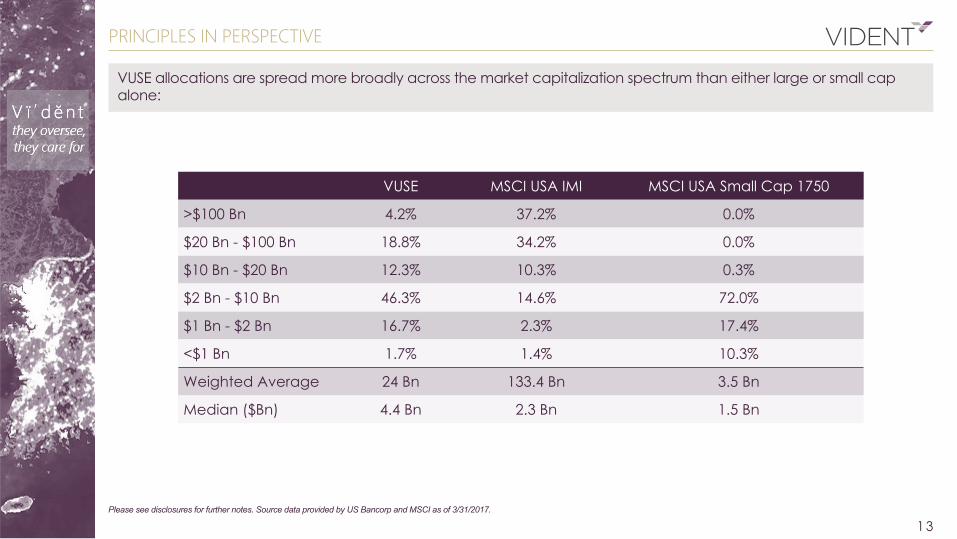
VUSE MSCI USA IMI MSCI USA Small Cap 1750
>$100 Bn 4.2% 37.2% 0.0%
$20 Bn - $100 Bn 18.8% 34.2% 0.0%
$10 Bn - $20 Bn 12.3% 10.3% 0.3%
$2 Bn - $10 Bn 46.3% 14.6% 72.0%
$1 Bn - $2 Bn 16.7% 2.3% 17.4%
<$1 Bn 1.7% 1.4% 10.3%
Weighted Average 24 Bn 133.4 Bn 3.5 Bn
Median ($Bn) 4.4 Bn 2.3 Bn 1.5 Bn
PRINCIPLES IN PERSPECTIVE
Please see disclosures for further notes. Source data provided by US Bancorp and MSCI as of 3/31/2017.
13
VUSE allocations are spread more broadly across the market capitalization spectrum than either large or small cap alone:
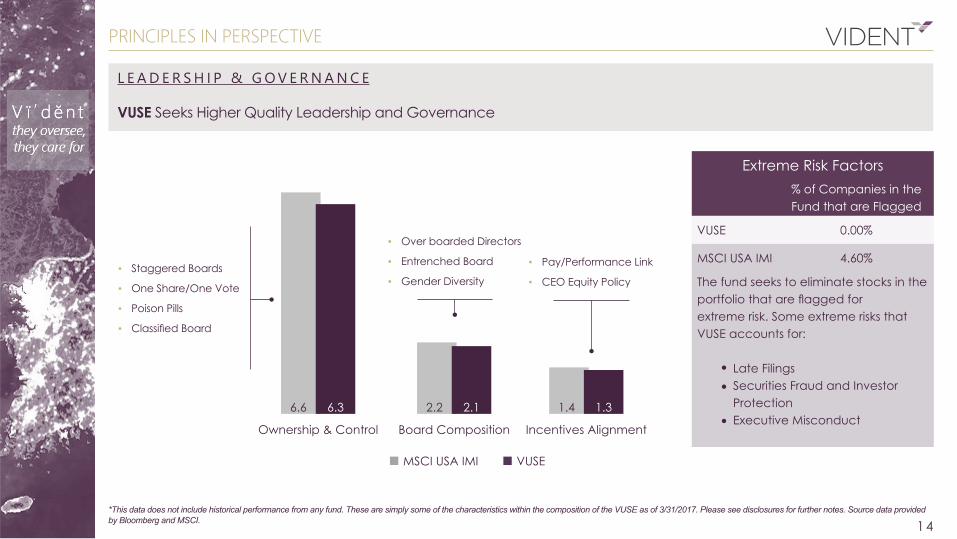
Extreme Risk Factors% of Companies in the Fund that are Flagged
VUSE 0.00%
MSCI USA IMI 4.60%
The fund seeks to eliminate stocks in the portfolio that are flagged for extreme risk. Some extreme risks that VUSE accounts for:
Late FilingsSecurities Fraud and Investor ProtectionExecutive Misconduct
L E A D E R S H I P & G O V E R N A N C E VUSE Seeks Higher Quality Leadership and Governance
MSCI USA IMI VUSE
*This data does not include historical performance from any fund. These are simply some of the characteristics within the composition of the VUSE as of 3/31/2017. Please see disclosures for further notes. Source data provided by Bloomberg and MSCI. 14
PRINCIPLES IN PERSPECTIVE
▪ Staggered Boards
▪ One Share/One Vote
▪ Poison Pills
▪ Classified Board
▪ Over boarded Directors
▪ Entrenched Board
▪ Gender Diversity
▪ Pay/Performance Link
▪ CEO Equity Policy
Ownership & Control
6.6 2.2 1.46.3 2.1 1.3
Board Composition Incentives Alignment
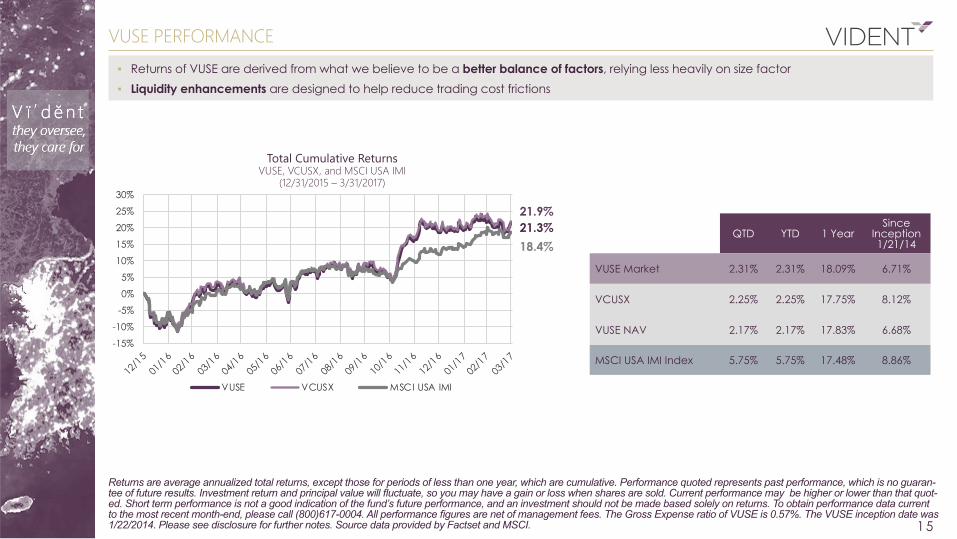
VUSE PERFORMANCE
Returns are average annualized total returns, except those for periods of less than one year, which are cumulative. Performance quoted represents past performance, which is no guaran-tee of future results. Investment return and principal value will fluctuate, so you may have a gain or loss when shares are sold. Current performance may be higher or lower than that quot-ed. Short term performance is not a good indication of the fund’s future performance, and an investment should not be made based solely on returns. To obtain performance data current to the most recent month-end, please call (800)617-0004. All performance figures are net of management fees. The Gross Expense ratio of VUSE is 0.57%. The VUSE inception date was 1/22/2014. Please see disclosure for further notes. Source data provided by Factset and MSCI.
▪ Returns of VUSE are derived from what we believe to be a better balance of factors, relying less heavily on size factor ▪ Liquidity enhancements are designed to help reduce trading cost frictions
15
Total Cumulative Returns VUSE, VCUSX, and MSCI USA IMI
(12/31/2015 – 3/31/2017)
21.3%21.9%
18.4%QTD YTD 1 Year
Since Inception 1/21/14
VUSE Market 2.31% 2.31% 18.09% 6.71%
VCUSX 2.25% 2.25% 17.75% 8.12%
VUSE NAV 2.17% 2.17% 17.83% 6.68%
MSCI USA IMI Index 5.75% 5.75% 17.48% 8.86%-15%
-10%
-5%
0%
5%
10%
15%
20%
25%
30%
VUSE VCUSX MSCI USA IMI
It is not possible to invest directly in an Index. All data described is reported using semiannual rebalancing and the assumed re-investment of dividends. Complete index methodology details for the Vident Indexes and other Vident Indices (if any), including the manner in which it/they is/are rebalanced, the timing of such rebalancing, criteria for additions and deletions, as well as all index calculations, please visit www.videntfinancial.com.Any charts and graphs are provided for illustrative purposes only. Vident maintains the Vident Index and other Vident Indices (if any) and calculates (either itself or through an Index Calculation Agent and/or another third party selected by Vident in its sole discretion from time to time) the index levels and performance shown or discussed, but does not manage actual assets. Must be preceded or accompanied by a prospectusInvesting involves risk. Principal loss is possible. VUSE has the same risks as the underlying securities traded on the exchange throughout the day. Redemptions are limited and often commission are charged on each trade. The performance of the fund may diverge from that of the Index. Because the fund employs a repre-sentative sampling strategy and may also invest up to 20% of its assets in securities that are not included in the Index, it may experience tracking error to a greater extent than a fund that seeks to replicate an index. The fund is not actively managed and may be affected by a general decline in market segments related to the index. The fund invests in securities included in, or representative of securities included in, the index, regardless of their investment merits. Small and medium-cap-italization companies tend to have more limited liquidity and greater price volatility than large-capitalization companies. ETFs may trade at a discount or premium to their NAV. Sources for company analytics are as follows: Bloomberg, GMI Consulting (Environmental/Social/Governance (ESG) and Accounting and Governance Risk (AGR) data sets) Bloomberg and MSCI are the sources for all index data shown. * Graphs calculated using historical data related to index composition, not historical per-formance. Data was collected from January 1, 2000 through June 30, 2014. The inception date of the VCUSX Index was 12/31/2014. All dividends will be reinvested back into the fund to keep future costs low. Staggered Board is a governance practice in which only a fraction of the members of the board of directors is elected each year, rather than all at once Poison Pill is strategy used by corporations to discourage “hostile takeovers.” A company will attempt to make its stock less attractive to the acquirer. Classified Boards are a particular structure for a board of directors in which a portion of the directors serve for different term lengths Overboarded Directors refers to a director who sits on a number of boards which could result in excessive time commitments and inability to properly fulfill their duties Entrenched Board is a board composed of directors with such long tenure and advancing ages
Holdings and sector allocations are subject to change and should not be considered a recommendation to buy or sell any security. Diversification does not assure a profit or protect against loss in a declining market.
MSCI U.S. IMI 2500 is MSCI”s U.S.-based Investable Market Index (IMI), which includes over 2,400 large, mid and small-cap U.S. stocks. Vident Core U.S. Stock IndexTM (VCUSX) is a principles-based U.S. equity strategy that seeks to emphasize companies with high-quality leadership and governance standards and trading at attractive valuations. The MSCI US Small Cap 1750 Index targets for inclusion 1,750 U.S. small cap companies and represents approximately 12% of the capitalization of the US equity market. S&P 500 data (as of 1/21/14) includes the largest 500 U.S. companies and captures approximately 80% coverage of available market cap-italization. Earnings Beat is the amount of profit produced during a specific period. Firm Enterprise Value is a measure of a company’s total value. Price/earnings is the valuation ratio of a company’s current share price compared to its per-share earnings. Forward Price Earnings (P/E) is a measure of the price-to-earnings ratio (P/E) using forecasted earnings for the P/E calculation, in this case using the next 12-month period. Price/book is the ratio used to compare a stock’s market value to its book value. Price/sales is a ratio for valuing a stock relative to its own past performance, other companies or the market itself. Price/cash flow is the measure of the market’s expectations of a firm’s future financial health. Market cap is an estimation of the value of a business that is obtained by multiplying the number of shares outstanding by the current price of a share. All dividends will be reinvested back into the fund to keep future costs low. The Vident Core U.S. Equity Fund ETF is distributed by Quasar Distributors, LLC. Vident Financial is the index provider of the fund. Exchange Traded Concepts, LLC (ETC) is the investment advisor of the fund and Vident Investment Advisory (VIA) is the sub-adviser of the fund. Quasar is not affiliated with Vident Financial, ETC or VIA.
DISCLOSURE