Embed Size (px)
Citation preview
Draft decision
Victorian electricity distribution network service providers
Distribution determination 2011–2015
Appendices
June 2010

© Commonwealth of Australia 2010 This work is copyright. Apart from any use permitted by the Copyright Act 1968, no part may be reproduced without permission of the Australian Competition and Consumer Commission. Requests and inquiries concerning reproduction and rights should be addressed to the Director Publishing, Australian Competition and Consumer Commission, GPO Box 3131, Canberra ACT 2601
APPENDICES I
Appendices A Submissions .........................................................................................................1
B AER service classification..................................................................................2
C Required amendments – proposed negotiating frameworks..........................4
C.1 CitiPower .....................................................................................................4 C.2 Powercor ......................................................................................................4 C.3 Jemena Electricity Networks (Victoria).......................................................4 C.4 SP AusNet....................................................................................................5 C.5 United Energy Distribution..........................................................................5
D Negotiated distribution service criteria ............................................................6
D.1 National electricity objective .......................................................................6
E Distribution tariffs..............................................................................................8
E.1 Changes to tariff structures ..........................................................................8 E.2 Calculation of the licence fee factor ..........................................................14
F Transmission tariffs..........................................................................................16
F.1 Introduction................................................................................................16 F.2 Maximum transmission revenue control....................................................16
G Assigning customers to tariff classes...............................................................20
H Assessment of individual outsourcing and related party arrangements .....23
H.1 Introduction................................................................................................23 H.2 CitiPower and Powercor ............................................................................23 H.3 Jemena........................................................................................................33 H.4 SP AusNet..................................................................................................40 H.5 United Energy ............................................................................................46
I Benchmarking...................................................................................................53
I.1 Rule requirements ......................................................................................53 I.2 Benchmarking Performance.......................................................................54 I.3 AER approach to benchmarking................................................................56 I.4 Draft decision—Victorian reset .................................................................58 I.5 Summary of Victorian DNSP regulatory proposals...................................74 I.6 Submissions ...............................................................................................75 I.7 Issues and AER considerations..................................................................76 I.8 Limitations of benchmarking.....................................................................78 I.9 Future Directions .......................................................................................80 I.10 AER conclusion .........................................................................................81
J Scale escalation .................................................................................................83
J.1 Introduction................................................................................................83 J.2 Regulatory requirements............................................................................84 J.3 Summary of Victorian DNSP regulatory proposals...................................84 J.4 Summary of submissions ...........................................................................85 J.5 Issues and AER considerations..................................................................86
II VICTORIAN DRAFT DISTRIBUTION DETERMINATION––DRAFT DECISION
J.6 Top down analysis ...................................................................................109 J.7 AER conclusion .......................................................................................112
K Real cost escalators.........................................................................................114
K.1 Introduction..............................................................................................114 K.2 Summary of Victorian DNSP regulatory proposals.................................115 K.3 Materials cost escalators ..........................................................................116 K.4 Labour cost escalators..............................................................................126 K.5 Other cost escalators and issues...............................................................139 K.6 Application of real cost escalators ...........................................................145
L Operating expenditure step changes.............................................................154
L.1 Introduction..............................................................................................154 L.2 Summary of Victorian DNSP regulatory proposals.................................155 L.3 Summary of submissions .........................................................................156 L.4 Issues and considerations.........................................................................156 L.5 AER conclusion .......................................................................................239
M Self insurance ..................................................................................................241
M.1 Introduction..............................................................................................241 M.2 Issues and AER considerations—conceptual approach to self insurance 245
N Equity raising costs.........................................................................................265
N.1 Introduction..............................................................................................265 N.2 Regulatory requirements..........................................................................265 N.3 Summary of Victorian DNSP regulatory proposals.................................266 N.4 Issues and AER considerations................................................................268 N.5 AER conclusion .......................................................................................298
O Alternative control services prices and labour rates...................................301
O.1 Public lighting services—proposed prices...............................................301 O.2 Fee based alternative control services......................................................308 O.3 Quoted alternative control services labour rates ......................................322 O.4 Jemena's proposed X factors for fee based alternative control services ..326
P Debt raising costs............................................................................................329
P.1 Introduction..............................................................................................329 P.2 Regulatory requirements..........................................................................329 P.3 Direct debt raising costs...........................................................................329 P.4 Issues and AER considerations................................................................331 P.5 AER conclusion .......................................................................................345
APPENDIX A—SUBMISSIONS 1
A Submissions The AER received submissions on the Victorian DNSPs' regulatory proposals from the following interested parties:
Australian Industry Group
Central Victorian Greenhouse Alliance
Citipower Pty and Powercor Australia Ltd joint submission
City of Darebin
Consumer Action Law Centre
Consumer Utilities Advocacy Centre
Energy Users Association of Australia
Energy Users Coalition of Victoria
MARS Petcare Australia
Municipal Association of Victoria
Origin Energy
Streetlight Group of Councils
The Hon. Peter Batchelor MP, Minister for Energy and Resources, Victoria
Total Environment Centre Inc
TRUenergy
Victorian Council of Social Service
Victorian Employers’ Chamber of Commerce and Industry
VicUrban
2 VICTORIAN DRAFT DISTRIBUTION DETERMINATION—DRAFT DECISION
B AER service classification
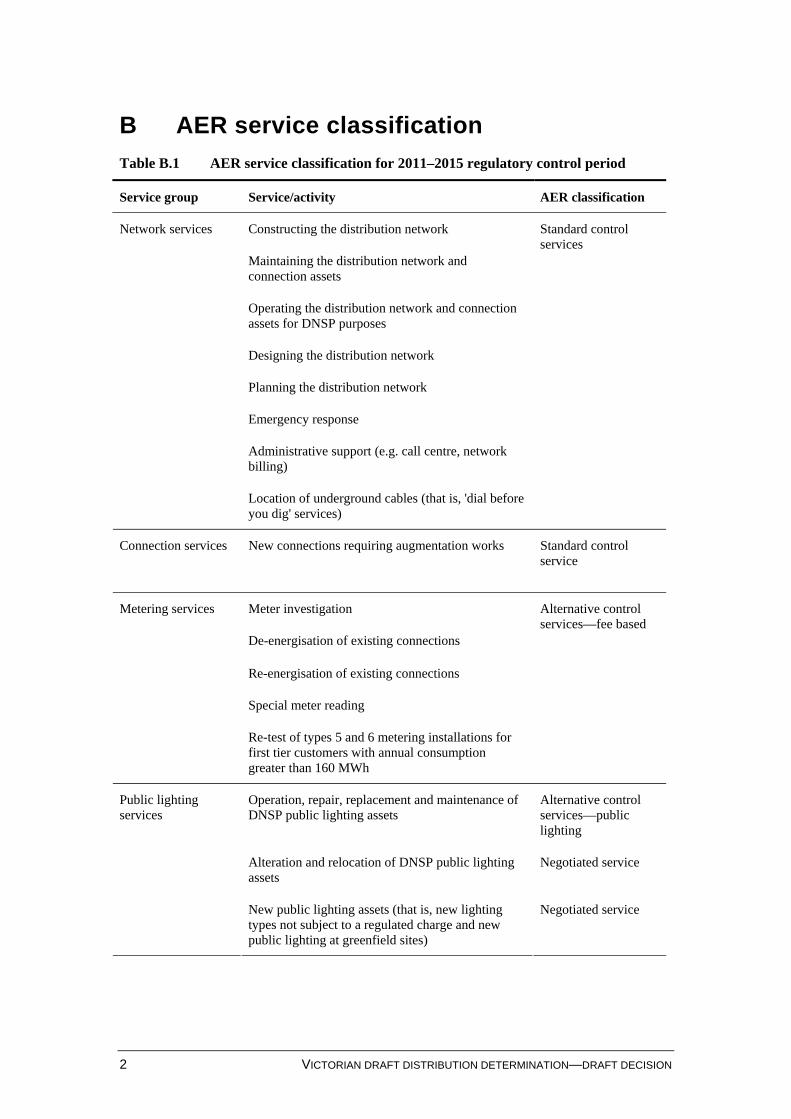
Table B.1 AER service classification for 2011–2015 regulatory control period
Service group Service/activity AER classification
Constructing the distribution network
Maintaining the distribution network and connection assets
Operating the distribution network and connection assets for DNSP purposes
Designing the distribution network
Planning the distribution network
Emergency response
Administrative support (e.g. call centre, network billing)
Network services
Location of underground cables (that is, 'dial before you dig' services)
Standard control services
Connection services New connections requiring augmentation works Standard control service
Meter investigation
De-energisation of existing connections
Re-energisation of existing connections
Special meter reading
Metering services
Re-test of types 5 and 6 metering installations for first tier customers with annual consumption greater than 160 MWh
Alternative control services—fee based
Operation, repair, replacement and maintenance of DNSP public lighting assets
Alternative control services—public lighting
Alteration and relocation of DNSP public lighting assets
Negotiated service
Public lighting services
New public lighting assets (that is, new lighting types not subject to a regulated charge and new public lighting at greenfield sites)
Negotiated service
APPENDIX B—AER SERVICE CLASSIFICATION 3
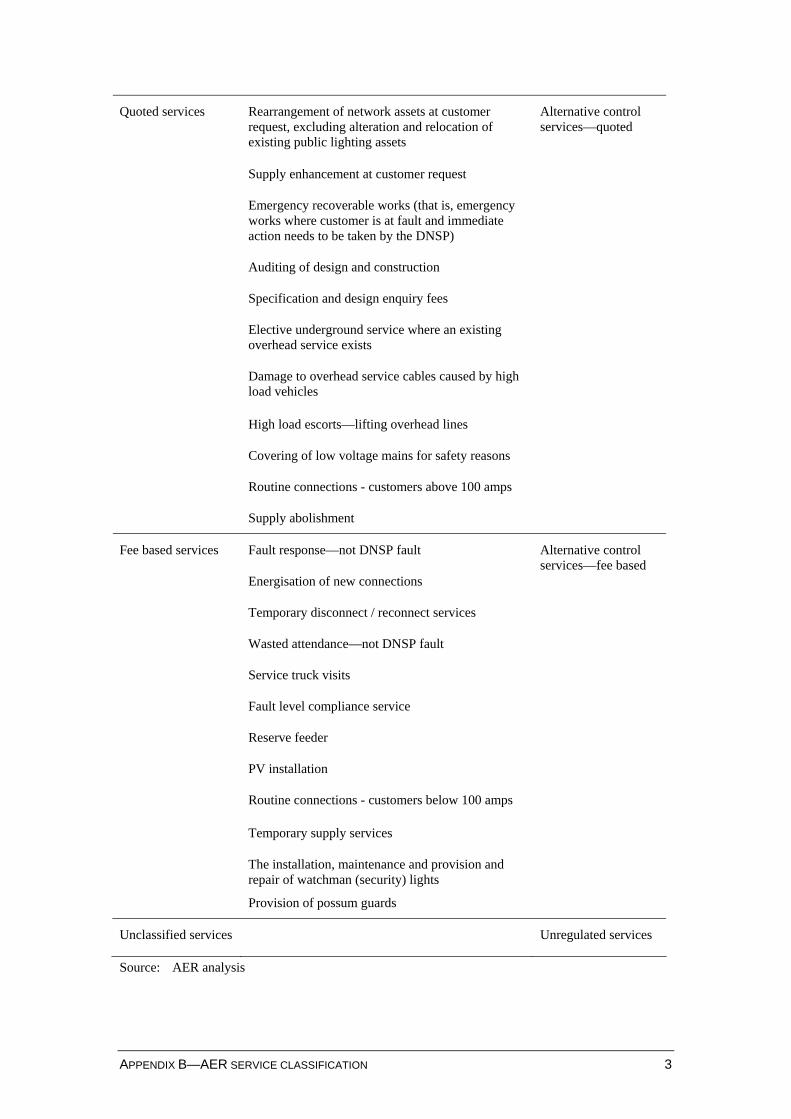
Rearrangement of network assets at customer request, excluding alteration and relocation of existing public lighting assets
Supply enhancement at customer request
Emergency recoverable works (that is, emergency works where customer is at fault and immediate action needs to be taken by the DNSP)
Auditing of design and construction
Specification and design enquiry fees
Elective underground service where an existing overhead service exists
Damage to overhead service cables caused by high load vehicles
High load escorts—lifting overhead lines
Covering of low voltage mains for safety reasons
Routine connections - customers above 100 amps
Quoted services
Supply abolishment
Alternative control services—quoted
Fault response—not DNSP fault
Energisation of new connections
Temporary disconnect / reconnect services
Wasted attendance—not DNSP fault
Service truck visits
Fault level compliance service
Reserve feeder
PV installation
Routine connections - customers below 100 amps
Temporary supply services
Fee based services
The installation, maintenance and provision and repair of watchman (security) lights
Provision of possum guards
Alternative control services—fee based
Unclassified services Unregulated services
Source: AER analysis
4 VICTORIAN DRAFT DISTRIBUTION DETERMINATION—DRAFT DECISION
C Required amendments – proposed negotiating frameworks
As set out in section 3.5 of this draft decision, the AER does not approve the negotiating frameworks proposed by SP AusNet, Jemena and United Energy. As required under clause 6.12.3(h) of the NER, the AER requires amendments to the negotiating frameworks proposed by the Victorian DNSPs, for it to be approved in accordance with the NER.
C.1 CitiPower No amendments required.
C.2 Powercor No amendments required.
C.3 Jemena Electricity Networks (Victoria) pages 3–4—removal of paragraph 2.2.2.
page 5—removal of the number and sentence '4.1.2 For the purpose of paragraph 4.1.1C', to be replaced with '4.1.3 For the purpose of paragraph 4.1.2C'.
pages 6–7—section 7 of the Jemena negotiating framework will be amended as follows:
7. Payment of Jemena’s Costs
7.1 Application fee
7.1.1 Prior to commencing negotiations, the Service Applicant must pay an application fee to Jemena.
7.1.2 The application fee will be determined by Jemena based upon an estimate of the minimum reasonable direct Costs that will be incurred by Jemena in relation to the Service Applicant's application for the provision of the Negotiated Distribution Service.
7.2 Direct Costs
7.2.1 From time to time, Jemena may give the Service Applicant a notice setting out an estimate of any reasonable direct Costs that will be incurred by Jemena in relation to the Service Applicant's application for the provision of the Negotiated Distribution Service that exceed the application fee paid by the Service Applicant under paragraph 7.1.2.
7.2.2 The Service Applicant must, within 20 Business Days of the receipt of that notice, pay to Jemena the amount stated in the notice provided by Jemena under paragraph 7.2.1.
APPENDIX C— REQUIRED AMENDMENTS–PROPOSED NEGOTIATING FRAMEWORKS 5
7.2.3 If the aggregate direct Costs incurred by Jemena in relation to the Service Applicant's application for the provision of the Negotiated Distribution Service are less than the amount paid by the Service Applicant under paragraphs 7.1.1 and 7.2.2, Jemena will:
A offset the excess amount against the price for the Negotiated Distribution Service; or
B refund the excess amount if the Service Applicant does not acquire the Negotiated Distribution Service.
7.2.4 Jemena may require the Service Applicant to enter into a binding agreement addressing conditions, guarantees and other matters in relation to the payment of on-going Costs in accordance with this paragraph 7.
C.4 SP AusNet page 6—removal of the sentence 'SPI Electricity may provide commercial information to the Service Applicant', to be replaced with 'SPI Electricity will provide all commercial information that a Service Applicant would reasonably require to enable it to engage in effective negotiating with SPI Electricity'.
C.5 United Energy Distribution page 6—under clause 8(b), remove the phrase 'take reasonable steps to'.
6 VICTORIAN DRAFT DISTRIBUTION DETERMINATION—DRAFT DECISION
D Negotiated distribution service criteria
D.1 National electricity objective 1. The terms and conditions of access for a negotiated distribution service, including
the price that is to be charged for the provision of that service and any access charges, should promote the achievement of the national electricity objective.
D.1.1 Criteria for terms and conditions of access
D.1.1.1 Terms and conditions of access
1. The terms and conditions of access for a negotiated distribution service must be fair and reasonable and consistent with the safe and reliable operation of the power system in accordance with the NER.
2. The terms and conditions of access for a negotiated distribution service (including in particular, any exclusions and limitations of liability and indemnities) must not be unreasonably onerous taking into account the allocation of risk between a distribution network service provider (DNSP) and any other party, the price for the negotiated distribution service and the costs to a DNSP of providing the negotiated distribution service.
3. The terms and conditions of access for a negotiated distribution service must take into account the need for the service to be provided in a manner that does not adversely affect the safe and reliable operation of the power system in accordance with the NER.
D.1.1.2 Price of services
1. The price for a negotiated distribution service must reflect the costs that a DNSP has incurred or incurs in providing that service, and must be determined in accordance with the principles and policies set out in the DNSP’s Cost Allocation Method.
2. Subject to criteria 7 and 8, the price for a negotiated distribution service must be at least equal to the cost that would be avoided by not providing that service but no more than the cost of providing it on a stand alone basis.
3. If a negotiated distribution service is a shared distribution service that:
i. exceeds any network performance requirements which it is required to meet under any relevant electricity legislation: or
ii. exceeds the network performance requirements set out in schedule 5.1a and 5.1 of the NER,
4. then the difference between the price for that service and the price for the shared distribution service which meets network performance requirements must reflect a DNSP’s incremental cost of providing that service (as appropriate).
5. If a negotiated distribution service is the provision of a shared distribution service that does not meet or exceed the network performance requirements, the difference between the price for that service and the price for the shared distribution service which meets, but does not exceed, the network performance
APPENDIX D— NEGOTIATED DISTRIBUTION SERVICE CRITERIA 7
requirements, should reflect the cost a DNSP would avoid by not providing that service (as appropriate).
6. The price for a negotiated distribution service must be the same for all Distribution Network Users unless there is a material difference in the costs of providing the negotiated distribution service to different Distribution Network Users or classes of Distribution Network Users.
7. The price for a negotiated distribution service must be subject to adjustment over time to the extent that the assets used to provide that service are subsequently used to provide services to another person, in which case such adjustment must reflect the extent to which the costs of that asset are being recovered through charges to that other person.
8. The price for a negotiated distribution service must be such as to enable a DNSP to recover the efficient costs of complying with all regulatory obligations or requirements associated with the provision of the negotiated service.
D.1.2 Criteria for access charges
D.1.2.1 Access charges
1. Any charges must be based on costs reasonably incurred by a DNSP in providing distribution network user access, and, in the case of compensation referred to in clauses 5.5(f)(4)(ii) and (iii) of the NER, on the revenue that is likely to be forgone and the costs that are likely to be incurred by a person referred to in those provisions where an event referred to in those provisions occurs (as appropriate).
2. Any charges must be based on costs reasonably incurred by a DNSP in providing transmission network user access to services deemed to be negotiated distribution services by clause 6.24.2(c) of the NER, and, in the case of compensation referred to in clauses 5.4A(h) to (j) of the NER, on the revenue that is likely to be foregone and the costs that are likely to be incurred by a person referred to in those provisions where an event referred to in those provisions occurs (as appropriate).
8 VICTORIAN DRAFT DISTRIBUTION DETERMINATION—DRAFT DECISION
E Distribution tariffs
E.1 Changes to tariff structures Changes to tariff structures can occur for customers in the following circumstances:
the introduction of new tariffs or tariff components (for example, introducing a step rate for the usage component of the domestic tariff)
adjustments to existing tariffs or tariff components (for example, changing the threshold on an inclining block tariff or the time bands associated with time of use, or TOU, tariffs). This situation is essentially the same as introducing new tariffs or tariff components
when customers move between existing tariffs (from origin tariffs to alternative tariffs) due for instance to a change in metering arrangements.
The values of the parameters in the weighted average price cap (WAPC) and side constraints formulas applying to the control mechanism will require adjustments for those tariffs subject to a change in structure. Specifically, adjustments will be required to:
the historical quantity weights ( ijtq 2 and j
tq 2 ) for these tariffs
the values of the current tariffs/tariff components in the WAPC and side constraints formulas ( ij
tp 1 and jtd 1 ).
This appendix sets out the approach to estimating the historical quantity weights and the substitute values for the current tariffs/tariff components to be used when calculating compliance with the WAPC and the side constraint formulas. For simplicity of presentation, any discussion in this appendix in relation to ij
tp 1 and ijtq 2
(for the WAPC) should be taken to be equally applicable to jtd 1 and j
tq 2 (for the side constraints).
E.1.1 Introducing new tariffs or tariff components
E.1.1.1 The value of ijtq 2
Both the WAPC and side constraints are calculated using audited historical quantities of consumption. However, historical quantities for any new tariffs/tariff components will not be available for two years.
In order to incorporate new tariff structures in the WAPC and the side constraints, the AER requires reasonable estimates to be submitted by the DNSP, based on the quantities that would have been sold if the new tariff/tariff components had been introduced in year ‘t–2’.
First, the DNSP must nominate the origin tariffs/tariff components, which represent the tariffs/tariff components that the customers, who will be moved to the new network tariffs/tariff components, are currently being charged.
APPENDIX E—DISTRIBUTION TARIFFS 9
Second, the DNSP must provide reasonable estimates of ijtq 2 for all applicable units of
measure (for example kWh, kW) for both the new tariffs/tariff components, and the origin tariffs/tariff components. The DNSP must make the following assumptions when calculating these reasonable estimates:
1. The only customers who would have moved to the new network tariff/tariff component in year t–2 did so due to a change in tariff structures initiated by the DNSP and as permitted under the customers’ network connection contract. This means that no new customers are included in the estimate,1 and nor are customers who request to change tariff either voluntarily, or through the actions of a retailer.
2. Customers have the same consumption and load profile on the new tariff/tariff component as they did on the origin tariff/tariff component. This implies that the sum of the reasonable estimates for year t–2 for each unit of measure on the new tariff/tariff component plus the reasonable estimates for year t–2 for each unit of measure on the origin tariff/tariff component, equals the actual audited quantities that occurred for the origin tariff/tariff component in year t–2.
In the year after a new tariff/tariff component has been introduced, there will still be no full year of audited historical data available to be used for ij
tq 2 . As a result the DNSP will be required to again submit reasonable estimates for both the new tariff/tariff component and the corresponding origin tariff/tariff component. At this time, however, the DNSP may base the reasonable estimates on the actual quantities that have occurred to date on the new tariff/tariff components and origin tariff/tariff components. The DNSP must demonstrate how it has arrived at the estimates.
E.1.1.2 The value of ijtp 1
The ijtp 1 of the corresponding origin tariff/tariff components will be used as the ij
tp 1 for the new tariff/tariff components, where both the origin and new tariff components are measured in the same units of measure. If there is no corresponding origin tariff/tariff components with the same units of measure, ij
tp 1 will be set to zero.
E.1.1.3 Example 1: Introducing an inclining block tariff component
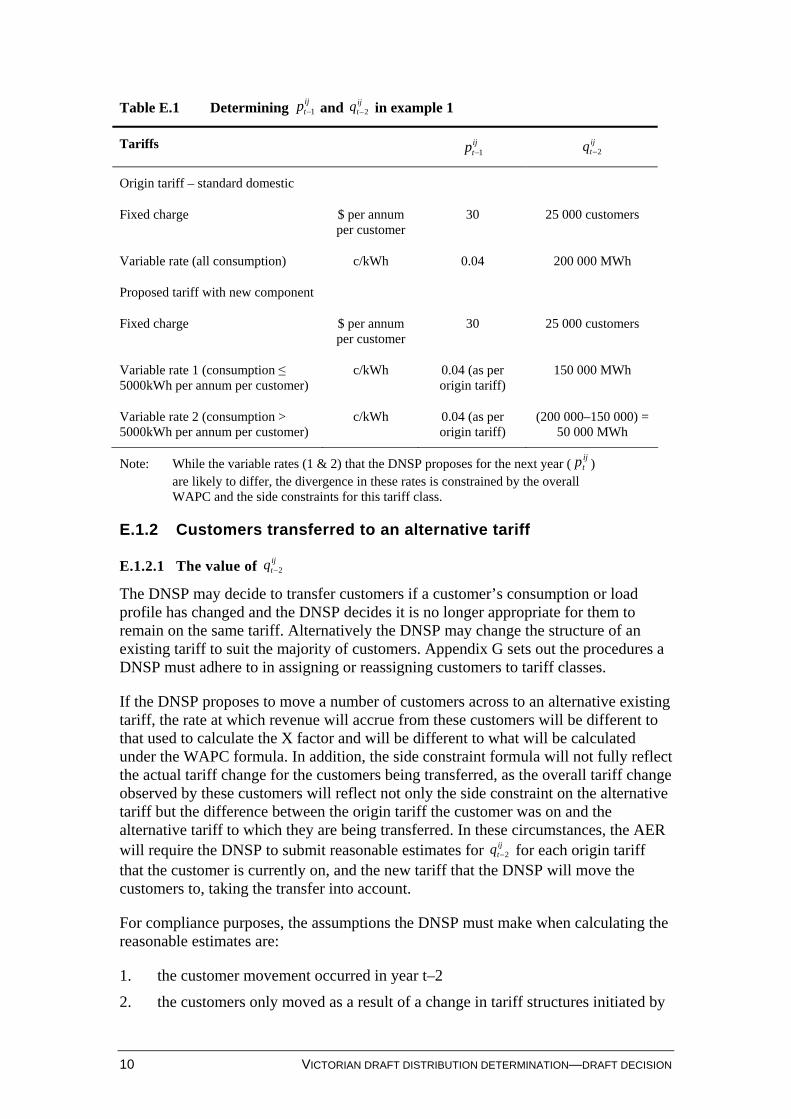
This example assumes that a domestic tariff with a single variable rate is amended so that there are now two variable rates based on a customer’s level of consumption. For each of the 25 000 customers on this tariff, their historical consumption is split between consumption up to 5000kWh per annum and any residual consumption above this amount. Under this approach, the total consumption for this tariff class of 200 000MWh is split, 150 000MWh against variable rate 1 and 50 000MWh against variable rate 2 as shown in the example set out in table E.1.
1 New customers have been allowed for in the growth assumption used when setting the X factor.
10 VICTORIAN DRAFT DISTRIBUTION DETERMINATION—DRAFT DECISION
Table E.1 Determining ijtp 1 and ij
tq 2 in example 1
Tariffs ijtp 1 ij
tq 2
Origin tariff – standard domestic
Fixed charge $ per annum per customer
30 25 000 customers
Variable rate (all consumption) c/kWh 0.04 200 000 MWh
Proposed tariff with new component
Fixed charge $ per annum per customer
30 25 000 customers
Variable rate 1 (consumption ≤ 5000kWh per annum per customer)
c/kWh 0.04 (as per origin tariff)
150 000 MWh
Variable rate 2 (consumption > 5000kWh per annum per customer)
c/kWh 0.04 (as per origin tariff)
(200 000–150 000) = 50 000 MWh
Note: While the variable rates (1 & 2) that the DNSP proposes for the next year ( ijtp )
are likely to differ, the divergence in these rates is constrained by the overall WAPC and the side constraints for this tariff class.
E.1.2 Customers transferred to an alternative tariff
E.1.2.1 The value of ijtq 2
The DNSP may decide to transfer customers if a customer’s consumption or load profile has changed and the DNSP decides it is no longer appropriate for them to remain on the same tariff. Alternatively the DNSP may change the structure of an existing tariff to suit the majority of customers. Appendix G sets out the procedures a DNSP must adhere to in assigning or reassigning customers to tariff classes.
If the DNSP proposes to move a number of customers across to an alternative existing tariff, the rate at which revenue will accrue from these customers will be different to that used to calculate the X factor and will be different to what will be calculated under the WAPC formula. In addition, the side constraint formula will not fully reflect the actual tariff change for the customers being transferred, as the overall tariff change observed by these customers will reflect not only the side constraint on the alternative tariff but the difference between the origin tariff the customer was on and the alternative tariff to which they are being transferred. In these circumstances, the AER will require the DNSP to submit reasonable estimates for ij
tq 2 for each origin tariff that the customer is currently on, and the new tariff that the DNSP will move the customers to, taking the transfer into account.
For compliance purposes, the assumptions the DNSP must make when calculating the reasonable estimates are:
1. the customer movement occurred in year t–2
2. the customers only moved as a result of a change in tariff structures initiated by
APPENDIX E—DISTRIBUTION TARIFFS 11
the DNSP and as permitted under the customers’ network connection contract. The estimates are not to include customers who choose to move at their discretion or movements caused by a retailer’s action
3. customers have the same consumption and load profile under either tariff.
Reasonable estimates will also be required in the year following the movement as there will still be no full year of audited historical data available.
E.1.2.2 The value of ijtp 1
The ijtp 1 for the corresponding origin tariff/tariff components will be used as the ij
tp 1 for the new tariff components.
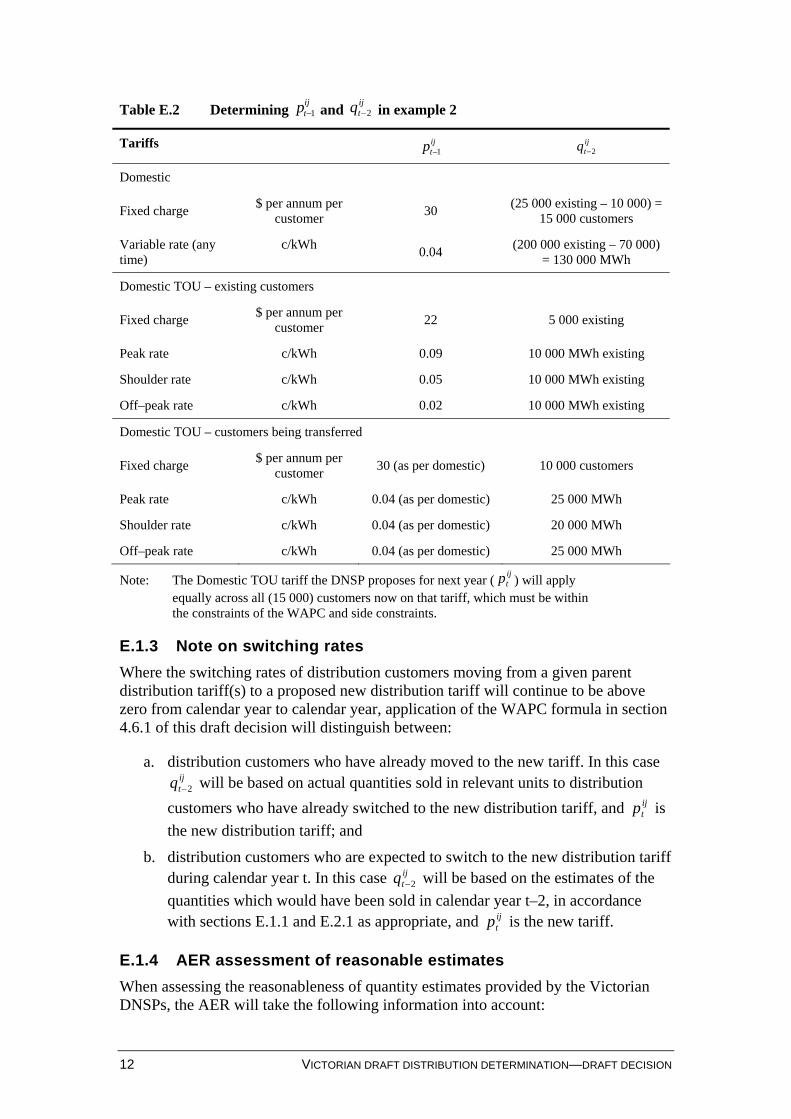
E.1.2.3 Example 2: Re-assigning some customers from the domestic flat rate tariff to the domestic TOU tariff
This example assumes 10 000 customers with consumption of 70 000 MWh will be moved by the DNSP from the domestic tariff to the domestic TOU tariff, which already has 5000 customer. Both tariffs remain in existence and there will be customers on both. The allocation of the 70 000 MWh across the peak, shoulder and off–peak reflects historical consumption patterns of these customers and is shown in table E.2.
12 VICTORIAN DRAFT DISTRIBUTION DETERMINATION—DRAFT DECISION
Table E.2 Determining ijtp 1 and ij
tq 2 in example 2
Tariffs ijtp 1
ijtq 2
Domestic
Fixed charge $ per annum per
customer 30
(25 000 existing – 10 000) = 15 000 customers
Variable rate (any time)
c/kWh 0.04
(200 000 existing – 70 000) = 130 000 MWh
Domestic TOU – existing customers
Fixed charge $ per annum per
customer 22 5 000 existing
Peak rate c/kWh 0.09 10 000 MWh existing
Shoulder rate c/kWh 0.05 10 000 MWh existing
Off–peak rate c/kWh 0.02 10 000 MWh existing
Domestic TOU – customers being transferred
Fixed charge $ per annum per
customer 30 (as per domestic) 10 000 customers
Peak rate c/kWh 0.04 (as per domestic) 25 000 MWh
Shoulder rate c/kWh 0.04 (as per domestic) 20 000 MWh
Off–peak rate c/kWh 0.04 (as per domestic) 25 000 MWh
Note: The Domestic TOU tariff the DNSP proposes for next year ( ijtp ) will apply
equally across all (15 000) customers now on that tariff, which must be within the constraints of the WAPC and side constraints.
E.1.3 Note on switching rates
Where the switching rates of distribution customers moving from a given parent distribution tariff(s) to a proposed new distribution tariff will continue to be above zero from calendar year to calendar year, application of the WAPC formula in section 4.6.1 of this draft decision will distinguish between:
a. distribution customers who have already moved to the new tariff. In this case ijtq 2 will be based on actual quantities sold in relevant units to distribution
customers who have already switched to the new distribution tariff, and ijtp is
the new distribution tariff; and
b. distribution customers who are expected to switch to the new distribution tariff during calendar year t. In this case ij
tq 2 will be based on the estimates of the
quantities which would have been sold in calendar year t–2, in accordance with sections E.1.1 and E.2.1 as appropriate, and ij
tp is the new tariff.
E.1.4 AER assessment of reasonable estimates
When assessing the reasonableness of quantity estimates provided by the Victorian DNSPs, the AER will take the following information into account:
APPENDIX E—DISTRIBUTION TARIFFS 13
1. the actual audited quantities sold in relevant units under the origin tariff in previous years
2. a forecast of the number of distribution customers that the DNSP states will move to the new tariff/tariff components, and the reasons for the move
3. a forecast of the number of distribution customers that the DNSP expects will remain on the origin tariff
4. a forecast of the quantities that the DNSP expects will be sold, in relevant units, to those distribution customers that are to be moved to the new tariff/tariff components
5. a forecast of the quantities that the DNSP expects will be sold, in relevant units, to those distribution customers that will remain on the origin tariff
6. a forecast of the distribution tariff, and associated revenue, the DNSP expects will be payable by those distribution customers that will be moved to the new tariff/tariff components
7. a forecast of the distribution tariff, and associated revenue, the DNSP expects will be payable by those distribution customers that will remain on the origin tariff
8. the approach the DNSP used to determine its forecasts (for 2–7 above)
9. the materiality of the reasonable estimates
10. further information as required by the AER.
14 VICTORIAN DRAFT DISTRIBUTION DETERMINATION—DRAFT DECISION
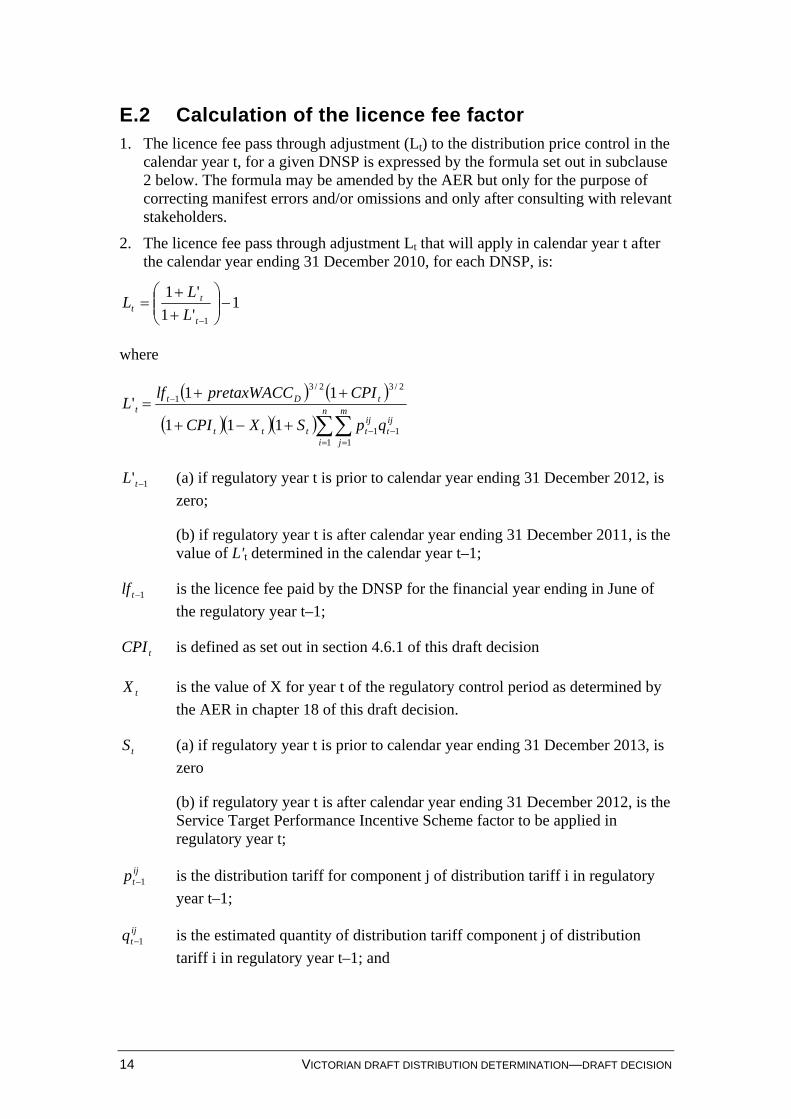
E.2 Calculation of the licence fee factor 1. The licence fee pass through adjustment (Lt) to the distribution price control in the
calendar year t, for a given DNSP is expressed by the formula set out in subclause 2 below. The formula may be amended by the AER but only for the purpose of correcting manifest errors and/or omissions and only after consulting with relevant stakeholders.
2. The licence fee pass through adjustment Lt that will apply in calendar year t after the calendar year ending 31 December 2010, for each DNSP, is:
1'1
'1
1
t
tt L
LL
where
n
i
m
j
ijt
ijtttt
tDtt
qpSXCPI
CPIpretaxWACClfL
1 111
2/32/31
111
11'
1' tL (a) if regulatory year t is prior to calendar year ending 31 December 2012, is
zero;
(b) if regulatory year t is after calendar year ending 31 December 2011, is the value of L't determined in the calendar year t–1;
1tlf is the licence fee paid by the DNSP for the financial year ending in June of
the regulatory year t–1;
tCPI is defined as set out in section 4.6.1 of this draft decision
tX is the value of X for year t of the regulatory control period as determined by
the AER in chapter 18 of this draft decision.
tS (a) if regulatory year t is prior to calendar year ending 31 December 2013, is
zero
(b) if regulatory year t is after calendar year ending 31 December 2012, is the Service Target Performance Incentive Scheme factor to be applied in regulatory year t;
ijtp 1 is the distribution tariff for component j of distribution tariff i in regulatory
year t–1;
ijtq 1 is the estimated quantity of distribution tariff component j of distribution
tariff i in regulatory year t–1; and
APPENDIX E—DISTRIBUTION TARIFFS 15
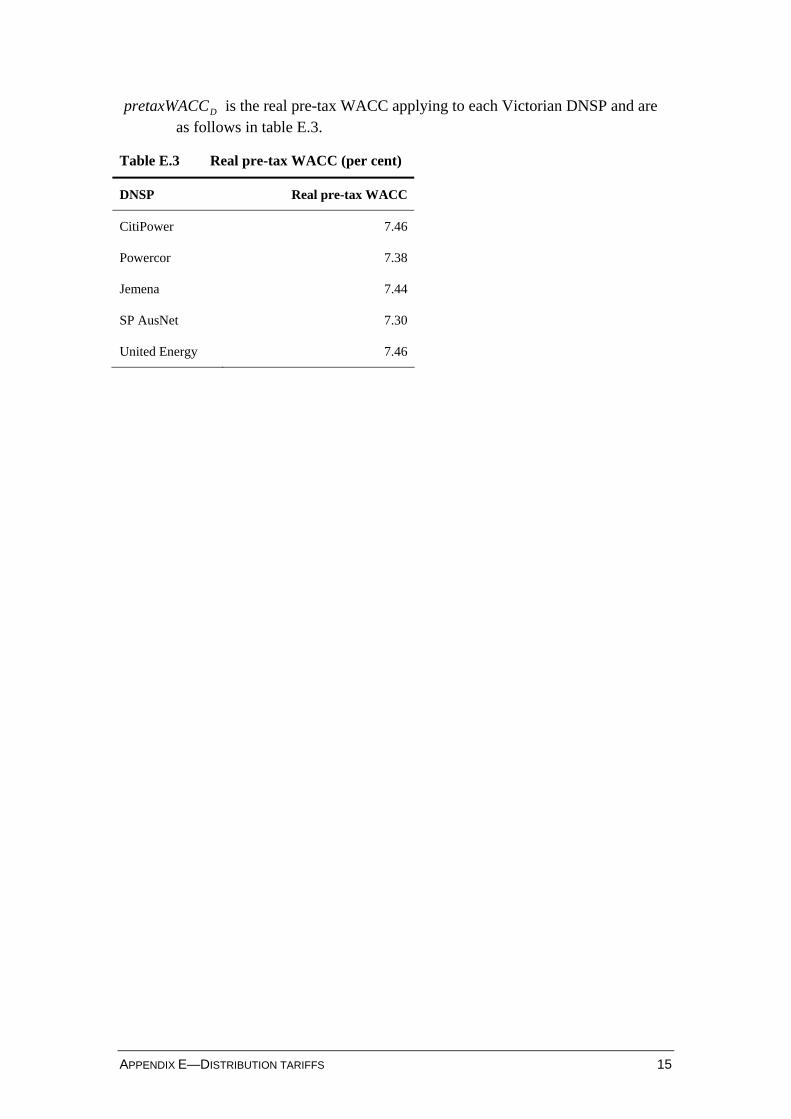
DpretaxWACC is the real pre-tax WACC applying to each Victorian DNSP and are as follows in table E.3.
Table E.3 Real pre-tax WACC (per cent)
DNSP Real pre-tax WACC
CitiPower 7.46
Powercor 7.38
Jemena 7.44
SP AusNet 7.30
United Energy 7.46
16 VICTORIAN DRAFT DISTRIBUTION DETERMINATION—DRAFT DECISION
F Transmission tariffs
F.1 Introduction To demonstrate compliance with clause 6.18.7 of the National Electricity Rules (NER) and this draft decision in the forthcoming regulatory control period, the AER requires the Victorian DNSPs to maintain a transmission use of system (TUOS) unders and overs account. The Victorian DNSPs must provide information on this account to the AER as part of its annual pricing proposals under clause 6.18.2(b)(7) of the NER.
As part of its pricing proposal for each regulatory year of the forthcoming regulatory control period, the Victorian DNSPs must provide details of their calculations of the charges that they incurred for transmission use of system services including the unders and overs component in accordance with clause 6.18.7 of the NER.
The Victorian DNSPs must provide details of calculations in the format set out in appendix F.2 of this draft decision. Amounts provided for the most recently completed regulatory year must be audited. Amounts for the current and next regulatory year will be regarded as estimates and forecasts respectively.
In proposing variations to the amount and structure of TUOS charges, the Victorian DNSPs are to achieve a zero expected balance on its TUOS unders and overs account at the end of each regulatory year in the forthcoming regulatory control period.
F.2 Maximum transmission revenue control The AER applies the Maximum Transmission Revenue control when considering whether or not to verify as compliant the DNSP’s proposed transmission use of system tariffs.
F.2.1
When assessing a DNSP’s proposed transmission use of system tariffs, submitted in accordance with clause 6.18.2 of the NER, the AER will assess whether the expected revenue from transmission use of system tariffs (TRt), is less than or equal to the Maximum Transmission Revenue (MTRt):
TRt ≤ MTRt
where:
MTRt is determined by the formula in clause F.2.2
TRt is the total of the DNSP’s proposed transmission use of system tariffs multiplied by the corresponding forecast quantities to be distributed for each transmission tariff component of each transmission tariff, in calendar year t.
APPENDIX F—TRANSMISSION TARIFFS 17
F.2.2 Implementation mechanism
Maximum Transmission Revenue (MTRt)
1. MTRt is expressed by the formula as set out below:
ttt KTCMTR
where:
tMTR (in ¢) is the maximum revenue the DNSP is allowed to receive from its
transmission use of system tariffs from all distribution customers for the calendar year t
tTC (in ¢) is the aggregate of all charges for use of the transmission system which
the DNSP forecasts it will be required to pay to AEMO and SPI PowerNet, or any other party holding a Victorian electricity transmission licence, during calendar year t, where payments comply with any relevant guidance in force from time to time
tK (in ¢) is determined in accordance with clauses F.2.3.
2. The AER may amend the MTRt formula as set out in clause F.2.2(1) where:
a. the AER is satisfied that the above definitions of the components of the MTRt will not operate in a manner which enables the DNSPs to recover costs associated with use of the transmission system.
F.2.3 Implementation mechanism
Correction factor Kt
1. tK is a correction factor to account for any under or over recovery of actual
revenue from transmission use of system tariffs in relation to allowed revenue from transmission use of system tariffs.
2. tK is determined by reference to the formula set out below. The formula may be
amended by the AER but only for the purpose of correcting manifest errors and/or omissions.
)1)(1)(( 1 Dttttt pretaxWACCCPIKKzKyK where:
tKy (in ¢) is calculated in accordance with clause F.2.4
tKz (in ¢) is calculated in accordance with clause F.2.5
1tK (in ¢) is the figure calculated for Kt for calendar year t-1
Pre tax WACCD is as set out in appendix E.2 of this draft decision
18 VICTORIAN DRAFT DISTRIBUTION DETERMINATION—DRAFT DECISION
CPIt is defined as set out in section 4.6.1 of this draft decision.
F.2.4 Implementation mechanism
Calculation of Kyt
1. Kyt is a correction factor determined with reference to the formula in this clause. The formula may be amended by the AER but only for the purpose of correcting manifest errors and/or omissions.
11 ttt TCTRKy
where:
1tTR (in ¢) is the total revenue which it is estimated the DNSP will earn from its
transmission use of system tariffs in respect of all distribution customers in calendar year t-1
1tTC (in ¢) is the aggregate of all charges relating to use of the transmission
system which it is estimated will be payable by the DNSP to AEMO and SPI PowerNet, or any other party holding a Victorian electricity transmission licence, during calendar year t-1, where payments comply with any relevant guidance in force from time to time.
F.2.5 Implementation mechanism
Calculation of Kzt
1. Kzt is a correction factor for the difference between the estimates made in clause F.2.4 in calendar year t-1 and actual audited values and is expressed by the formula in this clause. The formula may be amended by the AER but only for the purpose of correcting manifest errors and/or omissions.
12221 1*1*Re tDttttt CPIpretaxWACCTCeTCaTTRaKz
where:
2tTRa (in ¢) is the actual audited total revenue earned by the DNSP from
transmission use of system tariffs in respect of all distribution customers in calendar year t-2
2-tTRe (in ¢) is the figure used for 1tTR when calculating tKy for calendar year t-1
under clause F.2.4
2tTCa (in ¢) is the audited aggregate of all charges relating to use of the
transmission system which were paid by the DNSP to AEMO or SPI PowerNet, or any other party holding a Victorian electricity transmission licence, during calendar year t-2, where payments comply with any relevant guidance in force from time to time
APPENDIX F—TRANSMISSION TARIFFS 19
2tTCe (in ¢) is the figure used for 1tTC when calculating tKy for calendar year t-1
under clause F.2.4
1tCPI is defined as set out in section 4.6.1 of this draft decision
Pre tax WACCD is as set out in appendix E.2 of this draft decision.
20 VICTORIAN DRAFT DISTRIBUTION DETERMINATION—DRAFT DECISION
G Assigning customers to tariff classes
Procedures for assigning or reassigning customers to tariff classes
The procedures outlined in this appendix apply to all direct control services.
Assignment of existing customers to tariff classes at the commencement of the forthcoming regulatory control period
1. Each customer who was a customer of a Victorian DNSP prior to 1 January 2011, and who continues to be a customer of a Victorian DNSP as at 1 January 2011, will be taken to be 'assigned' to the same tariff class which the Victorian DNSP was using to charge that customer immediately prior to 1 January 2011.
Assignment of new customers to a tariff class during the forthcoming regulatory control period
2. If, after 1 January 2011, a Victorian DNSP becomes aware that a person will become a customer of the DNSP, then the DNSP must determine the tariff class to which the new customer will be assigned.
3. In determining the tariff class to which a customer or potential customer will be assigned, or reassigned, in accordance with section 2 or 5 of this appendix, a DNSP must take into account one or more of the following factors:
a. the nature and extent of the customer’s usage
b. the nature of the customer’s connection to the network1
c. whether remotely-read interval metering or other similar metering technology has been installed at the customer's premises as a result of a regulatory obligation or requirement
d. consistency with the AER's Interval Meter Reassignment Requirements2.
4. In addition to the requirements under section 3 of this appendix, a Victorian DNSP, when assigning or reassigning a customer to a tariff class, must ensure the following:
a. that customers with similar connection and usage profiles are treated equally
b. that customers which have micro–generation facilities are not treated less favourably than customers with similar load profiles without such facilities.
Reassignment of existing customers to another existing or a new tariff class during the forthcoming regulatory control period
5. If a Victorian DNSP believes that an existing customer’s load characteristics or connection characteristics (or both) have changed such that it is no longer appropriate for that customer to be assigned to the tariff class to which the customer is currently assigned or a customer no longer has the same or materially
1 The AER interprets 'nature' to include the installation of any technology capable of supporting time
based tariffs. 2 AER, Interval meter reassignment requirements: Final decision, May 2009.
APPENDIX G—ASSIGNING CUSTOMERS TO TARIFF CLASSES 21
similar load or connection characteristics as other customers on the customer’s existing tariff class, then it may reassign that customer to another tariff class.
Objections to proposed assignments and reassignments
6. A Victorian DNSP must notify the customer concerned in writing of the tariff class to which the customer has been assigned or reassigned by it, prior to the assignment or reassignment occurring.
7. The notice under section 6 of this appendix, must include advice that the customer may request further information from the DNSP and that the customer may object to the proposed assignment or reassignment. This notice must specifically include:
a. either a copy of the DNSP’s internal procedures for reviewing objections or the link to where such information is available on the DNSP’s website
b. that if the objection is not resolved to the satisfaction of the customer under the DNSP’s internal review system, then to the extent that resolution of such disputes are within the jurisdiction of the Energy and Water Ombudsman (Victoria) the customer is entitled to escalate the matter to such a body
c. that if the objection is not resolved to the satisfaction of the customer under the DNSP’s internal review system and the ombudsman scheme noted in clause 7.b, then the customer is entitled to seek a decision of the AER via the dispute resolution process available under Part 10 of the NEL.
8. If, in response to a notice issued in accordance with section 6 of this appendix, a Victorian DNSP receives a request for further information from a customer, then it must provide such information. If any of the information requested by the customer is confidential then it is not required to provide that information to the customer.
9. If, in response to a notice issued in accordance with section 7 of this appendix, a customer makes an objection to a Victorian DNSP about the proposed assignment or reassignment, the relevant Victorian DNSP must reconsider the proposed assignment or reassignment, taking into consideration the factors in sections 3 and 4 above, and notify the customer in writing of its decision and the reasons for that decision.
10. If a customer’s objection to a tariff class assignment or reassignment is upheld by the relevant body noted in clauses 7.b and 7.c, then any adjustment which needs to be made to tariffs will be done by the Victorian DNSP as part of the next annual review of prices.
System of assessment and review of the basis on which a customer is charged
11. Where the charging parameters for a particular tariff result in a basis of charge that varies according to the customer’s usage or load profile, the Victorian DNSP must set out in its annual pricing proposal a method by which it will review and assess the basis on which a customer is charged.
12. If the AER considers that the method provided under section 11 of this appendix, does not provide for an appropriate system of assessment and review by the DNSP of the basis on which a customer is charged, the AER may, at any time, request additional information or request that the relevant Victorian DNSP submit a revised pricing method.
22 VICTORIAN DRAFT DISTRIBUTION DETERMINATION—DRAFT DECISION
13. If the AER considers the DNSP's method for reviewing and assessing the basis on which a customer is charged, provided in accordance with section 11 of this appendix, is not reasonable it will advise the DNSP in writing.
Installation of interval meters and assignment of customers to time of use (TOU) tariffs
14. If a DNSP installs an interval meter for an existing distribution customer the DNSP may reassign that distribution customer to a TOU distribution tariff subject to clause 9.1.14 of the Victorian Electricity Distribution Code.3
15. A DNSP must provide a distribution customer with a notification in writing consistent with the interval meter reassignment requirements prior to reassigning a distribution customer who has an annual consumption of less than 20 MWh to a TOU distribution tariff under Distribution Code clause 9.1.14.
3 Reassignment to a TOU network tariff by a DNSP can only occur if the DNSP's network charges
are set on the basis of interval data. Refer AER, Interval meter reassignment requirements Final decision, May 2009, p. 21.
APPENDIX H––OUTSOURCING AND RELATED PARTY TRANSACTIONS 23
H Assessment of individual outsourcing and related party arrangements
H.1 Introduction In chapter 6, the AER summarised the each of the Victorian DNSPs' proposals in respect the connection between their operating and capital expenditure forecasts and the outsourcing and related party transactions entered into be the DNSPs. The AER also outlined a conceptual approach to the assessment of outsourcing and related party transactions to assist the AER is assesses the Victorian DNSPs' expenditure forecasts against the requirements of the NER.
In this appendix the AER applies that framework against each of the major outsourcing and related party transactions of the Victorian DNSPs.
H.2 CitiPower and Powercor
H.2.1 Corporate structure and outsourcing arrangements
CitiPower Pty (CitiPower) holds an electricity distribution licence for Melbourne’s central business district and inner suburbs. Powercor Australia Ltd (Powercor) holds an electricity distribution license for central and western Victoria, as well as Melbourne’s outer western suburbs. Powercor also holds an electricity distribution licence for the Docklands area (an area which is also covered by CitiPower’s licence).
CitiPower and Powercor are both wholly by CHEDHA Holdings Pty Ltd (CHEDHA Holdings). CHEDHA Holdings is 51 per cent owned by Cheung Kong Infrastructure Holdings Ltd (CKI) and Hong Kong Electric Holdings Ltd (HEH) and 49 per cent owned by Spark Infrastructure Group (Spark). Spark is a publicly listed stapled entity on the ASX. 1
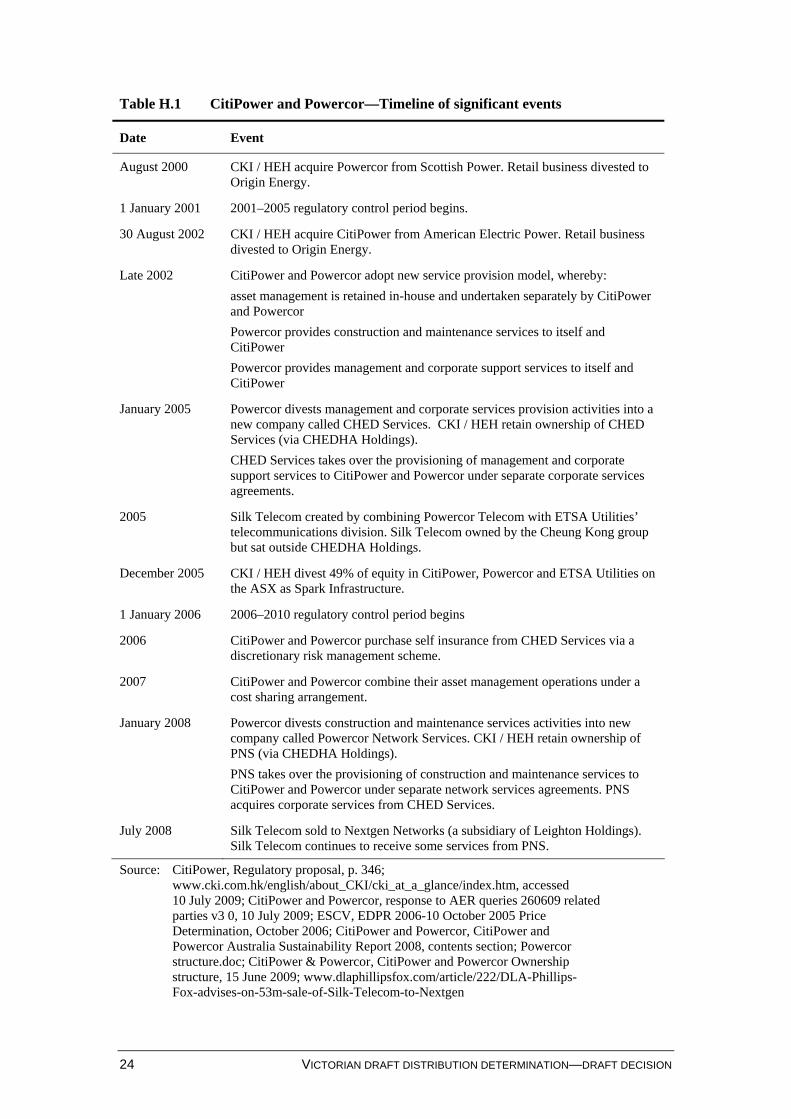
Table H.1 sets out a timeline of significant events in the development of CitiPower’s and Powercor’s corporate structure and contractual arrangements.
1 Spark is a stapled security and consists of Spark Infrastructure Holdings No.1 Ltd, Spark
Infrastructure Holdings No.2 Ltd, Spark Infrastructure Holdings International Ltd and Spark Infrastructure Trust (SIT). CKI owns 8.73 per cent of Spark and 38.87 per cent of Hong Kong Electric Holdings Ltd.
24 VICTORIAN DRAFT DISTRIBUTION DETERMINATION—DRAFT DECISION
Table H.1 CitiPower and Powercor—Timeline of significant events
Date Event
August 2000 CKI / HEH acquire Powercor from Scottish Power. Retail business divested to Origin Energy.
1 January 2001 2001–2005 regulatory control period begins.
30 August 2002 CKI / HEH acquire CitiPower from American Electric Power. Retail business divested to Origin Energy.
Late 2002 CitiPower and Powercor adopt new service provision model, whereby:
asset management is retained in-house and undertaken separately by CitiPower and Powercor
Powercor provides construction and maintenance services to itself and CitiPower
Powercor provides management and corporate support services to itself and CitiPower
January 2005 Powercor divests management and corporate services provision activities into a new company called CHED Services. CKI / HEH retain ownership of CHED Services (via CHEDHA Holdings).
CHED Services takes over the provisioning of management and corporate support services to CitiPower and Powercor under separate corporate services agreements.
2005 Silk Telecom created by combining Powercor Telecom with ETSA Utilities’ telecommunications division. Silk Telecom owned by the Cheung Kong group but sat outside CHEDHA Holdings.
December 2005 CKI / HEH divest 49% of equity in CitiPower, Powercor and ETSA Utilities on the ASX as Spark Infrastructure.
1 January 2006 2006–2010 regulatory control period begins
2006 CitiPower and Powercor purchase self insurance from CHED Services via a discretionary risk management scheme.
2007 CitiPower and Powercor combine their asset management operations under a cost sharing arrangement.
January 2008 Powercor divests construction and maintenance services activities into new company called Powercor Network Services. CKI / HEH retain ownership of PNS (via CHEDHA Holdings).
PNS takes over the provisioning of construction and maintenance services to CitiPower and Powercor under separate network services agreements. PNS acquires corporate services from CHED Services.
July 2008 Silk Telecom sold to Nextgen Networks (a subsidiary of Leighton Holdings). Silk Telecom continues to receive some services from PNS.
Source: CitiPower, Regulatory proposal, p. 346; www.cki.com.hk/english/about_CKI/cki_at_a_glance/index.htm, accessed 10 July 2009; CitiPower and Powercor, response to AER queries 260609 related parties v3 0, 10 July 2009; ESCV, EDPR 2006-10 October 2005 Price Determination, October 2006; CitiPower and Powercor, CitiPower and Powercor Australia Sustainability Report 2008, contents section; Powercor structure.doc; CitiPower & Powercor, CitiPower and Powercor Ownership structure, 15 June 2009; www.dlaphillipsfox.com/article/222/DLA-Phillips-Fox-advises-on-53m-sale-of-Silk-Telecom-to-Nextgen
APPENDIX H––OUTSOURCING AND RELATED PARTY TRANSACTIONS 25
CitiPower and Powercor’s related party transactions comprise:
corporate services agreements and a discretionary risk management scheme with CHED Services
network services agreements with Powercor Network Services (PNS)
a cost sharing arrangement with each other (ie. between CitiPower and Powercor)
resources agreements with CHED Services and PNS, and
an electrical and maintenance services agreement with ETSA Utilities (Powercor only)
In addition, CitiPower and Powercor have entered into separate electrical network communications agreements and corporate communications agreements with Silk Telecom. At the time these communications agreements were entered into, Silk Telecom was a related party of CitiPower and Powercor (as it was owned by the CKI / HEH group). Subsequently, it has been sold to an unrelated party, Nextgen Networks, a subsidiary of Leighton Holdings.
Each of the above arrangements are assessed in the following sections.
H.2.2 Corporate services agreements with CHED Services
In 2005, a separate legal entity, CHED Services was created and separated from CitiPower and Powercor to provide corporate services to CitiPower and Powercor under separate corporate services agreements (CSAs). The corporate services include CEO, finance, company secretary and legal, HR, corporate affairs, regulation, customer services, IT, and office administration. CHED Services has been providing these services since 1 January 2005, though the current agreements span the period 2008-2010. In order to facilitate the CSAs, CitiPower and Powercor provide staff to CHED Services under separate resource agreements with CHED Services.2
The pricing of services under the CSAs is based on a fixed charge for 2008, with CPI escalations being applied in 2009 and 2010. The 2008 fixed charge was based on what CitiPower and Powercor claim were forecast efficient costs plus a commercial margin (the margin was based on an Ernst & Young report, discussed below).
Presumption threshold
Given the common ownership of CitiPower, Powercor and CHED Services, the DNSPs do not have an incentive to enter into arms length arrangements with CHED Services. Further, CitiPower and Powercor acknowledge that they did not procure these services on a competitive basis or conduct a tendering process.3 Accordingly, the AER cannot presume that the contract prices of these agreements reflect efficient costs or costs of a prudent operator in the circumstances of CitiPower and Powercor.
2 CitiPower, Regulatory proposal, p.346; Powercor, Regulatory proposal, p.352. 3 CitiPower, Regulatory proposal, p.355; Powercor, Regulatory proposal, pp.362-363.
26 VICTORIAN DRAFT DISTRIBUTION DETERMINATION—DRAFT DECISION
Related party margin
CitiPower and Powercor commissioned Ernst & Young to establish ‘arms length’ margins for corporate services, using methods they say are acceptable to the ATO for related party transfer pricing. Ernst & Young advised different margins for different types of corporate services. These ranged from 3.76 per cent for HR, training and development services to 18.93 per cent for IT services. The margins from Ernst & Young’s report were adopted as the notional margins in the current CSA. Though given the fixed price nature of the contract, the outturn margins earned by CHED Services in any given year could be more or less than these notional margins, depending on CHED Services actual costs.
The AER’s critique of related party transfer pricing methods used for tax purposes being applied to economic regulation is set out in section 6.5.5. Accordingly, the AER does not consider that the Ernst & Young reports demonstrate the efficiency or prudency of the margins in the CSAs.
CHED Services’s corporate costs have already been factored into the base opex and capex forecasts—accordingly a margin to compensate for a share of CHED Services’ overheads is not appropriate as it would over-recover these costs. Additionally, the AER is not aware of any assets owned and utilised by CHED Services in providing services to CitiPower and Powercor which are not already contained within the DNSPs’ regulatory asset bases. The existence of such assets would justify a margin being paid to CHED Services, but does not appear to apply here. Accordingly, following the AER’s approach set out in section 6.5.4, a case for a margin above CHED Services’ actual costs has not been established.
The AER also notes that prior to the corporate services being provided by CHED Services, these services were provided by Powercor to both itself and CitiPower. Powercor has moved from a business model where it provided corporate services to itself ‘at cost’ to one where it now pays a related party ‘cost plus margin’ for these same or similar services. Powercor lists the ‘greater potential for the cost-efficient provision of … back office services’ as one of the reasons it moved to its current business model.4 However, considering Powercor previously had access to significant economies of scale through servicing both itself and CitiPower, the AER is not satisfied that the move to a business model where it now pays a profit margin to a related party (a cost it did not previously incur when providing the same services to itself) reflects the actions of a prudent operator in Powercor’s circumstances.
Further, it appears that most if not all staff utilised by CHED Services are in fact still directly employed by CitiPower or Powercor. KPMG describes the agreements as follows:
The Agreements are structured so that Powercor and CitiPower back office employees are effectively “seconded” to CHED and Powercor NS to undertake their daily activities. CHED and Powercor NS then pay Powercor and CitiPower for the use of these resources through a service fee.5
4 Powercor, Regulatory proposal, p.365. 5 KPMG, Powercor Australia Limited—Consideration of the arms length nature of shared service
arrangements, December 2007, p.2.
APPENDIX H––OUTSOURCING AND RELATED PARTY TRANSACTIONS 27
CitiPower and Powercor offer the services of their employees to CHED Services ‘at cost’, but when CHED Services utilises these same employees to provide services back to CitiPower and Powercor, the DNSPs pay ‘cost plus margin’. It would appear that the profit margin CitiPower and Powercor pays to CHED Services could be avoided by CitiPower and Powercor using its own employees to provide these services to themselves rather than entering into the arrangements they have with CHED Services. The AER considers it difficult to see how a prudent operator would second its staff to another business, only to effectively pay their own employees salaries plus a profit margin to that business. Given these considerations, the AER is not satisfied that the profit margins paid to CHED Services reflect efficient costs or the costs of a prudent operator in the circumstances of CitiPower and Powercor. In the AER’s opinion, it is unlikely that such arrangements would be entered into by parties acting on an arms length basis.
While the AER acknowledges the scale economies available through pooling these employees, it appears a more efficient arrangement would be similar to the cost sharing arrangement between CitiPower and Powercor, discussed in section H.2.5. Under this arrangement CitiPower and Powercor have merged their asset management teams, which operate as a single team, and with the actual costs of these employees allocated between CitiPower and Powercor. This setup accesses the scale economies of operating more than one network, while avoiding the payment of a profit margin to a related party.
H.2.3 Discretionary risk management scheme with CHED Services
CHED Services has established a discretionary risk management scheme (DRMS), with CitiPower and Powercor as scheme members. The purpose of the scheme is to provide in-fill insurance cover to CitiPower and Powercor in respect of amounts below the policy deductibles for the following external insurance policies:
liability insurance
property insurance, and
motor vehicle insurance6
The DRMS retains the funding reserves based on payments made by CitiPower and Powercor in order to enable CHED Services to meet the cost of claims under the DRMS. CHED Services charges CitiPower and Powercor a fee for the insurance services in accordance with external actuarial assessment and advice. The fee is based on the actual cost of the services plus a margin of 3.2 per cent paid by CitPower and 2.9 per cent for PNS.7
Presumption threshold
Given the common ownership of CitiPower, Powercor and CHED Services, the DNSPs do not have an incentive to enter into arms length arrangements with CHED Services. Further, CitiPower and Powercor acknowledge that they did not procure
6 CitiPower, Regulatory proposal, p.346; Powercor, Regulatory proposal, p.352. 7 CitiPower, Regulatory proposal, p.352; Powercor, Regulatory proposal, p.359.
28 VICTORIAN DRAFT DISTRIBUTION DETERMINATION—DRAFT DECISION
these services on a competitive basis or conduct a tendering process.8 Accordingly, the AER cannot presume that the contract prices of these agreements reflect efficient costs or costs of a prudent operator in the circumstances of CitiPower and Powercor.
Related party margin
CHED Services’s corporate costs are already included within the expenditure forecasts and this service would not appear to utilise any assets not already contained with CitiPower’s or Powercor’s RAB’s. Accordingly, following the AER’s approach set out in section 6.5.4, a case for a margin above CHED Services’ actual costs has not been established.
The AER also notes that the set-up of this scheme does not have an impact on the expected level of deductibles incurred. Rather its impact appears to be one of cost-smoothing for the DNSPs, whereby they pay a relatively constant fee to CHED Services each year, who then incurs the cost of deductibles when they occur, instead of CitiPower and Powercor incurring the deductible costs (which might vary on an annual basis).
When a service provider obtains external insurance, the premium price the pay effectively covers the expected cost of the exposure, plus an additional component to cover the insurer’s administration costs and a profit margin. Despite having to contribute to the insurer’s administration costs and a profit margin, incurring the insurance premium is still often a prudent action giving the risk-smoothing that can be considerable.
However, the AER notes that the risk transfer from CitiPower and Powercor to CHED Services is not significant given the deductibles only relate to relatively low value amounts. It is difficult for the AER to see the prudence in CitiPower’s or Powercor’s actions in entering this scheme which does not have significant cost-smoothing benefits. If CitiPower and Powercor instead retained these risks, their expected costs over the long run would be the same as that paid to CHED Services minus the profit margin. Accordingly, the AER is not satisfied that the profit margin paid to CHED Services is a cost that would be incurred by a prudent operator in CitiPower’s or Powercor’s circumstances.
H.2.4 Network services agreements with Powercor Network Services
In 2008, a separate legal entity, Powercor Network Services (PNS) was created and separated from CitiPower and Powercor to provide construction and maintenance services to CitiPower and Powercor under separate network services agreements (NSAs). These services include customer and connection services, asset replacement, maintenance services, asset performance (fault) services, and network development services. The current agreements span the period 2008-2010. In order the facilitate the NSAs, CitiPower and Powercor provide staff to PNS under separate resource agreements with PNS.9
8 CitiPower, Regulatory proposal, p.355; Powercor, Regulatory proposal, pp.362-363. 9 CitiPower, Regulatory proposal, p.347; Powercor, Regulatory proposal, p.353.
APPENDIX H––OUTSOURCING AND RELATED PARTY TRANSACTIONS 29
The pricing of services under the NSAs is based on a mix of fixed quotes, unit rates and labour rates.
Presumption threshold
Given the common ownership of CitiPower, Powercor and PNS, the DNSPs do not have an incentive to enter into arms length arrangements with PNS. Further, CitiPower and Powercor acknowledge that they did not procure these services on a competitive basis or conduct a tendering process.10 Accordingly, the AER cannot presume that the contract prices of these agreements reflect efficient costs or costs of a prudent operator in the circumstances of CitiPower and Powercor.
Related party margin
CitiPower and Powercor commissioned Ernst & Young to establish ‘arms length’ margins for corporate services, using methods they say are acceptable to the ATO for related party transfer pricing. Ernst & Young advised a margin of 5.26 per cent for construction and maintenance services. This margin was adopted as the notional margin in the NSA, though PNS’s outturn margin depends on its actual costs in any given year.
The AER’s critique of related party transfer pricing methods used for tax purposes being applied to economic regulation is set out in section 6.5.5. Accordingly, the AER does not consider that the Ernst & Young reports demonstrate the efficiency or prudency of the margin in the NSAs.
PNS’s corporate costs have already been factored into the base opex and capex forecasts—accordingly a margin to compensate for a share of PNS’s overheads is not appropriate as it would over-recover these costs. Additionally, the AER is not aware of any assets owned and utilised by PNS in providing services to CitiPower and Powercor which are not already contained within the DNSPs’ regulatory asset bases. The existence of such assets would justify a margin being paid to PNS, but does not appear to apply here. Accordingly, following the AER’s approach set out in section 6.5.4, a case for a margin above PNS’s actual costs has not been established.
The AER also has some reservations about the efficiency and prudence of CitiPower’s and Powercor’s business model and how PNS fits into this model. These reservations are the same for the corporate services agreements between the DNSPs and are set out in section H.2.2.
H.2.5 Cost sharing arrangement between CitiPower and Powercor
In 2007, CitiPower and Powercor merged their asset management teams. The associated costs are shared between CitiPower and Powercor under a cost sharing arrangement.
The agreements entail an annual payment being made between CitiPower and Powercor. The payment is based on the pooling of defined overhead costs and the reallocation of those costs to each DNSP based on defined formula. The difference
10 CitiPower, Regulatory proposal, p.355; Powercor, Regulatory proposal, pp.362-363.
30 VICTORIAN DRAFT DISTRIBUTION DETERMINATION—DRAFT DECISION
between the reallocation amount and the actual cost incurred by each DNSP is the amount that is paid by one DNSP to the other.
Presumption threshold
Given the common ownership of CitiPower and Powercor, the DNSPs do not have an incentive to enter into arms length arrangements with each other. Further, CitiPower and Powercor acknowledge that they did not procure these services on a competitive basis or conduct a tendering process.11 Accordingly, the AER cannot presume that the costs incurred by each DNSP under these arrangements reflect efficient costs or costs of a prudent operator in the circumstances of CitiPower and Powercor.
Related party margin
As described above, the actual costs incurred by CitiPower and Powercor are shared between the DNSPs with no profit margin added. Accordingly there is no related party margin issue to analyse.
H.2.6 Resource agreements with CHED Services and PNS.
As noted above, CitiPower and Powercor provide services to CHED Services and PNS under separate resources agreements.
CHED Services and PNS pay CitiPower and Powercor wages and salaries (inc. bonuses, allowances, leave payments, fringe benefits, fringe benefits tax, payroll tax, superannuation payments and workcover payments), operating expenses incurred by CitiPower or Powercor that are incidental to the provision of the staffing services (inc. phone calls, stationary, etc), and motor vehicles expenses relating to the services.12
These agreements differ from the other agreements between the parties in that it is CitiPower and Powercor providing services to CHED Services and PNS, not the other way around. And in return for these staffing services, CHED Services and PNS pay CitiPower and Powercor ‘at cost’ for the costs incurred.
As the costs of these resource agreements do not feed directly into CitiPower’s and Powercor’s expenditure forecasts, then do not need to be analysed in the same manner as the other arrangements. However, AER comments on the interaction between these resource agreements and the corporate and network services agreements, in sections H.2.2 and H.2.4 which analyse the CSAs and NSAs.
H.2.7 Electrical and maintenance services agreement with ETSA Utilities (Powercor only)
Under an electrical and maintenance services agreement, ETSA Utilities provides Powercor with limited cross boundary services. This includes electrical apparatus construction, repair, and preventative maintenance activities. ETSA Utilities also provides Powercor will all labour, approved vehicles, tools, equipment, uniforms and safety apparel necessary for the performance of these services.13
11 CitiPower, Regulatory proposal, p.355; Powercor, Regulatory proposal, pp.362-363. 12 CitiPower, Regulatory proposal, p.352; Powercor, Regulatory proposal, p.359. 13 Powercor, Regulatory proposal, p.354.
APPENDIX H––OUTSOURCING AND RELATED PARTY TRANSACTIONS 31
Presumption threshold
ETSA Utilities is 51 per cent owned by CKI / HEH and 49 per cent owned by Spark Infrastructure. These are same ultimate owners as Powercor.
Given the common ownership of Powercor and ETSA Utilities, Powercor does not have an incentive to enter into an arms length arrangement with ETSA Utilities. Powercor states that while it did procure the services on a competitive basis or through a tendering process, given the nature of cross boundary services, competitive tendering is impracticable.14
The AER acknowledges that competitive tendering for cross boundary services may be impractical, however, given the common ownership between the parties and consequent incentive to agree to an inflated contract price, the AER cannot presume that the costs incurred by Powercor under this arrangement reflect efficient costs or costs of a prudent operator in the circumstances of Powercor.
Related party margin
Powercor's regulatory accounting statements indicate that the payment to ETSA Utilities is a pass through of costs, with no profit margin. Accordingly, no related party profit margin issues arise in relation to this arrangement.
H.2.8 Electrical network communications agreement and corporate communications agreement with Silk Telecom
CitiPower and Powercor principally use Silk Telecom as their principal provider for all telecommunications links and services. Under the electricity network communications agreements, Silk Telecom provides electrical services including SCADA and trunked mobile radio services, and under the corporate communications agreements, it provides corporate communications services including managed wide area network (WAN), WAN links, mobile phones, remote access, PABX, voice and data communications.15
Silk Telecom was formed in 2005 from the merger of Powercor Telecom and ETSA Utilities’s telecommunications division. At the time it was created, Silk Telecom was ultimately owned by the Cheung Kong group (the same as CitiPower and Powercor), however sat outside CHEDHA holdings (CitiPower's and Powercor's more immediate holding company). In mid-2008, Silk Telecom was sold to Nextgen Networks, a subsidiary of Leighton Holdings.
Presumption threshold
While there is no longer any common ownership between Silk Telecom and CitiPower and Powercor, there was at the time the contracts were entered into, and accordingly CitiPower and Powercor would not have had an incentive to enter into arm's length arrangements with Silk Telecom when the current contracts were
14 Powercor, Regulatory proposal, p.364. 15 CitiPower, Regulatory proposal, p.346; Powercor, Regulatory proposal, p.353.
32 VICTORIAN DRAFT DISTRIBUTION DETERMINATION—DRAFT DECISION
negotiated. Further, the DNSPs acknowledge that the current contracts were not procured on a competitive basis or through a tendering process.16
CitiPower states that the agreements:
…expire in 2010, at which time CitiPower is committed to a competitive tendering process for the future procurement of the services currently provided by Silk Telecom.17
Powercor makes the same statement in its proposal.18 While the DNSPs may be committed to a competitive tendering process at the end of the current contract period (which cover the period 2006–10) it is the charges under the current contracts which form the basis of CitiPower's and Powercor's expenditure forecasts. Accordingly, the DNSPs commitment to a tendering process in the future does not substantiate the efficiency or prudence of their forecasts.
CitiPower and Powercor also state that the current agreements provide that:
…if a party forms the view that any component of the standard service charge no longer reflects current market prices, it may give notice to the other party to engage in good faith discussions to amend the agreement.19
The AER has reviewed the 'good faith' re-negotiation provisions in the agreements and makes the following points:
while the electricity network communications agreements allow for any component of the standard services charges to be re-negotiated, the corporate communications agreements only permit re-negotiation for a sub-set of services. This is contrary to CitiPower's and Powercor's statements that 'any' component of the standard services charges may be re-negotiated
the agreements only permitted a re-negotiation to be commenced prior to 30 September 2008, which the AER understands was a short time after the change of ownership
in re-negotiating the terms, the contracts require the parties to take into account material (where available) that CitiPower and Powercor state does not exist20
where the parties are unable to agree to changes, the current standard services charges continue to apply.
16 CitiPower, Regulatory proposal, p.356; Powercor, Regulatory proposal, p.364. 17 CitiPower, Regulatory proposal, p.354. 18 Powercor, Regulatory proposal, p.361. 19 CitiPower, Regulatory proposal, p.354; Powercor, Regulatory proposal, p.361. 20 The contracts require the parties to take into account any available market benchmarking reports
prepared by independent consultants based on like for like technologies. However, CitiPower and Powercor indicate that there is no direct market evidence or third party benchmarks sufficiently comparable (taking into account the nature and quantity of the services provided by Silk Telecom) to assess the current contract charges against. CitiPower, Regulatory proposal, p.354; Powercor, Regulatory proposal, p.361.
APPENDIX H––OUTSOURCING AND RELATED PARTY TRANSACTIONS 33
Given the above considerations, the AER does not consider that the absence of CitiPower or Powercor initiating contract re-negotiations after Silk Telecom was sold to an unrelated party is sufficient for the AER to presume that the contract charges reflect the efficient costs of a prudent operator.
Related party margin
Some of the margins in the contracts appear to be profit margins while other margins (ranging from 15–25 per cent) appear to be for corporate overheads (referred to as contract management, customer service, technical support and / or administrative support). While an allowance for corporate costs is a legitimate economic reason for a margin above direct costs, as set out in section 6.5.4, where a contract does not pass the presumption threshold, the AER is not satisfied that an unsupported percentage margin above cost (which is not verified against the actual corporate costs of the contractor) is a sufficient substantiation that the quantum of corporate costs proposed reasonably reflect efficient costs that would be incurred by a prudent operator, or a realistic expectation of input costs. Accordingly, the AER has not included a margin for Silk Telecom's corporate costs in this draft decision. However, if CitiPower and Powercor substantiate an appropriate allocation of Silk Telecom's actual corporate costs in their revised proposal then the AER would allow a margin in the final decision that reflects this amount.21
Additionally, the AER is not aware of any assets owned and utilised by Silk Telecom in providing services to CitiPower and Powercor which are not already contained within the DNSPs’ regulatory asset bases. The existence of such assets would justify a margin being paid to Silk Telecom, but does not appear to apply here.
H.3 Jemena
H.3.1 Corporate structure and outsourcing arrangements
Jemena Electricity Networks (Victoria) Ltd (Jemena) holds an electricity distribution licence for the north-western suburbs of Melbourne. Jemena’s electricity distribution network was formerly owned and operated by AGLE and then by Alinta Ltd (Alinta).
Jemena is a wholly owned subsidiary of Jemena Ltd, which is wholly owned (indirectly) by SPI (Australia) Assets Pty Ltd (SPIAA).22 SPIAA is a wholly owned subsidiary of Singapore Power International Pte Ltd (SPI) and is the holding company for the Jemena group of entities. SPI is a wholly owned subsidiary by Singapore Power Limited.
21 CitiPower's and Powercor's regulatory proposal indicate that in 2008 the margin paid to Silk
Telecom was $0.2 million for services to CitiPower and $0.4 million for services to Powercor. CitiPower, Regulatory proposal, p.354; Powercor, Regulatory proposal, p.361.Given the change in ownership in mid-2008, it is not clear whether their regulatory accounting statements from 2009 (being the source of the base opex and capitalised overhead forecasts in this decision) are inclusive of exclusive of margins paid to Silk Telecom. The AER intends to follow this up with CitiPower and Powercor between the draft and final decisions.
22 45.27 per cent of Jemena Ltd is owned directly by SPIAA. The remaining 54.73 per cent is owned by SPIAA indirectly through Jemena Group Holdings Pty Ltd (9.46 per cent) and Jemena Holdings Pty Ltd (45.27 per cent). Jemena Group Holdings and Jemena Holdings are wholly owned subsidiaries of SPIAA.
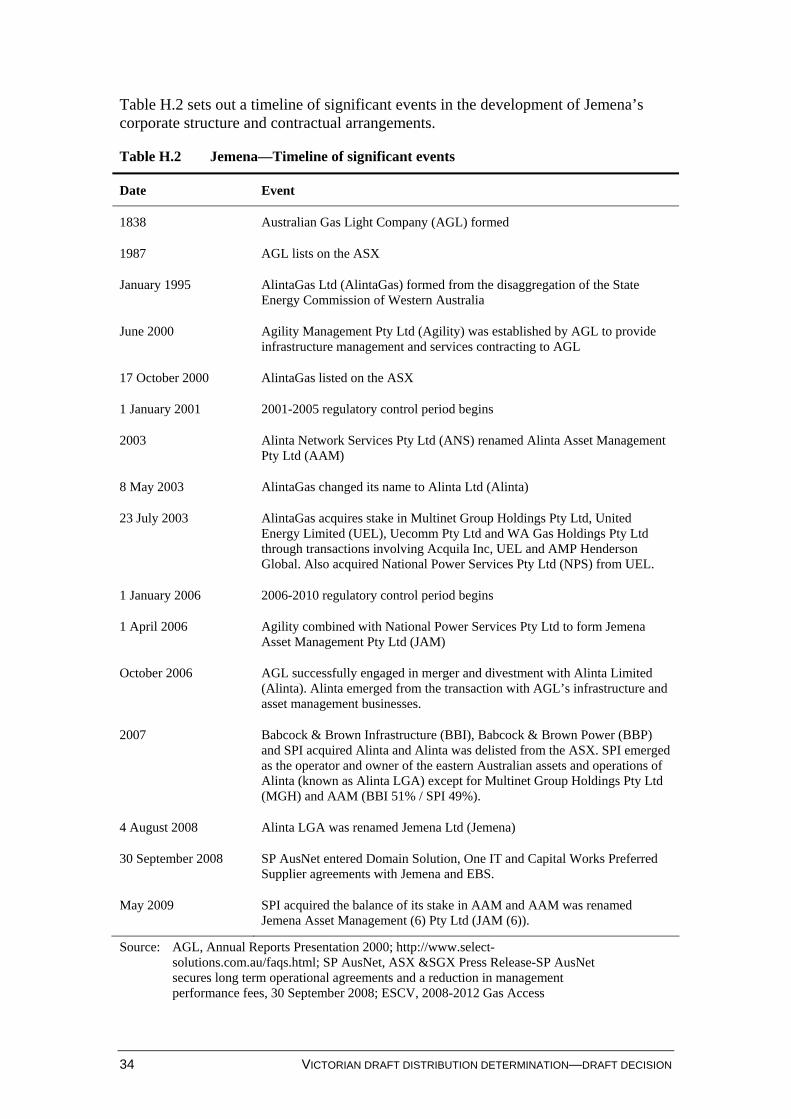
34 VICTORIAN DRAFT DISTRIBUTION DETERMINATION—DRAFT DECISION
Table H.2 sets out a timeline of significant events in the development of Jemena’s corporate structure and contractual arrangements.
Table H.2 Jemena—Timeline of significant events
Date Event
1838 Australian Gas Light Company (AGL) formed
1987 AGL lists on the ASX
January 1995 AlintaGas Ltd (AlintaGas) formed from the disaggregation of the State Energy Commission of Western Australia
June 2000 Agility Management Pty Ltd (Agility) was established by AGL to provide infrastructure management and services contracting to AGL
17 October 2000 AlintaGas listed on the ASX
1 January 2001 2001-2005 regulatory control period begins
2003 Alinta Network Services Pty Ltd (ANS) renamed Alinta Asset Management Pty Ltd (AAM)
8 May 2003 AlintaGas changed its name to Alinta Ltd (Alinta)
23 July 2003 AlintaGas acquires stake in Multinet Group Holdings Pty Ltd, United Energy Limited (UEL), Uecomm Pty Ltd and WA Gas Holdings Pty Ltd through transactions involving Acquila Inc, UEL and AMP Henderson Global. Also acquired National Power Services Pty Ltd (NPS) from UEL.
1 January 2006 2006-2010 regulatory control period begins
1 April 2006 Agility combined with National Power Services Pty Ltd to form Jemena Asset Management Pty Ltd (JAM)
October 2006 AGL successfully engaged in merger and divestment with Alinta Limited (Alinta). Alinta emerged from the transaction with AGL’s infrastructure and asset management businesses.
2007 Babcock & Brown Infrastructure (BBI), Babcock & Brown Power (BBP) and SPI acquired Alinta and Alinta was delisted from the ASX. SPI emerged as the operator and owner of the eastern Australian assets and operations of Alinta (known as Alinta LGA) except for Multinet Group Holdings Pty Ltd (MGH) and AAM (BBI 51% / SPI 49%).
4 August 2008 Alinta LGA was renamed Jemena Ltd (Jemena)
30 September 2008 SP AusNet entered Domain Solution, One IT and Capital Works Preferred Supplier agreements with Jemena and EBS.
May 2009 SPI acquired the balance of its stake in AAM and AAM was renamed Jemena Asset Management (6) Pty Ltd (JAM (6)).
Source: AGL, Annual Reports Presentation 2000; http://www.select-solutions.com.au/faqs.html; SP AusNet, ASX &SGX Press Release-SP AusNet secures long term operational agreements and a reduction in management performance fees, 30 September 2008; ESCV, 2008-2012 Gas Access
APPENDIX H––OUTSOURCING AND RELATED PARTY TRANSACTIONS 35
Arrangement Review Consultation Paper No.2; ACCC, Singapore Power, Babcock and Brown Limited-proposed acquisition of Alinta Ltd, 27 June 2007
H.3.2 Letter agreement / Asset management agreement with Jemena Asset Management
JAM (formerly Agility) has been managing Jemena’s (formerly AGLE’s) network since October 2000, under a ‘letter agreement’.23 The letter agreement appoints JAM as agent of Jemena, and pursuant to the agreement, JAM provides networks operations, capital works, metering and billing, IT, asset management and service integration services to Jemena.24
More recently, Jemena and JAM have agreed to an asset management agreement (AMA), which replaced the letter agreement from 1 January 2010. [text removed—confidential].25
Under the letter agreement and the AMA, JAM provides some services itself but also further outsources a number of activities (either directly or indirectly) to other related parties within the Jemena and SP AusNet groups. These include:
enterprise support function (ESF) services (ie. corporate services) from [text removed—confidential]
management consulting services from [text removed—confidential]
field and office labour services from [text removed—confidential]
IT services from [text removed—confidential], and
metering, vegetation management and technical asset inspection services from [text removed—confidential].26
Additionally, JAM outsources some activities to unrelated parties, including:
[text removed—confidential], and
[text removed—confidential].27
[text removed—confidential]
Essentially, Jemena's forecast opex and capex appears to be derived from the combination of JAM's current actual costs under the letter arrangement projected forwards with the margin from the AMA added on top.
23 Jemena, Regulatory proposal—Appendix 17.1, p.5. 24 Jemena, Regulatory proposal—Appendix 17.1, p.2. 25 Jemena, Regulatory proposal—Appendix 17.1, p.22. 26 Jemena, Regulatory proposal—Appendix 17.1, p.1. [text removed—confidential] 27 Jemena, Regulatory proposal—Appendix 17.1, p.26.
36 VICTORIAN DRAFT DISTRIBUTION DETERMINATION—DRAFT DECISION
Presumption threshold
The letter agreement was established in 2000 under the former AGL ownership.28 Given the common ownership between AGLE and Agility, an incentive existed to enter into arrangements that were not on arm’s length terms. The ESCV formed the same conclusion in the last EDPR.29
With the change of ownership, AGLE (now Jemena) and Agility (now JAM), maintained the letter agreement. It’s unclear whether the letter agreement allowed for a re-negotiation of terms, however the AER notes that even if this was the case, given the common ownership of Jemena and JAM, an incentive for Jemena to enter into arrangements that were not arm’s length would have existed. Further, this incentive also applied during the AMA negotiation. Jemena acknowledges that the AMA was not procured on a genuinely competitive basis.30 Accordingly, the AER considers that it cannot presume that the contract prices under the AMA reflect efficient costs or costs of a prudent operator in the circumstances of Jemena.
Jemena argues that it ‘employed the same internal controls for the AMA negotiations that Jemena would apply to external competitive tenders’. These included:
a formal request for proposal issued by Jemena to JAM
a formal response from JAM following a documented question-and-answer process
structured commercial negotiations, with probity controls and documented audit trails, and
an asset owner steering committee to govern negotiation strategy and to internally endorse and recommend the scope of the AMA services, pricing, incentive arrangements and terms and conditions.31
The AER acknowledges these positive aspects of the process taken by Jemena during the AMA negotiation process. However, the AER does not consider these are sufficient to ‘presume’ the contract terms reflect arms length terms. Given the incentive for Jemena to agree to non-arms length terms with JAM, the AER considers that only the discipline of a competitive tendering process in a competitive market is sufficient to provide the AER with the assurance that the contract reflects arms length terms without further scrutiny.
Related party margin
A share of Jemena Ltd's and JAM’s corporate costs have already been factored into the base opex and capex forecasts—accordingly an additional margin to compensate for a share of Jemena Ltd's or JAM's overheads is not appropriate as it would over-
28 Jemena, Regulatory proposal—Appendix 17.1, p.15. 29 ESCV, EDPR 2006-10—Final decision volume 1—Statement of purpose and reasons, October
2005, p.178. 30 Jemena, Regulatory proposal—Appendix 17.1, p.5. 31 Jemena, Regulatory proposal—Appendix 17.1, p.20.
APPENDIX H––OUTSOURCING AND RELATED PARTY TRANSACTIONS 37
recover these costs. Furthermore, the AER has identified some issues with the corporate costs allocated to Jemena with are considered in sections 6.7.1 and 6.7.3.
Additionally, the AER is not aware of any assets owned and utilised by JAM in providing services to Jemena which are not already contained within Jemena’s regulatory asset base. The existence of such assets would justify a margin being paid to JAM, but does not appear to apply here. Accordingly, following the AER’s approach set out in section 6.5.4, a case for a margin above JAM’s actual costs has not been established.
The AER notes that under the WOBCA methodology depreciation costs associated with IT assets are being allocated by JAM to Jemena. These assets may be related to assets not already contained in Jemena's RAB. If this is the case then a margin reflecting the return on and return of these IT assets is appropriate. The IT depreciation would be the return of assets. These IT depreciation costs are currently reflected within Jemena's base opex, and consequently reflected in Jemena's forecast opex.
At this stage the AER has not included a margin to reflect the return on these assets as it is not clear whether or not these assets are contained in Jemena's RAB or not. However, if Jemena is able to demonstrate in its revised proposal that these IT assets are not already included in the RAB, then the AER would, in its final decision, allow a margin to reflect the return on these assets.32 However, if Jemena is not able to demonstrate that these assets are not already in Jemena's RAB, then the AER, in its final decision, would not accept these IT depreciation costs in the base opex forecasts under the assumption that these assets are already contained within Jemena's RAB.
[text removed—confidential].33 34
Evans & Peck considered it reasonable to assume that project margins similar to those from the alliance agreements it’s been involved with would be applicable to Jemena’s AMA with JAM. Though Evans & Peck provides the following qualification to its conclusion:
This also assumes that the Manager under the AMA needs to generate a similar profit and recover similar overheads to other private sector construction and consulting service providers.35
The AER is not confident that this assumption holds in relation to the AMA. The AER expects that in order for an unrelated contractor to compete for services, it would first need to invest in certain capital assets (eg. depots, vehicles, equipment). Assuming these costs are not directly costed in its tenders, the unrelated contractor would need to earn a return of and return on these assets in the contracts it bids for
32 The AER notes that if Jemena is able to demonstrate that these IT assets are not already in its RAB,
an alternative form of compensation may be for these assets to be reported as capex and accordingly rolled into Jemena's RAB.
33 Jemena, Regulatory proposal—Appendix 17.1, p.26. 34 Jemena, Regulatory proposal—Appendix 7.12, ‘Evans & Peck, Jemena Electricity Networks (Vic)
Limited—Asset management agreement margin, 25 November 2009’, pp.4, appendix 4. 35 Jemena, Regulatory proposal—Appendix 7.12, ‘Evans & Peck, Jemena Electricity Networks (Vic)
Limited—Asset management agreement margin, 25 November 2009’, p.10.
38 VICTORIAN DRAFT DISTRIBUTION DETERMINATION—DRAFT DECISION
through the margin it includes in the tender. However, in the case of JAM, the AER notes that many if not all of these sorts of assets may already be contained within Jemena’s RAB. JAM would therefore not need to earn a profit to recover the return on these assets as its shareholders would already be receiving this return through the inclusion of these assets in Jemena’s RAB (given that Jemena and JAM have the same owners). However, if in its revised proposal, Jemena is able to establish that JAM provides services to Jemena utilising assets not already in Jemena's RAB, then a margin reflecting the return on and return of these assets would be appropriate.
[text removed—confidential]36 37
Considering the AER’s understanding that most if not all assets utilised by JAM in servicing the AMA are already included within Jemena’s RAB, that historical efficiencies realised by JAM will be rewarded through the ECM, and the apparent significant understatement of overheads in Evans & Peck’s analysis due to a misreporting by Jemena, the Evans & Peck report does not satisfy the AER that the margin in the AMA reasonably reflects efficient costs or the costs incurred by a prudent operator in the circumstances of Jemena.
As also noted above, Jemena submitted an EBIT margin benchmarking report from NERA which revised a previous NERA EBIT margin benchmarking report in response to criticisms from ACG on that previous report.38 NERA estimated that the average EBIT margin from a sample of companies over the period 2002–06 was 5.5 per cent, with a 95 confidence interval of 4.3–6.7 per cent.39
As outlined in section 6.5.5, the AER considers that whether or not a margin should be allowed, and the magnitude of that margin if allowed, should not simply be a matter of comparing the margin earned by a related party against industry benchmarks. Rather, the AER considers this is a case-by-case issue and includes consideration of the issues such as whether or not a related party’s corporate overheads are already included in the reported expenditure and whether it is utilising assets already in the service provider’s RAB—both considerations have an impact on the appropriate margin for a specific contract.
[text removed—confidential]
As noted above, Jemena's consultant (Evans & Peck) identifies the AMA as an alliance style contract. Evans & Peck state:
36 Jemena, Regulatory proposal—Appendix 7.12, ‘Evans & Peck, Jemena Electricity Networks (Vic)
Limited—Asset management agreement margin, 25 November 2009’, appendix 4. 37 This amount includes JAM’s own indirect costs ([c-i-c] million) and Jemena Ltd’s enterprise
support function costs which are allocated to JAM, and subsequently allocated by JAM to Jemena ([c-i-c] million or [c-i-c] million excluding one-off costs).
38 The NERA report was commissioned by Envestra in the context of the last Victorian GAAR. 39 Jemena, Regulatory proposal—Appendix 7.13 'NERA, Allen Consulting Group's review of NERA's
benchmarking of contractors' margins critique, October 2007', 30 November 2007, p.iv.
APPENDIX H––OUTSOURCING AND RELATED PARTY TRANSACTIONS 39
…the alliance method of delivery for capital projects and maintenance services is extensively used in the power sector.40
Accordingly, the type of contract that the AMA is appears to be commonly used in the industry and not of higher risk than the industry average. In fact, the only unusual feature is in relation to the recovery of corporate overheads.
In Evans & Peck's experience, payment of corporate overheads as part of the actual cost for delivering services is unusual in a typical alliance contract.41
That is, under the AMA, JAM recovers its actual overheads whereas under a typical industry contract an increase in overheads above that negotiated into the margin would be borne by the contractor.
In contrast, the AER is aware than in the contract United Energy has recently negotiated with preferred tender applicant, a significant cost overrun would result in the contractor not recovering its indirect costs.
In conclusion on this issue, Jemena has not substantiated that JAM bears a higher than industry average level of risk under the AMA.
H.3.3 Enterprise support function arrangement with Jemena Ltd
[text removed––confidential].42
[text removed––confidential].43
Presumption threshold
Given the ownership structure between Jemena and Jemena Ltd (Jemena is a wholly owned subsidiary of Jemena Ltd), Jemena did not have an incentive to enter into an arms length arrangement with Jemena Ltd. Jemena also acknowledges that that the services were not procured on a genuinely competitive basis and no tendering process was undertaken.44 Accordingly, the AER cannot presume that the costs incurred by Jemena under these arrangements reflect efficient costs or costs of a prudent operator in the circumstances of Jemena.
Related party margin
The ESF costs are overhead costs, and are allocated among the various networks that the Jemena group operates under its whole of business cost allocation (WOBCA) methodology. The costs are allocated on a cost recovery basis only, with no profit margin to Jemena Ltd added. Accordingly, no related party margin issue arise in relation to this arrangement requiring closer scrutiny.
40 Evans & Peck, Jemena Electricity Networks (Vic) Limited—Asset management agreement margin,
25 November 2009, p.9 41 Evans & Peck, Jemena Electricity Networks (Vic) Limited—Asset management agreement margin,
25 November 2009, p.7. 42 Jemena, Regulatory proposal—Appendix 17.1, p.7. 43 Jemena, Regulatory proposal—Appendix 17.1, p.2. 44 Jemena, Regulatory proposal—Appendix 17.1, p.7.
40 VICTORIAN DRAFT DISTRIBUTION DETERMINATION—DRAFT DECISION
However, a related party non-margin issue does arise. The costs allocated to Jemena include a share of the consulting fees paid by SPIAA to Singapore Power. These fees are considered closer in section 6.7.1.
H.4 SP AusNet
H.4.1 Corporate structure and outsourcing arrangements
SP AusNet holds an electricity distribution licence for eastern Victoria, and is part of the SP AusNet group.45 The SP AusNet group comprises three principal entities, namely SP Australia Networks (Distribution) and its subsidiaries, SP Australia Networks (Transmission) and its subsidiaries, and SP Australia Networks (Finance) Trust. SP AusNet is a subsidiary (indirectly) of SP Australia Networks (Distribution).46
The SP AusNet group is 51 per cent owned by Singapore Power International and 49 per cent owned by external investors and is listed on the Australian and Singaporean securities exchanges as a stapled security. Singapore Power Interational is owned directly by Singapore Power, and its ultimate parent is Temasek Holdings (Private) Ltd (Temasek). Temasek is the holding company for various commercial interests of the Singaporean government.47
Table H.3 sets out a timeline of significant events in the development of SP AusNet’s corporate structure and contractual arrangements.
45 References in this decision to ‘SP AusNet’ are references to ‘SPI Electricity’, and are to be
distinguished from references to the ‘SP AusNet group’. 46 SP AusNet, Regulatory proposal—Appendix (related party arrangements), p.13. 47 SP AusNet, Regulatory proposal—Appendix (related party arrangements), pp.13-15.
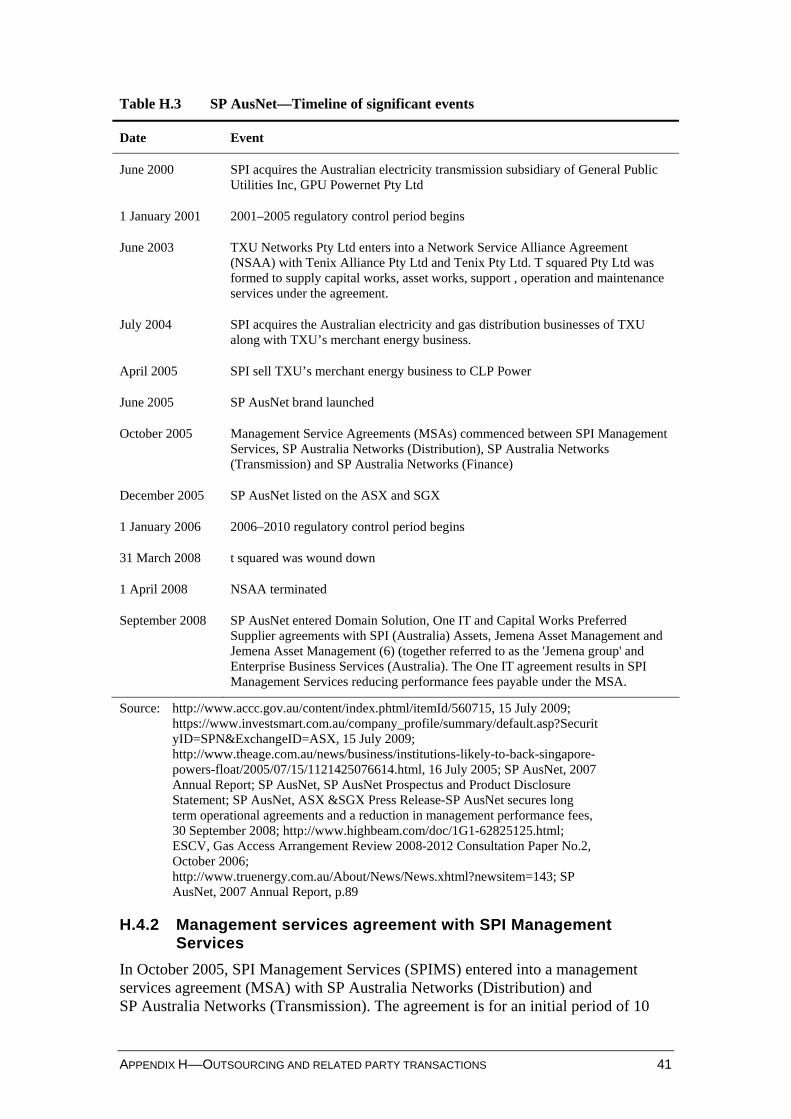
APPENDIX H––OUTSOURCING AND RELATED PARTY TRANSACTIONS 41
Table H.3 SP AusNet—Timeline of significant events
Date Event
June 2000 SPI acquires the Australian electricity transmission subsidiary of General Public Utilities Inc, GPU Powernet Pty Ltd
1 January 2001 2001–2005 regulatory control period begins
June 2003 TXU Networks Pty Ltd enters into a Network Service Alliance Agreement (NSAA) with Tenix Alliance Pty Ltd and Tenix Pty Ltd. T squared Pty Ltd was formed to supply capital works, asset works, support , operation and maintenance services under the agreement.
July 2004 SPI acquires the Australian electricity and gas distribution businesses of TXU along with TXU’s merchant energy business.
April 2005 SPI sell TXU’s merchant energy business to CLP Power
June 2005 SP AusNet brand launched
October 2005 Management Service Agreements (MSAs) commenced between SPI Management Services, SP Australia Networks (Distribution), SP Australia Networks (Transmission) and SP Australia Networks (Finance)
December 2005 SP AusNet listed on the ASX and SGX
1 January 2006 2006–2010 regulatory control period begins
31 March 2008 t squared was wound down
1 April 2008 NSAA terminated
September 2008 SP AusNet entered Domain Solution, One IT and Capital Works Preferred Supplier agreements with SPI (Australia) Assets, Jemena Asset Management and Jemena Asset Management (6) (together referred to as the 'Jemena group' and Enterprise Business Services (Australia). The One IT agreement results in SPI Management Services reducing performance fees payable under the MSA.
Source: http://www.accc.gov.au/content/index.phtml/itemId/560715, 15 July 2009; https://www.investsmart.com.au/company_profile/summary/default.asp?SecurityID=SPN&ExchangeID=ASX, 15 July 2009; http://www.theage.com.au/news/business/institutions-likely-to-back-singapore-powers-float/2005/07/15/1121425076614.html, 16 July 2005; SP AusNet, 2007 Annual Report; SP AusNet, SP AusNet Prospectus and Product Disclosure Statement; SP AusNet, ASX &SGX Press Release-SP AusNet secures long term operational agreements and a reduction in management performance fees, 30 September 2008; http://www.highbeam.com/doc/1G1-62825125.html; ESCV, Gas Access Arrangement Review 2008-2012 Consultation Paper No.2, October 2006; http://www.truenergy.com.au/About/News/News.xhtml?newsitem=143; SP AusNet, 2007 Annual Report, p.89
H.4.2 Management services agreement with SPI Management Services
In October 2005, SPI Management Services (SPIMS) entered into a management services agreement (MSA) with SP Australia Networks (Distribution) and SP Australia Networks (Transmission). The agreement is for an initial period of 10
42 VICTORIAN DRAFT DISTRIBUTION DETERMINATION—DRAFT DECISION
years but continues for two further 10 year periods unless terminated by either party giving no less than one year’s notice. If SP Australia Networks (Distribution) or SP Australia Networks (Transmission) initiate the termination, SPIMS is entitled to a termination fee equal to the previous year’s management services charge. The initial employees of SPIMS consisted of employees who transferred across from the SP AusNet group at the time of its restructure prior to the SP AusNet group’s initial public offering. 48
Under the agreement, the management services provided by SPIMS to the SP AusNet group include:
employee management
business management
evaluation of business opportunities
management of regulatory compliance and relations with regulator
financial and account management
management of IT
management and coordination of maintenance and engineering services
public and investor relations
legal and company secretarial services, and
general administration and company reporting49
According to SP AusNet, the management fees charged by SPIMS to the SP AusNet group under the agreement are comprised of:
a management services charge—which is to compensate SPIMS for the remuneration and other employment costs of SPIMS employees, and
a performance fee—which is to incentivise SPI Management Services to meet or better the financial and non-financial performance of SP AusNet and to align the interests of SPI Management Services with those of SP AusNet.50
Presumption threshold
Given the common ownership between SP AusNet and SPIMS, SP AusNet did not have an incentive to enter into an arms length arrangement with SPIMS. SP AusNet also acknowledges that that the services were not procured via a competitive tender.
48 SP AusNet, Regulatory proposal—Appendix (related party arrangements), p.22. 49 SP AusNet, Regulatory proposal—Appendix (related party arrangements), p.22. 50 SPI Electricity, Electricity distribution price review 2011-2015—Related party arrangements,
November 2009, p.16.
APPENDIX H––OUTSOURCING AND RELATED PARTY TRANSACTIONS 43
Accordingly, the AER cannot presume that the costs incurred by SP AusNet under the agreement reflect efficient costs or costs of a prudent operator in the circumstances of SP AusNet.
Related party margin
SP AusNet states that the management services charge to the SP AusNet group is based on the actual costs of the remuneration of the employees of SPIMS involved in the management of the SP AusNet group, and no margin is included. These costs are then allocated to each of the SP AusNet group’s networks via its activity based costing (ABC) allocation methodology. SP AusNet also states that the performance fee is not allocated to SP AusNet.51 As SPIMS provides management services to the SP AusNet group at cost, no related party margin issues arise in this situation. However, the AER had some concerns with the ABC allocation methodology used by the SP AusNet group to allocate these costs to SP AusNet and the other networks within the group. This issue is considered further in section 6.7.2.
H.4.3 IT services arrangement with Enterprise Business Services (Australia)
In September 2008, the SP AusNet group entered into an IT services agreement with Enterprise Business Services (Australia)(EB Services), a wholly-owned subsidiary of SPI Management Services. The agreement provides that EB Services is the exclusive provider of IT services to the SP AusNet group. The agreement is for an initial term of seven years and may be terminated early by the SP AusNet group in certain circumstances, subject to 12 months notice. A ‘transition plan’ was in place from the September 2008 until 31 March 2009, at which time the services provided by EB Services were in full operation.52
The IT services provided under the agreement include end-user computing, application services, managed services, and project and advisory services. The SP AusNet group has retained the provision of IT strategy and architecture, IT services management, and IT service level contract management.53
Presumption threshold
Given the common ownership between SP AusNet and EB Services, SP AusNet did not have an incentive to enter into an arm’s length arrangement with EB Services. SP AusNet also acknowledges that that the services were not procured via a competitive tender.54 Accordingly, the AER cannot presume that the costs incurred by SP AusNet under the agreement reflect efficient costs or costs of a prudent operator in the circumstances of SP AusNet.
51 SP AusNet, Regulatory proposal—Appendix (related party arrangements), p.23. 52 SP AusNet, Regulatory proposal—Appendix (related party arrangements), pp.25-26. 53 SP AusNet, Regulatory proposal—Appendix (related party arrangements), p.26. 54 SP AusNet, Regulatory proposal—Appendix (related party arrangements), p.26.
44 VICTORIAN DRAFT DISTRIBUTION DETERMINATION—DRAFT DECISION
Related party margin
SP AusNet states that the IT charges to the SP AusNet group are based on the actual costs of EB Services, and no margin is included. As EB Services providers services to the SP AusNet group at cost, no related party margin issues arise in this situation.
H.4.4 Capital works preferred supplier agreement with SPI (Australia) assets and subsidiaries
SPIAA, JAM and JAM (6) are parties to a capital works preferred supplier agreement with the SP AusNet group. [text removed—confidential].55
The services that may be awarded to the Jemena group under the agreement include asset replacement capital works, SP AusNet group initiated augmentation, fire mitigation and automation capital works, and various customer initiated capital works including public lighting.56
Presumption threshold
Given the common ownership between SP AusNet and the relevant entities in the Jemena group (i.e. SPIAA, JAM, JAM(6), SP AusNet did not have an incentive to enter into an arm’s length arrangement with these entities. SP AusNet also acknowledges that there was no tendering process in relation to the procurement of these services.57 Accordingly, the AER cannot presume that the costs incurred by SP AusNet under the agreement reflect efficient costs or costs of a prudent operator in the circumstances of SP AusNet.
Related party margin
The corporate costs of SPIAA, JAM and JAM (6) have already been factored into the base opex and capex forecasts—accordingly a margin to compensate for a share of the Jemena group’s overheads is not appropriate as it would over-recover these costs. Additionally, the AER is not aware of any assets owned and utilised by these Jemena group entities in providing services to SP AusNet which are not already contained within SP AusNet’s regulatory asset base. The existence of such assets would justify a margin being paid to these Jemena entities, but does not appear to apply here. Accordingly, following the AER’s approach set out in section 6.5.4, a case for a margin above SPIAA’s, JAM’s and JAM (6)’s actual costs has not been established.
[text removed—confidential].58 SP AusNet itself has explicitly removed the opex profit margin from the calculation of its efficient base year opex, and it states that the removal of this related party profit margin from its base year opex clearly demonstrates its opex forecast meets the prudency requirement in the NER.59 In contrast, SP AusNet has not removed the same profit margin from its capex forecast. The AER notes that the same prudency requirements in the NER apply to the opex and capex forecasts.
55 SP AusNet, Regulatory proposal—Appendix (related party arrangements), p.32. 56 SP AusNet, Regulatory proposal—Appendix (related party arrangements), pp.32-33. 57 SP AusNet, Regulatory proposal—Appendix (related party arrangements), p.33. 58 SP AusNet, Regulatory proposal—Appendix (related party arrangements), p.35. 59 SP AusNet, Regulatory proposal, pp.206-207.
APPENDIX H––OUTSOURCING AND RELATED PARTY TRANSACTIONS 45
In explaining why this profit margin has not been removed from the capex forecast, SP AusNet states:
SP AusNet is also of the opinion that the AER's definition if the related party does not have an "incurred cost" for each line of its charge then this should be treated as a profit margin is flawed. All companies whether regulated or unregulated would incur depreciation and cost of capital costs which would not always be revealed just by looking at the make-up of the charges and the statutory accounts. In SP AusNet's opinion related parties should be allowed a return of and return on capital invested just as non related parties include an allowance for these costs in determining their profit margin.60
The AER agrees with SP AusNet in that it also considers that the owners of a related party should have a reasonable opportunity to earn a return on and return of the capital the owners inject into the business. However, the AER's contention is that if these assets used by the related party to provide services to the DNSP are already contained within the DNSP's RAB, then the owners of the related party (who are the same owners as the DNSP) will already be receiving a return of and return on these assets. Unlike SP AusNet, the AER does not assume that assets used by the related party but not in the DNSP's RAB exist in all circumstances. Rather, the AER considers that it is up to the DNSP to demonstrate that there are assets utilised by its related party not in its RAB, and consequently assets where the owners of the related party are not receiving a return on and return of these assets.
H.4.5 Electricity distribution central region agreement with Tenix Alliance
SP AusNet, Tenix and Tenix Alliance were previously parties to a network services alliance agreement (NSAA), commonly referred to as the ‘t2 Alliance’. The t2 Alliance was contracted to perform most of the minor capital, operations and maintenance work on the SP AusNet group’s electricity and gas distribution networks.61
The NSAA was executed in 2003 for a period of five years with two five year extensions. The NSAA provided the SP AusNet group with the option to terminate the t2 Alliance on 31 March 2008 provided notice was given by 31 March 2007 [text removed—confidential].62
In September 2006, the SP AusNet group and Tenix agreed to terminate the NSAA effective 1 April 2008. [text removed—confidential].63 64
The SP AusNet group has established an installation service providers’ (ISP’s) panel. Tenix Alliance was appointed to the panel in August 2007, meaning that it can bid for projects on a competitive basis together with other contractors on the panel.
60 SP AusNet, RIN templates—Related party margins—22 March 2010, 23 March 2010, p.4. 61 SP AusNet, Regulatory proposal—Appendix (related party arrangements), p.37. 62 SP AusNet, Regulatory proposal—Appendix (related party arrangements), p.37. [text removed—
confidential]. 63 SP AusNet, Regulatory proposal—Appendix (related party arrangements), p.37. 64 SP AusNet, Regulatory proposal—Appendix (related party arrangements), p.38.
46 VICTORIAN DRAFT DISTRIBUTION DETERMINATION—DRAFT DECISION
After being appointed to the panel, SP AusNet awarded Tenix Alliance its electricity distribution central region agreement. The services provided by Tenix Alliance under the agreement include electricity distribution operations and maintenance, asset replacement, and capital works.
Presumption threshold
There is no common ownership between SP AusNet and Tenix Alliance that would incentivise SP AusNet to enter into a non-arm’s length agreement with Tenix Alliance. Further, the AER is not aware of any side-payments or other transactions between the parties that would lead SP AusNet to accept a contract from Tenix Alliance on non-arm’s length terms. Accordingly, the electricity distribution central region agreement passes the AER’s presumption threshold, and the AER can presume that the contract price under the agreement reflects efficient costs and the costs of a prudent service provider in the circumstances of SP AusNet.
[text removed—confidential].
Noting this possible limitation on the competitiveness of the electricity distribution central region agreement tender process, the AER considers that the agreement may still reasonably pass the presumption threshold, and therefore the AER may be able to presume that the contract price under the agreement reflects efficient costs and the costs of a prudent service provider in the circumstances of SP AusNet. Accordingly, the AER has not made any adjustments to the expenditure forecasts in respect of the margin in this agreement.
H.5 United Energy
H.5.1 Corporate structure and outsourcing arrangements
United Energy holds an electricity distribution licence for the areas of south-east Melbourne and the Mornington Peninsula.
United Energy is a wholly owned subsidiary of Power Partnerships, which in turn is a wholly owned subsidiary of United Energy Distribution Holdings.
UEDH is 66 per cent owned by Diversified Utility and Energy Trust (DUET).65 The remaining 34 per cent is owned by SPI (Australia) Assets Pty Ltd (SPIAA).66 SPIAA holds the assets that Singapore Power International (SPI) acquired in the SPI, Babcock & Brown Infrastructure, and Babcock & Brown Power takeover of Alinta Ltd.
Table H.4 sets out a timeline of significant events in the development of United Energy's corporate structure and contractual arrangements.
65 DUET No.1 and DUET No.2 each own 33 per cent of UEDH. 66 SPIAA’s economic interest in UEDH is via a loan note structure. Jemena Electricity Networks
(Vic), Regulatory Accounting Statements—Supplementary information to the 12 month 2008 calendar year regulatory accounts, 22 May 2009.
APPENDIX H––OUTSOURCING AND RELATED PARTY TRANSACTIONS 47
Table H.4 United Energy—Timeline of significant events
Date Event
11 May 1994 United Energy Ltd (UEL) incorporated
1 January 2001 2001-2005 regulatory control period begins
July 2003 DUET acquires a 66% shareholding in UEDH
14 July 2003 UEDH and Pacific Indian Energy Services enter into a management services agreement UEDH and AMP Capital Investors enter into a financial services agreement
15 July 2003 UEL ceases trading on ASX following 'reverse takeover' by Alinta Ltd and an increase in ownership from companies associated with AMP.
23 July 2003 United Energy, UEDH and Alinta Asset Management (AAM) enter into an operating services agreement (initial period ends 30 June 2006)
9 October 2003 UEL changed name to United Energy Distribution (United Energy)
1 January 2006 2006-2010 regulatory control period begins
1 July 2006 First renewal period of operating services agreement with AAM begins
1 September 2007 Alinta Ltd separated into several businesses following acquisition by a consortium comprising Singapore Power International (SPI), Babcock & Brown Infrastructure (BBI) and Babcock & Brown Power (BBP)
30 May 2008 United Energy commences proceedings against AAM (and the ESCV) in the Supreme Court of Victoria seeking provision of actual cost information from AAM and related matters
December 2008 BBI controlled Westnet Infrastructure Group sold its interest in UEDH to SPIAA
10 February 2009 Supreme Court of Victoria orders AAM to provide actual cost information to United Energy
H.5.2 Management, corporate and financial services provided by United Energy Distribution Holdings
United Energy's business model involves it outsourcing management, corporate and financial services to United Energy Distribution Holdings (UEDH), United Energy's immediate parent. UEDH provides some of these services itself, and further outsources other services to specialist providers which are related parties to United Energy, These further outsourcing arrangements are:
executive management services provided by Pacific Indian Energy Services (PIES) pursuant to a management services agreement (MSA)
treasury and financial services provided by AMP Capital Investors (AMPCI) pursuant to a financial services agreement (FSA), and
48 VICTORIAN DRAFT DISTRIBUTION DETERMINATION—DRAFT DECISION
management and investment services provided by DUET67
Presumption threshold
As United Energy is owned by UEDH, United Energy had an incentive to enter into a non-arm's length arrangement with UEDH. Further, given the common ownership between UEDH and PIES, AMPCI and DUET, UEDH had an incentive to enter into non-arm's length arrangements with these related parties when it further outsourced the services outlined above. Additionally, the AER understands that neither the arrangement between United Energy and UEDH, or the arrangements between UEDH and PIES, AMPCI or DUET were procured via a competitive open tendering process in a competitive market. Therefore, according to the presumption threshold outlined in section 6.5.2, the AER cannot presume that these arrangements reflect efficient costs or costs that would be incurred by a prudent operator in the circumstances of United Energy.
Related party margin
United Energy states that there is no profit margin added by UEDH in the services it provides itself to United Energy, nor is there any (further) profit margin in the services UEDH procures from related parties and on-provides to United Energy. Further, it is clear from United Energy's proposal, that there is no profit margin charged by PIES to UEDH. Accordingly no related party margin issues arise in relation to these services.
However, it is not clear whether or not a profit margin is added by AMPCI or DUET in the services it provides UEDH. A case for a profit margin in these arrangements has not been established. These arrangements are considered further in section 6.7.1.
H.5.3 Operating services agreement with Jemena Asset Management (current business model)
On 23 July 2003, United Energy and UEDH entered into an operating services agreement (OSA) with Jemena Asset Management (JAM). 68 The agreement specified an initial three year period ending on 30 June 2006, followed by a first renewal period of five years ending on 30 June 2011. Both dates occur six months into a new regulatory control period.
Under the agreement, JAM is the exclusive provider to United Energy of the services listed in the agreement. The scope of the services provided under the OSA are extensive and include network planning, construction, management, operation, maintenance and engineering as well as customer interface services. Initially, JAM also provided regulatory services to United Energy, however this function has transferred to Pacific Indian Energy Services on 1 April 2009 following an amendment to the agreement (discussed further below).
67 Specifically, the management and investment services are provided by AMPCI Macquarie
Infrastructure Management No.1 and AMPCI Macquarie Infrastructure Management No.2, as responsible entities for DUET. United Energy, Regulatory proposal--Appendix J1.
68 Specifically, the contract is with Jemena Asset Management (6) (JAM (6)). JAM (6) was previously known as Alinta Asset Management, and before that Alinta Network Services.
APPENDIX H––OUTSOURCING AND RELATED PARTY TRANSACTIONS 49
United Energy pays JAM a fixed annual opex fee which is adjusted annually in accordance with CPI and other factors (such as extreme weather events). JAM retains any savings in actual opex, or conversely bears any overspend. Capex fees are divided into fixed capital expenses and variable capital expenses and are subject to budgets which are prepared by JAM and submitted to United Energy for approval. The fixed capex fee is adjusted annually in a similar manner to the opex fee. The variable capex fee is calculated in accordance with a schedule of rates agreed annually between the parties.69
JAM acquires a number of services from other related parties in the Singapore Power group in order to facilitate its provision of services under the agreement.
Presumption threshold
While there is some common ownership between United Energy and JAM, there may not be an incentive for United Energy to enter into an arrangement with JAM on non-arm's length terms.
JAM is wholly owned by Singapore Power. Whereas, United Energy (through UEDH) is majority-owned by DUET and minority-owned by Singapore Power. In commenting on the establishment of the OSA, United Energy states:
DUET derives 66 cents in every dollar of earnings from UED. It follows that an uncommercial service agreement if it existed would damage that flow of earnings to DUET as the majority shakeholder of UED.70
As the AER stated in section 6.5.2, where a related party contractor is owned by a service provider's minority shareholder, the service provider's majority shareholder may not have an incentive to permit to the service provider to enter into a non-arm's length contract as any value or inflated profits transferred out of the service provider would not be to the benefit of the majority shareholder. This reasoning is consistent with United Energy's statement above.
However, the AER also noted that even in this scenario, where the negotiations over an operating services agreement did not occur independently of some other transaction, this lessens the assurance that contract term's reflect arm's length terms because the terms that one party is willing to accept for the operating agreement will be dependent on the terms of the other transaction.
69 On 10 October 2006, the OSA was amended to change the provisions relating to JAM’s power to
enter into contracts on behalf of United Energy. The previous agreement gave JAM power of attorney over United Energy and only required JAM to seek United Energy’s approval before incurring a liability on behalf of United Energy that was not in the ordinary course of providing the services specified in the agreement. The amended agreement withdrew the power of attorney and includes an acknowledgement that JAM is an independent contractor and not an agent or partner of United Energy. Under the amended agreement, JAM may only enter into agreements on behalf of United Energy that the United Energy board nominates from time to time by standing or specific resolution (other than use of system or connection agreements). The United Energy board has authorised JAM to enter into agreements that are in the normal course of business and do not commit United Energy to expenditure in excess of $100 000.
70 United Energy, Regulatory proposal--Appendix J1, p.8.
50 VICTORIAN DRAFT DISTRIBUTION DETERMINATION—DRAFT DECISION
The negotiations over the OSA occurred as part of a larger transaction involving an ownership re-organisation of United Energy known as the 'Shearwater transaction'.71 Further, United Energy acknowledges that JAM was appointed as the operator under the OSA without any tender process.72 Accordingly, under the presumption threshold set out in section 6.5.2, the AER cannot presume that the OSA fees reflect efficient costs or the costs that would be incurred by a prudent operator in the circumstances of United Energy.
Related party margin
The corporate costs of JAM have already been factored into the base opex and capex forecasts—accordingly a margin to compensate for a share of JAM's overheads is not appropriate as it would over-recover these costs.73 Additionally, the AER is not aware of any assets owned and utilised by JAM in providing services to United Energy which are not already contained within United Energy's regulatory asset base. The existence of such assets would justify a margin being paid to JAM, but does not appear to apply here. Accordingly, following the AER’s approach set out in section 6.5.4, a case for a margin above JAM's actual costs has not been established.
However, the AER notes that given the mostly fixed price nature of the OSA, and as a result of rising costs since the OSA was entered into, according to United Energy, JAM is currently making a loss in providing services under the agreement (referred to as a 'negative margin'). Accordingly, using JAM's actual costs results in a higher operating and capital expenditure forecasts than if the OSA fees were adopted.
On JAM's actual costs, the AER notes that under the WOBCA methodology depreciation costs associated with IT assets are being allocated by JAM to United Energy. These assets may be related to assets not already contained in United Energy's RAB. If this is the case then a margin reflecting the return on and return of these IT assets is appropriate. The IT depreciation would be the return of assets. These IT depreciation costs are currently reflected within United Energy's base opex, and consequently reflected in United Energy's forecast opex (under the AER's draft decision on United Energy's opex forecast).
At this stage the AER has not included a margin to reflect the return on these assets as it is not clear whether or not these assets are contained in United Energy's RAB or not. However, if United Energy is able to demonstrate in its revised proposal that these IT assets are not already included in the RAB, then the AER would, in its final 71 The 'Shearwater transaction' was a large series of transactions which involved: Power Partnership
(a company owned by Aquila and AMP) acquiring the remaining 42.95 per cent of shares in United Energy Limited that it did not previously own; Alinta and entities managed by AMP Henderson buying Aquila's 59.3 per cent interest in Power Partnership; Aquila selling its interests in its other Australian assets, namely an indirect holding in Alinta and its 48.2 per cent economic interest in the Multinet Partnership; AMP Henderson creating a new, wholesale diversified energy fund being DUET with the intention that DUET would be managed by AMP Henderson and would comprise two wholesale unit trusts whose securities would be stapled; and reorganising assets as between Alinta, United Energy and DUET. United Energy, Scheme booklet for the scheme of arrangement between United Energy Ltd and the holders of UEL shares in relation to the proposal with Power Partnership Pty Lid, 30 May 2003.
72 United Energy, Regulatory proposal--Appendix J1, pp.7-8 73 The AER notes that JAM's 2008 costs have been adopted for the purposes of this draft decision,
however these will be updated for JAM's 2009 costs in the final decision.
APPENDIX H––OUTSOURCING AND RELATED PARTY TRANSACTIONS 51
decision, allow a margin to reflect the return on these assets.74 However, if United Energy is not able to demonstrate that these assets are not already in United Energy's RAB, then the AER, in its final decision, would not accept these IT depreciation costs in the base opex forecasts under the assumption that these assets are already contained within United Energy's RAB.
H.5.4 Operating services agreement with ‘turnkey service provider’ (new business model)
When the first renewal period of the OSA with JAM ends on 30 June 2011, United Energy has informed the AER that it does not intend to renew this agreement. United Energy is taking the opportunity of the end of this agreement to move to a new business model. United Energy’s current and new business models are summarised in section 7.5.3.
As part of its move to a new business model, United Energy has advised that it will be separating its network into two geographical regions (that is, a northern and southern region). It has undertaken a tender process to appoint a ‘turnkey service provider’ that will manage and operate one of those regions and manage the contract for the other region which will be awarded to some other party.
In this section the AER assessing the contract with the turnkey service provider.
Presumption threshold
United Energy argues that its forecast has been ‘market-tested’ and so can be relied upon as being efficient. However, the AER notes that it is essentially only the tendered unit costs which have been market-tested with the other three components of its opex forecast estimated by United Energy. The AER has reviewed the tendering process and is reasonably satisfied with this process. However, the AER has concerns with each of the remaining three components of United Energy’s bottom up build of its costs.
The AER has reviewed United Energy’s tendering process and considers that the process adopted by United Energy appears reasonably competitive and involved a large number of applicants. That said, the AER has some concerns with the competitiveness of this process in relation to two clauses in the current JAM contract which:
provide JAM with a ‘right to match’ the terms of any future contract that replaces its existing contract; and
require any contractor that replaces JAM (or some other entity) to offer to purchase at least [c-i-c] per cent of United Energy (from Jemena) at a price determined by an independent valuer.
The AER considers that these clauses in the current contract may have dissuaded some applicants from participating in the tendering process or from rigorously 74 The AER notes that if United Energy is able to demonstrate that these IT assets are not already in
its RAB, an alternative form of compensation may be for these assets to be reported as capex and accordingly rolled into United Energy's RAB.
52 VICTORIAN DRAFT DISTRIBUTION DETERMINATION—DRAFT DECISION
competing for it under the knowledge that even if they were the preferred bidder JAM might exercise its right and end up with the contract. Additionally, the AER notes that JAM is currently disputing United Energy's interpretation of the 'right to match' clause. Part of this dispute is that JAM considers it has the right to re-tender for the entire scope of services currently provided under the OSA, and that if its exercises its right to match than United Energy is not able offer the second regional partner to a non-JAM entity. It is unclear whether or not the tender applicants were aware of this dispute in submitting their tenders, however if they were then this may have further dissuaded some applicants from participating or rigorously competing under the view that if JAM exercised its right to match than it would not even be awarded the second regional contract.
Additionally while there is not currently any common ownership between United Energy and the turnkey service provider, the interdependent negotiations between the OSA and the equity transfer lessens the extent that the AER can reasonably presume the OSA reflects arm’s length terms.
Notwithstanding the potential concerns the AER has over the competitiveness of the tendering process, and the interdependent negotiations involving the equity transfer, the fact that four consortia sought to be involved in the final stage of the tendering process indicates that the process was likely to have been reasonably competitive. Accordingly, the AER considers that the new agreement with the preferred tender passes the presumption threshold and the AER can presume that the contract charges under this contract reasonably reflect the efficient costs that would be incurred by a prudent operator in the circumstances of United Energy.
APPENDIX I—BENCHMARKING 53
I Benchmarking This appendix sets out the AER’s consideration of benchmarking issues that have been raised in its assessment of the Victorian Distribution Network Service Providers (DNSPs) regulatory proposals.
I.1 Rule requirements DNSPs are required to provide a forecast of the total opex required over the regulatory control period in order to achieve the operating expenditure (opex) objectives:
(1) meet or manage the expected demand for standard control services over that period
(2) comply with all applicable regulatory obligations or requirements associated with the provision of standard control services
(3) maintain the quality, reliability and security of supply of standard control services
(4) maintain the reliability, safety and security of the distribution system through the supply of standard control services.1
If the AER is satisfied that the total forecast opex for the regulatory control period reasonably reflects the opex criteria, then the AER must accept the forecast of the required opex. The opex criteria require that the total of the opex forecast reasonably reflects:
(1) the efficient costs of achieving the operating expenditure objectives; and
(2) the costs that a prudent operator in the circumstances of the relevant Distribution Network Service Provider would require to achieve the operating expenditure objectives
(3) a realistic expectation of the demand forecast and cost inputs required to achieve the operating expenditure objectives.2
In deciding whether or not the AER is satisfied the total of the opex forecast reasonably reflects the opex criteria it must have regard to the opex factors, including:
(1) Benchmark operating expenditure that would be incurred by an efficient Distribution Network Service Provider over the regulatory control period.3
The capex requirements, capex criteria, and the capital expenditure (capex) factors mirror those of opex, and are set out in clauses 6.5.7(a), 6.5.7(c) and 6.5.7(e) of the National Electricity Rules (NER).
1 NER, clause 6.5.6(a). 2 NER, cl.6.5.6(c). 3 NER, cl. 6.5.6(e).
54 VICTORIAN DRAFT DISTRIBUTION DETERMINATION—DRAFT DECISION
I.2 Benchmarking Performance Benchmarking can be defined as a process of comparison of some measure of actual performance against a reference or benchmark.4 There are many different approaches to benchmarking and the act of benchmarking can take many forms.
I.2.1 What is benchmarking?
The act of benchmarking can be defined as assessing performance against a benchmark and making meaningful comparisons between like activities. This benchmark can be defined as a standard for a particular activity or goal, often informed by the performance of an organisation recognised as the best in its field, or a group of peers, or a normative standard set by experts or community opinion.5
For the AER benchmarking is an analytical tool that can be used to assist with making judgements about the comparative performance and efficiency of firms. In the context of the NER, benchmarking can be defined as setting a standard against which something can be measured or judged.
I.2.2 Approaches to benchmarking performance
There are many different techniques and approaches to benchmarking efficiency, including:
process approaches
programming techniques
econometric (parametric) techniques
bottom up benchmarking
ratio analysis using a variety of ratios
time series, trend analysis and performance monitoring.
Process techniques attempt to assess efficiency using a comprehensive ‘bottom up’ technique. Process techniques are frequently employed by the AER in its investigations of regulated businesses.
Programming techniques include linear programming methods and statistical techniques. Data envelope analysis (DEA) is a commonly used technique that uses linear programming methods to determine (rather than estimate) the efficiency frontier of the sample using the respective inputs and outputs of the firms. Another linear programming technique is an index approach such as total factor productivity.
4 Mehdi, F., Fetz, A., Fillipini, M. Benchmarking and regulation in the electricity distribution sector,
Centre for Energy Policy and Economics, Swiss Federal Institute of Technology, p. 7. 5 ESCV, What Makes A Good Performance Monitoring Framework? Draft Background Paper No.
2, Local Government Performance Monitoring Framework, March 2010, p. I.
APPENDIX I—BENCHMARKING 55
Econometric (parametric) techniques involve estimating a cost or production frontier where the frontier is estimated based on the key drivers of cost, as selected by the modeller. Programming and econometric techniques are typically described as top down benchmarking techniques.
For capital expenditure, bottom up benchmarking may be used to compare firm’s unit costs with industry standard benchmark unit costs and through analytical models comparing firm’s performance in capex replacement across time and across the industry. Similarly in opex, benchmarking can inform the assessment of unit costs and analytical models can determine the specific drivers of each category of costs.
Ratio analysis uses a variety of ratios to compare like businesses. This form of analysis has been used by the AER, other regulators and consultants reviewing businesses.
Time series, trend analysis and performance monitoring benchmark businesses against key performance indicators (KPIs) through a performance reporting and monitoring regime that measures and monitors the relative performance of businesses at points in time and their rate of improvement over time.
Regulators have employed various forms of benchmarking, typically to inform regulatory outcomes but also as a direct determinant of regulatory outcomes. Regulators’ use of benchmarking can best be described as an aide to the making of informed judgements regarding the DNSPs’ operating and capital expenditures.
The Essential Services Commission of Victoria (ESCV) in 2004 commissioned work into the use of Total Factor Productivity (TFP) to regulate DNSPs in Victoria developed a forward work program for a staged introduction.6 Whilst the ESCV did not proceed with the use of TFP in the 2006-2010 Electricity Distribution Price Review (EDPR), the Victorian Minister for Resources and Energy has recently proposed a rule change that would allow the use of TFP in AER determinations.7 The rule change proposal is currently being assessed and reviewed by the Australian Energy Market Commission (AEMC).8
In the 2005 EDPR the ESCV used a revealed cost approach, relying on the incentive properties of the regulatory framework to set operating and capital expenditure allowances. More specifically, the DNSPs in Victoria are rewarded for revealing costs below the efficient benchmarks set by the regulator at each price review. For opex, the DNSPs and in turn customers benefit from the additional incentives provided through the efficiency carryover mechanism.9 The AER has also relied on the revealed cost
6 Cambridge Economic Policy Associates, Background to work on assessing efficiency for the 2005
distribution price control review for Ofgem, September 2003. http://www.esc.vic.gov.au/public/Energy/Regulation+and+Compliance/Reports+and+Investigations/Total+Factor+Productivity+(TFP)/
7 The Hon. Peter Batchelor, Minister for Energy and Resources (Victoria), Rule Change Proposal for Total Factor Productivity Methodology in Distribution, July 2008.
8 http://www.aemc.gov.au/Market-Reviews/Open/Review-Into-the-Use-of-Total-Factor-Productivity-for-the-Determination-of-Prices-and-Revenues.html
9 See chapter 13 for a discussion of the ECM.
56 VICTORIAN DRAFT DISTRIBUTION DETERMINATION—DRAFT DECISION
approach to setting opex and capex benchmarks that would be incurred by an efficient operator (see section I.3).
The United Kingdom’s (UK) Office of the Gas and Electricity Markets (Ofgem) uses benchmarking to directly inform their regulatory allowances.10 A key distinction with the UK experience though is that Ofgem has gone through an extensive process with industry to develop comprehensive sets of data to support and enable the benchmarking they undertake.
Regulators’ use of benchmarking is dependant on many things including:
the availability and quality of data
structure of regulatory regime, including legal requirements
sample size and similarity of firms within the sample that can be used to benchmark.
Availability and quality of data limits the benchmarking techniques that can be undertaken by the AER. For the AER to extend its use of benchmarking to include more complex approaches such as regression analysis and TFP, significant refinement of the availability and quality of data pertaining to DNSPs is required.11 See section I.3.5 below and I.9 on future directions for further discussion surrounding data issues and the AER’s Regulatory Information Notices (RINs).
I.3 AER approach to benchmarking
I.3.1 Role of Benchmarking
The AER recognises that it is must have regard to the benchmark expenditure (operating and capital) that an efficient regulated firm would incur over the course of the regulatory control period. The limitations of benchmarking however need to be carefully assessed and noted in considering how benchmarking is used in assessing and determining expenditure allowances.
The analysis in this appendix formed part of the considerations for the opex and capex chapters in the draft decision in that they have been used along side other analysis to arrive at conclusions made in relation to opex and capex allowances.
The AER and its consultants in this review have used a number of different forms of comparison such as benchmarking DNSPs' service performance against KPIs, benchmarked process approaches in the assessment of prudent and efficient expenditure proposals, benchmarked DNSPs proposed allowances against actual
10 Ofgem, Electricity Distribution Price Control Review Methodology and Initial Results Paper,
8 May 2009, p. 38-46. 11 This has been noted by the AEMC in their review of TFP, see AEMC, Review Into the Use of Total
Factor Productivity for the Determination of Prices and Revenues, Preliminary findings paper, December 2009, pp. 47-64. For an example of the data requirements and adjustments required to support regression analysis, see Cambridge Economic Policy Associates, Background to work on assessing efficiency for the 2005 distribution price control review, for Ofgem, September 2003, pp. 42-46.
APPENDIX I—BENCHMARKING 57
incurred expenditure and compare the relative performance of DNSPs using ratio analysis.12
The AER seeks to establish whether a firm can be considered efficient in its given circumstances and what level of expenditure (operating and capital) would be appropriate. This factor then becomes one of ten factors that the AER must weigh in arriving at a capex or opex allowance. The various benchmarking techniques as outlined above are employed by regulators and their advisors to assist in determining both elements of the applicable factor for capex or opex – that is whether a firm is efficient and whether the level of proposed expenditure meets an appropriate benchmark.
I.3.2 Capex
The AER uses a range of approaches to assess capital expenditure forecasts including elements of a process approach involving review of DNSPs policies and processes and a more detailed targeted review assessing justifications for specific projects.
The AER’s review of proposed capex includes elements of both a bottom up review (reinforcements) and a top down review (replacements), informed by consultants. To ensure that DNSPs incur only efficient expenditure the AER, and its consultants, review among other things:
the effectiveness of operating practices, procedures and asset management systems
the appropriateness of the capex forecasting methodology
the efficiency of labour and material costs used to forecast expenditures
the efficiency of the forecast capex for each year of the forthcoming regulatory control period, and whether there was any further scope for efficiencies.
The AER and its consultants consider, where applicable, whether the practices of the DNSPs under review are compatible with good electricity industry practice.
I.3.3 Opex
The regulatory regime administered by the AER uses the Efficiency Benefit Sharing Scheme (EBSS) to set a ‘revealed cost’ approach to establishing base year opex. The scheme operates with implicit assumptions that the DNSP is a prudent and efficient operator incurring efficient base year costs plus scale, input cost and step changes. These form the basis for forecasts of a prudent and efficient operator and rely on a historic benchmark that is assumed to be efficient given regime incentives.
I.3.4 S-factor
The s-factor incentive scheme benchmarks service standards and provides financial incentives to DNSPs to improve or maintain their network service performance. The
12 See section I.4.1for discussion of capex assessment and section I.4.2 for discussion of opex
assessment.
58 VICTORIAN DRAFT DISTRIBUTION DETERMINATION—DRAFT DECISION
scheme sets targets for DNSPs (for example, by setting the maximum number of minutes supply can be interrupted on any given part of the network, or by setting the maximum number of outages a customer can receive in a year without prior notification), against which the DNSPs' performance are measured for each year of the regulatory control period. Improvements in performance are rewarded with financial rewards and diminished performance incurs a financial penalty.
I.3.5 Key issues
The choice of benchmarks applied by the AER is directly related to the availability of quality data. The AEMC review of the TFP rule change proposal found that the AER would need access to better quality data before it could use TFP. Further, better quality data would also assist the AER in making determinations under the existing building block model.13 To use TFP to set regulatory allowances the AEMC found the AER would require at least eight years of continuous data across participating network services providers.14 The necessity of quality time series data to enable reliable TFP analysis is also applicable to the issue of benchmarking analysis undertaken by the AER under the building block approach.
For this review the AER has issued a revised RIN for use by the DNSPs in making their revised proposals. One benefit of this RIN will be to improve the data available from the Victorian DNSPs for the conduct of this review. In time improved data collection will also allow for additional benchmarking to be undertaken in future reviews exercises. This is discussed in further detail in section I.9 future directions.
I.4 Draft decision—Victorian reset The AER investigated a number of forms of benchmarking in considering the Victorian opex and capex forecasts for the forthcoming regulatory control period. With assistance from its consultants the AER undertook trend analysis, bottom up benchmarking, ratio analysis and reviews of policies and procedures to compare the efficiency of the opex and capex forecasts proposed by Victorian DNSPs.
In addition to the trend analysis of DNSPs expenditure in preceding regulatory periods conducted by the AER, the AER also engaged Nuttall Consulting to assist with the review of the efficiency of DNSPs capital expenditure. The AER found that:
ratio analysis of Victorian DNSPs with other NEM DNSPs indicates that their actual costs relative to non Victorian DNSPs are efficient
trend analysis indicates that Victorian DNSPs tend to over–forecast both capex and opex
actual costs of DNSPs as incurred in preceding regulatory periods are a better guide to forecast costs than DNSP forecasts
better data is required to further develop the AER’s approach to benchmarking.
13 AEMC, Review into the Use of Total Factor Productivity for the Determination of Prices and
Revenues, Preliminary findings paper, December 2009, pp. 47-64. 14 ibid., p. 49.
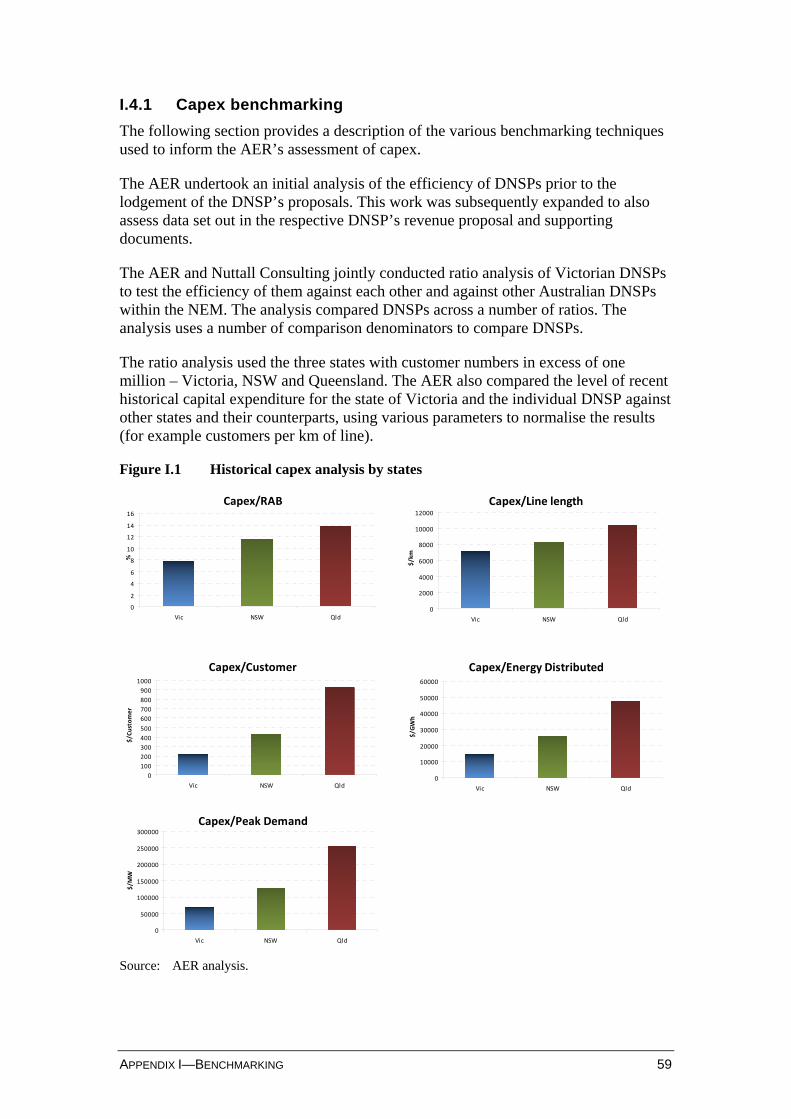
APPENDIX I—BENCHMARKING 59
I.4.1 Capex benchmarking
The following section provides a description of the various benchmarking techniques used to inform the AER’s assessment of capex.
The AER undertook an initial analysis of the efficiency of DNSPs prior to the lodgement of the DNSP’s proposals. This work was subsequently expanded to also assess data set out in the respective DNSP’s revenue proposal and supporting documents.
The AER and Nuttall Consulting jointly conducted ratio analysis of Victorian DNSPs to test the efficiency of them against each other and against other Australian DNSPs within the NEM. The analysis compared DNSPs across a number of ratios. The analysis uses a number of comparison denominators to compare DNSPs.
The ratio analysis used the three states with customer numbers in excess of one million – Victoria, NSW and Queensland. The AER also compared the level of recent historical capital expenditure for the state of Victoria and the individual DNSP against other states and their counterparts, using various parameters to normalise the results (for example customers per km of line).
Figure I.1 Historical capex analysis by states
Capex/RAB
0
2
4
6
8
10
12
14
16
Vic NSW Qld
%
Capex/Line length
0
2000
4000
6000
8000
10000
12000
Vic NSW Qld
$/km
Capex/Customer
0
100
200
300
400
500
600
700
800
900
1000
Vic NSW Qld
$/Customer
Capex/Energy Distributed
0
10000
20000
30000
40000
50000
60000
Vic NSW Qld
$/G
Wh
Capex/Peak Demand
0
50000
100000
150000
200000
250000
300000
Vic NSW Qld
$/M
W
Source: AER analysis.
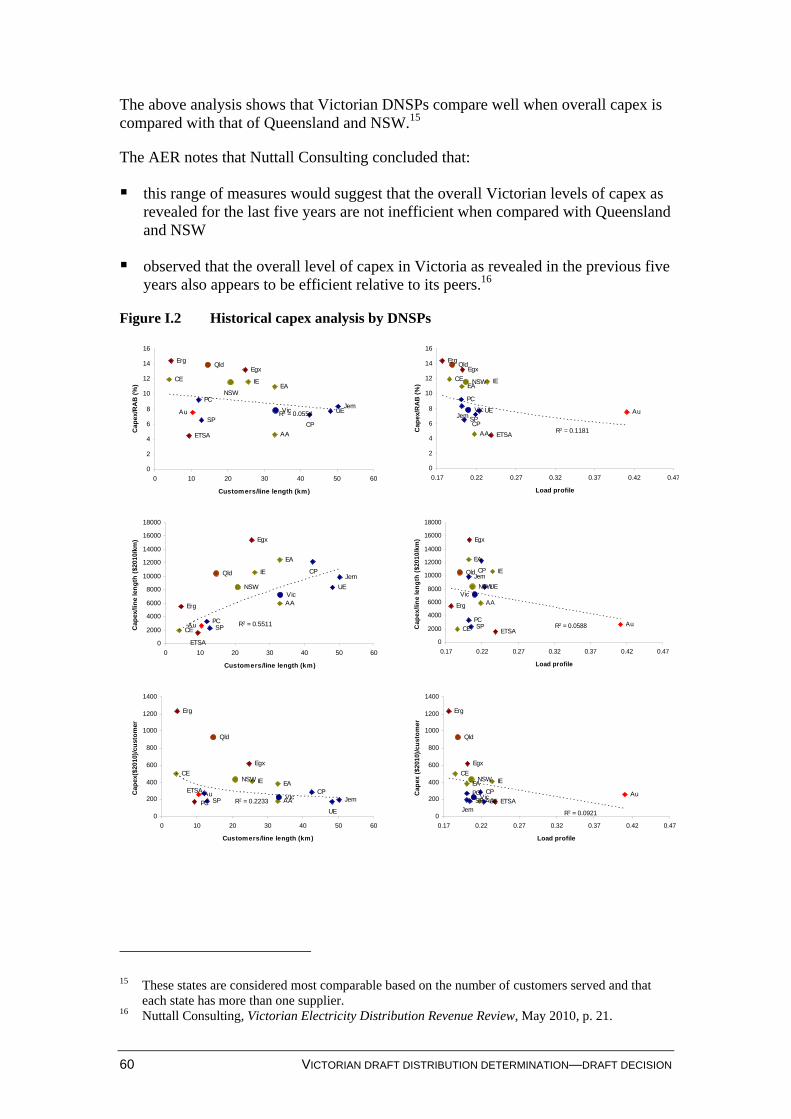
60 VICTORIAN DRAFT DISTRIBUTION DETERMINATION—DRAFT DECISION
The above analysis shows that Victorian DNSPs compare well when overall capex is compared with that of Queensland and NSW.15
The AER notes that Nuttall Consulting concluded that:
this range of measures would suggest that the overall Victorian levels of capex as revealed for the last five years are not inefficient when compared with Queensland and NSW
observed that the overall level of capex in Victoria as revealed in the previous five years also appears to be efficient relative to its peers.16
Figure I.2 Historical capex analysis by DNSPs
JemUE
CP
AA
EAIE
PC
SP
CE
EgxErg
ETSA
Au
NSW
Vic
Qld
R2 = 0.0554
0
2
4
6
8
10
12
14
16
0 10 20 30 40 50 60
Customers/line length (km)
Cap
ex/R
AB
(%
)
AuJem
UE
CP
AA
EAIE
PC
SP
CE
EgxErg
ETSA
Vic
NSW
Qld
R2 = 0.1181
0
2
4
6
8
10
12
14
16
0.17 0.22 0.27 0.32 0.37 0.42 0.47
Load profile
Cap
ex/R
AB
(%
)
Jem
UE
CP
AA
EA
IE
PCSPCE
Egx
Erg
ETSA
Au
Qld
NSWVic
R2 = 0.5511
0
2000
4000
6000
8000
10000
12000
14000
16000
18000
0 10 20 30 40 50 60
Customers/line length (km)
Cap
ex/li
ne
len
gth
($2
010/
km)
Jem
UE
CP
AA
EA
IE
PCSPCE
Egx
Erg
ETSAAu
NSWVic
Qld
R2 = 0.0588
0
2000
4000
6000
8000
10000
12000
14000
16000
18000
0.17 0.22 0.27 0.32 0.37 0.42 0.47
Load profile
Cap
ex/li
ne
len
gth
($2
010/
km)
AuETSA
Erg
Egx
CE
SPPC
IE EA
AACP
UE
JemVic
NSW
Qld
R2 = 0.2233
0
200
400
600
800
1000
1200
1400
0 10 20 30 40 50 60
Customers/line length (km)
Cap
ex($
2010
)/cu
sto
mer
AuETSA
Erg
Egx
CE
SPPC
IEEA
AACP
UEJem
Vic
NSW
Qld
R2 = 0.09210
200
400
600
800
1000
1200
1400
0.17 0.22 0.27 0.32 0.37 0.42 0.47
Load profile
Cap
ex (
$201
0)/c
ust
om
er
15 These states are considered most comparable based on the number of customers served and that
each state has more than one supplier. 16 Nuttall Consulting, Victorian Electricity Distribution Revenue Review, May 2010, p. 21.
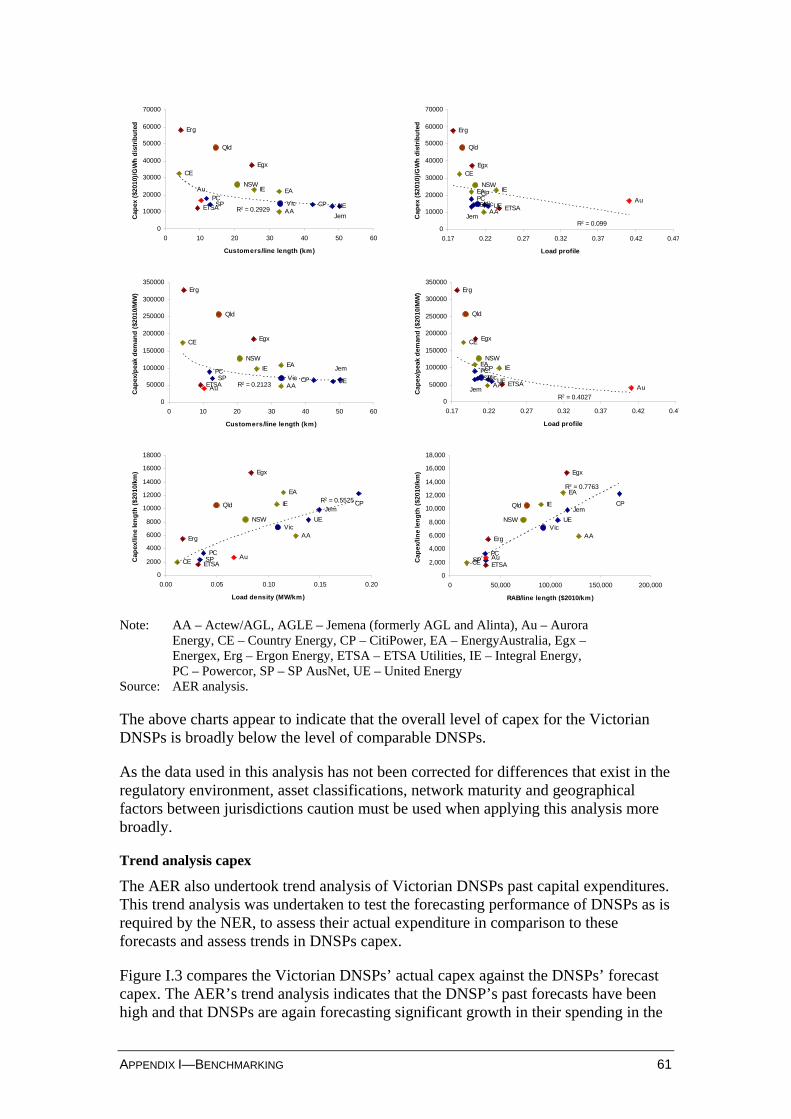
APPENDIX I—BENCHMARKING 61
Jem
UECPAA
EAIEPCSP
CEEgx
Erg
ETSA
Au
Qld
NSW
VicR2 = 0.2929
0
10000
20000
30000
40000
50000
60000
70000
0 10 20 30 40 50 60
Customers/line length (km)
Cap
ex (
$201
0)/G
Wh
dis
trib
ute
d
AuETSA
Erg
EgxCE
SPPC
IEEA
AA
CP
UE
Jem
Vic
NSW
Qld
R2 = 0.0990
10000
20000
30000
40000
50000
60000
70000
0.17 0.22 0.27 0.32 0.37 0.42 0.47
Load profile
Cap
ex (
$201
0)/G
Wh
dis
trib
ute
d
AuETSA
Erg
EgxCE
SPPC IE EA
AACP UE
Jem
Vic
NSW
Qld
R2 = 0.2123
0
50000
100000
150000
200000
250000
300000
350000
0 10 20 30 40 50 60
Customers/line length (km)
Cap
ex/p
eak
dem
and
($2
010/
MW
)
AuETSA
Erg
EgxCE
SPPC IEEA
AA
CP
UEJem
Qld
NSW
Vic
R2 = 0.40270
50000
100000
150000
200000
250000
300000
350000
0.17 0.22 0.27 0.32 0.37 0.42 0.47
Load profileC
apex
/pea
k d
eman
d (
$201
0/M
W)
AuETSA
Erg
Egx
CE SPPC
IE
EA
AA
CP
UE
Jem
VicNSW
QldR2 = 0.5525
0
2000
4000
6000
8000
10000
12000
14000
16000
18000
0.00 0.05 0.10 0.15 0.20
Load density (MW/km)
Cap
ex/li
ne
len
gth
($2
010/
km)
AuETSA
Erg
Egx
CESPPC
IE
EA
AA
CP
UE
Jem
VicNSW
Qld
R2 = 0.7763
0
2,000
4,000
6,000
8,000
10,000
12,000
14,000
16,000
18,000
0 50,000 100,000 150,000 200,000
RAB/line length ($2010/km)
Cap
ex/li
ne
len
gth
($2
010/
km)
Note: AA – Actew/AGL, AGLE – Jemena (formerly AGL and Alinta), Au – Aurora Energy, CE – Country Energy, CP – CitiPower, EA – EnergyAustralia, Egx – Energex, Erg – Ergon Energy, ETSA – ETSA Utilities, IE – Integral Energy, PC – Powercor, SP – SP AusNet, UE – United Energy
Source: AER analysis.
The above charts appear to indicate that the overall level of capex for the Victorian DNSPs is broadly below the level of comparable DNSPs.
As the data used in this analysis has not been corrected for differences that exist in the regulatory environment, asset classifications, network maturity and geographical factors between jurisdictions caution must be used when applying this analysis more broadly.
Trend analysis capex
The AER also undertook trend analysis of Victorian DNSPs past capital expenditures. This trend analysis was undertaken to test the forecasting performance of DNSPs as is required by the NER, to assess their actual expenditure in comparison to these forecasts and assess trends in DNSPs capex.
Figure I.3 compares the Victorian DNSPs’ actual capex against the DNSPs’ forecast capex. The AER’s trend analysis indicates that the DNSP’s past forecasts have been high and that DNSPs are again forecasting significant growth in their spending in the
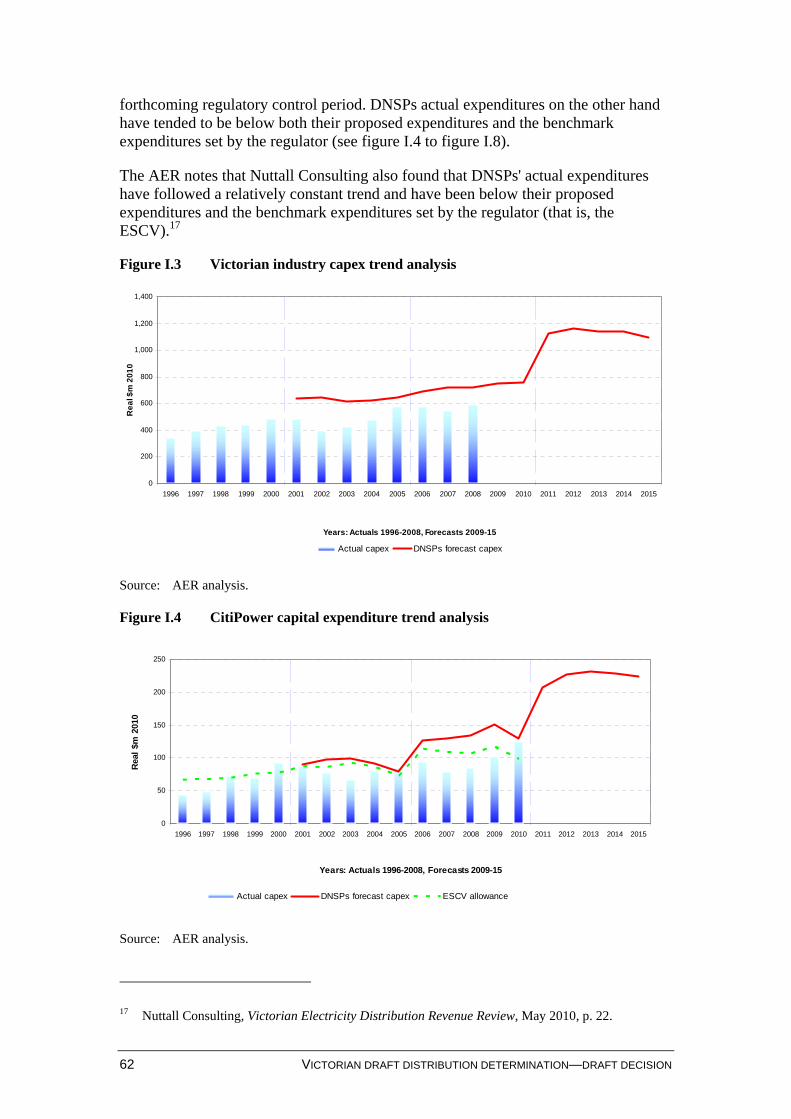
62 VICTORIAN DRAFT DISTRIBUTION DETERMINATION—DRAFT DECISION
forthcoming regulatory control period. DNSPs actual expenditures on the other hand have tended to be below both their proposed expenditures and the benchmark expenditures set by the regulator (see figure I.4 to figure I.8).
The AER notes that Nuttall Consulting also found that DNSPs' actual expenditures have followed a relatively constant trend and have been below their proposed expenditures and the benchmark expenditures set by the regulator (that is, the ESCV).17
Figure I.3 Victorian industry capex trend analysis
0
200
400
600
800
1,000
1,200
1,400
1996 1997 1998 1999 2000 2001 2002 2003 2004 2005 2006 2007 2008 2009 2010 2011 2012 2013 2014 2015
Years: Actuals 1996-2008, Forecasts 2009-15
Re
al $
m 2
01
0
Actual capex DNSPs forecast capex
Source: AER analysis.
Figure I.4 CitiPower capital expenditure trend analysis
0
50
100
150
200
250
1996 1997 1998 1999 2000 2001 2002 2003 2004 2005 2006 2007 2008 2009 2010 2011 2012 2013 2014 2015
Years: Actuals 1996-2008, Forecasts 2009-15
Rea
l $m
201
0
Actual capex DNSPs forecast capex ESCV allowance
Source: AER analysis.
17 Nuttall Consulting, Victorian Electricity Distribution Revenue Review, May 2010, p. 22.
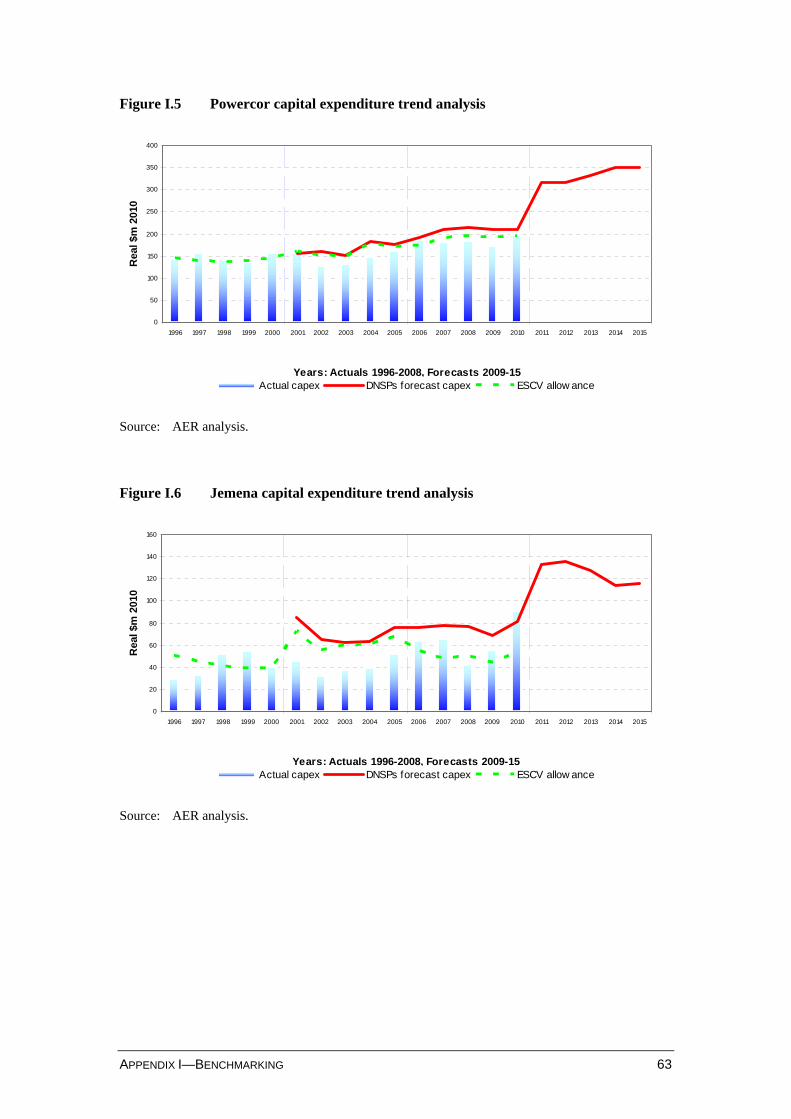
APPENDIX I—BENCHMARKING 63
Figure I.5 Powercor capital expenditure trend analysis
0
50
100
150
200
250
300
350
400
1996 1997 1998 1999 2000 2001 2002 2003 2004 2005 2006 2007 2008 2009 2010 2011 2012 2013 2014 2015
Years: Actuals 1996-2008, Forecasts 2009-15
Rea
l $m
201
0
Actual capex DNSPs forecast capex ESCV allow ance
Source: AER analysis.
Figure I.6 Jemena capital expenditure trend analysis
0
20
40
60
80
100
120
140
160
1996 1997 1998 1999 2000 2001 2002 2003 2004 2005 2006 2007 2008 2009 2010 2011 2012 2013 2014 2015
Years: Actuals 1996-2008, Forecasts 2009-15
Rea
l $m
201
0
Actual capex DNSPs forecast capex ESCV allow ance
Source: AER analysis.
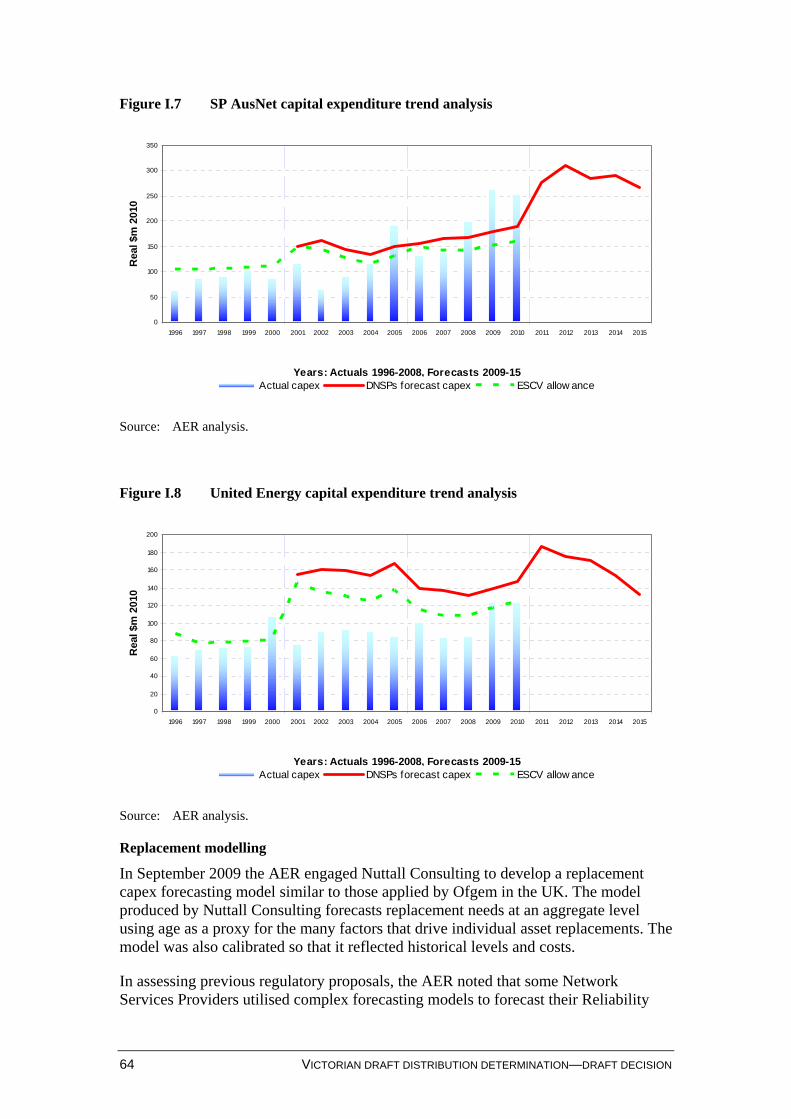
64 VICTORIAN DRAFT DISTRIBUTION DETERMINATION—DRAFT DECISION
Figure I.7 SP AusNet capital expenditure trend analysis
0
50
100
150
200
250
300
350
1996 1997 1998 1999 2000 2001 2002 2003 2004 2005 2006 2007 2008 2009 2010 2011 2012 2013 2014 2015
Years: Actuals 1996-2008, Forecasts 2009-15
Rea
l $m
201
0
Actual capex DNSPs forecast capex ESCV allow ance
Source: AER analysis.
Figure I.8 United Energy capital expenditure trend analysis
0
20
40
60
80
100
120
140
160
180
200
1996 1997 1998 1999 2000 2001 2002 2003 2004 2005 2006 2007 2008 2009 2010 2011 2012 2013 2014 2015
Years: Actuals 1996-2008, Forecasts 2009-15
Rea
l $m
201
0
Actual capex DNSPs forecast capex ESCV allow ance
Source: AER analysis.
Replacement modelling
In September 2009 the AER engaged Nuttall Consulting to develop a replacement capex forecasting model similar to those applied by Ofgem in the UK. The model produced by Nuttall Consulting forecasts replacement needs at an aggregate level using age as a proxy for the many factors that drive individual asset replacements. The model was also calibrated so that it reflected historical levels and costs.
In assessing previous regulatory proposals, the AER noted that some Network Services Providers utilised complex forecasting models to forecast their Reliability
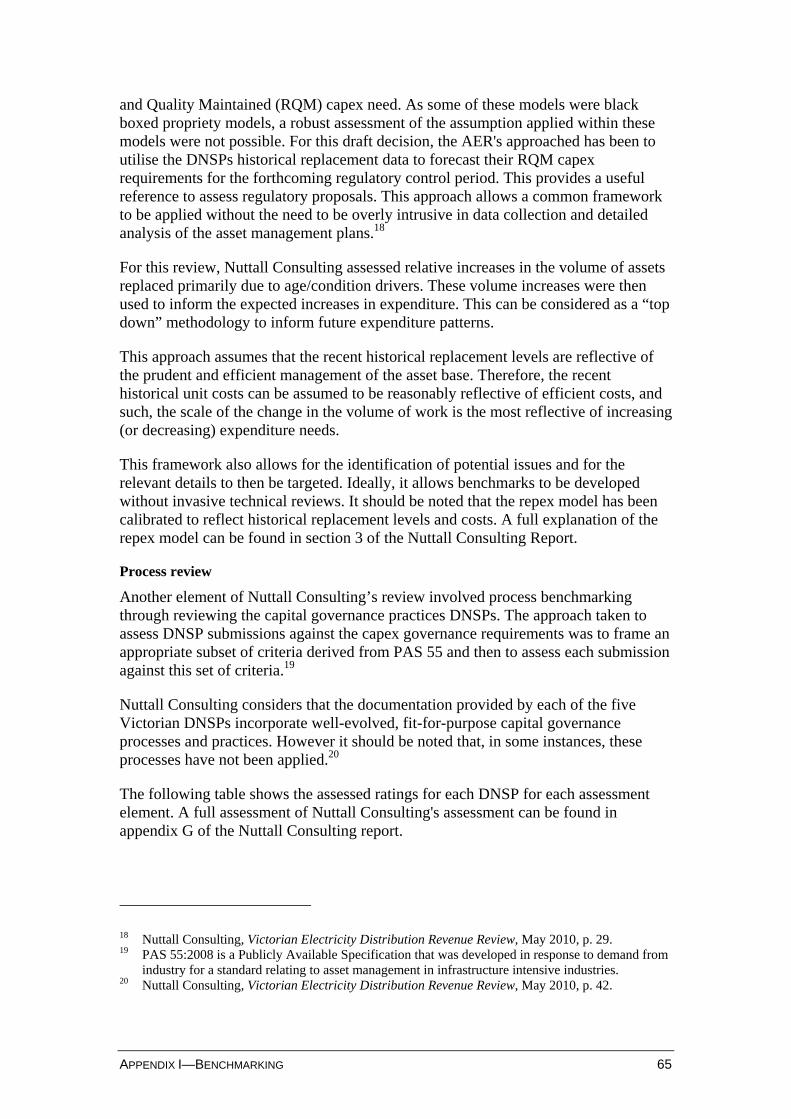
APPENDIX I—BENCHMARKING 65
and Quality Maintained (RQM) capex need. As some of these models were black boxed propriety models, a robust assessment of the assumption applied within these models were not possible. For this draft decision, the AER's approached has been to utilise the DNSPs historical replacement data to forecast their RQM capex requirements for the forthcoming regulatory control period. This provides a useful reference to assess regulatory proposals. This approach allows a common framework to be applied without the need to be overly intrusive in data collection and detailed analysis of the asset management plans.18
For this review, Nuttall Consulting assessed relative increases in the volume of assets replaced primarily due to age/condition drivers. These volume increases were then used to inform the expected increases in expenditure. This can be considered as a “top down” methodology to inform future expenditure patterns.
This approach assumes that the recent historical replacement levels are reflective of the prudent and efficient management of the asset base. Therefore, the recent historical unit costs can be assumed to be reasonably reflective of efficient costs, and such, the scale of the change in the volume of work is the most reflective of increasing (or decreasing) expenditure needs.
This framework also allows for the identification of potential issues and for the relevant details to then be targeted. Ideally, it allows benchmarks to be developed without invasive technical reviews. It should be noted that the repex model has been calibrated to reflect historical replacement levels and costs. A full explanation of the repex model can be found in section 3 of the Nuttall Consulting Report.
Process review
Another element of Nuttall Consulting’s review involved process benchmarking through reviewing the capital governance practices DNSPs. The approach taken to assess DNSP submissions against the capex governance requirements was to frame an appropriate subset of criteria derived from PAS 55 and then to assess each submission against this set of criteria.19
Nuttall Consulting considers that the documentation provided by each of the five Victorian DNSPs incorporate well-evolved, fit-for-purpose capital governance processes and practices. However it should be noted that, in some instances, these processes have not been applied.20
The following table shows the assessed ratings for each DNSP for each assessment element. A full assessment of Nuttall Consulting's assessment can be found in appendix G of the Nuttall Consulting report.
18 Nuttall Consulting, Victorian Electricity Distribution Revenue Review, May 2010, p. 29. 19 PAS 55:2008 is a Publicly Available Specification that was developed in response to demand from
industry for a standard relating to asset management in infrastructure intensive industries. 20 Nuttall Consulting, Victorian Electricity Distribution Revenue Review, May 2010, p. 42.
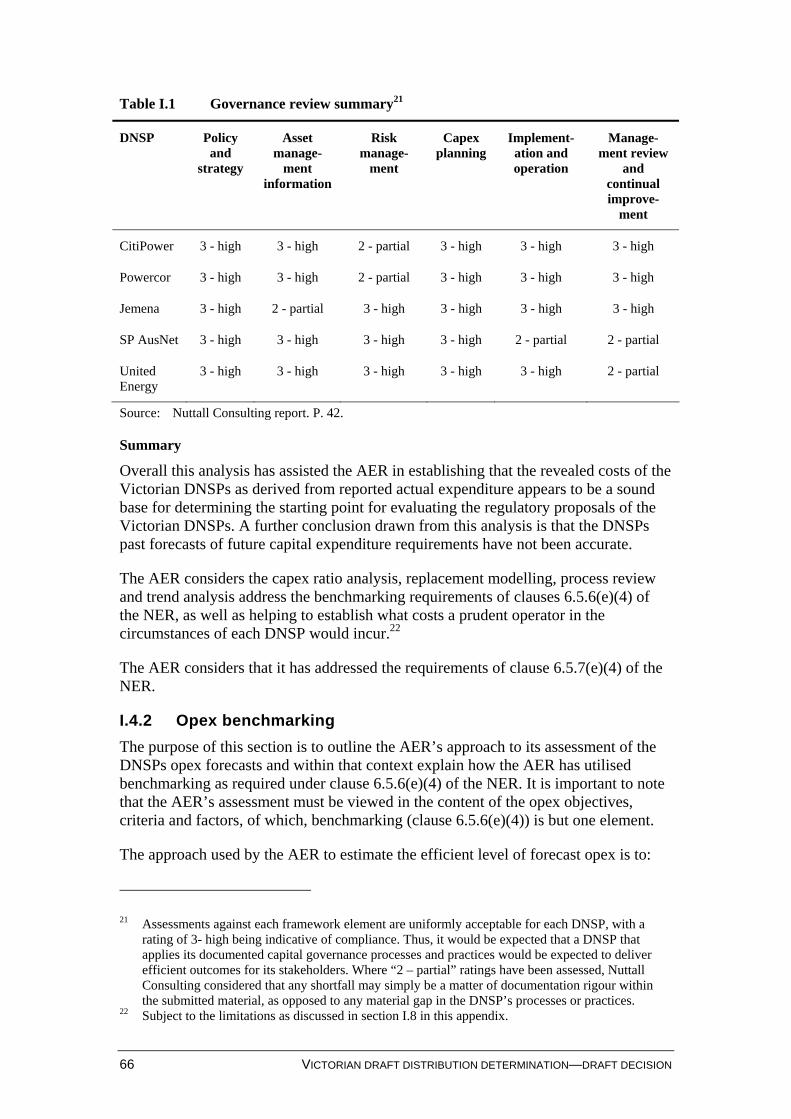
66 VICTORIAN DRAFT DISTRIBUTION DETERMINATION—DRAFT DECISION
Table I.1 Governance review summary21
DNSP Policy and
strategy
Asset manage-
ment information
Risk manage-
ment
Capex planning
Implement-ation and operation
Manage-ment review
and continual improve-
ment
CitiPower 3 - high 3 - high 2 - partial 3 - high 3 - high 3 - high
Powercor 3 - high 3 - high 2 - partial 3 - high 3 - high 3 - high
Jemena 3 - high 2 - partial 3 - high 3 - high 3 - high 3 - high
SP AusNet 3 - high 3 - high 3 - high 3 - high 2 - partial 2 - partial
United Energy
3 - high 3 - high 3 - high 3 - high 3 - high 2 - partial
Source: Nuttall Consulting report. P. 42.
Summary
Overall this analysis has assisted the AER in establishing that the revealed costs of the Victorian DNSPs as derived from reported actual expenditure appears to be a sound base for determining the starting point for evaluating the regulatory proposals of the Victorian DNSPs. A further conclusion drawn from this analysis is that the DNSPs past forecasts of future capital expenditure requirements have not been accurate.
The AER considers the capex ratio analysis, replacement modelling, process review and trend analysis address the benchmarking requirements of clauses 6.5.6(e)(4) of the NER, as well as helping to establish what costs a prudent operator in the circumstances of each DNSP would incur.22
The AER considers that it has addressed the requirements of clause 6.5.7(e)(4) of the NER.
I.4.2 Opex benchmarking
The purpose of this section is to outline the AER’s approach to its assessment of the DNSPs opex forecasts and within that context explain how the AER has utilised benchmarking as required under clause 6.5.6(e)(4) of the NER. It is important to note that the AER’s assessment must be viewed in the content of the opex objectives, criteria and factors, of which, benchmarking (clause 6.5.6(e)(4)) is but one element.
The approach used by the AER to estimate the efficient level of forecast opex is to:
21 Assessments against each framework element are uniformly acceptable for each DNSP, with a
rating of 3- high being indicative of compliance. Thus, it would be expected that a DNSP that applies its documented capital governance processes and practices would be expected to deliver efficient outcomes for its stakeholders. Where “2 – partial” ratings have been assessed, Nuttall Consulting considered that any shortfall may simply be a matter of documentation rigour within the submitted material, as opposed to any material gap in the DNSP’s processes or practices.
22 Subject to the limitations as discussed in section I.8 in this appendix.
APPENDIX I—BENCHMARKING 67
use a ‘base year’ cost which is typically actual audited opex in the last known year (that is, the penultimate year) of the current regulatory control period
add on any increased opex due to increases in the size of the network (referred to as scale escalators
add/subtract any real input cost changes above (or below) CPI over the regulatory control period (referred to as input cost escalators)
add/subtract any additional costs related to new or removed regulatory obligations (referred to as step changes).
The approach used by the AER to assess, and where necessary, estimate the efficient forecast level of opex involves drawing conclusions about the efficient ‘base level’ or ‘base year’ opex, and the rate at which the base will change over the forthcoming regulatory control period taking account of factors such as growth, real input costs and changes in regulatory obligations.
Firstly, the AER forms its conclusions about the base year expenditure and then turns its assessment to the proposed changes to apply to the base year. These two stages will be considered in turn below.
Base year expenditure
The AER considers that as the DNSPs are subject to commercial incentives, and where a DNSP is observed to be operating prudently then the audited base year costs can be regarded as efficient. The application of the EBSS ensures that there is an ongoing incentive for DNSPs to reduce costs.23 This ongoing incentive to reduce costs produces actual costs that reveal themselves as being efficient, hence the term ‘revealed costs’.
In reaching a conclusion about the efficiency of the revealed base year costs, the AER undertook a review of the actual and expected opex of the DNSPs as required under clause 6.5.6(e)(5) of the NER.
Ratio analysis opex
The following section provides a description of the various benchmarking techniques used to inform the AER’s assessment of opex.
The ratio analysis used the three states with customer numbers in excess of one million – Victoria, NSW and Queensland. The AER compared the level of recent historical opex for the state of Victoria and the individual DNSPs against other states and their counterparts, using various parameters to normalise the results (for example customers per km of line).
23 Or the Efficiency Carryover Mechanism (ECM) in Victoria. Consistent with the concept of
dynamic efficiency.
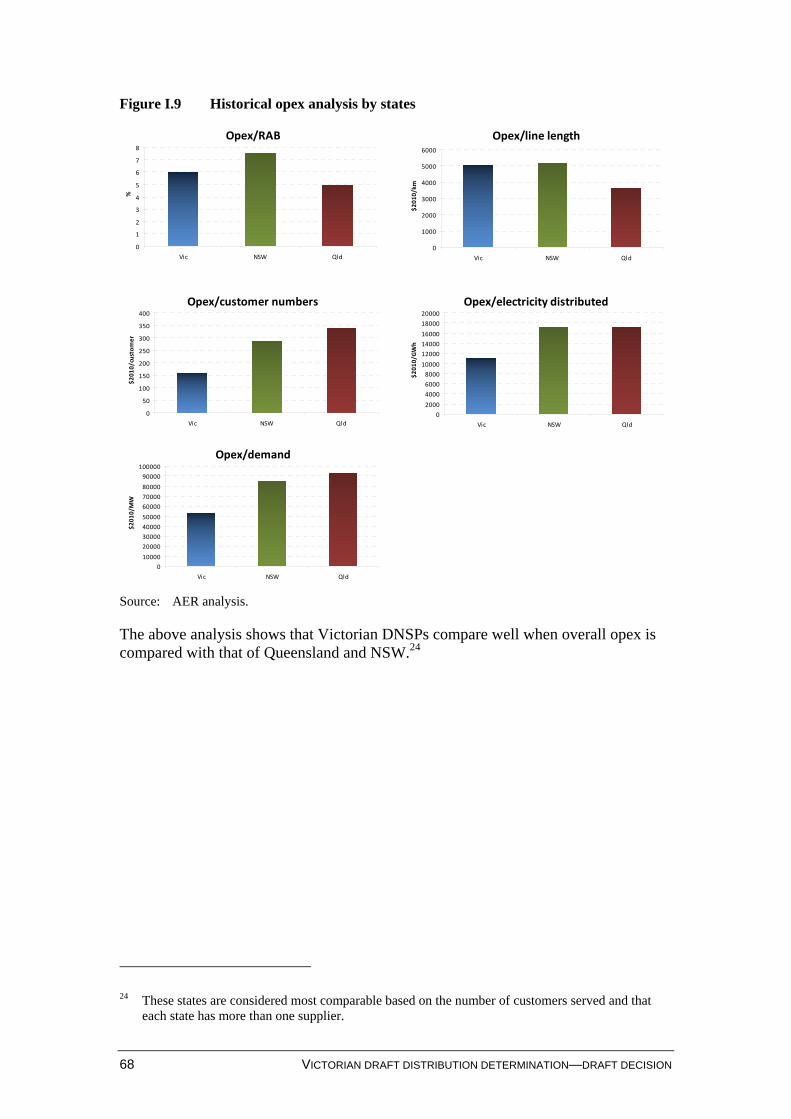
68 VICTORIAN DRAFT DISTRIBUTION DETERMINATION—DRAFT DECISION
Figure I.9 Historical opex analysis by states
Opex/RAB
0
1
2
3
4
5
6
7
8
Vic NSW Qld
%
Opex/line length
0
1000
2000
3000
4000
5000
6000
Vic NSW Qld
$2010/km
Opex/customer numbers
0
50
100
150
200
250
300
350
400
Vic NSW Qld
$2010/customer
Opex/electricity distributed
0
2000
4000
6000
8000
10000
12000
14000
16000
18000
20000
Vic NSW Qld
$2010/G
Wh
Opex/demand
0
10000
20000
30000
40000
50000
60000
70000
80000
90000
100000
Vic NSW Qld
$2010/M
W
Source: AER analysis.
The above analysis shows that Victorian DNSPs compare well when overall opex is compared with that of Queensland and NSW.24
24 These states are considered most comparable based on the number of customers served and that
each state has more than one supplier.
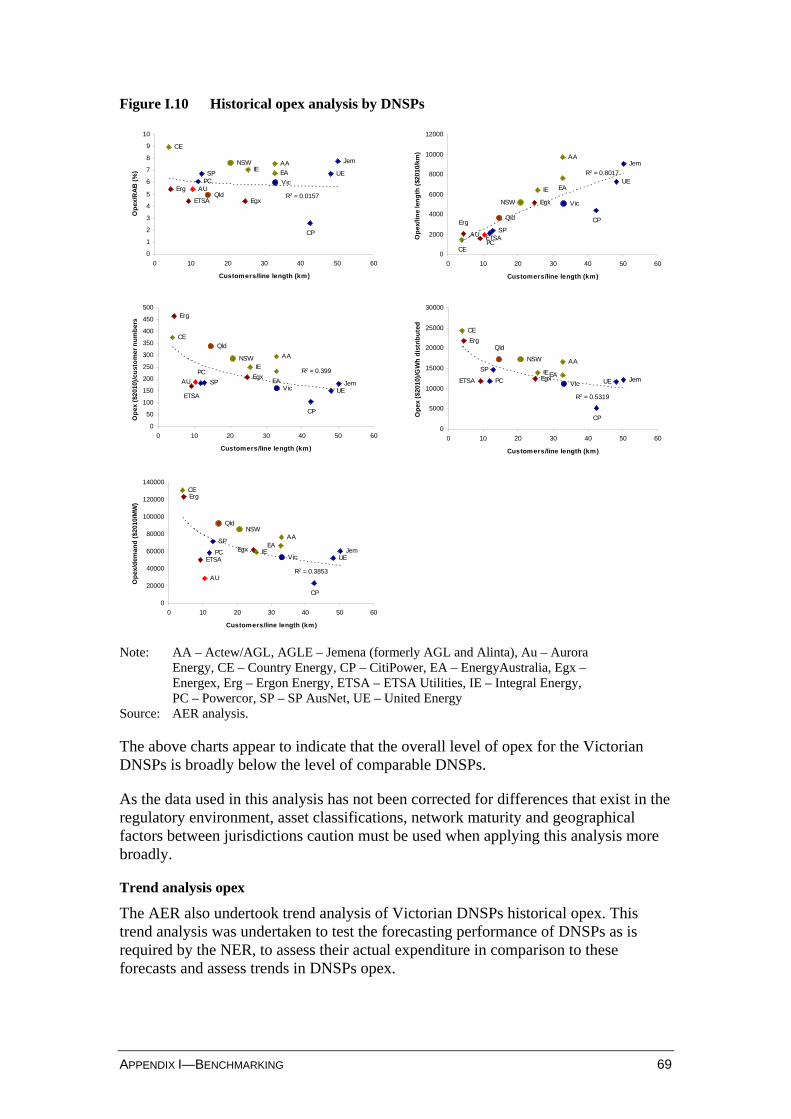
APPENDIX I—BENCHMARKING 69
Figure I.10 Historical opex analysis by DNSPs
AU
Jem
UE
CP
AA
EAIE
PCSP
CE
Egx
Erg
ETSA
NSW
Vic
Qld R2 = 0.0157
0
1
2
3
4
5
6
7
8
9
10
0 10 20 30 40 50 60
Customers/line length (km)
Op
ex/R
AB
(%
)
AU
Jem
UE
CP
AA
EAIE
PC
SP
CE
Egx
Erg
ETSA
NSW Vic
Qld
R2 = 0.8017
0
2000
4000
6000
8000
10000
12000
0 10 20 30 40 50 60
Customers/line length (km)
Op
ex/li
ne
len
gth
($2
010/
km)
AU JemUE
CP
AA
EA
IEPC
SP
CE
Egx
Erg
ETSA
NSW
Vic
Qld
R2 = 0.399
0
50
100
150
200
250
300
350
400
450
500
0 10 20 30 40 50 60
Customers/line length (km)
Op
ex (
$201
0)/c
ust
om
er n
um
ber
s
ETSA
Erg
Egx
CE
SP
PCIEEA
AA
CP
UE Jem
Qld
Vic
NSW
R2 = 0.5319
0
5000
10000
15000
20000
25000
30000
0 10 20 30 40 50 60
Customers/line length (km)
Op
ex (
$201
0)/G
Wh
dis
trib
ute
d
ETSA
Erg
Egx
CE
SP
PC IEEA
AA
CP
UEJem
AU
Qld
Vic
NSW
R2 = 0.3853
0
20000
40000
60000
80000
100000
120000
140000
0 10 20 30 40 50 60
Customers/line length (km)
Op
ex/d
eman
d (
$201
0/M
W)
Note: AA – Actew/AGL, AGLE – Jemena (formerly AGL and Alinta), Au – Aurora Energy, CE – Country Energy, CP – CitiPower, EA – EnergyAustralia, Egx – Energex, Erg – Ergon Energy, ETSA – ETSA Utilities, IE – Integral Energy, PC – Powercor, SP – SP AusNet, UE – United Energy
Source: AER analysis.
The above charts appear to indicate that the overall level of opex for the Victorian DNSPs is broadly below the level of comparable DNSPs.
As the data used in this analysis has not been corrected for differences that exist in the regulatory environment, asset classifications, network maturity and geographical factors between jurisdictions caution must be used when applying this analysis more broadly.
Trend analysis opex
The AER also undertook trend analysis of Victorian DNSPs historical opex. This trend analysis was undertaken to test the forecasting performance of DNSPs as is required by the NER, to assess their actual expenditure in comparison to these forecasts and assess trends in DNSPs opex.
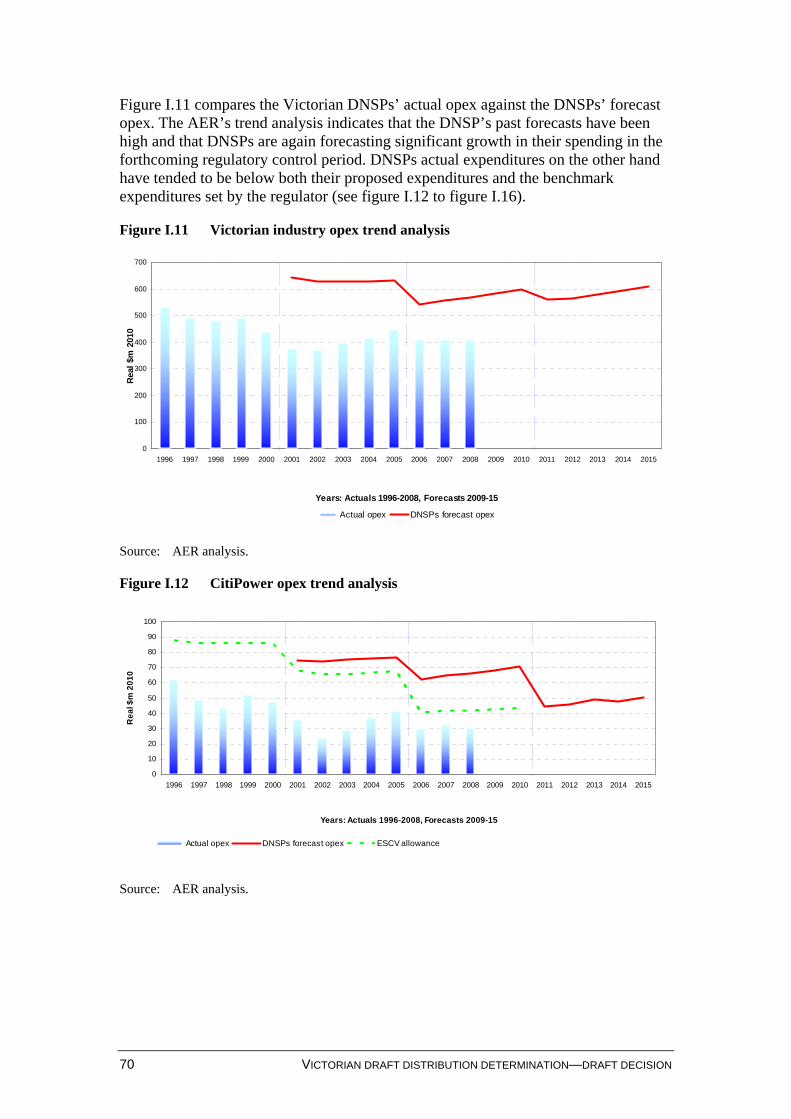
70 VICTORIAN DRAFT DISTRIBUTION DETERMINATION—DRAFT DECISION
Figure I.11 compares the Victorian DNSPs’ actual opex against the DNSPs’ forecast opex. The AER’s trend analysis indicates that the DNSP’s past forecasts have been high and that DNSPs are again forecasting significant growth in their spending in the forthcoming regulatory control period. DNSPs actual expenditures on the other hand have tended to be below both their proposed expenditures and the benchmark expenditures set by the regulator (see figure I.12 to figure I.16).
Figure I.11 Victorian industry opex trend analysis
0
100
200
300
400
500
600
700
1996 1997 1998 1999 2000 2001 2002 2003 2004 2005 2006 2007 2008 2009 2010 2011 2012 2013 2014 2015
Years: Actuals 1996-2008, Forecasts 2009-15
Rea
l $m
201
0
Actual opex DNSPs forecast opex
Source: AER analysis.
Figure I.12 CitiPower opex trend analysis
0
10
20
30
40
50
60
70
80
90
100
1996 1997 1998 1999 2000 2001 2002 2003 2004 2005 2006 2007 2008 2009 2010 2011 2012 2013 2014 2015
Years: Actuals 1996-2008, Forecasts 2009-15
Re
al $
m 2
01
0
Actual opex DNSPs forecast opex ESCV allowance
Source: AER analysis.
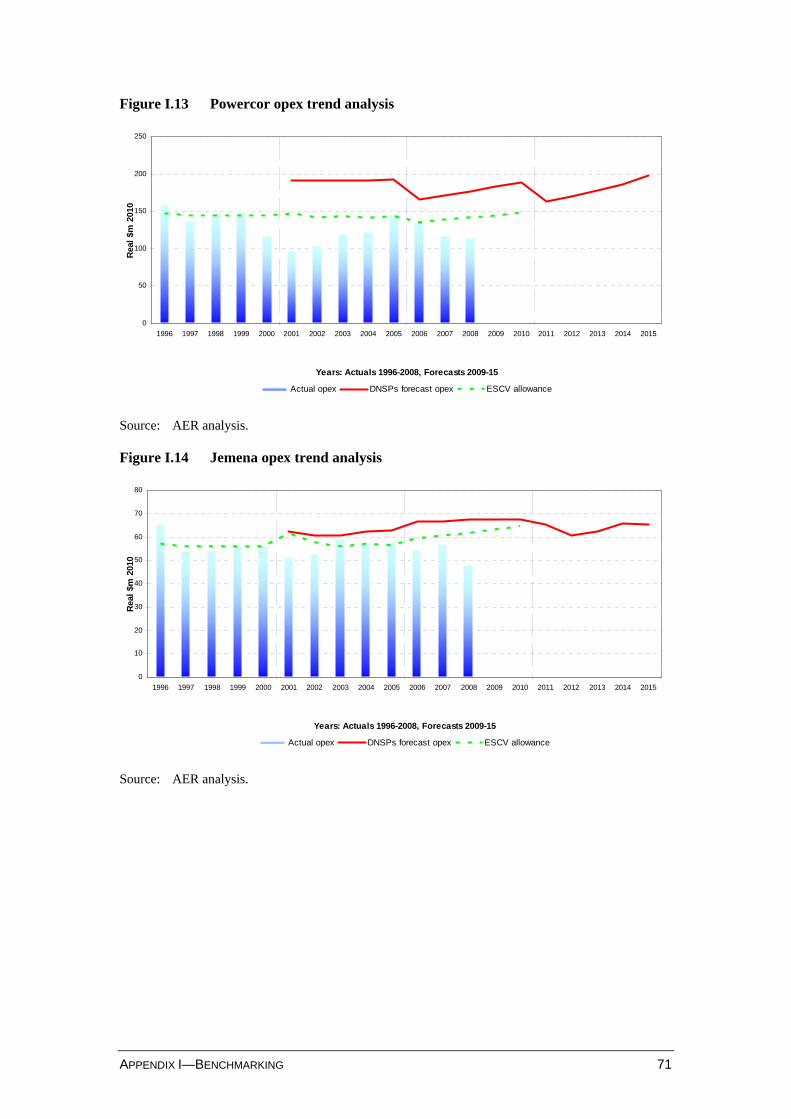
APPENDIX I—BENCHMARKING 71
Figure I.13 Powercor opex trend analysis
0
50
100
150
200
250
1996 1997 1998 1999 2000 2001 2002 2003 2004 2005 2006 2007 2008 2009 2010 2011 2012 2013 2014 2015
Years: Actuals 1996-2008, Forecasts 2009-15
Rea
l $m
201
0
Actual opex DNSPs forecast opex ESCV allowance
Source: AER analysis.
Figure I.14 Jemena opex trend analysis
0
10
20
30
40
50
60
70
80
1996 1997 1998 1999 2000 2001 2002 2003 2004 2005 2006 2007 2008 2009 2010 2011 2012 2013 2014 2015
Years: Actuals 1996-2008, Forecasts 2009-15
Rea
l $m
201
0
Actual opex DNSPs forecast opex ESCV allowance
Source: AER analysis.
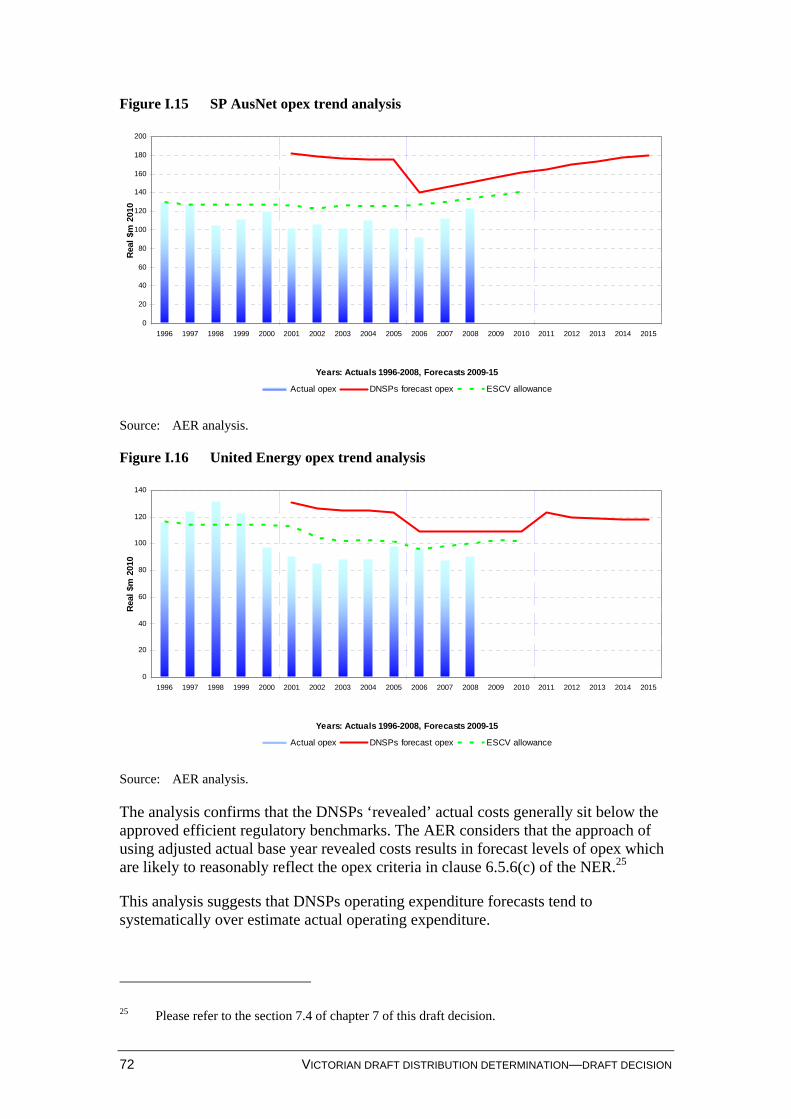
72 VICTORIAN DRAFT DISTRIBUTION DETERMINATION—DRAFT DECISION
Figure I.15 SP AusNet opex trend analysis
0
20
40
60
80
100
120
140
160
180
200
1996 1997 1998 1999 2000 2001 2002 2003 2004 2005 2006 2007 2008 2009 2010 2011 2012 2013 2014 2015
Years: Actuals 1996-2008, Forecasts 2009-15
Rea
l $m
201
0
Actual opex DNSPs forecast opex ESCV allowance
Source: AER analysis.
Figure I.16 United Energy opex trend analysis
0
20
40
60
80
100
120
140
1996 1997 1998 1999 2000 2001 2002 2003 2004 2005 2006 2007 2008 2009 2010 2011 2012 2013 2014 2015
Years: Actuals 1996-2008, Forecasts 2009-15
Rea
l $m
201
0
Actual opex DNSPs forecast opex ESCV allowance
Source: AER analysis.
The analysis confirms that the DNSPs ‘revealed’ actual costs generally sit below the approved efficient regulatory benchmarks. The AER considers that the approach of using adjusted actual base year revealed costs results in forecast levels of opex which are likely to reasonably reflect the opex criteria in clause 6.5.6(c) of the NER.25
This analysis suggests that DNSPs operating expenditure forecasts tend to systematically over estimate actual operating expenditure.
25 Please refer to the section 7.4 of chapter 7 of this draft decision.
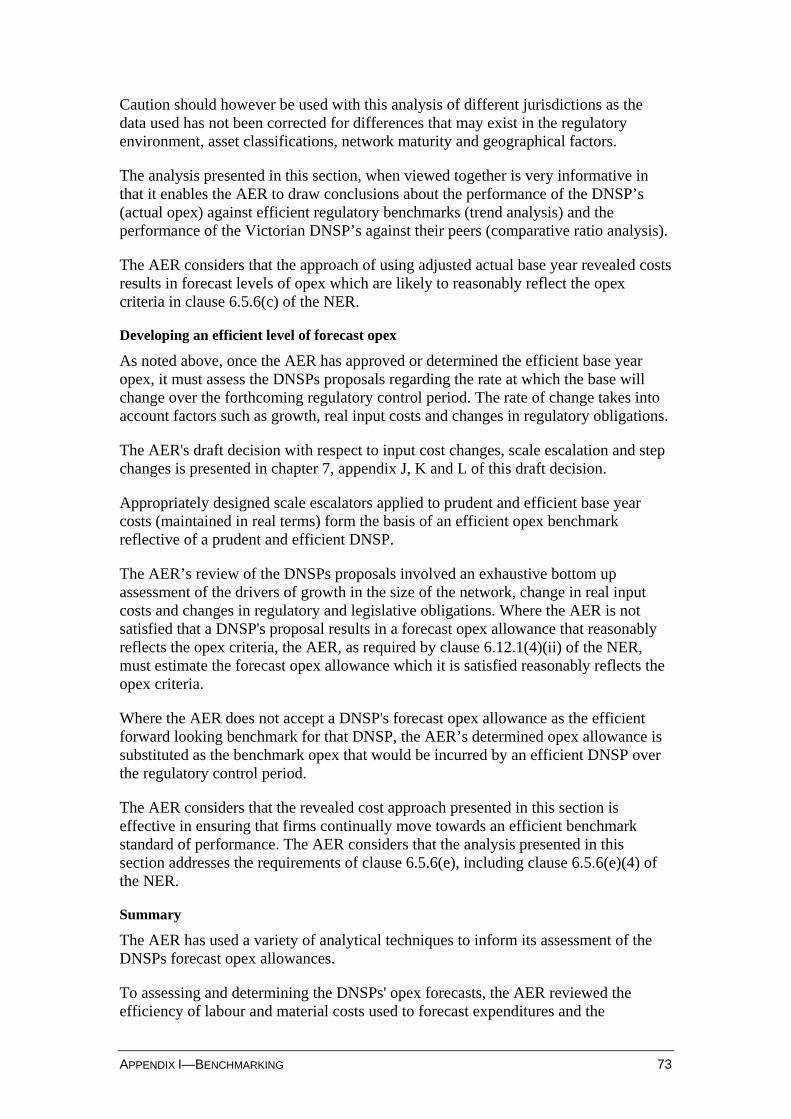
APPENDIX I—BENCHMARKING 73
Caution should however be used with this analysis of different jurisdictions as the data used has not been corrected for differences that may exist in the regulatory environment, asset classifications, network maturity and geographical factors.
The analysis presented in this section, when viewed together is very informative in that it enables the AER to draw conclusions about the performance of the DNSP’s (actual opex) against efficient regulatory benchmarks (trend analysis) and the performance of the Victorian DNSP’s against their peers (comparative ratio analysis).
The AER considers that the approach of using adjusted actual base year revealed costs results in forecast levels of opex which are likely to reasonably reflect the opex criteria in clause 6.5.6(c) of the NER.
Developing an efficient level of forecast opex
As noted above, once the AER has approved or determined the efficient base year opex, it must assess the DNSPs proposals regarding the rate at which the base will change over the forthcoming regulatory control period. The rate of change takes into account factors such as growth, real input costs and changes in regulatory obligations.
The AER's draft decision with respect to input cost changes, scale escalation and step changes is presented in chapter 7, appendix J, K and L of this draft decision.
Appropriately designed scale escalators applied to prudent and efficient base year costs (maintained in real terms) form the basis of an efficient opex benchmark reflective of a prudent and efficient DNSP.
The AER’s review of the DNSPs proposals involved an exhaustive bottom up assessment of the drivers of growth in the size of the network, change in real input costs and changes in regulatory and legislative obligations. Where the AER is not satisfied that a DNSP's proposal results in a forecast opex allowance that reasonably reflects the opex criteria, the AER, as required by clause 6.12.1(4)(ii) of the NER, must estimate the forecast opex allowance which it is satisfied reasonably reflects the opex criteria.
Where the AER does not accept a DNSP's forecast opex allowance as the efficient forward looking benchmark for that DNSP, the AER’s determined opex allowance is substituted as the benchmark opex that would be incurred by an efficient DNSP over the regulatory control period.
The AER considers that the revealed cost approach presented in this section is effective in ensuring that firms continually move towards an efficient benchmark standard of performance. The AER considers that the analysis presented in this section addresses the requirements of clause 6.5.6(e), including clause 6.5.6(e)(4) of the NER.
Summary
The AER has used a variety of analytical techniques to inform its assessment of the DNSPs forecast opex allowances.
To assessing and determining the DNSPs' opex forecasts, the AER reviewed the efficiency of labour and material costs used to forecast expenditures and the
74 VICTORIAN DRAFT DISTRIBUTION DETERMINATION—DRAFT DECISION
efficiency of the forecast opex for each year of the forthcoming regulatory control period. The AER considers that as the DNSPs are subject to commercial incentives, where a DNSP is observed to be operating prudently then audited base year unit costs can be regarded as efficient. The application of the EBSS ensures that there is a constant incentive for DNSPs to reduce costs. Appropriately designed scale escalators applied to prudent base year costs can then be used as reasonable comparators. The AER considers that this revealed cost approach is effective in ensuring that firms continually move towards an efficient standard of performance.
The AER concludes, on the basis of its top down and bottom up analysis, that Victorian DNSPs appear relatively efficient compared to other non-Victorian DNSPs. The AER considers the analysis presented in this section address the benchmarking requirements of clauses 6.5.6(e)(4) of the NER, as well as helping to establish what costs a prudent operator in the circumstances of each DNSP would incur.26
I.5 Summary of Victorian DNSP regulatory proposals United Energy and SP AusNet were the only DNSPs that included benchmarking analysis in their regulatory proposals.
United Energy
United Energy’s benchmarking compared DNSPs on five measures:27
total expenditure per customer from 2001 to 2015
capital expenditure per MWh of electricity distributed in 2009
capital expenditure per customer in 2009
unplanned SAIDI of a sample of DNSPs for 2007–08
actual and regulatory benchmark minutes off supply per customer.
Against the first three measures United Energy is shown to be one of the lowest costs DNSPs across the NEM with ETSA appearing similarly low cost in terms of capital expenditure. Whilst CitiPower, Powercor, Jemena and SP AusNet are shown to have higher costs than United Energy, their costs are still shown to be quite low in comparison with most of the other DNSPs across the NEM.
Against the fourth measure United Energy is also shown to be one of the best performing DNSPs and on the fifth measure United Energy is shown to beat the regulatory benchmark.
United Energy has suggested that Victorian DNSPs are relatively low cost against other DNSPs in the NEM and that United Energy is the least cost Victorian DNSP.
26 Subject to the limitations as discussed in section I.8 in this appendix. 27 United Energy, Regulatory Proposal for Distribution Prices and Services,
January 2011–December 2015, November 2009, pp. xiv-xvi, pp. 10-11 and pp. 13-14.
APPENDIX I—BENCHMARKING 75
SP AusNet
SP AusNet engaged SKM to benchmark DNSPs across a range of measures including:
total capital expenditure per energy sales
capital expenditure per total customer numbers
capital expenditure per line length
capital expenditure per maximum demand
capex/RAB ratio
opex per MWh
opex per customer
opex per line length
opex per maximum demand
SP AusNet’s opex relative to Wilson Cook composite size variable outputs.28
SP AusNet has suggested that Victorian DNSPs are relatively low cost against other DNSPs in the NEM and that SP AusNet is the most efficient rural DNSP in the NEM.
I.6 Submissions The Energy Users Association of Australia (EUAA) submitted that they consider that the AER has not applied the NER in relation to benchmarking of opex and capex during distribution reviews in NSW and transmission review in Tasmania and consider that the AER is incorrectly interpreting its benchmarking obligations.
The EUAA suggested that in determining the “efficient expenditure” of an efficient firm, the AER should develop a comparative analysis that uses established econometric and statistical techniques to develop systematic comparisons that take account of the exogenous and endogenous factors that affect a balanced comparison of one firm with another. This needs to be done to define the benchmark efficient opex against which the expenditure proposals of the Victorian DNSPs are to be compared. The evidence provided by this analysis then needs to be weighed (“had regard to)” by the AER in reaching its decision.29
The EUAA also suggested that the AER should closely examine the application of benchmarking in the UK, by its equivalent regulator, Ofgem30 and hope the AER
28 SP AusNet, Electricity Distribution Price Review, Regulatory Proposal, November 2009,
pp. 176-180 and pp. 198-204. 29 EUAA, AER Review of Victorian electricity distribution prices and distributors’ proposals for the
period 2011-2015, p. 15. 30 ibid., p. 17.
76 VICTORIAN DRAFT DISTRIBUTION DETERMINATION—DRAFT DECISION
fulfil the requirement under the NER to benchmark capex and opex expenditures in the Victorian review, having regard to Ofgem’s approach.
The Consumer Action Law Centre (CALC) recommended that the AER collate and make data available to stakeholders, including benchmark data, to enable them to more effectively comment on the DNSPs’ proposals.31 The Victorian Council of Social Services supported the recommendation by CALC for the AER to publish a full data set.
I.7 Issues and AER considerations
I.7.1 Rule requirements
The AER must be satisfied that the forecast expenditure proposed by DNSPs reflects the opex/capex criteria. Included in this is a consideration of the efficient costs of achieving the opex/capex objectives, a consideration of the costs a prudent operator in the circumstances of the relevant DNSP would require to achieve the opex/capex objectives and a consideration of the demand forecast and cost inputs required to achieve the opex/capex objectives.
If the AER is not satisfied that the forecast expenditure (opex or capex) proposed by the DNSPs reflects the opex/capex criteria, then it must substitute an amount that the AER is satisfied reasonably reflects the opex/capex criteria taking into account the opex/capex factors. While the AER must have regard to the benchmark expenditure that would be incurred by an efficient DNSP over the regulatory control period (as well as the other opex/capex factors), the AER must also be satisfied the estimate reflects the opex/capex criteria.32 This means the AER must acknowledge (among other things) the actual circumstances of the DNSP in question. The AER considers it may not solely provide an estimate of opex/capex based on what it has judged to be a benchmark. The AER provides its estimate based on a number of approaches, and in particular uses comparative cost analysis to ensure that the requirements of the NER are fulfilled.
I.7.2 Response to submissions
The AER does not consider that it has defined a role for benchmarking that is inconsistent with the rules, as the EUAA asserted. The AER acknowledges that the NER requires the AER to have regard to the benchmark opex/capex that would be incurred by an efficient DNSP over the regulatory control period. As the AER conducted benchmarking analysis, has been informed by the benchmarking analysis of its consultant Nuttall Consulting, and examined the consultants’ reports regarding benchmarking submitted by DNSPs, the AER considers that it has had regard to this factor when coming to its conclusions on the opex and capex allowances. Benchmarking was one component of the AER’s comparative analysis.
31 CALC, Submission to the Review of initial Distribution Network Service Providers' Proposals for
the 2011 - 2015 Regulatory Period, February 2010; VCOSS, Victorian electricity distribution network service providers' regulatory proposals, February 2010.
32 NER, cl.6.12.1(3) and 6.12.1(4).
APPENDIX I—BENCHMARKING 77
The AER does not come to a separate view on each and every opex and capex factor in isolation. Rather, the AER considers all the opex/capex factors and takes a holistic approach to determining reasonable forecasts of opex/capex over the regulatory control period that reflects the opex/capex criteria. The AER considers that as the NER requires the AER to have regard to all factors when determining whether it is satisfied that proposed expenditure reflects the opex/capex criteria, the AER must use its discretion when determining how much weight to place on each of those factors.
In relation to the EUAA’s comment on benchmarking undertaken by Ofgem, the AER can confirm it is aware of the Ofgem approach to benchmarking. A senior member of Ofgem’s regulatory team was seconded to the AER for 6 months and has assisted the AER in developing this draft decision.
Whilst lessons can be learned from Ofgem’s benchmarking of UK Distribution Network Operators (DNOs) there are a number of differences in the Australian regulatory regime and in Australian DNSPs. These differences need to be considered when coming to a view of the applicability of the approach used by Ofgem in its recent decisions to the Australian regulatory regime, which include:
the discretionary regulatory regime Ofgem operates under in the UK in comparison to the relatively prescriptive regime the AER operates under in Australia
the twenty years Ofgem has spent regulating DNOs and developing its approach to benchmarking in comparison to the recent formation of the AER and handover of regulatory control of DNSPs from State jurisdictional regulators
relatively homogenous DNOs in the UK that Ofgem regulate in comparison to the comparatively heterogonous DNSPs regulated by the AER in Australia.
I.7.3 Summary
The AER recognises that it is required to have regard to benchmark expenditure (opex and capex) that would be incurred by an efficient DNSP over the regulatory control period. The AER also notes that in considering the opex and capex factors, it becomes a matter of judgement as to the weighting given to the factors. It is not possible to view and come to a conclusion on each of the opex and capex factors in isolation. The AER considers all the opex and capex factors, and makes judgements based on a holistic approach.
The AER must come to a conclusion on the allowance to be given for opex and capex that is specific to each DNSP, taking into account benchmark costs that would be incurred by an efficient DNSP. The AER considers that, in addition to any established benchmark costs, under clauses 6.5.6(c)(2) and 6.5.7(c)(2) a DNSPs' circumstances are also relevant. When considering the allowance for each DNSP, the opex and capex factors do not stand alone but are considered together.
The AER considers that at the current time it cannot establish revenue allowances based primarily on the outcome of comparative benchmarking against other firms, as seems to be the EUAA’s preferred approach. When more standardised and appropriate data becomes available and benchmarking models give more consistent
78 VICTORIAN DRAFT DISTRIBUTION DETERMINATION—DRAFT DECISION
results, the weighting given to top down benchmarking as a part of the AER’s comparative analysis will likely increase.
However, in addition to the overarching regulatory framework and requirements of the NER under which the AER operates, there are inherent limitations in benchmarking techniques which must be recognised.
I.8 Limitations of benchmarking Benchmarking is a useful tool available to the AER to compare DNSPs. However benchmarking techniques require operating conditions to be accounted for so as to make firms more directly comparable.33 The limitations of benchmarking are frequently discussed in economic texts and were recently discussed in detail in the AER’s recent decisions for South Australia and Queensland electricity distribution.34 In most benchmarking models, where a firm appears less efficient than its peers, it will be unclear whether this difference is due to real inefficiency, data noise or a failure of the model to account for some firm-specific factor.35 In order to minimise this problem high quality data is needed.
Some of the general limitations of benchmarking and associated possible sources of error are:36
that the results obtained from the benchmarking are sensitive to the adopted method
that individual efficiency estimates remain sensitive to the assumptions regarding the adopted approach and model specification
errors in the assumptions of the technique used to normalise the data
errors in the selection of measured inputs and outputs (in particular, failing to correctly include relevant inputs or outputs)
errors in the measurement or aggregation of the inputs or outputs
errors in the assumptions about the information that can be obtained from relative productivity information and how that information is best extracted.
The AER notes the following specific limitations may affect comparisons based on the benchmarking undertaken for this reset:
33 Shuttleworth, G, “Benchmarking of electricity networks: Practical problems with its use for
regulation”, Utilities Policy 13, 2005, p. 311. 34 AER, Queensland distribution determination 2010–11 to 2014–15, Final decision, May 2010,
Appendix G and/or AER, South Australian distribution determination2010–11 to 2014–15, Final decision, May 2010, Appendix I.
35 Shuttleworth, G, “Benchmarking of electricity networks: Practical problems with its use for regulation”, Utilities Policy 13, 2005, p. 316.
36 Mehdi, F., Fetz, A., Fillipini, M. Benchmarking and regulation in the electricity distribution sector, Centre for Energy Policy and Economics, Swiss Federal Institute of Technology. Biggar, D. Understanding the Role for Relative Productivity Information in Natural Monopoly Regulation in Australia, November 2005 p. 30.
APPENDIX I—BENCHMARKING 79
the lumpiness of the capex programs
differing licensing requirements which exist between the NEM jurisdictions
differences in whether DNSPs buy or lease assets
differences in balance dates
variations in the characteristics of DNSPs (see I.8.1) and the age, size and maturity of their networks and the markets they serve
capitalisation, cost allocation and other accounting policies, as well as regulated service classifications, are assumed to be the same across all DNSPs, and across regulatory control periods in the sample
the sample includes a cross section of rural, urban and CBD DNSPs.
For this review the AER has found limitations in the available data that may preclude properly accounting for these factors, especially when making comparisons of business performance between DNSPs in different jurisdictions.
I.8.1 Characteristics of Victorian DNSPs
There are differences between DNSPs within the NEM and within Victorian DNSPs. The AER notes and attempts to take into account these differences when benchmarking DNSPs - when the available data permits. The differences that exist between DNSPs include the following variable factors:
the geography of service areas
customer density and usage characteristics
climatic conditions, including the duration and intensity of heatwaves and storms
the age, condition and structure of the networks
specific jurisdictional obligations.
It should be noted that NEM DNSPs cover quite different sized geographic areas, have businesses of quite different sizes and also have quite different characteristics.37 Table I.2 below details the forecast customer numbers, line length, energy delivered, and maximum demand for Victorian DNSPs for the forthcoming regulatory control period and also indicates that Victorian DNSPs have businesses of quite different sizes and characteristics.
37 AER, 2009 State of the energy market report p. 158 figure 6.1 which illustrates the detailed areas
covered by NEM DNSPs. Also see pp. 156-157 table 6.1 for details of the different characteristics of NEM DNSPs such as customer numbers, line length, energy delivered, and maximum demand etc.
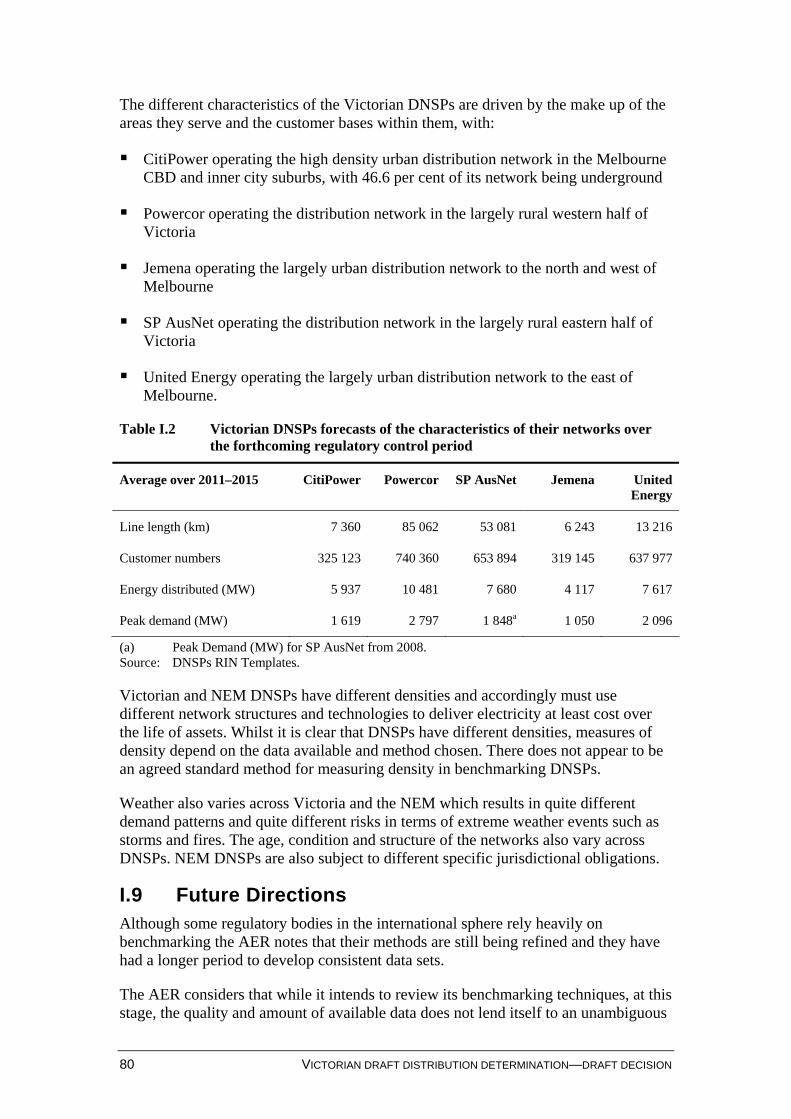
80 VICTORIAN DRAFT DISTRIBUTION DETERMINATION—DRAFT DECISION
The different characteristics of the Victorian DNSPs are driven by the make up of the areas they serve and the customer bases within them, with:
CitiPower operating the high density urban distribution network in the Melbourne CBD and inner city suburbs, with 46.6 per cent of its network being underground
Powercor operating the distribution network in the largely rural western half of Victoria
Jemena operating the largely urban distribution network to the north and west of Melbourne
SP AusNet operating the distribution network in the largely rural eastern half of Victoria
United Energy operating the largely urban distribution network to the east of Melbourne.
Table I.2 Victorian DNSPs forecasts of the characteristics of their networks over the forthcoming regulatory control period
Average over 2011–2015 CitiPower Powercor SP AusNet Jemena United Energy
Line length (km) 7 360 85 062 53 081 6 243 13 216
Customer numbers 325 123 740 360 653 894 319 145 637 977
Energy distributed (MW) 5 937 10 481 7 680 4 117 7 617
Peak demand (MW) 1 619 2 797 1 848a 1 050 2 096
(a) Peak Demand (MW) for SP AusNet from 2008. Source: DNSPs RIN Templates.
Victorian and NEM DNSPs have different densities and accordingly must use different network structures and technologies to deliver electricity at least cost over the life of assets. Whilst it is clear that DNSPs have different densities, measures of density depend on the data available and method chosen. There does not appear to be an agreed standard method for measuring density in benchmarking DNSPs.
Weather also varies across Victoria and the NEM which results in quite different demand patterns and quite different risks in terms of extreme weather events such as storms and fires. The age, condition and structure of the networks also vary across DNSPs. NEM DNSPs are also subject to different specific jurisdictional obligations.
I.9 Future Directions Although some regulatory bodies in the international sphere rely heavily on benchmarking the AER notes that their methods are still being refined and they have had a longer period to develop consistent data sets.
The AER considers that while it intends to review its benchmarking techniques, at this stage, the quality and amount of available data does not lend itself to an unambiguous
APPENDIX I—BENCHMARKING 81
interpretation of any one benchmarking model. A more detailed benchmarking exercise, such as that called for in some submissions, will require more standardised data from DNSPs, and over a longer time scale than the AER can currently access. Where further data over a longer time period is available, the AER will be able to utilise benchmarking to a greater degree.
The two most significant difficulties when considering benchmarking approaches are firstly, obtaining uniform and reliable cost data, and secondly, ensuring the approach and technique can account for the differences that may exist between firms being compared. Both of these difficulties are challenges for the AER in enhancing its future benchmarking of NSPs.
The AER has over time expanded its data collection and accordingly, application of benchmarking techniques to its investigations of capex and opex. The AER is continuing to establish policies, techniques and standardised systems and processes for benchmarking. The AER is also in the process of modifying RINs and the annual reporting regime to improve the data for robust benchmarking.
The AER’s refinement of benchmarking going forward will depend upon the extent to which this standardised data from NEM DNSPs is obtained. High quality comparable data allow comprehensive and useful benchmarking, whereas poor quality data casts doubt on the usefulness of benchmarking as an input into the cost assessment process.
DNSPs will need to adapt to new accounting guidelines to assist the AER in gathering comparable data. The AER intends to issue a revised RIN with this draft decision to facilitate improved data quality for the purpose of making the final decision. The changes correct some minor formulaic errors and collect additional information on capex, opex, escalators, STPIS parameters and demand forecasts using templates that have passed between the DNSPs and the AER in the investigation phase. The revised RIN is a precursor to the establishment of an on-going reporting framework that will improve the available data for future benchmarking exercises.
Progress and refinement of data collection and availability of data will dictate how the AER undertakes future benchmarking exercises. It will dictate whether the AER is able to make further use of regression analysis in both bottom up and top down benchmarking of opex, use the Ofgem approach to bottom up capital expenditure benchmarking, undertake DEA and further develop engineering/economic models to benchmark DNSPs.
As the AER works to improve its benchmarking models, it will continue its dialogue with stakeholders to construct models which can account for each DNSP’s specific cost drivers more effectively, and to gather the appropriate data for a more detailed exercise.
I.10 AER conclusion The AER considers that it has had regard to benchmarking, and utilised the information gained from its models in a suitable manner considering the limitations imposed by the current data.
82 VICTORIAN DRAFT DISTRIBUTION DETERMINATION—DRAFT DECISION
As required under clauses 6.5.6(e) and 6.5.7(e) of the NER, the AER has had regard to benchmark expenditure (opex and capex) that would be incurred by an efficient DNSP over the regulatory control period in coming to its conclusions on the forecast opex and capex allowances of the Victorian DNSPs. The AER will continue to develop more robust benchmarking techniques, and improve the quality of available information in order to expand its usage of benchmarking in evaluating opex and capex proposals.
APPENDIX J—SCALE ESCALATION 83
J Scale escalation
J.1 Introduction The approach used by the AER to estimate the efficient level of opex is to:
use a ‘base year’ cost, which is typically actual opex in the last known year (that is, the penultimate year) of the current regulatory control period
add any increased opex due to increases in the size of the network (referred to as scale escalators)
add (or subtract) any real cost changes above (or below) CPI over the regulatory control period (referred to as real cost escalators)
add (or subtract) any additional costs related to new or removed regulatory obligations (referred to as step changes).
The AER’s draft decision with respect to the DNSPs' opex forecasts (inclusive of each of the cost components above) is presented in chapter 7.
The AER’s draft decision on scale escalation is the subject of this appendix.
For the purpose of this draft decision, the base year opex from which the AER has applied scale and real cost escalators is 2010 and not the last year of known actuals (2009). The AER has relied on the benchmark efficiencies assumed by the Essential Services Commission of Victoria (ESCV) in its 2006 electricity determination price review (EDPR).1 See section 7.5.4 of chapter 7 for additional discussion. For the purpose of the AER’s assessment of the DNSP scale escalation proposals, the data has been analysed and presented from a base year of 2010.
All of the Victorian DNSPs (with the exception of United Energy) explicitly identified that the level of opex is linked to the size of the distribution network and that certain high level ‘scale factors’ should be applied to the revealed base year opex.
Scale escalation reflects the additional operating and maintenance activity required to service an expanding network. Real cost escalation ensures the opex allowance of servicing an expanding network is maintained in real terms.
The AER has addressed scale escalation in prior regulatory decisions (for example, ElectraNet2 and ETSA Utilities3) and notes the ESCV applied a network growth rate to the Victorian DNSPs for the current regulatory control period.4 In reaching the conclusions for this draft decision, the AER has given consideration to these prior decisions.
1 ESCV, Electricity distribution price review 2006–2010, vol. 1, October 2006. 2 AER, ElectraNet transmission determination, 2008–09 to 2012–13, Final decision, 11 April 2008. 3 AER, South Australia distribution determination, 2010–11 to 2014–15, Final decision, May 2010. 4 ESCV, EDPR, 2006–2010, vol. 1, October 2006, p. 212.
84 VICTORIAN DRAFT DISTRIBUTION DETERMINATION—DRAFT DECISION
J.2 Regulatory requirements Under clause 6.12.1(4) of the National Electricity Rules (NER), the AER must make a decision to accept or not accept the forecast opex included in a building block proposal. It must set out an estimate of the total of the DNSP’s required operating expenditure for the regulatory control period that it is satisfied reasonably reflects the operating expenditure criteria, taking into account the operating expenditure factors, as required by clause 6.5.6 and 6.12(4)(ii) of the NER.
Please refer to chapter 7 for a detailed discussion of the opex regulatory requirements.
J.3 Summary of Victorian DNSP regulatory proposals Scale escalation is typically expressed in terms of an annual rate of growth in opex resulting from an increase in the size of the distribution network. The annual growth rate is determined with reference to scale escalation or network growth drivers that are considered to approximate the resultant growth in the network and in-turn opex. The annual growth rate is used to escalate base opex and is typically adjusted to reflect identified economies of scale. These savings accrue to the DNSP (and in turn customers) from doing ‘more of the same’ operating and maintenance activities.
The Victorian DNSPs’ proposals can be broadly categorised according to the following three stages:
1. the selection of scale escalation or network growth drivers (for example, rate of growth in customer numbers)
2. the adjustment to the selected network growth drivers (for example, to incorporate economies of scale efficiency savings)
3. the adjusted or net scale escalation growth rate (for example, rate of growth in customer numbers net of adjustments) is applied annually over the forthcoming regulatory control period from the base year
For the remainder of this appendix the term ‘growth driver’ refers to the scale escalation or network growth driver (for example, customer numbers) identified as a proxy for growth in opex. The term ‘growth rate’ refers to the annual rate of change in the growth driver (for example, annual rate of change in customer numbers).
The Victorian DNSPs proposed a variety of growth drivers including: undepreciated network replacement cost, workforce numbers, workforce activity levels, customer numbers, energy consumption, peak demand, line length, the number of zone substations etc. The growth rates presented in table J.1 represent a weighted average of the proposed growth drivers from the 2010 base year.
The detailed break down of the DNSP’s proposed growth drivers is presented in conjunction with the AER’s assessment of the proposals (see section J.5.1 below).
The DNSP’s proposed the following growth rates, adjustments to those rates and scale opex increases for the forthcoming regulatory control period.
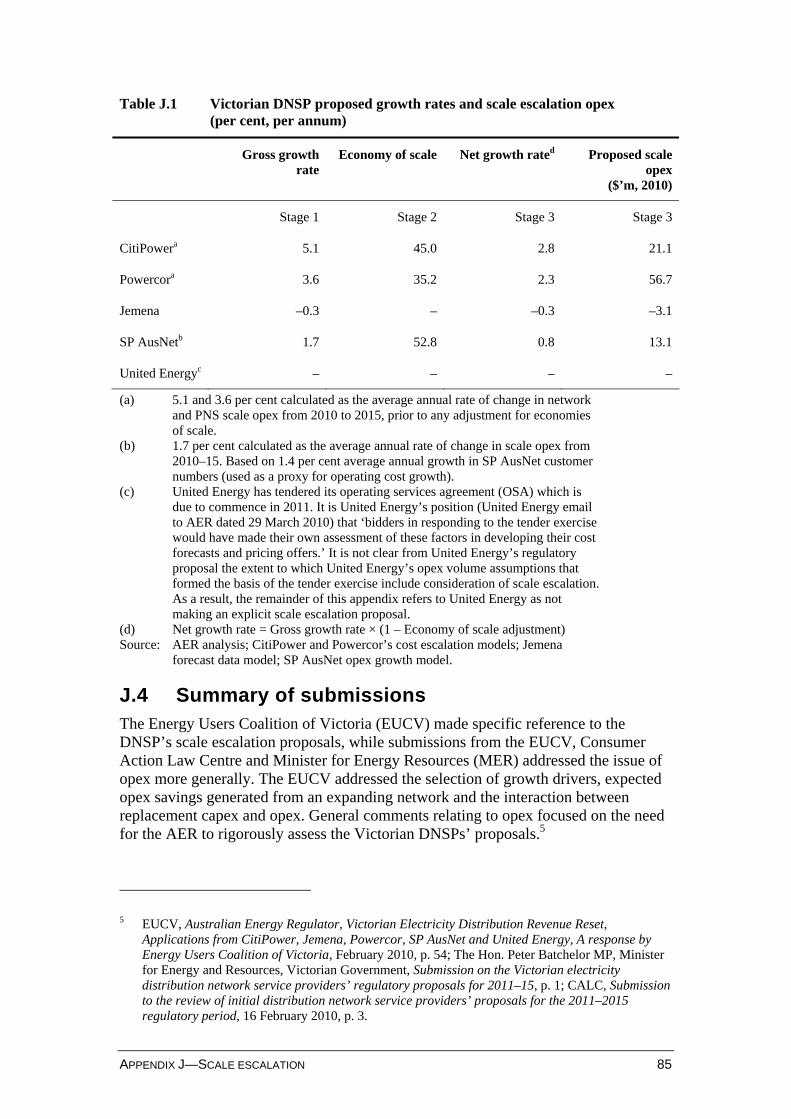
APPENDIX J—SCALE ESCALATION 85
Table J.1 Victorian DNSP proposed growth rates and scale escalation opex (per cent, per annum)
Gross growth rate
Economy of scale Net growth rated Proposed scale opex
($’m, 2010)
Stage 1 Stage 2 Stage 3 Stage 3
CitiPowera 5.1 45.0 2.8 21.1
Powercora 3.6 35.2 2.3 56.7
Jemena –0.3 – –0.3 –3.1
SP AusNetb 1.7 52.8 0.8 13.1
United Energyc – – – –
(a) 5.1 and 3.6 per cent calculated as the average annual rate of change in network and PNS scale opex from 2010 to 2015, prior to any adjustment for economies of scale.
(b) 1.7 per cent calculated as the average annual rate of change in scale opex from 2010–15. Based on 1.4 per cent average annual growth in SP AusNet customer numbers (used as a proxy for operating cost growth).
(c) United Energy has tendered its operating services agreement (OSA) which is due to commence in 2011. It is United Energy’s position (United Energy email to AER dated 29 March 2010) that ‘bidders in responding to the tender exercise would have made their own assessment of these factors in developing their cost forecasts and pricing offers.’ It is not clear from United Energy’s regulatory proposal the extent to which United Energy’s opex volume assumptions that formed the basis of the tender exercise include consideration of scale escalation. As a result, the remainder of this appendix refers to United Energy as not making an explicit scale escalation proposal.
(d) Net growth rate = Gross growth rate × (1 – Economy of scale adjustment) Source: AER analysis; CitiPower and Powercor’s cost escalation models; Jemena
forecast data model; SP AusNet opex growth model.
J.4 Summary of submissions The Energy Users Coalition of Victoria (EUCV) made specific reference to the DNSP’s scale escalation proposals, while submissions from the EUCV, Consumer Action Law Centre and Minister for Energy Resources (MER) addressed the issue of opex more generally. The EUCV addressed the selection of growth drivers, expected opex savings generated from an expanding network and the interaction between replacement capex and opex. General comments relating to opex focused on the need for the AER to rigorously assess the Victorian DNSPs’ proposals.5
5 EUCV, Australian Energy Regulator, Victorian Electricity Distribution Revenue Reset,
Applications from CitiPower, Jemena, Powercor, SP AusNet and United Energy, A response by Energy Users Coalition of Victoria, February 2010, p. 54; The Hon. Peter Batchelor MP, Minister for Energy and Resources, Victorian Government, Submission on the Victorian electricity distribution network service providers’ regulatory proposals for 2011–15, p. 1; CALC, Submission to the review of initial distribution network service providers’ proposals for the 2011–2015 regulatory period, 16 February 2010, p. 3.
86 VICTORIAN DRAFT DISTRIBUTION DETERMINATION—DRAFT DECISION
The EUCV suggested that a closer examination of the impact the various growth drivers have on opex was required.6 Specific reference was made to the use of consumption as a driver and the negligible impact on opex from existing customer consumption growth as opposed to the physical extension of the network:
If the new customers extend the geographical area serviced, then it is likely that the increase will result in more opex. If, however, the increased number result from increasing density of customers (e.g. if a house is pulled down and replaced with units) then the increase in opex is marginal at most. 7
If the increased demand is purely managed by increasing assets sizes in an existing network (especially if old undersized assets are replaced by larger but new assets) then the increase in demand has little impact on opex required. 8
The EUCV also recognised that the level of renewal capex is likely to have an impact on operating and maintenance activity:9
With the increase in capex for refurbishment, there must be a proportionate reduction in opex, as this is what justifies the replacement of old assets with new assets.
J.5 Issues and AER considerations In assessing the proposed growth rates, it is important to establish a framework to ensure that the AER is able to assess and determine whether it is satisfied the forecasts reasonably reflect the opex criteria in clause 6.5.6(c) of the NER. In reaching its draft decision, the AER must have regard to a variety of factors including (but not limited to) information provided in the Victorian DNSPs’ building block proposals, stakeholder submissions, relevant publicly available information, actual and expected operating expenditure and the substitution of capital and operating expenditure.
The structure of this appendix is outlined below.
The DNSPs' proposed growth drivers (for example, rate of growth in customer numbers) are presented and assessed in section J.5.1.
Section J.5.2 examines the DNSPs' proposed adjustments to the selected growth drivers, including adjustments for:
economies of scale (that is, opex grows at a rate less than the growth driver), and
capex / opex trade-off (acceleration of the capex renewal program may result in a reduction in required maintenance activity)
The DNSPs' proposed adjusted or net growth rates (for example, rate of growth in customer numbers net of adjustments) are also presented in this section.
6 EUCV, Submission to the AER, February 2010, p. 54. 7 ibid., p 55. 8 ibid., p 56. 9 ibid., p 49.
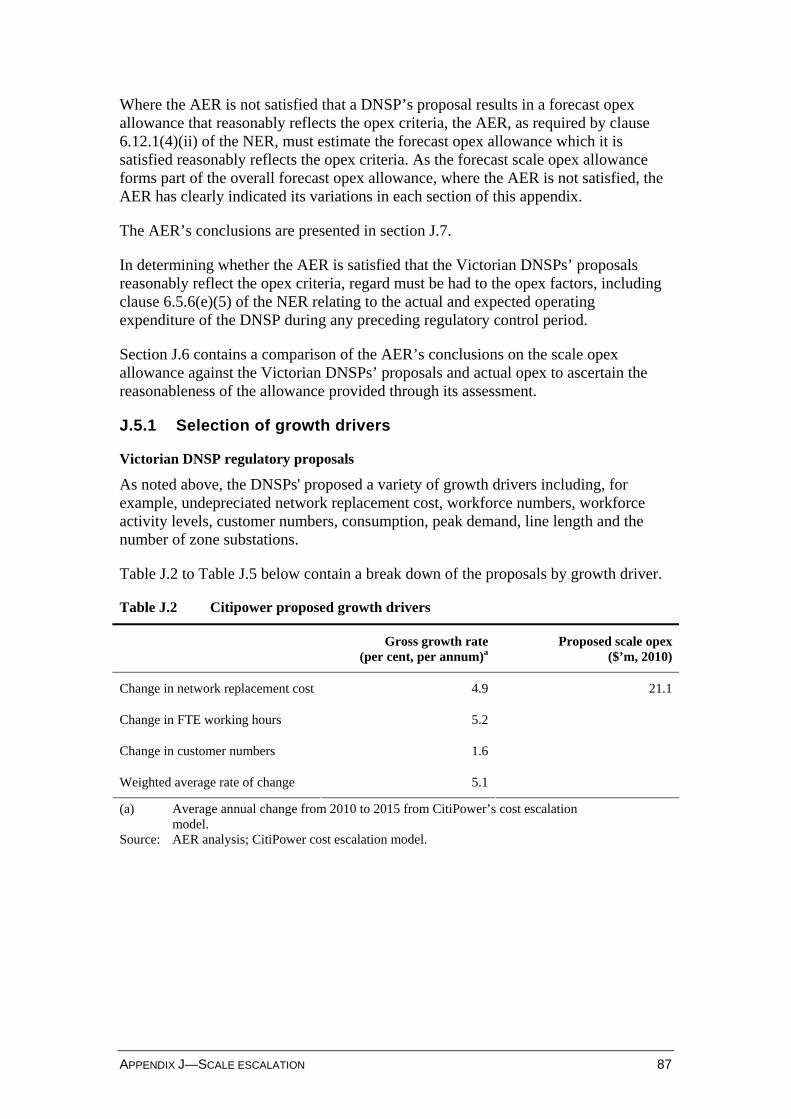
APPENDIX J—SCALE ESCALATION 87
Where the AER is not satisfied that a DNSP’s proposal results in a forecast opex allowance that reasonably reflects the opex criteria, the AER, as required by clause 6.12.1(4)(ii) of the NER, must estimate the forecast opex allowance which it is satisfied reasonably reflects the opex criteria. As the forecast scale opex allowance forms part of the overall forecast opex allowance, where the AER is not satisfied, the AER has clearly indicated its variations in each section of this appendix.
The AER’s conclusions are presented in section J.7.
In determining whether the AER is satisfied that the Victorian DNSPs’ proposals reasonably reflect the opex criteria, regard must be had to the opex factors, including clause 6.5.6(e)(5) of the NER relating to the actual and expected operating expenditure of the DNSP during any preceding regulatory control period.
Section J.6 contains a comparison of the AER’s conclusions on the scale opex allowance against the Victorian DNSPs’ proposals and actual opex to ascertain the reasonableness of the allowance provided through its assessment.
J.5.1 Selection of growth drivers
Victorian DNSP regulatory proposals
As noted above, the DNSPs' proposed a variety of growth drivers including, for example, undepreciated network replacement cost, workforce numbers, workforce activity levels, customer numbers, consumption, peak demand, line length and the number of zone substations.
Table J.2 to Table J.5 below contain a break down of the proposals by growth driver.
Table J.2 Citipower proposed growth drivers
Gross growth rate(per cent, per annum)a
Proposed scale opex($’m, 2010)
Change in network replacement cost 4.9
Change in FTE working hours 5.2
Change in customer numbers 1.6
Weighted average rate of change 5.1
21.1
(a) Average annual change from 2010 to 2015 from CitiPower’s cost escalation model.
Source: AER analysis; CitiPower cost escalation model.
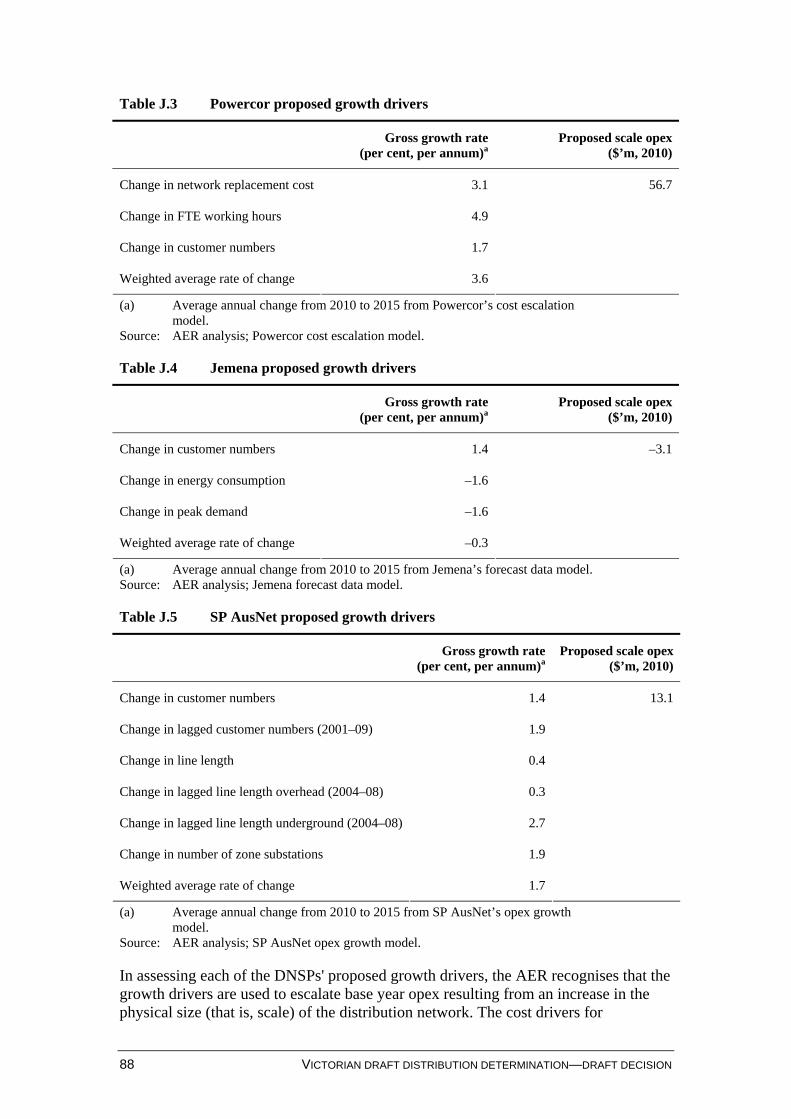
88 VICTORIAN DRAFT DISTRIBUTION DETERMINATION—DRAFT DECISION
Table J.3 Powercor proposed growth drivers
Gross growth rate(per cent, per annum)a
Proposed scale opex($’m, 2010)
Change in network replacement cost 3.1
Change in FTE working hours 4.9
Change in customer numbers 1.7
Weighted average rate of change 3.6
56.7
(a) Average annual change from 2010 to 2015 from Powercor’s cost escalation model.
Source: AER analysis; Powercor cost escalation model.
Table J.4 Jemena proposed growth drivers
Gross growth rate(per cent, per annum)a
Proposed scale opex($’m, 2010)
Change in customer numbers 1.4
Change in energy consumption –1.6
Change in peak demand –1.6
Weighted average rate of change –0.3
–3.1
(a) Average annual change from 2010 to 2015 from Jemena’s forecast data model. Source: AER analysis; Jemena forecast data model.
Table J.5 SP AusNet proposed growth drivers
Gross growth rate(per cent, per annum)a
Proposed scale opex($’m, 2010)
Change in customer numbers 1.4
Change in lagged customer numbers (2001–09) 1.9
Change in line length 0.4
Change in lagged line length overhead (2004–08) 0.3
Change in lagged line length underground (2004–08) 2.7
Change in number of zone substations 1.9
Weighted average rate of change 1.7
13.1
(a) Average annual change from 2010 to 2015 from SP AusNet’s opex growth model.
Source: AER analysis; SP AusNet opex growth model.
In assessing each of the DNSPs' proposed growth drivers, the AER recognises that the growth drivers are used to escalate base year opex resulting from an increase in the physical size (that is, scale) of the distribution network. The cost drivers for
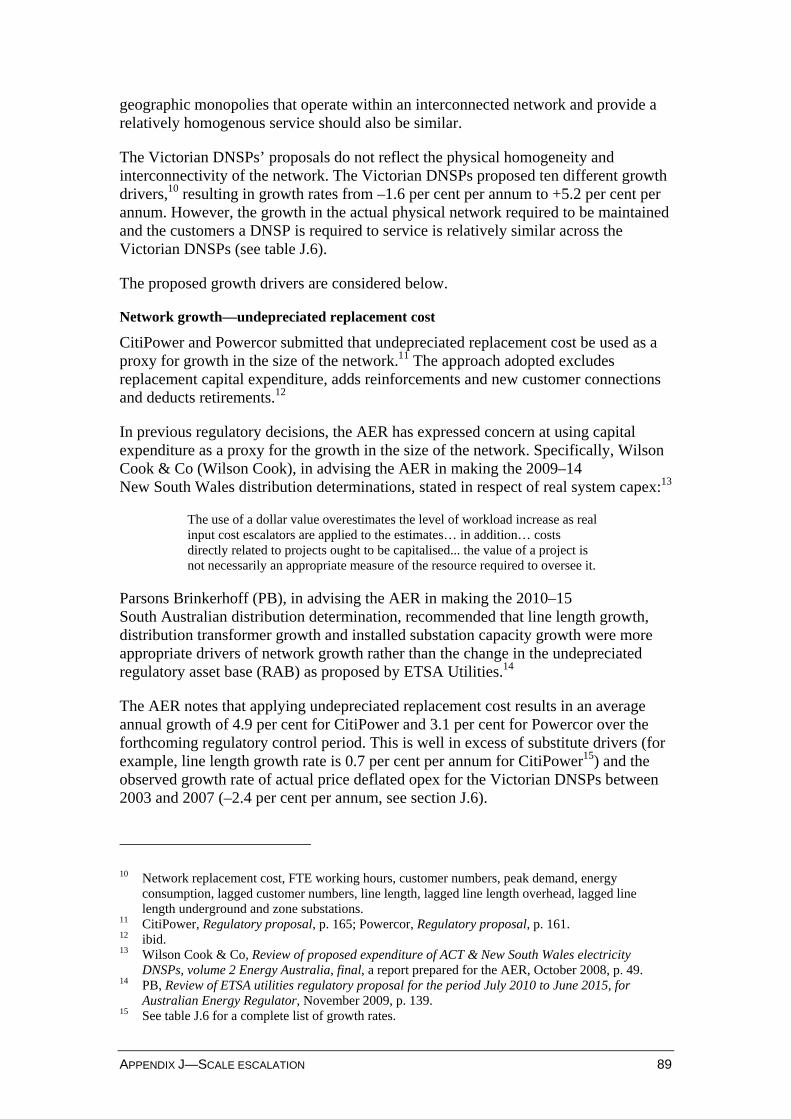
APPENDIX J—SCALE ESCALATION 89
geographic monopolies that operate within an interconnected network and provide a relatively homogenous service should also be similar.
The Victorian DNSPs’ proposals do not reflect the physical homogeneity and interconnectivity of the network. The Victorian DNSPs proposed ten different growth drivers,10 resulting in growth rates from –1.6 per cent per annum to +5.2 per cent per annum. However, the growth in the actual physical network required to be maintained and the customers a DNSP is required to service is relatively similar across the Victorian DNSPs (see table J.6).
The proposed growth drivers are considered below.
Network growth––undepreciated replacement cost
CitiPower and Powercor submitted that undepreciated replacement cost be used as a proxy for growth in the size of the network.11 The approach adopted excludes replacement capital expenditure, adds reinforcements and new customer connections and deducts retirements.12
In previous regulatory decisions, the AER has expressed concern at using capital expenditure as a proxy for the growth in the size of the network. Specifically, Wilson Cook & Co (Wilson Cook), in advising the AER in making the 2009–14 New South Wales distribution determinations, stated in respect of real system capex:13
The use of a dollar value overestimates the level of workload increase as real input cost escalators are applied to the estimates… in addition… costs directly related to projects ought to be capitalised... the value of a project is not necessarily an appropriate measure of the resource required to oversee it.
Parsons Brinkerhoff (PB), in advising the AER in making the 2010–15 South Australian distribution determination, recommended that line length growth, distribution transformer growth and installed substation capacity growth were more appropriate drivers of network growth rather than the change in the undepreciated regulatory asset base (RAB) as proposed by ETSA Utilities.14
The AER notes that applying undepreciated replacement cost results in an average annual growth of 4.9 per cent for CitiPower and 3.1 per cent for Powercor over the forthcoming regulatory control period. This is well in excess of substitute drivers (for example, line length growth rate is 0.7 per cent per annum for CitiPower15) and the observed growth rate of actual price deflated opex for the Victorian DNSPs between 2003 and 2007 (–2.4 per cent per annum, see section J.6).
10 Network replacement cost, FTE working hours, customer numbers, peak demand, energy
consumption, lagged customer numbers, line length, lagged line length overhead, lagged line length underground and zone substations.
11 CitiPower, Regulatory proposal, p. 165; Powercor, Regulatory proposal, p. 161. 12 ibid. 13 Wilson Cook & Co, Review of proposed expenditure of ACT & New South Wales electricity
DNSPs, volume 2 Energy Australia, final, a report prepared for the AER, October 2008, p. 49. 14 PB, Review of ETSA utilities regulatory proposal for the period July 2010 to June 2015, for
Australian Energy Regulator, November 2009, p. 139. 15 See table J.6 for a complete list of growth rates.
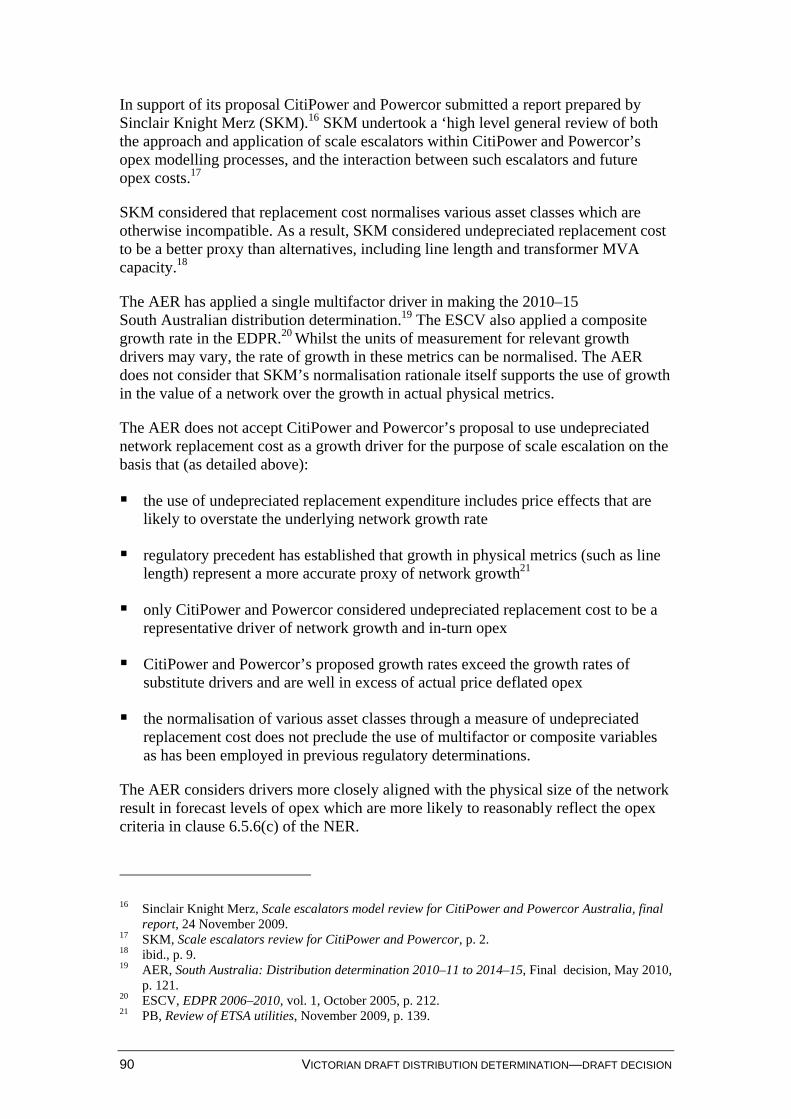
90 VICTORIAN DRAFT DISTRIBUTION DETERMINATION—DRAFT DECISION
In support of its proposal CitiPower and Powercor submitted a report prepared by Sinclair Knight Merz (SKM).16 SKM undertook a ‘high level general review of both the approach and application of scale escalators within CitiPower and Powercor’s opex modelling processes, and the interaction between such escalators and future opex costs.17
SKM considered that replacement cost normalises various asset classes which are otherwise incompatible. As a result, SKM considered undepreciated replacement cost to be a better proxy than alternatives, including line length and transformer MVA capacity.18
The AER has applied a single multifactor driver in making the 2010–15 South Australian distribution determination.19 The ESCV also applied a composite growth rate in the EDPR.20 Whilst the units of measurement for relevant growth drivers may vary, the rate of growth in these metrics can be normalised. The AER does not consider that SKM’s normalisation rationale itself supports the use of growth in the value of a network over the growth in actual physical metrics.
The AER does not accept CitiPower and Powercor’s proposal to use undepreciated network replacement cost as a growth driver for the purpose of scale escalation on the basis that (as detailed above):
the use of undepreciated replacement expenditure includes price effects that are likely to overstate the underlying network growth rate
regulatory precedent has established that growth in physical metrics (such as line length) represent a more accurate proxy of network growth21
only CitiPower and Powercor considered undepreciated replacement cost to be a representative driver of network growth and in-turn opex
CitiPower and Powercor’s proposed growth rates exceed the growth rates of substitute drivers and are well in excess of actual price deflated opex
the normalisation of various asset classes through a measure of undepreciated replacement cost does not preclude the use of multifactor or composite variables as has been employed in previous regulatory determinations.
The AER considers drivers more closely aligned with the physical size of the network result in forecast levels of opex which are more likely to reasonably reflect the opex criteria in clause 6.5.6(c) of the NER.
16 Sinclair Knight Merz, Scale escalators model review for CitiPower and Powercor Australia, final
report, 24 November 2009. 17 SKM, Scale escalators review for CitiPower and Powercor, p. 2. 18 ibid., p. 9. 19 AER, South Australia: Distribution determination 2010–11 to 2014–15, Final decision, May 2010,
p. 121. 20 ESCV, EDPR 2006–2010, vol. 1, October 2005, p. 212. 21 PB, Review of ETSA utilities, November 2009, p. 139.
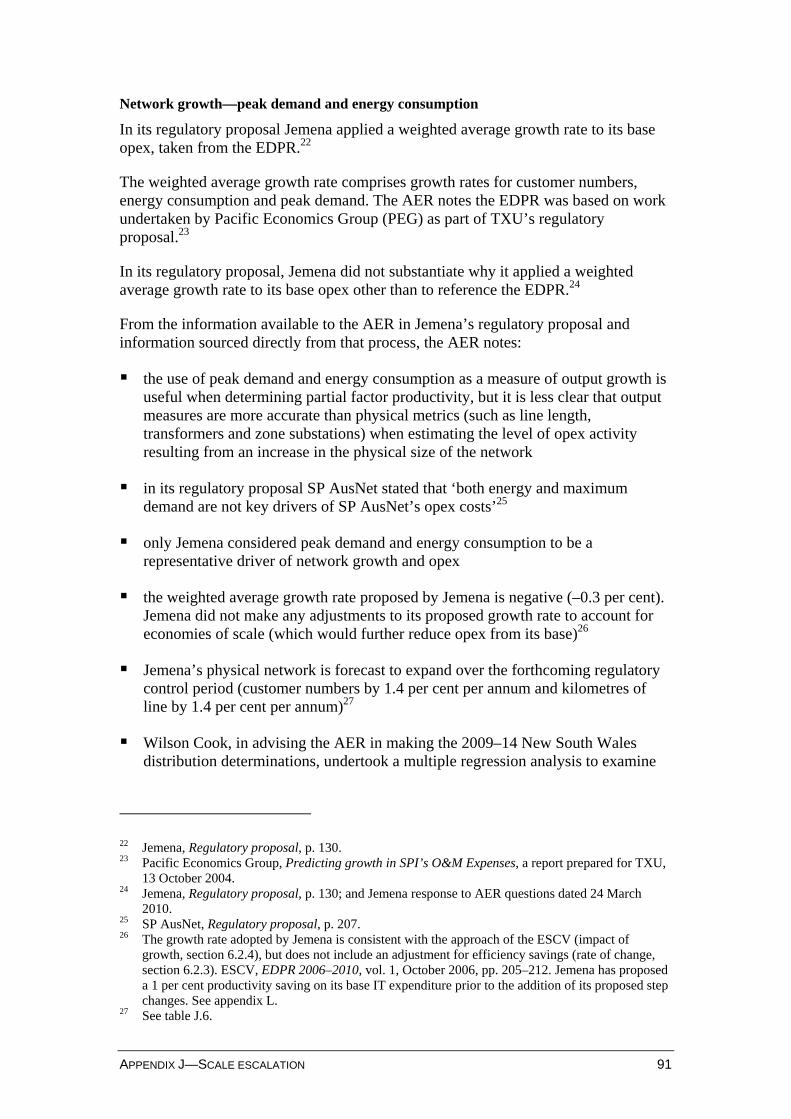
APPENDIX J—SCALE ESCALATION 91
Network growth––peak demand and energy consumption
In its regulatory proposal Jemena applied a weighted average growth rate to its base opex, taken from the EDPR.22
The weighted average growth rate comprises growth rates for customer numbers, energy consumption and peak demand. The AER notes the EDPR was based on work undertaken by Pacific Economics Group (PEG) as part of TXU’s regulatory proposal.23
In its regulatory proposal, Jemena did not substantiate why it applied a weighted average growth rate to its base opex other than to reference the EDPR.24
From the information available to the AER in Jemena’s regulatory proposal and information sourced directly from that process, the AER notes:
the use of peak demand and energy consumption as a measure of output growth is useful when determining partial factor productivity, but it is less clear that output measures are more accurate than physical metrics (such as line length, transformers and zone substations) when estimating the level of opex activity resulting from an increase in the physical size of the network
in its regulatory proposal SP AusNet stated that ‘both energy and maximum demand are not key drivers of SP AusNet’s opex costs’25
only Jemena considered peak demand and energy consumption to be a representative driver of network growth and opex
the weighted average growth rate proposed by Jemena is negative (–0.3 per cent). Jemena did not make any adjustments to its proposed growth rate to account for economies of scale (which would further reduce opex from its base)26
Jemena’s physical network is forecast to expand over the forthcoming regulatory control period (customer numbers by 1.4 per cent per annum and kilometres of line by 1.4 per cent per annum)27
Wilson Cook, in advising the AER in making the 2009–14 New South Wales distribution determinations, undertook a multiple regression analysis to examine
22 Jemena, Regulatory proposal, p. 130. 23 Pacific Economics Group, Predicting growth in SPI’s O&M Expenses, a report prepared for TXU,
13 October 2004. 24 Jemena, Regulatory proposal, p. 130; and Jemena response to AER questions dated 24 March
2010. 25 SP AusNet, Regulatory proposal, p. 207. 26 The growth rate adopted by Jemena is consistent with the approach of the ESCV (impact of
growth, section 6.2.4), but does not include an adjustment for efficiency savings (rate of change, section 6.2.3). ESCV, EDPR 2006–2010, vol. 1, October 2006, pp. 205–212. Jemena has proposed a 1 per cent productivity saving on its base IT expenditure prior to the addition of its proposed step changes. See appendix L.
27 See table J.6.
92 VICTORIAN DRAFT DISTRIBUTION DETERMINATION—DRAFT DECISION
the relationship between DNSP size and opex.28 In its analysis Wilson Cook examined the relationship between opex and a number of independent variables including customer numbers, line length, MW of demand, MWh of energy throughput and network type and noted ‘[e]xamination of the relationships between the variables revealed strong correlations between customer numbers, MW and MWh, indicating that combinations of these should be avoided.’29 The final model applied customer numbers and line length as determinants of size. Wilson Cook noted ‘the regression, as formulated, is evidentially applicable as a comparator of base year opex and as an escalator of opex cost in relation to increasing size overtime.’30
The AER considers that energy consumption and peak demand are necessary inputs when determining industry wide productivity levels. However, the task requires determining the impact on opex from growth in the network and as such the AER considers drivers more closely aligned with the physical size of the network result in forecast levels of opex which are more likely to reasonably reflect the opex criteria in clause 6.5.6(c) of the NER.31
Workload escalation––number of full time equivalent (FTE) labour hours
CitiPower and Powercor proposed an estimate of the number of hours of full time equivalent (FTE) trade skilled workers expected to be required to deliver the forecast expenditure program.32 Incremental FTE labour hours measures additional workload, and when directly related to the growth in the size of the network can be used to measure the rate of change in opex.
CitiPower and Powercor identified that:33
The forecast increase has been calculated by taking the forecasts of capital and operating expenditure and providing them to CitiPower’s [and Powercor’s] current provider of field resources, Powercor network services. Powercor Network Services have forecast the increase in full time equivalent trade skilled workers that will be required to deliver the expenditure programs.
In support of CitiPower and Powercor’s proposal, SKM considered FTE labour hours to be a reasonable proxy for the work volume growth driver. However, the SKM review was limited to a review of the FTE labour hours forecast by Powercor Network Services, based upon the direct field resource requirement as supplied by CitiPower and Powercor in their respective deliverability plans (2011–2015):34
28 Wilson Cook, Review of proposed expenditure of ACT & New South Wales electricity DNSPs:
Energy Australia’s submissions of January and February 2009, a report prepared for the AER, 31 March 2009, p. 14.
29 ibid., p. 14. 30 ibid., p. 15. 31 EUCV submitted that consumption growth may occur from new connections that extend the
network or from existing customers. It is EUCV’s position that the latter has a negligible impact on opex (see section J.4). It follows from EUCV’s position that more targeted physical metrics are better approximates of growth in the size of the network.
32 CitiPower, Regulatory proposal, p. 165; Powercor, Regulatory proposal, p. 161. 33 ibid. 34 SKM, Scale escalators review for CitiPower and Powercor, p. 10
APPENDIX J—SCALE ESCALATION 93
SKM did not review the deliverability plan in detail, nor the calculation of the resource requirements.
The AER acknowledges that FTE labour hours associated with growth in the size of the network is a direct measurement of the incremental operating and maintenance workload. However, the approach of CitiPower and Powercor to supply PNS with forecasts of operating and maintenance expenditure as the basis of the FTE labour hour projections, which inturn has been used as an escalation factor in the determination of the proposed level of opex, appears circular and on that basis unreliable. Furthermore, the forecast activity levels used to inform PNS’s projections are not adequately substantiated.35
The general approach to scale escalation is to develop forecasts of the rate of change in the efficient base year opex from drivers of the growth in the size of the network. Where the driver (in this case FTE labour hours) is derived from ‘forecasts of capital and operating expenditure’ from CitiPower and Powercor, the driver is not readily observable, independent and not easily verifiable.36 It is worth noting that SKM did not review the deliverability plan in detail, which in essence forms the basis of these forecasts.
The adoption of FTE labour hours results in average annual growth rates of 5.2 per cent for CitiPower and 4.9 per cent for Powercor over the forthcoming regulatory control period. This is well in excess of substitute drivers (for example, line length growth rate is 0.7 per cent per annum for CitiPower37) and the observed growth rate of actual price deflated opex for the Victorian DNSPs, between 2003 and 2007 (negative 2.4 per cent per annum, see section J.6).
The reliance on company projections has been considered by the ESCV in its 2008 review of Victorian gas access arrangements:38
Meyrick relied on company projections of their opex... any projection of operating expenditures over a future period necessarily, and unavoidably, involves assumptions… this leads to an inexorable link between the assumptions and conclusions of the analysis… This analysis is inherently self referential…
In the Commission’s view, little weight can be placed on forecast information which is not additionally supported by objective material.
The AER agrees that projections based on information that is independently observable and supported by objective information is preferable to information that cannot be readily observed and is not substantiated.
35 CitiPower and Powercor estimated that each of their respective opex work programs is forecast to
grow by 37 per cent and 31 per cent respectively over the forthcoming regulatory control period. The forecast increases in activity levels used to support PNS’s projections have not been supplied. The respective plans state that that the increases are driven by asset growth and an increase in base year expenditure. Source: Powercor, Deliverability Plan: 2011 to 2015, 30 November 2009, p. 5. CitiPower, Deliverability Plan: 2011 to 2015, 30 November 2009, p. 5.
36 When compared to the alternative, which is to measure the growth rate of physical assets. 37 See table J.6 for a complete list of growth rates. 38 ESCV, Gas access arrangement review 2008–2012, Final decision—public version, 7 March 2008,
p. 239.
94 VICTORIAN DRAFT DISTRIBUTION DETERMINATION—DRAFT DECISION
As the annual growth in FTE labour hours exceeds the annual growth in physical assets the Victorian DNSPs expect to maintain, this could be interpreted as a reduction in labour productivity (that is, increasing FTE labour hours per unit of assets). This relationship was not explained nor substantiated in Citipower and Powercor’s proposals.
The AER considers drivers more closely aligned with the physical size of the network result in forecast levels of opex which are more likely to reasonably reflect the opex criteria in clause 6.5.6(c) of the NER.39
Customer numbers
All of the Victorian DNSPs used the rate of change in customer numbers as a growth driver in their regulatory proposals.40
Customer numbers may be used as a proxy for network growth. However, as the EUCV noted:41
If the new customers extend the geographical area serviced, then it is likely that the increase will result in more opex. If, however, the increased number result from increasing density of customers (eg if a house is pulled down and replaced with units) then the increase in opex is marginal at most.
The AER agrees that customer growth as a proxy for network growth is dependent upon the resultant impact on physical assets. As a result, the AER considers that growth in physical assets remains the preferred network growth driver.42
However, opex is not exclusively driven by the size of the network. It can be also driven by the number of customers in terms of customer service and associated corporate operating costs. Therefore, growth in the number of customers can be shown to drive operating and maintenance activity, particularly where customers have a direct influence on the service provided by a DNSP.43
In advising the AER in making the 2009–14 New South Wales distribution determinations, Wilson Cook formulated a composite size variable that could be used as an aggregate predictor of opex. This top down analysis revealed that line length (as a measure of network growth) and customer numbers explained 97 per cent of the variation in opex amongst the sample DNSPs.44 The AER also notes that PB, during the making of the 2010–15 South Australian distribution determination accepted
39 In addition, customer numbers are likely to form a reasonable basis for escalating certain operating
activities (see table J.7). 40 With the exception of United Energy who did not explicitly identify scale escalation in its
regulatory proposal. 41 EUCV, Submission to the AER, page 55. 42 As noted in table J.5, SP AusNet proposed lagged line length and customer numbers as growth
drivers. The AER agrees that line length and customer numbers are appropriate growth drivers and notes the rate of change across regulatory periods is relatively stable. As a result the AER has used forecast growth rates net of economies of scale as this aligns with the period over which the opex allowance is determined.
43 Such as customer service enquiries, information requests, billing etc. 44 Wilson Cook, Review of ACT & New South Wales: Energy Australia’s submissions of January and
February 2009, pp. 14–15.
APPENDIX J—SCALE ESCALATION 95
ETSA Utilities’ proposal to apply customer number growth to customer service and associated corporate activities.45
The AER considers that growth in customer numbers, applied to certain operating activities results in forecast levels of opex which are likely to reasonably reflect the opex criteria in clause 6.5.6(c) of the NER.46
Conclusion on selection of scale escalation drivers
The AER considers that growth factors based on physical metrics such as line length and the number of distribution transformers and zone substations results in forecasts of opex that most closely reflect the actual growth in operating and maintenance activity levels (also supported by the trend analysis presented in table J.15). 47
The use of alternate drivers such as consumption and peak demand results in a negative growth impact for Jemena which is not supported intuitively as their network is expanding (according to physical metrics and customer numbers).48
CitiPower and Powercor proposed network growth rates based on asset valuations which implicitly include price effects as opposed to growth in the actual assets to be maintained. CitiPower and Powercor also proposed internal forecasts of workforce activity levels, which is inherently self referential and subjective. CitiPower and Powercor’s proposed growth rates result in scale opex forecasts significantly above the other DNSPs (see table J.1) and significantly above observed actual opex trends (see table J.15).
The use of a composite network growth factor based on line length, transformers and zone substations is broadly consistent with AER’s approach in the ETSA utilities review.49
As a result, for the reasons outlined above, the AER does not accept the majority of growth drivers proposed by the Victorian DNSPs.
The AER has adopted two growth drivers for each DNSP for the draft decision:
a composite network growth factor calculated as a simple average of the annual growth in line length and the number of distribution transformers and zone substations over the forthcoming regulatory control period
the annual growth in customer numbers over the forthcoming regulatory control period.
45 PB, Review of ETSA utilities, November 2009, p. 139 46 See table J.7. 47 Growth in the number of zone substations was proposed by SP AusNet and adopted by the AER
for the draft decision. The AER will consider alternatives such as growth in installed zone substation capacity in response to the draft decision where such alternatives are sufficiently documented and substantiated.
48 Even before efficiency gains are considered 49 With the exception of installed zone substation capacity. See footnote 47.
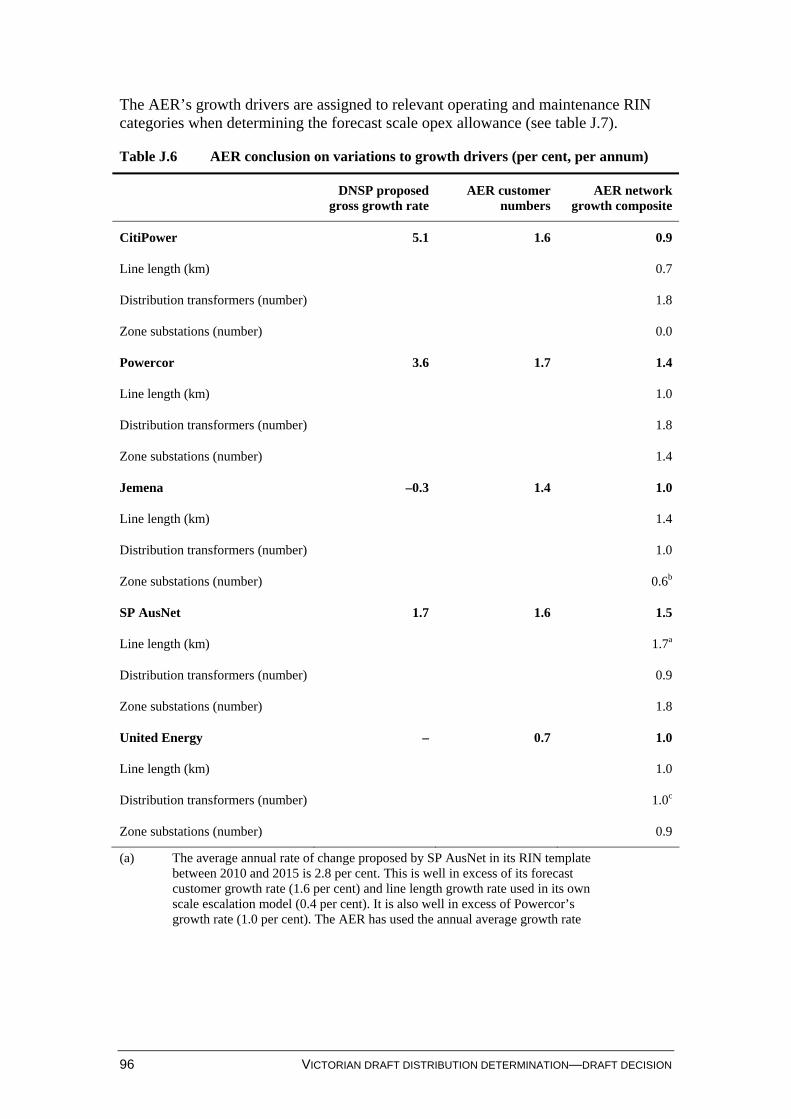
96 VICTORIAN DRAFT DISTRIBUTION DETERMINATION—DRAFT DECISION
The AER’s growth drivers are assigned to relevant operating and maintenance RIN categories when determining the forecast scale opex allowance (see table J.7).
Table J.6 AER conclusion on variations to growth drivers (per cent, per annum)
DNSP proposed gross growth rate
AER customer numbers
AER network growth composite
CitiPower 5.1 1.6 0.9
Line length (km) 0.7
Distribution transformers (number) 1.8
Zone substations (number) 0.0
Powercor 3.6 1.7 1.4
Line length (km) 1.0
Distribution transformers (number) 1.8
Zone substations (number) 1.4
Jemena –0.3 1.4 1.0
Line length (km) 1.4
Distribution transformers (number) 1.0
Zone substations (number) 0.6b
SP AusNet 1.7 1.6 1.5
Line length (km) 1.7a
Distribution transformers (number) 0.9
Zone substations (number) 1.8
United Energy – 0.7 1.0
Line length (km) 1.0
Distribution transformers (number) 1.0c
Zone substations (number) 0.9
(a) The average annual rate of change proposed by SP AusNet in its RIN template between 2010 and 2015 is 2.8 per cent. This is well in excess of its forecast customer growth rate (1.6 per cent) and line length growth rate used in its own scale escalation model (0.4 per cent). It is also well in excess of Powercor’s growth rate (1.0 per cent). The AER has used the annual average growth rate
APPENDIX J—SCALE ESCALATION 97
from 2005 to 2010 (1.7 per cent) for the draft decision but intends to review this number for the final decision.50
(b) The average annual rate of change proposed by Jemena in response to information requested on 3 March 2010, and submitted on 24 March 2010, was 3.3 per cent. This is well in excess of other DNSPs and does not correspond to comparable growth rates sourced from Jemena’s RIN template (0.6 per cent).
(c) In the absence of information on the number of distribution transformers the AER has used the growth in line length. The AER is seeking information from United Energy on the number of distribution transformers in response to the draft decision.
The resultant network growth rates can be supported intuitively as SP AusNet and Powercor, with large rural networks and relatively high customer growth rates, have higher network growth rates for scale purposes compared to CitiPower, Jemena and United Energy. Similarly, CitiPower, with its closed urban network has the smallest network growth rate.
As noted above, opex is not exclusively driven by the size of the network. It can be also driven by the number of customers in terms of customer service and associated corporate operating costs. For the purpose of this draft decision, the AER's growth drivers have been allocated to the following RIN categories.
50 The impact of urban infill development is likely to result in a growth rate for line length of less
than the growth in customers. This position is also supported by the EUCV, p. 55.
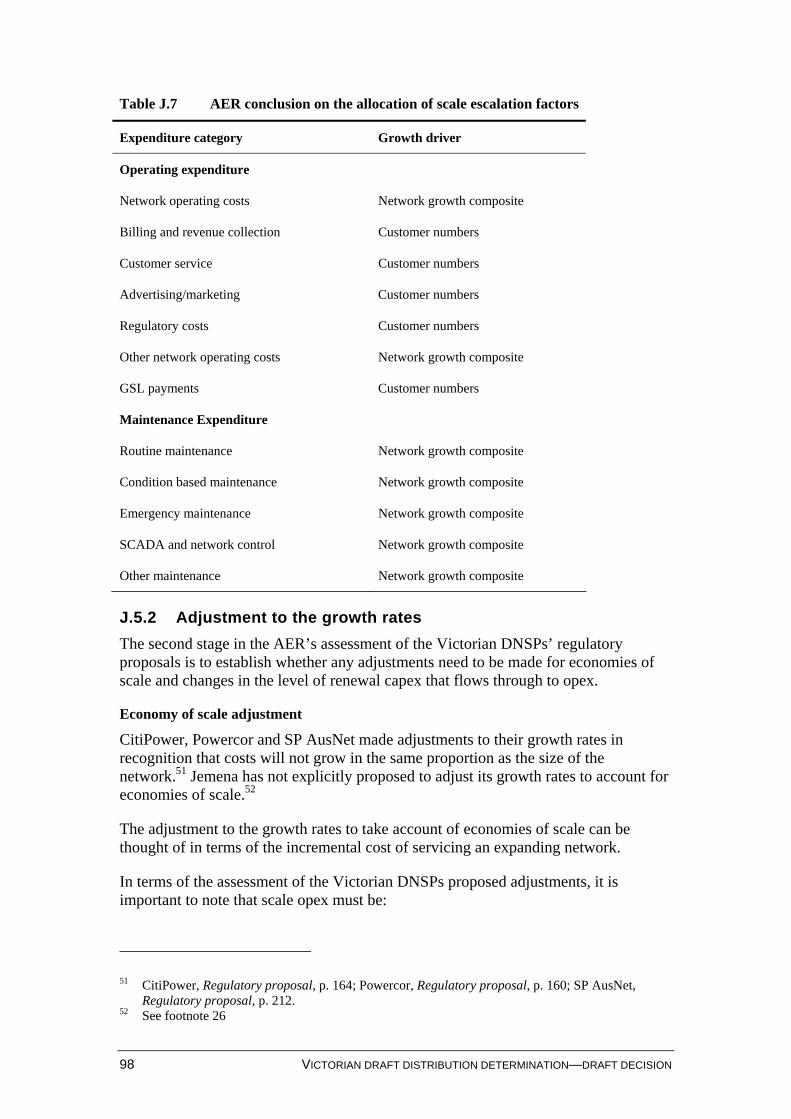
98 VICTORIAN DRAFT DISTRIBUTION DETERMINATION—DRAFT DECISION
Table J.7 AER conclusion on the allocation of scale escalation factors
Expenditure category Growth driver
Operating expenditure
Network operating costs Network growth composite
Billing and revenue collection Customer numbers
Customer service Customer numbers
Advertising/marketing Customer numbers
Regulatory costs Customer numbers
Other network operating costs Network growth composite
GSL payments Customer numbers
Maintenance Expenditure
Routine maintenance Network growth composite
Condition based maintenance Network growth composite
Emergency maintenance Network growth composite
SCADA and network control Network growth composite
Other maintenance Network growth composite
J.5.2 Adjustment to the growth rates
The second stage in the AER’s assessment of the Victorian DNSPs’ regulatory proposals is to establish whether any adjustments need to be made for economies of scale and changes in the level of renewal capex that flows through to opex.
Economy of scale adjustment
CitiPower, Powercor and SP AusNet made adjustments to their growth rates in recognition that costs will not grow in the same proportion as the size of the network.51 Jemena has not explicitly proposed to adjust its growth rates to account for economies of scale.52
The adjustment to the growth rates to take account of economies of scale can be thought of in terms of the incremental cost of servicing an expanding network.
In terms of the assessment of the Victorian DNSPs proposed adjustments, it is important to note that scale opex must be:
51 CitiPower, Regulatory proposal, p. 164; Powercor, Regulatory proposal, p. 160; SP AusNet,
Regulatory proposal, p. 212. 52 See footnote 26
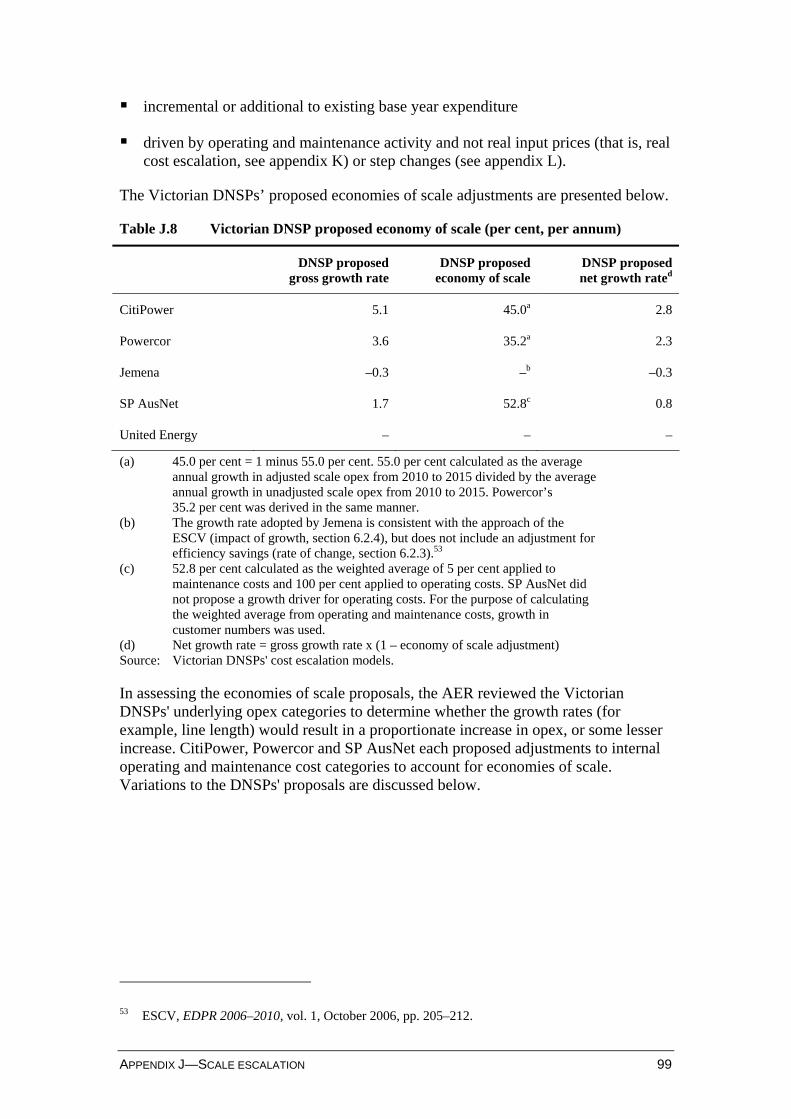
APPENDIX J—SCALE ESCALATION 99
incremental or additional to existing base year expenditure
driven by operating and maintenance activity and not real input prices (that is, real cost escalation, see appendix K) or step changes (see appendix L).
The Victorian DNSPs’ proposed economies of scale adjustments are presented below.
Table J.8 Victorian DNSP proposed economy of scale (per cent, per annum)
DNSP proposedgross growth rate
DNSP proposed economy of scale
DNSP proposednet growth rated
CitiPower 5.1 45.0a 2.8
Powercor 3.6 35.2a 2.3
Jemena –0.3 –b –0.3
SP AusNet 1.7 52.8c 0.8
United Energy – – –
(a) 45.0 per cent = 1 minus 55.0 per cent. 55.0 per cent calculated as the average annual growth in adjusted scale opex from 2010 to 2015 divided by the average annual growth in unadjusted scale opex from 2010 to 2015. Powercor’s 35.2 per cent was derived in the same manner.
(b) The growth rate adopted by Jemena is consistent with the approach of the ESCV (impact of growth, section 6.2.4), but does not include an adjustment for efficiency savings (rate of change, section 6.2.3).53
(c) 52.8 per cent calculated as the weighted average of 5 per cent applied to maintenance costs and 100 per cent applied to operating costs. SP AusNet did not propose a growth driver for operating costs. For the purpose of calculating the weighted average from operating and maintenance costs, growth in customer numbers was used.
(d) Net growth rate = gross growth rate x (1 – economy of scale adjustment) Source: Victorian DNSPs' cost escalation models.
In assessing the economies of scale proposals, the AER reviewed the Victorian DNSPs' underlying opex categories to determine whether the growth rates (for example, line length) would result in a proportionate increase in opex, or some lesser increase. CitiPower, Powercor and SP AusNet each proposed adjustments to internal operating and maintenance cost categories to account for economies of scale. Variations to the DNSPs' proposals are discussed below.
53 ESCV, EDPR 2006–2010, vol. 1, October 2006, pp. 205–212.
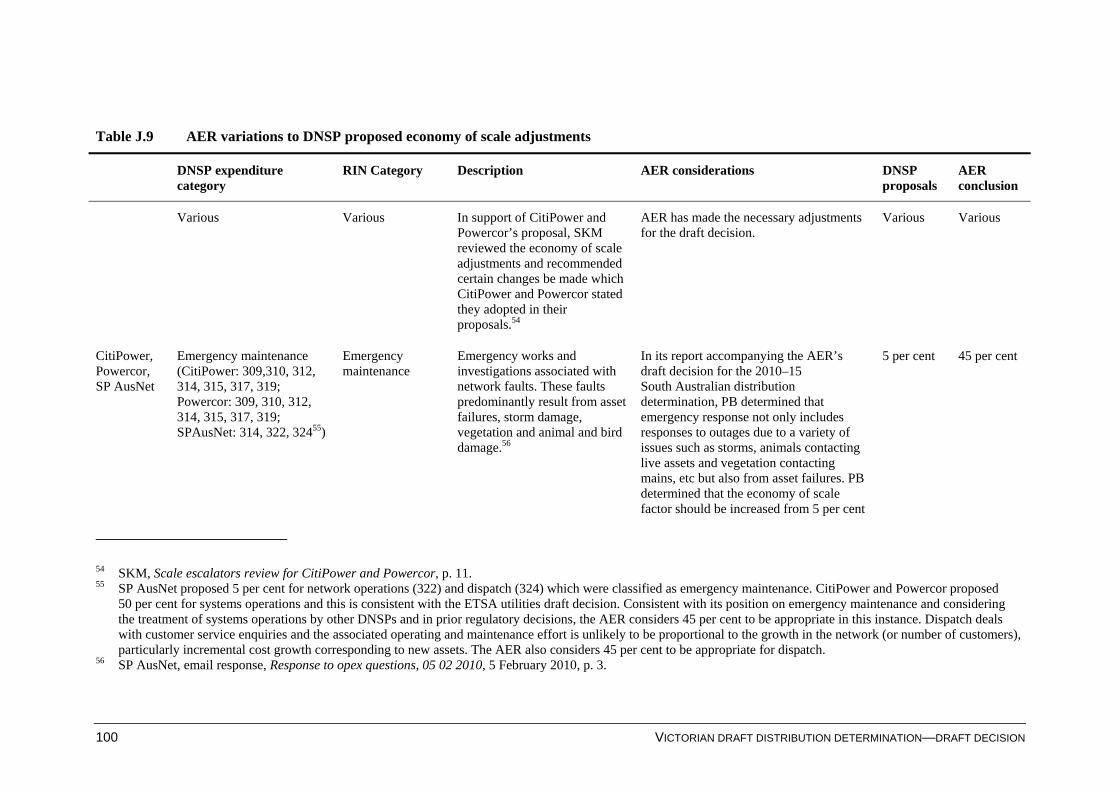
100 VICTORIAN DRAFT DISTRIBUTION DETERMINATION—DRAFT DECISION
Table J.9 AER variations to DNSP proposed economy of scale adjustments
DNSP expenditure category
RIN Category Description AER considerations DNSP proposals
AER conclusion
Various Various In support of CitiPower and Powercor’s proposal, SKM reviewed the economy of scale adjustments and recommended certain changes be made which CitiPower and Powercor stated they adopted in their proposals.54
AER has made the necessary adjustments for the draft decision.
Various Various
CitiPower, Powercor, SP AusNet
Emergency maintenance (CitiPower: 309,310, 312, 314, 315, 317, 319; Powercor: 309, 310, 312, 314, 315, 317, 319; SPAusNet: 314, 322, 32455)
Emergency maintenance
Emergency works and investigations associated with network faults. These faults predominantly result from asset failures, storm damage, vegetation and animal and bird damage.56
In its report accompanying the AER’s draft decision for the 2010–15 South Australian distribution determination, PB determined that emergency response not only includes responses to outages due to a variety of issues such as storms, animals contacting live assets and vegetation contacting mains, etc but also from asset failures. PB determined that the economy of scale factor should be increased from 5 per cent
5 per cent 45 per cent
54 SKM, Scale escalators review for CitiPower and Powercor, p. 11. 55 SP AusNet proposed 5 per cent for network operations (322) and dispatch (324) which were classified as emergency maintenance. CitiPower and Powercor proposed
50 per cent for systems operations and this is consistent with the ETSA utilities draft decision. Consistent with its position on emergency maintenance and considering the treatment of systems operations by other DNSPs and in prior regulatory decisions, the AER considers 45 per cent to be appropriate in this instance. Dispatch deals with customer service enquiries and the associated operating and maintenance effort is unlikely to be proportional to the growth in the network (or number of customers), particularly incremental cost growth corresponding to new assets. The AER also considers 45 per cent to be appropriate for dispatch.
56 SP AusNet, email response, Response to opex questions, 05 02 2010, 5 February 2010, p. 3.
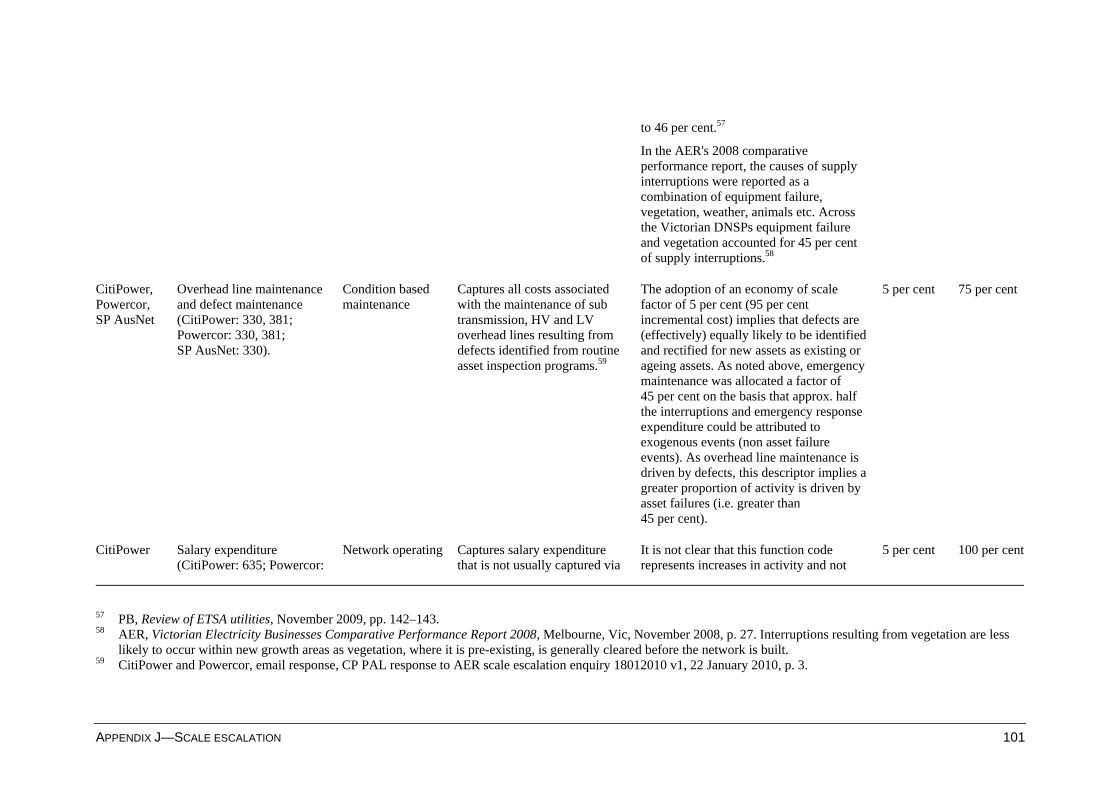
APPENDIX J—SCALE ESCALATION 101
to 46 per cent.57
In the AER's 2008 comparative performance report, the causes of supply interruptions were reported as a combination of equipment failure, vegetation, weather, animals etc. Across the Victorian DNSPs equipment failure and vegetation accounted for 45 per cent of supply interruptions.58
CitiPower, Powercor, SP AusNet
Overhead line maintenance and defect maintenance (CitiPower: 330, 381; Powercor: 330, 381; SP AusNet: 330).
Condition based maintenance
Captures all costs associated with the maintenance of sub transmission, HV and LV overhead lines resulting from defects identified from routine asset inspection programs.59
The adoption of an economy of scale factor of 5 per cent (95 per cent incremental cost) implies that defects are (effectively) equally likely to be identified and rectified for new assets as existing or ageing assets. As noted above, emergency maintenance was allocated a factor of 45 per cent on the basis that approx. half the interruptions and emergency response expenditure could be attributed to exogenous events (non asset failure events). As overhead line maintenance is driven by defects, this descriptor implies a greater proportion of activity is driven by asset failures (i.e. greater than 45 per cent).
5 per cent 75 per cent
CitiPower Salary expenditure (CitiPower: 635; Powercor:
Network operating Captures salary expenditure that is not usually captured via
It is not clear that this function code represents increases in activity and not
5 per cent 100 per cent
57 PB, Review of ETSA utilities, November 2009, pp. 142–143. 58 AER, Victorian Electricity Businesses Comparative Performance Report 2008, Melbourne, Vic, November 2008, p. 27. Interruptions resulting from vegetation are less
likely to occur within new growth areas as vegetation, where it is pre-existing, is generally cleared before the network is built. 59 CitiPower and Powercor, email response, CP PAL response to AER scale escalation enquiry 18012010 v1, 22 January 2010, p. 3.
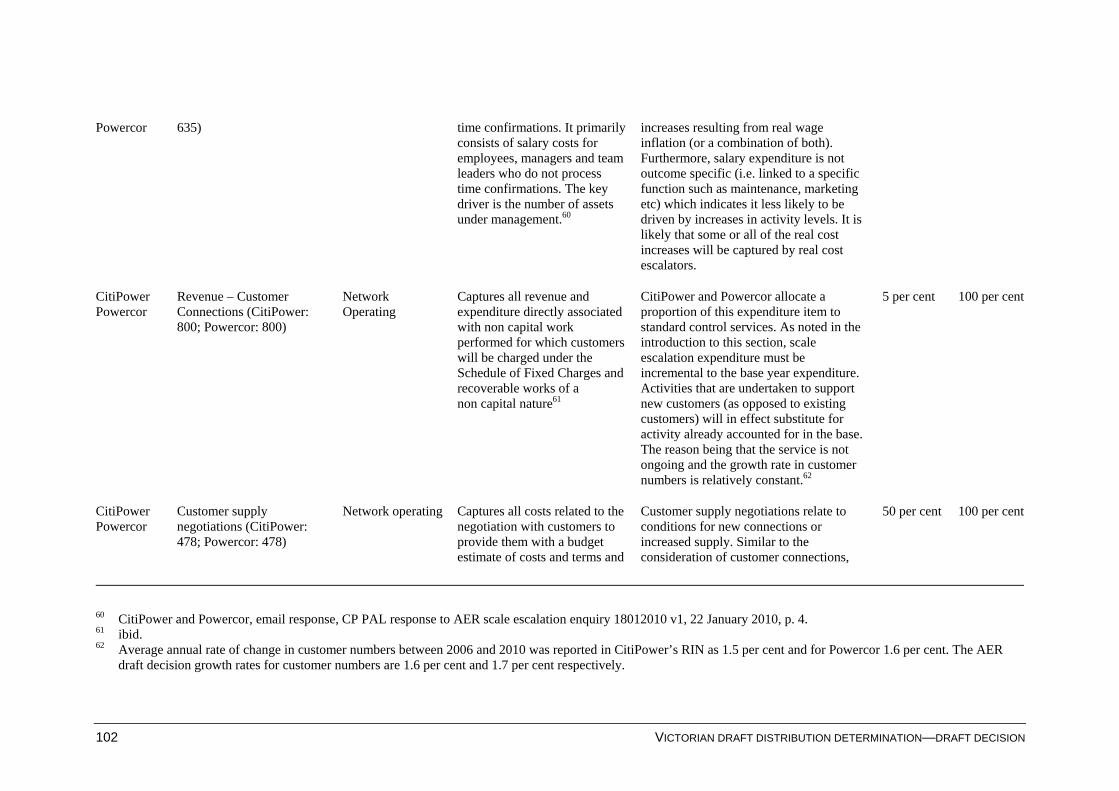
102 VICTORIAN DRAFT DISTRIBUTION DETERMINATION—DRAFT DECISION
Powercor 635) time confirmations. It primarily consists of salary costs for employees, managers and team leaders who do not process time confirmations. The key driver is the number of assets under management.60
increases resulting from real wage inflation (or a combination of both). Furthermore, salary expenditure is not outcome specific (i.e. linked to a specific function such as maintenance, marketing etc) which indicates it less likely to be driven by increases in activity levels. It is likely that some or all of the real cost increases will be captured by real cost escalators.
CitiPower Powercor
Revenue – Customer Connections (CitiPower: 800; Powercor: 800)
Network Operating
Captures all revenue and expenditure directly associated with non capital work performed for which customers will be charged under the Schedule of Fixed Charges and recoverable works of a non capital nature61
CitiPower and Powercor allocate a proportion of this expenditure item to standard control services. As noted in the introduction to this section, scale escalation expenditure must be incremental to the base year expenditure. Activities that are undertaken to support new customers (as opposed to existing customers) will in effect substitute for activity already accounted for in the base. The reason being that the service is not ongoing and the growth rate in customer numbers is relatively constant.62
5 per cent 100 per cent
CitiPower Powercor
Customer supply negotiations (CitiPower: 478; Powercor: 478)
Network operating Captures all costs related to the negotiation with customers to provide them with a budget estimate of costs and terms and
Customer supply negotiations relate to conditions for new connections or increased supply. Similar to the consideration of customer connections,
50 per cent 100 per cent
60 CitiPower and Powercor, email response, CP PAL response to AER scale escalation enquiry 18012010 v1, 22 January 2010, p. 4. 61 ibid. 62 Average annual rate of change in customer numbers between 2006 and 2010 was reported in CitiPower’s RIN as 1.5 per cent and for Powercor 1.6 per cent. The AER
draft decision growth rates for customer numbers are 1.6 per cent and 1.7 per cent respectively.
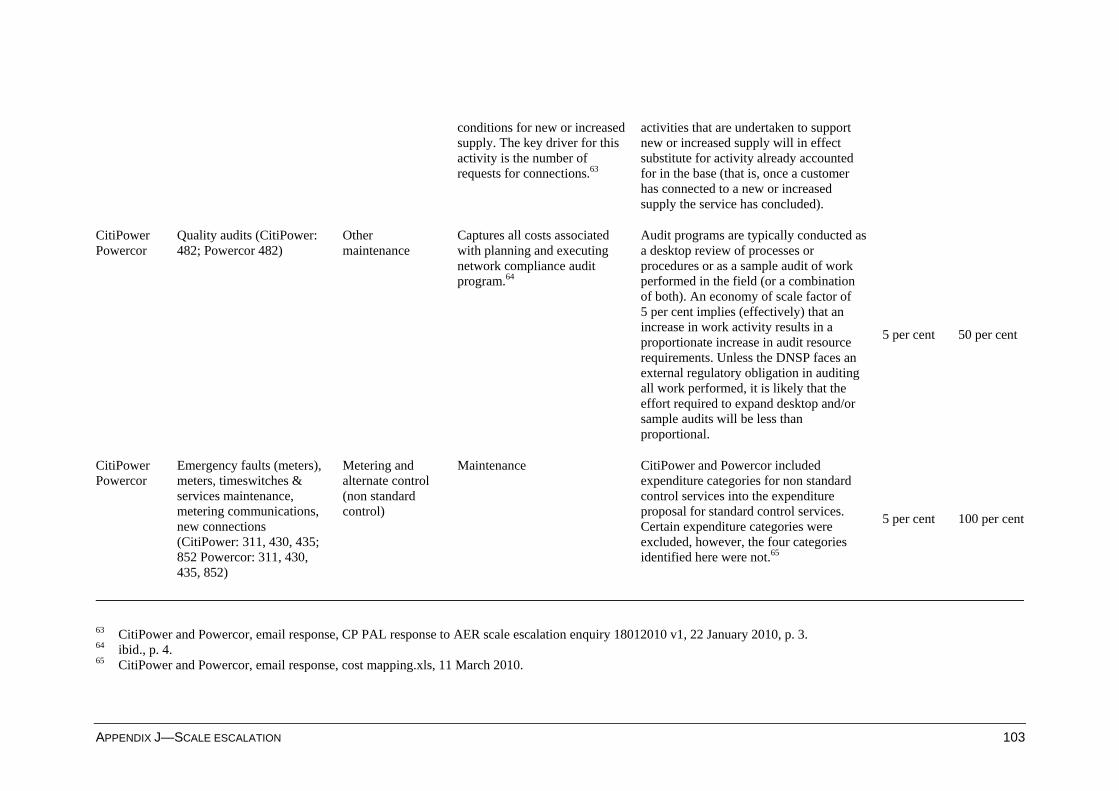
APPENDIX J—SCALE ESCALATION 103
conditions for new or increased supply. The key driver for this activity is the number of requests for connections.63
activities that are undertaken to support new or increased supply will in effect substitute for activity already accounted for in the base (that is, once a customer has connected to a new or increased supply the service has concluded).
CitiPower Powercor
Quality audits (CitiPower: 482; Powercor 482)
Other maintenance
Captures all costs associated with planning and executing network compliance audit program.64
Audit programs are typically conducted as a desktop review of processes or procedures or as a sample audit of work performed in the field (or a combination of both). An economy of scale factor of 5 per cent implies (effectively) that an increase in work activity results in a proportionate increase in audit resource requirements. Unless the DNSP faces an external regulatory obligation in auditing all work performed, it is likely that the effort required to expand desktop and/or sample audits will be less than proportional.
5 per cent 50 per cent
CitiPower Powercor
Emergency faults (meters), meters, timeswitches & services maintenance, metering communications, new connections (CitiPower: 311, 430, 435; 852 Powercor: 311, 430, 435, 852)
Metering and alternate control (non standard control)
Maintenance CitiPower and Powercor included expenditure categories for non standard control services into the expenditure proposal for standard control services. Certain expenditure categories were excluded, however, the four categories identified here were not.65
5 per cent 100 per cent
63 CitiPower and Powercor, email response, CP PAL response to AER scale escalation enquiry 18012010 v1, 22 January 2010, p. 3. 64 ibid., p. 4. 65 CitiPower and Powercor, email response, cost mapping.xls, 11 March 2010.
104 VICTORIAN DRAFT DISTRIBUTION DETERMINATION—DRAFT DECISION
In arriving at the conclusions above the AER notes that the Victorian DNSPs' should realise additional efficiency savings that accrue from the introduction of advanced metering infrastructure (AMI).
In the AER’s 2009 AMI final determination the Victorian DNSPs identified potential benefits in terms of reduced costs associated with metering maintenance, connection and reconnection disputes, reduced special meter reads and reduced costs of customer trials.66
In terms of the scale economy benefits that extend beyond those identified and accounted for through the AMI final determination, it is not clear whether the Victorian DNSPs specifically accounted for additional economies of scale that can be directly attributable to AMI.67
The AER considers that AMI should lead to improvements in a number of areas, including the management of faults, specifically more immediate notification of faults and their origin which is likely to reduce field response times.68
In its regulatory proposal, CitiPower identified capabilities that flow from AMI and associated leveraged capex that:69
Enable network controllers to proactively identify localised faults by linking the network outage management system with AMI outage information. Currently, network operators predominantly rely on customers notifying CitiPower of localised faults… this would shorten the period of time over which the customer is off supply.
CitiPower also identified that it expects to:70
Collect more accurate localised data to enable CitiPower to make more efficient and prudent network planning decisions.
While it is too early to evaluate the precise effect on efficiency from the use of AMI infrastructure, the AER expects that such efficiencies will be evident over time and will impact on operating cost trends.
The AER revisions outlined in table J.9 increase the economies of scale adjustments from 44.4 per cent (DNSP proposed average) to an average of 57.6 per cent (AER average).
66 AER, Victorian advanced metering infrastructure review, 2009–11 AMI budget and charges
applications, final determination, October 2009, pp. 104–105. 67 Whilst Jemena did not specifically adjust its proposed growth rates for economies of scale, it has
identified that the benefits of Jemena’s smart grid strategy [includes AMI] will not be realised until the 2016–2020 regulatory period. Jemena, Regulatory proposal, p. 29.
68 Whilst United Energy identified ‘leveraged’ benefits in terms of ‘improved management of faults response’, they also stipulated that additional opex is required to evaluate and assess the technology available. United Energy, Regulatory proposal, p. 62. SP AusNet identified an expected increase in quality of supply queries. SP AusNet, Regulatory proposal, p. 188.
69 CitiPower, Regulatory proposal, p. 415 70 ibid.
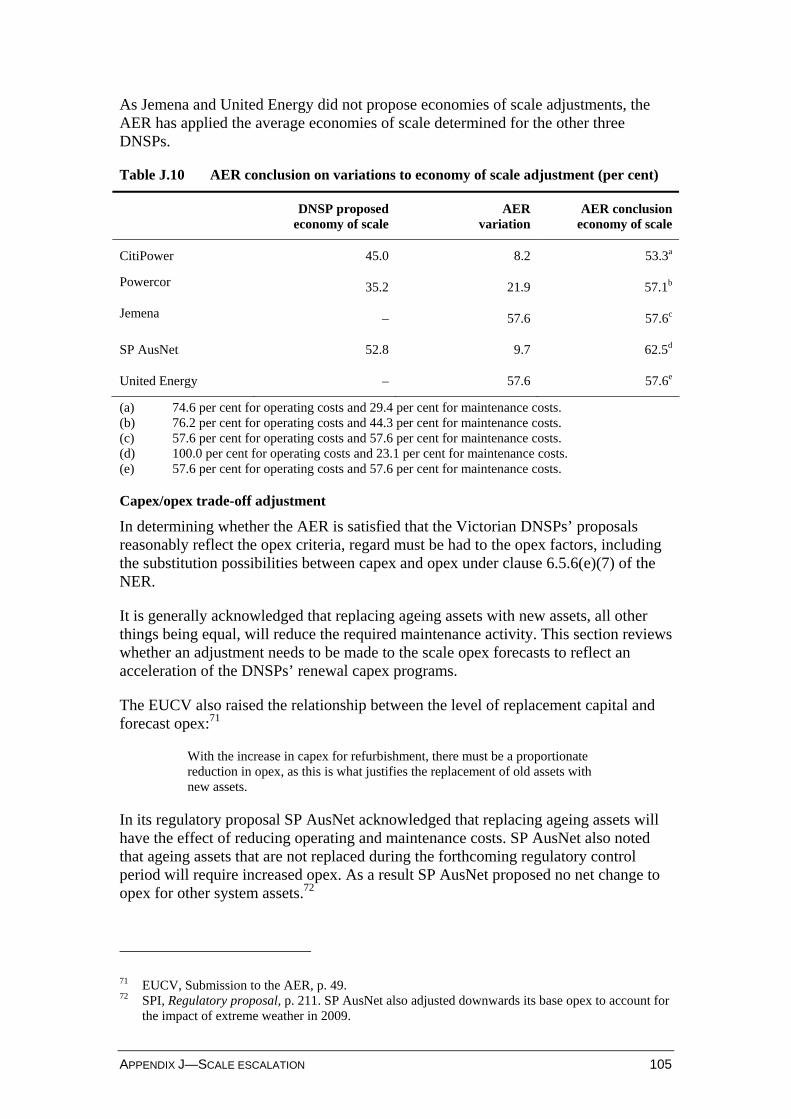
APPENDIX J—SCALE ESCALATION 105
As Jemena and United Energy did not propose economies of scale adjustments, the AER has applied the average economies of scale determined for the other three DNSPs.
Table J.10 AER conclusion on variations to economy of scale adjustment (per cent)
DNSP proposedeconomy of scale
AERvariation
AER conclusioneconomy of scale
CitiPower 45.0 8.2 53.3a
Powercor 35.2 21.9 57.1b
Jemena – 57.6 57.6c
SP AusNet 52.8 9.7 62.5d
United Energy – 57.6 57.6e
(a) 74.6 per cent for operating costs and 29.4 per cent for maintenance costs. (b) 76.2 per cent for operating costs and 44.3 per cent for maintenance costs. (c) 57.6 per cent for operating costs and 57.6 per cent for maintenance costs. (d) 100.0 per cent for operating costs and 23.1 per cent for maintenance costs. (e) 57.6 per cent for operating costs and 57.6 per cent for maintenance costs.
Capex/opex trade-off adjustment
In determining whether the AER is satisfied that the Victorian DNSPs’ proposals reasonably reflect the opex criteria, regard must be had to the opex factors, including the substitution possibilities between capex and opex under clause 6.5.6(e)(7) of the NER.
It is generally acknowledged that replacing ageing assets with new assets, all other things being equal, will reduce the required maintenance activity. This section reviews whether an adjustment needs to be made to the scale opex forecasts to reflect an acceleration of the DNSPs’ renewal capex programs.
The EUCV also raised the relationship between the level of replacement capital and forecast opex:71
With the increase in capex for refurbishment, there must be a proportionate reduction in opex, as this is what justifies the replacement of old assets with new assets.
In its regulatory proposal SP AusNet acknowledged that replacing ageing assets will have the effect of reducing operating and maintenance costs. SP AusNet also noted that ageing assets that are not replaced during the forthcoming regulatory control period will require increased opex. As a result SP AusNet proposed no net change to opex for other system assets.72
71 EUCV, Submission to the AER, p. 49. 72 SPI, Regulatory proposal, p. 211. SP AusNet also adjusted downwards its base opex to account for
the impact of extreme weather in 2009.
106 VICTORIAN DRAFT DISTRIBUTION DETERMINATION—DRAFT DECISION
The relationship between operating and maintenance activity and the age of a DNSP's network was examined extensively by Wilson Cook as part of the AER’s 2009–14 New South Wales distribution determinations.73 Wilson Cook concluded that the defect rate of assets is likely to remain relatively flat during the majority of its life span and it is only when the asset reaches the end of its life does the defect rate rise.74 However, it is at this time that it becomes economic to replace as opposed to maintain the asset.
This conclusion was also supported by PB in advising the AER in its 2011–16 South Australian distribution determination:75
PB would expect that a well-targeted, prioritised and optimised asset replacement program will reduce preventative maintenance requirements because older assets are more likely to be in poor condition to have been nominated for increased inspection and maintenance cycles. It is also reasonable to anticipate that the benefits of a well targeted replacement program will mean fewer unplanned asset failures requiring both defects rectification and emergency response, and will result in improved reliability and public safety.
In the case of the DNSP proposals, the rate of growth in reliability and quality maintained capex is likely to offset any increased maintenance expenditure on those assets exempt from the renewal program at the end of their effective life. Nuttall Consulting reported that the proportion of the network over 90 per cent of the asset life was between 2.3 per cent for SP AusNet and 3.5 per cent for United Energy.76 The replacement capex allowance is targeted at these ‘old assets’ as it becomes economic to replace as opposed to repair such assets in order to maintain service performance. This view is supported by Wilson Cook’s observations on defect rates above. In advising on the replacement capex allowance, Nuttall Consulting observed:77
Based upon our review, and considering the findings of our repex modelling and the past overestimation of RQM [reliability quality maintained] requirements, we consider that the RQM allowance should be based on the recent historical levels with some additional allowance for aging of the network. We consider that the results of our repex modelling can be used as a reasonable estimate of the increases required due to the aging.
The implication is that the effect of increased replacement capex should be considered in the calculation of the rate of scale escalation. SP AusNet did not provide additional material to suggest this is not the case.78
73 Wilson Cook, Review of ACT & New South Wales: Energy Australia’s submissions of January and
February 2009, p. 27. 74 The rising cost trend is applicable only to assets of greater than 50 years in age (and even then, it is
seen to be volatile). For assets in the range of age of 5 to 45 years, where the bulk of assets are expected to reside, the defect rate with age is flat. Wilson Cook, Review of ACT & New South Wales: Energy Australia’s submissions of January and February 2009, p. 27.
75 PB, Review of ETSA utilities, November 2009, p. 144. 76 Nuttall Consulting, Report—capital expenditure, Victorian electricity distribution price review, a
report to the AER, confidential—final report, 6 May 2010, p. 37. 77 ibid., p 65. 78 In advising the AER in its 2011–16 South Australian distribution final determination, PB
recommended the AER remove the additional top down adjustment on the basis that ETSA
APPENDIX J—SCALE ESCALATION 107
The methodology for determining the quantum of the trade-off used in this draft decision is based on the approach adopted by PB.79
Specifically, the methodology involves calculating the annual ratio of compounding renewal capex to an estimate of the current (undepreciated) replacement cost of the asset base, and then applying 20 per cent of this ratio to calculate the recommended adjustment to the forecast operating and maintenance expenditure allowance.80
An estimate of the current (undepreciated) asset replacement cost was provided by CitiPower, Powercor and United Energy in each of their regulatory proposals.81 The AER observed that each of the DNSPs' closing RABs approximated 40 per cent of their current (undepreciated) asset replacement cost.82 For the purpose of the draft decision the current (undepreciated) asset replacement cost for Jemena and SP AusNet was set at 2.5 times their closing 2010 RAB (equivalent to 40 per cent).
Table J.11 below outlines the approach taken to determining the quantum of the trade-off for each DNSP.
Utilities revised proposal regarding the impact on opex from network age included consideration of the capex/opex trade-off. See PB, Review of ETSA utilities’ revised regulatory proposal for the period July 2010 to June 2015, for Australian Energy Regulator, May 2010, p. 38. For this draft decision, on the basis of the information available, the AER considers the net impact to be a minor reduction in opex.
79 PB, Review of ETSA Utilities, November 2009, p. 144. 80 ibid. The 20 per cent factor accounts for reduced defect requirements with replaced assets, and
effectively reflects the proportion of total maintenance that is typically experienced by network owners associated with rectifying defects compared with the amount associated with routine inspections and maintenance. This proportion has been identified as typical, based on PB’s experience working with a number of network owners across Australia.
81 CitiPower cost escalation model; Powercor cost escalation model; and United Energy remaining life model.
82 2010 closing RAB, CitiPower (46.5 per cent), Powercor (34.1 per cent) and United Energy (39.2 per cent).
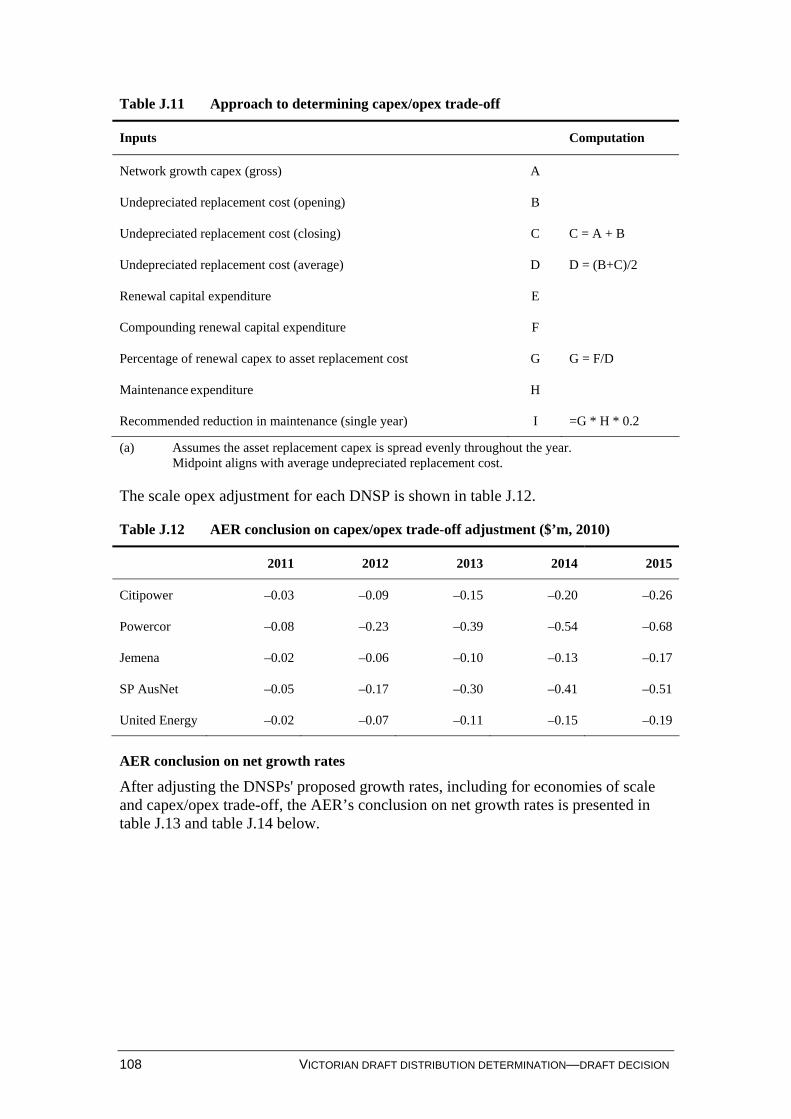
108 VICTORIAN DRAFT DISTRIBUTION DETERMINATION—DRAFT DECISION
Table J.11 Approach to determining capex/opex trade-off
Inputs Computation
Network growth capex (gross) A
Undepreciated replacement cost (opening) B
Undepreciated replacement cost (closing) C C = A + B
Undepreciated replacement cost (average) D D = (B+C)/2
Renewal capital expenditure E
Compounding renewal capital expenditure F
Percentage of renewal capex to asset replacement cost G G = F/D
Maintenance expenditure H
Recommended reduction in maintenance (single year) I =G * H * 0.2
(a) Assumes the asset replacement capex is spread evenly throughout the year. Midpoint aligns with average undepreciated replacement cost.
The scale opex adjustment for each DNSP is shown in table J.12.
Table J.12 AER conclusion on capex/opex trade-off adjustment ($’m, 2010)
2011 2012 2013 2014 2015
Citipower –0.03 –0.09 –0.15 –0.20 –0.26
Powercor –0.08 –0.23 –0.39 –0.54 –0.68
Jemena –0.02 –0.06 –0.10 –0.13 –0.17
SP AusNet –0.05 –0.17 –0.30 –0.41 –0.51
United Energy –0.02 –0.07 –0.11 –0.15 –0.19
AER conclusion on net growth rates
After adjusting the DNSPs' proposed growth rates, including for economies of scale and capex/opex trade-off, the AER’s conclusion on net growth rates is presented in table J.13 and table J.14 below.
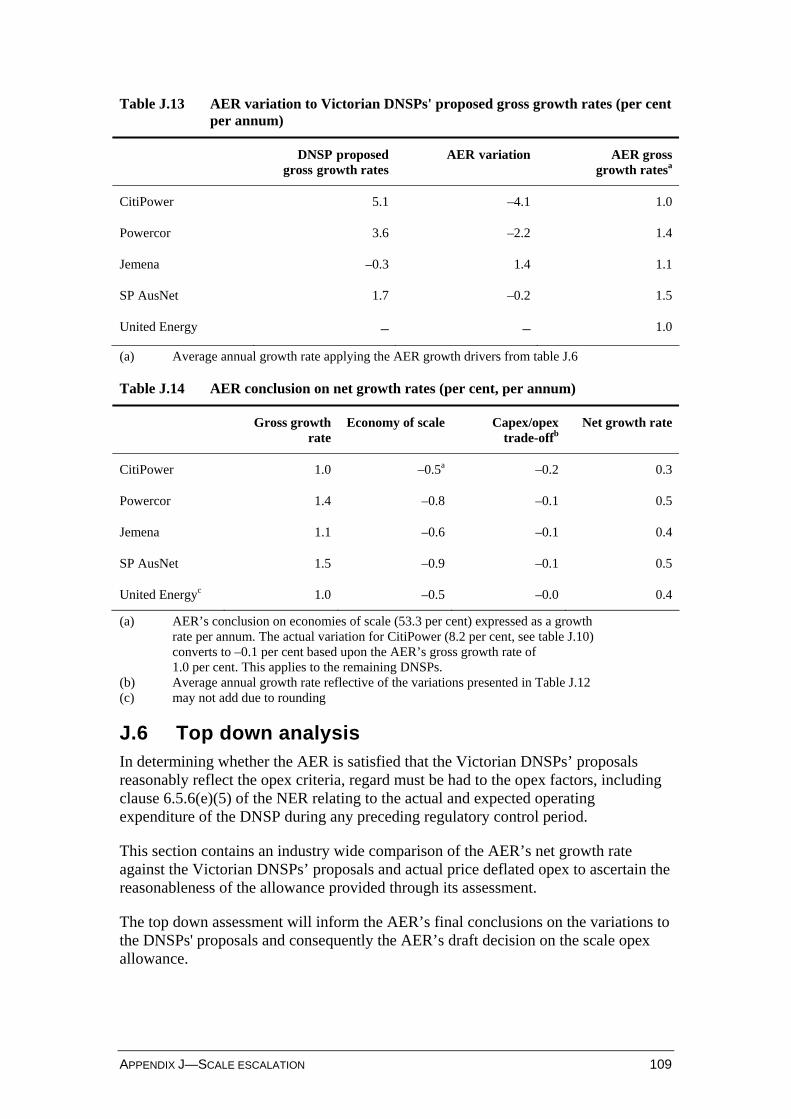
APPENDIX J—SCALE ESCALATION 109
Table J.13 AER variation to Victorian DNSPs' proposed gross growth rates (per cent per annum)
DNSP proposed gross growth rates
AER variation AER grossgrowth ratesa
CitiPower 5.1 –4.1 1.0
Powercor 3.6 –2.2 1.4
Jemena –0.3 1.4 1.1
SP AusNet 1.7 –0.2 1.5
United Energy – – 1.0
(a) Average annual growth rate applying the AER growth drivers from table J.6
Table J.14 AER conclusion on net growth rates (per cent, per annum)
Gross growth rate
Economy of scale Capex/opextrade-offb
Net growth rate
CitiPower 1.0 –0.5a –0.2 0.3
Powercor 1.4 –0.8 –0.1 0.5
Jemena 1.1 –0.6 –0.1 0.4
SP AusNet 1.5 –0.9 –0.1 0.5
United Energyc 1.0 –0.5 –0.0 0.4
(a) AER’s conclusion on economies of scale (53.3 per cent) expressed as a growth rate per annum. The actual variation for CitiPower (8.2 per cent, see table J.10) converts to –0.1 per cent based upon the AER’s gross growth rate of 1.0 per cent. This applies to the remaining DNSPs.
(b) Average annual growth rate reflective of the variations presented in Table J.12 (c) may not add due to rounding
J.6 Top down analysis In determining whether the AER is satisfied that the Victorian DNSPs’ proposals reasonably reflect the opex criteria, regard must be had to the opex factors, including clause 6.5.6(e)(5) of the NER relating to the actual and expected operating expenditure of the DNSP during any preceding regulatory control period.
This section contains an industry wide comparison of the AER’s net growth rate against the Victorian DNSPs’ proposals and actual price deflated opex to ascertain the reasonableness of the allowance provided through its assessment.
The top down assessment will inform the AER’s final conclusions on the variations to the DNSPs' proposals and consequently the AER’s draft decision on the scale opex allowance.
110 VICTORIAN DRAFT DISTRIBUTION DETERMINATION—DRAFT DECISION
In order to develop a like-for-like comparison of actual trend opex and the AER’s scale opex allowance, actual opex needs to be deflated to remove the impact of CPI and real input price changes.
The AER notes in its 2008 final decision on gas access arrangements, the ESCV represented the rate of change in opex according to the following formula:83
Δ real opex = Δ opex price less Δ change in opex PFP plus Δ output quantity less Δ in CPI
In this formula, the rate of change in opex is a function of real changes in input prices (net of CPI) and changes in output quantity net of changes in partial factor productivity (PFP).
In terms of examining the impact of growth in the size of the network, by removing the influence of CPI and input price movements, the resultant change in opex can be narrowed to growth in the size of the network (scale escalation) and PFP (identified gains – economies of scale and unidentified gains – technology improvements).
The opex data presented in table J.15 below has been deflated to represent the residual changes due to growth and efficiency gains.
The opex data is sourced from the DNSPs' proposals and has been deflated using CPI and an ABS index of wage growth (as a proxy for input price changes).84
The trend in deflated opex has been established by taking the annual average rate of change between the first and second regulatory control periods85 (2001–05 and 2006–8 respectively). The average annual rate of change was computed over four periods (between the midpoints—2003 and 2007). The midpoints were calculated as the average opex for each regulatory control period.86
Where the rate of change in actual opex is greater than zero, the impact of growth has exceeded savings from realised efficiency gains. Where the rate of change in actual opex is less than zero the effect of efficiency gains has exceeded the impact of growth on opex.
The results in table J.15 show that the impact of efficiency gains significantly outweighed the impact of growth over the preceding two regulatory control periods. Actual deflated opex fell between 2003 and 2007, being the midpoints of the prior and current periods (based on actual audited data), by 2.4 per cent per annum. The results also reveal that the net reductions are greatest for operating costs as opposed to maintenance costs. This is consistent with the industry level growth rates applied by the AER (0.3 per cent per annum for operating costs and 0.6 per cent per annum for
83 ESCV, Gas access arrangement review 2008–2012, final decision – public version, Melbourne,
Vic, 7 March 2008, p. 224. 84 ABS, 6345.0 Labour price index, Australia, total hourly rates of pay excluding bonuses: sector by
industry, original (financial year index numbers for year ended June quarter), Private, electricity, gas, water and waste services. www.abs.gov.au.
85 Using actual audited opex. 86 The average taken over the 2006 to 2008 period was also adjusted for step changes to ensure a like-
for-like business as usual comparison with the 2001 to 2005 regulatory control period.
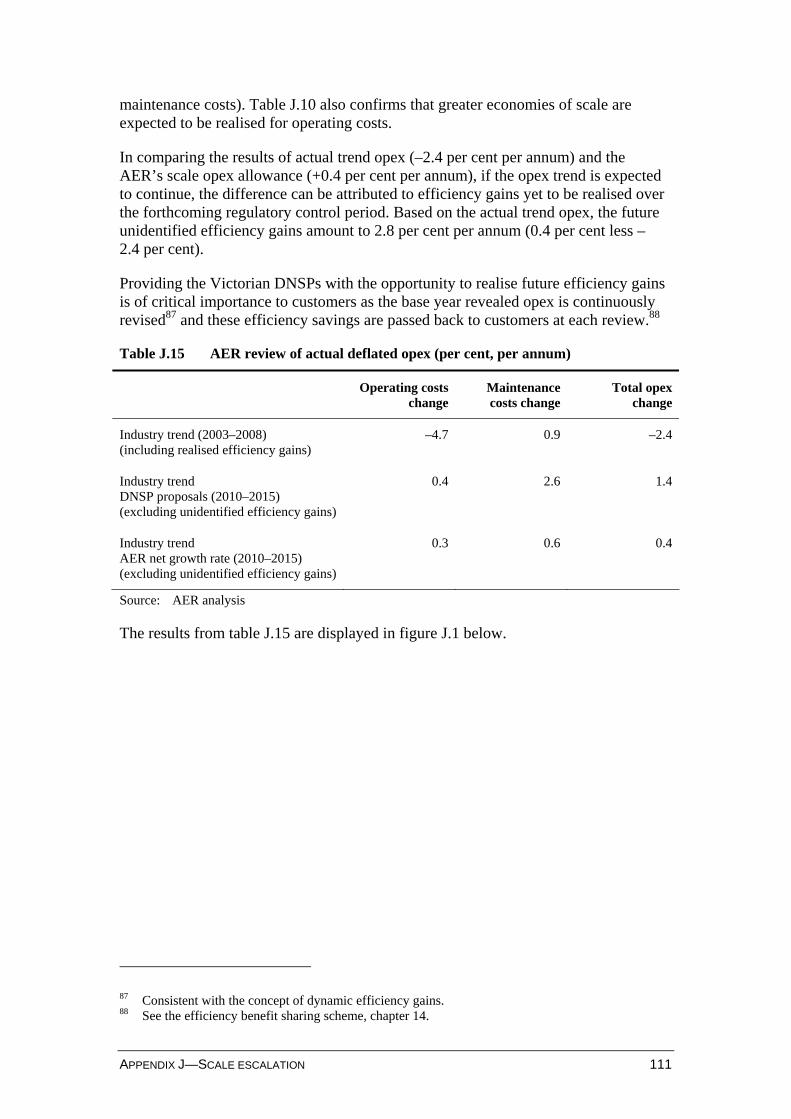
APPENDIX J—SCALE ESCALATION 111
maintenance costs). Table J.10 also confirms that greater economies of scale are expected to be realised for operating costs.
In comparing the results of actual trend opex (–2.4 per cent per annum) and the AER’s scale opex allowance (+0.4 per cent per annum), if the opex trend is expected to continue, the difference can be attributed to efficiency gains yet to be realised over the forthcoming regulatory control period. Based on the actual trend opex, the future unidentified efficiency gains amount to 2.8 per cent per annum (0.4 per cent less –2.4 per cent).
Providing the Victorian DNSPs with the opportunity to realise future efficiency gains is of critical importance to customers as the base year revealed opex is continuously revised87 and these efficiency savings are passed back to customers at each review.88
Table J.15 AER review of actual deflated opex (per cent, per annum)
Operating costs change
Maintenance costs change
Total opexchange
Industry trend (2003–2008) (including realised efficiency gains)
–4.7 0.9 –2.4
Industry trend DNSP proposals (2010–2015) (excluding unidentified efficiency gains)
0.4 2.6 1.4
Industry trend AER net growth rate (2010–2015) (excluding unidentified efficiency gains)
0.3 0.6 0.4
Source: AER analysis
The results from table J.15 are displayed in figure J.1 below.
87 Consistent with the concept of dynamic efficiency gains. 88 See the efficiency benefit sharing scheme, chapter 14.
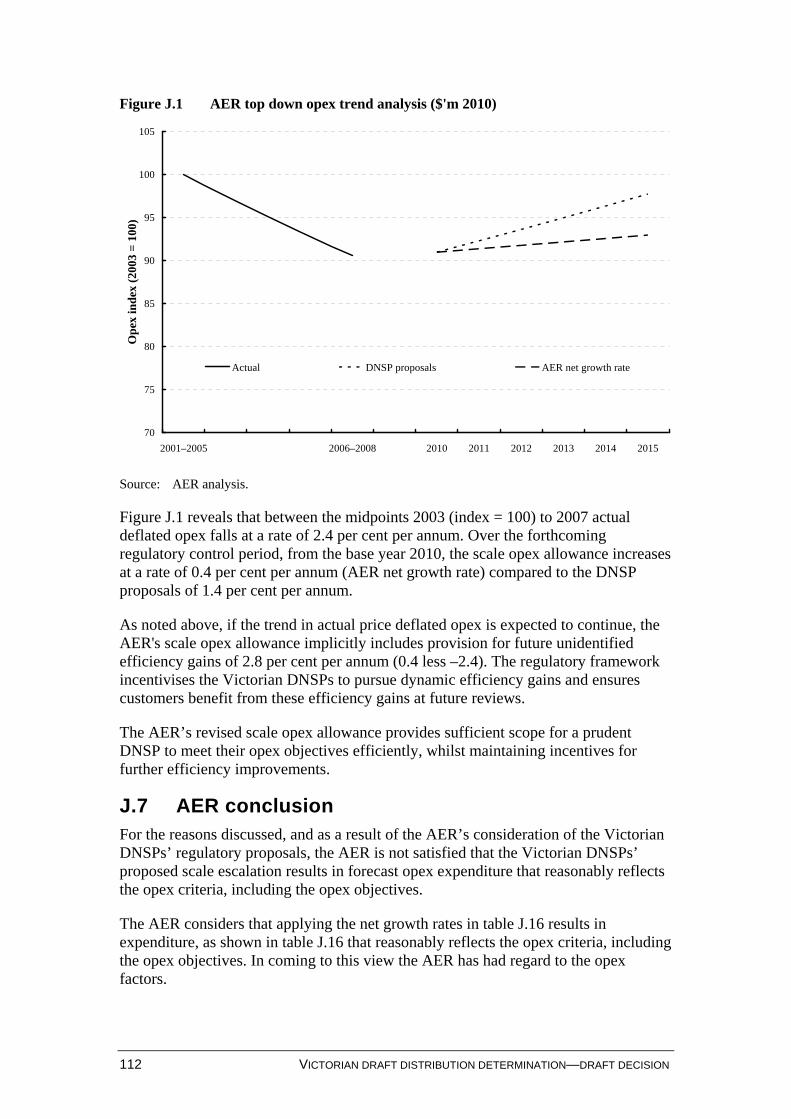
112 VICTORIAN DRAFT DISTRIBUTION DETERMINATION—DRAFT DECISION
Figure J.1 AER top down opex trend analysis ($'m 2010)
70
75
80
85
90
95
100
105
2001–2005 2006–2008 2010 2011 2012 2013 2014 2015
Op
ex in
dex
(20
03 =
100
)
Actual DNSP proposals AER net growth rate
Source: AER analysis.
Figure J.1 reveals that between the midpoints 2003 (index = 100) to 2007 actual deflated opex falls at a rate of 2.4 per cent per annum. Over the forthcoming regulatory control period, from the base year 2010, the scale opex allowance increases at a rate of 0.4 per cent per annum (AER net growth rate) compared to the DNSP proposals of 1.4 per cent per annum.
As noted above, if the trend in actual price deflated opex is expected to continue, the AER's scale opex allowance implicitly includes provision for future unidentified efficiency gains of 2.8 per cent per annum (0.4 less –2.4). The regulatory framework incentivises the Victorian DNSPs to pursue dynamic efficiency gains and ensures customers benefit from these efficiency gains at future reviews.
The AER’s revised scale opex allowance provides sufficient scope for a prudent DNSP to meet their opex objectives efficiently, whilst maintaining incentives for further efficiency improvements.
J.7 AER conclusion For the reasons discussed, and as a result of the AER’s consideration of the Victorian DNSPs’ regulatory proposals, the AER is not satisfied that the Victorian DNSPs’ proposed scale escalation results in forecast opex expenditure that reasonably reflects the opex criteria, including the opex objectives.
The AER considers that applying the net growth rates in table J.16 results in expenditure, as shown in table J.16 that reasonably reflects the opex criteria, including the opex objectives. In coming to this view the AER has had regard to the opex factors.
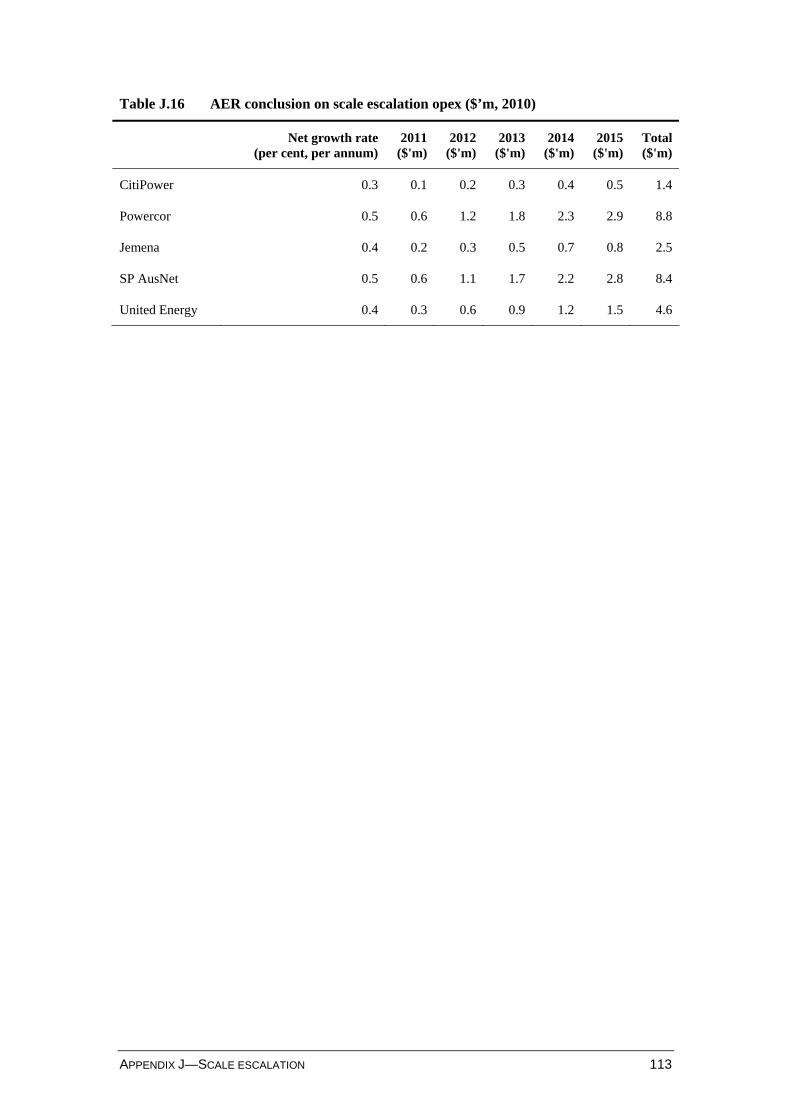
APPENDIX J—SCALE ESCALATION 113
Table J.16 AER conclusion on scale escalation opex ($’m, 2010)
Net growth rate(per cent, per annum)
2011($'m)
2012($'m)
2013($'m)
2014 ($'m)
2015 ($'m)
Total($'m)
CitiPower 0.3 0.1 0.2 0.3 0.4 0.5 1.4
Powercor 0.5 0.6 1.2 1.8 2.3 2.9 8.8
Jemena 0.4 0.2 0.3 0.5 0.7 0.8 2.5
SP AusNet 0.5 0.6 1.1 1.7 2.2 2.8 8.4
United Energy 0.4 0.3 0.6 0.9 1.2 1.5 4.6
114 VICTORIAN DRAFT DISTRIBUTION DETERMINATION—DRAFT DECISION
K Real cost escalators
K.1 Introduction In recent regulatory determinations for electricity network service providers (NSP), the AER has allowed capital expenditure (capex) and/or operating expenditure (opex) allowances to be escalated, in real terms, for expected input cost increases.1 This involves the disaggregation of expenditure allowances into specific inputs (for example labour, land and materials) which are priced in terms of a base year. These base year costs are increased or decreased for each year of the regulatory control period relative to changes in the real price level. The nominal price level (that is the real price plus inflation) is taken into account when prices and revenues are adjusted at the aggregated level under the CPI–X control mechanism.
The methodology employed to determine the real cost escalators generally combines forecast movements in the price of input components with weightings for the relative contribution of each of the components to final equipment / project costs. This in turn generates real capex and opex forecasts for the regulatory control period. The weightings are typically specific to each regulated business, given differences in the composition of their respective expenditure forecasts.
Historically, the objective of introducing real cost escalation has been to take account of the impact of the commodities boom and skills shortages in the engineering field in Australia in recent years. In light of these external factors, the AER has considered that cost escalation at CPI did not reasonably reflect a realistic expectation of the movement in some of the input costs faced by electricity NSPs. The AER has previously expressed that the real cost escalation regime should be applied symmetrically to also reflect real cost decreases.2 This approach provides the opportunity for NSPs to recover the efficient costs of real increases, while ensuring that end users receive the benefit of real cost reductions.
Given that there is no futures market for the procurement and installation of electrical equipment (for example transformers, switchgear), in previous AER decisions cost escalation rates have been estimated with reference to the expected growth in key input ‘cost factors’ such as:
copper
aluminium
steel
crude oil 1 For example, see AER, New South Wales Distribution determination 2009–10 to 2013–14, Final
decision, April 2009, pp. 478–507; AER, Queensland distribution determination 2010–11 to 2014–15, Final decision, May 2010, pp. 397–413; and AER, South Australia distribution determination 2010–11 to 2014–15, Final decision, May 2010, pp. 324–333.
2 AER, SP AusNet transmission determination 2008–09 to 2013–14, Final decision, January 2008, p. 80.
APPENDIX K—REAL COST ESCALATORS 115
construction costs
electricity, gas and water (EGW) sector labour costs
general labour costs
land and easement costs.3
All other inputs are typically escalated in line with CPI only.
In assessing the escalators proposed by the Victorian DNSPs, the AER considers that its conclusions from the recent final New South Wales (NSW), Australian Capital Territory (ACT), Queensland (QLD) and South Australian (SA) decisions are still applicable with respect to the methodology used for estimating each escalator.4
The AER has a preference for updating real cost escalation factors with the most up to date forecasts at the time of its final decision. This preference is consistent with the capex and opex criterion in the NER which requires the AER to be satisfied that the capex and opex forecasts reasonably reflect a realistic expectation of demand forecast and cost inputs required to achieve the capex and opex objectives.5 The AER considers that using the most recently available data to update cost escalation forecasts, where appropriate, satisfies this requirement.
K.2 Summary of Victorian DNSP regulatory proposals The Victorian DNSPs engaged consultants BIS Shrapnel and Sinclair Knight Merz (SKM) to develop real cost escalation rates for the forthcoming regulatory control period.
BIS Shrapnel provided a wages outlook for both the utilities (electricity, gas and water) and outsourced services sectors (construction, and property and business services) in Victoria. The outlook forecasts continued upward pressure on wages throughout the forthcoming regulatory control period.6
SKM proposed methods for escalating base metals, oil, construction costs and other inputs that are largely consistent with the methods the AER has applied in recent decisions.7 However, not all the Victorian DNSPs applied SKM’s methods, with United Energy noting that it was not relevant as it relied heavily on outsourced services.
3 For example, see AER, New South Wales distribution determination, Final decision, April 2009,
pp. 478–507; AER, Queensland distribution determination, Final decision, May 2010, pp. 397–413; and AER, South Australia distribution determination, Final decision, May 2010, pp. 324–333.
4 ibid. 5 NER, cll. 6.5.6 (c)(3) and 6.5.7 (c)(3). 6 BIS Shrapnel, Wages Outlook for the Electricity Distribution Sector in Victoria, August 2009, p. 2. 7 For example, see AER, New South Wales distribution determination, Final decision, April 2009,
pp. 478–507; AER, Queensland distribution determination, Final decision, May 2010, pp. 397–413; and AER, South Australia distribution determination, Final decision, May 2010, pp. 324–333.
116 VICTORIAN DRAFT DISTRIBUTION DETERMINATION—DRAFT DECISION
Each of the proposed key escalators are discussed below.
K.3 Materials cost escalators This section discusses the materials cost escalators proposed by the Victorian DNSPs to apply to their forecast capex and opex allowances in the forthcoming regulatory control period.
K.3.1 Victorian DNSP proposals
The Victorian DNSPs engaged SKM to provide price movement forecasts for key material inputs.8 As part of this process, SKM developed the following escalators for the Victorian DNSPs:
Aluminium and copper
Steel
Crude oil
Wood poles
Construction costs
Exchange rates and inflation (used to develop the materials cost escalators)
Trade weighted index (TWI).
For each escalator, SKM developed forecasts that considered the cost of carbon under two carbon pollution reduction scheme (CPRS) scenarios, as well as a base case scenario, where the CPRS was not factored into the forecasts.9 SKM’s approach to carbon is discussed in more detail in section K.5.2.
CitiPower and Powercor adopted the input cost escalators proposed by SKM under the CPRS5 EITE scenario, but did not provide a breakdown by material in their regulatory proposal.10 Instead, these forecasts were used to provide a weighted average escalator that was applied to each capital expenditure category.11
8 SKM, Victorian Distribution Network Service Providers annual material cost escalators 2010–15
Final Report, 11 November 2009 (CitiPower, Regulatory proposal 2011 to 2015, Appendix C0041, 30 November 2009; Powercor, Regulatory proposal 2011 to 2015, Appendix P0041, 30 November 2009; Jemena, Regulatory proposal 2011–15, Appendix 7.1, 30 November 2009; SP AusNet, Electricity Distribution Price Review, Regulatory proposal, Appendix H, November 2009; United Energy, Regulatory proposal for distribution prices and services, January 2011–December 2015, Appendix D-2, November 2009)
9 The two CPRS scenarios developed by SKM were a minimum 5 per cent reduction in greenhouse gas emissions with emissions intensive trade exposed assistance (CPRS5 EITE) and a minimum 25 per cent reduction in emissions (CPRS25).
10 CitiPower, Regulatory proposal 2011 to 2015, 30 November 2009, pp. 234–235; Powercor, Regulatory proposal, 2011 to 2015, 30 November 2009 pp. 235–236.
11 ibid.
APPENDIX K—REAL COST ESCALATORS 117
Jemena Electricity Networks (Jemena) also utilised the SKM escalators developed under the CPRS5 EITE scenario.12 However, its regulatory proposal indicated that only the steel and aluminium input cost escalators were applied.13 Jemena subsequently clarified that the material cost escalators contained in appendix B of its SKM report were applied as part of its regulatory proposal.14
SP AusNet applied material escalators based on SKM’s base case scenario (no CPRS).15 SP AusNet provided a breakdown of materials cost escalators for capex, but applied its own weightings to a number of its materials.16 SP AusNet did not apply any material cost escalators to opex.17
United Energy did not apply any input cost escalators as part of its regulatory proposal. United Energy stated that the use of input cost escalators was not relevant to it as it relied heavily on outsourced services. Specifically, United Energy stated that it:
… has embarked upon a competitive tendering process… Whilst UED’s asset management plan determines the required volume of services for the forthcoming regulatory period, it is a matter for bidders to forecast input costs, such as labour and materials.18
K.3.2 Submissions
The Energy Users Coalition of Victoria (EUCV) was concerned that the AER’s overarching approach to materials cost escalation allowed electricity transport businesses ‘real’ cost increases when other businesses have to operate without them.
The EUCV considered that this approach:
did not subject the Victorian DNSPs to the downward pressures imposed by competition and essentially precluded any requirement for the Victorian DNSPs to improve productivity19
was inconsistent with the objective of achieving efficient costs20
increased the risks consumers face under the regulatory process by allowing larger than CPI adjustments for materials.21
12 Jemena, Response to information requested, 21 December 2009, p. 2. 13 Jemena, Regulatory proposal 2011-2015, 30 November 2009, p. 136. 14 Jemena, Response to information requested on 15 December 2009, 21 December 2009, pp. 1–2. 15 SP AusNet, response to information requested on 16 February 2010, 26 February 2010, p. 8. 16 SP AusNet’s approach is different to that applied by the other Victorian DNSPs (excluding
United Energy), which applied weightings determined by SKM. SP AusNet, Regulatory proposal, p. 171.
17 SP AusNet acknowledged that contradictory statements made in its regulatory proposal regarding the application of material cost input escalators to its opex were incorrect and clarified that no material cost escalation for opex was being sought: SP AusNet, response to information requested on 22 January 2010, submitted on 5 February 2010, p. 28.
18 United Energy, Regulatory proposal for Distribution Prices and Services, January 2011 - December 2011, November 2009, p. 52.
19 EUCV, A response to applications from CitiPower, Jemena, Powercor, SP AusNet and United Energy, February 2010, p. 30.
20 ibid.
118 VICTORIAN DRAFT DISTRIBUTION DETERMINATION—DRAFT DECISION
The EUCV also considered that the Victorian DNSPs should not be able to increase capex for materials cost escalation for the forthcoming regulatory control period without identifying the level of the materials cost elements implicit within the cost elements of the current regulatory control period.22
Finally, the EUCV considered that since materials costs were decreasing to levels akin to the long term average, a return to the basic premise of CPI adjustments was warranted.23
AER considerations
The AER acknowledges the EUCV’s concerns but does not consider a departure from its current approach to materials input cost escalation is appropriate. The EUCV notes that the prices of some materials have fallen significantly to the point where they are much closer to long term averages.24 The AER considers that its methodology for estimating input cost escalation rates (see section K.3.3) ensures that the most recent data on prices is reflected in its decisions.
The AER also notes that negative escalation rates have and will be applied where costs are forecast to decline. This approach ensures that all Victorian DNSPs experience upward and downward pressure on prices.
The AER agrees with the EUCV that the Victorian DNSPs should identify the amount of capex attributed to materials escalation. The AER notes that this was a requirement of the Regulatory Information Notice (RIN) that all the Victorian DNSPs were required to comply with as part of their regulatory proposals. The AER sought clarification from the Victorian DNSPs on the information provided and requested additional information during the review process.
K.3.3 Assessment of Escalators
K.3.3.1 Aluminium and copper
SKM developed input cost escalators for aluminium and copper through a combination of futures contract prices and economic forecasts. SKM determined the average spot price on the London Metal Exchange (LME) over the last 30 days, and the average 3 month, 15 month and 27 month LME contract prices. SKM then plotted the Consensus Economics long-term forecast (taken as 7.5 years from the survey date), and linearly interpolated each of the above data points. The corresponding December points were identified in the interpolated results and fed into SKM’s model.25
Given the Consensus Economics long-term data is in real form, SKM converted this data to nominal dollars to interpolate with the nominal LME market prices. SKM’s methodology was to convert real United States dollar (USD) values to real Australian
21 EUCV, Submission to the AER, p. 36. 22 ibid., p. 33. 23 ibid., p. 34. 24 ibid., p. 34. 25 SKM, Victorian Distribution Network Service Providers annual material cost escalators 2010–15
Final Report, p. 28.
APPENDIX K—REAL COST ESCALATORS 119
dollar (AUD) values using SKM forecast USD/AUD exchange rates. Real AUD values were then converted to nominal AUD values.
Based on this approach, the escalation rates for aluminium and copper that SKM calculated for the Victorian DNSPs are shown in table K.1 and table K.2.
Table K.1 SKM proposed aluminium real cost escalators (per cent)
2010 2011 2012 2013 2014 2015
CitiPower/Powercor/Jemena 18.5 7.7 6.2 6.4 6.0 5.7
SP AusNeta 15.9 5.1 3.7 3.9 3.4 3.1
(a) SP AusNet applied its own weightings to SKM’s analysis. SP AusNet’s numbers are for capex only.
Source: SKM, Victorian Distribution Network Service Providers annual material cost escalators 2010–15, p. 31; SP AusNet, Regulatory proposal, p. 171.
Table K.2 SKM proposed copper real cost escalators (per cent)
2010 2011 2012 2013 2014 2015
CitiPower/Powercor/Jemena 16.9 1.7 –1.3 –1.8 –1.8 –1.8
SP AusNeta 14.3 –0.7b –3.7b –4.1b –4.1 –4.2
(a) SP AusNet applied its own weightings to SKM’s analysis. SP AusNet’s numbers are for capex only.
(b) Revised numbers: SP AusNet's regulatory proposal figures were incorrect. SP AusNet, response to information requested on 16 February 2010, submitted on 26 February 2010, p. 9.
Source: SKM, Victorian Distribution Network Service Providers annual material cost escalators 2010–15, p. 31; SP AusNet, Regulatory proposal, p. 171.
AER considerations
The method proposed by SKM to forecast the escalation of aluminium and copper costs for the Victorian DNSPs is broadly consistent with the method allowed by the AER in recent decisions for other DNSPs.26 This method is based on the interpolation of LME spot and forward contract prices with Consensus Economics long term forecasts.
However, the AER is not satisfied that the approach SKM has taken to forecast the exchange rates used to restate the USD based market prices of aluminium and copper provides a realistic expectation of cost inputs. Instead, the AER has converted the interpolated series from nominal USD to nominal AUD through the use of the Econtech ANSIO exchange rate forecasts. The figures were then converted to real forecast mineral prices using the updated Australian inflation forecast, as discussed in section K.5.1.
26 For example, see AER, New South Wales distribution determination, Final decision, April 2009,
pp. 478–507; AER, Queensland distribution determination, Final decision, May 2010, pp. 397–413; and AER, South Australia distribution determination, Final decision, May 2010, pp. 324–333.
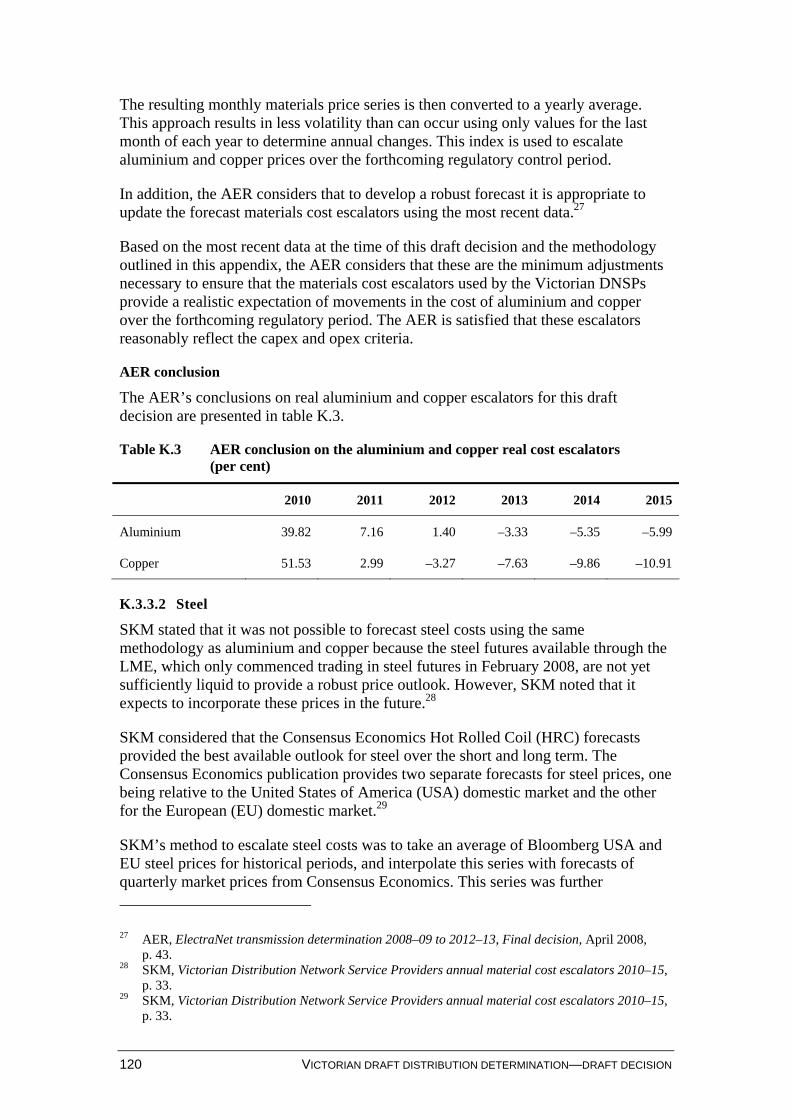
120 VICTORIAN DRAFT DISTRIBUTION DETERMINATION—DRAFT DECISION
The resulting monthly materials price series is then converted to a yearly average. This approach results in less volatility than can occur using only values for the last month of each year to determine annual changes. This index is used to escalate aluminium and copper prices over the forthcoming regulatory control period.
In addition, the AER considers that to develop a robust forecast it is appropriate to update the forecast materials cost escalators using the most recent data.27
Based on the most recent data at the time of this draft decision and the methodology outlined in this appendix, the AER considers that these are the minimum adjustments necessary to ensure that the materials cost escalators used by the Victorian DNSPs provide a realistic expectation of movements in the cost of aluminium and copper over the forthcoming regulatory period. The AER is satisfied that these escalators reasonably reflect the capex and opex criteria.
AER conclusion
The AER’s conclusions on real aluminium and copper escalators for this draft decision are presented in table K.3.
Table K.3 AER conclusion on the aluminium and copper real cost escalators (per cent)
2010 2011 2012 2013 2014 2015
Aluminium 39.82 7.16 1.40 –3.33 –5.35 –5.99
Copper 51.53 2.99 –3.27 –7.63 –9.86 –10.91
K.3.3.2 Steel
SKM stated that it was not possible to forecast steel costs using the same methodology as aluminium and copper because the steel futures available through the LME, which only commenced trading in steel futures in February 2008, are not yet sufficiently liquid to provide a robust price outlook. However, SKM noted that it expects to incorporate these prices in the future.28
SKM considered that the Consensus Economics Hot Rolled Coil (HRC) forecasts provided the best available outlook for steel over the short and long term. The Consensus Economics publication provides two separate forecasts for steel prices, one being relative to the United States of America (USA) domestic market and the other for the European (EU) domestic market.29
SKM’s method to escalate steel costs was to take an average of Bloomberg USA and EU steel prices for historical periods, and interpolate this series with forecasts of quarterly market prices from Consensus Economics. This series was further
27 AER, ElectraNet transmission determination 2008–09 to 2012–13, Final decision, April 2008,
p. 43. 28 SKM, Victorian Distribution Network Service Providers annual material cost escalators 2010–15,
p. 33. 29 SKM, Victorian Distribution Network Service Providers annual material cost escalators 2010–15,
p. 33.
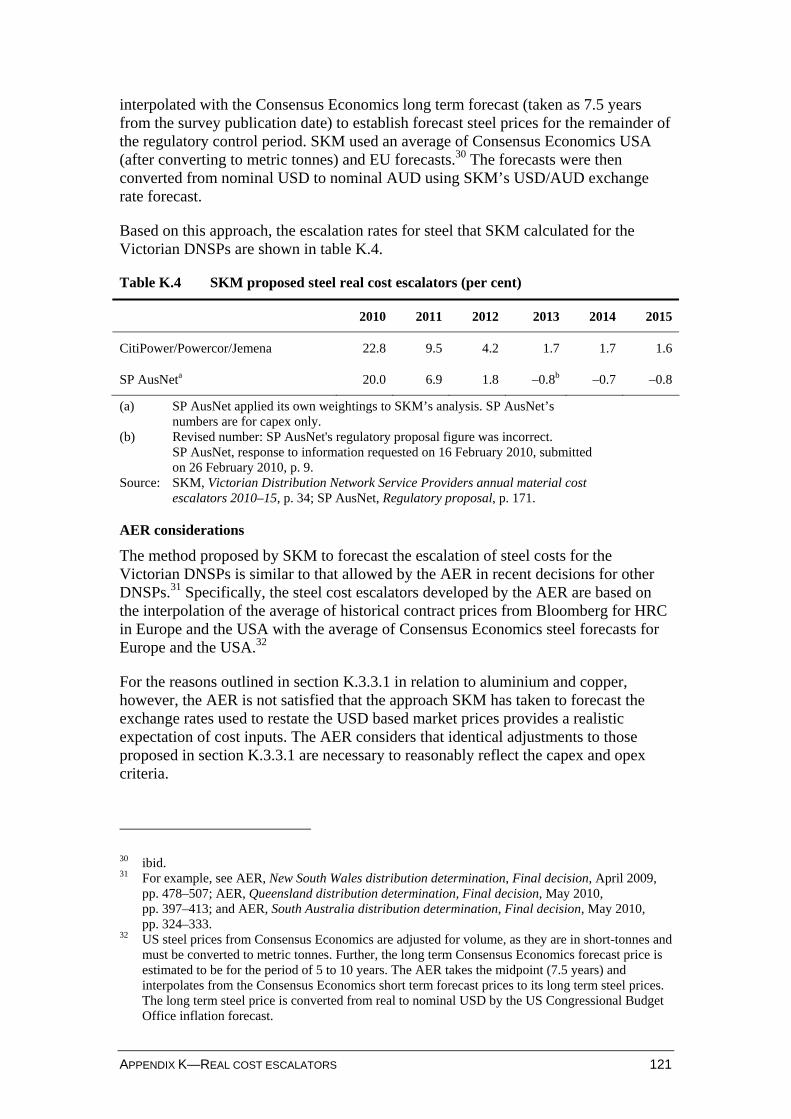
APPENDIX K—REAL COST ESCALATORS 121
interpolated with the Consensus Economics long term forecast (taken as 7.5 years from the survey publication date) to establish forecast steel prices for the remainder of the regulatory control period. SKM used an average of Consensus Economics USA (after converting to metric tonnes) and EU forecasts.30 The forecasts were then converted from nominal USD to nominal AUD using SKM’s USD/AUD exchange rate forecast.
Based on this approach, the escalation rates for steel that SKM calculated for the Victorian DNSPs are shown in table K.4.
Table K.4 SKM proposed steel real cost escalators (per cent)
2010 2011 2012 2013 2014 2015
CitiPower/Powercor/Jemena 22.8 9.5 4.2 1.7 1.7 1.6
SP AusNeta 20.0 6.9 1.8 –0.8b –0.7 –0.8
(a) SP AusNet applied its own weightings to SKM’s analysis. SP AusNet’s numbers are for capex only.
(b) Revised number: SP AusNet's regulatory proposal figure was incorrect. SP AusNet, response to information requested on 16 February 2010, submitted on 26 February 2010, p. 9.
Source: SKM, Victorian Distribution Network Service Providers annual material cost escalators 2010–15, p. 34; SP AusNet, Regulatory proposal, p. 171.
AER considerations
The method proposed by SKM to forecast the escalation of steel costs for the Victorian DNSPs is similar to that allowed by the AER in recent decisions for other DNSPs.31 Specifically, the steel cost escalators developed by the AER are based on the interpolation of the average of historical contract prices from Bloomberg for HRC in Europe and the USA with the average of Consensus Economics steel forecasts for Europe and the USA.32
For the reasons outlined in section K.3.3.1 in relation to aluminium and copper, however, the AER is not satisfied that the approach SKM has taken to forecast the exchange rates used to restate the USD based market prices provides a realistic expectation of cost inputs. The AER considers that identical adjustments to those proposed in section K.3.3.1 are necessary to reasonably reflect the capex and opex criteria.
30 ibid. 31 For example, see AER, New South Wales distribution determination, Final decision, April 2009,
pp. 478–507; AER, Queensland distribution determination, Final decision, May 2010, pp. 397–413; and AER, South Australia distribution determination, Final decision, May 2010, pp. 324–333.
32 US steel prices from Consensus Economics are adjusted for volume, as they are in short-tonnes and must be converted to metric tonnes. Further, the long term Consensus Economics forecast price is estimated to be for the period of 5 to 10 years. The AER takes the midpoint (7.5 years) and interpolates from the Consensus Economics short term forecast prices to its long term steel prices. The long term steel price is converted from real to nominal USD by the US Congressional Budget Office inflation forecast.
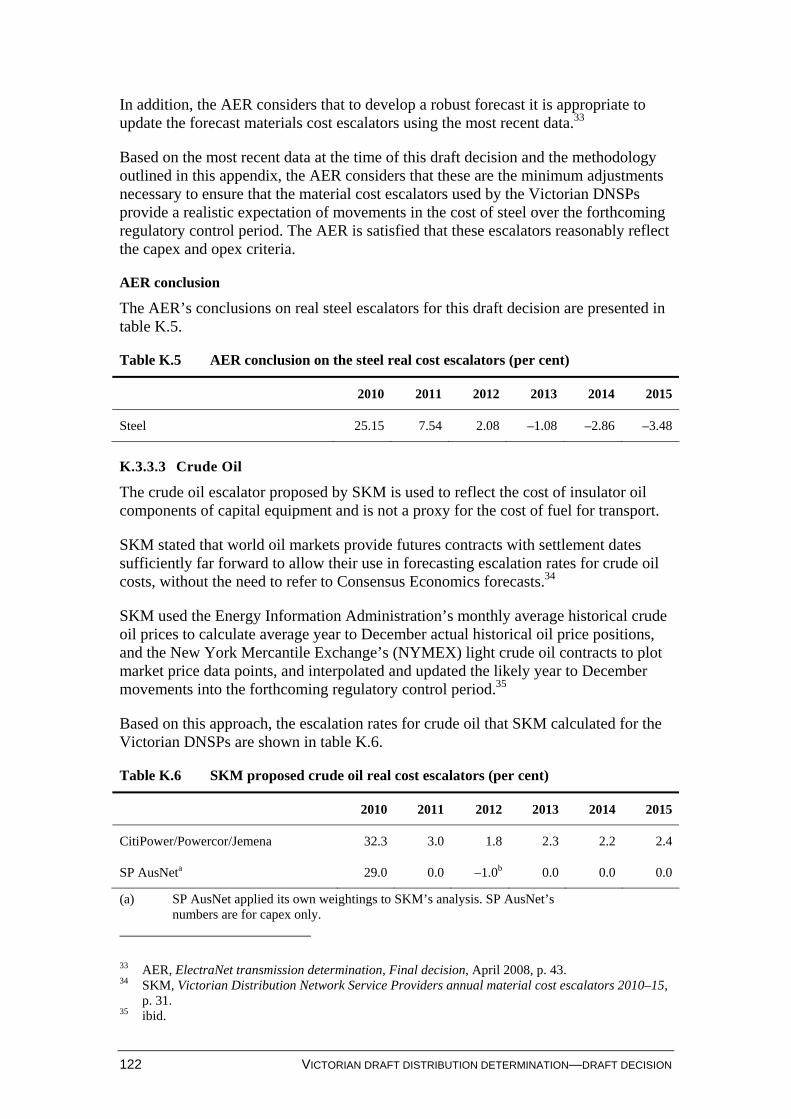
122 VICTORIAN DRAFT DISTRIBUTION DETERMINATION—DRAFT DECISION
In addition, the AER considers that to develop a robust forecast it is appropriate to update the forecast materials cost escalators using the most recent data.33
Based on the most recent data at the time of this draft decision and the methodology outlined in this appendix, the AER considers that these are the minimum adjustments necessary to ensure that the material cost escalators used by the Victorian DNSPs provide a realistic expectation of movements in the cost of steel over the forthcoming regulatory control period. The AER is satisfied that these escalators reasonably reflect the capex and opex criteria.
AER conclusion
The AER’s conclusions on real steel escalators for this draft decision are presented in table K.5.
Table K.5 AER conclusion on the steel real cost escalators (per cent)
2010 2011 2012 2013 2014 2015
Steel 25.15 7.54 2.08 –1.08 –2.86 –3.48
K.3.3.3 Crude Oil
The crude oil escalator proposed by SKM is used to reflect the cost of insulator oil components of capital equipment and is not a proxy for the cost of fuel for transport.
SKM stated that world oil markets provide futures contracts with settlement dates sufficiently far forward to allow their use in forecasting escalation rates for crude oil costs, without the need to refer to Consensus Economics forecasts.34
SKM used the Energy Information Administration’s monthly average historical crude oil prices to calculate average year to December actual historical oil price positions, and the New York Mercantile Exchange’s (NYMEX) light crude oil contracts to plot market price data points, and interpolated and updated the likely year to December movements into the forthcoming regulatory control period.35
Based on this approach, the escalation rates for crude oil that SKM calculated for the Victorian DNSPs are shown in table K.6.
Table K.6 SKM proposed crude oil real cost escalators (per cent)
2010 2011 2012 2013 2014 2015
CitiPower/Powercor/Jemena 32.3 3.0 1.8 2.3 2.2 2.4
SP AusNeta 29.0 0.0 –1.0b 0.0 0.0 0.0
(a) SP AusNet applied its own weightings to SKM’s analysis. SP AusNet’s numbers are for capex only.
33 AER, ElectraNet transmission determination, Final decision, April 2008, p. 43. 34 SKM, Victorian Distribution Network Service Providers annual material cost escalators 2010–15,
p. 31. 35 ibid.
APPENDIX K—REAL COST ESCALATORS 123
(b) Revised number: SP AusNet's regulatory proposal figure was incorrect. SP AusNet, response to information requested on 16 February 2010, submitted on 26 February 2010, p. 9.
Source: SKM, Victorian Distribution Network Service Providers annual material cost escalators 2010–15, p. 32; SP AusNet, Regulatory proposal, p. 171.
AER considerations
The AER notes that the price of oil futures contracts are available for the duration of the forthcoming regulatory control period. As such, it is not necessary or desirable to rely on economic forecasts as an indicator of future oil prices.
The AER considers that SKM’s approach to forecasting the escalation of the Victorian DNSPs’ crude oil costs is similar to the method previously approved by the AER in recent decisions for other DNSPs.36 That is, the crude oil cost escalator is based on the West Texas Intermediate (WTI) average monthly prices from the USA Department of Energy—Energy Information Agency. The AER interpolates this data with the Bloomberg forecast crude oil contract prices that use WTI crude oil prices as their reference price.
For the reasons outlined in section K.3.3.1 in relation to aluminium and copper, however, the AER is not satisfied that the approach SKM has taken to forecast the exchange rates used to restate the USD based market prices provides a realistic expectation of cost inputs. The AER considers that identical adjustments to those proposed in section K.3.3.1 are necessary to reasonably reflect the capex and opex criteria.
In addition, the AER considers that to develop a robust forecast it is appropriate to update the forecast materials cost escalators using the most recent data.37
Based on the most recent data at the time of this draft decision and the methodology outlined in this appendix, the AER considers that these are the minimum adjustments necessary to ensure that the materials cost escalators used by the Victorian DNSPs provide a realistic expectation of movements in the cost of crude oil over the forthcoming regulatory control period. The AER is satisfied that these escalators reasonably reflect the capex and opex criteria.
AER conclusion
The AER’s conclusions on real crude oil escalators for this draft decision are presented in table K.7.
36 AER, Queensland distribution determination, Final decision, May 2010, pp. 397–413; and AER,
South Australia distribution determination, Final decision, May 2010, pp. 324–333. 37 AER, ElectraNet transmission determination, Final decision, April 2008, p. 43.
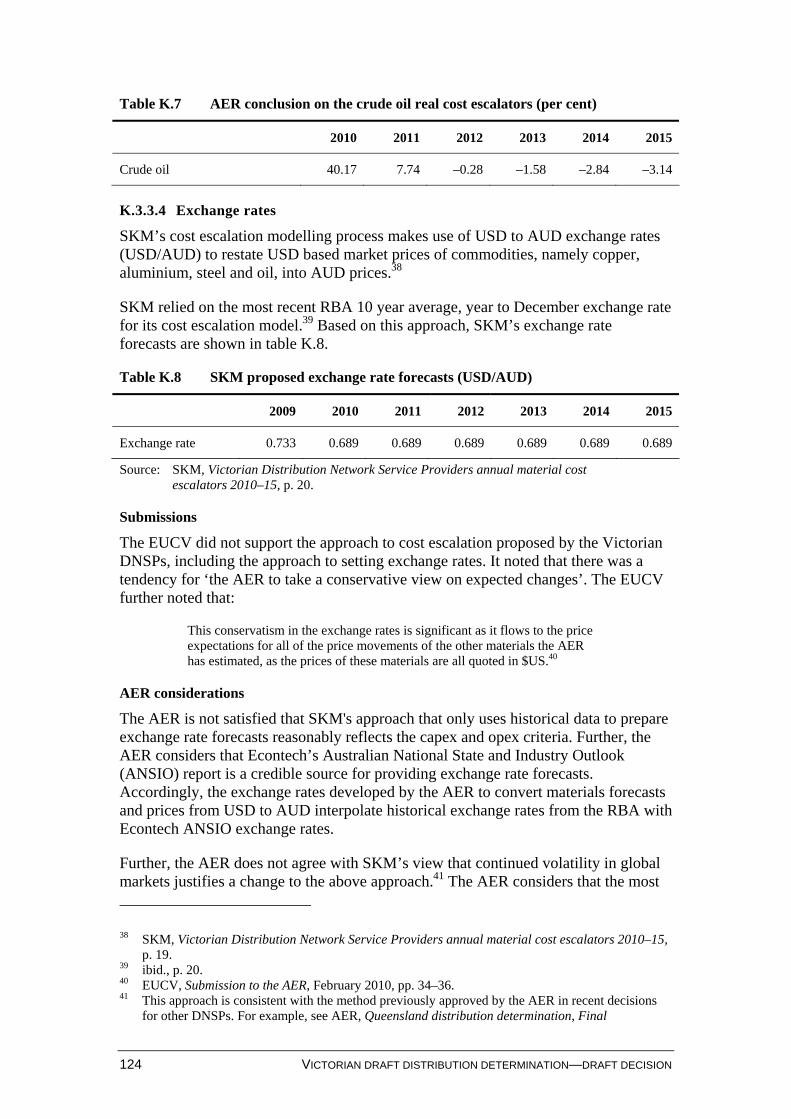
124 VICTORIAN DRAFT DISTRIBUTION DETERMINATION—DRAFT DECISION
Table K.7 AER conclusion on the crude oil real cost escalators (per cent)
2010 2011 2012 2013 2014 2015
Crude oil 40.17 7.74 –0.28 –1.58 –2.84 –3.14
K.3.3.4 Exchange rates
SKM’s cost escalation modelling process makes use of USD to AUD exchange rates (USD/AUD) to restate USD based market prices of commodities, namely copper, aluminium, steel and oil, into AUD prices.38
SKM relied on the most recent RBA 10 year average, year to December exchange rate for its cost escalation model.39 Based on this approach, SKM’s exchange rate forecasts are shown in table K.8.
Table K.8 SKM proposed exchange rate forecasts (USD/AUD)
2009 2010 2011 2012 2013 2014 2015
Exchange rate 0.733 0.689 0.689 0.689 0.689 0.689 0.689
Source: SKM, Victorian Distribution Network Service Providers annual material cost escalators 2010–15, p. 20.
Submissions
The EUCV did not support the approach to cost escalation proposed by the Victorian DNSPs, including the approach to setting exchange rates. It noted that there was a tendency for ‘the AER to take a conservative view on expected changes’. The EUCV further noted that:
This conservatism in the exchange rates is significant as it flows to the price expectations for all of the price movements of the other materials the AER has estimated, as the prices of these materials are all quoted in $US.40
AER considerations
The AER is not satisfied that SKM's approach that only uses historical data to prepare exchange rate forecasts reasonably reflects the capex and opex criteria. Further, the AER considers that Econtech’s Australian National State and Industry Outlook (ANSIO) report is a credible source for providing exchange rate forecasts. Accordingly, the exchange rates developed by the AER to convert materials forecasts and prices from USD to AUD interpolate historical exchange rates from the RBA with Econtech ANSIO exchange rates.
Further, the AER does not agree with SKM’s view that continued volatility in global markets justifies a change to the above approach.41 The AER considers that the most
38 SKM, Victorian Distribution Network Service Providers annual material cost escalators 2010–15,
p. 19. 39 ibid., p. 20. 40 EUCV, Submission to the AER, February 2010, pp. 34–36. 41 This approach is consistent with the method previously approved by the AER in recent decisions
for other DNSPs. For example, see AER, Queensland distribution determination, Final
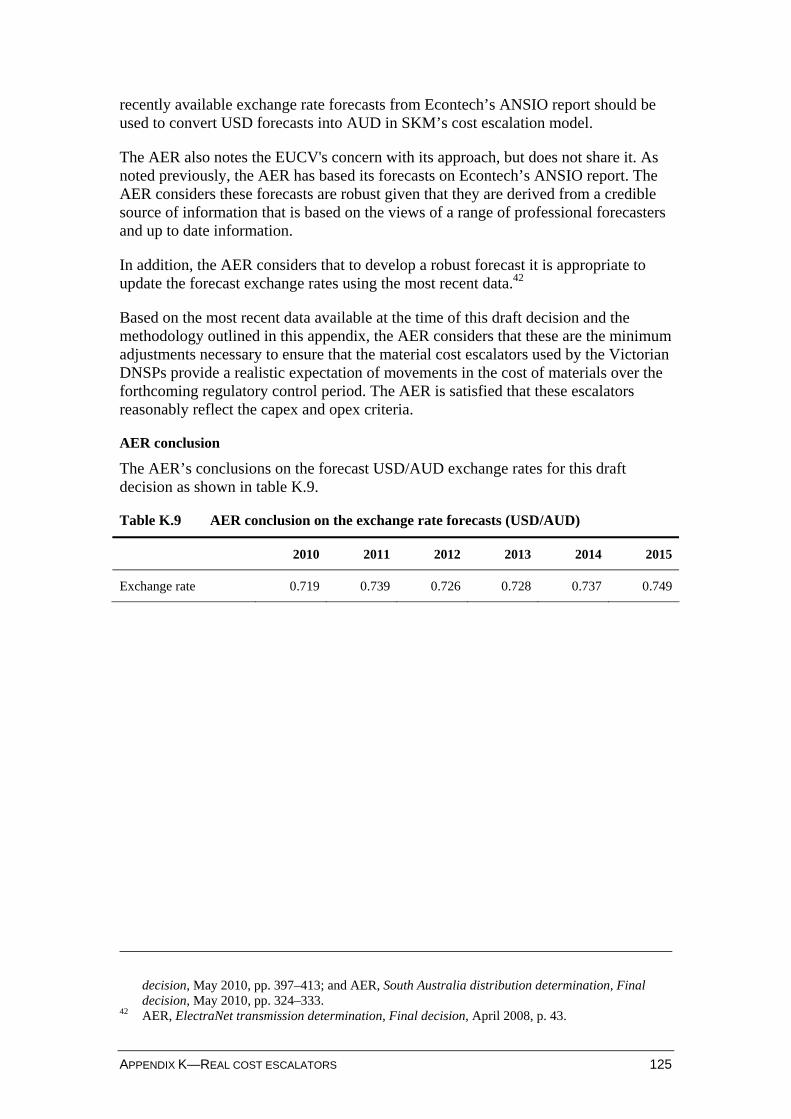
APPENDIX K—REAL COST ESCALATORS 125
recently available exchange rate forecasts from Econtech’s ANSIO report should be used to convert USD forecasts into AUD in SKM’s cost escalation model.
The AER also notes the EUCV's concern with its approach, but does not share it. As noted previously, the AER has based its forecasts on Econtech’s ANSIO report. The AER considers these forecasts are robust given that they are derived from a credible source of information that is based on the views of a range of professional forecasters and up to date information.
In addition, the AER considers that to develop a robust forecast it is appropriate to update the forecast exchange rates using the most recent data.42
Based on the most recent data available at the time of this draft decision and the methodology outlined in this appendix, the AER considers that these are the minimum adjustments necessary to ensure that the material cost escalators used by the Victorian DNSPs provide a realistic expectation of movements in the cost of materials over the forthcoming regulatory control period. The AER is satisfied that these escalators reasonably reflect the capex and opex criteria.
AER conclusion
The AER’s conclusions on the forecast USD/AUD exchange rates for this draft decision as shown in table K.9.
Table K.9 AER conclusion on the exchange rate forecasts (USD/AUD)
2010 2011 2012 2013 2014 2015
Exchange rate 0.719 0.739 0.726 0.728 0.737 0.749
decision, May 2010, pp. 397–413; and AER, South Australia distribution determination, Final decision, May 2010, pp. 324–333.
42 AER, ElectraNet transmission determination, Final decision, April 2008, p. 43.
126 VICTORIAN DRAFT DISTRIBUTION DETERMINATION—DRAFT DECISION
K.4 Labour cost escalators This section discusses the real labour cost escalation assumptions applied by the Victorian DNSPs in developing their capex and opex forecasts for the forthcoming regulatory control period.
K.4.1 Victorian DNSP proposals
On behalf of all the Victorian DNSPs, BIS Shrapnel developed labour cost escalators based on two primary measures of wage growth:
average weekly ordinary time earnings (AWOTE)
a labour price index (LPI).
BIS Shrapnel considered that, of these two measures, AWOTE best reflects the increase in wage cost changes across the economy.43
Additionally, the proposed labour cost escalators provided by BIS Shrapnel fall into two general categories:
internal labour cost growth forecasts
outsourced labour cost growth forecasts.44
BIS Shrapnel’s forecasts were informed by analysis of past and expected wage movements, based on the three main methods of setting pay and working conditions: awards, collective agreements and individual agreements.45
BIS Shrapnel considered both macro-economic factors and circumstances specific to the Victorian DNSPs, and subsequently weighted these factors by the relative share of the workforce that has its pay set by each of the methods listed above.46 BIS Shrapnel found that:
collective bargaining dominates pay setting arrangements in the electricity, gas and water (EGW) sector with 84.4 per cent of wage outcomes
14.7 per cent of EGW employees have their pay set by individual arrangements
only around 0.9 per cent of EGW workers have their pay set by awards.47
BIS Shrapnel also considered that its sector based modelling of wage movements was superior to economic regression techniques that forecast wage growth at the industry level. BIS Shrapnel made the following observations in support of its forecasting methodology:
43 BIS Shrapnel, Wages outlook for the electricity distribution sector in Victoria, August 2009, p. 10. 44 ibid., p. 1. 45 ibid., p. 10. 46 CitiPower, Regulatory proposal, p. 232. 47 BIS Shrapnel, Wages outlook for the electricity distribution sector in Victoria, August 2009, p. 10.
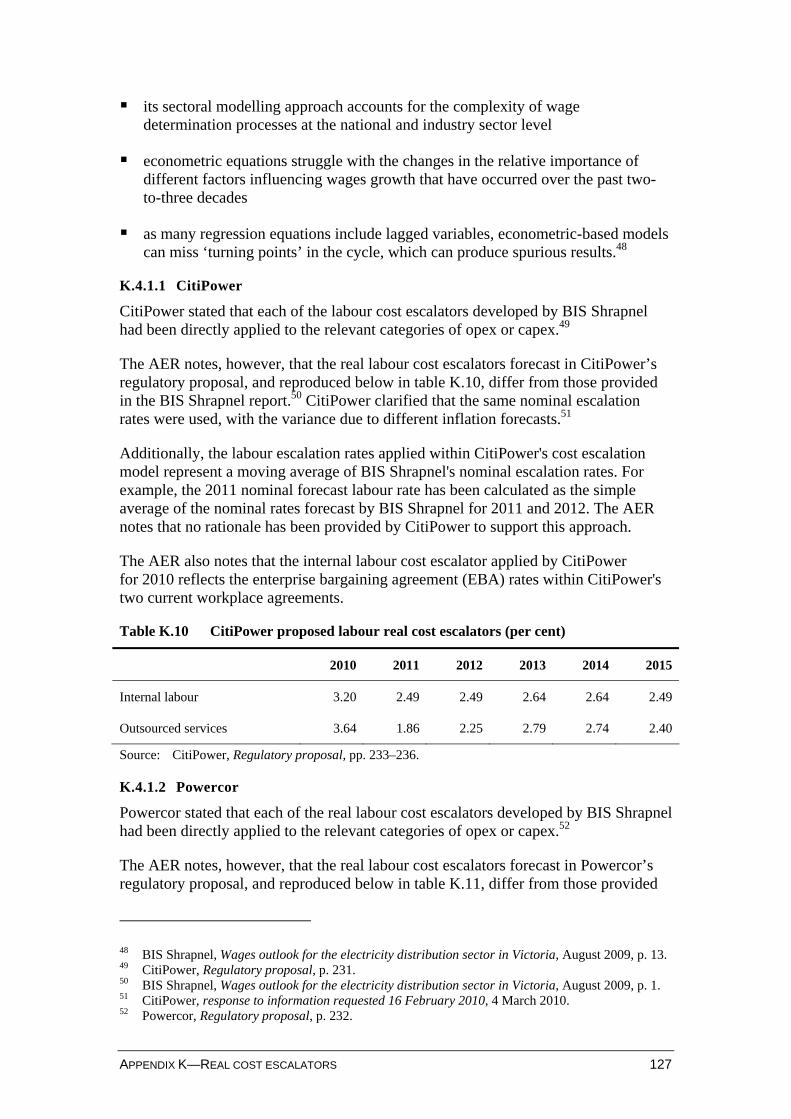
APPENDIX K—REAL COST ESCALATORS 127
its sectoral modelling approach accounts for the complexity of wage determination processes at the national and industry sector level
econometric equations struggle with the changes in the relative importance of different factors influencing wages growth that have occurred over the past two-to-three decades
as many regression equations include lagged variables, econometric-based models can miss ‘turning points’ in the cycle, which can produce spurious results.48
K.4.1.1 CitiPower
CitiPower stated that each of the labour cost escalators developed by BIS Shrapnel had been directly applied to the relevant categories of opex or capex.49
The AER notes, however, that the real labour cost escalators forecast in CitiPower’s regulatory proposal, and reproduced below in table K.10, differ from those provided in the BIS Shrapnel report.50 CitiPower clarified that the same nominal escalation rates were used, with the variance due to different inflation forecasts.51
Additionally, the labour escalation rates applied within CitiPower's cost escalation model represent a moving average of BIS Shrapnel's nominal escalation rates. For example, the 2011 nominal forecast labour rate has been calculated as the simple average of the nominal rates forecast by BIS Shrapnel for 2011 and 2012. The AER notes that no rationale has been provided by CitiPower to support this approach.
The AER also notes that the internal labour cost escalator applied by CitiPower for 2010 reflects the enterprise bargaining agreement (EBA) rates within CitiPower's two current workplace agreements.
Table K.10 CitiPower proposed labour real cost escalators (per cent)
2010 2011 2012 2013 2014 2015
Internal labour 3.20 2.49 2.49 2.64 2.64 2.49
Outsourced services 3.64 1.86 2.25 2.79 2.74 2.40
Source: CitiPower, Regulatory proposal, pp. 233–236.
K.4.1.2 Powercor
Powercor stated that each of the real labour cost escalators developed by BIS Shrapnel had been directly applied to the relevant categories of opex or capex.52
The AER notes, however, that the real labour cost escalators forecast in Powercor’s regulatory proposal, and reproduced below in table K.11, differ from those provided
48 BIS Shrapnel, Wages outlook for the electricity distribution sector in Victoria, August 2009, p. 13. 49 CitiPower, Regulatory proposal, p. 231. 50 BIS Shrapnel, Wages outlook for the electricity distribution sector in Victoria, August 2009, p. 1. 51 CitiPower, response to information requested 16 February 2010, 4 March 2010. 52 Powercor, Regulatory proposal, p. 232.
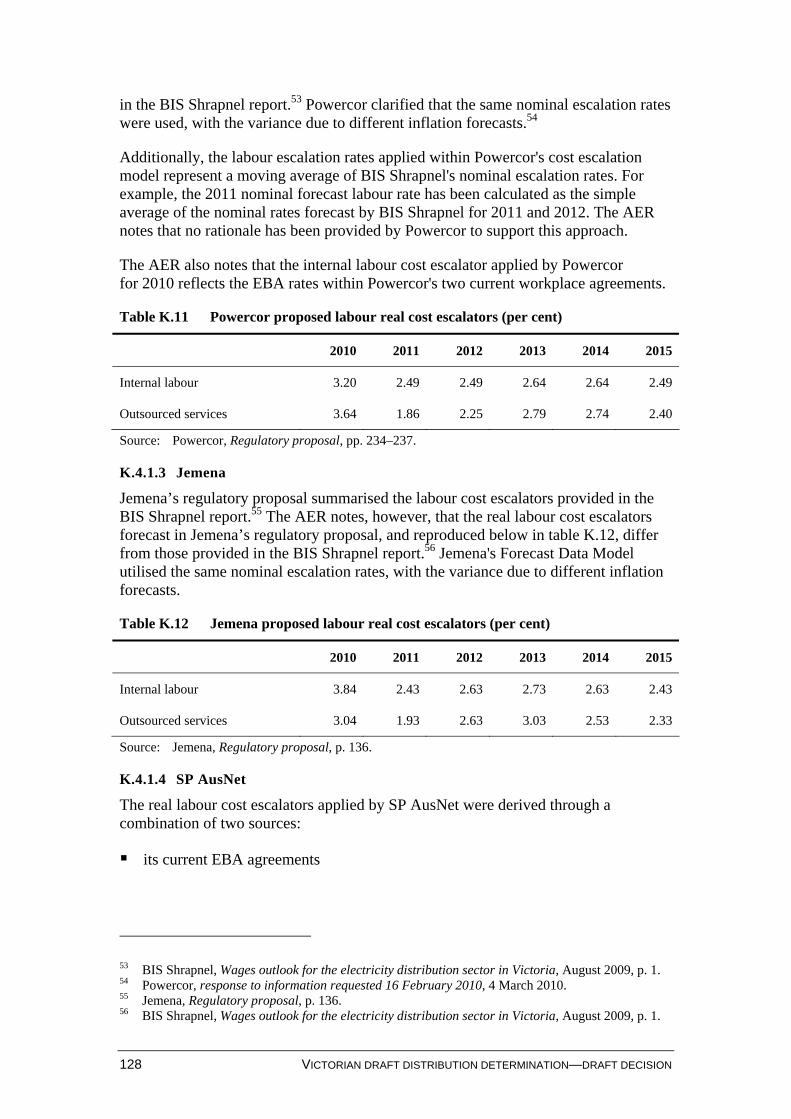
128 VICTORIAN DRAFT DISTRIBUTION DETERMINATION—DRAFT DECISION
in the BIS Shrapnel report.53 Powercor clarified that the same nominal escalation rates were used, with the variance due to different inflation forecasts.54
Additionally, the labour escalation rates applied within Powercor's cost escalation model represent a moving average of BIS Shrapnel's nominal escalation rates. For example, the 2011 nominal forecast labour rate has been calculated as the simple average of the nominal rates forecast by BIS Shrapnel for 2011 and 2012. The AER notes that no rationale has been provided by Powercor to support this approach.
The AER also notes that the internal labour cost escalator applied by Powercor for 2010 reflects the EBA rates within Powercor's two current workplace agreements.
Table K.11 Powercor proposed labour real cost escalators (per cent)
2010 2011 2012 2013 2014 2015
Internal labour 3.20 2.49 2.49 2.64 2.64 2.49
Outsourced services 3.64 1.86 2.25 2.79 2.74 2.40
Source: Powercor, Regulatory proposal, pp. 234–237.
K.4.1.3 Jemena
Jemena’s regulatory proposal summarised the labour cost escalators provided in the BIS Shrapnel report.55 The AER notes, however, that the real labour cost escalators forecast in Jemena’s regulatory proposal, and reproduced below in table K.12, differ from those provided in the BIS Shrapnel report.56 Jemena's Forecast Data Model utilised the same nominal escalation rates, with the variance due to different inflation forecasts.
Table K.12 Jemena proposed labour real cost escalators (per cent)
2010 2011 2012 2013 2014 2015
Internal labour 3.84 2.43 2.63 2.73 2.63 2.43
Outsourced services 3.04 1.93 2.63 3.03 2.53 2.33
Source: Jemena, Regulatory proposal, p. 136.
K.4.1.4 SP AusNet
The real labour cost escalators applied by SP AusNet were derived through a combination of two sources:
its current EBA agreements
53 BIS Shrapnel, Wages outlook for the electricity distribution sector in Victoria, August 2009, p. 1. 54 Powercor, response to information requested 16 February 2010, 4 March 2010. 55 Jemena, Regulatory proposal, p. 136. 56 BIS Shrapnel, Wages outlook for the electricity distribution sector in Victoria, August 2009, p. 1.
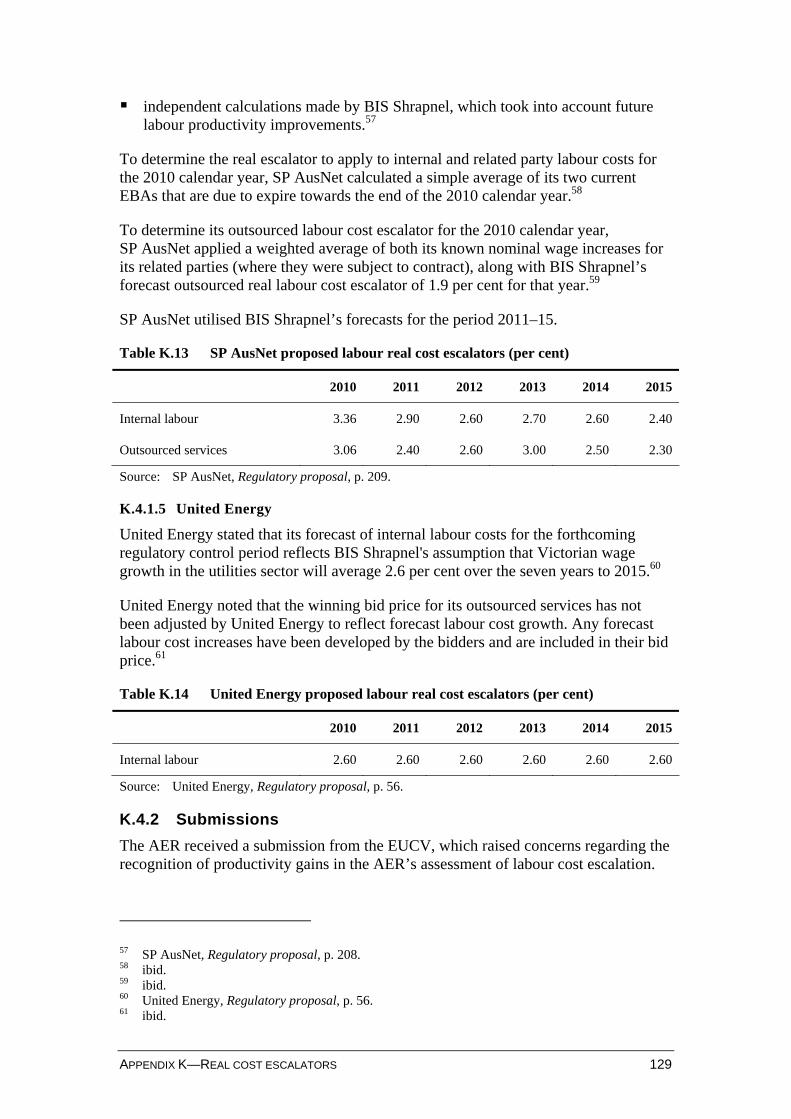
APPENDIX K—REAL COST ESCALATORS 129
independent calculations made by BIS Shrapnel, which took into account future labour productivity improvements.57
To determine the real escalator to apply to internal and related party labour costs for the 2010 calendar year, SP AusNet calculated a simple average of its two current EBAs that are due to expire towards the end of the 2010 calendar year.58
To determine its outsourced labour cost escalator for the 2010 calendar year, SP AusNet applied a weighted average of both its known nominal wage increases for its related parties (where they were subject to contract), along with BIS Shrapnel’s forecast outsourced real labour cost escalator of 1.9 per cent for that year.59
SP AusNet utilised BIS Shrapnel’s forecasts for the period 2011–15.
Table K.13 SP AusNet proposed labour real cost escalators (per cent)
2010 2011 2012 2013 2014 2015
Internal labour 3.36 2.90 2.60 2.70 2.60 2.40
Outsourced services 3.06 2.40 2.60 3.00 2.50 2.30
Source: SP AusNet, Regulatory proposal, p. 209.
K.4.1.5 United Energy
United Energy stated that its forecast of internal labour costs for the forthcoming regulatory control period reflects BIS Shrapnel's assumption that Victorian wage growth in the utilities sector will average 2.6 per cent over the seven years to 2015.60
United Energy noted that the winning bid price for its outsourced services has not been adjusted by United Energy to reflect forecast labour cost growth. Any forecast labour cost increases have been developed by the bidders and are included in their bid price.61
Table K.14 United Energy proposed labour real cost escalators (per cent)
2010 2011 2012 2013 2014 2015
Internal labour 2.60 2.60 2.60 2.60 2.60 2.60
Source: United Energy, Regulatory proposal, p. 56.
K.4.2 Submissions
The AER received a submission from the EUCV, which raised concerns regarding the recognition of productivity gains in the AER’s assessment of labour cost escalation.
57 SP AusNet, Regulatory proposal, p. 208. 58 ibid. 59 ibid. 60 United Energy, Regulatory proposal, p. 56. 61 ibid.
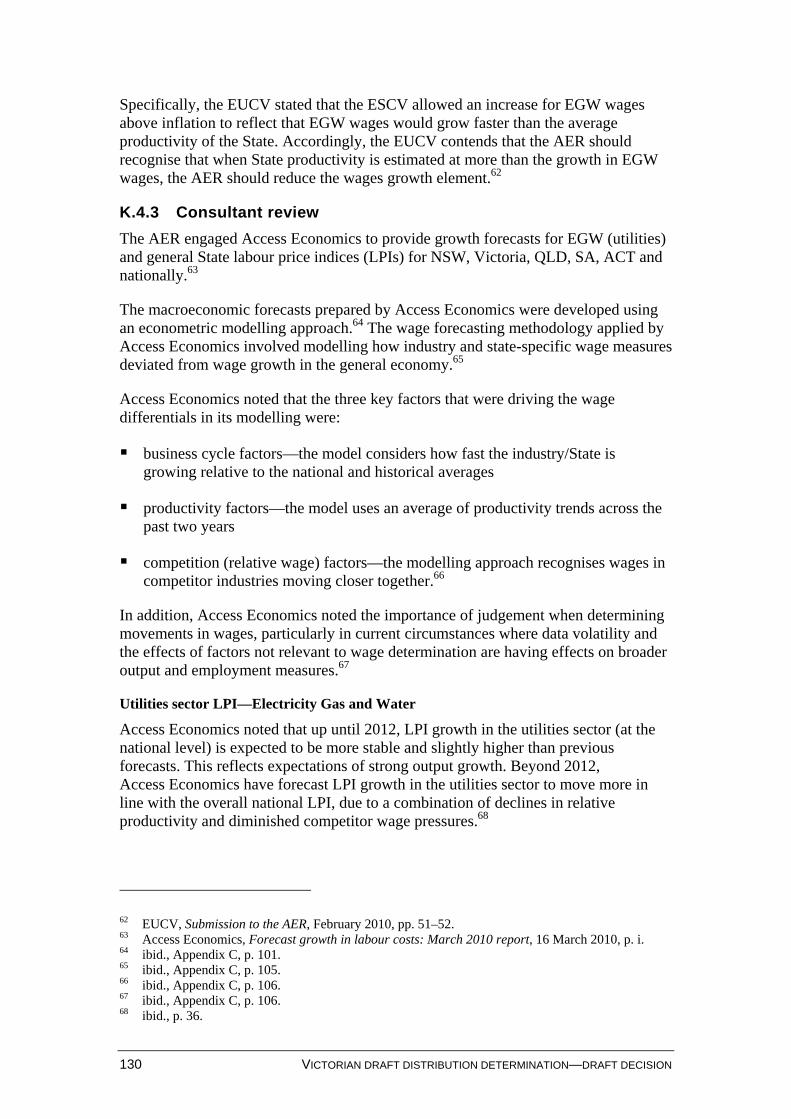
130 VICTORIAN DRAFT DISTRIBUTION DETERMINATION—DRAFT DECISION
Specifically, the EUCV stated that the ESCV allowed an increase for EGW wages above inflation to reflect that EGW wages would grow faster than the average productivity of the State. Accordingly, the EUCV contends that the AER should recognise that when State productivity is estimated at more than the growth in EGW wages, the AER should reduce the wages growth element.62
K.4.3 Consultant review
The AER engaged Access Economics to provide growth forecasts for EGW (utilities) and general State labour price indices (LPIs) for NSW, Victoria, QLD, SA, ACT and nationally.63
The macroeconomic forecasts prepared by Access Economics were developed using an econometric modelling approach.64 The wage forecasting methodology applied by Access Economics involved modelling how industry and state-specific wage measures deviated from wage growth in the general economy.65
Access Economics noted that the three key factors that were driving the wage differentials in its modelling were:
business cycle factors—the model considers how fast the industry/State is growing relative to the national and historical averages
productivity factors—the model uses an average of productivity trends across the past two years
competition (relative wage) factors—the modelling approach recognises wages in competitor industries moving closer together.66
In addition, Access Economics noted the importance of judgement when determining movements in wages, particularly in current circumstances where data volatility and the effects of factors not relevant to wage determination are having effects on broader output and employment measures.67
Utilities sector LPI—Electricity Gas and Water
Access Economics noted that up until 2012, LPI growth in the utilities sector (at the national level) is expected to be more stable and slightly higher than previous forecasts. This reflects expectations of strong output growth. Beyond 2012, Access Economics have forecast LPI growth in the utilities sector to move more in line with the overall national LPI, due to a combination of declines in relative productivity and diminished competitor wage pressures.68
62 EUCV, Submission to the AER, February 2010, pp. 51–52. 63 Access Economics, Forecast growth in labour costs: March 2010 report, 16 March 2010, p. i. 64 ibid., Appendix C, p. 101. 65 ibid., Appendix C, p. 105. 66 ibid., Appendix C, p. 106. 67 ibid., Appendix C, p. 106. 68 ibid., p. 36.
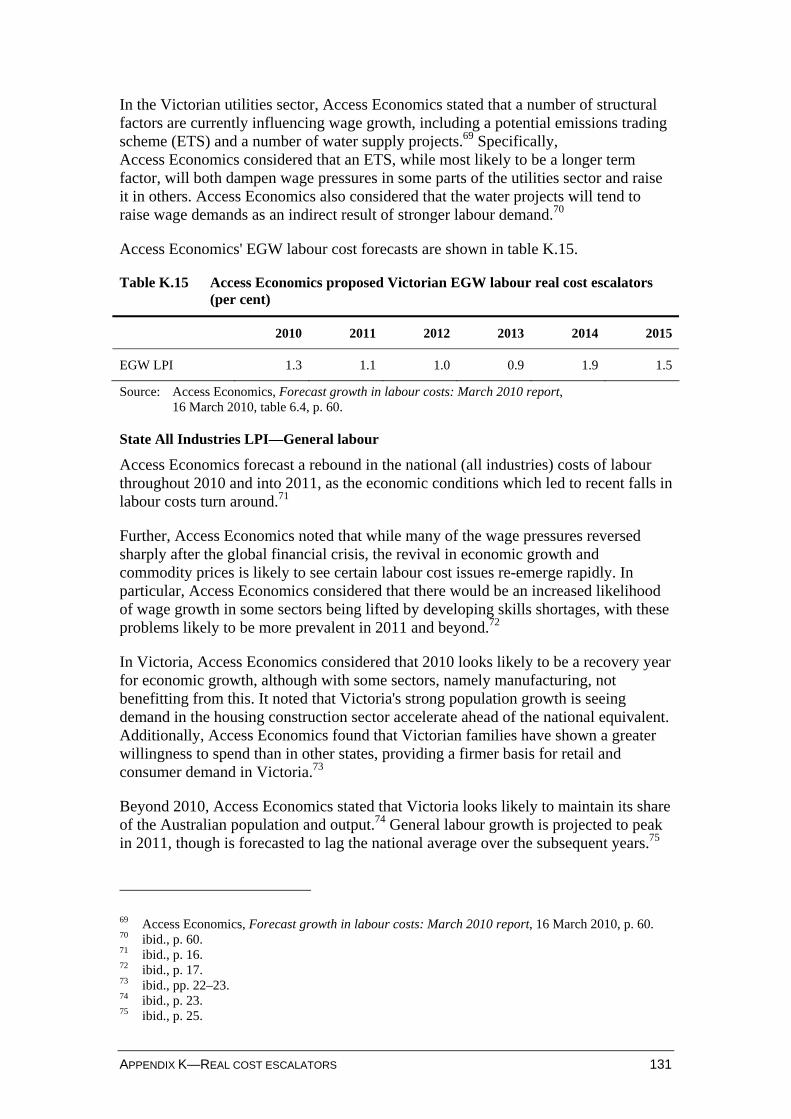
APPENDIX K—REAL COST ESCALATORS 131
In the Victorian utilities sector, Access Economics stated that a number of structural factors are currently influencing wage growth, including a potential emissions trading scheme (ETS) and a number of water supply projects.69 Specifically, Access Economics considered that an ETS, while most likely to be a longer term factor, will both dampen wage pressures in some parts of the utilities sector and raise it in others. Access Economics also considered that the water projects will tend to raise wage demands as an indirect result of stronger labour demand.70
Access Economics' EGW labour cost forecasts are shown in table K.15.
Table K.15 Access Economics proposed Victorian EGW labour real cost escalators (per cent)
2010 2011 2012 2013 2014 2015
EGW LPI 1.3 1.1 1.0 0.9 1.9 1.5
Source: Access Economics, Forecast growth in labour costs: March 2010 report, 16 March 2010, table 6.4, p. 60.
State All Industries LPI—General labour
Access Economics forecast a rebound in the national (all industries) costs of labour throughout 2010 and into 2011, as the economic conditions which led to recent falls in labour costs turn around.71
Further, Access Economics noted that while many of the wage pressures reversed sharply after the global financial crisis, the revival in economic growth and commodity prices is likely to see certain labour cost issues re-emerge rapidly. In particular, Access Economics considered that there would be an increased likelihood of wage growth in some sectors being lifted by developing skills shortages, with these problems likely to be more prevalent in 2011 and beyond.72
In Victoria, Access Economics considered that 2010 looks likely to be a recovery year for economic growth, although with some sectors, namely manufacturing, not benefitting from this. It noted that Victoria's strong population growth is seeing demand in the housing construction sector accelerate ahead of the national equivalent. Additionally, Access Economics found that Victorian families have shown a greater willingness to spend than in other states, providing a firmer basis for retail and consumer demand in Victoria.73
Beyond 2010, Access Economics stated that Victoria looks likely to maintain its share of the Australian population and output.74 General labour growth is projected to peak in 2011, though is forecasted to lag the national average over the subsequent years.75
69 Access Economics, Forecast growth in labour costs: March 2010 report, 16 March 2010, p. 60. 70 ibid., p. 60. 71 ibid., p. 16. 72 ibid., p. 17. 73 ibid., pp. 22–23. 74 ibid., p. 23. 75 ibid., p. 25.
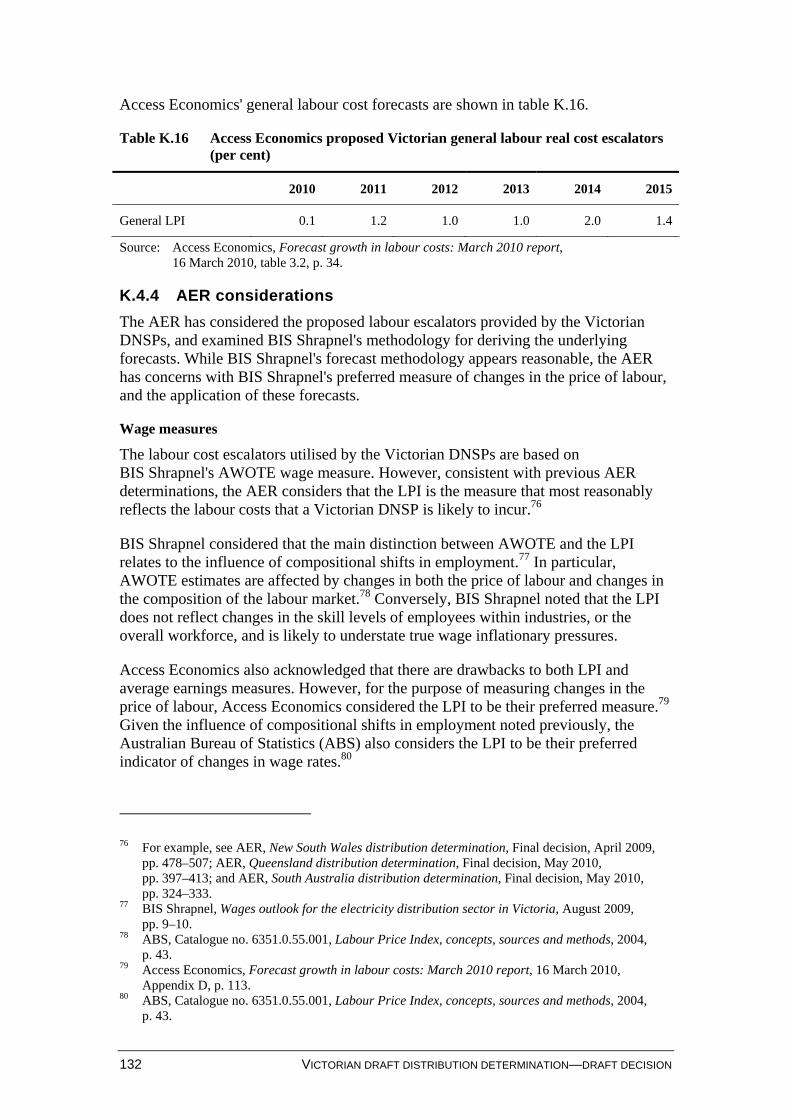
132 VICTORIAN DRAFT DISTRIBUTION DETERMINATION—DRAFT DECISION
Access Economics' general labour cost forecasts are shown in table K.16.
Table K.16 Access Economics proposed Victorian general labour real cost escalators (per cent)
2010 2011 2012 2013 2014 2015
General LPI 0.1 1.2 1.0 1.0 2.0 1.4
Source: Access Economics, Forecast growth in labour costs: March 2010 report, 16 March 2010, table 3.2, p. 34.
K.4.4 AER considerations
The AER has considered the proposed labour escalators provided by the Victorian DNSPs, and examined BIS Shrapnel's methodology for deriving the underlying forecasts. While BIS Shrapnel's forecast methodology appears reasonable, the AER has concerns with BIS Shrapnel's preferred measure of changes in the price of labour, and the application of these forecasts.
Wage measures
The labour cost escalators utilised by the Victorian DNSPs are based on BIS Shrapnel's AWOTE wage measure. However, consistent with previous AER determinations, the AER considers that the LPI is the measure that most reasonably reflects the labour costs that a Victorian DNSP is likely to incur.76
BIS Shrapnel considered that the main distinction between AWOTE and the LPI relates to the influence of compositional shifts in employment.77 In particular, AWOTE estimates are affected by changes in both the price of labour and changes in the composition of the labour market.78 Conversely, BIS Shrapnel noted that the LPI does not reflect changes in the skill levels of employees within industries, or the overall workforce, and is likely to understate true wage inflationary pressures.
Access Economics also acknowledged that there are drawbacks to both LPI and average earnings measures. However, for the purpose of measuring changes in the price of labour, Access Economics considered the LPI to be their preferred measure.79 Given the influence of compositional shifts in employment noted previously, the Australian Bureau of Statistics (ABS) also considers the LPI to be their preferred indicator of changes in wage rates.80
76 For example, see AER, New South Wales distribution determination, Final decision, April 2009,
pp. 478–507; AER, Queensland distribution determination, Final decision, May 2010, pp. 397–413; and AER, South Australia distribution determination, Final decision, May 2010, pp. 324–333.
77 BIS Shrapnel, Wages outlook for the electricity distribution sector in Victoria, August 2009, pp. 9–10.
78 ABS, Catalogue no. 6351.0.55.001, Labour Price Index, concepts, sources and methods, 2004, p. 43.
79 Access Economics, Forecast growth in labour costs: March 2010 report, 16 March 2010, Appendix D, p. 113.
80 ABS, Catalogue no. 6351.0.55.001, Labour Price Index, concepts, sources and methods, 2004, p. 43.
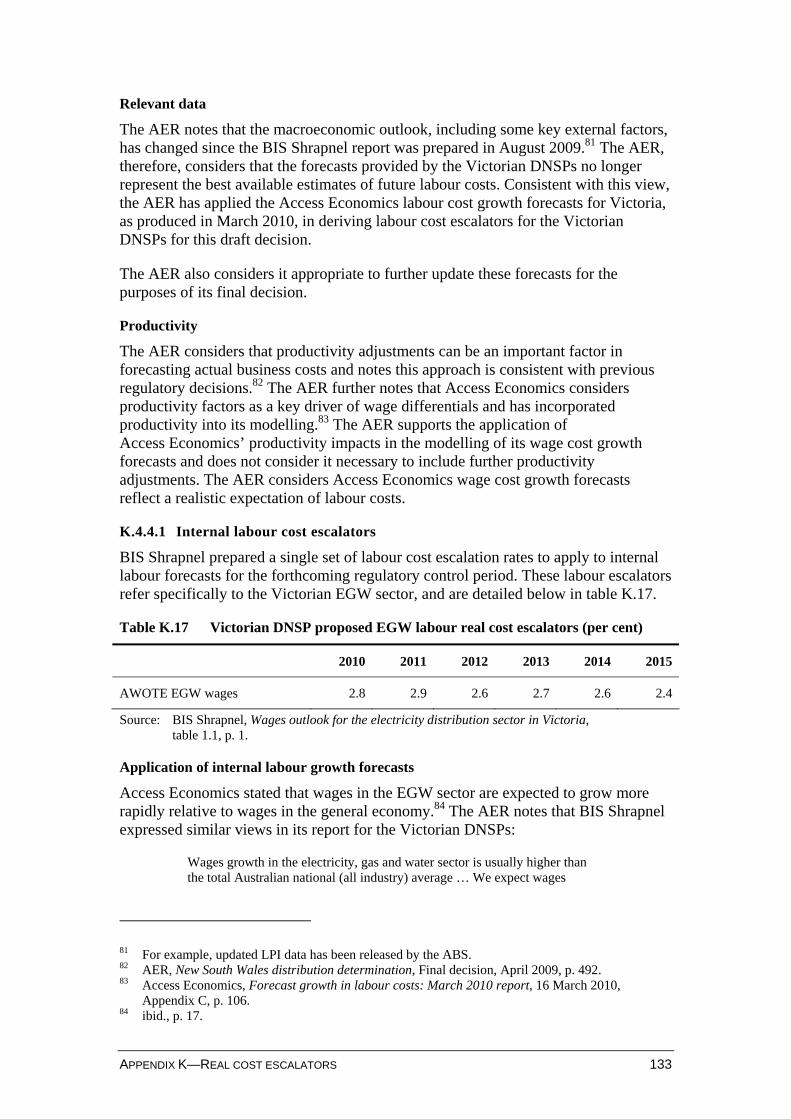
APPENDIX K—REAL COST ESCALATORS 133
Relevant data
The AER notes that the macroeconomic outlook, including some key external factors, has changed since the BIS Shrapnel report was prepared in August 2009.81 The AER, therefore, considers that the forecasts provided by the Victorian DNSPs no longer represent the best available estimates of future labour costs. Consistent with this view, the AER has applied the Access Economics labour cost growth forecasts for Victoria, as produced in March 2010, in deriving labour cost escalators for the Victorian DNSPs for this draft decision.
The AER also considers it appropriate to further update these forecasts for the purposes of its final decision.
Productivity
The AER considers that productivity adjustments can be an important factor in forecasting actual business costs and notes this approach is consistent with previous regulatory decisions.82 The AER further notes that Access Economics considers productivity factors as a key driver of wage differentials and has incorporated productivity into its modelling.83 The AER supports the application of Access Economics’ productivity impacts in the modelling of its wage cost growth forecasts and does not consider it necessary to include further productivity adjustments. The AER considers Access Economics wage cost growth forecasts reflect a realistic expectation of labour costs.
K.4.4.1 Internal labour cost escalators
BIS Shrapnel prepared a single set of labour cost escalation rates to apply to internal labour forecasts for the forthcoming regulatory control period. These labour escalators refer specifically to the Victorian EGW sector, and are detailed below in table K.17.
Table K.17 Victorian DNSP proposed EGW labour real cost escalators (per cent)
2010 2011 2012 2013 2014 2015
AWOTE EGW wages 2.8 2.9 2.6 2.7 2.6 2.4
Source: BIS Shrapnel, Wages outlook for the electricity distribution sector in Victoria, table 1.1, p. 1.
Application of internal labour growth forecasts
Access Economics stated that wages in the EGW sector are expected to grow more rapidly relative to wages in the general economy.84 The AER notes that BIS Shrapnel expressed similar views in its report for the Victorian DNSPs:
Wages growth in the electricity, gas and water sector is usually higher than the total Australian national (all industry) average … We expect wages
81 For example, updated LPI data has been released by the ABS. 82 AER, New South Wales distribution determination, Final decision, April 2009, p. 492. 83 Access Economics, Forecast growth in labour costs: March 2010 report, 16 March 2010,
Appendix C, p. 106. 84 ibid., p. 17.
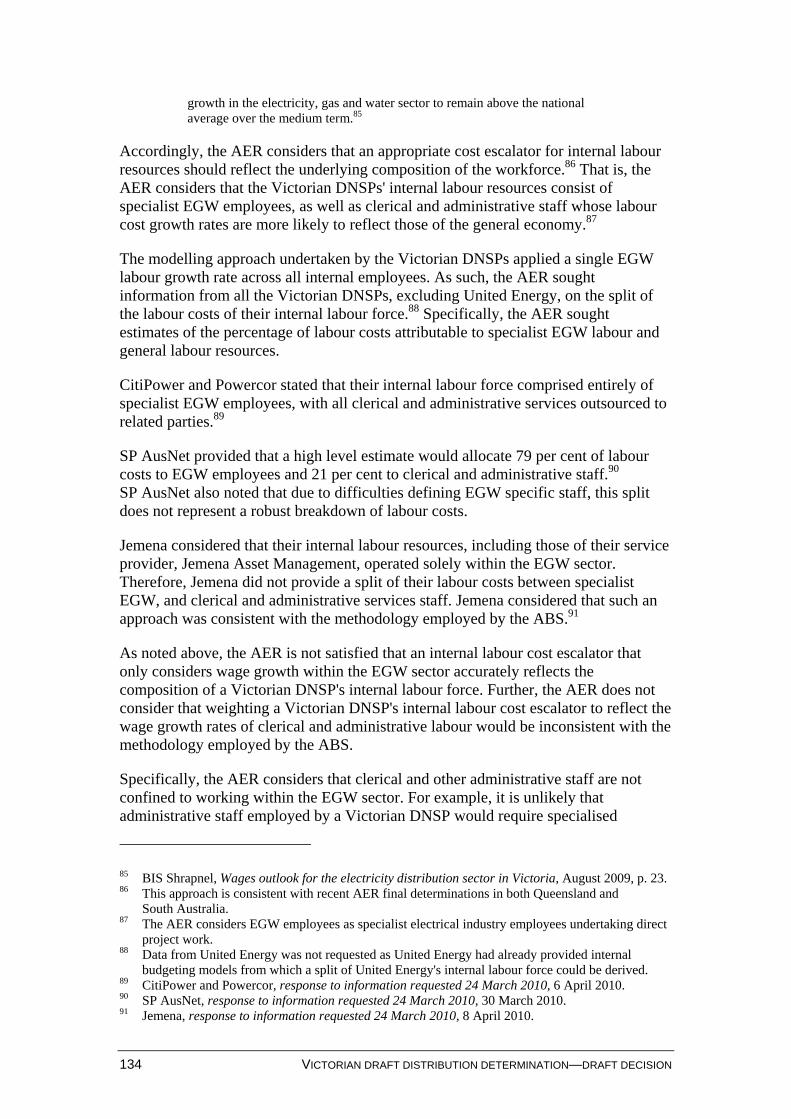
134 VICTORIAN DRAFT DISTRIBUTION DETERMINATION—DRAFT DECISION
growth in the electricity, gas and water sector to remain above the national average over the medium term.85
Accordingly, the AER considers that an appropriate cost escalator for internal labour resources should reflect the underlying composition of the workforce.86 That is, the AER considers that the Victorian DNSPs' internal labour resources consist of specialist EGW employees, as well as clerical and administrative staff whose labour cost growth rates are more likely to reflect those of the general economy.87
The modelling approach undertaken by the Victorian DNSPs applied a single EGW labour growth rate across all internal employees. As such, the AER sought information from all the Victorian DNSPs, excluding United Energy, on the split of the labour costs of their internal labour force.88 Specifically, the AER sought estimates of the percentage of labour costs attributable to specialist EGW labour and general labour resources.
CitiPower and Powercor stated that their internal labour force comprised entirely of specialist EGW employees, with all clerical and administrative services outsourced to related parties.89
SP AusNet provided that a high level estimate would allocate 79 per cent of labour costs to EGW employees and 21 per cent to clerical and administrative staff.90 SP AusNet also noted that due to difficulties defining EGW specific staff, this split does not represent a robust breakdown of labour costs.
Jemena considered that their internal labour resources, including those of their service provider, Jemena Asset Management, operated solely within the EGW sector. Therefore, Jemena did not provide a split of their labour costs between specialist EGW, and clerical and administrative services staff. Jemena considered that such an approach was consistent with the methodology employed by the ABS.91
As noted above, the AER is not satisfied that an internal labour cost escalator that only considers wage growth within the EGW sector accurately reflects the composition of a Victorian DNSP's internal labour force. Further, the AER does not consider that weighting a Victorian DNSP's internal labour cost escalator to reflect the wage growth rates of clerical and administrative labour would be inconsistent with the methodology employed by the ABS.
Specifically, the AER considers that clerical and other administrative staff are not confined to working within the EGW sector. For example, it is unlikely that administrative staff employed by a Victorian DNSP would require specialised
85 BIS Shrapnel, Wages outlook for the electricity distribution sector in Victoria, August 2009, p. 23. 86 This approach is consistent with recent AER final determinations in both Queensland and
South Australia. 87 The AER considers EGW employees as specialist electrical industry employees undertaking direct
project work. 88 Data from United Energy was not requested as United Energy had already provided internal
budgeting models from which a split of United Energy's internal labour force could be derived. 89 CitiPower and Powercor, response to information requested 24 March 2010, 6 April 2010. 90 SP AusNet, response to information requested 24 March 2010, 30 March 2010. 91 Jemena, response to information requested 24 March 2010, 8 April 2010.
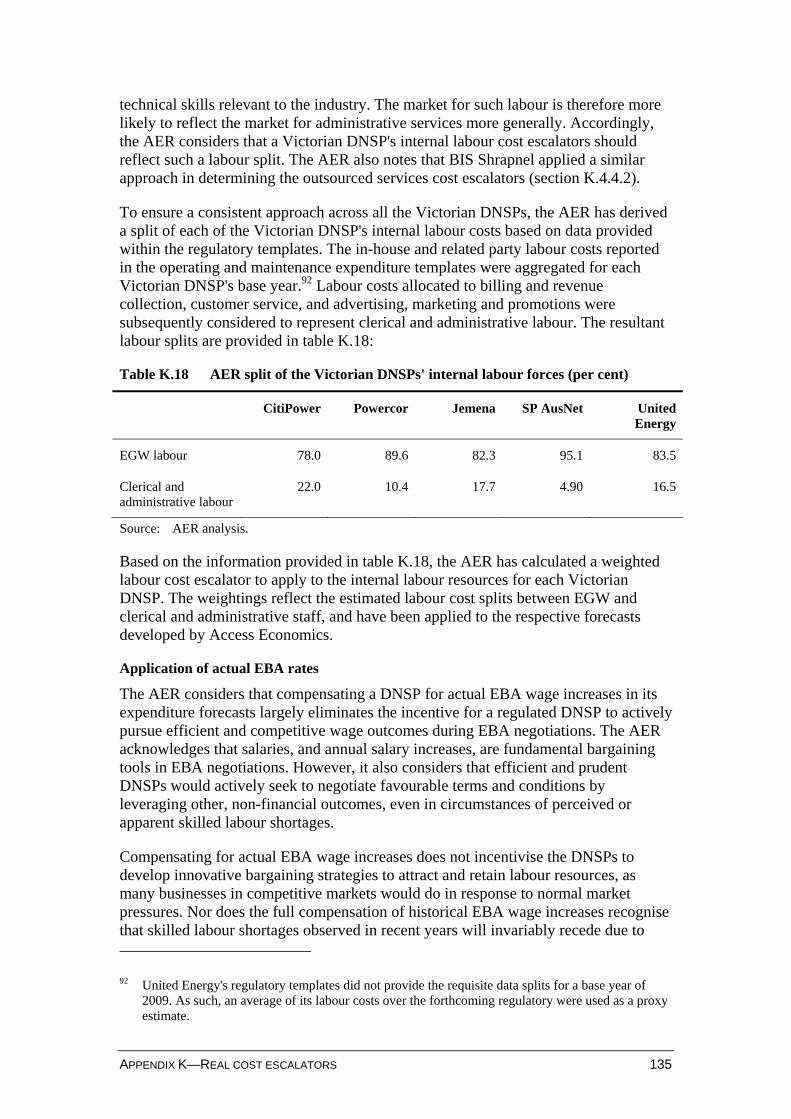
APPENDIX K—REAL COST ESCALATORS 135
technical skills relevant to the industry. The market for such labour is therefore more likely to reflect the market for administrative services more generally. Accordingly, the AER considers that a Victorian DNSP's internal labour cost escalators should reflect such a labour split. The AER also notes that BIS Shrapnel applied a similar approach in determining the outsourced services cost escalators (section K.4.4.2).
To ensure a consistent approach across all the Victorian DNSPs, the AER has derived a split of each of the Victorian DNSP's internal labour costs based on data provided within the regulatory templates. The in-house and related party labour costs reported in the operating and maintenance expenditure templates were aggregated for each Victorian DNSP's base year.92 Labour costs allocated to billing and revenue collection, customer service, and advertising, marketing and promotions were subsequently considered to represent clerical and administrative labour. The resultant labour splits are provided in table K.18:
Table K.18 AER split of the Victorian DNSPs' internal labour forces (per cent)
CitiPower Powercor Jemena SP AusNet United Energy
EGW labour 78.0 89.6 82.3 95.1 83.5
Clerical and administrative labour
22.0 10.4 17.7 4.90 16.5
Source: AER analysis.
Based on the information provided in table K.18, the AER has calculated a weighted labour cost escalator to apply to the internal labour resources for each Victorian DNSP. The weightings reflect the estimated labour cost splits between EGW and clerical and administrative staff, and have been applied to the respective forecasts developed by Access Economics.
Application of actual EBA rates
The AER considers that compensating a DNSP for actual EBA wage increases in its expenditure forecasts largely eliminates the incentive for a regulated DNSP to actively pursue efficient and competitive wage outcomes during EBA negotiations. The AER acknowledges that salaries, and annual salary increases, are fundamental bargaining tools in EBA negotiations. However, it also considers that efficient and prudent DNSPs would actively seek to negotiate favourable terms and conditions by leveraging other, non-financial outcomes, even in circumstances of perceived or apparent skilled labour shortages.
Compensating for actual EBA wage increases does not incentivise the DNSPs to develop innovative bargaining strategies to attract and retain labour resources, as many businesses in competitive markets would do in response to normal market pressures. Nor does the full compensation of historical EBA wage increases recognise that skilled labour shortages observed in recent years will invariably recede due to 92 United Energy's regulatory templates did not provide the requisite data splits for a base year of
2009. As such, an average of its labour costs over the forthcoming regulatory were used as a proxy estimate.
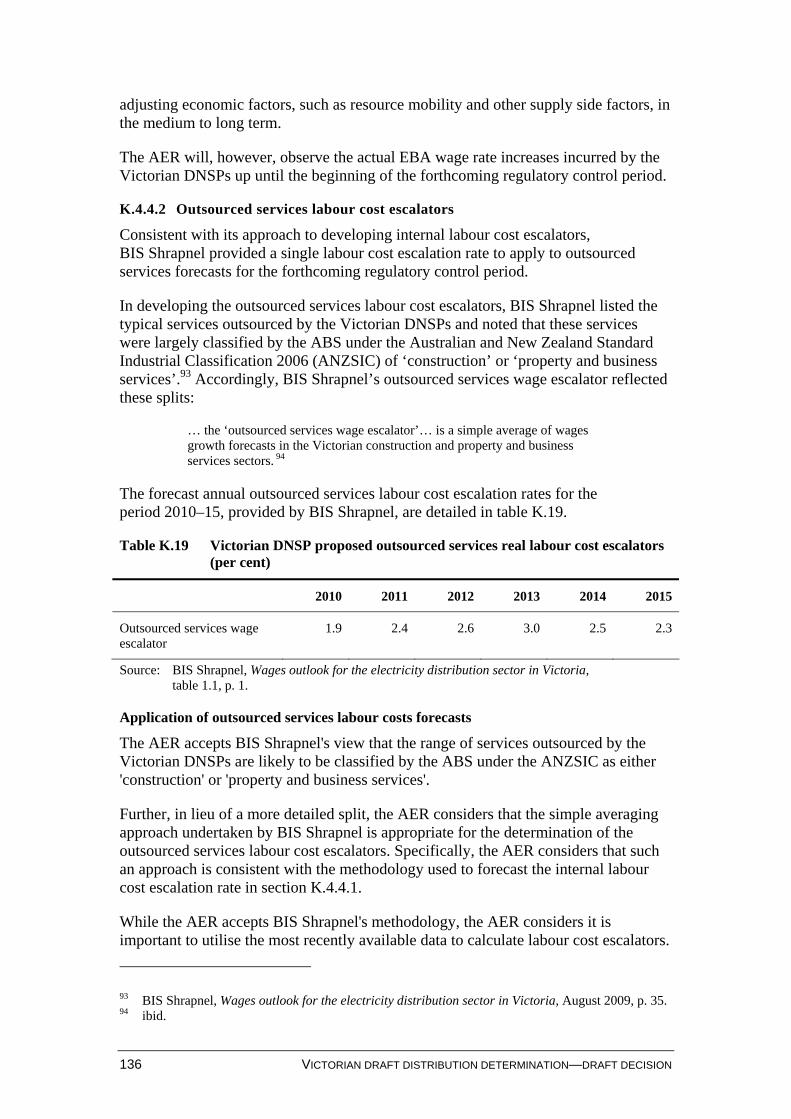
136 VICTORIAN DRAFT DISTRIBUTION DETERMINATION—DRAFT DECISION
adjusting economic factors, such as resource mobility and other supply side factors, in the medium to long term.
The AER will, however, observe the actual EBA wage rate increases incurred by the Victorian DNSPs up until the beginning of the forthcoming regulatory control period.
K.4.4.2 Outsourced services labour cost escalators
Consistent with its approach to developing internal labour cost escalators, BIS Shrapnel provided a single labour cost escalation rate to apply to outsourced services forecasts for the forthcoming regulatory control period.
In developing the outsourced services labour cost escalators, BIS Shrapnel listed the typical services outsourced by the Victorian DNSPs and noted that these services were largely classified by the ABS under the Australian and New Zealand Standard Industrial Classification 2006 (ANZSIC) of ‘construction’ or ‘property and business services’.93 Accordingly, BIS Shrapnel’s outsourced services wage escalator reflected these splits:
… the ‘outsourced services wage escalator’… is a simple average of wages growth forecasts in the Victorian construction and property and business services sectors. 94
The forecast annual outsourced services labour cost escalation rates for the period 2010–15, provided by BIS Shrapnel, are detailed in table K.19.
Table K.19 Victorian DNSP proposed outsourced services real labour cost escalators (per cent)
2010 2011 2012 2013 2014 2015
Outsourced services wage escalator
1.9 2.4 2.6 3.0 2.5 2.3
Source: BIS Shrapnel, Wages outlook for the electricity distribution sector in Victoria, table 1.1, p. 1.
Application of outsourced services labour costs forecasts
The AER accepts BIS Shrapnel's view that the range of services outsourced by the Victorian DNSPs are likely to be classified by the ABS under the ANZSIC as either 'construction' or 'property and business services'.
Further, in lieu of a more detailed split, the AER considers that the simple averaging approach undertaken by BIS Shrapnel is appropriate for the determination of the outsourced services labour cost escalators. Specifically, the AER considers that such an approach is consistent with the methodology used to forecast the internal labour cost escalation rate in section K.4.4.1.
While the AER accepts BIS Shrapnel's methodology, the AER considers it is important to utilise the most recently available data to calculate labour cost escalators.
93 BIS Shrapnel, Wages outlook for the electricity distribution sector in Victoria, August 2009, p. 35. 94 ibid.
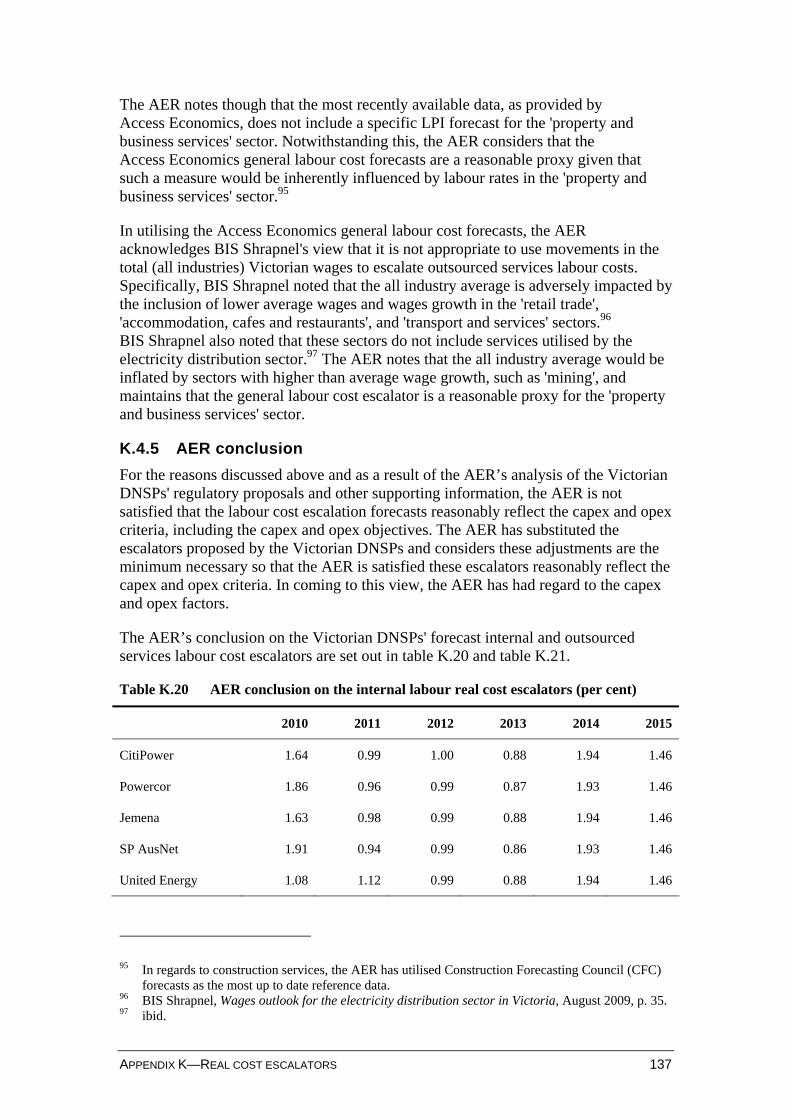
APPENDIX K—REAL COST ESCALATORS 137
The AER notes though that the most recently available data, as provided by Access Economics, does not include a specific LPI forecast for the 'property and business services' sector. Notwithstanding this, the AER considers that the Access Economics general labour cost forecasts are a reasonable proxy given that such a measure would be inherently influenced by labour rates in the 'property and business services' sector.95
In utilising the Access Economics general labour cost forecasts, the AER acknowledges BIS Shrapnel's view that it is not appropriate to use movements in the total (all industries) Victorian wages to escalate outsourced services labour costs. Specifically, BIS Shrapnel noted that the all industry average is adversely impacted by the inclusion of lower average wages and wages growth in the 'retail trade', 'accommodation, cafes and restaurants', and 'transport and services' sectors.96 BIS Shrapnel also noted that these sectors do not include services utilised by the electricity distribution sector.97 The AER notes that the all industry average would be inflated by sectors with higher than average wage growth, such as 'mining', and maintains that the general labour cost escalator is a reasonable proxy for the 'property and business services' sector.
K.4.5 AER conclusion
For the reasons discussed above and as a result of the AER’s analysis of the Victorian DNSPs' regulatory proposals and other supporting information, the AER is not satisfied that the labour cost escalation forecasts reasonably reflect the capex and opex criteria, including the capex and opex objectives. The AER has substituted the escalators proposed by the Victorian DNSPs and considers these adjustments are the minimum necessary so that the AER is satisfied these escalators reasonably reflect the capex and opex criteria. In coming to this view, the AER has had regard to the capex and opex factors.
The AER’s conclusion on the Victorian DNSPs' forecast internal and outsourced services labour cost escalators are set out in table K.20 and table K.21.
Table K.20 AER conclusion on the internal labour real cost escalators (per cent)
2010 2011 2012 2013 2014 2015
CitiPower 1.64 0.99 1.00 0.88 1.94 1.46
Powercor 1.86 0.96 0.99 0.87 1.93 1.46
Jemena 1.63 0.98 0.99 0.88 1.94 1.46
SP AusNet 1.91 0.94 0.99 0.86 1.93 1.46
United Energy 1.08 1.12 0.99 0.88 1.94 1.46
95 In regards to construction services, the AER has utilised Construction Forecasting Council (CFC)
forecasts as the most up to date reference data. 96 BIS Shrapnel, Wages outlook for the electricity distribution sector in Victoria, August 2009, p. 35. 97 ibid.
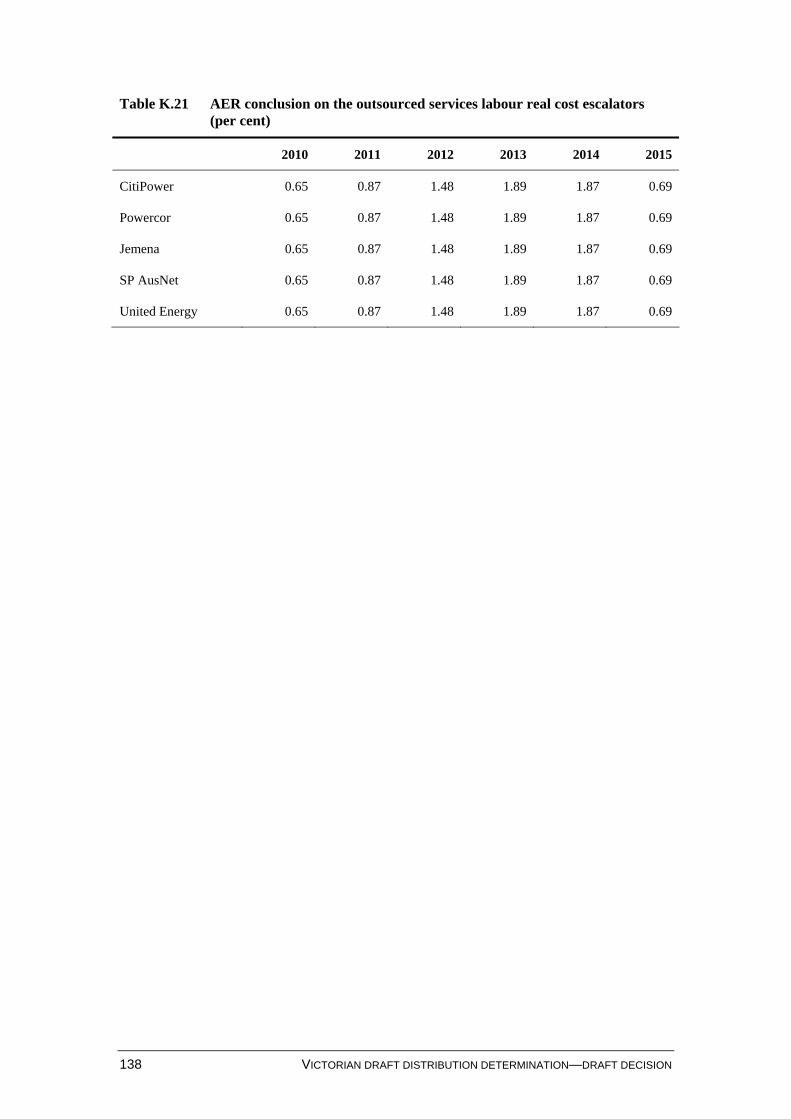
138 VICTORIAN DRAFT DISTRIBUTION DETERMINATION—DRAFT DECISION
Table K.21 AER conclusion on the outsourced services labour real cost escalators (per cent)
2010 2011 2012 2013 2014 2015
CitiPower 0.65 0.87 1.48 1.89 1.87 0.69
Powercor 0.65 0.87 1.48 1.89 1.87 0.69
Jemena 0.65 0.87 1.48 1.89 1.87 0.69
SP AusNet 0.65 0.87 1.48 1.89 1.87 0.69
United Energy 0.65 0.87 1.48 1.89 1.87 0.69
APPENDIX K—REAL COST ESCALATORS 139
K.5 Other cost escalators and issues This section discusses the other cost escalations proposed by the Victorian DNSPs (excluding United Energy) to apply to their forecast capex and opex allowances in the forthcoming regulatory control period.98
K.5.1 Inflation
Inflation forecasts are needed to convert forecasts of materials prices from nominal terms into real terms.
The AER considers that the approach proposed by the Victorian DNSPs is reasonable and consistent with the approach that has been adopted in recent AER determinations.99 The AER has, however, ensured that the most recently available data has been used in determining its inflation forecasts. The AER also notes that these forecasts will be updated to reflect the latest available information as part of its final decision.
The expected inflation rate is also a key input into the PTRM to forecast nominal allowed revenues and to index the RAB. Further discussion regarding the derivation of inflation forecasts utilised throughout the draft decision is provided in chapter 11.
K.5.2 Carbon
As part of its analysis of materials escalators, SKM considered that the Commonwealth Government’s proposed implementation of a carbon pollution reduction scheme (CPRS) would impose additional costs on greenhouse gas emitters, which would flow through to prices of services, materials and equipment. It proposed that the materials cost escalation rates for electricity network assets should include the likely impacts of carbon pricing on network infrastructure costs.100 As part of its modelling, SKM proposed two different CPRS scenarios—a 5 per cent reduction in carbon emissions with emissions intensive trade exposed assistance (CPRS5 EITE) and a 25 per cent reduction in carbon emissions (CPRS25)—and a base case scenario, where the CPRS was not factored into its forecasts.101
CitiPower, Powercor and Jemena applied the input cost escalators that SKM developed under the CPRS5 EITE scenario.102 As noted earlier (section K.3.1) SP AusNet applied input cost escalators that SKM developed under the base case (no CPRS) and United Energy did not apply any materials input cost escalators.103
98 United Energy, Regulatory proposal, November 2009, p. 52. 99 For example, see AER, New South Wales distribution determination, Final decision, April 2009,
pp. 478–507; AER, Queensland distribution determination, Final decision, May 2010, pp. 397–413; and AER, South Australia distribution determination, Final decision, May 2010, pp. 324–333.
100 SKM, Victorian Distribution Network Service Providers annual material cost escalators 2010–15, p. 8.
101 ibid., pp. 39–43. 102 CitiPower, Regulatory proposal, p. 234; Powercor, Regulatory proposal, p. 235; Jemena, response
to information requested on 15 December 2009, 21 December 2009, p. 2. 103 SP AusNet, response to information requested on 16 February 2010, 26 February 2010, p. 8;
United Energy, Regulatory proposal, p. 52.
140 VICTORIAN DRAFT DISTRIBUTION DETERMINATION—DRAFT DECISION
CitiPower also proposed that in the event that an emissions trading scheme event is established it would nominate it as a pass through event for the reasons set out by the AER in the NSW Final Decision.104
AER considerations
The Australian Government has recently announced that it will delay the implementation of the CPRS until after the end of the current commitment period of the Kyoto Protocol (which ends in 2012).105 Until the CPRS is established, the AER cannot be satisfied that additional expenditure associated with the CPRS is either prudent or efficient. Furthermore, in the event that CPRS legislation is passed, the affected Victorian DNSPs may apply to the AER to transfer the cost to distribution network users through a positive pass through.106 Pass through arrangements are discussed in chapter 16 of this draft decision.
The AER also considers that, through the efficiency of the market, the potential costs of a CPRS on the cost of materials will have been factored into the price of forward material contracts. The AER therefore considers that the inclusion of a carbon factor in addition to the use of forward contracts would result in over-compensation for the Victorian DNSPs, which is neither prudent nor efficient.
AER conclusion
The AER concludes that the cost escalators adopted by the Victorian DNSPs should not include any explicit consideration of the CPRS.
For the reasons discussed and as a result of the AER’s analysis of the Victorian regulatory proposals, the AER is not satisfied that the Victorian DNSPs’ proposed methodology for considering the CPRS reasonably reflects the capex and opex criteria, including the capex and opex objectives. In coming to this view the AER has had regard to the capex and opex factors.
K.5.3 Wood poles
In their regulatory proposals, CitiPower, Powercor and Jemena relied on the wood pole forecasts prepared by SKM.107 SKM noted that:
the Australian wood pole market is a mature market and that its prices reflected fundamental positions regarding the supply and demand of wood poles
continued demand and supply side pressure would be felt on the market price for wood poles going forward
it has developed a database of historic wood pole costs in Australia and that its preliminary results suggest that there has been a weighted average annual
104 CitiPower, Regulatory proposal, pp. 279–282. 105 Department of Climate Change and Energy Efficiency,
www.climatechange.gov.au/en/media/whats-new/cprs-delayed.aspx, accessed May 2010. 106 NER, cl. 6.6.1. 107 CitiPower, Regulatory proposal, p. 234; Jemena, Regulatory proposal, p. 112; and Powercor,
Regulatory proposal, p. 235.
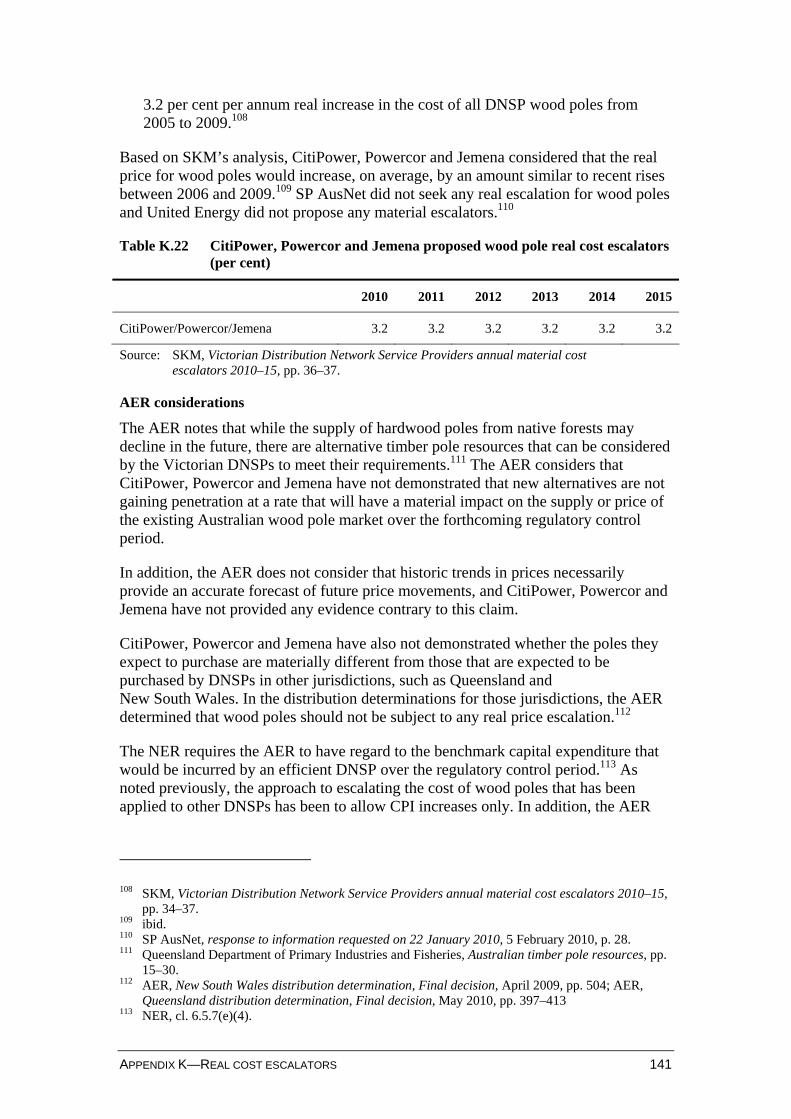
APPENDIX K—REAL COST ESCALATORS 141
3.2 per cent per annum real increase in the cost of all DNSP wood poles from 2005 to 2009.108
Based on SKM’s analysis, CitiPower, Powercor and Jemena considered that the real price for wood poles would increase, on average, by an amount similar to recent rises between 2006 and 2009.109 SP AusNet did not seek any real escalation for wood poles and United Energy did not propose any material escalators.110
Table K.22 CitiPower, Powercor and Jemena proposed wood pole real cost escalators (per cent)
2010 2011 2012 2013 2014 2015
CitiPower/Powercor/Jemena 3.2 3.2 3.2 3.2 3.2 3.2
Source: SKM, Victorian Distribution Network Service Providers annual material cost escalators 2010–15, pp. 36–37.
AER considerations
The AER notes that while the supply of hardwood poles from native forests may decline in the future, there are alternative timber pole resources that can be considered by the Victorian DNSPs to meet their requirements.111 The AER considers that CitiPower, Powercor and Jemena have not demonstrated that new alternatives are not gaining penetration at a rate that will have a material impact on the supply or price of the existing Australian wood pole market over the forthcoming regulatory control period.
In addition, the AER does not consider that historic trends in prices necessarily provide an accurate forecast of future price movements, and CitiPower, Powercor and Jemena have not provided any evidence contrary to this claim.
CitiPower, Powercor and Jemena have also not demonstrated whether the poles they expect to purchase are materially different from those that are expected to be purchased by DNSPs in other jurisdictions, such as Queensland and New South Wales. In the distribution determinations for those jurisdictions, the AER determined that wood poles should not be subject to any real price escalation.112
The NER requires the AER to have regard to the benchmark capital expenditure that would be incurred by an efficient DNSP over the regulatory control period.113 As noted previously, the approach to escalating the cost of wood poles that has been applied to other DNSPs has been to allow CPI increases only. In addition, the AER
108 SKM, Victorian Distribution Network Service Providers annual material cost escalators 2010–15,
pp. 34–37. 109 ibid. 110 SP AusNet, response to information requested on 22 January 2010, 5 February 2010, p. 28. 111 Queensland Department of Primary Industries and Fisheries, Australian timber pole resources, pp.
15–30. 112 AER, New South Wales distribution determination, Final decision, April 2009, pp. 504; AER,
Queensland distribution determination, Final decision, May 2010, pp. 397–413 113 NER, cl. 6.5.7(e)(4).
142 VICTORIAN DRAFT DISTRIBUTION DETERMINATION—DRAFT DECISION
notes that SP AusNet’s regulatory proposal proposed that wood poles be escalated by CPI only.114
The AER is therefore not satisfied that the forecast capex associated with CitiPower's, Powercor's and Jemena's proposed wood pole escalators reasonably reflect the efficient costs required by a prudent operator to achieve the capex objectives. The AER therefore considers that forecast expenditure for wood poles should not be subject to any real price escalation. That is, they should be escalated by CPI only.
AER conclusions
The AER concludes that the cost escalators adopted by the Victorian DNSPs should not include any real escalation for wood poles.
For the reasons discussed and as a result of the AER’s analysis of the Victorian DNSPs’ regulatory proposals, the AER is not satisfied that the Victorian DNSPs’ proposed methodology for escalating wood poles reasonably reflects the capex and opex criteria, including the capex and opex objectives. In coming to this view the AER has had regard to the capex and opex factors.
K.5.4 Trade weighted index
SKM applied the trade weighted index (TWI) published by the RBA to develop a nominal escalator for the Victorian DNSPs’ imported manufacturing input costs. This escalator was used as an input component within the cost escalation models for the Victorian DNSPs (excluding United Energy).115 SKM stated that the TWI is utilised as a means to account for the comparative movement in the cost of imported items at the effective Australian dollar exchange rate.
The SKM methodology is to take the inverse of the average of the RBA year to December TWI figure for each calendar year, and calculate the annual changes in the figures presented. This provides the relative effect on costs to an Australian producer.
To forecast the expected movement in the TWI over the forthcoming regulatory control period, SKM assumed that the TWI would return to the historical average of the ten years to 2009.116
The proposed real escalation rates for imported manufacturing costs proposed by SKM are shown in table K.23.
114 SP AusNet, response to information requested on 22 January 2010, 5 February 2010, p. 28. 115 CitiPower, Regulatory proposal, pp. 234–235; Powercor, Regulatory proposal, pp. 235–236;
Jemena, response to information requested on 15 December 2009, 21 December 2009, pp. 1–2; SP AusNet, response to information requested on 22 January 2010, 5 February 2010, p. 28.
116 SKM, Victorian Distribution Network Service Providers annual material cost escalators 2010–15, p. 21.
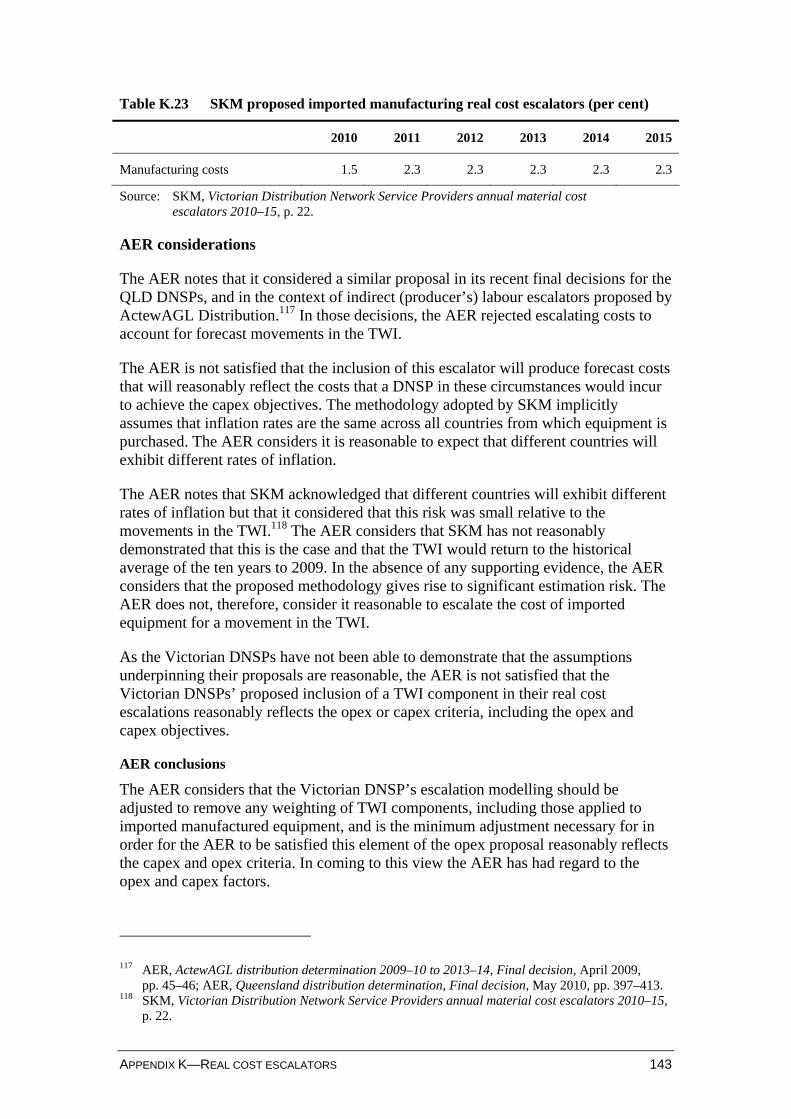
APPENDIX K—REAL COST ESCALATORS 143
Table K.23 SKM proposed imported manufacturing real cost escalators (per cent)
2010 2011 2012 2013 2014 2015
Manufacturing costs 1.5 2.3 2.3 2.3 2.3 2.3
Source: SKM, Victorian Distribution Network Service Providers annual material cost escalators 2010–15, p. 22.
AER considerations
The AER notes that it considered a similar proposal in its recent final decisions for the QLD DNSPs, and in the context of indirect (producer’s) labour escalators proposed by ActewAGL Distribution.117 In those decisions, the AER rejected escalating costs to account for forecast movements in the TWI.
The AER is not satisfied that the inclusion of this escalator will produce forecast costs that will reasonably reflect the costs that a DNSP in these circumstances would incur to achieve the capex objectives. The methodology adopted by SKM implicitly assumes that inflation rates are the same across all countries from which equipment is purchased. The AER considers it is reasonable to expect that different countries will exhibit different rates of inflation.
The AER notes that SKM acknowledged that different countries will exhibit different rates of inflation but that it considered that this risk was small relative to the movements in the TWI.118 The AER considers that SKM has not reasonably demonstrated that this is the case and that the TWI would return to the historical average of the ten years to 2009. In the absence of any supporting evidence, the AER considers that the proposed methodology gives rise to significant estimation risk. The AER does not, therefore, consider it reasonable to escalate the cost of imported equipment for a movement in the TWI.
As the Victorian DNSPs have not been able to demonstrate that the assumptions underpinning their proposals are reasonable, the AER is not satisfied that the Victorian DNSPs’ proposed inclusion of a TWI component in their real cost escalations reasonably reflects the opex or capex criteria, including the opex and capex objectives.
AER conclusions
The AER considers that the Victorian DNSP’s escalation modelling should be adjusted to remove any weighting of TWI components, including those applied to imported manufactured equipment, and is the minimum adjustment necessary for in order for the AER to be satisfied this element of the opex proposal reasonably reflects the capex and opex criteria. In coming to this view the AER has had regard to the opex and capex factors.
117 AER, ActewAGL distribution determination 2009–10 to 2013–14, Final decision, April 2009,
pp. 45–46; AER, Queensland distribution determination, Final decision, May 2010, pp. 397–413. 118 SKM, Victorian Distribution Network Service Providers annual material cost escalators 2010–15,
p. 22.
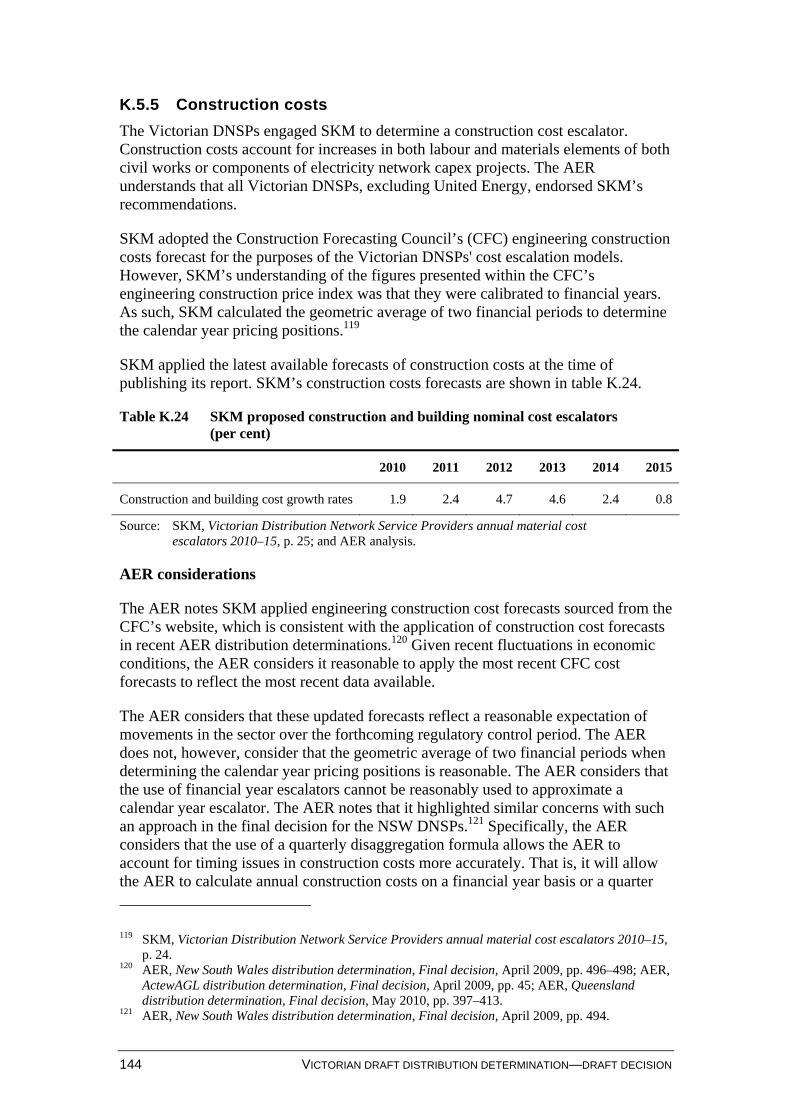
144 VICTORIAN DRAFT DISTRIBUTION DETERMINATION—DRAFT DECISION
K.5.5 Construction costs
The Victorian DNSPs engaged SKM to determine a construction cost escalator. Construction costs account for increases in both labour and materials elements of both civil works or components of electricity network capex projects. The AER understands that all Victorian DNSPs, excluding United Energy, endorsed SKM’s recommendations.
SKM adopted the Construction Forecasting Council’s (CFC) engineering construction costs forecast for the purposes of the Victorian DNSPs' cost escalation models. However, SKM’s understanding of the figures presented within the CFC’s engineering construction price index was that they were calibrated to financial years. As such, SKM calculated the geometric average of two financial periods to determine the calendar year pricing positions.119
SKM applied the latest available forecasts of construction costs at the time of publishing its report. SKM’s construction costs forecasts are shown in table K.24.
Table K.24 SKM proposed construction and building nominal cost escalators (per cent)
2010 2011 2012 2013 2014 2015
Construction and building cost growth rates 1.9 2.4 4.7 4.6 2.4 0.8
Source: SKM, Victorian Distribution Network Service Providers annual material cost escalators 2010–15, p. 25; and AER analysis.
AER considerations
The AER notes SKM applied engineering construction cost forecasts sourced from the CFC’s website, which is consistent with the application of construction cost forecasts in recent AER distribution determinations.120 Given recent fluctuations in economic conditions, the AER considers it reasonable to apply the most recent CFC cost forecasts to reflect the most recent data available.
The AER considers that these updated forecasts reflect a reasonable expectation of movements in the sector over the forthcoming regulatory control period. The AER does not, however, consider that the geometric average of two financial periods when determining the calendar year pricing positions is reasonable. The AER considers that the use of financial year escalators cannot be reasonably used to approximate a calendar year escalator. The AER notes that it highlighted similar concerns with such an approach in the final decision for the NSW DNSPs.121 Specifically, the AER considers that the use of a quarterly disaggregation formula allows the AER to account for timing issues in construction costs more accurately. That is, it will allow the AER to calculate annual construction costs on a financial year basis or a quarter
119 SKM, Victorian Distribution Network Service Providers annual material cost escalators 2010–15,
p. 24. 120 AER, New South Wales distribution determination, Final decision, April 2009, pp. 496–498; AER,
ActewAGL distribution determination, Final decision, April 2009, pp. 45; AER, Queensland distribution determination, Final decision, May 2010, pp. 397–413.
121 AER, New South Wales distribution determination, Final decision, April 2009, pp. 494.
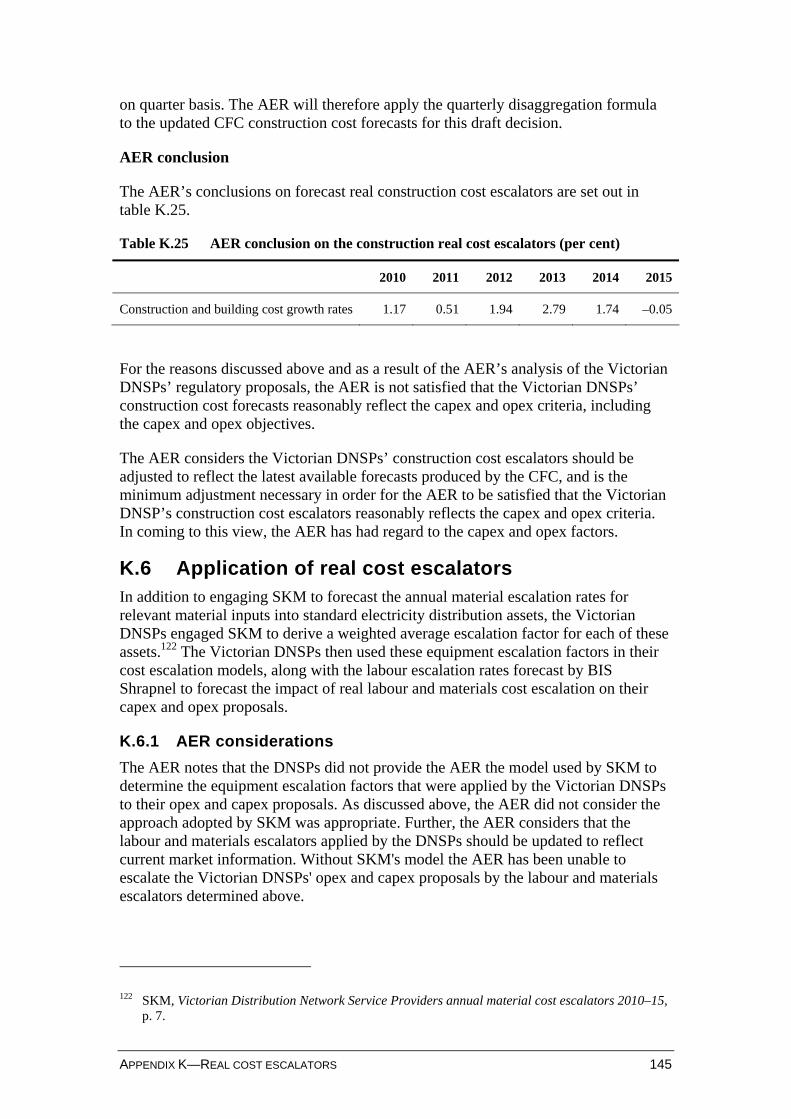
APPENDIX K—REAL COST ESCALATORS 145
on quarter basis. The AER will therefore apply the quarterly disaggregation formula to the updated CFC construction cost forecasts for this draft decision.
AER conclusion
The AER’s conclusions on forecast real construction cost escalators are set out in table K.25.
Table K.25 AER conclusion on the construction real cost escalators (per cent)
2010 2011 2012 2013 2014 2015
Construction and building cost growth rates 1.17 0.51 1.94 2.79 1.74 –0.05
For the reasons discussed above and as a result of the AER’s analysis of the Victorian DNSPs’ regulatory proposals, the AER is not satisfied that the Victorian DNSPs’ construction cost forecasts reasonably reflect the capex and opex criteria, including the capex and opex objectives.
The AER considers the Victorian DNSPs’ construction cost escalators should be adjusted to reflect the latest available forecasts produced by the CFC, and is the minimum adjustment necessary in order for the AER to be satisfied that the Victorian DNSP’s construction cost escalators reasonably reflects the capex and opex criteria. In coming to this view, the AER has had regard to the capex and opex factors.
K.6 Application of real cost escalators In addition to engaging SKM to forecast the annual material escalation rates for relevant material inputs into standard electricity distribution assets, the Victorian DNSPs engaged SKM to derive a weighted average escalation factor for each of these assets.122 The Victorian DNSPs then used these equipment escalation factors in their cost escalation models, along with the labour escalation rates forecast by BIS Shrapnel to forecast the impact of real labour and materials cost escalation on their capex and opex proposals.
K.6.1 AER considerations
The AER notes that the DNSPs did not provide the AER the model used by SKM to determine the equipment escalation factors that were applied by the Victorian DNSPs to their opex and capex proposals. As discussed above, the AER did not consider the approach adopted by SKM was appropriate. Further, the AER considers that the labour and materials escalators applied by the DNSPs should be updated to reflect current market information. Without SKM's model the AER has been unable to escalate the Victorian DNSPs' opex and capex proposals by the labour and materials escalators determined above.
122 SKM, Victorian Distribution Network Service Providers annual material cost escalators 2010–15,
p. 7.
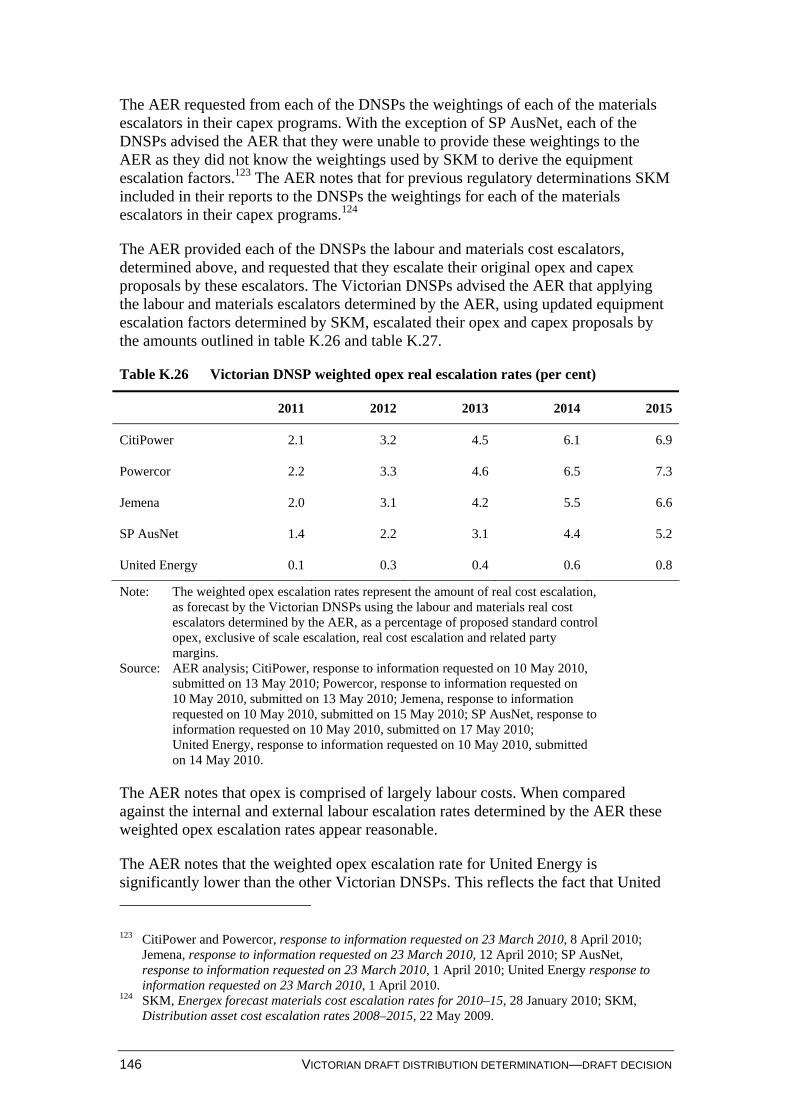
146 VICTORIAN DRAFT DISTRIBUTION DETERMINATION—DRAFT DECISION
The AER requested from each of the DNSPs the weightings of each of the materials escalators in their capex programs. With the exception of SP AusNet, each of the DNSPs advised the AER that they were unable to provide these weightings to the AER as they did not know the weightings used by SKM to derive the equipment escalation factors.123 The AER notes that for previous regulatory determinations SKM included in their reports to the DNSPs the weightings for each of the materials escalators in their capex programs.124
The AER provided each of the DNSPs the labour and materials cost escalators, determined above, and requested that they escalate their original opex and capex proposals by these escalators. The Victorian DNSPs advised the AER that applying the labour and materials escalators determined by the AER, using updated equipment escalation factors determined by SKM, escalated their opex and capex proposals by the amounts outlined in table K.26 and table K.27.
Table K.26 Victorian DNSP weighted opex real escalation rates (per cent)
2011 2012 2013 2014 2015
CitiPower 2.1 3.2 4.5 6.1 6.9
Powercor 2.2 3.3 4.6 6.5 7.3
Jemena 2.0 3.1 4.2 5.5 6.6
SP AusNet 1.4 2.2 3.1 4.4 5.2
United Energy 0.1 0.3 0.4 0.6 0.8
Note: The weighted opex escalation rates represent the amount of real cost escalation, as forecast by the Victorian DNSPs using the labour and materials real cost escalators determined by the AER, as a percentage of proposed standard control opex, exclusive of scale escalation, real cost escalation and related party margins.
Source: AER analysis; CitiPower, response to information requested on 10 May 2010, submitted on 13 May 2010; Powercor, response to information requested on 10 May 2010, submitted on 13 May 2010; Jemena, response to information requested on 10 May 2010, submitted on 15 May 2010; SP AusNet, response to information requested on 10 May 2010, submitted on 17 May 2010; United Energy, response to information requested on 10 May 2010, submitted on 14 May 2010.
The AER notes that opex is comprised of largely labour costs. When compared against the internal and external labour escalation rates determined by the AER these weighted opex escalation rates appear reasonable.
The AER notes that the weighted opex escalation rate for United Energy is significantly lower than the other Victorian DNSPs. This reflects the fact that United
123 CitiPower and Powercor, response to information requested on 23 March 2010, 8 April 2010;
Jemena, response to information requested on 23 March 2010, 12 April 2010; SP AusNet, response to information requested on 23 March 2010, 1 April 2010; United Energy response to information requested on 23 March 2010, 1 April 2010.
124 SKM, Energex forecast materials cost escalation rates for 2010–15, 28 January 2010; SKM, Distribution asset cost escalation rates 2008–2015, 22 May 2009.
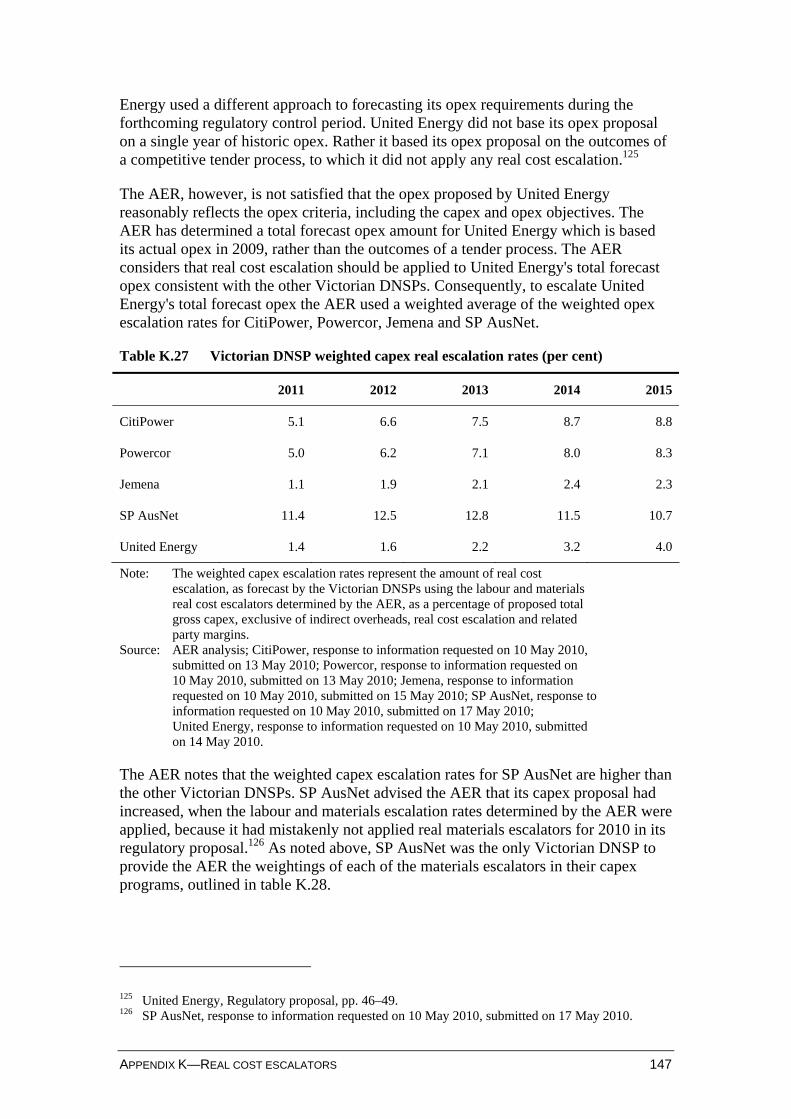
APPENDIX K—REAL COST ESCALATORS 147
Energy used a different approach to forecasting its opex requirements during the forthcoming regulatory control period. United Energy did not base its opex proposal on a single year of historic opex. Rather it based its opex proposal on the outcomes of a competitive tender process, to which it did not apply any real cost escalation.125
The AER, however, is not satisfied that the opex proposed by United Energy reasonably reflects the opex criteria, including the capex and opex objectives. The AER has determined a total forecast opex amount for United Energy which is based its actual opex in 2009, rather than the outcomes of a tender process. The AER considers that real cost escalation should be applied to United Energy's total forecast opex consistent with the other Victorian DNSPs. Consequently, to escalate United Energy's total forecast opex the AER used a weighted average of the weighted opex escalation rates for CitiPower, Powercor, Jemena and SP AusNet.
Table K.27 Victorian DNSP weighted capex real escalation rates (per cent)
2011 2012 2013 2014 2015
CitiPower 5.1 6.6 7.5 8.7 8.8
Powercor 5.0 6.2 7.1 8.0 8.3
Jemena 1.1 1.9 2.1 2.4 2.3
SP AusNet 11.4 12.5 12.8 11.5 10.7
United Energy 1.4 1.6 2.2 3.2 4.0
Note: The weighted capex escalation rates represent the amount of real cost escalation, as forecast by the Victorian DNSPs using the labour and materials real cost escalators determined by the AER, as a percentage of proposed total gross capex, exclusive of indirect overheads, real cost escalation and related party margins.
Source: AER analysis; CitiPower, response to information requested on 10 May 2010, submitted on 13 May 2010; Powercor, response to information requested on 10 May 2010, submitted on 13 May 2010; Jemena, response to information requested on 10 May 2010, submitted on 15 May 2010; SP AusNet, response to information requested on 10 May 2010, submitted on 17 May 2010; United Energy, response to information requested on 10 May 2010, submitted on 14 May 2010.
The AER notes that the weighted capex escalation rates for SP AusNet are higher than the other Victorian DNSPs. SP AusNet advised the AER that its capex proposal had increased, when the labour and materials escalation rates determined by the AER were applied, because it had mistakenly not applied real materials escalators for 2010 in its regulatory proposal.126 As noted above, SP AusNet was the only Victorian DNSP to provide the AER the weightings of each of the materials escalators in their capex programs, outlined in table K.28.
125 United Energy, Regulatory proposal, pp. 46–49. 126 SP AusNet, response to information requested on 10 May 2010, submitted on 17 May 2010.
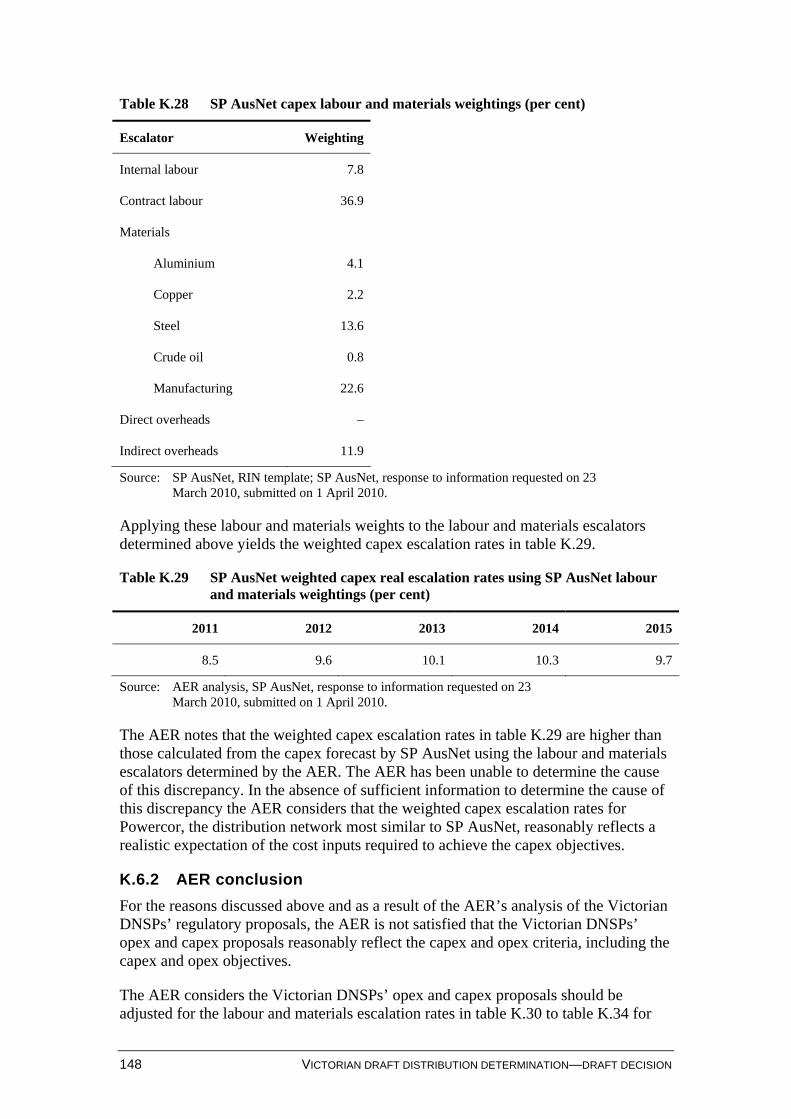
148 VICTORIAN DRAFT DISTRIBUTION DETERMINATION—DRAFT DECISION
Table K.28 SP AusNet capex labour and materials weightings (per cent)
Escalator Weighting
Internal labour 7.8
Contract labour 36.9
Materials
Aluminium 4.1
Copper 2.2
Steel 13.6
Crude oil 0.8
Manufacturing 22.6
Direct overheads –
Indirect overheads 11.9
Source: SP AusNet, RIN template; SP AusNet, response to information requested on 23 March 2010, submitted on 1 April 2010.
Applying these labour and materials weights to the labour and materials escalators determined above yields the weighted capex escalation rates in table K.29.
Table K.29 SP AusNet weighted capex real escalation rates using SP AusNet labour and materials weightings (per cent)
2011 2012 2013 2014 2015
8.5 9.6 10.1 10.3 9.7
Source: AER analysis, SP AusNet, response to information requested on 23 March 2010, submitted on 1 April 2010.
The AER notes that the weighted capex escalation rates in table K.29 are higher than those calculated from the capex forecast by SP AusNet using the labour and materials escalators determined by the AER. The AER has been unable to determine the cause of this discrepancy. In the absence of sufficient information to determine the cause of this discrepancy the AER considers that the weighted capex escalation rates for Powercor, the distribution network most similar to SP AusNet, reasonably reflects a realistic expectation of the cost inputs required to achieve the capex objectives.
K.6.2 AER conclusion
For the reasons discussed above and as a result of the AER’s analysis of the Victorian DNSPs’ regulatory proposals, the AER is not satisfied that the Victorian DNSPs’ opex and capex proposals reasonably reflect the capex and opex criteria, including the capex and opex objectives.
The AER considers the Victorian DNSPs’ opex and capex proposals should be adjusted for the labour and materials escalation rates in table K.30 to table K.34 for
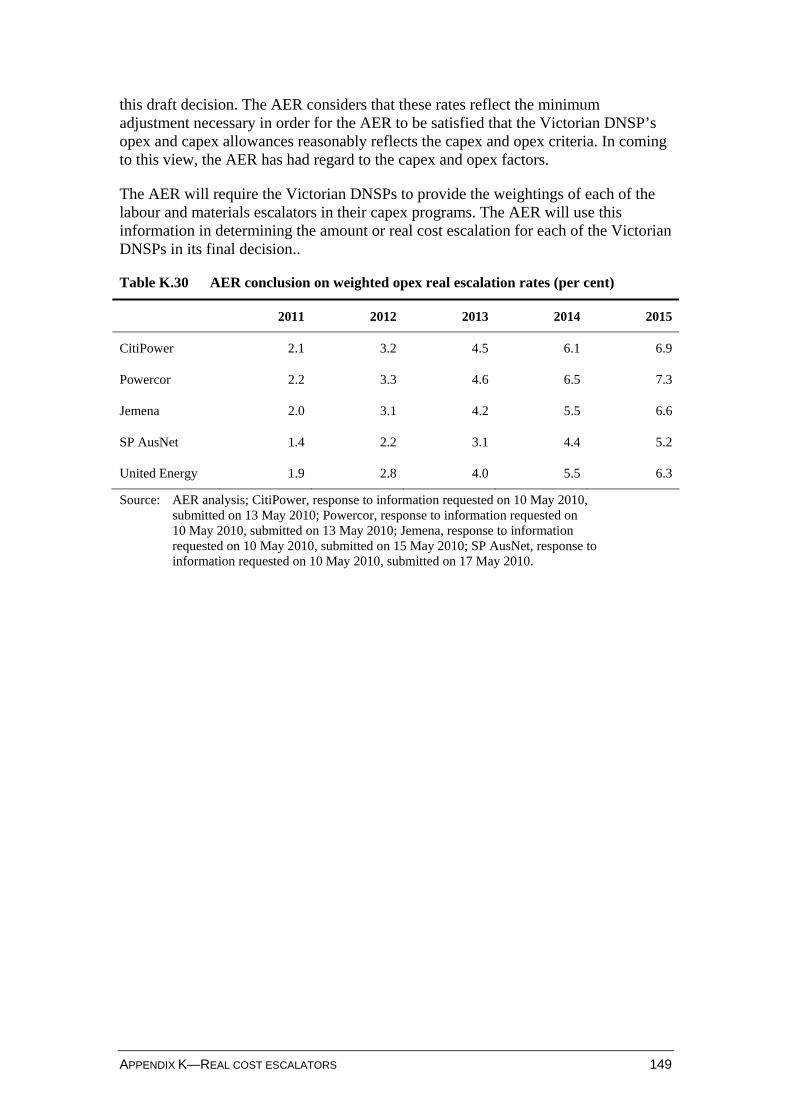
APPENDIX K—REAL COST ESCALATORS 149
this draft decision. The AER considers that these rates reflect the minimum adjustment necessary in order for the AER to be satisfied that the Victorian DNSP’s opex and capex allowances reasonably reflects the capex and opex criteria. In coming to this view, the AER has had regard to the capex and opex factors.
The AER will require the Victorian DNSPs to provide the weightings of each of the labour and materials escalators in their capex programs. The AER will use this information in determining the amount or real cost escalation for each of the Victorian DNSPs in its final decision..
Table K.30 AER conclusion on weighted opex real escalation rates (per cent)
2011 2012 2013 2014 2015
CitiPower 2.1 3.2 4.5 6.1 6.9
Powercor 2.2 3.3 4.6 6.5 7.3
Jemena 2.0 3.1 4.2 5.5 6.6
SP AusNet 1.4 2.2 3.1 4.4 5.2
United Energy 1.9 2.8 4.0 5.5 6.3
Source: AER analysis; CitiPower, response to information requested on 10 May 2010, submitted on 13 May 2010; Powercor, response to information requested on 10 May 2010, submitted on 13 May 2010; Jemena, response to information requested on 10 May 2010, submitted on 15 May 2010; SP AusNet, response to information requested on 10 May 2010, submitted on 17 May 2010.
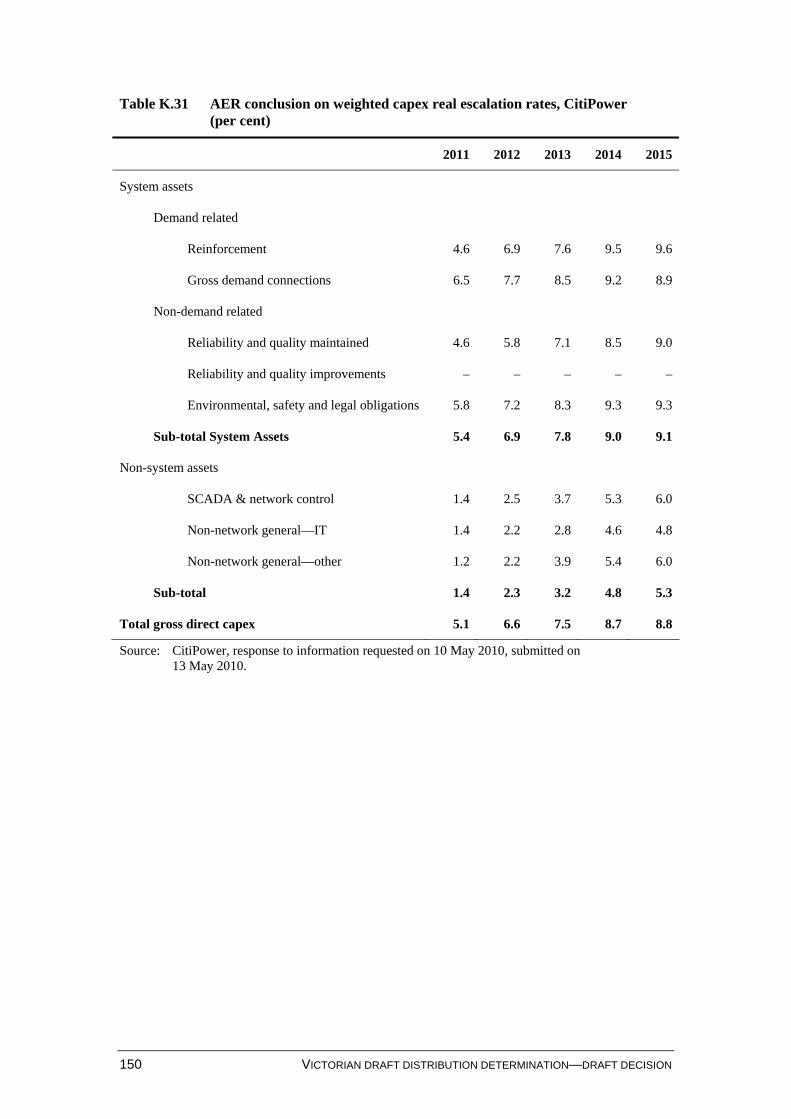
150 VICTORIAN DRAFT DISTRIBUTION DETERMINATION—DRAFT DECISION
Table K.31 AER conclusion on weighted capex real escalation rates, CitiPower (per cent)
2011 2012 2013 2014 2015
System assets
Demand related
Reinforcement 4.6 6.9 7.6 9.5 9.6
Gross demand connections 6.5 7.7 8.5 9.2 8.9
Non-demand related
Reliability and quality maintained 4.6 5.8 7.1 8.5 9.0
Reliability and quality improvements – – – – –
Environmental, safety and legal obligations 5.8 7.2 8.3 9.3 9.3
Sub-total System Assets 5.4 6.9 7.8 9.0 9.1
Non-system assets
SCADA & network control 1.4 2.5 3.7 5.3 6.0
Non-network general—IT 1.4 2.2 2.8 4.6 4.8
Non-network general—other 1.2 2.2 3.9 5.4 6.0
Sub-total 1.4 2.3 3.2 4.8 5.3
Total gross direct capex 5.1 6.6 7.5 8.7 8.8
Source: CitiPower, response to information requested on 10 May 2010, submitted on 13 May 2010.
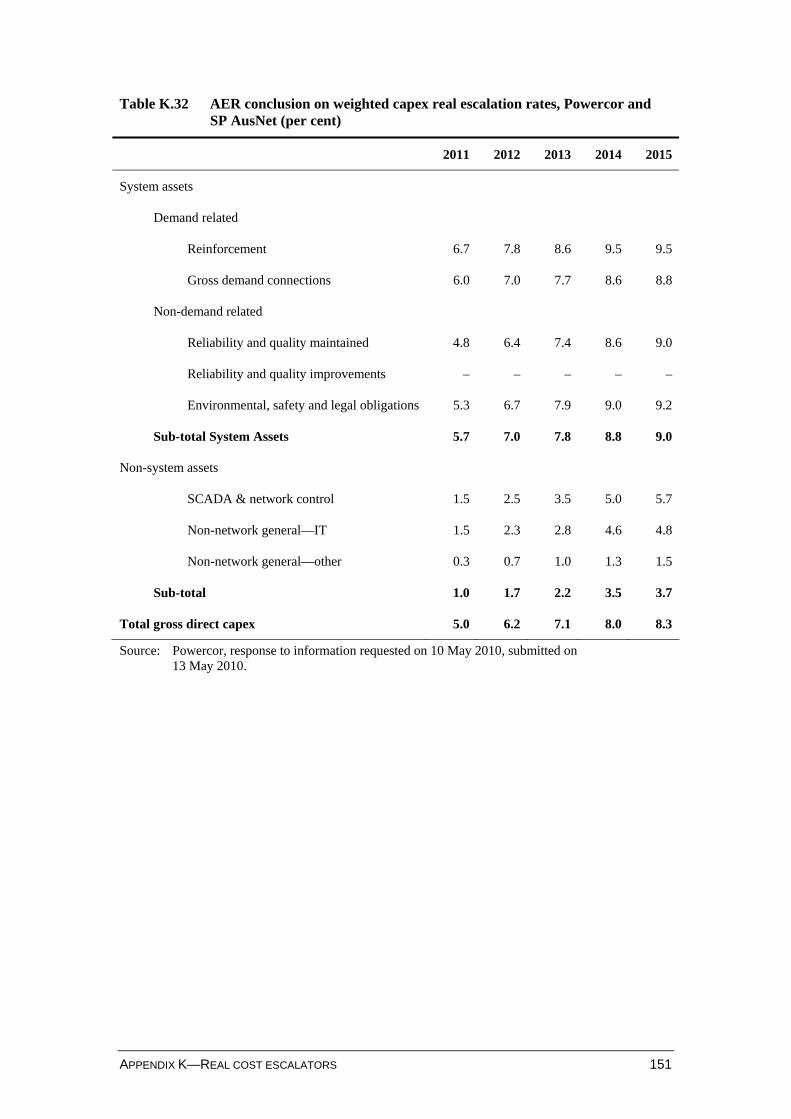
APPENDIX K—REAL COST ESCALATORS 151
Table K.32 AER conclusion on weighted capex real escalation rates, Powercor and SP AusNet (per cent)
2011 2012 2013 2014 2015
System assets
Demand related
Reinforcement 6.7 7.8 8.6 9.5 9.5
Gross demand connections 6.0 7.0 7.7 8.6 8.8
Non-demand related
Reliability and quality maintained 4.8 6.4 7.4 8.6 9.0
Reliability and quality improvements – – – – –
Environmental, safety and legal obligations 5.3 6.7 7.9 9.0 9.2
Sub-total System Assets 5.7 7.0 7.8 8.8 9.0
Non-system assets
SCADA & network control 1.5 2.5 3.5 5.0 5.7
Non-network general—IT 1.5 2.3 2.8 4.6 4.8
Non-network general—other 0.3 0.7 1.0 1.3 1.5
Sub-total 1.0 1.7 2.2 3.5 3.7
Total gross direct capex 5.0 6.2 7.1 8.0 8.3
Source: Powercor, response to information requested on 10 May 2010, submitted on 13 May 2010.
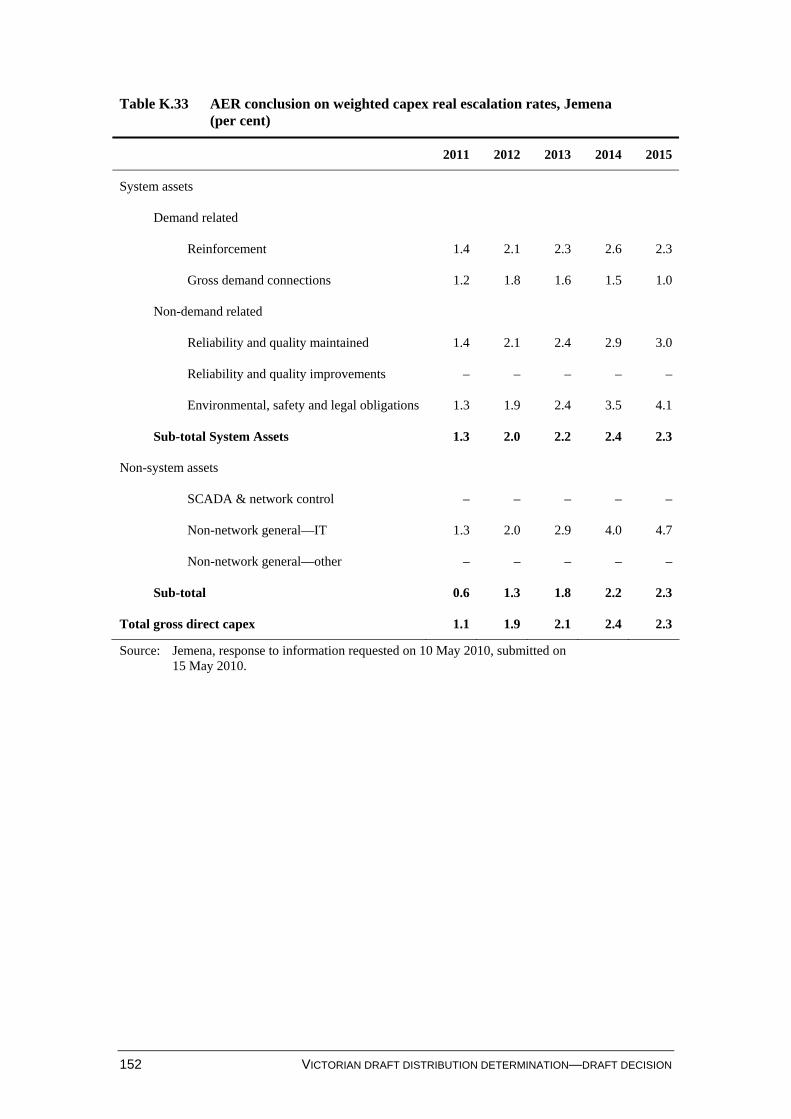
152 VICTORIAN DRAFT DISTRIBUTION DETERMINATION—DRAFT DECISION
Table K.33 AER conclusion on weighted capex real escalation rates, Jemena (per cent)
2011 2012 2013 2014 2015
System assets
Demand related
Reinforcement 1.4 2.1 2.3 2.6 2.3
Gross demand connections 1.2 1.8 1.6 1.5 1.0
Non-demand related
Reliability and quality maintained 1.4 2.1 2.4 2.9 3.0
Reliability and quality improvements – – – – –
Environmental, safety and legal obligations 1.3 1.9 2.4 3.5 4.1
Sub-total System Assets 1.3 2.0 2.2 2.4 2.3
Non-system assets
SCADA & network control – – – – –
Non-network general—IT 1.3 2.0 2.9 4.0 4.7
Non-network general—other – – – – –
Sub-total 0.6 1.3 1.8 2.2 2.3
Total gross direct capex 1.1 1.9 2.1 2.4 2.3
Source: Jemena, response to information requested on 10 May 2010, submitted on 15 May 2010.
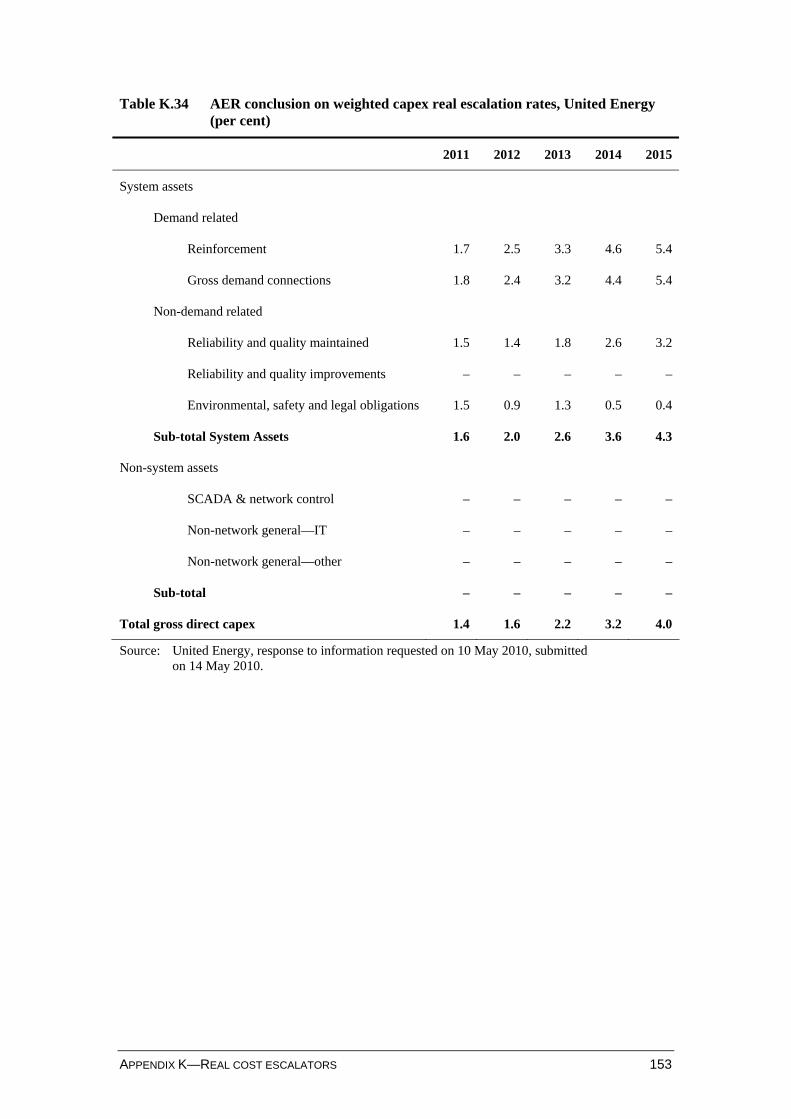
APPENDIX K—REAL COST ESCALATORS 153
Table K.34 AER conclusion on weighted capex real escalation rates, United Energy (per cent)
2011 2012 2013 2014 2015
System assets
Demand related
Reinforcement 1.7 2.5 3.3 4.6 5.4
Gross demand connections 1.8 2.4 3.2 4.4 5.4
Non-demand related
Reliability and quality maintained 1.5 1.4 1.8 2.6 3.2
Reliability and quality improvements – – – – –
Environmental, safety and legal obligations 1.5 0.9 1.3 0.5 0.4
Sub-total System Assets 1.6 2.0 2.6 3.6 4.3
Non-system assets
SCADA & network control – – – – –
Non-network general—IT – – – – –
Non-network general—other – – – – –
Sub-total – – – – –
Total gross direct capex 1.4 1.6 2.2 3.2 4.0
Source: United Energy, response to information requested on 10 May 2010, submitted on 14 May 2010.
154 VICTORIAN DRAFT DISTRIBUTION DETERMINATION—DRAFT DECISION
L Operating expenditure step changes
L.1 Introduction Having determined the base operating and maintenance expenditure (see chapter 7) the AER’s approach is to recognise that DNSPs may be subject to changes in regulatory obligations or a change in operating environment that would not necessarily be reflected in the recurrent expenditure. The base operating and maintenance expenditure should therefore be adjusted for costs arising from new (or changed) legislative obligations or a change in operating environment (termed ‘step changes’). For these purposes, the reference to legislative obligations is intended to encompass all regulatory obligations whether imposed by legislation or another regulatory instrument, such as a licence, code or price determination.
Accordingly, the Victorian DNSPs should identify any step changes and provide information supporting the basis and quantum of these step changes.
The forecast operating expenditure (opex) criteria also require that the total of the forecast opex reasonably reflects the efficient costs and the costs that a prudent operator in the circumstances of the relevant DNSP would require.1 In assessing the Victorian DNSPs’ proposals, the AER must therefore be satisfied that any proposed opex step changes reasonably reflect the opex criteria, including the opex objectives.2 In coming to its view, the AER has had regard to the opex factors, specifically:
(4) benchmark opex that would be incurred by an efficient DNSP over the regulatory control period;
(5) the actual and expected opex of the DNSP during any preceding regulatory control periods;
(7) the substitution possibilities between opex and capex3
In assessing the Victorian DNSPs’ proposed step changes, the AER has in the first instance had regard to changes in the regulatory obligations and subsequently changes in the operating environment. Consistent with the AER’s approach to step changes in the New South Wales final electricity distribution determination4, the AER has then assessed whether the proposed (operating expenditure) opex is prudent and efficient. In determining whether the opex is prudent and efficient, the AER has had regard to whether the proposal has appropriately quantified all cost savings and benefits.
Each step change proposed by the Victorian DNSPs is discussed in the following sections. Where possible, common step change issues have been grouped together and discussed. However, where a business specific issue has been proposed this has been discussed separately.
1 NER, clauses 6.5.6(c)(1), 6.5.6(c)(2). 2 NER, clauses 6.5.6(c), 6.5.6(a). 3 NER, clause 6.5.6(e). 4 AER, Final decision, New South Wales distribution determination 2009–10 to 2013–14,
28 April 2009, pp. 163–168.
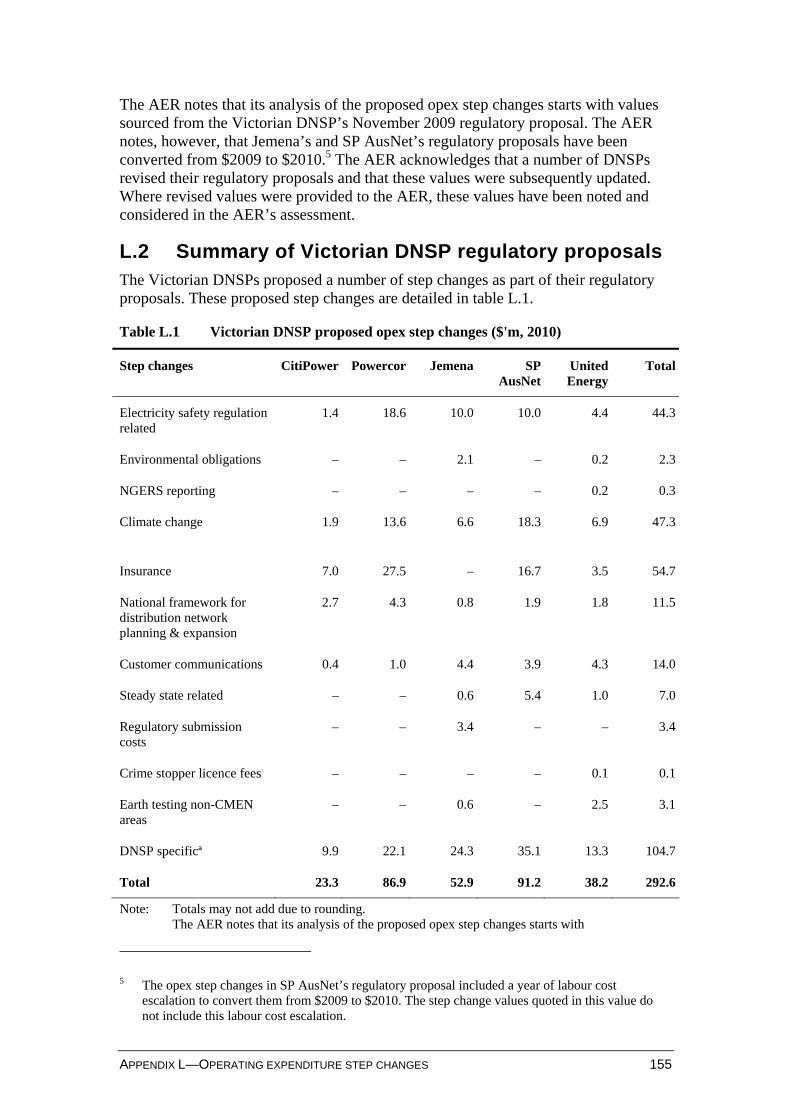
APPENDIX L—OPERATING EXPENDITURE STEP CHANGES 155
The AER notes that its analysis of the proposed opex step changes starts with values sourced from the Victorian DNSP’s November 2009 regulatory proposal. The AER notes, however, that Jemena’s and SP AusNet’s regulatory proposals have been converted from $2009 to $2010.5 The AER acknowledges that a number of DNSPs revised their regulatory proposals and that these values were subsequently updated. Where revised values were provided to the AER, these values have been noted and considered in the AER’s assessment.
L.2 Summary of Victorian DNSP regulatory proposals The Victorian DNSPs proposed a number of step changes as part of their regulatory proposals. These proposed step changes are detailed in table L.1.
Table L.1 Victorian DNSP proposed opex step changes ($'m, 2010)
Step changes CitiPower Powercor Jemena SP AusNet
United Energy
Total
Electricity safety regulation related
1.4 18.6 10.0 10.0 4.4 44.3
Environmental obligations – – 2.1 – 0.2 2.3
NGERS reporting – – – – 0.2 0.3
Climate change 1.9 13.6 6.6 18.3 6.9 47.3
Insurance 7.0 27.5 – 16.7 3.5 54.7
National framework for distribution network planning & expansion
2.7 4.3 0.8 1.9 1.8 11.5
Customer communications 0.4 1.0 4.4 3.9 4.3 14.0
Steady state related – – 0.6 5.4 1.0 7.0
Regulatory submission costs
– – 3.4 – – 3.4
Crime stopper licence fees – – – – 0.1 0.1
Earth testing non-CMEN areas
– – 0.6 – 2.5 3.1
DNSP specificª 9.9 22.1 24.3 35.1 13.3 104.7
Total 23.3 86.9 52.9 91.2 38.2 292.6
Note: Totals may not add due to rounding. The AER notes that its analysis of the proposed opex step changes starts with
5 The opex step changes in SP AusNet’s regulatory proposal included a year of labour cost
escalation to convert them from $2009 to $2010. The step change values quoted in this value do not include this labour cost escalation.
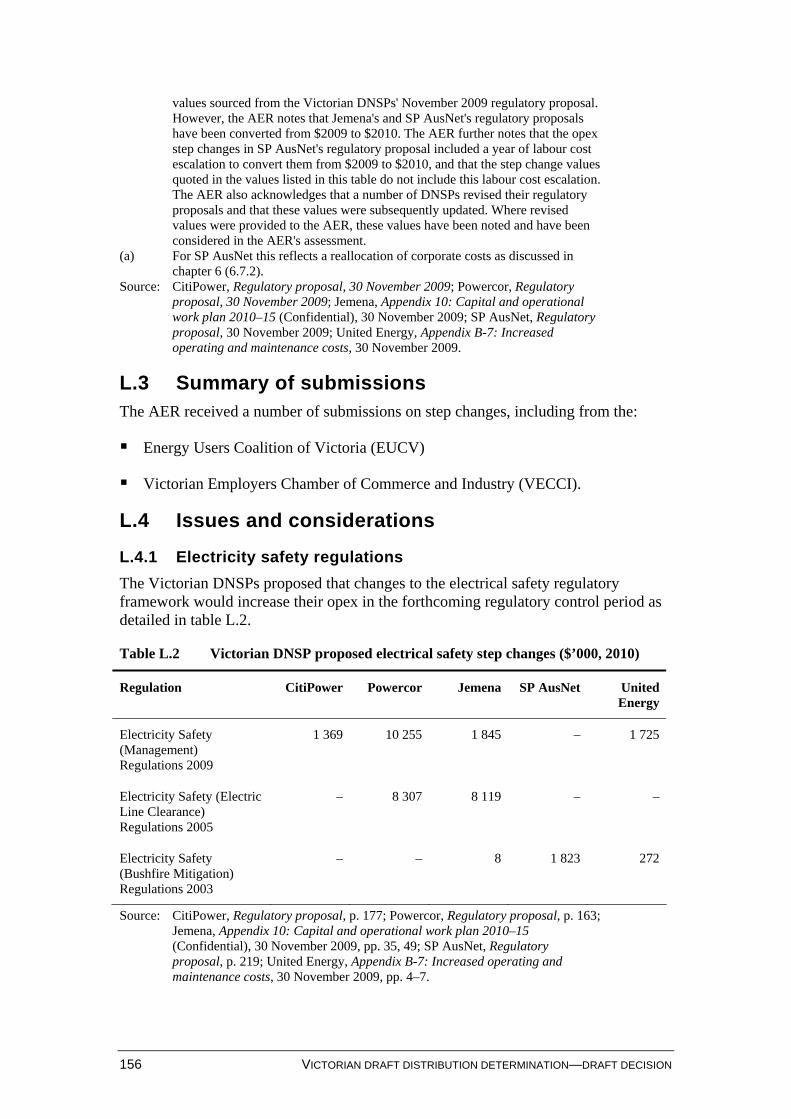
156 VICTORIAN DRAFT DISTRIBUTION DETERMINATION—DRAFT DECISION
values sourced from the Victorian DNSPs' November 2009 regulatory proposal. However, the AER notes that Jemena's and SP AusNet's regulatory proposals have been converted from $2009 to $2010. The AER further notes that the opex step changes in SP AusNet's regulatory proposal included a year of labour cost escalation to convert them from $2009 to $2010, and that the step change values quoted in the values listed in this table do not include this labour cost escalation. The AER also acknowledges that a number of DNSPs revised their regulatory proposals and that these values were subsequently updated. Where revised values were provided to the AER, these values have been noted and have been considered in the AER's assessment.
(a) For SP AusNet this reflects a reallocation of corporate costs as discussed in chapter 6 (6.7.2).
Source: CitiPower, Regulatory proposal, 30 November 2009; Powercor, Regulatory proposal, 30 November 2009; Jemena, Appendix 10: Capital and operational work plan 2010–15 (Confidential), 30 November 2009; SP AusNet, Regulatory proposal, 30 November 2009; United Energy, Appendix B-7: Increased operating and maintenance costs, 30 November 2009.
L.3 Summary of submissions The AER received a number of submissions on step changes, including from the:
Energy Users Coalition of Victoria (EUCV)
Victorian Employers Chamber of Commerce and Industry (VECCI).
L.4 Issues and considerations
L.4.1 Electricity safety regulations
The Victorian DNSPs proposed that changes to the electrical safety regulatory framework would increase their opex in the forthcoming regulatory control period as detailed in table L.2.
Table L.2 Victorian DNSP proposed electrical safety step changes ($’000, 2010)
Regulation CitiPower Powercor Jemena SP AusNet United Energy
Electricity Safety (Management) Regulations 2009
1 369 10 255 1 845 – 1 725
Electricity Safety (Electric Line Clearance) Regulations 2005
– 8 307 8 119 – –
Electricity Safety (Bushfire Mitigation) Regulations 2003
– – 8 1 823 272
Source: CitiPower, Regulatory proposal, p. 177; Powercor, Regulatory proposal, p. 163; Jemena, Appendix 10: Capital and operational work plan 2010–15 (Confidential), 30 November 2009, pp. 35, 49; SP AusNet, Regulatory proposal, p. 219; United Energy, Appendix B-7: Increased operating and maintenance costs, 30 November 2009, pp. 4–7.
APPENDIX L—OPERATING EXPENDITURE STEP CHANGES 157
Consultant review
Nuttall Consulting assessed the DNSPs’ proposals relating to the Electricity Safety (Electric Line Clearance) Regulations 2010 and the Electricity Safety (Bushfire Mitigation) Regulations 2003. It found some elements of the DNSPs’ cost estimates reasonable but considered other aspects required further substantiation.
AER considerations
Electrical Safety (Management) Regulations 2009
The AER notes that the Electricity Safety (Management) Regulations 2009 replaced the Electricity Safety (Management) Regulations 1999, which sunset in December 2009. The difference between the new regulations and the previous version are relatively minor, however, the AER considers that changes to the Electricity Safety Act 1998 mean that the new regulations will be applied differently in practice.
Previously, the Electricity Safety Act, and its associated regulations adopted a prescriptive approach to the regulation of electrical safety. However, under this framework DNSPs were able to develop, on a voluntary basis, an electricity safety management scheme (ESMS). Energy Safe Victoria (ESV) could then, by approving a proposed ESMS, exempt the DNSP from the requirement to comply with certain aspects of the Electricity Safety Act and its associated regulations. The voluntary ESMS could thereby replace an alternative compliance mechanism containing certain prescriptive regulation. The AER notes that under this framework all of the Victorian DNSPs had in place a voluntary ESMS.
The AER also notes that under the Electricity Safety Amendment Act 2007, which took effect on 1 January 2010, all Victorian DNSPs must submit and operate under an approved ESMS, and the DNSPs must submit their proposed ESMSs to ESV by the end of 2010.6 Furthermore, these mandatory ESMSs will need to be of a broader scope than the current voluntary ESMS.
In addition, the AER notes that the Electricity Safety (Network Assets) Regulations 1999 have sunset and were not remade. The Electricity Safety (Network Assets) Regulations prescribed safety standards for a wide range of issues involving network assets. Consequently, the DNSPs’ new mandatory ESMSs will need to address a number of safety issues that were previously addressed by the Electricity Safety (Network Assets) Regulations. Under this new electrical safety regulatory framework there are two main categories of new costs that may be imposed on the DNSPs in addition to those faced in the 2009 base year:
1. process compliance costs
2. substantive compliance costs.
ESMS process compliance costs
The AER notes that while the Victorian DNSPs will need to conduct a major review and revise their existing voluntary ESMSs, this will need to be conducted before the
6 Section 99(3),Electricity Safety Act.
158 VICTORIAN DRAFT DISTRIBUTION DETERMINATION—DRAFT DECISION
end of 2010 and thus will not be a cost borne in the forthcoming regulatory control period.
The AER notes, however, that the DNSPs will face other annual ESMS process compliance costs but not all of the DNSPs forecast an explicit cost to undertake these activities:
CitiPower and Powercor only provided a total cost estimate for compliance with the new ESMS regulatory arrangements, which is discussed below under substantive compliance costs.7
SP AusNet did not propose an opex allowance for any process compliance costs associated with the new ESMS requirements above that included in their opex in the base year.8
Jemena and United Energy both proposed that they would require $1.7 million ($2010) to meet new ESMS process requirements.9
Specifically, Jemena and United Energy stated that the new mandatory ESMS would impose substantial additional process compliance costs.
The AER requested a detailed cost build up of these process compliance costs and both Jemena and United Energy identified further activities that had been included in their cost estimates. The AER notes that some of these costs (scheme description, formal safety assessment and general development of the overall documentation for the ESMS) are attributed to preparing an ESMS, which will be borne in the current regulatory control period.
The AER sought advice from the ESV as to which of these process compliance costs it considered were additional to the costs faced in the current regulatory control period. Following initial discussions with the ESV, the AER requested that the ESV confirm the understanding that the Electrical Safety (Management) Regulations 2009 would not increase the ongoing compliance costs of the Victorian DNSPs and that any additional costs would all be borne in the current regulatory control period. The ESV confirmed that this understanding was correct.10
The AER has considered the step changes proposed by Jemena and United Energy and considers that the tasks they identified are all tasks that these businesses should be currently undertaking. Consequently, the AER considers that Jemena and United Energy have not demonstrated that additional opex to that expended in the base year is required to comply with the process requirements of the Electrical Safety (Management) Regulations 2009.
7 CitiPower, Regulatory proposal, p. 177; Powercor, Regulatory proposal, p. 178. 8 SP AusNet, Regulatory proposal, pp. 217–227. 9 Jemena, Appendix 10: Capital and operational work plan 2010-15 (Confidential),
30 November 2009, p. 35; United Energy, Appendix B-7: Increased operating and maintenance costs, 30 November 2009, p. 5.
10 Letter from Energy Safe Victoria to AER, 15 April 2010.
APPENDIX L—OPERATING EXPENDITURE STEP CHANGES 159
Substantive compliance costs
The AER notes that CitiPower and Powercor proposed that the new ESMS requirements would increase substantive compliance costs by fifty per cent.11 CitiPower and Powercor based this estimate on the regulatory impact statement (RIS) published by ESV when it released the Electricity Safety (Management) Regulations for public consultation. The AER notes that in that RIS, ESV stated:
The implementation of the proposed regulations is expected to increase the substantive costs to a significant degree. This reflects both the fact that two MEC [major electricity companies] will be subject to ESMS requirements for the first time and the fact that ESV expects to require more detailed and wider ranging ESMS to be prepared under the new mandatory arrangements than have been adopted in practice under the current voluntary scheme. While no precise quantification of the likely size of the substantive cost increases is possible, an indicative estimate is that the current level of substantive costs could increase by a factor of up to 100% following the implementation of the mandatory ESMS arrangements.12
The AER considers, however, this quote does not provide evidence as to whether the new ESMS requirements will increase the DNSPs’ substantive compliance costs. The first reason cited in the quote for an increase in substantive compliance costs is that two major electricity companies will be required to prepare an ESMS for the first time. However, neither of these two major electricity companies are a DNSP, with all five of the Victorian DNSPs currently operating under a voluntary ESMS.13
The other reason identified in the RIS for an increase in substantive compliance costs is that the mandatory ESMSs will need to be more detailed and wider ranging than the existing voluntary ESMSs. One reason for this is that under a voluntary ESMS the DNSPs were not required to address safety risks that were covered by the Electricity Safety (Network Assets) Regulations. However, with the sunsetting of the Electricity Safety (Network Assets) Regulations the DNSPs will now need to address in their mandatory ESMSs the risks that were previously covered by the Electricity Safety (Network Assets) Regulations. Thus, while the DNSPs will have to address some risks in their new ESMSs that are not covered in their current ESMSs, and will face some costs in preparing their new ESMSs, their current practices already address these risks and they will not necessarily face any new ongoing costs. This is made clear by the RIS, which stated that it:
…is necessary to emphasise that these constitute the gross costs associated with the proposed regulations. That is, the affected parties already bear a significant proportion of these costs. 14
The AER therefore considers that CitiPower and Powercor have not justified that they require additional opex, above that expended in the 2009 base year, to achieve compliance with their ESMSs.
11 CitiPower, Regulatory proposal, pp. 176–177; Powercor, Regulatory proposal, p. 177–178. 12 Energy Safe Victoria (ESV), Regulatory impact statement: Electricity Safety (Management)
Regulations 2009, August 2009, pp. 2–3. 13 ESV, Regulatory impact statement: Electricity Safety (Management) Regulations 2009,
August 2009, p. 7. 14 ibid, p. 3.
160 VICTORIAN DRAFT DISTRIBUTION DETERMINATION—DRAFT DECISION
With respect to Jemena, the AER notes that Jemena considered that the following step changes were necessary for it to comply with its ESMS, once approved by ESV:
protection setting review
[text removed – confidential]
WireAlert neutral condition monitors
[text removed – confidential]
[text removed – confidential]
[text removed – confidential]
distribution substation cleaning, gardening and security
earth testing in non-CMEN areas
overhead mounted switchgear inspection and maintenance
non-pole distribution substation routine maintenance.15
Similarly, SP AusNet advised the AER that it considered that the following step changes were necessary for it to comply with its ESMS, once approved by ESV:
POEL inspections
vegetation management—hazardous trees
vegetation management—incremental growth
power cable test program
condition monitoring
power transformer refurbishment
substation earthing systems
substation site cleanup work
process & configuration management
substation civil infrastructure works
substation fire system works.16
15 Jemena, response to information requested on 19 February 2010, confidential, submitted on
22 March 2010.
APPENDIX L—OPERATING EXPENDITURE STEP CHANGES 161
Each of these proposed step changes have been addressed within this chapter. However, the AER notes that neither Jemena nor SP AusNet provided any evidence from ESV that these actions would be required for their ESMSs to be assessed as adequate. The AER considers that if an ESMS could be assessed as adequate without requiring a particular action then that action is not a regulatory requirement.
United Energy did not identify any substantive compliance costs that it considered as step changes necessary to comply with its ESMS, once approved by the ESV.17
Electrical Safety (Electric Line Clearance) Regulations 2010
The AER notes that only Jemena proposed opex step changes to meet the expected increase in opex from the anticipated new electric line clearance regulations.18
SP AusNet noted that the existing regulations would be replaced and stated that it ‘reserves the right to include the costs associated with these obligations within its response to the AER’s Draft Decision’.19 United Energy also noted that the existing regulations would sunset and be replaced. However, because of uncertainty over the timing and scope of the new regulations, it considered that it was unable to undertake robust expenditure forecasting and did not include the impact of the new regulations in its opex proposal. It noted that it would address this situation by either proposing a nominated pass through event or, if there was greater certainty, revise its opex forecast to include the additional cost of complying with the regulations.20
Powercor indicated that in forecasting its opex requirement for the forthcoming regulatory control period, it had anticipated that the new electric line clearance regulations and code would be substantively similar to the existing regulations and code.21
The AER notes that on 25 February 2010, after the DNSPs submitted their regulatory proposals, ESV published the proposed Electricity Safety (Electric Line Clearance) Regulations 2010, accompanied by a regulatory impact statement (RIS), for consultation. The RIS identifies four changes in the proposed line clearance regulations that will impact the DNSPs:
updating of management plans
providing written notification to affected persons
clearance space surrounding aerial bundled cables
16 SP AusNet, response to information requested on 22 January 2010, confidential, submitted on
5 February 2010. 17 United Energy, response to information requested on 4 March 2010, confidential, submitted on
23 March 2010. 18 Jemena, Regulatory proposal, p. 42. 19 SP AusNet, Regulatory proposal, p. 227. 20 United Energy, Regulatory proposal, p. 256. 21 Powercor, Regulatory proposal, p. 173.
162 VICTORIAN DRAFT DISTRIBUTION DETERMINATION—DRAFT DECISION
overhanging branches in hazardous bushfire risk areas.22
As part of the cost benefit analysis conducted in the RIS, ESV estimated the cost to DNSPs of complying with both the existing regulations and the proposed regulations. The difference between these two cost estimates represents the opex step change of the proposed regulations. These cost estimates are discussed below.23
The AER notes that after the release of the proposed Electricity Safety (Electric Line Clearance) Regulations 2010, CitiPower, Powercor, Jemena and SP AusNet all provided the AER with estimates of the cost impact of the proposed regulations.
The AER notes that the proposed Electricity Safety (Electric Line Clearance) Regulations 2010 are currently open for public consultation, and that it would not be prudent to pre-empt the outcome of that consultation process. However, the AER expects that these regulations will be settled prior to 30 June 2010 and considers that these regulations, when they commence, will likely increase the DNSPs’ opex requirements. Accordingly, the AER anticipates that the DNSPs will include in their revised regulatory proposals an opex step change for increased vegetation management activities under the new regulations.
Providing written notification to affected persons
The AER notes that under the proposed Code of practice for electric line clearance, DNSPs will be required to notify all affected persons of any intentions to cut or remove a tree that is on private property or is of cultural or environmental significance, where the tree is to be cut or removed for line clearance purposes. The code states that the notice may be given in writing or by publication in a newspaper. Further, if the tree is on private property the DNSP must consult with the occupier of the land, if the tree is to be cut, or the owner of the land, if the tree is to be removed.24
The AER considers that the current code of practice has similar requirements to notify, and consult with, affected persons before DNSPs cut or remove trees.25 However, one significant difference between the notification requirements in the existing and proposed code of practice is the means by which notification is given. Under the existing code of practice DNSPs must notify the occupier, or owner, of the land in writing. If, after taking reasonable steps to provide notification in writing, the DNSP has been unable to directly notify the occupier it may then provide notification in a newspaper.26 The proposed code of practice, however, does not require the DNSP to attempt to provide notice in writing before providing notification in a newspaper.27
The cost of providing notification under both the proposed and existing codes of practice is estimated in the RIS, and outlined in table L.3 below. The RIS clearly identifies that the Victorian DNSPs notification costs will be reduced under the proposed Code of practice for electric line clearance.
22 ESV, Proposed Electricity Safety (Electric Line Clearance) Regulations 2010: Regulatory Impact
Statement, 15 February 2010, p. 62. 23 ibid. 24 Clause 5 of the proposed Code of practice for electric line clearance. 25 Clauses 3 and 4 of the existing Code of practice for electric line clearance. 26 Clauses 3(b) and 3(c) of the existing Code of practice for electric line clearance. 27 Clause 5(4)(b) of the proposed Code of practice for electric line clearance.
APPENDIX L—OPERATING EXPENDITURE STEP CHANGES 163
Table L.3 Estimated annual cost of notifications under the existing and proposed Code of practice for electric line clearance ($’000, 2010)
DNSP Existing code Proposed code Step change
CitiPower 450 4 –446
Powercor 4 500 9 –4 491
Jemena 349 9 –340
SP AusNet 450 9 –441
United Energy 658 9 –648
Source: ESV, Proposed Electricity Safety (Electric Line Clearance) Regulations 2010: Regulatory impact statement, February 2010, pp. 136–141.
The AER notes that in estimating the DNSPs’ existing notification costs the ESV sought advice from the Victorian DNSPs. ESV received notification cost estimates from both Powercor and SP AusNet, which are shown in table L.3 above. The ESV noted that the two cost estimates received were significantly different. For the purposes of the RIS ESV took a conservative approach and estimated the costs for CitiPower, Jemena and United Energy based on SP AusNet’s cost estimate.28
CitiPower, Powercor, Jemena and SP AusNet all stated that the proposed notification and consultation requirements would increase, not decrease their costs.29
Jemena stated that the consultation requirements in the proposed Code of practice for electric line clearance significantly increased their notification and consultation requirements compared to the existing code of practice. The DNSPs stated that it would increase their costs in two ways:
1. increased direct costs of consultation
2. reduced efficiencies through having to revisit sites when consultation is not concluded before cutting commences.30
The AER sought advice from ESV as to whether it considered that the proposed Code of practice for electric line clearance would increase the DNSPs’ notification and consultation costs. ESV confirmed the views outlined in the RIS. It confirmed that the proposed code of practice would not require DNSPs to attempt to notify land owners or occupiers in writing before publishing a notice in a newspaper. Further, it confirmed that the proposed code of practice would not impose significant new
28 ESV, Proposed Electricity Safety (Electric Line Clearance) Regulations 2010: Regulatory impact
statement, February 2010, p. 136. 29 CitiPower/Powercor, letter, 4 March 2010; Jemena, response to information requested on
22 January 2010, confidential, submitted on 4 March 2010; SP AusNet, response to information requested on 29 January 2010, confidential, submitted on 22 March 2010.
30 Jemena, response to information requested on 22 January 2010, confidential, submitted on 4 March 2010.
164 VICTORIAN DRAFT DISTRIBUTION DETERMINATION—DRAFT DECISION
consultation requirements for cutting or pruning trees on private property compared to the existing code.31
Nuttall Consulting reviewed the impact of the notification and consultation requirements of the proposed Code of practice for electric line clearance. Nuttall Consulting considered that the notice and consultation requirements of the proposed code were not clear but that in ‘the absence of any further clarification, it would appear reasonable to rely on the interpretation of the ESV as provided in the RIS’.32
The AER considers that the proposed Electricity Safety (Electric Line Clearance) Regulations 2010 will provide the DNSPs greater flexibility in how they notify land owners and occupiers of tree cutting and removal and should consequently reduce their vegetation management costs. Further, the AER considers that the consultation requirements of proposed regulations are very similar to those in the existing regulations and that the DNSPs vegetation management consultation costs should not, therefore, be increased by the proposed regulations.
31 Letter from Energy Safe Victoria to AER, Electricity Safety Act and associated Regulations,
15 April 2010. 32 Nuttall Consulting, Victorian Electricity Distribution Revenue Review, March 2010, p. 327.
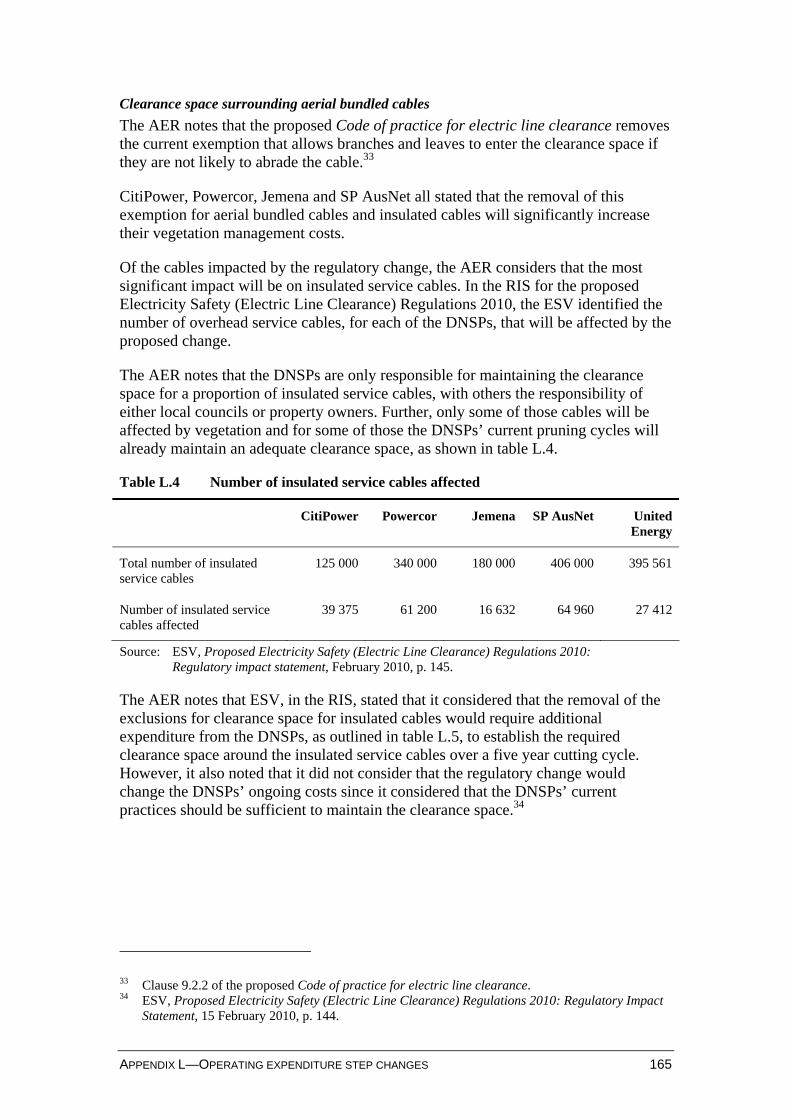
APPENDIX L—OPERATING EXPENDITURE STEP CHANGES 165
Clearance space surrounding aerial bundled cables
The AER notes that the proposed Code of practice for electric line clearance removes the current exemption that allows branches and leaves to enter the clearance space if they are not likely to abrade the cable.33
CitiPower, Powercor, Jemena and SP AusNet all stated that the removal of this exemption for aerial bundled cables and insulated cables will significantly increase their vegetation management costs.
Of the cables impacted by the regulatory change, the AER considers that the most significant impact will be on insulated service cables. In the RIS for the proposed Electricity Safety (Electric Line Clearance) Regulations 2010, the ESV identified the number of overhead service cables, for each of the DNSPs, that will be affected by the proposed change.
The AER notes that the DNSPs are only responsible for maintaining the clearance space for a proportion of insulated service cables, with others the responsibility of either local councils or property owners. Further, only some of those cables will be affected by vegetation and for some of those the DNSPs’ current pruning cycles will already maintain an adequate clearance space, as shown in table L.4.
Table L.4 Number of insulated service cables affected
CitiPower Powercor Jemena SP AusNet United Energy
Total number of insulated service cables
125 000 340 000 180 000 406 000 395 561
Number of insulated service cables affected
39 375 61 200 16 632 64 960 27 412
Source: ESV, Proposed Electricity Safety (Electric Line Clearance) Regulations 2010: Regulatory impact statement, February 2010, p. 145.
The AER notes that ESV, in the RIS, stated that it considered that the removal of the exclusions for clearance space for insulated cables would require additional expenditure from the DNSPs, as outlined in table L.5, to establish the required clearance space around the insulated service cables over a five year cutting cycle. However, it also noted that it did not consider that the regulatory change would change the DNSPs’ ongoing costs since it considered that the DNSPs’ current practices should be sufficient to maintain the clearance space.34
33 Clause 9.2.2 of the proposed Code of practice for electric line clearance. 34 ESV, Proposed Electricity Safety (Electric Line Clearance) Regulations 2010: Regulatory Impact
Statement, 15 February 2010, p. 144.
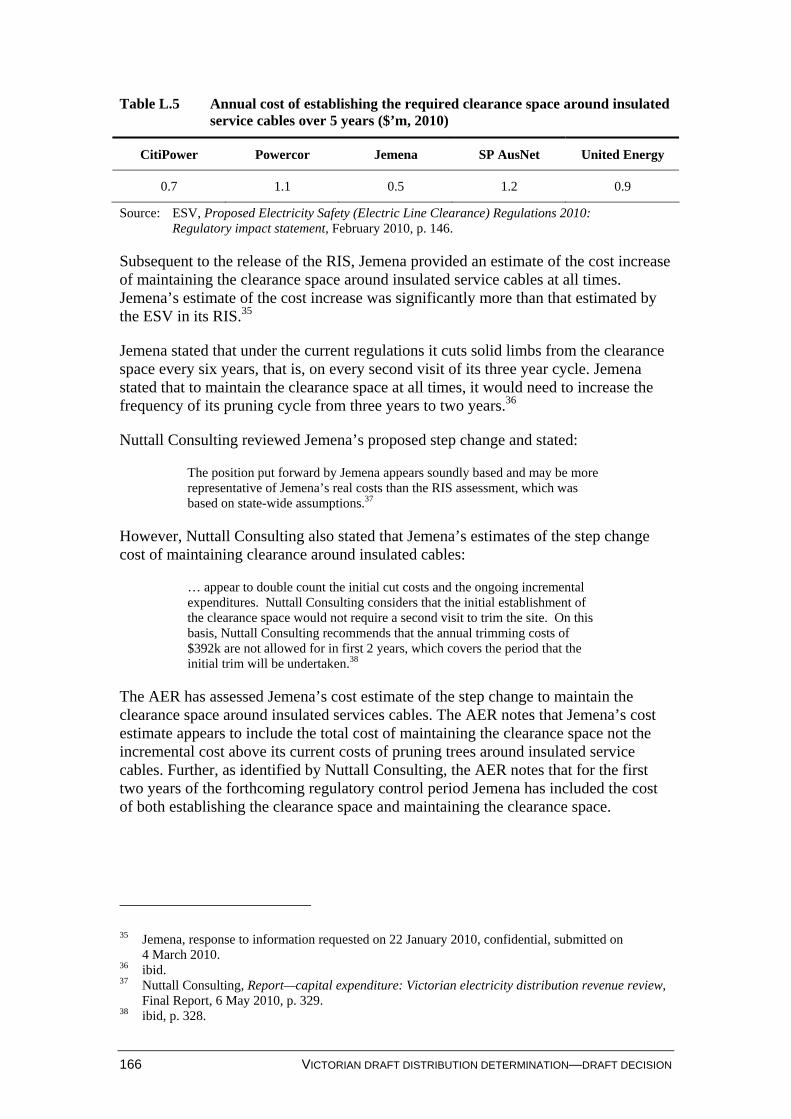
166 VICTORIAN DRAFT DISTRIBUTION DETERMINATION—DRAFT DECISION
Table L.5 Annual cost of establishing the required clearance space around insulated service cables over 5 years ($’m, 2010)
CitiPower Powercor Jemena SP AusNet United Energy
0.7 1.1 0.5 1.2 0.9
Source: ESV, Proposed Electricity Safety (Electric Line Clearance) Regulations 2010: Regulatory impact statement, February 2010, p. 146.
Subsequent to the release of the RIS, Jemena provided an estimate of the cost increase of maintaining the clearance space around insulated service cables at all times. Jemena’s estimate of the cost increase was significantly more than that estimated by the ESV in its RIS.35
Jemena stated that under the current regulations it cuts solid limbs from the clearance space every six years, that is, on every second visit of its three year cycle. Jemena stated that to maintain the clearance space at all times, it would need to increase the frequency of its pruning cycle from three years to two years.36
Nuttall Consulting reviewed Jemena’s proposed step change and stated:
The position put forward by Jemena appears soundly based and may be more representative of Jemena’s real costs than the RIS assessment, which was based on state-wide assumptions.37
However, Nuttall Consulting also stated that Jemena’s estimates of the step change cost of maintaining clearance around insulated cables:
… appear to double count the initial cut costs and the ongoing incremental expenditures. Nuttall Consulting considers that the initial establishment of the clearance space would not require a second visit to trim the site. On this basis, Nuttall Consulting recommends that the annual trimming costs of $392k are not allowed for in first 2 years, which covers the period that the initial trim will be undertaken.38
The AER has assessed Jemena’s cost estimate of the step change to maintain the clearance space around insulated services cables. The AER notes that Jemena’s cost estimate appears to include the total cost of maintaining the clearance space not the incremental cost above its current costs of pruning trees around insulated service cables. Further, as identified by Nuttall Consulting, the AER notes that for the first two years of the forthcoming regulatory control period Jemena has included the cost of both establishing the clearance space and maintaining the clearance space.
35 Jemena, response to information requested on 22 January 2010, confidential, submitted on
4 March 2010. 36 ibid. 37 Nuttall Consulting, Report—capital expenditure: Victorian electricity distribution revenue review,
Final Report, 6 May 2010, p. 329. 38 ibid, p. 328.
APPENDIX L—OPERATING EXPENDITURE STEP CHANGES 167
SP AusNet advised the AER that under the proposed Code of practice for electric line clearance it would need to maintain the clearance around 81 200 service cables.39 This is the same number of service cables identified by the ESV in the RIS as being the responsibility of SP AusNet and that were surrounded by vegetation. However, ESV estimated that for some of these service cables SP AusNet’s current clearance cycle would maintain the clearance space required by the proposed code of practice. ESV estimate that only 64 960 service cables would be affected by the proposed code of practice.40
In estimating the cost of maintaining clearance around insulated cables, SP AusNet assumed that it would establish this clearance space over a five year cycle, which would require transitional regulatory provisions. SP AusNet also assumed that it would need to undertake an annual cycle to maintain the clearance space and that 60 per cent of service cables would require a mid cycle cut.41
The AER notes that SP AusNet has proposed that it will establish the clearance space around all insulated service cables over a five year cycle. Despite this, SP AusNet has assumed it will need to maintain the clearance space around all cables from 2011. Further, SP AusNet has assumed that service cables will need vegetation cut in all years to maintain the clearance space, even the year in which the vegetation is cut to establish the clearance space.
The AER also notes that SP AusNet has assumed it will need annual cutting to maintain the clearance space, with 60 per cent of services requiring a further mid cycle cut while Jemena has assumed a two year cutting cycle.
The AER considers that prudent operators in the circumstances of the Victorian DNSPs will require additional opex, above that expended in the base year, to comply with the new requirements in the proposed Electricity Safety (Electric Line Clearance) Regulations 2010 relating to insulated cables. However, the AER considers that the DNSPs have not provided sufficient evidence to determine the quantum of opex required. Further, the AER notes that the revised regulations have not yet been finalised. For this draft decision, the AER considers that the estimated cost of maintaining the clearance space surrounding aerial bundled cables estimated by the ESV, and outlined in table L.5 above, is the amount that prudent operators in the circumstances of the Victorian DNSPs would require to comply with the requirements in the proposed Electricity Safety (Electric Line Clearance) Regulations 2010 relating to aerial bundled cables.
Overhanging branches in hazardous bushfire risk areas
The AER notes that under the proposed Electricity Safety (Electric Line Clearance) Regulations 2010, vegetation will not be allowed to overhang 66kV powerlines in areas designated as low bushfire risk areas (LBRA) or bare overhead powerlines in
39 SP AusNet, response to information requested on 29 January 2010, confidential, submitted on
22 March 2010. 40 ESV, Proposed Electricity Safety (Electric Line Clearance) Regulations 2010: Regulatory Impact
Statement, 15 February 2010, p. 145. 41 SP AusNet, response to information requested on 29 January 2010, confidential, submitted on
22 March 2010.
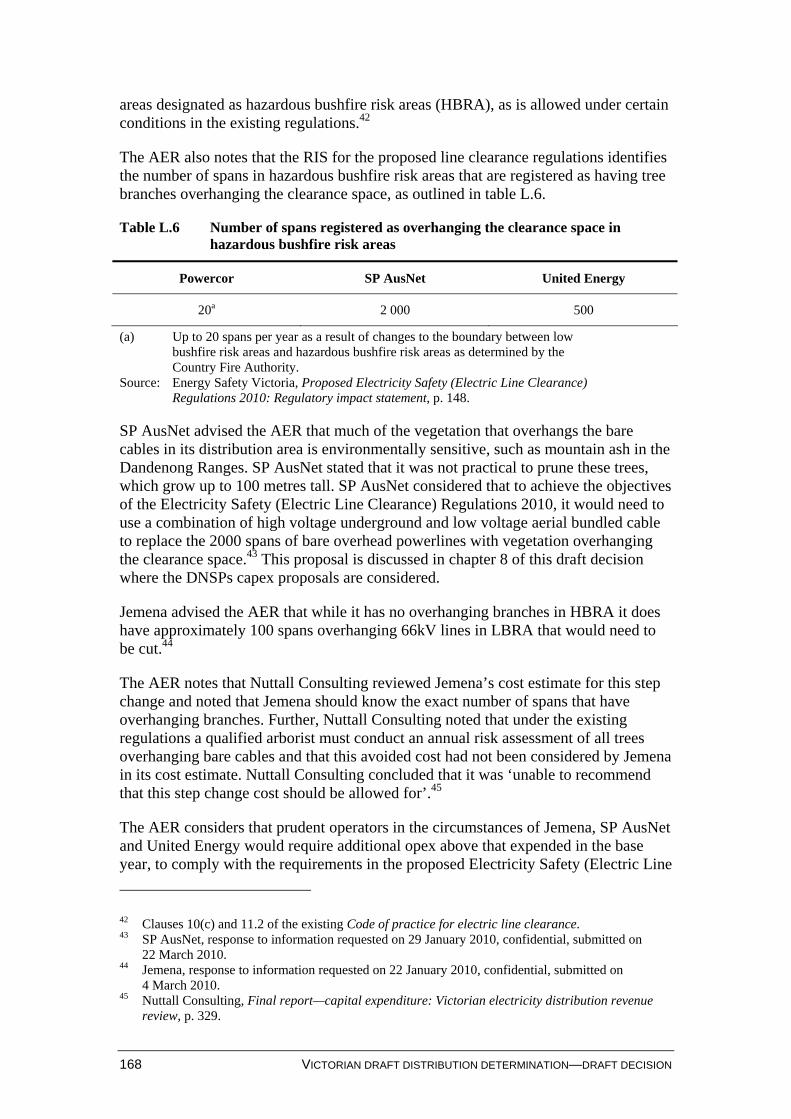
168 VICTORIAN DRAFT DISTRIBUTION DETERMINATION—DRAFT DECISION
areas designated as hazardous bushfire risk areas (HBRA), as is allowed under certain conditions in the existing regulations.42
The AER also notes that the RIS for the proposed line clearance regulations identifies the number of spans in hazardous bushfire risk areas that are registered as having tree branches overhanging the clearance space, as outlined in table L.6.
Table L.6 Number of spans registered as overhanging the clearance space in hazardous bushfire risk areas
Powercor SP AusNet United Energy
20a 2 000 500
(a) Up to 20 spans per year as a result of changes to the boundary between low bushfire risk areas and hazardous bushfire risk areas as determined by the Country Fire Authority.
Source: Energy Safety Victoria, Proposed Electricity Safety (Electric Line Clearance) Regulations 2010: Regulatory impact statement, p. 148.
SP AusNet advised the AER that much of the vegetation that overhangs the bare cables in its distribution area is environmentally sensitive, such as mountain ash in the Dandenong Ranges. SP AusNet stated that it was not practical to prune these trees, which grow up to 100 metres tall. SP AusNet considered that to achieve the objectives of the Electricity Safety (Electric Line Clearance) Regulations 2010, it would need to use a combination of high voltage underground and low voltage aerial bundled cable to replace the 2000 spans of bare overhead powerlines with vegetation overhanging the clearance space.43 This proposal is discussed in chapter 8 of this draft decision where the DNSPs capex proposals are considered.
Jemena advised the AER that while it has no overhanging branches in HBRA it does have approximately 100 spans overhanging 66kV lines in LBRA that would need to be cut.44
The AER notes that Nuttall Consulting reviewed Jemena’s cost estimate for this step change and noted that Jemena should know the exact number of spans that have overhanging branches. Further, Nuttall Consulting noted that under the existing regulations a qualified arborist must conduct an annual risk assessment of all trees overhanging bare cables and that this avoided cost had not been considered by Jemena in its cost estimate. Nuttall Consulting concluded that it was ‘unable to recommend that this step change cost should be allowed for’.45
The AER considers that prudent operators in the circumstances of Jemena, SP AusNet and United Energy would require additional opex above that expended in the base year, to comply with the requirements in the proposed Electricity Safety (Electric Line
42 Clauses 10(c) and 11.2 of the existing Code of practice for electric line clearance. 43 SP AusNet, response to information requested on 29 January 2010, confidential, submitted on
22 March 2010. 44 Jemena, response to information requested on 22 January 2010, confidential, submitted on
4 March 2010. 45 Nuttall Consulting, Final report—capital expenditure: Victorian electricity distribution revenue
review, p. 329.
APPENDIX L—OPERATING EXPENDITURE STEP CHANGES 169
Clearance) Regulations 2010 relating to trees overhanging bare cables. However, the AER considers that these DNSPs have not provided sufficient evidence to determine the quantum of opex required. Further, the AER notes that the revised regulations have not yet been finalised.
Cessation of exclusions
The AER notes that under the existing Electricity Safety (Electric Line Clearance) Regulations 2005, the Victorian DNSPs are required to maintain the mandated clearance spaces at all times. However, the Victorian DNSPs currently have an exemption from ESV that allows vegetation to enter the clearance space at certain times. While the exemption varies for each of the DNSPs, broadly:
in hazardous bushfire risk areas the DNSPs are required to achieve and maintain compliance during the fire danger season
in low bushfire risk areas the DNSPs are required to operate under a plan, approved by ESV, that is designed to achieve and maintain the minimum clearance space requirements in the Code under normal growth conditions.
The AER notes that the ESV has advised each of the DNSPs that these exemptions will cease with the sunsetting of the existing regulations and that it does not intend to provide the DNSPs any exemptions under the proposed Electricity Safety (Electric Line Clearance) Regulations 2010. The AER further notes that the DNSPs have stated that the cessation of these exemptions will significantly raise their vegetation management costs.
Powercor, in its regulatory proposal, stated that the cessation of its exemption for LBRA would increase its vegetation management costs by $8.3 million ($2010) over the forthcoming regulatory control period. It stated that it had commenced a new vegetation management program in 2009 that it considered would achieve full compliance by 2012.46
Subsequently, Powercor advised the AER that it has spent more in 2009 than it had estimated in its regulatory proposal and that consequently it would need $6 million ($2010) less than it proposed in its regulatory proposal. It also stated that it would need a further $32 million ($2010) for the cessation of its exclusion for hazardous bushfire risk areas, which it had not included in its regulatory proposal.47
Both Jemena and SP AusNet stated that to maintain clearance spaces at all times they would need to increase the frequency of their pruning cycles.48 SP AusNet stated that it was not possible to increase the severity of its pruning as this would ‘impact the
46 Powercor, Regulatory proposal, p. 174. 47 CitiPower/Powercor, letter, 4 March 2010. 48 Jemena, response to information requested on 22 January 2010, confidential, submitted on
4 March 2010; SP AusNet, response to information requested on 29 January 2010, confidential, submitted on 22 March 2010.
170 VICTORIAN DRAFT DISTRIBUTION DETERMINATION—DRAFT DECISION
structural integrity, health and aesthetic value of vegetation adjacent to overhead powerlines and result in significant negative community reaction’.49
The AER sought advice from ESV as to whether its understanding that the expiration of the exemptions will not require the DNSPs to increase the frequency of their pruning cycles, or undertake mid cycle inspections and pruning was correct. ESV confirmed that this understanding was correct.50
Nuttall Consulting reviewed Jemena’s estimate of the cost impact of removing the exemptions from maintaining clearance spaces at all times. Nuttall Consulting concluded that it was ‘not clear the monetary saving, if any, the current exemption grants to Jemena’.51
For the reasons discussed above, and as a result of the AER’s consideration of the DNSPs’ regulatory proposals and other supporting information, the AER is not satisfied that the DNSPs’ proposed expenditure for the cessation of line clearance exemptions reasonably reflects the opex criteria, including the opex objectives. In coming to this view the AER has had regard to the opex factors.
The AER notes that Powercor commenced a new vegetation management program in 2009 that it considers will maintain clearance spaces at all times within low bushfire risk areas. Consequently it will receive part of the cost of this proposed step change in its base opex. However, the AER also notes that the increase in expenditure has also contributed to a negative carryover for Powercor under the efficiency carryover mechanism.
AER conclusion
For the reasons discussed above and as a result of the AER’s consideration of the DNSPs’ regulatory proposals and other supporting information, the AER is not satisfied that the proposed step changes submitted by the DNSPs to meet new regulatory requirements under the Electricity Safety (Electric Line Clearance) Regulations 2010 reasonably reflect the opex criteria, including the opex objectives.
The AER notes that the DNSPs should have significantly more certainty over the form of the Electricity Safety (Electric Line Clearance) Regulations 2010 when they submit their revised regulatory proposals. The AER anticipates that the DNSPs will include in their revised regulatory proposals step changes for the impact of these regulations, having regard also to the AER’s draft decision on these step changes.
For the purpose of this draft decision the AER considers that the step changes in table L.7, which are the costs of the proposed Electricity Safety (Electric Line Clearance) Regulations 2010 as outlined by ESV in the RIS for those regulations, result in expenditure that reasonably reflects the opex criteria, including the opex objectives,
49 SP AusNet, response to information requested on 29 January 2010, confidential, submitted on
22 March 2010. 50 Letter from Energy Safe Victoria to AER, Electricity Safety Act and associated Regulations,
15 April 2010 51 Nuttall Consulting, Final report—capital expenditure: Victorian electricity distribution revenue
review, p. 330.
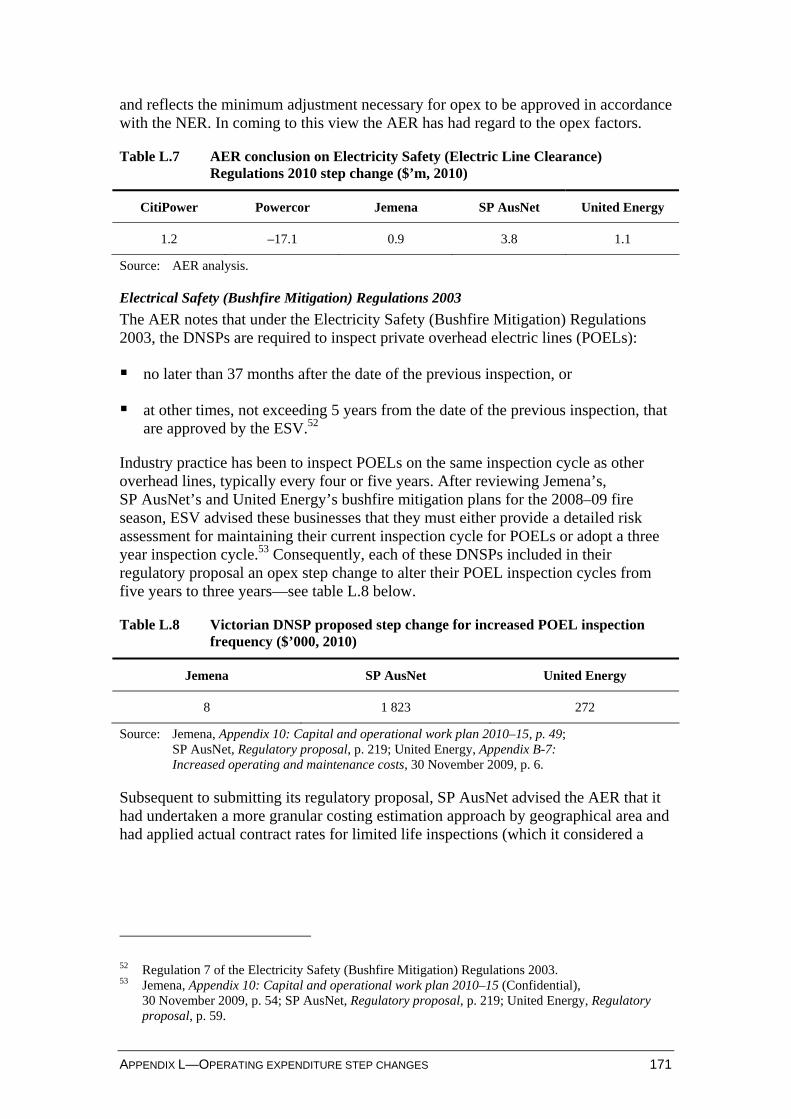
APPENDIX L—OPERATING EXPENDITURE STEP CHANGES 171
and reflects the minimum adjustment necessary for opex to be approved in accordance with the NER. In coming to this view the AER has had regard to the opex factors.
Table L.7 AER conclusion on Electricity Safety (Electric Line Clearance) Regulations 2010 step change ($’m, 2010)
CitiPower Powercor Jemena SP AusNet United Energy
1.2 –17.1 0.9 3.8 1.1
Source: AER analysis.
Electrical Safety (Bushfire Mitigation) Regulations 2003
The AER notes that under the Electricity Safety (Bushfire Mitigation) Regulations 2003, the DNSPs are required to inspect private overhead electric lines (POELs):
no later than 37 months after the date of the previous inspection, or
at other times, not exceeding 5 years from the date of the previous inspection, that are approved by the ESV.52
Industry practice has been to inspect POELs on the same inspection cycle as other overhead lines, typically every four or five years. After reviewing Jemena’s, SP AusNet’s and United Energy’s bushfire mitigation plans for the 2008–09 fire season, ESV advised these businesses that they must either provide a detailed risk assessment for maintaining their current inspection cycle for POELs or adopt a three year inspection cycle.53 Consequently, each of these DNSPs included in their regulatory proposal an opex step change to alter their POEL inspection cycles from five years to three years—see table L.8 below.
Table L.8 Victorian DNSP proposed step change for increased POEL inspection frequency ($’000, 2010)
Jemena SP AusNet United Energy
8 1 823 272
Source: Jemena, Appendix 10: Capital and operational work plan 2010–15, p. 49; SP AusNet, Regulatory proposal, p. 219; United Energy, Appendix B-7: Increased operating and maintenance costs, 30 November 2009, p. 6.
Subsequent to submitting its regulatory proposal, SP AusNet advised the AER that it had undertaken a more granular costing estimation approach by geographical area and had applied actual contract rates for limited life inspections (which it considered a
52 Regulation 7 of the Electricity Safety (Bushfire Mitigation) Regulations 2003. 53 Jemena, Appendix 10: Capital and operational work plan 2010–15 (Confidential),
30 November 2009, p. 54; SP AusNet, Regulatory proposal, p. 219; United Energy, Regulatory proposal, p. 59.
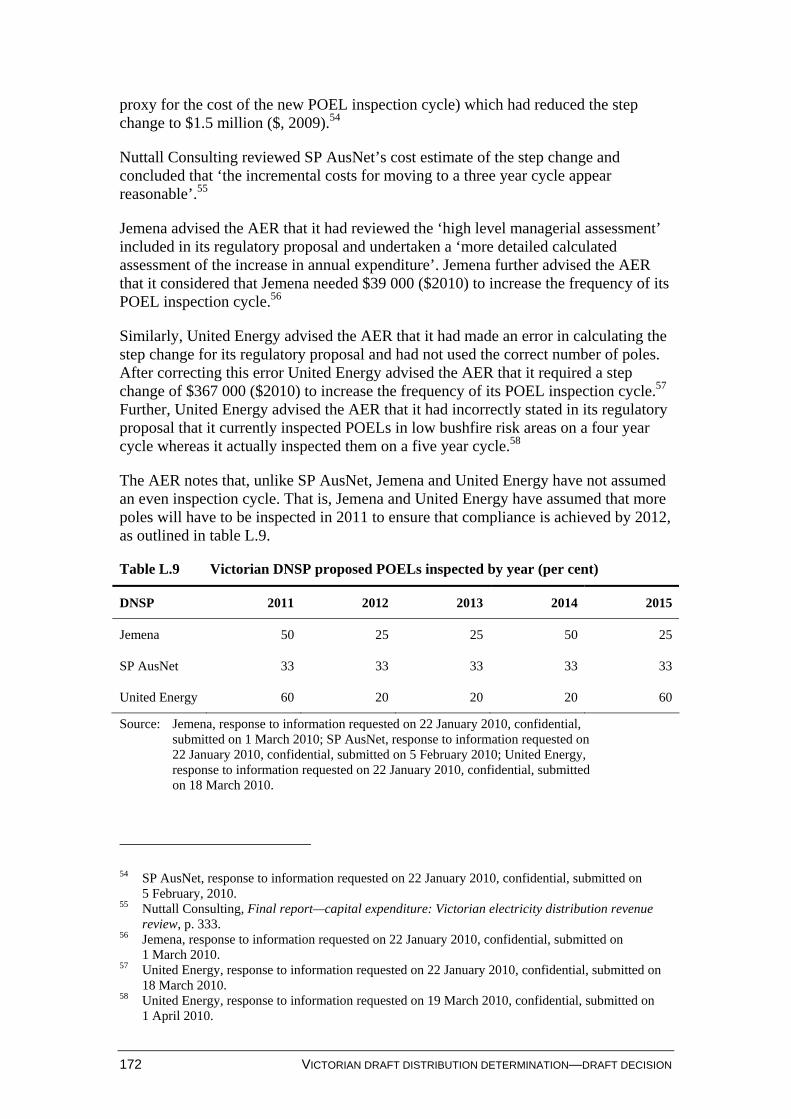
172 VICTORIAN DRAFT DISTRIBUTION DETERMINATION—DRAFT DECISION
proxy for the cost of the new POEL inspection cycle) which had reduced the step change to $1.5 million ($, 2009).54
Nuttall Consulting reviewed SP AusNet’s cost estimate of the step change and concluded that ‘the incremental costs for moving to a three year cycle appear reasonable’.55
Jemena advised the AER that it had reviewed the ‘high level managerial assessment’ included in its regulatory proposal and undertaken a ‘more detailed calculated assessment of the increase in annual expenditure’. Jemena further advised the AER that it considered that Jemena needed $39 000 ($2010) to increase the frequency of its POEL inspection cycle.56
Similarly, United Energy advised the AER that it had made an error in calculating the step change for its regulatory proposal and had not used the correct number of poles. After correcting this error United Energy advised the AER that it required a step change of $367 000 ($2010) to increase the frequency of its POEL inspection cycle.57 Further, United Energy advised the AER that it had incorrectly stated in its regulatory proposal that it currently inspected POELs in low bushfire risk areas on a four year cycle whereas it actually inspected them on a five year cycle.58
The AER notes that, unlike SP AusNet, Jemena and United Energy have not assumed an even inspection cycle. That is, Jemena and United Energy have assumed that more poles will have to be inspected in 2011 to ensure that compliance is achieved by 2012, as outlined in table L.9.
Table L.9 Victorian DNSP proposed POELs inspected by year (per cent)
DNSP 2011 2012 2013 2014 2015
Jemena 50 25 25 50 25
SP AusNet 33 33 33 33 33
United Energy 60 20 20 20 60
Source: Jemena, response to information requested on 22 January 2010, confidential, submitted on 1 March 2010; SP AusNet, response to information requested on 22 January 2010, confidential, submitted on 5 February 2010; United Energy, response to information requested on 22 January 2010, confidential, submitted on 18 March 2010.
54 SP AusNet, response to information requested on 22 January 2010, confidential, submitted on
5 February, 2010. 55 Nuttall Consulting, Final report—capital expenditure: Victorian electricity distribution revenue
review, p. 333. 56 Jemena, response to information requested on 22 January 2010, confidential, submitted on
1 March 2010. 57 United Energy, response to information requested on 22 January 2010, confidential, submitted on
18 March 2010. 58 United Energy, response to information requested on 19 March 2010, confidential, submitted on
1 April 2010.
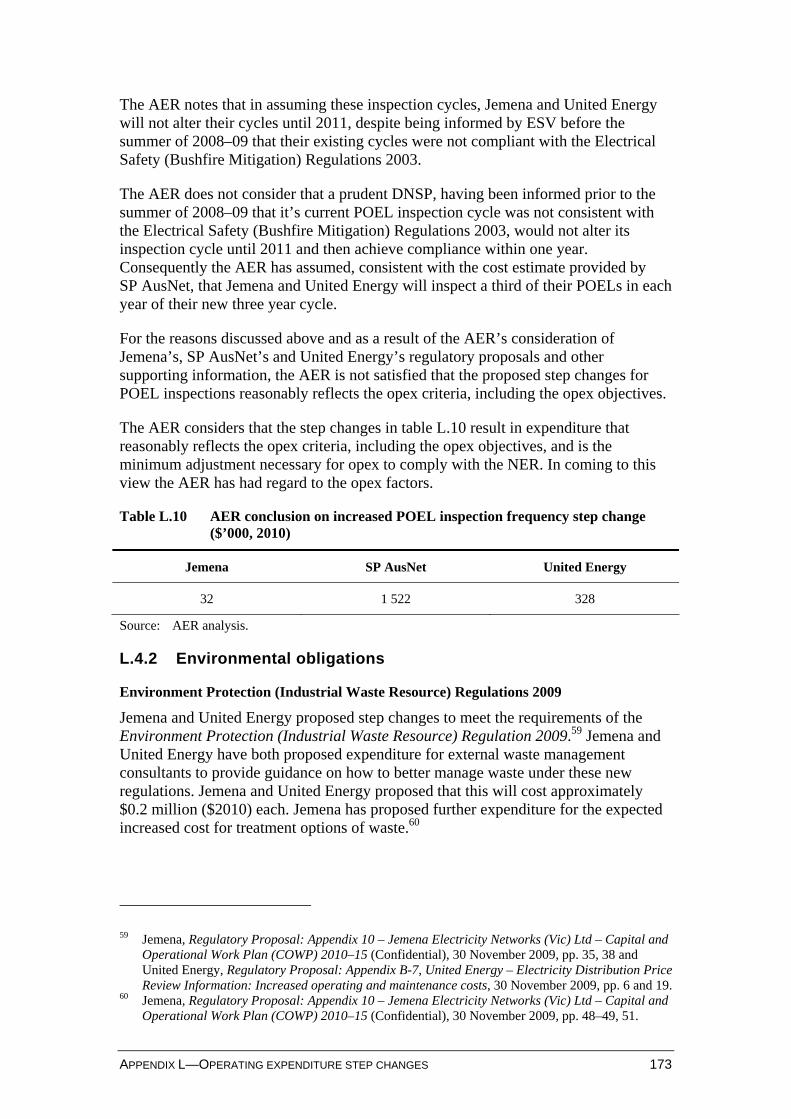
APPENDIX L—OPERATING EXPENDITURE STEP CHANGES 173
The AER notes that in assuming these inspection cycles, Jemena and United Energy will not alter their cycles until 2011, despite being informed by ESV before the summer of 2008–09 that their existing cycles were not compliant with the Electrical Safety (Bushfire Mitigation) Regulations 2003.
The AER does not consider that a prudent DNSP, having been informed prior to the summer of 2008–09 that it’s current POEL inspection cycle was not consistent with the Electrical Safety (Bushfire Mitigation) Regulations 2003, would not alter its inspection cycle until 2011 and then achieve compliance within one year. Consequently the AER has assumed, consistent with the cost estimate provided by SP AusNet, that Jemena and United Energy will inspect a third of their POELs in each year of their new three year cycle.
For the reasons discussed above and as a result of the AER’s consideration of Jemena’s, SP AusNet’s and United Energy’s regulatory proposals and other supporting information, the AER is not satisfied that the proposed step changes for POEL inspections reasonably reflects the opex criteria, including the opex objectives.
The AER considers that the step changes in table L.10 result in expenditure that reasonably reflects the opex criteria, including the opex objectives, and is the minimum adjustment necessary for opex to comply with the NER. In coming to this view the AER has had regard to the opex factors.
Table L.10 AER conclusion on increased POEL inspection frequency step change ($’000, 2010)
Jemena SP AusNet United Energy
32 1 522 328
Source: AER analysis.
L.4.2 Environmental obligations
Environment Protection (Industrial Waste Resource) Regulations 2009
Jemena and United Energy proposed step changes to meet the requirements of the Environment Protection (Industrial Waste Resource) Regulation 2009.59 Jemena and United Energy have both proposed expenditure for external waste management consultants to provide guidance on how to better manage waste under these new regulations. Jemena and United Energy proposed that this will cost approximately $0.2 million ($2010) each. Jemena has proposed further expenditure for the expected increased cost for treatment options of waste.60
59 Jemena, Regulatory Proposal: Appendix 10 – Jemena Electricity Networks (Vic) Ltd – Capital and
Operational Work Plan (COWP) 2010–15 (Confidential), 30 November 2009, pp. 35, 38 and United Energy, Regulatory Proposal: Appendix B-7, United Energy – Electricity Distribution Price Review Information: Increased operating and maintenance costs, 30 November 2009, pp. 6 and 19.
60 Jemena, Regulatory Proposal: Appendix 10 – Jemena Electricity Networks (Vic) Ltd – Capital and Operational Work Plan (COWP) 2010–15 (Confidential), 30 November 2009, pp. 48–49, 51.
174 VICTORIAN DRAFT DISTRIBUTION DETERMINATION—DRAFT DECISION
AER considerations
With respect to Jemena’s and United Energy’s claims for an external consultant to undertake an assessment on alternative approaches to treating prescribed industrial waste (PIW), the AER notes that there is no specific change in the operating environment regarding waste assessments under the Environment Protection (Industrial Waste Resource) Regulation 2009.
Following discussions with the EPA and its own analysis, the AER considers that the Environment Protection (Industrial Waste Resource) Regulation 2009 provides a regulatory framework with greater flexibility and incentives for PIW producers to assess and pursue alternatives to taking waste to landfill. Specifically, the AER considers that there is no material change in the way waste is assessed under the previous regulations61 compared to the new regulations.
The AER also notes that should Jemena decide to investigate better ways to treat waste, the Environment Protection Authority Victoria (EPA) provides services that can help:
assist industry reduce its impact on the environment
reduce costs
enhance reputations.62
Specifically, the AER notes that the EPA’s Sustainable Solutions Unit:
…delivers advice and standard services to industry by helping them improve resource efficiency and generate less waste. 63
The AER further notes that one source of assistance provided by the EPA is the HazWaste Fund which provides financial assistance to businesses to speed up the process of reducing the volume and hazard of hazardous waste in Victoria.64
The AER also considers that historic increases in landfill costs, combined with increased scope for waste producers to reuse and recycle, provides cost efficient alternatives to taking waste to landfill. This is also supported by the EPA who have noted:
Where industry can recover, reprocess or reuse the materials, they can save money on the purchase of raw materials.65
Finally, the AER also considers that any business process improvements which result in lower costs will be self financing as the net costs should be expected to be less than those reflected in the revenue requirement. 61 Environment Protection (Prescribed Waste) Regulations 1998, Industrial Waste Management
Policy (Prescribed Industrial Waste) 2000. 62 Environmental Protection Agency Victoria, Waste avoidance and reduction, June 2009, p. 1. 63 ibid. 64 ibid. 65 Environmental Protection Agency Victoria, Industrial Waste Resource Guidelines: Introduction to
the environment (industrial waste resource) regulations 2009, June 2009, p. 1.
APPENDIX L—OPERATING EXPENDITURE STEP CHANGES 175
With respect to Jemena’s proposal for a step change associated with an increase in the cost for treatment of Category B PIW, the AER notes that Jemena referred to the Environment Protection (Industrial Waste Resource) Regulation 2009 and the Victorian Government’s 2010 Annual Statement of Government Intentions (2010 annual statement) as the drivers for increases in unit rates for waste to landfill.66
In regard to the Environment Protection (Industrial Waste Resource) Regulation 2009, the AER notes that consistent with the discussion above, the introduction of this regulation did not force a material change in a waste producer’s treatment of waste to landfill. Its implementation reduced the administrative burden on waste producers as well as broadened the scope for the way waste is classified and allows greater flexibility to treat waste. The AER considers that there are no direct aspects of this regulation that would drive large increases in a ‘business as usual’ treatment of waste, particularly in relation to the unit rates of waste to landfill for a DNSP.
In regard to the Victorian Government’s 2010 annual statement, the AER notes that the Victorian Government announced in March 2010 that increased levies for waste to landfill do not apply to the landfill levy for PIW. This is due to PIW levies being increased in 2008 in line with the Victorian Government’s commitment to zero hazard waste to landfill by 2020.
AER conclusion
For the reasons discussed above and as a result of the AER’s consideration of Jemena’s and United Energy’s regulatory proposals and other supporting information, the AER is not satisfied that the proposed expenditure reasonably reflects the opex criteria, including the opex objectives. In coming to this view the AER has had regard to the opex factors.
National greenhouse and energy reporting
The National Greenhouse and Energy Reporting Act 2007 (NGERS) introduced a national framework for the reporting and dissemination of information about greenhouse gas emissions, greenhouse gas projects, and energy use and production by corporations. The first annual reporting period began on 1 July 2008.67
Jemena proposed additional expenditure for increased external auditing costs associated with NGERS. According to Jemena, the initial audit undertaken, and included in Jemena’s base year, was at a necessarily high level as the NGERS auditing compliance framework was still under development in 2009. Jemena considered a more detailed external NGERS audit was both prudent and necessary to ensure adequate governance of NGERS obligations and liabilities.68
United Energy stated that given it had not built its opex forecast from base costs, full compensation was required for the costs associated with NGERS. Specifically,
66 Jemena, response to information requested on 22 January 2010, submitted on 5 March 2010. 67 Department of Climate Change and Energy Efficiency, www.climatechange.gov.au/reporting,
accessed March 2010. 68 Jemena, response to information requested on 22 January 2010, confidential, submitted on
6 February 2010.
176 VICTORIAN DRAFT DISTRIBUTION DETERMINATION—DRAFT DECISION
United Energy proposed that staffing requirements (0.2 full time equivalent employees) would total $15 000 per annum, coupled with external auditing costs of $30 000 per annum.69
AER considerations
The AER accepts that the NGERS represents a regulatory obligation for which mandatory compliance is required. However, the AER notes that compliance with the NGERS was required, and achieved, during the current regulatory control period. Furthermore, no evidence was provided to demonstrate that the final auditing framework, as compared to the draft, resulted in any material additional requirements being imposed on the businesses.
Given that the NGERS compliance costs are already included in Jemena’s base year expenditure, and that these costs are rolled forward into the forthcoming regulatory period, the AER considers that additional expenditure would not represent an efficient level.
In regard to United Energy, the AER acknowledges that a bottom up build of costs has been undertaken, and that the costs of compliance with the NGERS have not been included in the tendered costs to service United Energy’s network. However, the AER has assessed United Energy’s regulatory proposal in accordance with a revealed cost approach. As such, a base year operating expenditure amount has been derived based on a combination of Jemena Asset Management’s 2008 regulatory accounts and United Energy’s internal cost models. These base year costs capture the normal ongoing operating costs of United Energy, which would include the NGERS compliance costs.
AER conclusion
For the reasons discussed above, and as a result of the AER’s consideration of both Jemena and United Energy’s regulatory proposals and other supporting information, the AER is not satisfied that the proposed opex step change for NGERS reporting reasonably reflects the opex criteria, including the opex objectives. In coming to these views the AER has had regard to the opex factors.
L.4.3 AECOM based climate change proposal
The Victorian DNSPs commissioned an independent consultant, AECOM, to evaluate the opex (and capex) consequences of climate change on their networks.
All of the Victorian DNSPs proposed opex step changes associated with projected changes to the climate. These step change proposals included projected cost increases for:
the impact of more extreme weather days
the impact of increased bushfire risk
69 United Energy, Regulatory proposal, Appendix B-7, (Confidential), p. 7.
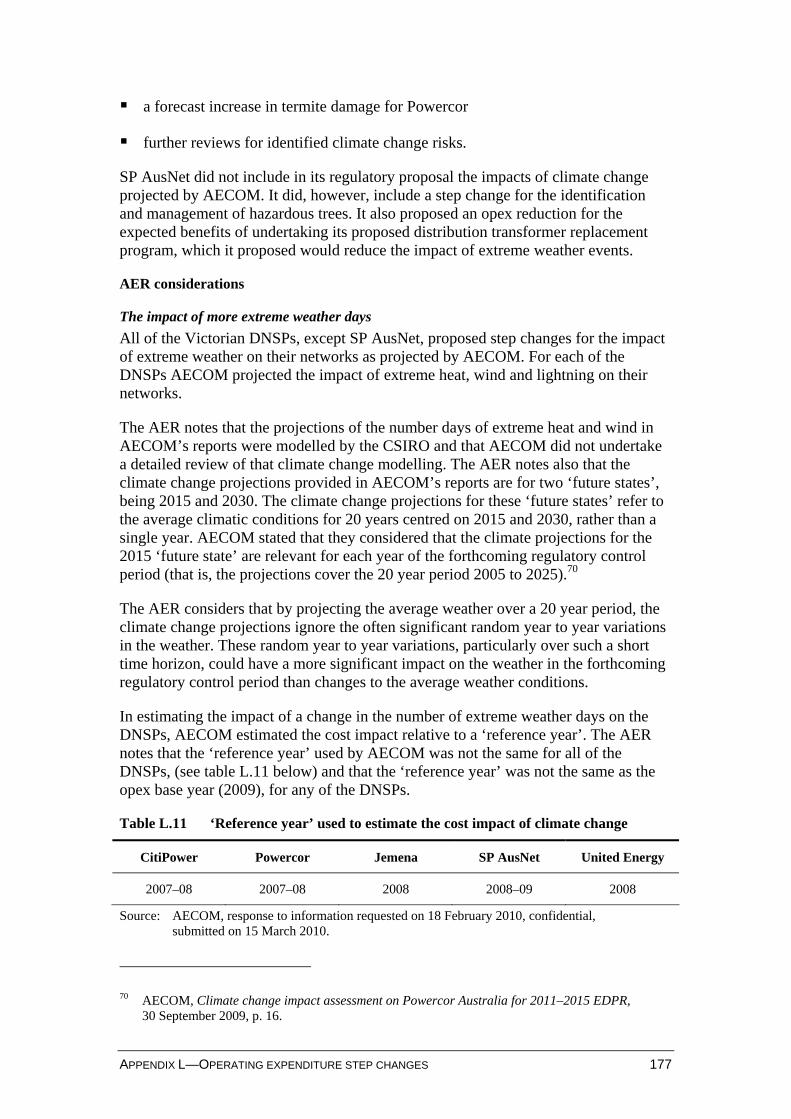
APPENDIX L—OPERATING EXPENDITURE STEP CHANGES 177
a forecast increase in termite damage for Powercor
further reviews for identified climate change risks.
SP AusNet did not include in its regulatory proposal the impacts of climate change projected by AECOM. It did, however, include a step change for the identification and management of hazardous trees. It also proposed an opex reduction for the expected benefits of undertaking its proposed distribution transformer replacement program, which it proposed would reduce the impact of extreme weather events.
AER considerations
The impact of more extreme weather days
All of the Victorian DNSPs, except SP AusNet, proposed step changes for the impact of extreme weather on their networks as projected by AECOM. For each of the DNSPs AECOM projected the impact of extreme heat, wind and lightning on their networks.
The AER notes that the projections of the number days of extreme heat and wind in AECOM’s reports were modelled by the CSIRO and that AECOM did not undertake a detailed review of that climate change modelling. The AER notes also that the climate change projections provided in AECOM’s reports are for two ‘future states’, being 2015 and 2030. The climate change projections for these ‘future states’ refer to the average climatic conditions for 20 years centred on 2015 and 2030, rather than a single year. AECOM stated that they considered that the climate projections for the 2015 ‘future state’ are relevant for each year of the forthcoming regulatory control period (that is, the projections cover the 20 year period 2005 to 2025).70
The AER considers that by projecting the average weather over a 20 year period, the climate change projections ignore the often significant random year to year variations in the weather. These random year to year variations, particularly over such a short time horizon, could have a more significant impact on the weather in the forthcoming regulatory control period than changes to the average weather conditions.
In estimating the impact of a change in the number of extreme weather days on the DNSPs, AECOM estimated the cost impact relative to a ‘reference year’. The AER notes that the ‘reference year’ used by AECOM was not the same for all of the DNSPs, (see table L.11 below) and that the ‘reference year’ was not the same as the opex base year (2009), for any of the DNSPs.
Table L.11 ‘Reference year’ used to estimate the cost impact of climate change
CitiPower Powercor Jemena SP AusNet United Energy
2007–08 2007–08 2008 2008–09 2008
Source: AECOM, response to information requested on 18 February 2010, confidential, submitted on 15 March 2010.
70 AECOM, Climate change impact assessment on Powercor Australia for 2011–2015 EDPR,
30 September 2009, p. 16.
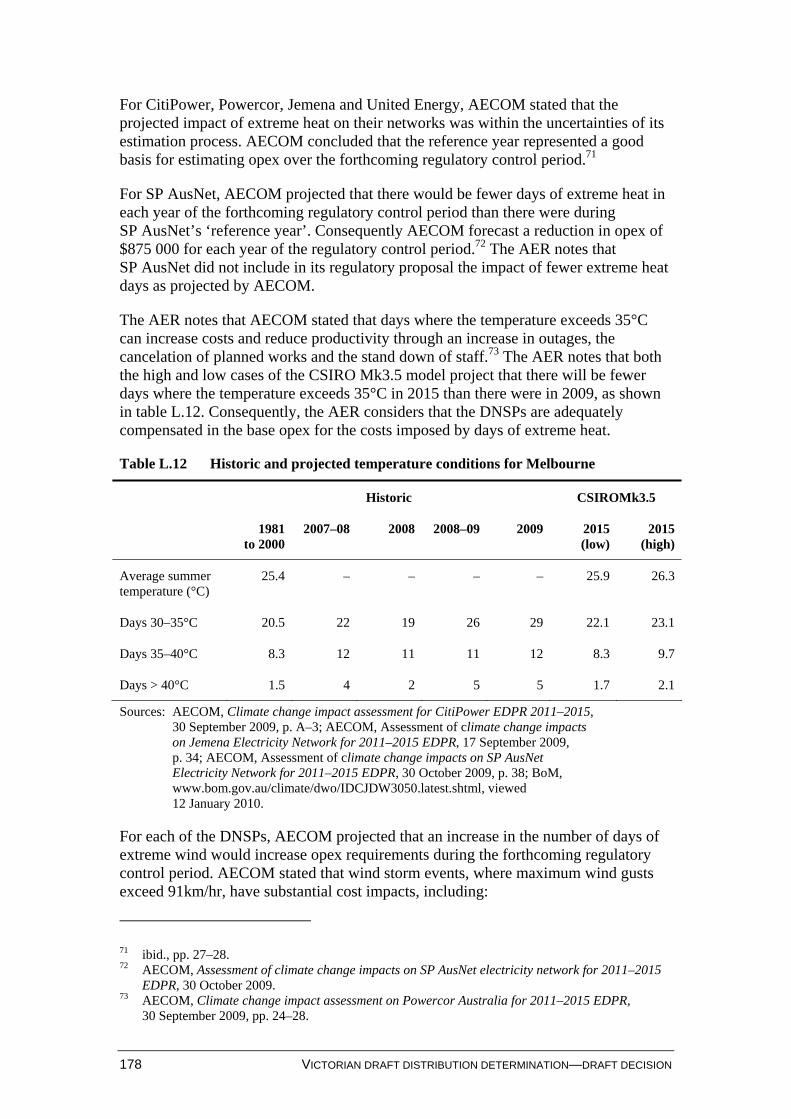
178 VICTORIAN DRAFT DISTRIBUTION DETERMINATION—DRAFT DECISION
For CitiPower, Powercor, Jemena and United Energy, AECOM stated that the projected impact of extreme heat on their networks was within the uncertainties of its estimation process. AECOM concluded that the reference year represented a good basis for estimating opex over the forthcoming regulatory control period.71
For SP AusNet, AECOM projected that there would be fewer days of extreme heat in each year of the forthcoming regulatory control period than there were during SP AusNet’s ‘reference year’. Consequently AECOM forecast a reduction in opex of $875 000 for each year of the regulatory control period.72 The AER notes that SP AusNet did not include in its regulatory proposal the impact of fewer extreme heat days as projected by AECOM.
The AER notes that AECOM stated that days where the temperature exceeds 35°C can increase costs and reduce productivity through an increase in outages, the cancelation of planned works and the stand down of staff.73 The AER notes that both the high and low cases of the CSIRO Mk3.5 model project that there will be fewer days where the temperature exceeds 35°C in 2015 than there were in 2009, as shown in table L.12. Consequently, the AER considers that the DNSPs are adequately compensated in the base opex for the costs imposed by days of extreme heat.
Table L.12 Historic and projected temperature conditions for Melbourne
Historic CSIROMk3.5
1981 to 2000
2007–08 2008 2008–09 2009 2015 (low)
2015 (high)
Average summer temperature (°C)
25.4 – – – – 25.9 26.3
Days 30–35°C 20.5 22 19 26 29 22.1 23.1
Days 35–40°C 8.3 12 11 11 12 8.3 9.7
Days > 40°C 1.5 4 2 5 5 1.7 2.1
Sources: AECOM, Climate change impact assessment for CitiPower EDPR 2011–2015, 30 September 2009, p. A–3; AECOM, Assessment of climate change impacts on Jemena Electricity Network for 2011–2015 EDPR, 17 September 2009, p. 34; AECOM, Assessment of climate change impacts on SP AusNet Electricity Network for 2011–2015 EDPR, 30 October 2009, p. 38; BoM, www.bom.gov.au/climate/dwo/IDCJDW3050.latest.shtml, viewed 12 January 2010.
For each of the DNSPs, AECOM projected that an increase in the number of days of extreme wind would increase opex requirements during the forthcoming regulatory control period. AECOM stated that wind storm events, where maximum wind gusts exceed 91km/hr, have substantial cost impacts, including:
71 ibid., pp. 27–28. 72 AECOM, Assessment of climate change impacts on SP AusNet electricity network for 2011–2015
EDPR, 30 October 2009. 73 AECOM, Climate change impact assessment on Powercor Australia for 2011–2015 EDPR,
30 September 2009, pp. 24–28.
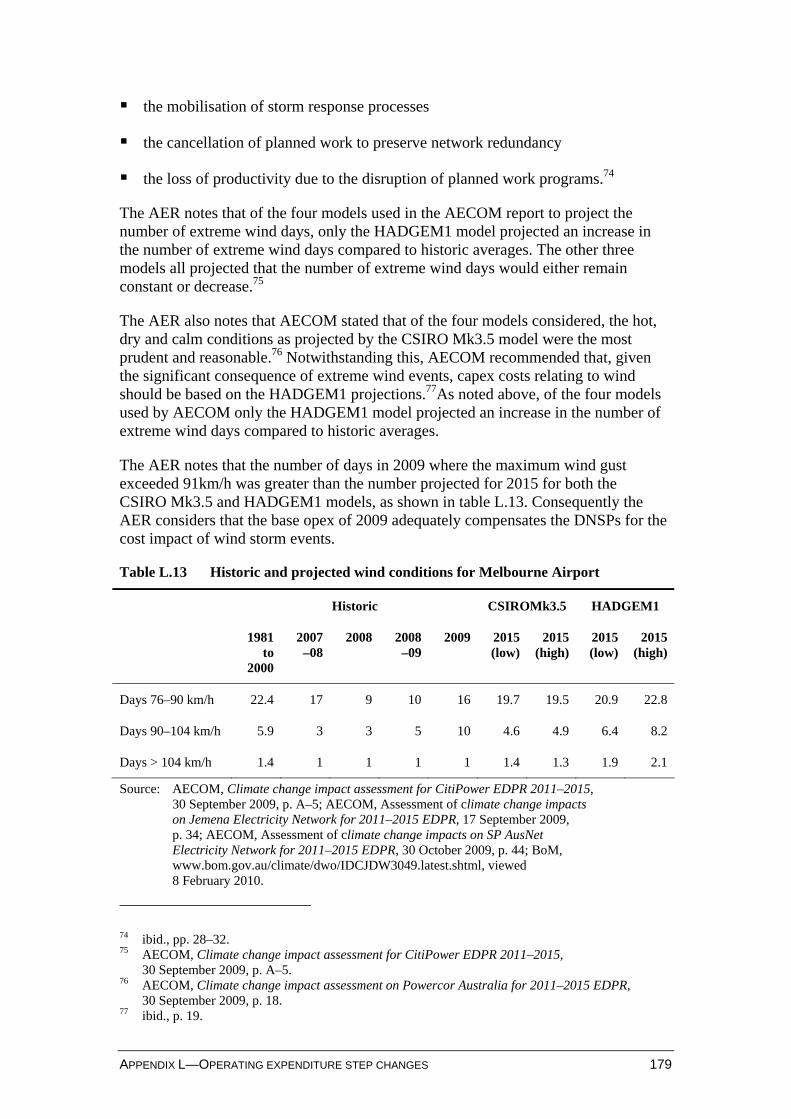
APPENDIX L—OPERATING EXPENDITURE STEP CHANGES 179
the mobilisation of storm response processes
the cancellation of planned work to preserve network redundancy
the loss of productivity due to the disruption of planned work programs.74
The AER notes that of the four models used in the AECOM report to project the number of extreme wind days, only the HADGEM1 model projected an increase in the number of extreme wind days compared to historic averages. The other three models all projected that the number of extreme wind days would either remain constant or decrease.75
The AER also notes that AECOM stated that of the four models considered, the hot, dry and calm conditions as projected by the CSIRO Mk3.5 model were the most prudent and reasonable.76 Notwithstanding this, AECOM recommended that, given the significant consequence of extreme wind events, capex costs relating to wind should be based on the HADGEM1 projections.77As noted above, of the four models used by AECOM only the HADGEM1 model projected an increase in the number of extreme wind days compared to historic averages.
The AER notes that the number of days in 2009 where the maximum wind gust exceeded 91km/h was greater than the number projected for 2015 for both the CSIRO Mk3.5 and HADGEM1 models, as shown in table L.13. Consequently the AER considers that the base opex of 2009 adequately compensates the DNSPs for the cost impact of wind storm events.
Table L.13 Historic and projected wind conditions for Melbourne Airport
Historic CSIROMk3.5 HADGEM1
1981 to
2000
2007 –08
2008 2008–09
2009 2015 (low)
2015 (high)
2015 (low)
2015 (high)
Days 76–90 km/h 22.4 17 9 10 16 19.7 19.5 20.9 22.8
Days 90–104 km/h 5.9 3 3 5 10 4.6 4.9 6.4 8.2
Days > 104 km/h 1.4 1 1 1 1 1.4 1.3 1.9 2.1
Source: AECOM, Climate change impact assessment for CitiPower EDPR 2011–2015, 30 September 2009, p. A–5; AECOM, Assessment of climate change impacts on Jemena Electricity Network for 2011–2015 EDPR, 17 September 2009, p. 34; AECOM, Assessment of climate change impacts on SP AusNet Electricity Network for 2011–2015 EDPR, 30 October 2009, p. 44; BoM, www.bom.gov.au/climate/dwo/IDCJDW3049.latest.shtml, viewed 8 February 2010.
74 ibid., pp. 28–32. 75 AECOM, Climate change impact assessment for CitiPower EDPR 2011–2015,
30 September 2009, p. A–5. 76 AECOM, Climate change impact assessment on Powercor Australia for 2011–2015 EDPR,
30 September 2009, p. 18. 77 ibid., p. 19.
180 VICTORIAN DRAFT DISTRIBUTION DETERMINATION—DRAFT DECISION
AECOM also considered the impact of lighting on all of the Victorian DNSPs with the exception of CitiPower. In its assessment of the impact of lightning strikes on electricity distribution networks AECOM noted that there was a relationship between temperature and lightning frequency. Specifically, AECOM reported an increased incidence of lightening when the temperature exceeds 30°C.78
For each of the DNSPs, AECOM considered the daily number of lightning strikes within the same temperature bands as provided by the climate models. AECOM then estimated the future frequency of lightning strikes by multiplying the daily average lightning count in each temperature band by the temperature projections for 2015 provided by the CSIRO Mk3.5 model.
For Jemena and United Energy, AECOM concluded that the projected increase in lightning frequency, and the associated outage costs, was not material and within the uncertainties of the estimation process.79
The AER notes that the projected number of days in 2015 where the temperature exceeds 30°C is less than the number in 2009, as shown in table l.12. Consequently, the AER considers that the DNSPs are adequately compensated in the base opex for the costs imposed by lightning strikes.
Bushfire
AECOM projected that bushfire management costs would increase in the forthcoming regulatory control period due to:
an increase in extreme fire risk days
longer fire seasons
changes in land use
additional management actions.80
Increase in extreme fire risk days For each of the DNSPs, except CitiPower, AECOM compared the historical number of very high and extreme risk fire days against projections for 2020 and 2050 produced by the Bushfire Cooperative Research Centre and the Australian Bureau of Meteorology.81
AECOM noted that on days of total fire ban, planned works are cancelled and other event escalation procedures are implemented. Using cost estimates of this lost
78 ibid., pp. 33–35. 79 AECOM, Assessment of climate change impacts on United Energy network for 2011–2015 EDPR,
17 September 2009, p. 47; Jemena, Assessment of climate change impacts on Jemena Electricity Networks, for 2011–2015 EDPR, 17 September, p. 46.
80 AECOM, Climate change impact assessment on Powercor Australia for 2011–2015 EDPR, 30 September 2009, pp. 57–70.
81 Bushfire CRC and BoM, Bushfire weather in southeast Australia: Recent trends and projected climate change impacts, September 2007.
APPENDIX L—OPERATING EXPENDITURE STEP CHANGES 181
productivity provided by each of the DNSPs, AECOM estimated the cost impact of an increase in extreme risk fire days.82
However, the AER notes that in estimating the cost of extreme risk fire days AECOM measured the difference, in number of extreme risk days, between the average number of days for 1973–2006 and the projected number of days for 2020.83 The AER notes that the number of very high and extreme risk fire days in the 2008–09 fire season, which most closely represents the 2009 calendar year, was higher than the projection for 2020. Consequently the AER considers that the DNSPs are adequately compensated in the base opex for any productivity losses caused by very high and extreme risk fire days.
Longer fire seasons In its report AECOM noted that climate change projections indicate that the length of the gazetted fire season could increase during the forthcoming regulatory control period. AECOM stated that the length of the fire season can impact on the vegetation management costs of the DNSPs, which must ensure that all vegetation is outside the mandated clearance spaces at all times during the declared fire season.84
AECOM projected the length of the declared fire seasons during the forthcoming regulatory control period by extrapolating an historical time series.85 However, it is unclear how these projections of the length of the declared fire season have been used to project the cost impact of longer fire seasons.
The AER notes that AECOM has not compared the length of the fire season in the opex base year, which is 2009, to the projected fire season lengths for the forthcoming regulatory control period. That is, AECOM has not demonstrated that the projected length of the fire seasons for the forthcoming regulatory control period would be longer than that in the opex base year. Consequently, the AER considers that the DNSPs have not provided evidence to support the claim that they will not be adequately compensated in the base opex for the costs imposed by the length of the declared fire season.
Changes in land use In its report to Powercor, AECOM stated that it was likely that changes in land use would impact Powercor’s vegetation management costs during the forthcoming regulatory control period. AECOM considered it was likely that some areas of irrigated land, which are generally considered to be low fire risk, would become dryland agricultural land, which is considered to be high risk.86
AECOM noted that the Country Fire Authority (CFA) generally undertakes fire risk mapping every four years and that the next remapping is expected to be completed in 2011. AECOM also noted that at the last remapping, completed in 2007, 4.25 per cent of low bushfire risk land was remapped as high bushfire risk land. Consultation by
82 AECOM, Climate change impact assessment on Powercor Australia for 2011–2015 EDPR,
30 September 2009, pp. 57–60. 83 ibid., pp. 57–60. 84 ibid., pp. 63–66. 85 ibid., pp. 63–66. 86 ibid., pp. 66–70.
182 VICTORIAN DRAFT DISTRIBUTION DETERMINATION—DRAFT DECISION
AECOM with the CFA, Goulburn Murray Water and Powercor, indicated that a further contraction of 5 per cent would be a reasonable assumption but that it could be higher. Based on the outcomes of the 2007 remapping review and consultation, AECOM recommended a doubling in the percentage reduction in low bushfire risk areas would occur at the upcoming 2011 review. That is, a 10 per cent reduction in low bushfire risk areas.87
Using GIS mapping, AECOM identified the number of spans outside of town boundaries. Ten per cent of these spans were then assumed to be impacted by the remapping. It was then assumed that 5 per cent of these spans will require management.88
The AER considered the outcomes of the 2007 fire hazard mapping and notes that approximately half of the low fire bushfire risk area that was reclassified as high risk was in the Loddon local government area. In the Loddon area, the land classified as low bushfire risk reduced from 11 995 to 1058 hectares.89 The AER notes that if the Loddon area is excluded from the analysis the land area classified as low bushfire risk is reduced by 2.2 per cent. As note above, AECOM recommended that a 10 per cent reduction in low bushfire risk areas would occur at the 2011 review.
The AER also notes that AECOM appears to assume that 10 per cent of all spans outside of township boundaries will be impacted by the remapping, rather than only those that are currently classified as being in low bushfire risk areas. Furthermore, AECOM provided no basis for assuming that 5 per cent of the spans assumed to be remapped would require a change in their management. The AER notes that a significant proportion of spans will not have vegetation near the clearance space. Furthermore, Powercor is not the entity responsible for maintaining the clearance space for all power lines.
Additional management actions. AECOM proposed for each of the DNSPs, except CitiPower, that additional management actions would be required to address an increased fire risk in the forthcoming regulatory control period. These actions included:
the expansion of Powercor’s enhanced bushfire maintenance program90
a review by Jemena of the installation of insulated conductor systems91
additional hazard tree identification and management.92
87 ibid. 88 ibid. 89 ibid., p. 68. 90 ibid., pp. 60–61. 91 AECOM, Assessment of climate change impacts on Jemena Electricity Networks for 2011–2015
EDPR, 17 September 2009, pp. 75–76. 92 AECOM, Climate change impact assessment on Powercor Australia for 2011–2015 EDPR,
30 September 2009, pp. 61–63; AECOM, Assessment of climate change impacts on Jemena Electricity Networks for 2011–2015 EDPR, 17 September 2009, p. 75; AECOM, Assessment of climate change impacts on United Electricity Distribution networks for 2011–2015 EDPR,
APPENDIX L—OPERATING EXPENDITURE STEP CHANGES 183
AECOM did not estimate a cost for the identification and management of hazard trees for SP AusNet since SP AusNet had developed its own estimate.93 SP AusNet forecast $20 million (real 2010) would be required to address an increasing bushfire risk profile by reducing the number of tree related incidents from 17 per annum to 10.94 SP AusNet noted that its proposal went beyond that which is required by Victorian legislation and that the adoption of a risk based approach would permit it to remove, through a targeted approach, high risk vegetation outside the clearance space in high bushfire risk areas.95
Nuttall Consulting reviewed SP AusNet’s hazard tree identification and management program and stated that this proposal was not based on a direct regulatory obligation, but on a cost and benefit analysis. It noted:
the outcome of SP AusNet’s cost benefit analysis
that it was a technical consulting business and that the assessment of societal benefits was not part of its core business
that it appeared self-evident that the costs of the bushfires of 2009 were enormous and that there was a benefit in reducing the scope for these to recur.96
Nuttall Consulting stated that the impending findings and recommendations from the Victorian Bushfires Royal Commission (VBRC) had complicated its assessment of this proposal. It also noted that the impending recommendations have a significant potential to overlap and/or impact the proposed hazardous tree removal program.97
Nuttall Consulting determined that given the uncertainty and potential scale of any program resulting from the findings of the VBRC, in addition to SP AusNet not proposing to commence its vegetation management program until 2011, that this issue be considered in conjunction with the findings from the VBRC.98
The AER considers that the proposals regarding additional management actions are not step changes as Powercor, Jemena, SP AusNet and United Energy have not demonstrated to the AER’s satisfaction that these proposals are linked to a new or changed regulatory obligation or requirement.
In addition, the AER notes that SP AusNet has stated that its proposal goes beyond the minimum clearance distances to powerlines prescribed in Victorian legislation.99 Similarly, AECOM stated that the proposed enhanced maintenance programs in
17 September 2009, p. 75; AECOM, Assessment of climate change impacts on SP AusNet Electricity networks for 2011–2015 EDPR, 30 October 2009, pp. 74–75.
93 AECOM, Assessment of climate change impacts on SP AusNet Electricity Networks for 2011–2015 EDPR, p. 75.
94 SP AusNet, Regulatory proposal, p. 221. 95 SP AusNet, Regulatory proposal, Appendix I (Confidential), Electricity Distribution Network,
Incremental opex impact to 2009 base year, p. 22. 96 Nuttall Consulting, Victorian Electricity Distribution Revenue Review, March 2010, pp. 258–259. 97 ibid. 98 ibid. 99 SP AusNet, Regulatory proposal, Appendix I (Confidential), Electricity Distribution Network,
Incremental opex impact to 2009 base year, p. 22.
184 VICTORIAN DRAFT DISTRIBUTION DETERMINATION—DRAFT DECISION
Powercor’s high risk fire areas involve ‘actions above and beyond compliance requirements’.100
The AER also notes Nuttall Consulting’s finding that SP AusNet’s proposal should not be added to the allowed opex, but that it should be considered in conjunction with the findings from the VBRC.101
The AER recognises the importance of bushfire mitigation but considers that it would not be prudent to approve additional opex for these proposals until the VBRC’s recommendations, and the Victorian Government’s response to those recommendations, are released.102 The AER notes that:
the VBRC is not expected to release its final report until July 2010103
SP AusNet has, as part of its justification for this proposal, provided an estimate of the societal risk per tree related fire incident.104 The AER considers that, at this time, this information may be of more use as an input to the Victorian Government’s deliberations on, and response to, the VBRC’s final recommendations
the Victorian DNSPs may seek the approval of the AER to pass through to distribution network users a positive pass through amount should their costs increase because of new regulatory obligations arising from the VBRC’s final recommendations and the Victorian Government’s decisions in response to the recommendations.105
The AER notes that this draft decision does not preclude the DNSPs from undertaking the proposed programs through self financing arrangements should they determine it is in their commercial interest to do so. However, the AER notes that any business process improvements which result in lower costs will be self financing as the net costs should be expected to be less than those reflected in the revenue requirement. The AER considers that SP AusNet has recognised this self financing aspect where it noted that if its program of reducing tree hazards was complemented by the reduction in incremental growth of trees, that this ‘will reduce future tree related faults to the network and reduce the long term increase in annual vegetation management costs’.106
100 AECOM, Climate change impact assessment on Powercor Australia for 2011–2015 EDPR,
30 September 2009, p. 60. 101 Nuttall Consulting, Victorian Electricity Distribution Revenue Review, March 2010, p. 259. 102 The 2009 Victorian Bushfires Royal Commission was established on 16 February 2009 to
investigate the causes and responses to the bushfires which swept through parts of Victoria in late January and February 2009.
103 2009 Victorian Bushfires Royal Commission, www.royalcommission.vic.gov.au/About-Us, accessed 12 March 2010.
104 SP AusNet, Regulatory proposal, Appendix I (Confidential), Electricity Distribution Network, Incremental opex impact to 2009 base year, p. 22.
105 NER, clause 6.6.1. 106 SP AusNet, Regulatory proposal, Appendix I (Confidential), Electricity Distribution Network,
Incremental opex impact to 2009 base year, p. 22.
APPENDIX L—OPERATING EXPENDITURE STEP CHANGES 185
Termite damage
In its report to Powercor, AECOM noted that the incidence of poles requiring treatment for termite infestation has increased over the last ten years. AECOM forecast the number of poles that would require treatment in the forthcoming regulatory control period by linearly extrapolating the historic time series from 1998 to 2008. From this number, AECOM forecast the cost of treating termite infested poles during the forthcoming regulatory control period. AECOM then subtracted from this amount the cost estimate of treatment for the current regulatory control period to estimate the additional cost for the forthcoming period.107
The AER notes that AECOM has not compared the number of poles requiring treatment for termites in the opex base year, which is 2009, to the projected number for the forthcoming regulatory control period. That is, AECOM has not demonstrated that the projected number of poles requiring treatment for termites for the forthcoming regulatory control period is greater than that in the opex base year. Consequently the AER considers that Powercor has not provided evidence to support the claim that it will not be adequately compensated in the base opex for the costs of treating termite infested poles.
Further reviews for identified climate change risks
In its reports to the DNSPs AECOM identified areas where it considered the DNSPs needed to conduct further reviews on the potential impacts of climate change, including:
the impact of increased temperatures on distribution switchgear108
the impact of dry soil on the performance of underground cables109
the impact on the thermal rating of overhead lines.110
The AER notes that climate change is not a new phenomenon, and that mean temperatures in Australia have risen 0.9°C since 1950.111 Also, temperatures during the current regulatory control period have been significantly above historical averages. Furthermore, the impact of the climate on distribution switchgear, underground cables and overhead lines is well known. However, the AER notes that the DNSPs have apparently not undertaken these identified reviews despite having experienced climate change.
The AER considers that prudent operators in the circumstances of the Victorian DNSPs would already be regularly reviewing the state of their distribution networks, including for the impacts of climate change. Consequently, the AER considers that the DNSPs are adequately compensated in the base opex for the costs of reviewing the impact of climate change on their electrical equipment.
107 AECOM, Climate change impact assessment on Powercor Australia for 2011–2015 EDPR,
30 September 2009, pp. 70–75. 108 ibid., pp. 43–45. 109 ibid., pp. 45–49. 110 ibid., pp. 49–50. 111 CSIRO, The science of tackling climate change, 30 September 2009, p. 5.
186 VICTORIAN DRAFT DISTRIBUTION DETERMINATION—DRAFT DECISION
SP AusNet’s proposed distribution transformer replacement program
SP AusNet proposed a reduction to its opex for the expected benefits of undertaking its proposed distribution transformer replacement program. The AER has assessed this capex project in chapter 8. The AER assessed SP AusNet’s proposed distribution transformer replacement program and considered that there is not sufficient evidence to suggest the methodology proposed to determine overloaded distribution transformers would be effective in reducing failure rates of distribution substations. Consequently the AER will not apply the corresponding opex reduction of $1.8 million ($2010).
AER conclusion
The AER notes that in the opex base year of 2009 the DNSPs experienced more days of extreme heat and wind than forecast by AECOM for each year of the forthcoming regulatory control period. The cost associated with these extreme weather events will be reflected in the actual opex of the DNSPs in 2009, which will be used as the base year for setting their opex requirements for the forthcoming regulatory control period.
For the reasons discussed above and as a result of the AER’s consideration of the Victorian DNSPs’ regulatory proposals and other supporting information, the AER is not satisfied that the DNSPs’ proposed climate change expenditure reasonably reflects the opex criteria, including the opex objectives. In coming to this view the AER has had regard to the opex factors.
L.4.4 Insurance
Victorian DNSP regulatory proposals
The combined step changes proposed by CitiPower, Powercor, SP AusNet and United Energy total $54.7 million over the forthcoming regulatory control period, or an average step change of $10.9 million per annum.112 Jemena did not propose a step change in its insurance costs. The insurance step changes proposed by each DNSP is outlined in table L.14.
112 Note that CitiPower and Powercor proposed self insurance costs as an opex step change in their
respective regulatory proposals, however the AER has considered these costs in the self insurance appendix M and therefore these costs are not reflected in the opex step change appendix.
APPENDIX L—OPERATING EXPENDITURE STEP CHANGES 187
Table L.14 Victorian DNSP proposed insurance premium step changes ($’m, 2010)
2011 2012 2013 2014 2015 Total
(step change)
Total
(base opex)
Total
(base + step change)
CitiPower 0.8 1.1 1.4 1.7 2.0 7.0 4.0 11.1
Powercor 3.0 4.2 5.4 6.7 8.2 27.5 12.9 40.3
Jemenaa – – – – – – – –
SP AusNetb 3.3 3.3 3.3 3.3 3.3 16.7 14.1 30.7
United Energy 0.7 0.7 0.7 0.7 0.7 3.5 7.0 10.6
Industry 7.8 9.3 10.8 12.4 14.3 54.7 38.0 92.7
(a) Jemena did not separately identify the insurance costs in its base year opex. (b) The base year opex costs relate only to SP AusNet’s liability insurance
premiums. SP AusNet did not separately identify the insurance costs in its base year opex relating to other insured risks.
Source: CitiPower, Regulatory proposal, p.171; Aon, CitiPower Pty—Insurance cost projections, October 2009; Powercor, Regulatory proposal, p.167; SP AusNet, Opex Step Change_Final.xls, December 2009; United Energy, Regulatory proposal—Appendix B.7, 30 November 2009; United Energy, Regulatory proposal—Appendix I.7 ‘Marsh, General liability and professional indemnity insurance—Renewal report—United Energy Distribution Holdings Pty Ltd—For period 30 September 2009 to 30 September 2010’, 30 November 2009.
CitiPower and Powercor state that the categories of insurance for which they obtain insurance cover include corporate travel, crime, industrial special risk (property), inpatriate, liability, motor vehicle and personal accident. Powercor also obtains insurance for aviation risk.113 The insurance premium costs in CitiPower’s and Powercor’s base year (2009) opex are $0.8m and $2.5m, respectively.114
CitiPower and Powercor engaged Aon to forecast their insurance premiums over the forthcoming regulatory control period. Aon developed year-by-year forecast percentage increases for three groups of insurances risks being ‘general’, ‘liability’ and ‘property’. In developing these percentage increases Aon considered four factors, being:
business trends—changing characteristics of CitiPower’s and Powercor’s businesses
general insurance market trends—referring to the cyclical nature of the insurance premium market
other key influences—including the ‘Black Saturday’ bushfires, competition in the insurance market, recent record maximum temperatures, and the current financial market situation, and
113 CitiPower, Regulatory proposal, p.170; Powercor, Regulatory proposal, p.167. 114 Includes brokers fees.
188 VICTORIAN DRAFT DISTRIBUTION DETERMINATION—DRAFT DECISION
the impact of CitiPower and Powercor’s risk management and insurer relationships on the influence of the previous three factors. Aon considered this would have a ‘moderating’ impact on the other three factors.115
Aon’s assessment resulted in an increasing insurance premium cost profile for both service providers. Aon forecast CitiPower’s overall insurance premiums to increase from $0.8 million to $2.8 million per annum between 2009 and 2015 (250.9 per cent increase). For Powercor, Aon forecast its overall insurance premiums to increase from $2.6 million to $10.8 million per annum between 2009 and 2015 (318.9 per cent increase).116
SP AusNet states that its annual liability insurance premiums increased from $1.8 million to $5.7 million as of September 2009. As only one quarter of this increase is reflected in its base year (2009) opex, SP AusNet has included the remaining three quarters ($3.0 million) as a step change. In addition, SP AusNet has sought an allowance for additional coverage resulting in an additional small increase ($0.3 million per annum). The combined effect of these components is a step change of $3.3 million per annum.117
Similar to SP AusNet, United Energy notes that its insurance premiums increased from $1.4 million to $2.1 million as of September 2009. Accordingly, United Energy seeks a $0.7 million increase in its annual opex forecast as an insurance step change.118
Submissions on DNSP regulatory proposals
Energy Users Coalition of Victoria
The Energy Users Coalition of Victoria (EUCV) notes that bushfire related impacts have featured in the step changes proposed by all five Victorian DNSPs, even CitiPower with its CBD and close urban area. The EUCV states:
Significant cost claims have been made as a result of the bushfires—both in direct costs (e.g. increased inspections, clearing, etc) and in indirect costs (e.g. insurance costs, claims from impacted electricity users, etc). There is potential for the DBs to deliberately over-emphasize these costs, and the AER should be rigorous in their assessments of such claims.119
AER considerations
CitiPower and Powercor—Business trends
Aon identified asset value growth and revenue growth as ‘business trend’ drivers and applied one of these drivers to each of CitiPower’s and Powercor’s insurance
115 Aon, CitiPower Pty—Insurance cost projections, October 2009; Aon, Powercor Australia Ltd—
Insurance cost projections, October 2009. 116 These values are expressed in $2010. The AER has converted the values in the Aon report which
were expressed in $2009. 117 SP AusNet, Regulatory proposal—Appendix I ‘Electricity distribution network—Incremental opex
impact to 2009 base year’, November 2009, p.15. 118 United Energy, Regulatory proposal—Appendix B.7, 30 November 2009.; United Energy,
Regulatory proposal—Appendix I.7 (Marsh insurance premiums renewal report for UEDH), p.4. 119 EUCV, Submission to AER, p.53.
APPENDIX L—OPERATING EXPENDITURE STEP CHANGES 189
premiums. This resulted in average annual cost increases of approximately 5.5 per cent for risks where the asset value growth driver was applied and average annual cost increases of 2-3 per cent for risks where the revenue growth driver was applied.
However, Aon has not explained why it has chosen these particular drivers, which driver it applied to which risk. Additionally, Aon has not demonstrated that CitiPower’s or Powercor’s historical insurance premiums have moved in line with their asset value growth and / or revenue growth, such that it might be reasonable to expect their future insurance premiums to move in line with these factors.
Also, the AER notes that the business trend drivers applied by CitiPower and Powercor to their insurance premium forecasts appear to play a similar role to opex scale adjustments. While CitiPower and Powercor did not apply scale adjustments to insurance forecasts in its proposal, the AER has applied scale adjustments to the total opex base (which includes insurance premiums) in this draft decision. Accordingly, if the AER accepted the business trend escalations then this would lead to a ‘double-counting’ of these cost drivers. The scale adjustments proposed by each of the DNSP’s and the AER’s scale adjustments analysis is set out in appendix J.
Given the above considerations, the AER is not reasonably satisfied that the business trend component of the insurance premium step changes proposed by CitiPower and Powercor represent efficient costs, costs that a prudent operator in the circumstances of CitiPower or Powercor would incur, or a realistic expectation of input costs.
CitiPower and Powercor—General insurance market trends
Using annual insurance survey data, Aon mapped premium movements in the general insurance market between 1993 and 2009, distinguishing between liability insurance and property insurance.
Upon considering this historical data, Aon formed the view that the insurance market is cyclical, with cycles of approximately 10 years in length and five years between peaks and troughs. Aon also formed the view that the insurance market was currently at a trough and that the next peak would equal the last peak.120
The historical trend and Aon’s forecast is presented in figure L.1.
120 Aon, CitiPower Pty—Insurance cost projections, October 2009, p.10
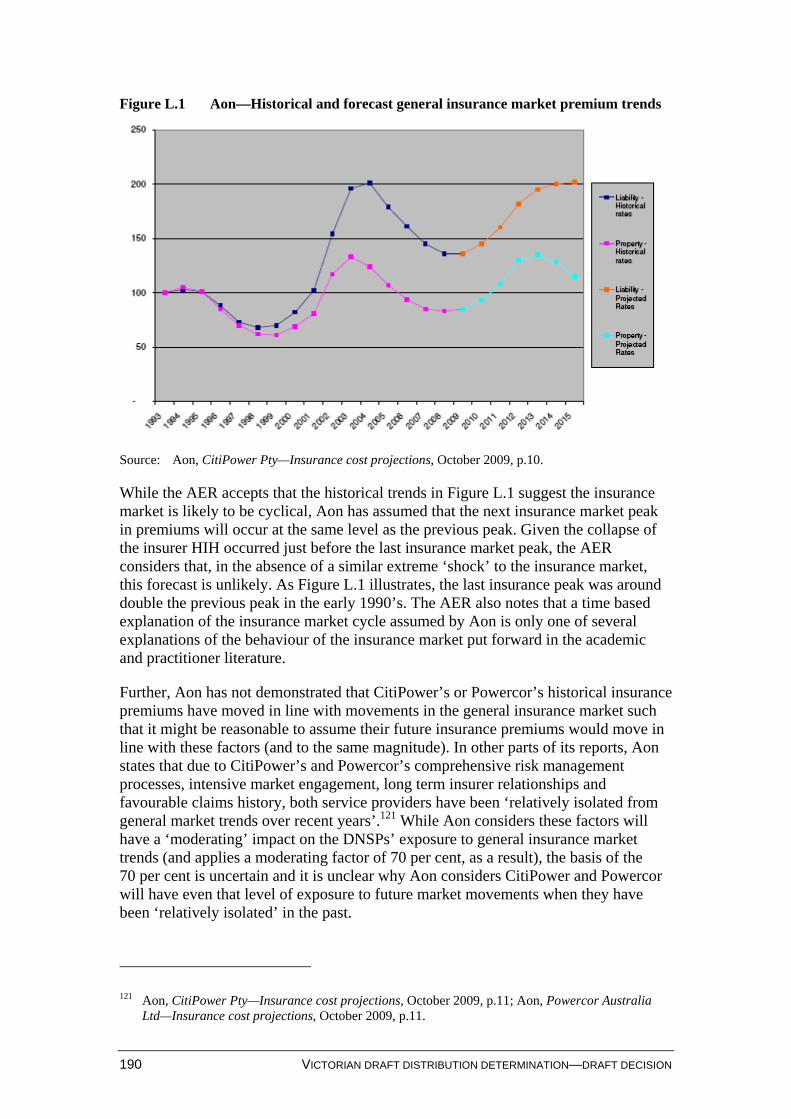
190 VICTORIAN DRAFT DISTRIBUTION DETERMINATION—DRAFT DECISION
Figure L.1 Aon—Historical and forecast general insurance market premium trends
Source: Aon, CitiPower Pty—Insurance cost projections, October 2009, p.10.
While the AER accepts that the historical trends in Figure L.1 suggest the insurance market is likely to be cyclical, Aon has assumed that the next insurance market peak in premiums will occur at the same level as the previous peak. Given the collapse of the insurer HIH occurred just before the last insurance market peak, the AER considers that, in the absence of a similar extreme ‘shock’ to the insurance market, this forecast is unlikely. As Figure L.1 illustrates, the last insurance peak was around double the previous peak in the early 1990’s. The AER also notes that a time based explanation of the insurance market cycle assumed by Aon is only one of several explanations of the behaviour of the insurance market put forward in the academic and practitioner literature.
Further, Aon has not demonstrated that CitiPower’s or Powercor’s historical insurance premiums have moved in line with movements in the general insurance market such that it might be reasonable to assume their future insurance premiums would move in line with these factors (and to the same magnitude). In other parts of its reports, Aon states that due to CitiPower’s and Powercor’s comprehensive risk management processes, intensive market engagement, long term insurer relationships and favourable claims history, both service providers have been ‘relatively isolated from general market trends over recent years’.121 While Aon considers these factors will have a ‘moderating’ impact on the DNSPs’ exposure to general insurance market trends (and applies a moderating factor of 70 per cent, as a result), the basis of the 70 per cent is uncertain and it is unclear why Aon considers CitiPower and Powercor will have even that level of exposure to future market movements when they have been ‘relatively isolated’ in the past.
121 Aon, CitiPower Pty—Insurance cost projections, October 2009, p.11; Aon, Powercor Australia
Ltd—Insurance cost projections, October 2009, p.11.
APPENDIX L—OPERATING EXPENDITURE STEP CHANGES 191
Given the above considerations, the AER is not reasonably satisfied that the general market trend component of the insurance premium step changes proposed by CitiPower and Powercor represent efficient costs, costs that a prudent operator in the circumstances of CitiPower or Powercor would incur, or a realistic expectation of input costs.
CitiPower and Powercor—Liability (including bushfire liability) premiums
While Aon initially applies the combined effect of its business trend and general insurance market trend analysis to the premiums forecasts for each of the three insurance categories (general classes, liability, property), Aon subsequently overrides this forecast for liability premiums.
The different forecast for liability premiums is due to Aon’s view that CitiPower and Powercor will experience ‘a period of above average increases’ for liability insurance premiums. Aon’s reasons for these above average increases include the ‘Black Saturday’ bushfires and other bushfires, the restricted level of competition in the insurance market, recent record maximum temperatures, and the current financial market situation.122
While Aon states that these factors make it ‘very difficult to accurately predict’ insurance premiums in the near future, Aon has made some predictions. These predictions are that CitiPower’s and Powercor’s liability premiums will increase by 50 per cent in 2010, an additional 50-100 per cent in 2011, followed by further annual increases of 20 per cent in 2013, 2014 and 2015.123 Cumulatively, this would result in a 444 per cent increase in liability premiums by the end of the forthcoming regulatory control period. However, due to Aon’s moderating factor, it adjusts the 2013-15 premium increases from 20 per cent per annum to 15 per cent per annum as it expects that CitiPower and Powercor will be viewed more favourably by the market.124
It may be reasonable to conclude that the factors identified by Aon would have a positive impact on insurance premiums, though it is difficult to understand that the recent domestic and international bushfires would have a significant impact on CitiPower’s insurance premiums given its CBD and inner urban geography. Moreover, there is no clear link between the factors raised by Aon and the percentage increases it suggests. Accordingly, the AER is not satisfied that the step change forecasts submitted by CitiPower or Powercor reasonably reflect effect costs, costs that a prudent operator in the circumstances of the DNSPs would incur, or a realistic expectation of input costs.
While the AER has not accepted Powercor’s liability insurance forecasts, the AER expects that most of the re-pricing of insurance premiums as a result of bushfires in
122 Aon, CitiPower Pty—Insurance cost projections, October 2009, pp.11-14; Aon, Powercor Australia
Ltd—Insurance cost projections, October 2009, pp.11-14. 123 These escalators have been applied to CitiPower’s and Powercor’s liability premiums in place of
the general insurance market trend escalators applied in the previous section. 124 Aon, CitiPower Pty—Insurance cost projections, October 2009, pp.11-14; Aon, Powercor
Australia Ltd—Insurance cost projections, October 2009, pp.11-14.
192 VICTORIAN DRAFT DISTRIBUTION DETERMINATION—DRAFT DECISION
2009 is likely to be reflected in the 2010 premiums.125 Accordingly, if Powercor submits its 2010 bushfire liability premiums with its revised proposal, then the AER may be satisfied that the difference between its 2009 and 2010 premiums reflect a realistic expectation of costs inputs over the forthcoming regulatory control period.
SP AusNet
SP AusNet states that its liability insurance premiums increased from $1.8 million to $5.7 million as of September 2009. As only one quarter of this increase is reflected in its base year (2009) opex, SP AusNet has included the remaining three quarters ($3.0 million) as a step change. In addition, SP AusNet sought an allowance of $0.3 million per annum for ‘additional coverage’. The combined effect of these components is a step change of $3.3 million per annum.126
The AER sought verification of SP AusNet’s September 2009 increase in liability insurance premiums against invoices from its insurer. However, the invoices provided by SP AusNet did not relate to its electricity distribution business, but other networks owned by the SP AusNet group. Subject to SP AusNet submitting the correct invoices with its regulatory proposal that verifies the September 2009 increase, the AER will be satisfied that this increase reflects a realistic expectation of input costs in the forthcoming regulatory control period.
On the $0.3 million additional step change, the AER sought additional information from SP AusNet on why it sought additional coverage and what the ‘additional coverage’ relates to.
In response, SP AusNet stated that the additional coverage related to a maximum probable loss exercise that it is ‘in the process of finalising’. It stated that the $330 000 forecast is based on a quotation from its insurer to increase its coverage, however due to confidentially reasons, SP AusNet stated it was unable to provide that quotation to the AER.127
SP AusNet has not provided details about the calculation of the maximum probable loss exercise. Accordingly, due to this lack of supporting information, the AER is not satisfied that SP AusNet’s proposed step change for additional insurance coverage reasonably reflects efficient costs, costs incurred by a prudent operator, or a realistic expectation of input costs.
125 To assume the re-pricing of risk occurs over a longer timeframe would suggest the insurance
market is not efficient and takes a prolonged period of time to price in new information. The AER has not been presented with evidence that suggests this is how the insurance market operates.
126 SP AusNet, Regulatory proposal—Appendix I ‘Electricity distribution network—Incremental opex impact to 2009 base year’, November 2009, p.15.
127 SP AusNet claimed that based on legal advice it had sought, the wording of its insurance policy is confidential and that any leaking of the details could void the policy. SP AusNet stated that for individual AER staff members to view the document it would require its underwriters to agree to release the policy via a confidentially agreement, individual AER staff members wishing to view the policy would be required to sign confidentiality agreements, the viewing could only occur at SP AusNet’s office and SP AusNet would not allow a copy of the document to leave its office. SP AusNet, Response to insurance premiums question, 21 April 2011.
APPENDIX L—OPERATING EXPENDITURE STEP CHANGES 193
United Energy
Similar to SP AusNet, United Energy states that its insurance premiums were to set to rise in September 2009. The AER has verified United Energy’s $0.7 million step change in insurance costs against the renewal report submitted by United Energy from its insurance broker (Marsh). Accordingly, the AER is satisfied that United Energy’s proposed step change reasonably reflects a realistic expectation of cost inputs over the forthcoming regulatory control period.
However, the AER notes that United Energy has ‘double-counted’ its proposed insurance step change within its opex forecast. United Energy’s consolidated budget model (used by United Energy to derive its opex forecast) includes an ‘insurance’ line item that comprises United Energy’s total insurance forecast (i.e. effectively includes the base forecast plus the step change). Notwithstanding this, the consolidated budget model also includes a ‘scope change’ line item that appears to incorporate each of United Energy’s opex step changes, including its insurance step change. Accordingly, while the AER accepts United Energy’s proposed insurance step change, it has removed this amount from the opex base forecast to avoid the ‘double-counting’ in United Energy’s proposal.
AER conclusion
CitiPower, Powercor, SP AusNet and United Energy proposed insurance premium step changes totalling $54.7 million over the forthcoming regulatory control period.
Based on the considerations in this section, the AER is not satisfied that CitiPower’s and Powercor’s proposed insurance step changes of $7.0 million and $27.5 million over the forthcoming regulatory control period, respectively, reasonably reflect the opex criteria. Of the $16.7 million step change proposed by SP AusNet over the forthcoming regulatory control period, the AER is satisfied that $15.0 million reasonably reflects the opex criteria (a $1.7 million adjustment). And the AER is satisfied that United Energy’s proposed insurance step change of $3.5 million over the forthcoming regulatory control period reasonably reflects the opex criteria, however the AER has removed the ‘double-counting’ of this increase in United Energy’s opex proposal (by removing it from the opex base forecast). In coming to these views the AER has had regard to the opex factors.
While the AER does not accept CitiPower’s and Powercor’s ‘business trend’ escalations, the AER has applied scale escalations to each of the DNSP’s base year operating costs (which includes insurance costs). The scale escalations are discussed in chapter 7.
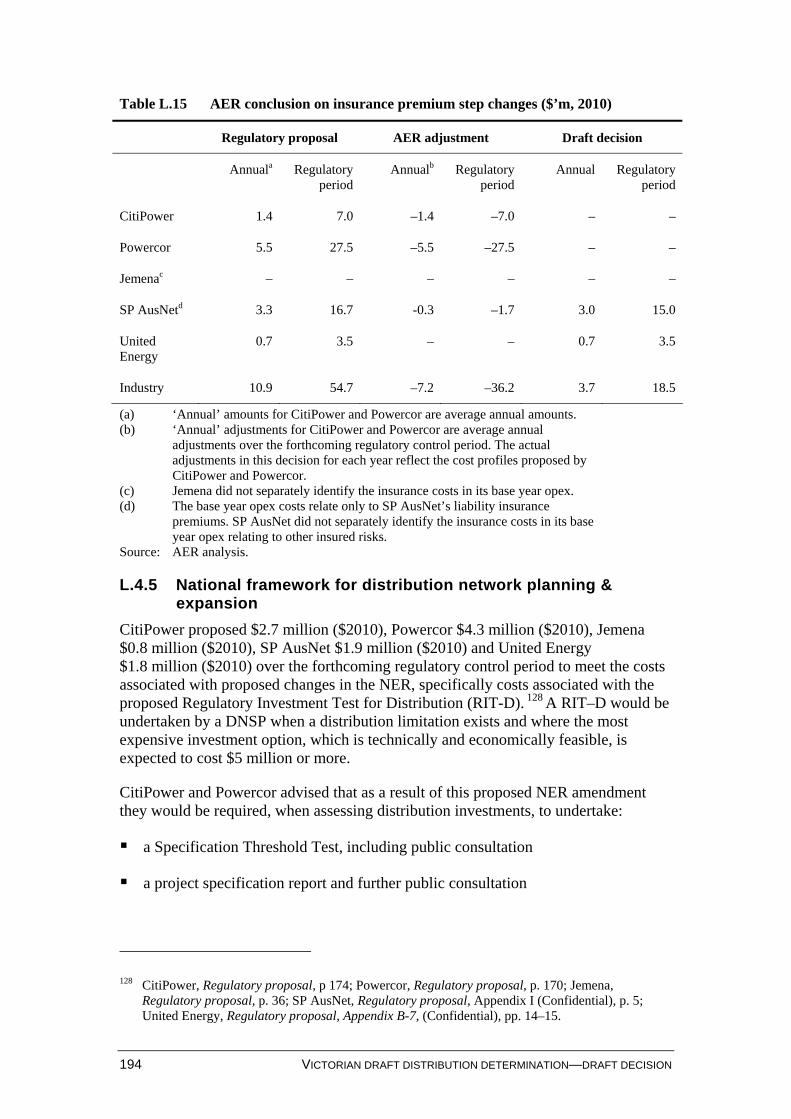
194 VICTORIAN DRAFT DISTRIBUTION DETERMINATION—DRAFT DECISION
Table L.15 AER conclusion on insurance premium step changes ($’m, 2010)
Regulatory proposal AER adjustment Draft decision
Annuala Regulatory period
Annualb Regulatory period
Annual Regulatory period
CitiPower 1.4 7.0 –1.4 –7.0 – –
Powercor 5.5 27.5 –5.5 –27.5 – –
Jemenac – – – – – –
SP AusNetd 3.3 16.7 -0.3 –1.7 3.0 15.0
United Energy
0.7 3.5 – – 0.7 3.5
Industry 10.9 54.7 –7.2 –36.2 3.7 18.5
(a) ‘Annual’ amounts for CitiPower and Powercor are average annual amounts. (b) ‘Annual’ adjustments for CitiPower and Powercor are average annual
adjustments over the forthcoming regulatory control period. The actual adjustments in this decision for each year reflect the cost profiles proposed by CitiPower and Powercor.
(c) Jemena did not separately identify the insurance costs in its base year opex. (d) The base year opex costs relate only to SP AusNet’s liability insurance
premiums. SP AusNet did not separately identify the insurance costs in its base year opex relating to other insured risks.
Source: AER analysis.
L.4.5 National framework for distribution network planning & expansion
CitiPower proposed $2.7 million ($2010), Powercor $4.3 million ($2010), Jemena $0.8 million ($2010), SP AusNet $1.9 million ($2010) and United Energy $1.8 million ($2010) over the forthcoming regulatory control period to meet the costs associated with proposed changes in the NER, specifically costs associated with the proposed Regulatory Investment Test for Distribution (RIT-D). 128 A RIT–D would be undertaken by a DNSP when a distribution limitation exists and where the most expensive investment option, which is technically and economically feasible, is expected to cost $5 million or more.
CitiPower and Powercor advised that as a result of this proposed NER amendment they would be required, when assessing distribution investments, to undertake:
a Specification Threshold Test, including public consultation
a project specification report and further public consultation
128 CitiPower, Regulatory proposal, p 174; Powercor, Regulatory proposal, p. 170; Jemena,
Regulatory proposal, p. 36; SP AusNet, Regulatory proposal, Appendix I (Confidential), p. 5; United Energy, Regulatory proposal, Appendix B-7, (Confidential), pp. 14–15.
APPENDIX L—OPERATING EXPENDITURE STEP CHANGES 195
a project assessment process, including consideration of all applicable market benefits and costs, draft and final reports and public consultation.129
CitiPower and Powercor also advised that the existing regulatory test process is costly and time consuming, requiring expert legal and economic consultants and significant internal resources. They noted that they had assumed $35 000 per RIT–D for most distribution related projects and $45 000 for transmission connection related projects.130 CitiPower and Powercor also anticipated a nine month consultation process. The other Victorian DNSPs had similar cost assumptions.
The proposed expenditure also included the costs associated with meeting the RIT–D Rule changes requirement to incorporate a dispute resolution process.131
AER considerations
The AER notes that:
at the time the Victorian DNSPs’ regulatory proposals were submitted to the AER, the proposed RIT–D Rule change was still subject to consultation by the Australian Energy Market Commission (AEMC) and final approval by the Ministerial Council on Electricity (MCE)
if the AEMC’s final report is accepted by the MCE, the AEMC’s draft framework and draft Rule changes are expected to undergo consultation in 2010, with final Rule changes to follow132
AEMC representatives have confirmed to AER staff that if the Rule change is accepted, new obligations are expected to be imposed on DNSPs during 2011.133
The AER also notes that discussions with AEMC staff have resulted in the AER concluding that there is sufficient certainty that the RIT–D is likely to be implemented and effective from 2011. The AER therefore considers that it is appropriate that the Victorian DNSPs have included a step change associated with the expected RIT–D obligations as part of their regulatory proposals for the forthcoming regulatory control period.
The AER further notes that the proposed cost of these proposals is based on the estimated costs of the DNSPs engaging external consultants to undertake RIT–D reviews and the internal costs of full time equivalent staff. With the exception of Powercor and Jemena, the DNSPs’ forecast costs for RIT–D expenditure are roughly equivalent.134 With respect to Powercor and Jemena, the AER has examined the differences in costs and considers that this difference reasonably reflects the number of RIT–Ds that they expect to undertake and the corresponding costs associated with demand side engagement. 129 Powercor, Regulatory proposal, pp. 170–71. 130 CitiPower and Powercor, Operating expenditure, email to AER, 9 February 2010, p. 12. 131 Powercor, Regulatory proposal, pp. 170–71. 132 AER staff discussion with AEMC staff. AER is required to develop guidelines on the RIT–D as
part of this process. 133 AER staff discussion with AEMC staff. 134 Powercor’s proposal was for $4.3 million ($2009) while Jemena’s was $0.6 million ($2009).
196 VICTORIAN DRAFT DISTRIBUTION DETERMINATION—DRAFT DECISION
The AER accepts that there will be costs associated with the DNSPs’ compliance with the requirements of the RIT–D, particularly the costs associated with consultant reviews. However, the AER notes that this is similar to the current regulatory test requirements; therefore only the additional volume of work required by the $5 million threshold test review represents a step change.
The AER also notes the scope and costs of the regulatory test undertaken by CitiPower for its CBD security of supply project in 2007, as submitted to the ESCV for its consideration.135 The AER considers that this process was essentially a forerunner to the proposed RITD requirements. The AER considers that there are similarities between the proposed RIT–D requirements and the consultation process CitiPower undertook for the Brunswick terminal station upgrade and that therefore its forecast costs reasonably reflects the efficient costs faced by a prudent operator complying with the intended Rule change.
Other DNSPs provided a breakdown of the costs associated with undertaking RITDs, including full time equivalent personnel, venue hire rates and the costs to undertake consultation on demand side management initiatives. Jemena reduced its original cost estimate of $0.7 million ($2009) proposed on 30 November 2009, to $0.6 million ($2010) following further internal analysis.136 United Energy amended its costs marginally to reflect the AEMC’s final decision on the $5 million cost threshold that triggers a RIT–D.137 CitiPower and Powercor also reduced their forecast costs slightly from that originally provided to the AER on 30 November 2009, based on new internal information.138
The AER, after converting all DNSPs’ proposed costs into 2010 dollars reviewed all the Victorian DNSPs’ pricing methodologies and is satisfied that they represent those of a prudent and efficient operator in the circumstances faced by them.
AER conclusion
For the reasons discussed above and as a result of the AER’s consideration of the DNSPs’ regulatory proposals and other supporting information, the AER is satisfied that the DNSPs’ proposed expenditure to comply with the national framework for distribution planning and expansion reasonably reflects the opex criteria, including the opex objectives. In coming to this view the AER has had regard to the opex factors.
135 Essential Services Commission of Victoria (ESCV),
www.esc.vic.gov.au/public/Energy/Consultations/CitiPower+CBD+Security+of+Supply+Proposal,accessed 9 April 2010.
136 Jemena, response to information requested on 11 February 2010, confidential, submitted on 11 February 2010.
137 United Energy, response to information requested on 22 February 2010, confidential, submitted on 24 February 2010.
138 CitiPower and Powercor, response to information requested on 19 February 2010, confidential, submitted on 5 March 2010.
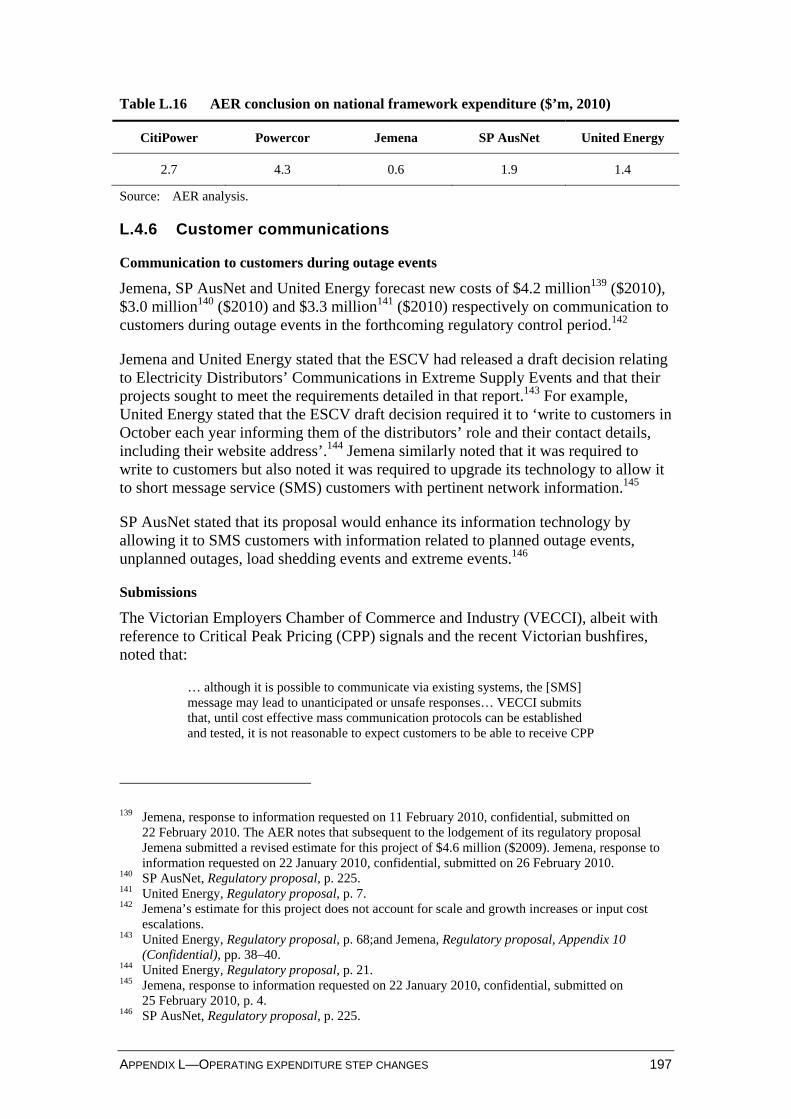
APPENDIX L—OPERATING EXPENDITURE STEP CHANGES 197
Table L.16 AER conclusion on national framework expenditure ($’m, 2010)
CitiPower Powercor Jemena SP AusNet United Energy
2.7 4.3 0.6 1.9 1.4
Source: AER analysis.
L.4.6 Customer communications
Communication to customers during outage events
Jemena, SP AusNet and United Energy forecast new costs of $4.2 million139 ($2010), $3.0 million140 ($2010) and $3.3 million141 ($2010) respectively on communication to customers during outage events in the forthcoming regulatory control period.142
Jemena and United Energy stated that the ESCV had released a draft decision relating to Electricity Distributors’ Communications in Extreme Supply Events and that their projects sought to meet the requirements detailed in that report.143 For example, United Energy stated that the ESCV draft decision required it to ‘write to customers in October each year informing them of the distributors’ role and their contact details, including their website address’.144 Jemena similarly noted that it was required to write to customers but also noted it was required to upgrade its technology to allow it to short message service (SMS) customers with pertinent network information.145
SP AusNet stated that its proposal would enhance its information technology by allowing it to SMS customers with information related to planned outage events, unplanned outages, load shedding events and extreme events.146
Submissions
The Victorian Employers Chamber of Commerce and Industry (VECCI), albeit with reference to Critical Peak Pricing (CPP) signals and the recent Victorian bushfires, noted that:
… although it is possible to communicate via existing systems, the [SMS] message may lead to unanticipated or unsafe responses… VECCI submits that, until cost effective mass communication protocols can be established and tested, it is not reasonable to expect customers to be able to receive CPP
139 Jemena, response to information requested on 11 February 2010, confidential, submitted on
22 February 2010. The AER notes that subsequent to the lodgement of its regulatory proposal Jemena submitted a revised estimate for this project of $4.6 million ($2009). Jemena, response to information requested on 22 January 2010, confidential, submitted on 26 February 2010.
140 SP AusNet, Regulatory proposal, p. 225. 141 United Energy, Regulatory proposal, p. 7. 142 Jemena’s estimate for this project does not account for scale and growth increases or input cost
escalations. 143 United Energy, Regulatory proposal, p. 68;and Jemena, Regulatory proposal, Appendix 10
(Confidential), pp. 38–40. 144 United Energy, Regulatory proposal, p. 21. 145 Jemena, response to information requested on 22 January 2010, confidential, submitted on
25 February 2010, p. 4. 146 SP AusNet, Regulatory proposal, p. 225.
198 VICTORIAN DRAFT DISTRIBUTION DETERMINATION—DRAFT DECISION
signals reliably, let alone be sufficiently informed to act on the content of that communication. 147
AER considerations
The AER notes that the ESCV’s final decision on Electricity Distributors’ Communications in Extreme Supply Events places obligations in the relevant ESCV codes to (amongst other things):
… require the distributors to provide customers with more accessible information through information on their websites and sending letters to their customers annually, prior to summer…148
The AER also notes that the ESCV noted that ‘the amendments will be finalised by early March 2010 and will take effect from 1 April 2010’.149
The AER recognises that the Electricity Distribution Code (EDC) will be amended to require Victorian DNSPs to write to their customers in October each year to inform them of the DNSPs’ role and to provide customers with their contact details, including their website address, early in 2010.150 The AER notes that at the time of writing this draft decision, the amendment to the EDC had not commenced. Nonetheless, the AER considers that it is sufficiently confident that it will commence and that some Victorian DNSPs may experience a consequent step change in costs.
The AER does not, however, consider that there is sufficient certainty regarding an obligation for the Victorian DNSPs to communicate with customers via SMS. The AER notes that the ESCV’s draft decision on communication in extreme supply events discussed SMS but did not mandate its use.151 Specifically, the AER notes that the ESCV’s draft decision:
noted that most DNSPs were trialling, or planning to implement, new technologies to notify customers about outages, including the use of SMS
determined that further initiatives should not be proposed at this time. 152
The AER also notes the broader concerns raised by VECCI with respect to mass communication, those being that:
the implementation of a SMS communication scheme may lead to unanticipated or unsafe responses
the cost effectiveness of mass communication protocols needs to be tested. 153 147 VECCI, Submission to the Australian Energy Regulator on the Victorian electricity distribution
service providers’ proposals for the 2011–2015 regulatory period, February 2010, pp. 9–10. 148 ESCV, Final decision, Electricity distributors’ communication in extreme supply events,
December 2009, Summary, p. 2. 149 ESCV, Final decision, Electricity distributors’ communication in extreme supply events,
December 2009, p. 3. 150 ibid., p. 13. 151 The AER notes that the ESCV’s final decision did note contain any discussion on SMS. 152 ESCV, Draft decision, Electricity distributors’ communication in extreme supply events,
December 2009, p. 19 and 24.
APPENDIX L—OPERATING EXPENDITURE STEP CHANGES 199
In addition, the AER notes that SMS technology may be inaccessible to many customers and relies on mobile telephony which is not used by all customers.
On the basis of its own analysis, the concerns raised by VECCI and material provided by SP AusNet, United Energy and Jemena, the AER is not satisfied that SP AusNet’s regulatory proposal is a step change. Specifically, the AER does not consider that there is a new regulatory obligation or requirement within the EDC that necessitates SP AusNet using SMS to communicate with its customers with respect to information on planned outage events, unplanned outages, load shedding events and extreme events. With respect to Jemena and United Energy, the AER similarly does not consider it reasonable to support the SMS enhancing components of Jemena’s and United Energy’s proposals.154
The AER notes that Jemena provided information on the costs of the sub-components of its proposal that enabled the AER to account for the SMS component of its proposal—this was $2.1 million or 50 per cent of its proposal. United Energy did not provide the AER with a similar break down of costs (despite being requested to do so155); therefore the AER considers that a comparable (50 per cent) amendment should be made to United Energy’s proposal. The AER considers that this is reasonable given the strong similarities between Jemena’s and United Energy’s proposals. The AER has therefore reduced United Energy’s proposal by $1.6 million.
The AER notes that should amendments be made to the EDC (or other regulatory instrument) that require communication with customers through SMS, the Victorian DNSPs may seek the approval of the AER to pass through to distribution network users a positive pass through amount.156
AER conclusion
For the reasons discussed and as a result of the AER’s consideration of United Energy’s and Jemena’s regulatory proposals and other supporting information, the AER is not satisfied that the inclusion of costs associated with upgrades to SMS capability reasonably reflect the opex criteria, including the opex objectives. With respect to United Energy, the estimate the AER is satisfied reasonably reflects the opex criteria is $1.6 million less than that which United Energy proposed. With respect to Jemena, the estimate the AER is satisfied reasonably reflects the opex criteria is $2.1 million less than that which Jemena proposed. In coming to this view, the AER has had regard to the opex factors.
With regard to SP AusNet’s regulatory proposal, for the reasons discussed above and as a result of the AER’s consideration of SP AusNet’s regulatory proposals and other supporting information, the AER is not satisfied that the inclusion of costs associated with its proposal reasonably reflect the opex criteria, including the opex objectives. In coming to this view, the AER has had regard to the opex factors. 153 VECCI, Submission to the Australian Energy Regulator on the Victorian electricity distribution
service providers’ proposals for the 2011–2015 regulatory period, February 2010, pp. 9–10. 154 Jemena, response to information requested on 22 January 2010, confidential, submitted on
26 February 2010. 155 United Energy, response to information requested on 22 January 2010, confidential, submitted on
22 February 2010. 156 NER, clause 6.6.1.
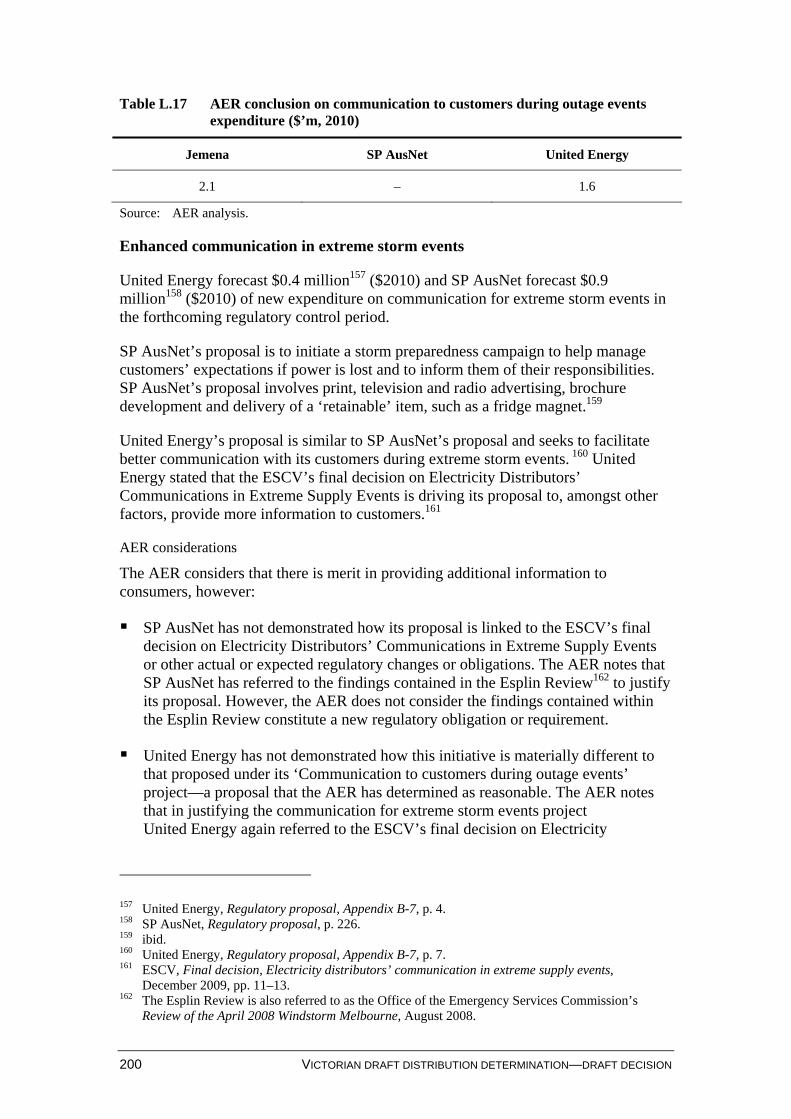
200 VICTORIAN DRAFT DISTRIBUTION DETERMINATION—DRAFT DECISION
Table L.17 AER conclusion on communication to customers during outage events expenditure ($’m, 2010)
Jemena SP AusNet United Energy
2.1 – 1.6
Source: AER analysis.
Enhanced communication in extreme storm events
United Energy forecast $0.4 million157 ($2010) and SP AusNet forecast $0.9 million158 ($2010) of new expenditure on communication for extreme storm events in the forthcoming regulatory control period.
SP AusNet’s proposal is to initiate a storm preparedness campaign to help manage customers’ expectations if power is lost and to inform them of their responsibilities. SP AusNet’s proposal involves print, television and radio advertising, brochure development and delivery of a ‘retainable’ item, such as a fridge magnet.159
United Energy’s proposal is similar to SP AusNet’s proposal and seeks to facilitate better communication with its customers during extreme storm events. 160 United Energy stated that the ESCV’s final decision on Electricity Distributors’ Communications in Extreme Supply Events is driving its proposal to, amongst other factors, provide more information to customers.161
AER considerations
The AER considers that there is merit in providing additional information to consumers, however:
SP AusNet has not demonstrated how its proposal is linked to the ESCV’s final decision on Electricity Distributors’ Communications in Extreme Supply Events or other actual or expected regulatory changes or obligations. The AER notes that SP AusNet has referred to the findings contained in the Esplin Review162 to justify its proposal. However, the AER does not consider the findings contained within the Esplin Review constitute a new regulatory obligation or requirement.
United Energy has not demonstrated how this initiative is materially different to that proposed under its ‘Communication to customers during outage events’ project—a proposal that the AER has determined as reasonable. The AER notes that in justifying the communication for extreme storm events project United Energy again referred to the ESCV’s final decision on Electricity
157 United Energy, Regulatory proposal, Appendix B-7, p. 4. 158 SP AusNet, Regulatory proposal, p. 226. 159 ibid. 160 United Energy, Regulatory proposal, Appendix B-7, p. 7. 161 ESCV, Final decision, Electricity distributors’ communication in extreme supply events,
December 2009, pp. 11–13. 162 The Esplin Review is also referred to as the Office of the Emergency Services Commission’s
Review of the April 2008 Windstorm Melbourne, August 2008.
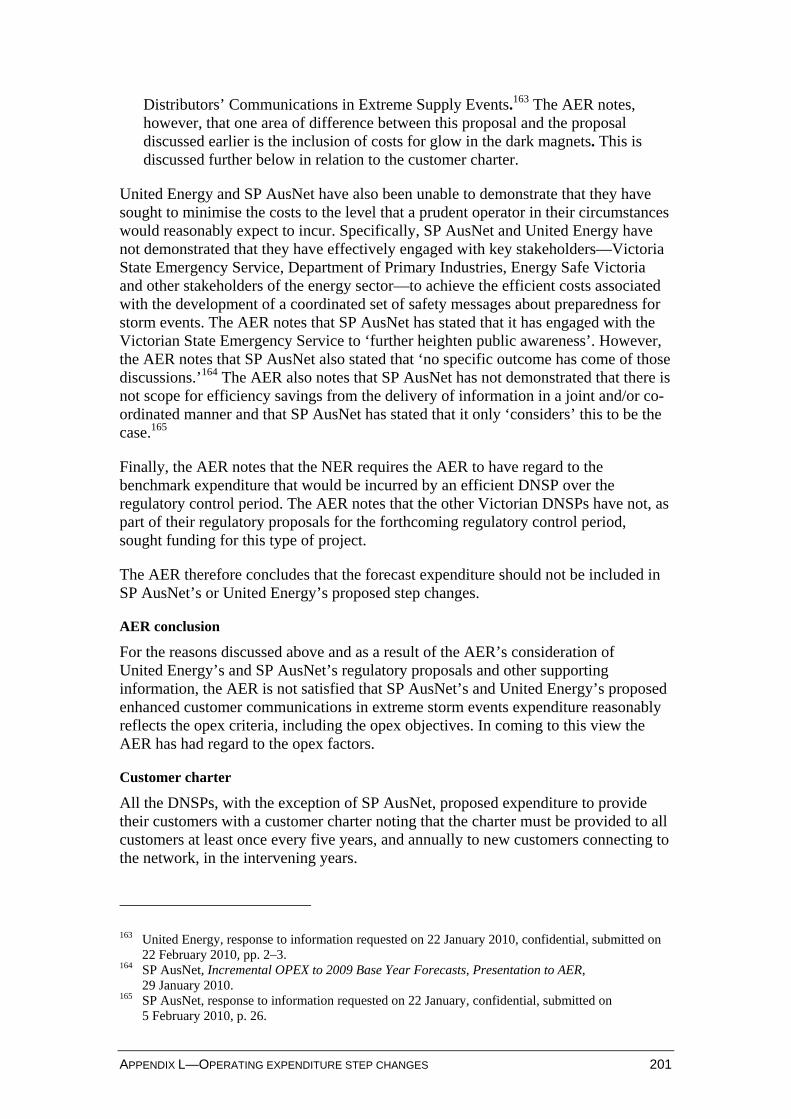
APPENDIX L—OPERATING EXPENDITURE STEP CHANGES 201
Distributors’ Communications in Extreme Supply Events.163 The AER notes, however, that one area of difference between this proposal and the proposal discussed earlier is the inclusion of costs for glow in the dark magnets. This is discussed further below in relation to the customer charter.
United Energy and SP AusNet have also been unable to demonstrate that they have sought to minimise the costs to the level that a prudent operator in their circumstances would reasonably expect to incur. Specifically, SP AusNet and United Energy have not demonstrated that they have effectively engaged with key stakeholders—Victoria State Emergency Service, Department of Primary Industries, Energy Safe Victoria and other stakeholders of the energy sector—to achieve the efficient costs associated with the development of a coordinated set of safety messages about preparedness for storm events. The AER notes that SP AusNet has stated that it has engaged with the Victorian State Emergency Service to ‘further heighten public awareness’. However, the AER notes that SP AusNet also stated that ‘no specific outcome has come of those discussions.’164 The AER also notes that SP AusNet has not demonstrated that there is not scope for efficiency savings from the delivery of information in a joint and/or co-ordinated manner and that SP AusNet has stated that it only ‘considers’ this to be the case.165
Finally, the AER notes that the NER requires the AER to have regard to the benchmark expenditure that would be incurred by an efficient DNSP over the regulatory control period. The AER notes that the other Victorian DNSPs have not, as part of their regulatory proposals for the forthcoming regulatory control period, sought funding for this type of project.
The AER therefore concludes that the forecast expenditure should not be included in SP AusNet’s or United Energy’s proposed step changes.
AER conclusion
For the reasons discussed above and as a result of the AER’s consideration of United Energy’s and SP AusNet’s regulatory proposals and other supporting information, the AER is not satisfied that SP AusNet’s and United Energy’s proposed enhanced customer communications in extreme storm events expenditure reasonably reflects the opex criteria, including the opex objectives. In coming to this view the AER has had regard to the opex factors.
Customer charter
All the DNSPs, with the exception of SP AusNet, proposed expenditure to provide their customers with a customer charter noting that the charter must be provided to all customers at least once every five years, and annually to new customers connecting to the network, in the intervening years.
163 United Energy, response to information requested on 22 January 2010, confidential, submitted on
22 February 2010, pp. 2–3. 164 SP AusNet, Incremental OPEX to 2009 Base Year Forecasts, Presentation to AER,
29 January 2010. 165 SP AusNet, response to information requested on 22 January, confidential, submitted on
5 February 2010, p. 26.
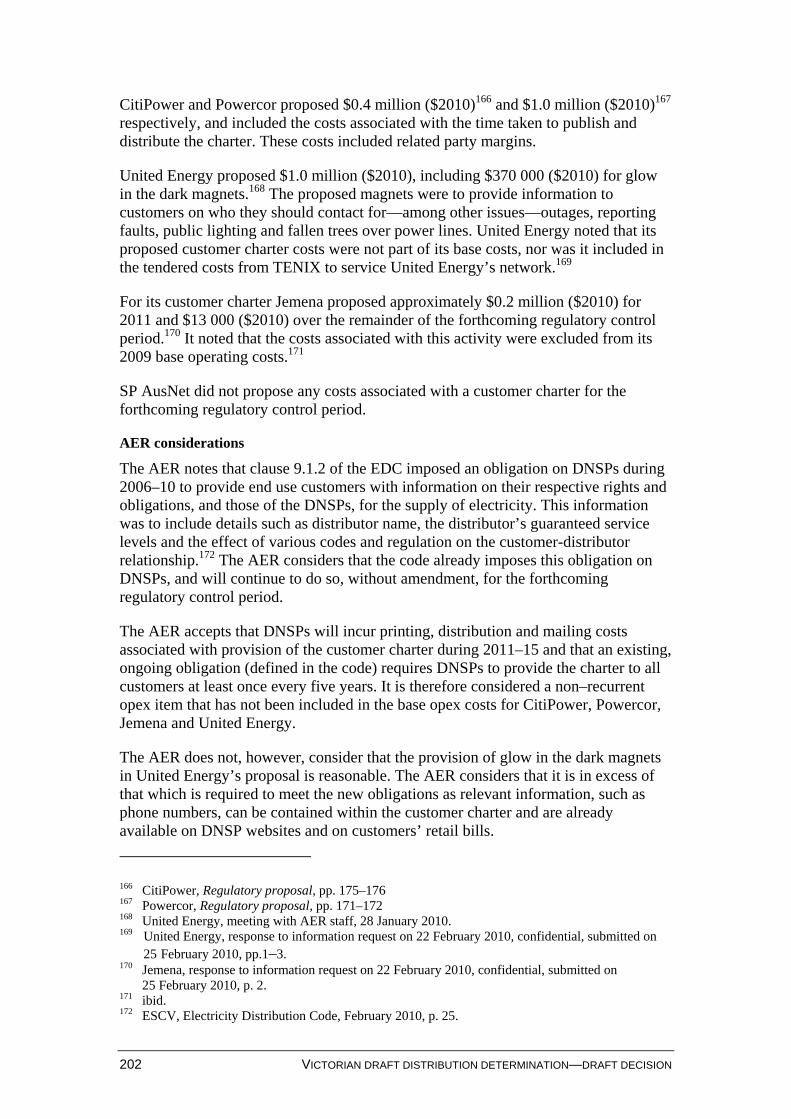
202 VICTORIAN DRAFT DISTRIBUTION DETERMINATION—DRAFT DECISION
CitiPower and Powercor proposed $0.4 million ($2010)166 and $1.0 million ($2010)167 respectively, and included the costs associated with the time taken to publish and distribute the charter. These costs included related party margins.
United Energy proposed $1.0 million ($2010), including $370 000 ($2010) for glow in the dark magnets.168 The proposed magnets were to provide information to customers on who they should contact for—among other issues—outages, reporting faults, public lighting and fallen trees over power lines. United Energy noted that its proposed customer charter costs were not part of its base costs, nor was it included in the tendered costs from TENIX to service United Energy’s network.169
For its customer charter Jemena proposed approximately $0.2 million ($2010) for 2011 and $13 000 ($2010) over the remainder of the forthcoming regulatory control period.170 It noted that the costs associated with this activity were excluded from its 2009 base operating costs.171
SP AusNet did not propose any costs associated with a customer charter for the forthcoming regulatory control period.
AER considerations
The AER notes that clause 9.1.2 of the EDC imposed an obligation on DNSPs during 2006–10 to provide end use customers with information on their respective rights and obligations, and those of the DNSPs, for the supply of electricity. This information was to include details such as distributor name, the distributor’s guaranteed service levels and the effect of various codes and regulation on the customer-distributor relationship.172 The AER considers that the code already imposes this obligation on DNSPs, and will continue to do so, without amendment, for the forthcoming regulatory control period.
The AER accepts that DNSPs will incur printing, distribution and mailing costs associated with provision of the customer charter during 2011–15 and that an existing, ongoing obligation (defined in the code) requires DNSPs to provide the charter to all customers at least once every five years. It is therefore considered a non–recurrent opex item that has not been included in the base opex costs for CitiPower, Powercor, Jemena and United Energy.
The AER does not, however, consider that the provision of glow in the dark magnets in United Energy’s proposal is reasonable. The AER considers that it is in excess of that which is required to meet the new obligations as relevant information, such as phone numbers, can be contained within the customer charter and are already available on DNSP websites and on customers’ retail bills.
166 CitiPower, Regulatory proposal, pp. 175–176 167 Powercor, Regulatory proposal, pp. 171–172 168 United Energy, meeting with AER staff, 28 January 2010. 169 United Energy, response to information request on 22 February 2010, confidential, submitted on
25 February 2010, pp.1–3. 170 Jemena, response to information request on 22 February 2010, confidential, submitted on
25 February 2010, p. 2. 171 ibid. 172 ESCV, Electricity Distribution Code, February 2010, p. 25.
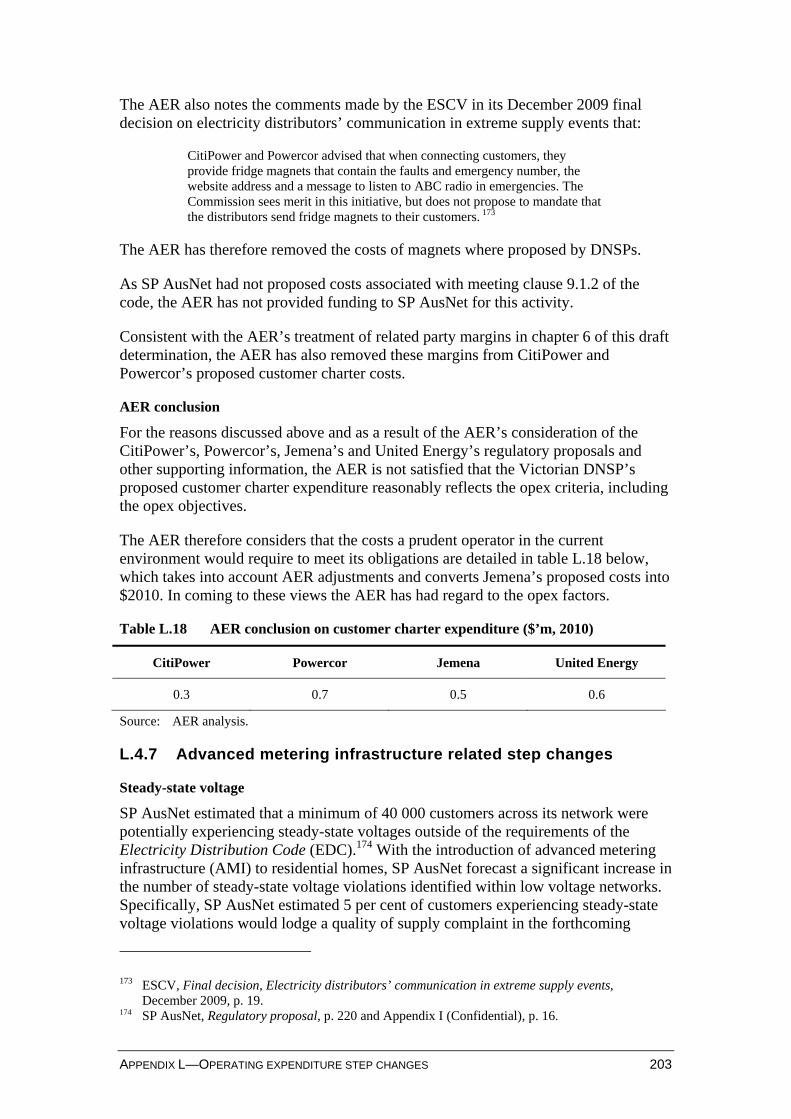
APPENDIX L—OPERATING EXPENDITURE STEP CHANGES 203
The AER also notes the comments made by the ESCV in its December 2009 final decision on electricity distributors’ communication in extreme supply events that:
CitiPower and Powercor advised that when connecting customers, they provide fridge magnets that contain the faults and emergency number, the website address and a message to listen to ABC radio in emergencies. The Commission sees merit in this initiative, but does not propose to mandate that the distributors send fridge magnets to their customers. 173
The AER has therefore removed the costs of magnets where proposed by DNSPs.
As SP AusNet had not proposed costs associated with meeting clause 9.1.2 of the code, the AER has not provided funding to SP AusNet for this activity.
Consistent with the AER’s treatment of related party margins in chapter 6 of this draft determination, the AER has also removed these margins from CitiPower and Powercor’s proposed customer charter costs.
AER conclusion
For the reasons discussed above and as a result of the AER’s consideration of the CitiPower’s, Powercor’s, Jemena’s and United Energy’s regulatory proposals and other supporting information, the AER is not satisfied that the Victorian DNSP’s proposed customer charter expenditure reasonably reflects the opex criteria, including the opex objectives.
The AER therefore considers that the costs a prudent operator in the current environment would require to meet its obligations are detailed in table L.18 below, which takes into account AER adjustments and converts Jemena’s proposed costs into $2010. In coming to these views the AER has had regard to the opex factors.
Table L.18 AER conclusion on customer charter expenditure ($’m, 2010)
CitiPower Powercor Jemena United Energy
0.3 0.7 0.5 0.6
Source: AER analysis.
L.4.7 Advanced metering infrastructure related step changes
Steady-state voltage
SP AusNet estimated that a minimum of 40 000 customers across its network were potentially experiencing steady-state voltages outside of the requirements of the Electricity Distribution Code (EDC).174 With the introduction of advanced metering infrastructure (AMI) to residential homes, SP AusNet forecast a significant increase in the number of steady-state voltage violations identified within low voltage networks. Specifically, SP AusNet estimated 5 per cent of customers experiencing steady-state voltage violations would lodge a quality of supply complaint in the forthcoming
173 ESCV, Final decision, Electricity distributors’ communication in extreme supply events,
December 2009, p. 19. 174 SP AusNet, Regulatory proposal, p. 220 and Appendix I (Confidential), p. 16.
204 VICTORIAN DRAFT DISTRIBUTION DETERMINATION—DRAFT DECISION
regulatory control period (an increase from 330 to 2330 complaints).175 SP AusNet proposed $5.4 million ($2010) to investigate these additional complaints.176
Similarly, Jemena and United Energy estimated that a significant number of customers within their networks were experiencing voltage violations outside of the levels provided in the EDC. Jemena and United Energy proposed a proactive approach to resolve steady-state violations. For example, United Energy stated that:
With AMI in place, UED will no longer be ignorant of these issues and will therefore have an obligation to proactively correct identified problems.177
Jemena and United Energy’s proposed step change to rectify steady-state voltage violations amounted to $0.6 million ($2010) and $1.0 million ($2010) respectively.178
AER considerations
The rationale provided for the proposed quality of supply step change can be separated into two distinct arguments. Specifically:
Jemena and United Energy claim that as quality of supply data becomes available following the roll-out of AMI, they are compelled to take a proactive approach to rectifying steady-state voltage violations; and
SP AusNet considers that once customers realise that quality of supply data is available, there will be a marked increase in the number of complaints, and ensuing investigations.
In response to Jemena and United Energy’s claims, the AER notes that this represents a departure from current practices. At present, both distributors are aware of the significant number of customers experiencing quality of supply variations. According to the results of the Long Term National Power Quality Survey conducted by the University of Wollongong, of which both Jemena and United Energy were participants, the level of LV monitored sites with higher than the notional limit of voltage variations is above 20 per cent. However, both distributors only address customer power quality issues based on a reactive approach, triggered by customer complaints.179
Notionally, it would appear that it is not efficient to resolve every power quality issue throughout the network. It also appears that the severity of the majority of steady-state voltage violations is minimal, as noted by United Energy:
175 SP AusNet, Regulatory proposal, p. 220 and Appendix I (Confidential), p. 16. 176 ibid. 177 United Energy, response to information requested on 22 January 2010, confidential, submitted on
16 February 2010. 178 Jemena, Regulatory Proposal: Appendix 10 – Jemena Electricity Networks (Vic) Ltd – Capital and
Operational Work Plan (COWP) 2010–15 (Confidential), 30 November 2009, p. 48; United Energy, Regulatory proposal, Appendix B-7, p. 4.
179 Jemena, response to information requested on 22 January 2010, confidential, submitted on 22 February 2010; United Energy, response to information requested on 22 January 2010, confidential, submitted on 16 February 2010.
APPENDIX L—OPERATING EXPENDITURE STEP CHANGES 205
It is believed that customers only complain about voltage excursions if the voltage delivered is well outside code limits, as most appliances are likely to continue to operate without any discernable impact if violations are relatively small. Because of this, it is very likely the number of identified sites exceeding code limits in an AMI environment will be orders of magnitude greater than the number of customer complaints currently being received by UED relating to steady state voltage.180
The AER considers that a reasonable inference from the above comment is that United Energy’s current approach to rectifying steady-state violations is one that is consistent with practicable compliance (as opposed to literal) with the EDC. On this basis, and given that there has been no change in the actual requirements of the EDC regarding quality of supply issues, the AER considers the step change is not consistent with the approach likely to be taken by a prudent and efficient service provider.
The AER also considers that SP AusNet’s claim does not reflect expenditure that a prudent and efficient service provider would incur. Primarily, no tangible evidence has been supplied to support expectations of an increased level of customer complaints.
As noted previously, customers typically only enquire about their power quality when the voltage delivered is well outside EDC limits. The introduction of AMI is not expected to have a detrimental impact on the quality of supply provided and subsequently, SP AusNet’s submission of a 600 per cent increase in customer complaints appears unfounded.181
AER conclusion
For the reasons discussed above, and as a result of the AER’s consideration of the DNSPs’ regulatory proposals and other supporting information, the AER is not satisfied that the proposed opex step change for voltage violations reasonably reflects the opex criteria, including the opex objectives. In coming to this view the AER has had regard to the opex factors.
AMI data analysis
Jemena and United Energy also proposed a step change for increased expenditure resulting from the implementation of AMI in the forthcoming regulatory control period. Jemena proposed $0.9 million ($2010) to perform data analysis and conduct trials of other functions in AMI meters to deliver better customer service.182 United Energy proposed $1.4 million ($2010) for leveraging AMI to improve network management.183
180 United Energy, response to information requested on 22 January 2010, confidential, submitted on
16 February 2010. 181 SP AusNet estimates that currently, 40 000 customers are experiencing steady-state voltages
outside of Code limits. In 2009, SP AusNet received 330 voltage complaints, while in 2011, SP AusNet have forecast this number to increase by 2000 customers
182 Jemena, Regulatory Proposal: Appendix 10, p. 40. 183 United Energy, Regulatory Proposal: Appendix B-7, p. 5, pp. 16–17.
206 VICTORIAN DRAFT DISTRIBUTION DETERMINATION—DRAFT DECISION
The expenditure proposed by Jemena and United Energy to analyse and test AMI data was therefore in addition to that provided for in the AER’s 2009 final determination for the Victorian AMI review.
AER considerations
The AER does not consider that these proposals are step changes because Jemena and United Energy have not been able to demonstrate to the AER’s satisfaction that they are linked to a new or changed regulatory obligation or requirement. While the AMI Order in Council (OIC) imposes regulatory obligations that require the Victorian DNSPs to, among other things, install smart meters throughout Victoria, these proposed step changes are for activities which are not within the scope of obligations set out in Schedule 2.1 of the OIC.184 Jemena and United Energy have both acknowledged that their proposals are beyond the scope of the OIC.185
The AER notes that all activities covered by Schedule 2.1 of the OIC were previously considered as part of the AER’s final determination for the Victorian AMI review.186
The AER further notes that Jemena and United Energy have not identified any defined outputs from the proposed additional analysis and trialling. As a result, it is unclear how these expenditures reflect the efficient cost of achieving the opex objectives when they are additional to the current base expenditure and provide no defined benefits to customers.
Further, the AER recognises that these proposals may be of benefit to Jemena and United Energy by allowing them to identify and subsequently implement business efficiencies and reduce ongoing costs. Notwithstanding this, Jemena and United Energy did not identify any such efficiencies in their regulatory proposals. However, the regulatory framework provides incentives for DNSPs to pursue such efficiencies, funded through self financing arrangements, and retain the benefits for a period consistent with the EBSS. The benefits of those efficiencies are shared with customers over time.
The AER therefore does not consider it appropriate for Jemena’s and United Energy’s AMI-related proposals to be considered as step changes.
AER conclusion
For the reasons discussed above and as a result of the AER’s consideration of Jemena and United Energy’s regulatory proposals and other supporting information, the AER is not satisfied that the proposed opex step changes discussed above reasonably reflect the opex criteria, including the opex objectives. In coming to this view the AER has had regard to the opex factors.
184 See Victoria Government Gazette No. S 314, Advanced Metering Infrastructure Order in Council
2008, 25 November 2008, p. 25. 185 Jemena, Response to information requested on 22 January 2010, confidential, submitted on
25 February 2010; United Energy, Response to information requested on 22 January 2010, confidential, submitted on 3 February 2010.
186 AER, Final Determination: Victorian Advanced Metering Infrastructure review - 2009–11 AMI budget and charges applications, October 2009.
APPENDIX L—OPERATING EXPENDITURE STEP CHANGES 207
L.4.8 Regulatory submission costs
Jemena proposed a step change of $3.4 million ($2010) for the preparation and submission of its 2016–2020 regulatory proposal.187 Jemena noted that this expenditure was not provided for in its base costs and that it would be required in the fourth and fifth year of the forthcoming regulatory control period. The AER notes that none of the other DNSPs have proposed regulatory submission costs as a step change for the forthcoming regulatory control period.
The AER notes that under clause 6.8.2 of the NER, DNSPs are required to submit a regulatory proposal prior to the expiration of the current distribution determination.188 The AER considers that this is not a new or changed regulatory obligation but that it is a specific regulatory obligation that will be incurred by all Victorian DNSPs in the forthcoming regulatory control period.
The AER also notes that, in general, the costs for preparing a regulatory submission can be significant, particularly over the last two years of a regulatory control period. The AER considers that where a DNSP uses either of these years as a base year for the preparation of their regulatory submission, an adjustment should be made to remove these increased costs from the base year as they are not usually expected to be incurred in every year of a regulatory control period.
The AER also considers that Jemena, in managing this regulatory obligation and the anomaly of a fluctuation of related costs in their base year opex, have demonstrated to the AER’s satisfaction that Jemena’s regulatory submission costs have been removed from its base year opex and it will incur these costs in the forthcoming regulatory control period as a step change.
The AER notes that the basis for Jemena’s regulatory submission costs in the forthcoming regulatory control period was the costs to prepare its regulatory submission in the current regulatory control period, adjusted for escalation. The AER considers the expenditure proposed by Jemena is reasonable and that of a prudent and efficient DNSP. The AER therefore considers that in meeting the requirements under clause 6.8.2 of the NER the expenditure proposed should be included in Jemena’s proposed opex step change forecasts.
The AER also considers that where significant increases exist in a DNSP’s base year opex, due to regulatory submission costs, the appropriate treatment should be to remove these costs from the base year and provide them as a step change for the forthcoming regulatory control period. Where the AER has identified this in the Victorian DNSPs regulatory proposals, it has applied this approach.
The AER notes that it requested the Victorian DNSPs to provide their regulatory submission costs for the current regulatory control period. The AER further notes that in determining the Victorian DNSPs’ regulatory submission costs for the forthcoming regulatory control period it has taken their respective current regulatory control period regulatory submission costs and adjusted these forward. These costs were then 187 Jemena, Regulatory Proposal: Appendix 10 – Jemena Electricity Networks (Vic) Ltd – Capital and
Operational Work Plan (COWP) 2010–15 (Confidential), 30 November 2009, pp. 58–59. 188 NER, cl. 6.8.2(a).
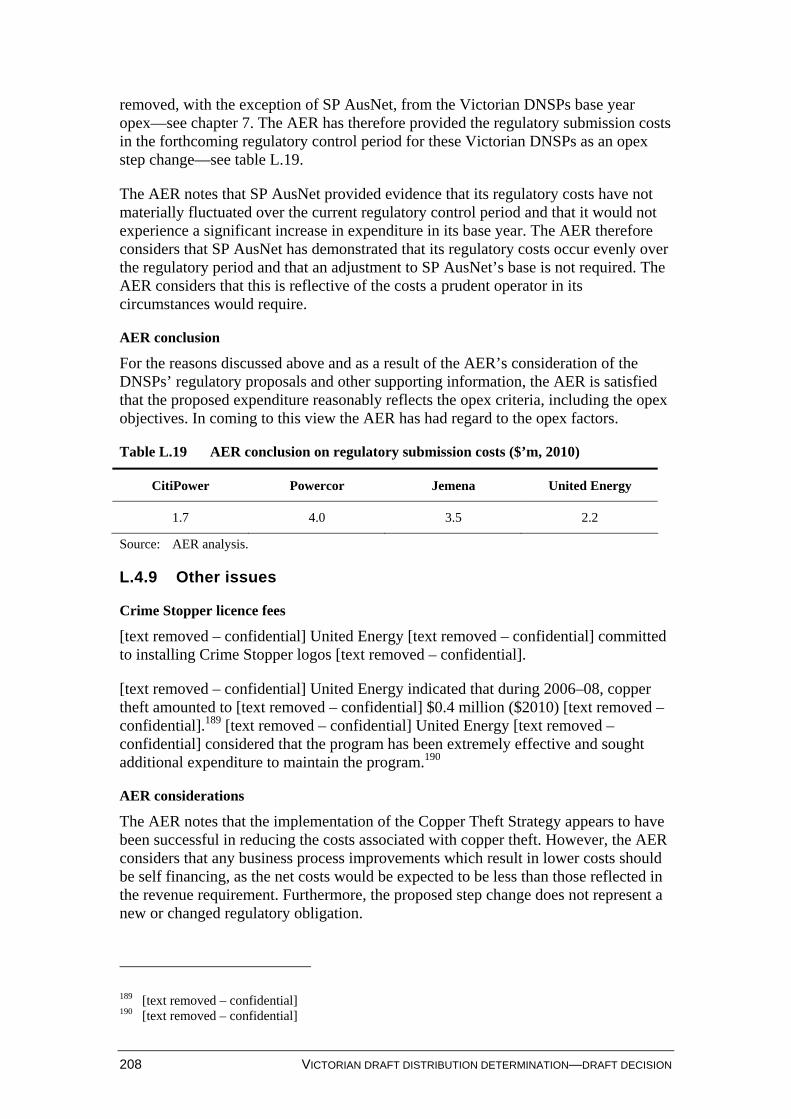
208 VICTORIAN DRAFT DISTRIBUTION DETERMINATION—DRAFT DECISION
removed, with the exception of SP AusNet, from the Victorian DNSPs base year opex—see chapter 7. The AER has therefore provided the regulatory submission costs in the forthcoming regulatory control period for these Victorian DNSPs as an opex step change—see table L.19.
The AER notes that SP AusNet provided evidence that its regulatory costs have not materially fluctuated over the current regulatory control period and that it would not experience a significant increase in expenditure in its base year. The AER therefore considers that SP AusNet has demonstrated that its regulatory costs occur evenly over the regulatory period and that an adjustment to SP AusNet’s base is not required. The AER considers that this is reflective of the costs a prudent operator in its circumstances would require.
AER conclusion
For the reasons discussed above and as a result of the AER’s consideration of the DNSPs’ regulatory proposals and other supporting information, the AER is satisfied that the proposed expenditure reasonably reflects the opex criteria, including the opex objectives. In coming to this view the AER has had regard to the opex factors.
Table L.19 AER conclusion on regulatory submission costs ($’m, 2010)
CitiPower Powercor Jemena United Energy
1.7 4.0 3.5 2.2
Source: AER analysis.
L.4.9 Other issues
Crime Stopper licence fees
[text removed – confidential] United Energy [text removed – confidential] committed to installing Crime Stopper logos [text removed – confidential].
[text removed – confidential] United Energy indicated that during 2006–08, copper theft amounted to [text removed – confidential] $0.4 million ($2010) [text removed – confidential].189 [text removed – confidential] United Energy [text removed – confidential] considered that the program has been extremely effective and sought additional expenditure to maintain the program.190
AER considerations
The AER notes that the implementation of the Copper Theft Strategy appears to have been successful in reducing the costs associated with copper theft. However, the AER considers that any business process improvements which result in lower costs should be self financing, as the net costs would be expected to be less than those reflected in the revenue requirement. Furthermore, the proposed step change does not represent a new or changed regulatory obligation.
189 [text removed – confidential] 190 [text removed – confidential]
APPENDIX L—OPERATING EXPENDITURE STEP CHANGES 209
AER conclusion
For the reasons discussed above, and as a result of the AER’s consideration of [text removed – confidential] United Energy’s regulatory proposals and other supporting information, the AER is not satisfied that the proposed opex step change for Crime Stopper logos reasonably reflects the opex criteria, including the opex objectives. In coming to this view the AER has had regard to the opex factors.
Earth testing non-CMEN areas
Regulation 27(2) of the Electrical Safety (Network Assets) Regulations 1999 requires that earthing systems, except common multiple earthed neutral (CMEN) earthing systems, be inspected and tested at least every 10 years for compliance with regulation 23.
Jemena and United Energy claim that their focus throughout the previous 10 year period has been the installation of CMEN systems in urban areas. Consequently, through this period no earth testing of HV structures was conducted.191 The proposed step change, $0.6 million ($2010) for Jemena and $2.5 million ($2010) for United Energy, reflects expenditure required to earth test non-CMEN areas.192
AER considerations
The AER considers that the proposed step changes do not represent a new or changed regulatory obligation. The Victorian DNSPs have had a legal obligation to comply with these Regulations since 1999.
Additionally, the AER notes that the 2006–10 EDPR provided an allowance for additional capex and/or opex so as to enable compliance with a number of regulations including that associated with regulation 27. The AER notes that the ESCV stated that:
[t]he step changes in operating expenditure proposed by the distributors to improve compliance with these inspection and testing requirements appears reasonable.193
The AER further considers that the significant underspend in operating expenditure over the previous and current regulatory periods highlights that both Jemena and United Energy have had the financial capacity to respond to these obligations.
AER conclusion
For the reasons discussed above, and as a result of the AER’s consideration of both Jemena and United Energy’s regulatory proposals and other supporting information, the AER is not satisfied that the proposed opex step change to earth test non-CMEN 191 Jemena, response to information requested on 22 January 2010, confidential, submitted on 5
February 2010; United Energy, response to information requested on 22 January 2010, confidential, submitted on 8 February 2010.
192 Jemena, Regulatory Proposal: Appendix 10 – Jemena Electricity Networks (Vic) Ltd – Capital and Operational Work Plan (COWP) 2010–15 (Confidential), 30 November 2009, p. 49; United Energy, Regulatory proposal, Appendix B-7, p. 6.
193 ESCV, Electricity Distribution Price Review 2006–10, October 2005 Price Determination as amended in accordance with a decision of the Appeal Panel dated 17 February 2006, Final Decision Volume 1, Statement of Purpose and Reasons, October 2006, p. 222.
210 VICTORIAN DRAFT DISTRIBUTION DETERMINATION—DRAFT DECISION
areas reasonably reflects the opex criteria, including the opex objectives. In coming to this view the AER has had regard to the opex factors.
Static Guard Patrol
[text removed – confidential] United Energy proposed $0.1 million ($2010) for static guard/patrol expenditure194 but appeared to confuse it with protection setting review.195
The AER notes that following an information request, United Energy [text removed – confidential] modified their proposed step changes [text removed – confidential].196
AER considerations
The AER does not consider that these proposals are step changes as [text removed – confidential] United Energy [text removed – confidential] have not been able to demonstrate that they are linked to a new or changed regulatory obligation or requirement. The AER considers that the protection of assets from vandalism and theft is standard operating procedure for a prudent and efficient network operator. [text removed – confidential] United Energy [text removed – confidential] have been unable to demonstrate to the AER’s satisfaction that there will be any significant change in their operating environments due to an increase in either theft or vandalism to warrant a step change.
The AER therefore considers that this proposal should already be part of [text removed – confidential] United Energy’s normal ongoing operational expenditure and that it is not reasonable for this proposal to be included in [text removed – confidential] United Energy’s proposed step changes.
AER conclusion
For the reasons discussed above and as a result of the AER’s consideration of [text removed – confidential] United Energy’s regulatory proposals and other supporting information, the AER is not satisfied that the proposed opex step change discussed above reasonably reflects the opex criteria, including the opex objectives. In coming to this view the AER has had regard to the opex factors.
L.4.10 Additional step changes proposed CitiPower
CitiPower proposed one additional specific step change which is discussed below.
West Melbourne terminal station
CitiPower sought funding to enter into commercial agreements with one or more demand side management proponents to help curtail the load in the area supplied by the West Melbourne terminal station (WMTS).197
194 United Energy, Regulatory Proposal: Appendix B-7, p. 6. 195 ibid., p. 20. 196 [text removed – confidential] United Energy, Response to information requested on 22 January
2010, confidential, submitted on 22 February 2010.
APPENDIX L—OPERATING EXPENDITURE STEP CHANGES 211
CitiPower noted that this project:
was required as WMTS was facing the likelihood of peak demand exceeding its ‘N’ capacity rating
was an interim measure, required only for 2011–13, and that completion of the Metro 2012 project in late 2013 would help it reduce the energy at risk at WMTS.198
Consultant review
The AER engaged Nuttall Consulting to assist with its review of this proposed step change. Nuttall Consulting noted that CitiPower had only provided the details of one demand service provider offer from the demand side service providers identified in their regulatory proposal.199 Nuttall Consulting also determined, through discussions with CitiPower staff, that no contract for these services was in place for the 2009–10 summer period and that the risk was managed through the use of voltage reduction.200
Nuttall Consulting also noted that CitiPower’s 2009 Transmission Connection Planning Report identified four options for managing the contingent risks at WMTS until the Metro 2012 project was complete. These options included:
a contingency plan for the transfer of load to adjacent substations
a contingency plan to utilise the capacity of the ‘Normal Open’ 220/66 kV transformer
demand reduction, which was noted as an opportunity to develop a number of innovative customer schemes to encourage voluntary demand reduction during times of network constraint
embedded generation in the order of about 150 MVA, which would help to defer the need for augmentation. 201
Nuttall Consulting considered that CitiPower had not considered that any of the other options outlined above could be used to address the energy at risk. It noted that given the size of the proposed expenditure, it would have been prudent if the costs and benefits of the other projects had been considered.202
Nuttall Consulting concluded by noting that:
demand management was not the only prudent alternative or the most efficient alternative for addressing the contingent risks at WMTS
197 CitiPower considered this material to be confidential as its forecasts were based on discussions it
had undertaken to date with various demand side management proponents. CitiPower, Regulatory proposal, pp. 177–178.
198 CitiPower, Regulatory proposal, pp. 177–178. 199 Nuttall Consulting, Victorian Electricity Distribution Revenue Review, March 2010, pp. 275–276. 200 ibid., pp. 275–276. 201 ibid. 202 ibid.
212 VICTORIAN DRAFT DISTRIBUTION DETERMINATION—DRAFT DECISION
the proposed expenditure was not supported by the information provided by CitiPower.203
AER considerations
The AER notes that the load forecasts for WMTS identify an emerging network constraint and that a response will be required by CitiPower to avoid the loss of supply and minimise the load at risk.
The AER also notes that the 2009 Transmission Connection Planning Report identified four options for managing the contingent risks at WMTS and that Nuttall Consulting concluded that it would have been prudent if the costs and benefits of these options had been considered. The AER agrees with Nuttall Consulting and therefore considers that CitiPower’s options analysis was incomplete and that it has failed to reasonably demonstrate the efficiency of the chosen option over the alternatives. The AER considers that this is a significant shortcoming, indicating that the efficiency of CitiPower’s approach cannot be ascertained with any certainty.
The AER also agrees with Nuttall Consulting that there are a number of other aspects of CitiPower’s proposal that also do not support the proposed expenditure, particularly:
demand management costs only being provided by one demand management supplier
the expected reduction in demand by demand management of 10MVA for 2009–10 not being contracted for.
AER conclusion
Based on documentation provided by CitiPower, Nuttall Consulting and the AER’s own analysis, the AER is therefore not satisfied that CitiPower’s proposed expenditure for this proposal reasonably reflects the efficient costs a prudent operator in the circumstances of CitiPower would require to achieve the opex objectives. The AER agrees with Nuttall Consulting that the proposed expenditure is not supported and has therefore removed this proposed step change from CitiPower’s opex allowance. In coming to this view the AER has had regard to the opex factors.
L.4.11 Additional step changes proposed by Jemena
Jemena proposed a number of additional specific step changes.204 These step changes totalled $7.1 million ($2010) and are discussed below.
Wire alert neutral condition monitors—forecast $1.7 million ($2010) to pilot neutral condition monitoring equipment. The proposed pilot would test the effectiveness of these devices in addressing neutral problems.205
203 ibid. 204 Jemena, Regulatory Proposal: Appendix 10 – Jemena Electricity Networks (Vic) Ltd – Capital and
Operational Work Plan (COWP) 2010–15 (Confidential), 30 November 2009, p. 48. 205 Open circuit service neutrals upstream of the Multiple Earth Neutral point in a household can result
in voltages appearing on all earthed metalwork within that installation. This can, for example,
APPENDIX L—OPERATING EXPENDITURE STEP CHANGES 213
[text removed – confidential] 206
Transformer noise tests at zone substations—forecast $0.1 million ($2010) to undertake a program of noise testing of Jemena zone substations to proactively identify sites that exceeded the EPA SEPP–1 limits. Identification would enable Jemena to identify non-compliant sites and plan to address those concerns.207
Zone substation ladder inspection—forecast $17 000 ($2010) to establish an annual inspection of portable ladders stored at zone substations to ensure safe working environment and ongoing compliance with occupational health and safety regulations relating to working at heights.208
Zone substation fall arrest inspection—forecast $6 000 ($2010) to ensure ongoing compliance with occupational health and safety regulations relating to working at heights. 209 The proposal involved implementing a new program of annual inspections, to be carried out by external contractors, of all fall arrest equipment installed on zone substation plant, equipment and buildings.
Non pole DS routine maintenance—forecast $0.6 million ($2010) to implement a preventative inspection program based on a new substation inspection manual for in kiosk and indoor substations. The proposed program included thermal scanning of the substation plant, gathering of equipment data and the inspection and assessment of substation plant. Currently, inspections occur on an opportunistic basis.210
Overhead mounted switchgear inspection & maintenance—forecast $1.1 million ($2010) to establish a new targeted program of inspection of HV air break switches and disconnectors on a five-yearly cycle. Currently overhead switchgear are maintained following defect reports from the field and based on ground line inspections.211
Distribution substation cleaning, gardening and security—forecast $1.0 million ($2010) for a preventative maintenance program to ensure that substations and easements are appropriately maintained and that defects are identified and corrected in a timely manner. Prior to 2009, maintenance was conducted on a
include plumbing and gas systems and associated appliances that are either directly or indirectly connected to the installations earthing system. Jemena, Regulatory Proposal: Appendix 10 – Jemena Electricity Networks (Vic) Ltd – Capital and Operational Work Plan (COWP) 2010–15 (Confidential), 30 November 2009, pp. 49–50.
206 ibid., p. 52; and Jemena, response to information requested on 22 January 2010, confidential, submitted on 5 February 2010.
207 ibid., p. 51; and Jemena, response to information requested on 22 January 2010, confidential, submitted on 5 February 2010.
208 ibid., p. 52; and Jemena, response to information requested on 22 January 2010, confidential, submitted on 1 March 2010.
209 ibid., p. 51; and Jemena, response to information requested on 22 January 2010, confidential, submitted on 1 March 2010.
210 ibid., p. 52; and Jemena, response to information requested on 22 January 2010, confidential, submitted on 1 March 2010.
211 ibid., p. 53; and Jemena, response to information requested on 22 January 2010, confidential, submitted on 1 March 2010.
214 VICTORIAN DRAFT DISTRIBUTION DETERMINATION—DRAFT DECISION
corrective basis. The maintenance program is also intended to address a number of safety and security issues .212
[text removed – confidential].213
Protection setting review—$0.4 million ($2010) to undertake a comprehensive network-wide protection setting review.214 Jemena noted that a comprehensive review has not been undertaken in the last ten years and that current practice in meeting this obligation was piece-meal protection setting studies undertaken on an annual basis.
Sunshine depot restoration cost—forecast $25 000 ($2010) to restore the Sunshine depot to its move-in state following the termination of the lease and staff moving to new premises in 2011.215
Broadmeadows site relocation—forecast $2.2 million ($2010) for the relocation of staff from several of Jemena’s facilities, including the Broadmeadows facility, to a new integrated facility due to operational and occupational health and safety issues.216 Also included in this step change is expenditure to compensate employees for their change in condition of employment in moving to the new facility.
AER considerations
The AER notes that Jemena identified the following step changes as being indirectly required for the new electricity safety management scheme (ESMS):
Protection setting review
[text removed – confidential]
WireAlert neutral condition monitors
[text removed – confidential]
[text removed – confidential]
[text removed – confidential]
Distribution substation cleaning, gardening and security
Earth testing in non-CMEN areas
212 ibid., p. 52; and Jemena, response to information requested on 22 January 2010, confidential,
submitted on 1 March 2010. 213 ibid., pp. 37–38 and Jemena, response to information requested 22 January 2010, confidential,
submitted on 5 February 2010. 214 ibid., pp. 35, 37–38 and Jemena response to information requested 22 January 2010, confidential,
submitted on 6 February 2010. 215 ibid., p. 59. 216 Jemena, response to information requested 19 February 2010, confidential, submitted on
10 March 2010.
APPENDIX L—OPERATING EXPENDITURE STEP CHANGES 215
Overhead mounted switchgear inspection and maintenance
Non-pole distribution substation routine maintenance.217
The AER accepts Jemena’s advice that these proposed step changes are indirectly related to the requirements under the ESMS and that they are not being driven by a specific requirement. As these proposals are not directly linked to a specific new or changed regulatory obligation or requirement the AER does not consider these to be step changes. However, the AER does recognise that some of Jemena’s proposals reflect a change in its operating environment. These step changes are discussed in more detail below.
The AER notes that subsequent to Jemena’s lodgement of its regulatory proposal Jemena notified the AER that its zone substation ladder inspection program was already captured in its base year cost and that this step change was no longer required.218 The AER accepts the withdrawal of this project and has made the necessary adjustment.
With respect to the Sunshine depot restoration costs step change, the AER notes that this step change reflects a once-off cost that would be incurred by Jemena in the forthcoming regulatory control period due to a change in its operating environment. The AER considers the proposed expenditure by Jemena for this step change reflects the costs that would be incurred by a prudent and efficient DNSP in Jemena’s circumstances and therefore has included this proposal in the opex forecasts for its proposed step changes.
The AER considers that Jemena’s other proposals are not step changes as it has, either:
not been able to identify a specific regulatory trigger, or
not been able to demonstrate that there has been a change in its operating environment, or
received funding to address these regulatory requirements or obligations in previous regulatory determinations.
With respect to the wire alert neutral condition monitors, the AER notes that the Electricity Safety (Network Assets) Regulations 1999 previously placed obligations on Jemena to maintain the integrity of the supply neutral. Jemena notes that this obligation was met by neutral testing once every 10 years and asset inspection for service height and service conditions.219 Based on this information, the AER considers that the cost of compliance with these regulations have already been included in Jemena’s base level of opex.
217 Jemena, response to information requested 22 January 2010, confidential, submitted on
22 March 2010. 218 Jemena, response to information requested 22 January 2010, confidential, submitted on
1 March 2010. 219 Jemena, Regulatory Proposal: Appendix 10 – Jemena Electricity Networks (Vic) Ltd – Capital and
Operational Work Plan (COWP) 2010–15 (Confidential), 30 November 2009, p. 50.
216 VICTORIAN DRAFT DISTRIBUTION DETERMINATION—DRAFT DECISION
The AER also notes that Jemena has linked this proposal to the ‘as low as reasonably practicable’ paradigm change under the Electricity Safety Act 1998. The AER understands that the intent of this change was, in part, to provide DNSPs greater flexibility (including with respect to risk), in meeting their regulatory obligations—an approach that is often welcomed by businesses as it provides scope for flexibility and the implementation of a more cost effective and risk balanced approach to meeting required regulations or obligations.
The AER considers that a prudent and efficient DNSP seeking to achieve an ‘as low as reasonably practicable outcome’ would therefore be able to demonstrate, through a robust cost-benefit analysis, that its proposal was required and that the approach being put forward was the most efficient method by which it could achieve those regulatory obligations. The AER notes that Jemena has not demonstrated that this is the case for the ‘wire alert’ proposal.
The AER also considers that an efficient DNSP would already be pro-actively managing the risks and costs associated with regulatory compliance. As discussed previously, the AER considers that any business process improvements which result in lower costs will be self financing as the net costs should be expected to be less than those reflected in the revenue requirement.
Jemena’s proposal on [text removed – confidential] and transformer noise tests at zone substations are also linked to the ‘as low as reasonably practicable’ paradigm change under the Electricity Safety Act 1998. However, consistent with its view regarding wire alert, the AER considers that Jemena has been unable to demonstrate that this proposal is required and that the proposed costs are representative of the costs that a prudent operator in Jemena’s circumstances would require. In addition, the AER again notes that any business process improvements which result in lower costs will be self financing as the net costs should be expected to be less than those reflected in the revenue requirement.
With respect to Jemena’s transformer noise tests at zone substations, the AER notes that the ESCV provided AGLE (now Jemena) $1.8 million for noise abatement in the EDPR 2006–10.220 In that decision, the ESCV noted that the Victorian DNSPs are ‘required to maintain noise at the nearest residence to within levels complying with the State Environment Protection Policy (Control of Noise from Commerce, Industry and Trade) No N–1’.221 The AER therefore considers that meeting the requirements of this regulatory obligation should already be included in Jemena’s base level of opex and has not included this proposal in the opex expenditure forecasts for Jemena’s proposed step changes.
With respect to zone substation fall arrest inspection, the AER notes that Jemena, in response to questions raised on this issue, stated that this step change is to meet its obligations under the part 3.3 of the Occupational Health and Safety Regulations 2007.222 As this is not a new obligation the AER considers compliance with this
220 ESCV, Electricity Distribution Price Review, 2006–10, p. 308. 221 ibid. 222 Jemena, response to information requested 22 January 2010, confidential, submitted on
1 March 2010.
APPENDIX L—OPERATING EXPENDITURE STEP CHANGES 217
regulatory obligation should already be included in Jemena’s base level of opex. Therefore the AER has not included this proposal in Jemena’s step change costs.
The AER further notes that capital expenditure funding for ‘working at heights’ was provided to AGLE (now Jemena) as part of the ESCV’s EDPR 2006–10. Specifically, the AER notes that the ESCV provided $1.0 million to Jemena to meet working with height requirements and that this funding ‘could be accepted in lieu of an operating expenditure step change for this expense.’223 The AER also notes that Jemena, in response to questions raised on this issue, stated that in order to ‘maintain compliance with the regulations this equipment requires regular inspection’.224 The AER considers this statement clearly demonstrates that this is not a new obligation and should therefore not be treated as a step change.
The AER notes that Jemena has also linked the zone substation fall arrest inspection proposal to the ‘as low as reasonably practicable’ paradigm change under the Electricity Safety Act 1998. However the AER considers that Jemena has been unable to demonstrate that this specific activity is required and that the option being put forward to meet this perceived requirement is representative of the costs that a prudent operator in Jemena’s circumstances would need.
The AER also considers that Jemena’s proposals for non pole DS routine maintenance and overhead mounted switchgear inspection & maintenance are not step changes. The AER considers that Jemena has been unable to demonstrate to the AER’s satisfaction that these proposals are linked to specific new or changed regulatory obligations or requirements or a change in Jemena’s operating environment. The AER notes that Jemena has linked these proposals to the ‘as low as reasonably practicable’ paradigm change under the Electricity Safety Act 1998 but considers that these proposals primarily seek to replace existing ad hoc procedures with a more formalised process.225 That is, the AER considers that the proposals stem from a business decision by Jemena regarding the appropriateness of a process to address known concerns rather than establishing a new process to meet a new regulatory requirement or obligation.
The AER also considers that a prudent and efficient DNSP seeking to achieve ‘a low as practicable outcome’ would be able to demonstrate, through a robust cost benefit analysis, that the non pole DS routine maintenance and overhead mounted switchgear inspection & maintenance proposals were required and that the approaches being put forward were the most efficient methods by which it would achieve those regulatory obligations. The AER considers that Jemena has not demonstrated that this is the case.
The AER also considers that Jemena’s proposal for distribution substation cleaning, gardening and security is not a step change. The AER is not satisfied that Jemena has linked this proposal to an explicit change in regulatory obligations or a change in its operating environment. Jemena has linked this proposal to the ‘as low as reasonably practicable’ paradigm change under the Electricity Safety Act 1998 and the Electricity
223 ESCV, Electricity Distribution Price Review 2006–10, p. 310. 224 Jemena, response to information requested 22 January 2010, confidential, submitted on
1 March 2010. 225 ibid.
218 VICTORIAN DRAFT DISTRIBUTION DETERMINATION—DRAFT DECISION
Safety (Management) Regulations 2009. Consistent with most of the proposals discussed above, the AER considers that Jemena has been unable to demonstrate that these specific activities are required. Jemena has also conceded that this proposal is in response to a recognised need for improvement, and is required to meet its existing obligations under the Occupational Health and Safety Act 2004.226 Its statements clearly demonstrate that this proposal is not in response to a change in operating environment, as a prudent and efficient network operator in Jemena’s circumstances should already be maintaining a safe place of work, as is required by the Occupational Health and Safety Act. The AER therefore considers that meeting the requirements of this regulatory obligation should already be included in Jemena’s base level of opex and has not included this proposal in Jemena’s step change costs.
With respect to the [text removed – confidential] step change, the AER notes that this is not a new or changed regulatory obligation or requirement, or a change in the operating environment for Jemena. The AER also notes that the ESCV included in the EDPR 2006–10, expenditure in the revenue requirements for all Victorian DNSPs so that they could meet their respective obligations under the [text removed – confidential].227 Furthermore, in the EDPR 2006–10 the ESCV provided AGLE (now Jemena) additional operating and maintenance expenditure for [text removed – confidential].228 The AER therefore considers that meeting the requirements of this regulatory obligation should already be included in Jemena’s base level of opex and has not included this proposal in Jemena’s step change costs.
With respect to the protection setting review, the AER notes that this proposed step change is not linked to a new or changed regulatory obligation or requirement. Nor is this a change in the operating environment for Jemena. The obligation of maintaining an effective protection system has been in place for the Victorian DNSPs for some time under the Electricity Safety Act 1999 and the Electricity Safety (Network Assets) Regulations 1999. Whilst Jemena’s current piece-meal approach to satisfying this obligation raises questions regarding whether such an approach is that of a prudent operator, the AER considers that meeting the requirements of this regulatory obligation should already be included in Jemena’s base level of opex and has not included this proposal Jemena’s step change costs.
Finally, with respect to the proposed Broadmeadows site relocation step change, the AER notes that whilst it is likely that expenditure will be required in the future, Jemena has not demonstrated to the AER’s satisfaction that the costs proposed are that of a prudent operator. Specifically, Jemena has not demonstrated to the AER’s satisfaction that the information provided to it has gained internal approval by Jemena.229 As the information provided contains several options and recommendations which have not been finalised or approved, the AER considers that the option being put forward is not representative of the costs that a prudent operator in Jemena’s circumstances would need. Therefore the AER has not included this proposal in Jemena’s step change costs.
226 ibid. 227 [text removed – confidential] 228 [text removed – confidential] 229 Jemena, Broadmeadows relocation business proposal, draft (Confidential), February 2010.
APPENDIX L—OPERATING EXPENDITURE STEP CHANGES 219
For all the proposals discussed in this section, the AER also notes that the NER requires the AER to have regard to the benchmark expenditure that would be incurred by an efficient DNSP over the regulatory control period. The AER notes that no other Victorian DNSP has, as part of their regulatory proposal for the forthcoming regulatory control period, sought approval for step changes of this type.
AER conclusion
For the reasons discussed and as a result of the AER’s consideration of Jemena’s regulatory proposals and other supporting information, apart from the Sunshine depot restoration costs, the AER is not satisfied that the expenditure proposed by Jemena discussed above reasonably reflects the opex criteria, including the opex objectives. In coming to this view the AER has had regard to the opex factors.
L.4.12 Expenditure to achieve capex/opex balance
Jemena also proposed several step changes to implement condition monitoring techniques. Jemena considered that these proposals will permit it to achieve an appropriate balance between capex and opex when dealing with an aging network.230 These step changes totalled $1.0 million ($2010) and are discussed below.
Zone substation transient earth voltage (TEV) testing—forecast $0.1 million ($2010) to undertake new non-intrusive condition monitoring of in-service metal clad switchgear used in zone substations.231
Zone substation post current/voltage transformer (CT/VT) testing—forecast $27 000 ($2010) to deploy intrusive condition assessment tests on oil filled transformers that exceed 40 years of age.232
Zone substation transformer dryouts (Trojan)—forecast $0.1 million ($2010) to treat zone substation transformers with high moisture content with an on–line oil dryout unit to reduce moisture levels over time, to slow the rate of aging and extend the life of the transformers.233
Zone substation degree of polymerisation (DP) testing—forecast $0.3 million ($2010) to measure the moisture content in transformer insulation systems, and to estimate the DP of the paper insulation system of the transformers. DP testing will help in assessing the condition of transformers over 40 years of age and will facilitate decisions on replacement or refurbishment.234
Zone substation transformer condition testing—forecast $0.2 million ($2010) to apply a program of conventional electrical tests to ageing transformers to further assist with condition assessment and decision making on replacement programs.235
230 Jemena, Regulatory Proposal: Appendix 10 – Jemena Electricity Networks (Vic) Ltd – Capital and
Operational Work Plan (COWP) 2010–15 (Confidential), 30 November 2009, p. 55. 231 ibid., pp. 55–56. 232 ibid., p. 56. 233 ibid. 234 ibid. 235 ibid.
220 VICTORIAN DRAFT DISTRIBUTION DETERMINATION—DRAFT DECISION
Zone substation power quality metering maintenance—forecast $0.1 million ($2010) to establish a routine maintenance policy for power quality meters installed during the 2001–05 regulatory control period.236
Zone substation secondary spares maintenance—forecast $22 000 ($2010) to undertake a periodic maintenance regime for electronic based secondary spare equipment (including protection and control relays, power quality meters and battery chargers), to ensure spare equipment is serviceable and ready for use at all times.237
Cable testing to predict/manage forecast failure increases—forecast $0.3 million ($2010) to continue its implementation of a program to monitor the condition of underground high voltage cables and their associated accessories.238
Consultant review
In determining the reasonableness of Jemena’s ‘capex/opex balance’ proposal, the AER sought advice from Nuttall Consulting. Nuttall Consulting considered that, with the exception of power quality metering maintenance and secondary spares maintenance, the maintenance practices were reasonably well defined, and that it may be prudent for Jemena to implement those programs in the forthcoming period. However, Nuttall Consulting noted that Jemena’s views on the need for these practices were not driven from changes to regulatory obligations, but were on the basis that the proposed additional opex would realise net economic benefits through avoided capex and reduced risks.239 Nuttall Consulting also considered that Jemena had not provided economic analysis that clearly justified the scale and timing of the proposed increases.240
Nuttall Consulting further considered that the incentive mechanisms in the existing regulatory regime should inherently allow for the types of changes to routine maintenance practices proposed by Jemena. In particular, Nuttall Consulting considered that this would be the case for benefits resulting from avoided capex and reliability improvements, such as those proposed by Jemena.241
Nuttall Consulting concluded that given the absence of economic analysis that clearly demonstrated the need for these step increases, Jemena’s ‘capex/opex balance’ proposal was not justified.242
AER considerations
The AER agrees with Nuttall Consulting that Jemena’s ‘capex/opex balance’ proposal is driven by economic benefits rather than a new or changed regulatory obligation, or a change in Jemena’s operating environment. As such, the AER does not consider the ‘capex/opex balance’ proposal is a step change.
236 ibid. p. 57. 237 ibid. 238 ibid. 239 Nuttall Consulting, Victorian Electricity Distribution Revenue Review, p. 347. 240 ibid. 241 ibid., pp. 347–348. 242 ibid., p. 348.
APPENDIX L—OPERATING EXPENDITURE STEP CHANGES 221
The AER agrees with Nuttall Consulting that, with the exception of power quality metering maintenance and secondary spares maintenance, there may be merit in Jemena’s proposal and that the maintenance practices are reasonably well defined. The AER also acknowledges the benefits of a capex/opex trade-off. However, the AER notes that any such business process improvements which result in lower costs will be self financing, as the net costs should be expected to be less than those reflected in the revenue requirement. The AER also considers that initiatives for asset condition monitoring should be a routine process undertaken by prudent and efficient DNSPs.
The AER notes that if Jemena can clearly identify a change in its operating environment associated with this proposal, it must also reasonably demonstrate that its proposed opex is prudent and efficient before the AER can approve it. Jemena’s proposals are considered in more detail below.
With respect to TEV testing, the AER agrees with Nuttall Consulting that it appears to be a prudent approach to condition monitoring of metalclad switchgear. However, the AER notes that when asked to identify the benefits of this proposal, Jemena did not provide any assessment of the reduction in intrusive testing costs, or the potential for life extension or reduced failures. As this information was not provided, the AER considers that Jemena has not demonstrated the efficiency of its proposal and that therefore it cannot be satisfied that this expenditure would comply with the requirements of the NER.
For CT/VT testing, transformer dryouts, DP testing, transformer condition testing and cable testing, the AER notes that Jemena stated that it would require increased capex for retirement of aged assets should it not receive the requisite opex.243 However, Nuttall Consulting found that Jemena had not provided any economic analysis that demonstrated the prudency and efficiency of these proposed increases.244 The AER agrees with Nuttall Consulting’s findings and considers that Jemena must provide sufficient economic analysis before the AER can be satisfied that these proposals are prudent and efficient.
For power quality metering maintenance, information provided for the 2006–10 EDPR listed 21 meters installed in 2000. The AER notes that based on information provided by Jemena, Nuttall Consulting found that all of the 21 meters should have been subject to maintenance in or prior to the current regulatory control period. 245 The AER further notes that Jemena did not directly respond when asked whether the existing meters were already due for maintenance.246 The AER agrees with Nuttall Consulting that Jemena has failed to justify the case for additional opex. With respect to spares maintenance, Jemena was unable to clearly state the benefits of the proposed expenditure other than to note that a failure to implement the practice
243 Jemena, response to information requested 22 January 2010, confidential, submitted on
25 February 2010. 244 Nuttall Consulting, Victorian Electricity Distribution Revenue Review, pp. 344–347. 245 ibid., p. 345. 246 ibid.
222 VICTORIAN DRAFT DISTRIBUTION DETERMINATION—DRAFT DECISION
increases the risk that the spare equipment will not be serviceable when required.247 The AER agrees with Nuttall Consulting that there were a number of other aspects of Jemena’s proposal that did not support the proposed opex, specifically: the risk that a spare unit may not be available has not changed as current practice
is not to energise the spare units
the ambiguity associated with how long the manufacturer recommendations have been in place and whether there have been historical failures of spare equipment that have impacted on Jemena’s performance
the lack of clarity regarding the failure of a spare unit and whether there is more than one spare or alternate options for interim operations
whether, if a replacement unit costs $10 000, it is economically justified to spend $10 000 every fours years to prevent a possible failure
that Jemena does not appear to have considered the impact of new stock moving through the inventory and thereby deferring the need to power up the spares in question
that the amount of expenditure suggests that Jemena has a volume of units, such that significant synergies could be achieved in the process. 248
In relation to cable testing, the AER notes that Nuttall Consulting found that Jemena did not provide adequate information about “partial discharge” tests in its referenced literature, or provide any economic analysis that demonstrated the prudency and efficiency of the proposal.249 The AER therefore cannot be satisfied that this proposal is prudent and efficient.
Based on the information provided by Jemena, Nuttall Consulting and the analysis undertaken by the AER, the AER considers that it is not reasonable for Jemena’s ‘capex/opex balance’ proposal to be included in Jemena’s proposed step change costs.
AER conclusion
For the reasons discussed above and as a result of the AER’s consideration of Jemena’s regulatory proposals and other supporting information, the AER is not satisfied that Jemena’s proposed expenditure reasonably reflects the opex criteria, including the opex objectives. In coming to this view the AER has had regard to the opex factors.
247 Jemena, Regulatory Proposal: Appendix 10 – Jemena Electricity Networks (Vic) Ltd – Capital and
Operational Work Plan (COWP) 2010–15 (Confidential), 30 November 2009, p. 57. 248 Nuttall Consulting, Victorian Electricity Distribution Revenue Review, p. 346. 249 ibid., p. 347.
APPENDIX L—OPERATING EXPENDITURE STEP CHANGES 223
L.4.13 Information technology opex step changes
Jemena proposed multiple opex step changes for information technology (IT) in the forthcoming regulatory control period totalling $7.2 million ($2010).250 Jemena proposed IT opex step changes in four categories, based on the nature of its IT initiatives:
increased support of current systems
introduction of new systems
systems replacement
new data centre facilities.251
Increased support of current systems
Jemena proposed $0.8 million ($2010) for increased support of current systems.252 This proposal included new systems to replace or upgrade existing systems, additional support, additional software licences and maintenance contracts with vendors.253 Jemena considered that the scope, scale and complexity of work, as well risk mitigation was driving this step change. The specific IT projects associated with this proposed step change were:
SAS replacement
BRIO query replacement
asset defects database
program and portfolio management.254
Introduction of new systems
Jemena proposed step changes of $3.1 million ($2010) for the introduction of new systems, which included additional IT resources for operation and support.255 The specific IT projects associated with this proposed step change were:
emergency, risk and safety management
real time security implementation
spatial intelligence tool
250 Jemena, Jemena IT Strategy: Asset Management Plan 2011–15 (Confidential), 30 November 2009,
p. 63. 251 ibid. 252 ibid. 253 Jemena, response to information requested 22 January 2010, confidential, submitted on,
12 February 2010. 254 Jemena, Jemena IT Strategy: Asset Management Plan 2011–15 (Confidential), 30 November 2009,
p. 64. 255 ibid.
224 VICTORIAN DRAFT DISTRIBUTION DETERMINATION—DRAFT DECISION
distribution management system
relay equipment setting information system (RESIS)
equipment testing recording and verification
service delivery and field mobile computing.256
Systems replacement
Jemena proposed an opex step change reduction of $0.9 million ($2010) as a result of the replacement of its 12 year old SAP systems with a new SAP system. Jemena noted that this will allow it to take advantage of new and improved capabilities and associated efficiencies which transfer into savings of opex for IT resources.257
New data centre facilities
Jemena proposed $7.8 million ($2010) for new data centre facilities.258 Jemena noted this was required as its production and disaster recovery centres need to be relocated, following it being given a notice to vacate its current leased premises and the disaster recovery centre no longer being fit for purpose.259 The specific IT projects associated with this proposed step change were:
Production data centre facilities
Production data centre racks
Disaster recovery data centre facilities
Disaster recovery data centre racks.
Jemena has also proposed a step change reduction of 1 per cent to its baseline prior to the total step change due to efficiency gains stemming from incremental improvements based on increased IT staff productivity from new technologies, applications and tools. This equates to a reduction of $3.6 million ($2010) over the forthcoming regulatory control period.
Consultant review
In determining the reasonableness of Jemena’s IT opex step change proposals, the AER sought advice from Nuttall Consulting.260
With respect to Jemena’s increased support of current systems step change, Nuttall Consulting considered that while Jemena had provided detailed and well supported documentation for this step change it had not demonstrated how the implementation costs for the proposed new systems were greater than the existing 256 ibid. 257 ibid., pp. 41–42 and 64–65. 258 ibid., p. 65. 259 Jemena, response to information requested 22 January 2010, confidential, submitted on
12 February 2010. 260 Nuttall Consulting, Victorian Electricity Distribution Revenue Review, pp. 333–337.
APPENDIX L—OPERATING EXPENDITURE STEP CHANGES 225
systems.261 Further, Nuttall Consulting considered that the benefits from this step change had not been quantified by Jemena nor had they been included as part of the step change calculations. Nuttall Consulting concluded that the lack of recognition of existing system costs and lack of quantified benefits resulted in it being unable to support this proposed step change.
With respect to Jemena’s ‘introduction of new systems’ step change, Nuttall Consulting considered that, in general, this suite of step changes was supported and should be accepted by the AER.262
Nuttall Consulting noted that Jemena’s emergency risk and safety management system step change was consistent with the number of extreme events forecast by AECOM in the forthcoming regulatory control period.263 However, Nuttall Consulting noted that the AER had not accepted AECOM climate change modelling as part of its draft decision and that it was therefore unable to recommend expenditure relating to this step change.
Nuttall Consulting considered that the implementation of a distribution management system step change would replace a number of existing manual systems. It noted that the benefits of replacing the manual systems had not been adequately quantified by Jemena. Further, Nuttall Consulting considered that the costs of this step change did not reflect any potential benefits associated with its implementation. Nuttall Consulting concluded by noting that this cost should not be allowed as the overall benefits of the implementation of the distribution management system could outweigh the step change operating expenditure.
Nuttall Consulting noted that the equipment testing recording and verification step change is assumed to be the input of information into the RESIS. This being the case, Nuttall Consulting considered that this proposal merely replaced the existing process and recommended that costs should not be allowed as one system is simply replacing another.
With respect to Jemena’s SAP replacement step change, Nuttall Consulting considered that the savings proposed should be supported.264
With respect to Jemena’s new data centre facilities step change, Nuttall Consulting noted that Jemena had proposed the replacement of current data centres due to the current facilities reaching capacity and there being no scope for further expansion.265
Nuttall Consulting further noted that the main component of the forecast costs related to purchasing data centre facilities on a “per rack” basis.266 It noted that the model provided by Jemena showed an annual increment growth of 10 per cent, which
261 ibid., p. 334. 262 ibid., p. 335. 263 Jemena, Regulatory Proposal: Appendix 7.8 – Jemena Electricity Networks (Vic) Ltd – AECOM –
Assessment of Climate Change Impacts on Jemena Electricity Networks for 2011–15 EDPR (Confidential), 30 November 2009.
264 Nuttall Consulting, Victorian Electricity Distribution Revenue Review, p. 336. 265 ibid. 266 ibid., pp. 336–337.
226 VICTORIAN DRAFT DISTRIBUTION DETERMINATION—DRAFT DECISION
amongst other things, included aspects for the additional growth of data from the Advanced Metering Infrastructure (AMI) initiative. Nuttall Consulting considered that these costs should have already been provided for in the AMI cost recovery process and should not be provided for again. It considered that the costs for the AMI data growth represented 5 per cent of the annual increment proposed.
Nuttall Consulting also noted that Jemena’s proposed cost for the production and disaster recovery data centre racks had been provided for on incremental basis between the existing and new costs.267 Nuttall Consulting considered that this is consistent with industry rates.
Finally, Nuttall Consulting considered that the production and disaster recovery facility costs proposed by Jemena were reasonable and consistent with expected industry rates.268
AER considerations
The AER has assessed Jemena’s proposed IT opex step changes and agrees, in general, with Nuttall Consulting’s analysis. Specifically, with respect to Jemena’s proposed:
increased support of current systems step changes, the AER agrees with Nuttall Consulting that it should not be supported as Jemena has not demonstrated to the AER’s satisfaction that these costs represent an increase to the replacement of existing systems or support costs
systems replacement and new data centre facilities step changes, the AER agrees with Nuttall Consulting ‘s analysis of these step changes and its conclusions. The AER considers that Jemena has demonstrated that these step changes are a change in the operating environment for Jemena and that the costs represent a change in the opex forecasts for Jemena.
introduction of new systems step changes, the AER notes Nuttall Consulting’s analysis and agrees with the step changes indentified to not be supported. The AER considers the remaining step changes in this suite have not been demonstrated to have been driven by a specific regulatory trigger or a change in operating environment and are also not supported.
Regarding the introduction of new systems step changes, the AER further notes that for:
real time security systems—the AER considers that this proposal for the increase in security threats has not been well supported or quantified. Furthermore, the AER considers that the proposed costs for this step change do not reflect total benefits of its implementation and therefore are not efficient
267 ibid., p. 337. 268 ibid.
APPENDIX L—OPERATING EXPENDITURE STEP CHANGES 227
spatial intelligence—the AER considers that it has not been reasonably demonstrated that this step change is caused by a change in Jemena’s operating environment
RESIS—the AER considers that it has not been reasonably demonstrated that this step change is caused by a change in Jemena’s operating environment
services delivery and field mobile computing—the AER considers that this step change is closely aligned to leveraging off the AMI rollout. The AER considers that such costs have been already been provided for in the AER’s AMI cost recovery process and should not be provided for again.
The AER therefore considers that Jemena’s proposed expenditure for this suite of step changes is not reasonable and therefore has not included these in Jemena’s step change costs.
The AER accepts Jemena’s proposal of a reduction in expenditure due to IT efficiency gains from improved IT staff productivity over the forthcoming regulatory control period.
AER conclusion
For the reasons discussed above and as a result of the AER’s consideration of Jemena’s regulatory proposals, advice from Nuttall Consulting and other supporting information, the AER has only included in Jemena’s step change costs the IT opex that has been identified as either a regulatory obligation or requirement or a change in Jemena’s operating environment. The AER has also considered whether Jemena’s proposed expenditure reasonably reflects the opex criteria, including the opex objectives. In coming to this view the AER has had regard to the opex factors.
L.4.14 Late, additional, proposed step changes
Jemena submitted numerous step changes worth $8.0 million ($2010) that were not provided with its regulatory proposal.269 Jemena claimed that these step changes were included in its total forecast expenditure for step changes but that the specific details regarding the changes were not included in its regulatory proposal. The late, additional step changes proposed were:
Avoided cost distribution payment to AGLPG
Base year efficiency carryover
Stakeholder relations—marketing communications
Stakeholder relations—additional staff to manage claims.270
The AER notes that details of these step changes were not included in Jemena’s regulatory proposal and that when information about the proposed step changes was 269 Jemena, Step changes overview (Confidential), 29 January 2010. 270 Jemena, response to information requested 19 February 2010, confidential, submitted on
10 March 2010.
228 VICTORIAN DRAFT DISTRIBUTION DETERMINATION—DRAFT DECISION
submitted to the AER the level of detail provided to support these proposals was limited.
In addition to having to seek additional information on these ‘missing’ step changes, the AER notes that there were numerous discrepancies between the dollar value of several step changes and the information provided in Jemena’s Capital and Operational Work Plan (COWP). Given the amount of time available to a DNSP to provide a regulatory proposal, the AER is concerned with the initial oversight, and the proposed revisions to Jemena’s regulatory proposal. The AER considers that there may be steps that Jemena may wish to consider implementing to improve the quality of the information provided in its regulatory proposal prior to it being submitted to the AER.
In addition, the AER notes that late additions to a proposal jeopardises the AER’s ability to make its determination in the prescribed time and that Chapter 6 of the NER requires that DNSPs provide a robust and complete proposal in the first instance.
Notwithstanding the AER’s concerns it has considered these proposed step changes below.
Avoided cost distribution payment to AGLPG
Jemena proposed a step change for the avoided distribution use of system costs that it has been paying to AGL Power Generation.271 The AER notes that Jemena subsequently retracted this step change, noting that this proposal would not occur in the forthcoming regulatory control period.272
Base year efficiency carryover
Whilst not explicit in its regulatory proposal, Jemena proposed a base year efficiency carryover step change in information provided to the AER subsequent to the lodgement of its regulatory proposal.273 Jemena has subsequently advised the AER that this is not a step change but rather represents the fifth year forecast increment from the EBSS as described in Jemena’s regulatory proposal.274 As Jemena has noted that this is not an opex step change, it is therefore not considered in this section but is discussed in the base opex section of chapter 7.
Stakeholder relations—marketing communications
Jemena proposed $0.8 million ($2010) for a range of additional marketing activities to:
increase consumer awareness on issues such as the electricity industry and the distributors’ role
271 Jemena, Step changes overview (Confidential), 29 January 2010, p. 9. 272 Jemena, response to information requested 19 February 2010, confidential, submitted on
10 March 2010. 273 Jemena, Step changes overview (Confidential), 29 January 2010, p. 9, 274 Jemena, Regulatory Proposal: Appendix 10 – Jemena Electricity Networks (Vic) Ltd – Capital and
Operational Work Plan (COWP) 2010–15 (Confidential), 30 November 2009, pp. 134–135.
APPENDIX L—OPERATING EXPENDITURE STEP CHANGES 229
provide information about increasing supply events and vital distribution contact details
engage with the community on infrastructure upgrades that will maintain supply reliability, network stability and minimise customer outages.275
Stakeholder relations—additional staff to manage claims
Jemena proposed $0.4 million ($2010) for additional staff to manage customer service and communications, administration and additional paperwork, claims investigation and processing, liaising with field contractors, reporting and follow-up cases during and after an extreme supply event.276
AER considerations and conclusion
The AER considers that these late, additional step changes are not step changes as Jemena has, in general, either not been able to identify a specific regulatory trigger or demonstrate that there has been a change in the operating environment that would warrant additional expenditure in these areas.
With respect to the stakeholder relations—marketing communications step change, the AER notes that this is not a new or changed regulatory obligation or requirement. The AER also notes that this step change is not being driven by a change in Jemena’s operating environment in the forthcoming regulatory control period. Furthermore, the AER notes that there is synergy between parts of this step change and the step change expenditure being provided for under Jemena’s proposal for communication to customers during outage events, discussed previously.
The AER also notes that part of the marketing communications step change relates to providing consumers with distribution contact details and alternative communication tools such as their website, with particular reference to supply events. The AER notes that expenditure has been provided under the communication to customers during outage events step change which will ensure that information of this type is available to all customers, including those who are considered at most risk of a supply event. The AER therefore considers that this aspect of this step change has already been addressed in the communication to customers during outage events step change.
For the remaining aspects of the marketing communications step change, the AER considers that Jemena has not demonstrated to the AER’s satisfaction that these costs are representative of a prudent and efficient DNSP. The AER notes that historically Jemena has been provided opex under the activity area of advertising and marketing which is for amongst other things, communicating with customers on distribution matters which include providing notice of planned interruptions, educating the public on network-related electricity safety and activities arising from the DNSP’s obligations in relation to quality of supply.277 The AER therefore considers that the
275 Jemena, response to information requested 19 February 2010, confidential, submitted on
10 March 2010. 276 ibid. 277 ESCV, Electricity Industry Guideline No. 3: Regulatory Information Requirements Issue No. 6,
December 2006, pp. 46–47.
230 VICTORIAN DRAFT DISTRIBUTION DETERMINATION—DRAFT DECISION
cost of compliance with these regulations has already been included in Jemena’s base level of opex.
With respect to the proposed stakeholder relations—additional staff to manage claims step change, the AER notes that this is not being driven by a new or changed regulatory obligation or requirement, or a change in Jemena’s operating environment in the forthcoming regulatory control period. The AER also notes that Jemena’s proposal for this step change is based on costs incurred during 2009, the base year for Jemena’s proposal. As these costs have not been raised as one-off events to be removed from the base year in Jemena’s regulatory proposal,278 the AER considers that the cost to manage these claims should already be included in Jemena’s base level opex. The AER therefore concludes that no additional expenditure for this proposed step change is warranted.
The AER has considered whether Jemena’s proposed expenditure reasonably reflects the opex criteria, including the opex objectives. In coming to this view the AER has had regard to the opex factors.
L.4.15 Additional step changes proposed by Powercor
Powercor proposed one additional specific step change. This step change totalled $22 million ($2010) and is discussed below.
At risk townships protection plans
Powercor proposed $22 million ($2010) to undertake measures to meet the objectives of the Victorian Government’s ‘at risk townships’ protection plans initiative.279 This proposal would extend Powercor’s existing bushfire mitigation programs and would cover thirty eight towns that are located in its territory and which are subject to township protection plans.
The activities identified by Powercor as being additional to its existing bushfire mitigation program included:
a line construction survey
LIDAR aerial imaging
an independent asset audit
ground fuel reduction
a broader review of hazardous trees outside clearance space
research into new technologies.280
278 Jemena, Regulatory Proposal: Appendix 10 – Jemena Electricity Networks (Vic) Ltd – Capital and
Operational Work Plan (COWP) 2010–15 (Confidential), 30 November 2009, pp. 132–133. 279 Premier of Victoria, www.premier.vic.gov.au/newsroom/7841.html accessed 7 January 2010. See
also Statement of Government Intentions, February 2010, pp. 2, 18. 280 Nuttall Consulting, Victorian Electricity Distribution Revenue Review, March 2010, pp. 267–269.
APPENDIX L—OPERATING EXPENDITURE STEP CHANGES 231
Consultant review
Nuttall Consulting requested Powercor to provide analysis that demonstrated how its proposed expenditure increases were calculated and the proposed benefits and outcomes. It noted that Powercor’s response was very high-level and that it did not provide sufficient detail to reasonably determine how the expenditure increases had been calculated.281 Notwithstanding this, Nuttall Consulting considered that the value of some of the benefits associated with this proposal would appear to be material.282
Nuttall Consulting considered that the research and development component of this proposal was not consistent with the opex objectives as defined in the NER.283 It noted that:
research and development was a mechanism through which a DNSP can identify and subsequently implement business efficiencies and reduce ongoing costs
the ESCV, in its 2005 Final Determination, concluded that research and development expenditure should not be included in allowed expenditure.284
Nuttall Consulting concluded that the expenditures associated with the line survey, LIDAR, the independent asset audit, and research and development should not be included in the expenditure forecast for Powercor’s proposed step changes.285
AER considerations
The AER reviewed information about the township protection plans available on Victorian Government press releases and the Country Fire Authority’s website and notes that they provide:
a community information map for the affected areas
information about the risk of fire danger and how residents should respond depending on the degree of fire risk.286
The AER considers that the township protection plans do not impose an obligation on DNSPs to undertake specific fire mitigation strategies. The AER notes that it requested advice from Powercor as to the regulatory obligations that drove this
281 ibid. 282 ibid. 283 ibid. 284 ibid. 285 ibid. 286 Country Fire Authority, http://cfaonline.cfa.vic.gov.au/mycfa/Sho
w?pageId=publicDisplayDoc&fname=Castlemaine_25283.pdf, accessed 7 January 2010.
232 VICTORIAN DRAFT DISTRIBUTION DETERMINATION—DRAFT DECISION
proposal. Powercor responded noting that there was no regulatory obligation imposed.287
The AER notes that Powercor may choose to undertake this proposal through self financing arrangements and irrespective of whether it is provided with a specific revenue allowance for the activities. The AER also notes that the incentive framework in place under chapter 6 of the NER encourages the DNSPs to achieve efficiencies in their operating and maintenance expenditure over the regulatory period. The benefits of those efficiencies are shared between DNSPs and customers over time.
The AER considers that Powercor’s proposal pre-empts the recommendations of the Victorian Bushfires Royal Commission (VBRC) and the Victorian Government’s response to these recommendations. The AER considers that Powercor’s forecasts are based, in part, on the assumption that additional regulatory obligations will be imposed on it.
The AER notes that the VBRC’s recommendations are not expected to be released until July 2010.288
Recognising the uncertainty surrounding these issues, the AER does not consider it appropriate or prudent to pre-empt either the VBRC recommendations or the Victorian Government’s response. The AER notes that if the State Government places new regulatory requirements on the Victorian DNSPs, due to the recommendations of the VBRC or other processes, the DNSPs may seek the approval of the AER to pass through to distribution network users a positive pass through amount.289
AER conclusion
For the reasons discussed and as a result of the AER’s consideration of Powercor’s regulatory proposal, advice from Nuttall Consulting and other supporting information, the AER is satisfied that Powercor’s proposed ‘at risk townships’ proposal does not reasonably reflect the opex criteria, including the opex objectives. The AER does not therefore accept Powercor’s ‘at risk townships’ proposal. In coming to this view the AER has had regard to the opex factors.
L.4.16 Additional step changes proposed by SP AusNet
SP AusNet proposed a number of specific additional step changes. These step changes totalled $43 million ($2010) and are discussed below.
National energy customer framework—forecast $0.3 million ($2010) for additional resources relating to the establishment of the National Energy Customer Framework (NECF).290
Power cable test program—forecast $1.5 million ($2010) to implement a prioritised cyclic test and monitoring program for all underground power cables to
287 Powercor, meeting with AER staff and Nuttall Consulting, 24 February 2010. 288 2009 Victorian Bushfires Royal Commission, www.royalcommission.vic.gov.au/Interim-Reports,
accessed 17 February 2010. 289 NER, clause 6.6.1. 290 SP AusNet, Regulatory proposal, Table 7.17, p. 219.
APPENDIX L—OPERATING EXPENDITURE STEP CHANGES 233
reduce the risk of failures and to more accurately forecast long term asset condition, remaining life and replacement profiles.291
Condition monitoring—forecast $5.4 million ($2010) to enhance its asset condition monitoring and to improve safety, reduce failure risk and more reliably forecast timely asset replacement requirements.292
Power transformer refurbishment—forecast $3.8 million ($2010) to enhance its existing program of intensive condition assessment of transformers and regulators, and improve the efficiency of its decisions on the need for their refurbishment and replacement.293
Substation civil infrastructure works—forecast $1.0 million ($2010) to begin to rectify civil infrastructure issues in its substations, and which if left unattended would impact zone substation security, reliability and safety.294
Substation fire system works—forecast $0.7 million ($2010) to complete annual fire preparedness, including hydrant testing, at its substations prior to the fire danger period.295
Process and configuration management—forecast $1.0 million ($2010) for the development and maintenance of configuration standards for protection and control schemes and devices, and the processes and procedures for protection and control setting and database management.296
Planned SAIDI reduction—forecast $19.9 million ($2010) to achieve the regulatory target of 34 minutes of planned SAIDI (PSAIDI) as set by the ESCV.297
Substation site clean-up works—forecast $0.7 million ($2010) for asset retirement and site demolition and cleanup works resulting from redundancy of certain zone substations driven by proposed network augmentation projects.298
Substation earthing systems—forecast $1.0 million ($2010) for substation switchyard resurfacing and earth grid testing, required to ensure that electrical safety and surface stability integrity is maintained.299
Vegetation management – incremental growth—forecast $8.2 million ($2010) for increased levels of immature tree removal outside of the required clearance space as part of its vegetation management program.300
291 SP AusNet, Regulatory proposal, p. 222 and Appendix I (Confidential), p. 5. 292 ibid. 293 ibid. 294 SP AusNet, Regulatory proposal, p. 224 and Appendix I (Confidential), p. 5. 295 ibid. 296 SP AusNet, Regulatory proposal, p. 223 and Appendix I (Confidential), p. 5. 297 SP AusNet, Regulatory proposal, p. 227 and Appendix I (Confidential), p. 5. 298 SP AusNet, Regulatory proposal, p. 223 and Appendix I (Confidential), p. 5. 299 SP AusNet, Regulatory proposal, p. 223 and Appendix I (Confidential), pp. 35–37.
234 VICTORIAN DRAFT DISTRIBUTION DETERMINATION—DRAFT DECISION
AER considerations
The AER considers that these proposals are not step changes as SP AusNet has not demonstrated that these proposals are linked to a new or changed regulatory obligation or requirement. The AER notes that SP AusNet’s regulatory proposal explicitly states that these proposals are being driven by its desire to ‘enhance’ outcomes. 301 Consequently, the AER considers that SP AusNet has not demonstrated that these proposals represent the efficient costs required to achieve the opex objectives in clause 6.5.6(a) of the NER.
The AER also considers that these proposals should already be part of SP AusNet’s normal ongoing operational expenditure and as such, they should already be provided for in its base level of opex. Some of these proposed step changes are discussed in more detail below.
With respect to SP AusNet’s proposed NECF step change, the AER notes that:
SP AusNet is participating in the development of the NECF
the NECF is expected to be completed in 2010
the NECF will be introduced in the forthcoming regulatory control period.302
However, the AER considers that this proposal is not a step change as it is not being driven by a change in regulatory obligations or requirements, nor does it represent a change in SP AusNet’s operating environment. The AER considers that participating in the development of policy and regulations, in this case the NECF, is part of the normal ongoing operation of a prudent and efficient DNSP. The AER therefore considers that this proposal should already be part of SP AusNet’s ongoing opex and that it is not reasonable for this project to be included in SP AusNet’s proposed step changes. The AER notes that should the introduction of the NECF mandate specific action to be undertaken, DNSPs will be able to seek the approval of the AER to pass through to distribution network users a positive pass through amount.303
With respect to the substation fire system works, the AER notes that the fire hydrants and hydrant systems in zone substations are subject to the maintenance testing requirements of Australian Standard AS1851-2005, Maintenance of fire protection systems and equipment.304 The AER notes that this standard has not been newly established and that SP AusNet has not demonstrated how any recent changes to this standard have imposed any new or changed obligations on SP AusNet. The AER also considers that SP AusNet has not demonstrated how other aspects of its current fire preparedness program are linked to new or changed regulatory obligations. The AER therefore considers that this proposal should already be part of SP AusNet’s ongoing
300 SP AusNet, Regulatory proposal, Appendix I (Confidential), pp. 46–49. 301 SP AusNet, Regulatory proposal, pp. 221, 224. 302 Ministerial Council on Energy, Standing Committee of Officials, National Energy Customer
Framework: Second Exposure Draft, November 2009, p. 4. 303 NER, clause 6.6.1. 304 SP AusNet, AMS 20-55 Civil Infrastructure, 2009, pp. 32–33.
APPENDIX L—OPERATING EXPENDITURE STEP CHANGES 235
opex and that it is not reasonable for this project to be included in SP AusNet’s proposed step changes.
In terms of the planned service target performance incentive scheme (PSAIDI) reduction, the AER notes that the PSAIDI target referred to in SP AusNet’s regulatory proposal is an aspirational target that was set by the ESCV in the EDPR 2006–10.305 Given the aspirational nature of this target, the AER considers that this proposal is not a step change as it is not based on a new or changed regulatory obligation or requirement.
The AER agrees with SP AusNet that there is merit in it continuing to improve its PSAIDI. The AER notes that SP AusNet has stated its commitment to safe work practice is one of the key drivers for this proposal. The AER recognises SP AusNet’s commitment to safe work practice but notes that all DNSPs are required to meet safe work practices.306
While not providing SP AusNet funding directly through its proposed planned SAIDI step change, the AER notes that SP AusNet will be provided with additional funding for continuing its existing work practices through scale escalation—see appendix J. This scaling factor will be applied to SP AusNet’s base line operating costs in recognition of the (capex) augmentation that it intends to undertake in the forthcoming regulatory control period.
For the reasons discussed above, and based on the information presented to the AER and its own analysis, the AER considers that it is not reasonable for the planned SAIDI reduction project to be included in SP AusNet’s proposed step changes.
The AER considers that the substation site clean-up works proposal is not a step change as SP AusNet has been unable to demonstrate that its proposal is linked to a new or changed regulatory obligation. In response to an information request by the AER, SP AusNet cited ESMS safety requirements, EPA requirements and contractual conditions as drivers for this proposal.307 The AER notes that SP AusNet has been unable to demonstrate to the AER’s satisfaction that either the Electricity Safety Act 1998 or the Electricity Safety (Management) Regulations 2009 explicitly apply to this proposed step change. SP AusNet has also been unable to demonstrate to the AER’s satisfaction that any obligations under the Environment Protection Act 1970, such as the treatment of contaminated soil, are new requirements. The AER also notes that contractual obligations are not a driver for a step change.
In addition, the AER does not consider that SP AusNet has demonstrated to the AER’s satisfaction that this proposal is a result of a change in SP AusNet’s operating environment. The AER considers substation site clean-up work to be part of the normal ongoing operation of a prudent and efficient DNSP, and that as such this
305 ESCV, Electricity Distribution Price Review 2006–10, October 2005 Price Determination as
amended in accordance with a decision of the Appeal Panel dated 17 February 2006. Final Decision Volume 1, Statement of Purpose and Reasons, pp. 28–68.
306 SP AusNet, Regulatory proposal, Appendix I (Confidential), Electricity Distribution Network, Incremental opex impact to 2009 base year, p. 45.
307 SP AusNet, Response to information requested on 22 January, confidential, submitted on 5 February 2010.
236 VICTORIAN DRAFT DISTRIBUTION DETERMINATION—DRAFT DECISION
expenditure is not a step change and should already be included in SP AusNet’s base opex.
Similarly, the AER considers that the proposed step change regarding substation earthing systems does not represent a change in SP AusNet’s operating environment. Accordingly, the AER considers switchyard resurfacing and earth grid testing to be part of the normal ongoing operation of a prudent and efficient DNSP. As this expenditure is not a step change, it should already be included in SP AusNet’s base opex.
In determining the reasonableness of SP AusNet’s condition monitoring and power transformer refurbishment proposals, the AER sought advice from Nuttall Consulting. Nuttall Consulting found that:
With respect to condition monitoring, one of the key outcomes of this proposal would be that SP AusNet improved its knowledge of the condition of its assets. It noted that this should result in reduced asset failures and/or life extension, reduced outages and associated fault and maintenance expenditures. Nuttall Consulting concluded that the lack of any quantitative benefits associated with this proposal was not reasonable and that SP AusNet had not demonstrated its proposal was prudent and efficient.308
With respect to power transformer refurbishment, SP AusNet had not demonstrated that there was any external or internal driver that required anything other than an incremental change to its current practices. Nuttall Consulting also noted that SP AusNet did not intend to commence this proposal until 2011 and that the lack of any quantitative benefits associated with this proposal was not reasonable. Nuttall Consulting concluded that the lack of quantified benefits resulted in it being unable to support this recommendation.309
The AER agrees with Nuttall Consulting’s review of SP AusNet’s condition monitoring and power transformer refurbishment proposals. The AER further notes that any business process improvements which result in lower costs will be self financing as the net costs should be expected to be less than those reflected in the revenue requirement. In addition, the AER considers that SP AusNet has not demonstrated that these proposals are linked to a new or changed regulatory obligation or requirement.
Based on the information provided by SP AusNet, advice from Nuttall Consulting and the analysis undertaken by the AER, the AER considers that it is not reasonable for SP AusNet’s condition monitoring and power transformer refurbishment proposals to be included in the opex forecasts for SP AusNet’s proposed step changes.
More broadly, the AER notes that the NER requires the AER to have regard to the benchmark expenditure that would be incurred by an efficient DNSP over the regulatory control period. The AER also notes that no other Victorian DNSP has sought, as part of its regulatory proposal for the forthcoming regulatory control
308 Nuttall Consulting, Victorian Electricity Distribution Revenue Review, March 2010, pp. 265–266. 309 ibid.
APPENDIX L—OPERATING EXPENDITURE STEP CHANGES 237
period, approval for step changes of the type described above. The AER therefore considers that it is not reasonable for these projects to be included in SP AusNet’s proposed step changes and has therefore excluded them.
AER conclusion
For the reasons discussed above and as a result of the AER’s consideration of SP AusNet’s regulatory proposal and other supporting information, the AER is not satisfied that the proposed opex step changes considered above reasonably reflect the opex criteria, including the opex objectives. In coming to this view the AER has had regard to the opex factors.
L.4.17 Additional step changes proposed by United Energy
United Energy proposed five specific additional step changes. However, the AER notes that United Energy’s demand management initiative step change has not been considered in this section as it has been considered in the demand management incentive scheme (DMIS) chapter—chapter 17. The AER notes that this expenditure was proposed by United Energy under the DMIS.
United Energy’s remaining four proposed step changes totalled $1.4 million ($2010) and are discussed below.
Additional marketing—forecast $0.4 million ($2010) to market itself more proactively as a stand-alone distribution company, and establish a profile in the community and with various stakeholder groups.310
Premium feed-in tariff—forecast $0.9 million ($2010) to recover the administrative costs of managing and complying with the premium feed-in tariff scheme through the ‘billing and revenue’ component of forecast opex.311
Zone substation secondary spares maintenance—forecast $10 000 ($2010) to undertake a periodic maintenance regime for electronic based secondary spare equipment (particularly protection and control relays), to ensure spare equipment is serviceable and ready for use at all times.312
Zone substation power quality metering maintenance—forecast $85 000 ($2010) to establish a routine maintenance policy for power quality meters installed during the 2001–05 regulatory control period.313
AER considerations and conclusion
With respect to the proposed additional marketing expenditure, the AER notes that a bottom-up build of costs has been undertaken by United Energy. However, the AER further notes that it has assessed United Energy’s regulatory proposal in accordance with a revealed cost approach. As such, a base year operating expenditure amount has
310 United Energy, Regulatory proposal, Appendix B-7, p. 4. 311 ibid., pp. 20–21. 312 United Energy, Regulatory proposal: Appendix B-7, p. 5; United Energy, Response to information
requested on 22 January 2010, confidential, submitted on 5 February 2010. 313 United Energy, Regulatory proposal: Appendix B-7, p. 6 and pp. 18–19.
238 VICTORIAN DRAFT DISTRIBUTION DETERMINATION—DRAFT DECISION
been derived for United Energy based on a combination of Jemena Asset Management’s 2008 regulatory accounts and United Energy’s internal cost models. The base year costs capture the normal ongoing operating costs of United Energy, from which any marketing costs are expected to be included. In addition, the AER notes that:
the proposed step change does not represent a new or changed regulatory obligation; and
United Energy has not provided a cost-benefit analysis to quantify the expected benefits to customers from undertaking this additional marketing expenditure.
For the reasons discussed above, and as a result of the AER’s consideration of United Energy’s regulatory proposal and other supporting information, the AER is not satisfied that the proposed opex step change for additional marketing expenditure reasonably reflects the opex criteria, including the opex objectives. In coming to this view the AER has had regard to the opex factors.
With respect to the premium feed-in tariff step change, the AER has not accepted United Energy’s proposed approach. This issue is discussed further in chapter 4 which sets out the AER’s draft decision on the control mechanism for standard control services. Consistent with this approach, and as a result of the AER’s consideration of United Energy’s regulatory proposal and other supporting information, the AER is not satisfied that the proposed opex step change to recover the administrative costs of managing and complying with the premium feed-in tariff scheme reasonably reflects the opex criteria, including the opex objectives. In coming to this view the AER has had regard to the opex factors.
For secondary spares maintenance and power quality metering maintenance, the AER notes that these proposed step changes are essentially the same as two of Jemena’s ‘capex/opex balance’ step changes discussed in section L.4.12. Consistent with the analysis in that section, the AER does not consider that United Energy has demonstrated that these proposals are driven by a new or changed regulatory obligation or a change in operating environment.
Further, with respect to secondary spares maintenance, United Energy was unable to clearly state the benefits of the proposed expenditure other than to note that a failure to implement the practice increased the risk that the spare equipment would not be serviceable when required.314 The AER notes Nuttall Consulting’s analysis of Jemena’s secondary spares maintenance step change and considers its analysis is also applicable to United Energy.315 Based on this analysis, and the information provided by United Energy, the AER considers that:
the risk that a spare unit may not be available has not changed as current practice is not to energise the spare units
314 United Energy, Response to information requested on 22 January 2010, confidential, submitted on
5 February 2010. 315 Nuttall Consulting, Victorian Electricity Distribution Revenue Review, p. 346.
APPENDIX L—OPERATING EXPENDITURE STEP CHANGES 239
there is ambiguity associated with how long the manufacturer recommendations have been in place and whether there have been historical failures of spare equipment that have impacted on performance
there is a lack of clarity regarding the failure of a spare unit and whether there is more than one spare or alternate options for interim operations
whether, if a replacement unit costs $10 000, it is economically justified to spend $10 000 every fours years to prevent a possible failure
United Energy does not appear to have considered the impact of new stock moving through the inventory and thereby deferring the need to power up the spares in question
the amount of expenditure suggests that United Energy has a volume of units, such that significant synergies could be achieved in the process.
With respect to power quality metering maintenance, the AER is not satisfied that United Energy has provided enough information about when the power quality meters were installed, and hence whether they should have been subject to maintenance in or prior to the currently regulatory control period.316 The AER notes that in relation to the same proposal for Jemena, Nuttall Consulting found that Jemena’s power quality meters ought to have been subject to maintenance in or prior to the current regulatory control period.317 If United Energy’s power quality meters were installed at a similar time—and United Energy has not provided information to suggest otherwise—it is reasonable to apply Nuttall Consulting’s advice to United Energy. As such, The AER considers that United Energy has failed to justify the case for additional opex.
For the reasons discussed above, and as a result of the AER’s consideration of United Energy’s regulatory proposal and other supporting information, the AER is not satisfied that the proposed opex step changes for secondary spares maintenance and power quality metering maintenance reasonably reflect the opex criteria, including the opex objectives. In coming to this view the AER has had regard to the opex factors.
L.5 AER conclusion Table L.20 sets out the AER’s decision on the amounts that will be added to the base operating and maintenance expenditure for each distributor for costs associated with opex step changes. These tables also include opex allowances associated with overhead cost allocation which are discussed in chapter 7.
316 United Energy, Regulatory proposal: Appendix B-7, pp. 18–19. 317 Nuttall Consulting, Victorian Electricity Distribution Revenue Review, p. 345.
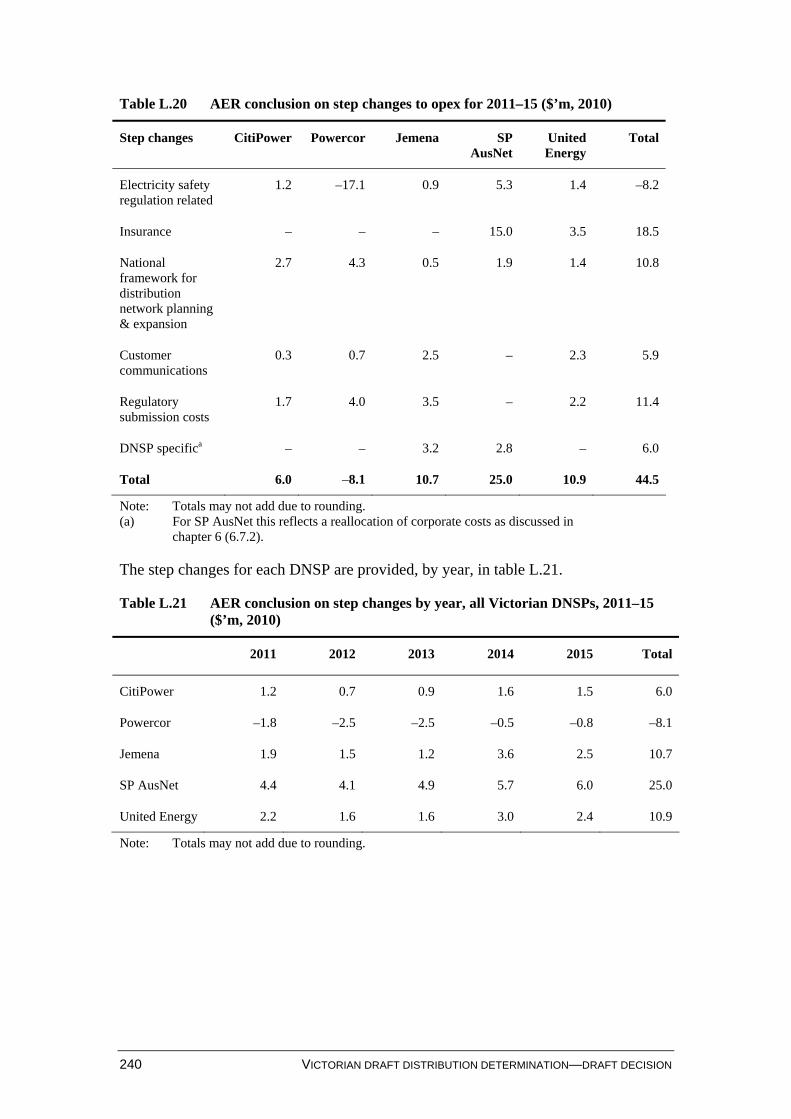
240 VICTORIAN DRAFT DISTRIBUTION DETERMINATION—DRAFT DECISION
Table L.20 AER conclusion on step changes to opex for 2011–15 ($’m, 2010)
Step changes CitiPower Powercor Jemena SP AusNet
United Energy
Total
Electricity safety regulation related
1.2 –17.1 0.9 5.3 1.4 –8.2
Insurance – – – 15.0 3.5 18.5
National framework for distribution network planning & expansion
2.7 4.3 0.5 1.9 1.4 10.8
Customer communications
0.3 0.7 2.5 – 2.3 5.9
Regulatory submission costs
1.7 4.0 3.5 – 2.2 11.4
DNSP specifica – – 3.2 2.8 – 6.0
Total 6.0 –8.1 10.7 25.0 10.9 44.5
Note: Totals may not add due to rounding. (a) For SP AusNet this reflects a reallocation of corporate costs as discussed in
chapter 6 (6.7.2).
The step changes for each DNSP are provided, by year, in table L.21.
Table L.21 AER conclusion on step changes by year, all Victorian DNSPs, 2011–15 ($’m, 2010)
2011 2012 2013 2014 2015 Total
CitiPower 1.2 0.7 0.9 1.6 1.5 6.0
Powercor –1.8 –2.5 –2.5 –0.5 –0.8 –8.1
Jemena 1.9 1.5 1.2 3.6 2.5 10.7
SP AusNet 4.4 4.1 4.9 5.7 6.0 25.0
United Energy 2.2 1.6 1.6 3.0 2.4 10.9
Note: Totals may not add due to rounding.
APPENDIX M—SELF INSURANCE 241
M Self insurance
M.1 Introduction The Victorian DNSPs each included an allowance for self insurance within their operating expenditure (opex) forecast for the forthcoming regulatory control period. Jemena, SP AusNet and United Energy each provided a board resolution to self insure the risks identified in their regulatory proposal.1 CitiPower, Powercor, SP AusNet and United Energy engaged Aon Global Risk Consulting (Aon) and Jemena engaged Marsh Pty Ltd (Marsh) to quantify their current and future potential self insured risks.2 The risks identified and the annual self insurance premiums of those risks calculated by Aon and Marsh have been summarised in table M.1
Victorian DNSPs all proposed that self insurance should be allowed for risks which:
cannot be externally insured3
external insurance is available but is not economically efficient4
are covered by external insurance which require the DNSPs to pay a deductible amount (excess) when making a claim5
are not accounted for elsewhere in their regulatory proposals6
can be economically managed by the DNSPs.7
Based on this approach the Victorian DNSPs proposed self insurance for deductible amounts for risks which were externally insured and sought full self insurance for risks which were not externally insured.
In addition, United Energy proposed to self insure risks which were unforeseeable and therefore difficult to accurately forecast such as storms, bush fires and third party
1 CitiPower and Powercor stated that they did not have a board resolution to self insure but did
provide board minutes relating to the establishment of their Discretionary Risk Management Scheme (DRMS) with CHED Services which encompasses self insurance arrangements and of which CitiPower and Powercor are members. CitiPower and Powercor also provided the AER with the Constitution under which the DRMS was established, proof of membership of the DRMS and a document setting out the policy framework of the DRMS.
2 Aon Corporation provides risk management services, insurance and reinsurance brokerage, and human capital consulting, globally. See Aon website, http://www.aon.com.au/australia/site-map.jsp, viewed 26 May 2010; Marsh Pty Ltd provides risk and insurance services. See Marsh website, http://www.marsh.com.au/about_Marsh/index.php, viewed 26 May 2010.
3 CitiPower, Regulatory proposal 2011 to 2015, 30 November 2009, pp. 178–179; Powercor, Regulatory proposal 2011 to 2015, 30 November 2009, pp. 179; SP AusNet, Electricity Distribution Price Review, Regulatory proposal, November 2009, pp. 229–232; United Energy, Regulatory proposal for distribution prices and services, January 2011–December 2015, November 2009, pp. 73.
4 ibid. 5 ibid.; United Energy, Regulatory proposal, p. 74. 6 ibid.; United Energy, Regulatory proposal, p. 73. 7 ibid.; United Energy, Regulatory proposal, p. 74.
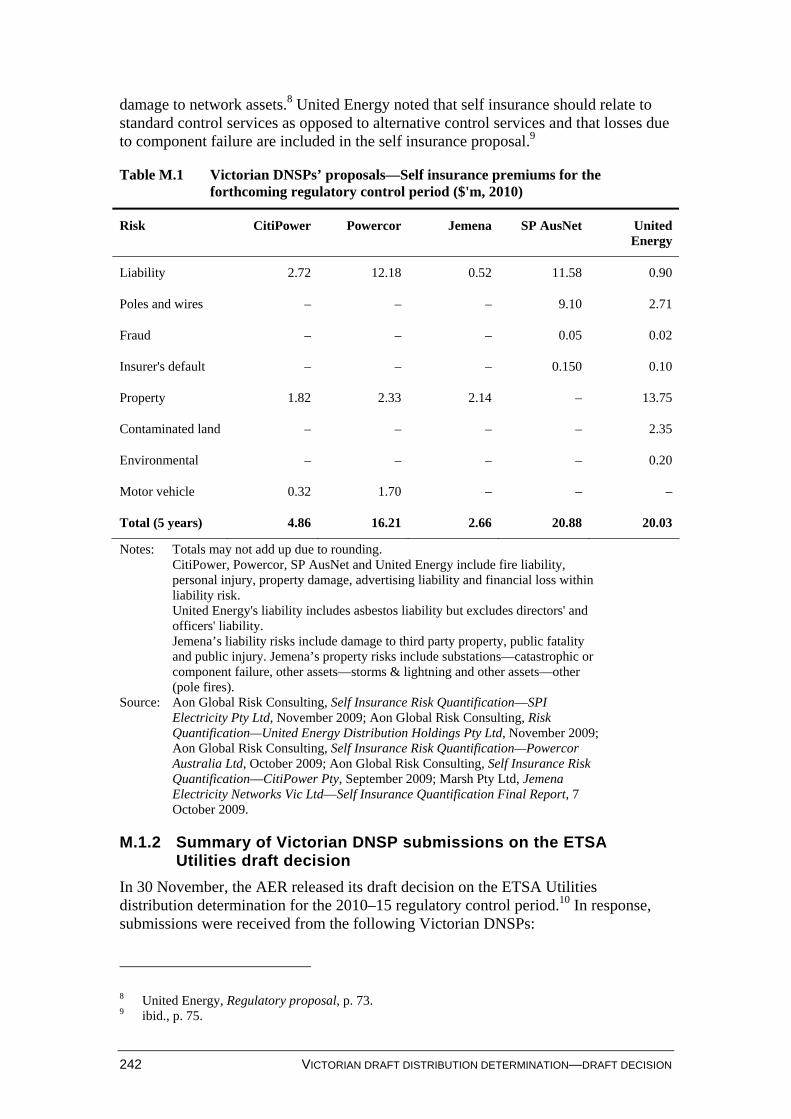
242 VICTORIAN DRAFT DISTRIBUTION DETERMINATION—DRAFT DECISION
damage to network assets.8 United Energy noted that self insurance should relate to standard control services as opposed to alternative control services and that losses due to component failure are included in the self insurance proposal.9
Table M.1 Victorian DNSPs’ proposals—Self insurance premiums for the forthcoming regulatory control period ($'m, 2010)
Risk CitiPower Powercor Jemena SP AusNet United Energy
Liability 2.72 12.18 0.52 11.58 0.90
Poles and wires – – – 9.10 2.71
Fraud – – – 0.05 0.02
Insurer's default – – – 0.150 0.10
Property 1.82 2.33 2.14 – 13.75
Contaminated land – – – – 2.35
Environmental – – – – 0.20
Motor vehicle 0.32 1.70 – – –
Total (5 years) 4.86 16.21 2.66 20.88 20.03
Notes: Totals may not add up due to rounding. CitiPower, Powercor, SP AusNet and United Energy include fire liability,
personal injury, property damage, advertising liability and financial loss within liability risk.
United Energy's liability includes asbestos liability but excludes directors' and officers' liability.
Jemena’s liability risks include damage to third party property, public fatality and public injury. Jemena’s property risks include substations—catastrophic or component failure, other assets—storms & lightning and other assets—other (pole fires).
Source: Aon Global Risk Consulting, Self Insurance Risk Quantification—SPI Electricity Pty Ltd, November 2009; Aon Global Risk Consulting, Risk Quantification—United Energy Distribution Holdings Pty Ltd, November 2009; Aon Global Risk Consulting, Self Insurance Risk Quantification—Powercor Australia Ltd, October 2009; Aon Global Risk Consulting, Self Insurance Risk Quantification—CitiPower Pty, September 2009; Marsh Pty Ltd, Jemena Electricity Networks Vic Ltd—Self Insurance Quantification Final Report, 7 October 2009.
M.1.2 Summary of Victorian DNSP submissions on the ETSA Utilities draft decision
In 30 November, the AER released its draft decision on the ETSA Utilities distribution determination for the 2010–15 regulatory control period.10 In response, submissions were received from the following Victorian DNSPs:
8 United Energy, Regulatory proposal, p. 73. 9 ibid., p. 75.
APPENDIX M—SELF INSURANCE 243
CitiPower and Powercor
SP AusNet
United Energy
CitiPower and Powercor submitted a joint response in which they had engaged Aon to review the AER's draft decision. Aon's report commented on the calculation of self insurance and matters that electricity businesses should consider in deciding whether to self insure.11
United Energy and SP AusNet both raised concerns with the AER's assertion that self insurance for underground damage and environmental liability reduces the incentive for businesses to prevent environmental liability.12 SP AusNet and United Energy submitted that self insurance provides an incentive for the network service provider to manage and control the risk.13
SP AusNet and United Energy also raised issues with the AER's assertion that self insurance relates to uncontrollable costs (citing the example of motor vehicle risks).14 SP AusNet and United Energy stated that no risk is entirely uncontrollable. Both DNSPs further stated that if motor vehicle risks were self insured the service provider would have the incentive to reduce the risk.15 SP AusNet submitted that the AER's decision to reject a self insurance allowance for motor vehicle risks was inconsistent with the revenue and pricing principles set out in the National Electricity Law (NEL) in relation to the recovery of efficient costs.16
SP AusNet further submitted that the AER's assertion that the impairment of a key income generating asset would result in a service provider being unable to generate income and repair the asset is uncorroborated. SP AusNet stated that the impairment of a particular asset will not affect a service provider's ability to produce revenue, given that networks service providers usually have:
… very significant regulatory asset base values, with geographically dispersed assets, and operate within a defined regulatory framework …17
In response to the AER's preference to consider losses associated with key income producing asset events as pass through events, SP AusNet and United Energy stated that not all costs may be recovered if they do not meet the pass through materiality
10 The AER's approach to self insurance in the ETSA Utilities draft and final decisions is outlined in
the decision documents, see AER South Australia Distribution determination, 2010-2015, Final decision, appendix G.
11 Aon Global Risk Consulting, CitiPower and Powercor Australia Ltd—Self Insurance Overview in Response to AER Draft ETSA Determination, February 2010, p. 5.
12 SPI Electricity Pty Ltd, Submission to the AER's Draft Distribution Determination for South Australia, 16 February 2010, p. 3; United Energy Distribution, Submission to the AER's Draft Decision for ETSA Utilities 2010-2015, 16 February 2010, pp. 1–2.
13 ibid. 14 ibid. 15 ibid. 16 SP AusNet, Submission to the AER, pp. 3–4. 17 SP AusNet, Submission to the AER p. 2.
244 VICTORIAN DRAFT DISTRIBUTION DETERMINATION—DRAFT DECISION
threshold and service providers should have the opportunity to recover efficient costs as required by the revenue and pricing principles of the NEL.18 More generally, SP AusNet and United Energy stated that the cost pass through mechanism compared with the self insurance mechanism offers weaker incentives for network service providers to reduce the risk of events occurring and reducing costs if they do occur.19 SP AusNet and United Energy further commented that ex post reviews conducted by the AER as part of the pass through mechanism increase regulatory risk faced by the DNSPs.20
In addition, SP AusNet raised concerns that the lack of stakeholder consultation on the AER's position in the ETSA Utilities draft decision (prior to the release of the draft decision) 'creates regulatory risk'.21
CitiPower and Powercor also made a joint submission on the AER's role in interpreting the National Electricity Rules (NER) (made in the context of the ETSA Utilities determination process). In this submission CitiPower and Powercor stated:
In the Businesses' view, assessing self insurance is like assessing any other category of opex. The AER should consider whether the premiums are in the range that reasonably reflects the opex criteria. To substitute a set of 'key assessment criteria' for the statutory test gives rise to the possibility that the AER will fall into error in this regard. In addition, as discussed further below, after assessing self insurance premiums, the Businesses consider that the AER should assess total forecast opex and make decision in respect of total forecast opex, rather than a single element of that forecast. 22
M.1.3 Summary of submissions
In commenting on the AER's position in the ETSA Utilities draft decision, the Energy Users Coalition of Victoria (EUCV) stated that:
In its detailed assessment of increases in opex for self insurance, the AER took a firm line in its review of the ETSA Utilities claims for increased costs.23
The EUCV considered that the AER should take a similar approach in assessing the Victorian DNSPs' regulatory proposals.24
M.1.4 Regulatory Information Notice (RIN) requirements
In accordance with the RIN, for each self insurance allowance sought, the Victorian DNSPs were asked to provide:
a description of the risk
18 SP AusNet, Submission to the AER, p. 4; United Energy, Submission to the AER, p. 2. 19 SP AusNet, Submission to the AER, p. 3; United Energy, Submission to the AER, pp. 1–2. 20 ibid. 21 SP AusNet, Submission to the AER, p. 2. 22 CitiPower and Powercor, letter to the AER, Victorian Electricity Distribution Price Review,
2011–15—Interpretation of the National Electricity Rules, p.2. 23 EUCV, A response to applications from CitiPower, Jemena, Powercor, SP AusNet and
United Energy, February 2010, p. 60. 24 ibid.
APPENDIX M—SELF INSURANCE 245
a description of the calculation of the self insurance risk premium (for example, probability multiplied by consequence) including the size of the premium proposed for each regulatory year
a report from an actuary who is qualified to provide such advice on the calculation of each self insurance risk premium
any quotes obtained from external insurers.
The DNSPs were also asked to explain:
why compensation should be provided for the risk
where insurance is available from an external insurer(s) and an insurance quote has been obtained
the amount insured for which the quote related
the annual amount of the premium so obtained
the size of the deductible
the terms and conditions of the insurance
how and whether the risk for which self insurance is being sought is not recovered through any other mechanism.
This information was sought from the Victorian DNSPs so that the AER could make an assessment of the efficiency of forecast expenditure, and ensure these risks were best compensated for through a self insurance allowance (as opposed, for example, to a pass through). This information was not intended to form a set of 'qualifying' criteria against which the AER might approve or reject each self insurance allowance, as proposed by United Energy.25 The AER assessed the efficiency of such expenditure against the relevant requirements in the NEL and NER, though the AER may develop more detailed criteria for assessment where necessary, for example, to assist it in implementing the NEL and NER. The development of the AER's conceptual approach to the treatment of self insurance is discussed below.
M.2 Issues and AER considerations—conceptual approach to self insurance
The AER has formed a conceptual framework, which it has used to assess the Victorian DNSPs’ proposed self insurance categories and self insurance allowances for the forthcoming 2011–15 regulatory control period.
Events for which the DNSP may be granted a self insurance allowance are those where the DNSP bears the risk of an event. The occurrence of such events (and potentially, their cost) cannot be accurately forecast. Self insurance may also be
25 United Energy, Regulatory proposal, pp. 72–73.
246 VICTORIAN DRAFT DISTRIBUTION DETERMINATION—DRAFT DECISION
necessary if insurance is not available or only available on uneconomic terms or conditions. In some instances, self insurance is sought in addition to purchased insurance. Some DNSPs seek to self insure for the excess amount (deductibles), which is the amount DNSPs are liable to pay if they make a claim with their insurer. It is important to note that self insurance should only be for risks that are not otherwise remunerated through other components of the total revenue building blocks.
Relevant considerations in developing the AER's approach to assessing self insurance are set out below. Several of these considerations also relate to the treatment of cost pass through arrangements for the 2011–15 regulatory control period, which are discussed in further detail at chapter 16 of this draft determination.
M.2.1 Previous regulatory treatment
Previous AER approach (ETSA Utilities) In its recent final distribution determination for ETSA Utilities, the AER stated that:
Self insurance is an alternative risk management method to external insurance, where the network service provider bears the risk of an event that is beyond the network service provider’s control. Self insurance may also be necessary if insurance is not available or only available on uneconomic terms or conditions. It is important to note that self insurance should only be for risks that are not otherwise remunerated through other components of the total revenue building blocks.26
The AER considered the following when assessing proposed self insurance events consistent with the opex criteria, including: the attitude of the network service provider to managing risk and its capacity
to self insure
the approaches to funding a future loss when a self insurance event occurs
the reporting and administration of self insurance
whether an insurance premium can be determined and whether the self insurance event relates to an incurred cost
whether the premium estimated is an efficient cost.27
The above criteria related to the assessment of proposed self insurance allowances in the ETSA Utilities draft determination. These criteria were also used for assessment in the final decision for ETSA Utilities. However, in that determination the AER further stated that:
if the self insurance event relates to a ‘business as usual cost’ or ‘ongoing business activity’, the cost is to be excluded from self insurance.28
26 AER, South Australian distribution determination 2010–11 to 2014–15, Final decision, May 2010,
pp. 504–505. 27 AER, South Australian distribution determination, Final decision, May 2010, p. 486. 28 ibid., p. 505.
APPENDIX M—SELF INSURANCE 247
The AER noted that only insurable risks should be allowed for self insurance. That is, risks which are predictable and measurable and when incurred, result in the DNSPs' costs being recorded within the revenue building block components. The AER considered that self insurance will not be allowed for events which relate to loss of value (for example, key person risk and business interruption).
In the ETSA utilities determination, the AER also considered that costs which are 'not uncontrollable' should not be included as self insurance allowances (and that 'business as usual' costs should also be excluded from self insurance).29
M.2.2 Previous Victorian approach (EDPR 2001–05)
For the 2001–05 Electricity Distribution Price Review (EDPR), the Victorian DNSPs proposed allowances to compensate for asymmetric events, in the form of an increment to the weighted average cost of capital (WACC).
The Office of the Regulator-General, Victoria (ORG, now ESCV), noted that only downside asymmetric risks were identified by the Victorian DNSPs, and that this could result in DNSPs being compensated for downside events whilst retaining the benefits of upside events.30 As a result, the ORG based its decision on the assumption that the Victorian DNSPs' proposals were 'deliberately conservative'.31
In determining the appropriate self insurance allowances for the distributors, the ORG considered:
whether the risk had already been taken into account in setting expenditure benchmarks
whether the risk could be compensated by potential upside events.32
The ORG determined that general events which affect expenditure had been accounted for through setting of expenditure benchmarks, or would be compensated by potential upside events. In relation to non-routine network related events, the ORG determined that costs relating to such events had been adequately allowed for in the operating benchmarks.33
The ORG concluded that high-cost low probability events can be treated through self insurance or as a pass through event.34 However, the ORG noted three issues with self insurance. First, that the self insurance approach assumes DNSPs can accurately quantify the cost of such events. Second, the ORG considered that where DNSPs do not have formal insurance, there is a moral hazard risk to customers in that they will pay the self insurance premium whilst the DNSP may not be able to carry the risk
29 ibid., p. 490. 30 ORG, EDPR 2001-2005, Statement of purpose and reasons, September 2000, Vol.1, p. 318. 31 ibid. 32 ibid. 33 The ORG noted costs such as additional operating costs incurred in restoring customer supply and
damage to DNSP's assets from major natural events. The ORG did allow an allowance of $0.75 million for distributor liabilities to third parties. This allowance was raised by rural distributors who faced the possibility of third party damage claims arising from bushfires.
34 ORG, EDPR 2001-2005, September 2000, Vol.1,, p. 320.
248 VICTORIAN DRAFT DISTRIBUTION DETERMINATION—DRAFT DECISION
when the event actually occurs.35 Third, it was noted that a distinction should be drawn between recurrent events and non-recurrent events.36
Where DNSPs had submitted an allowance for the risk of major asset failure, the ORG noted that:
DNSPs' assets are geographically spread and therefore it is unlikely that associated costs would be significant
new capital expenditure will be transferred to the regulatory asset base (RAB) and therefore the DNSP would only need to finance costs for the regulatory control period
the DNSP only would be liable for costs not covered already by insurance, such as exceeding maximum allowance and the deductible amount
the majority of costs arising from such events will relate to legal action arising from the DNSPs' failure to supply. ORG considered that DNSPs were usually insured for such liabilities.37
DNSPs submitted that self insurance is more efficient in certain cases and that if the ORG only provided an allowance for external commercial insurance purchased by the DNSPs there would be a 'bias' against the use of self insurance.38 The ORG noted that it would conduct further reviews to encourage DNSPs to have an incentive to self insure to the extent that this is efficient.
M.2.3 Previous Victorian approach (EDPR 2006–10)
In the 2006–10 EDPR the ESCV noted a need to provide distributors with self insurance allowances. In the final decision the ESCV made allowances for self insurance to:
… ensure the distributors are provided with a reasonable level of funding for the frequent uninsured events that occur…39
The ESCV added self insurance to the base opex for AGLE ($0.1million), Powercor ($0.2 million) and SP AusNet ($0.5 million).40
The ESCV included an allowance of $250 000 per annum for third party claims arising out of bushfire claims for SP AusNet and Powercor.41
In the 2006–10 EDPR, the ESCV also noted (in relation to SP AusNet's claim for poles and wires):
35 ibid. 36 ibid. 37 In considering these points the ORG included a self insurance allowance of $600 000 million for
TXU's assets which were not externally insured. 38 ORG, EDPR 2001-2005, September 2000, Vol.1,, p. 137. 39 ESCV, EDPR 2006–10, Final Decision Volume 1, October 2006, p. 203. 40 ibid. 41 ibid.
APPENDIX M—SELF INSURANCE 249
… given that any assets installed will be rolled into the regulatory asset base at the time of the next price review, and given the absence of an efficiency carryover mechanism, the only costs incurred by SP AusNet are the financing costs for a period of approximately two and a half years. … the Commission considers that there should be some flexibility for the financing costs associated with capital expenditure above the forecast, up to a cap, to also be rolled into the regulatory asset base, based on the circumstances …The Commission considers that substantial losses of poles and wires may be a factor that is taken into account by the relevant regulator at the time of the next price review when considering whether these additional financing costs should be rolled into the regulatory asset base.42
M.2.4 Consideration of relevant factors
Asymmetric risk
As in other determinations, the Victorian DNSPs have only identified risks which result in cost increases (that is, downside risks) that they face. However, the AER considers that DNSPs should only be compensated for risks which are negatively asymmetric in aggregate, and if not compensated for would result in the expected return being less than the regulatory WACC. This means that the potential downside risks to the service provider (which are not already compensated through the capex forecasts, other components of the opex forecast, or elsewhere in the regulatory regime) outweigh the potential upside risks to the service provider.43
The ORG noted that upside events are difficult to quantify (and subsequently used to balance downside events), citing the issue of information asymmetry between the regulator and the DNSP.44 However, that did not prevent the ORG from including the potential of upside events occurring as a criterion in determining whether an allowance should be made for downside risks submitted by DNSPs.
The ORG was of the opinion that upside events should be considered when considering the DNSPs' proposed downside events by considering objective data such as:
the actual financial performance of DNSPs in prior regulatory control periods
the accepted fact that most utilities trade significantly above their regulatory asset values and earn above benchmark returns
evidence of utilities in other jurisdictions exceeding benchmarks.45
Compensation of risks through other areas of the regulatory regime
There are various mechanisms through which a DNSP can recover its efficient costs. These include:
42 ibid., p. 237 43 That is, overall, the negative asymmetric risk (for example, a severe storm risk) must outweigh the
upside asymmetric risks (for example, little to no bad investment risk). 44 ORG, Draft Electricity Distribution Price Review, 2001-2005, Vol. 1, p. 136. 45 ORG, EDPR 2001-2005, September 2000, Vol. 1, p. 327.
250 VICTORIAN DRAFT DISTRIBUTION DETERMINATION—DRAFT DECISION
Through other components of the opex forecast—the opex forecast (excluding the self insurance component) provides compensation for recurrent risks such as routine network maintenance. This compensation arises due to the historical base year costs being projected forward to forecast opex. Accordingly, only the incremental costs above base year costs associated with events with increasing probability in each year of the regulatory control period should be considered for inclusion in the self insurance allowance. For the purposes of determining the appropriate opex base year amount, any actual incurred costs associated with self insurance risks should be excluded from the base year to avoid a double-counting with the self insurance allowance. The AER has therefore removed actual incurred costs associated with self insurance risks from the calculation of the opex base year in this draft decision (this is relevant for CitiPower and Powercor in particular).
Through the capex forecast and RAB—at the end of the regulatory control period, the actual capex incurred on the distribution system is rolled into the RAB. Therefore, the AER considers that events relating to capex costs should be excluded from the self insurance component of the opex forecast to avoid a double-recovery of these costs.
Through the WACC—in respect of systematic risks.
As noted in chapter 16, when assessing whether particular risks or costs are to be treated as pass through events or compensated through the self insurance component of the opex allowance, the regulator should consider the foreseeability, probability, magnitude and controllability of those risks or costs. The relationship between foreseeability, probability and magnitude and the consequence of whether such events are more appropriately treated as self insurance or pass throughs is discussed in more detail at chapter 16 of this draft decision. The issue of controllability is discussed below.
M.2.4.1 Insurance deductibles
As previously noted the Victorian DNSPs are seeking self insurance for the deductible amount for risks which are externally insured. Where a distributor is externally insured the deductible amount refers to the amount distributors have to pay if they make a claim to their external insurers. There is no allowance for the deductible amount within the total revenue building blocks. Therefore, the AER considers that deductibles should be compensated for in the regulatory regime. This is because it would be uneconomic for the DNSPs to seek insurance for the below deductible amount (and these costs would be unnecessarily passed onto customers).
Whilst the AER will accept deductibles on the basis they are more efficient than seeking external insurance for below deductible amounts, there are other relevant considerations which might lead the AER to reject self insurance allowances even where they relate to insurance deductibles.
Controllability
As summarised above, in response to the AER's ETSA Utilities draft decision, SP AusNet and United Energy lodged submissions stating that they disagreed with the
APPENDIX M—SELF INSURANCE 251
AER's assertion that self insurance should only relate to uncontrollable risks. SP AusNet and United Energy argued that no risk is absolutely uncontrollable.46
On further consideration, the AER considers there may be merit in SP AusNet and United Energy 's arguments that controllable risks should be included within the self insurance allowance (subject to where there are negative asymmetric risks in aggregate). The AER agrees that providing compensation for controllable risks through an ex ante self insurance allowance (typically based on the expected probability and cost of the event) may incentivise the DNSP to mitigate the probability and cost impact of the event in order to maximise its profitability. Accordingly, the AER considers that SP AusNet and United Energy's view that self insurance provides an incentive for the service provider to manage and control the risk is a reasonable point.47
The approach to controllable risks in relation to self insurance should be contrasted with the treatment under pass through provisions. Where a DNSP has some control over the cost or timing of an event, but it is able to pass the consequential cost onto consumers via a pass through, it may have less incentive to mitigate both the probability and cost impact. While the pass through arrangements in the NER permit the AER to only allow DNSPs to pass through efficient costs, due to the information asymmetry between the regulator and the service provider, it may be difficult for the AER to fully recognise inefficient costs which DNSPs seek to pass through to consumers.
In general, where risks are within the reasonable control of the DNSP, an ex ante form of compensation (such as a self insurance allowance) provides for a more effective incentive to operate efficiently than an ex post form of compensation (such as pass through arrangements).
The AER considers that deductibles for external insurance policies can, in principle, be treated as self insurance allowances. The AER notes that the appropriate allowance for such deductibles would normally be calculated on a 'probability times consequence basis'. However, the deductible will not be permitted as a self insurance allowance where it is included in the base year opex for 2011–15, or where the costs associated with the risk are capital costs which will be subsequently rolled into the RAB at the commencement of the forthcoming regulatory control period.
The issue of information asymmetry between the regulator and service provider has been discussed above, and also in the pass through chapter of this draft determination (see chapter 16). DNSPs are incentivised to reveal the full costs of downside risks that they face in the regulatory regime (for example, risks for which they seek self insurance). The AER further notes that, because of the information asymmetry problem, potential upside risks faced by the DNSP are unlikely to be quantified such that they can be used to offset downside risks. The AER notes that several of the self
46 SP AusNet, Submission to the AER's Draft Distribution Determination for South Australia, 16
February 2010, p.3. United Energy Distribution, Submission to the AER's Draft Decision for ETSA Utilities 2010-2015, 16 February 2010, p. 2.
47 SP AusNet, Submission to the AER's Draft Distribution Determination for South Australia, 16 February 2010, p. 3. United Energy Distribution, Submission to the AER's Draft Decision for ETSA Utilities 2010-2015, 16 February 2010, p. 1.
252 VICTORIAN DRAFT DISTRIBUTION DETERMINATION—DRAFT DECISION
insurance categories proposed by the Victorian DNSPs for the 2011–15 regulatory control period relate to immaterial costs which are likely to be offset by immaterial upside risks enjoyed but not identified by the DNSPs. One of the NER revenue and pricing principles is to provide DNSPs with a reasonable opportunity to recover at least their efficient costs. As the immaterial downside risks identified by the DNSPs are likely to be mitigated by the unidentified upside risks, the AER considers the Victorian DNSPs will already have a reasonable opportunity to recover at least their efficient costs without an allowance for the immaterial downside risks they have identified.
The AER considers that this conceptual approach aligns with the opex criteria, factors and objectives contained in clause 6.5.6 of the NER. Relevant aspects of this approach are outlined below.
NER requirements
The AER concurs with CitiPower and Powercor's views. For this reason, the AER has aligned its proposed treatment of self insurance for the Victorian distribution determination 2011–15 with the opex objectives, criteria and factors set out in clause 6.5.6 of the NER.
Clauses 6.5.6 (1), (3) and (4) of the NER discuss the need to maintain the quality, reliability and security of supply of standard control services, and to maintain the reliability, safety and security of the distribution system through the supply of standard control services.48 The AER considers it important to allow recovery of costs associated with standard control services through allowing DNSPs to recover costs incurred throughout the regulatory control period. However, the AER notes that costs that would likely threaten the reliability, safety and security of standard control services (and the DNSPs' network)—that is, one-off costs of a high magnitude—are more appropriately recovered through the pass through arrangements provided for in the NER (and through this determination).
The AER notes the provisions in clause 6.5.6 (c) of the NER, which relate to the efficient costs of achieving the opex objectives and the costs that a prudent operator would incur in achieving the opex objectives. The AER considers that these are effectively embedded in the self insurance approach through two main principles:
permitting the DNSP to self insure for below deductible amounts, which the AER considers is a more efficient way to allow for recovery of those amounts (rather than, for example, disallowing the DNSPs to recover these through self insurance and incentivising the DNSP to seek insurance for the below deductible amount, which may be imprudent and an uneconomic or inefficient cost)
rejecting self insurance amounts where a representative amount is already in the DNSP’s base year. That is, where a DNSP seeks a self insurance amount for an event, and that event has occurred in the base year and the costs incurred from that event are representative of the amount sought for self insurance, the AER will not permit the proposed self insurance amount because it is already being recovered elsewhere (though the DNSP's base year).
48 NER, cl.6.5.6 (1)(a)(3); NER, cl. 6.5.6 (1)(a)(4).
APPENDIX M—SELF INSURANCE 253
M.2.5 Application of AER conceptual approach to Victorian DNSP regulatory proposals
The AER's draft decision on each type of risk proposed by the Victorian DNSPs is discussed below.
Liability risks (including bushfire liability)
All five DNSPs proposed self insurance allowances for liability risks.49
Jemena proposed self insurance allowances for damage to third party property, public fatalities, and public injury. The AER accepts each of these allowances on the basis that they relate to deductibles for external insurance policies, and are not recovered through the base year allowance.
For CitiPower, Powercor, SP AusNet and United Energy, Aon was commissioned to calculate self insurance premiums for liability risks. The AER notes that these amounts all relate to deductibles for externally held insurance policies which cover liability for fires, asbestos, and other liabilities. The self insurance allowances calculated by Aon were calculated by adding the historical losses for relevant liabilities and determining the value of future expected losses based on the historical incidence and frequency of those losses.50
For asbestos liability, United Energy claimed a separate allowance of $24 000 per annum. This was based on an expected frequency of one claim per 12.5 years, and a cost impact of $300 000 per claim (the deductible for the external insurance policy held by United Energy).51 The Aon report refers to only one previous claim, in 2005. On this basis, the AER notes that the costs associated with this risk are not already compensated for in the base year for United Energy. The AER considers that these costs should be recovered. The AER accepts the self insurance amounts for asbestos liability for United Energy as these costs relate to a below deductible amount held on external insurance policies.
For general liabilities, United Energy, SP AusNet, CitiPower and Powercor proposed allowances as follows:
United Energy—$155 192 per annum
SP AusNet—$2 316 000 per annum
CitiPower—$526 952 per annum
Powercor—$2 337 910 per annum.52
49 CitiPower, Regulatory proposal, pp. 179–184; Powercor, Regulatory proposal, pp. 178–184;
Jemena, Regulatory proposal, pp. 138–140; SP AusNet, Regulatory proposal, p. 231; United Energy, Regulatory proposal, p. 80.
50 See Aon reports for CitiPower, Powercor, SP AusNet and United Energy. 51 Aon, United Energy self insurance report, pp 11–15. 52 Aon, Powercor self insurance report, pp. 9–12.
254 VICTORIAN DRAFT DISTRIBUTION DETERMINATION—DRAFT DECISION
These are actual costs incurred by CitiPower for below deductible liability claims. For CitiPower, losses of $4 161 575 were recorded over 11 years (from 1998 to 2009).53 From 2005–2009, losses range from $456 860 (in 2005), to $702 947 (in 2009), which were incurred over 133 incidents/claims (an average of 26.6 per annum).54 This implies that these costs are incurred in most years of the regulatory control period. Accordingly, the self insurance allowance proposed by CitiPower has already been compensated through the actual incurred losses of 2009, the cost of which is included in CitiPower's base year (used to derive opex forecasts for 2011–15). The AER therefore rejects CitiPower's proposed self insurance allowance for liability risks.
Powercor, SP AusNet and United Energy all proposed allowances that incorporate general liability and fire liability.55 These related to below deductible amounts on external insurance policies. Claims for bushfire events carry a higher deductible of $10 million for SP AusNet and Powercor, and $5 million for United Energy.
Each Aon report details historical liability losses as follows:
United Energy—losses of $2 151 620 from 1997–200956
Powercor—losses of $14 229 350 from 1997–200957
SP AusNet—losses of $21 446 638 from 1990–2009.58
In addition to loss history, Aon made adjustments to each of these DNSP's self insurance allowances, based on the projected impacts of climate change (which were quantified in the study 'Bushfire Weather in Southeast Australia').59
The AER has considered the impact of climate change on Victorian DNSPs forecast costs in length at chapters 7 and 8). Whilst noting the impact of climate change on the Victorian DNSPs, the AER considers that the effects of climate change will continue to emerge progressively over time, rather than manifest themselves in the 2011–15 regulatory control period. For example, the increases in 'total fire weather' cited by Aon are not forecast to be realised until 2020. As circumstances change, the DNSPs would be expected to progressively respond in their planning and operating procedures over time. The AER notes also that these increases do not relate to new mandatory obligations or requirements which the DNSPs must adhere to. Accordingly, the AER considers that any climate change effects on the Victorian DNSPs will be gradual and will be dealt with as they arise in forthcoming regulatory control periods. The AER therefore rejects any incremental increases in self insurance
53 Aon, CitiPower self insurance report, pp. 9–11. 54 Aon, CitiPower self insurance report, Appendix 2, Attachment 1. 55 Aon , Powercor self insurance report, p. 9–12, Aon, SP AusNet self insurance report, p.. 7–11.
Aon, United Energy self insurance report, pp. 11–15. 56 Aon, United Energy self insurance report, p. 11. 57 Aon, Powercor self insurance report, p. 9. 58 Aon state that it has only used data from 2000–2009, as this more accurately reflects SP AusNet's
projected loss experience; Aon, SP AusNet self insurance report, p.7. 59 Bushfire weather in Southeast Australia, commissioned by the Climate Institute, conducted by
Bushfire Co-operative Research Centre, the Bureau of Meteorology, and CSIRO Marine and Atmospheric Research.
APPENDIX M—SELF INSURANCE 255
allowances based on predicted climate change for the 2011–15 regulatory control period.
The Aon report also made adjustments for an additional fire liability loss, stating that:
Based on the frequency of large bushfire events and the likely contribution of electricity distribution assets, we have incorporated a scenario of a $10 million loss occurring once every 20 years into our assessment. Whilst we acknowledge that bushfire mitigation practices have improved over time and some of the older events may possibly not be as large today if there were similar circumstances, the competing argument is that today, with a greater population and asset concentration, liability consequences on a per square kilometre basis are likely to be higher. For the purposes of calculating SPI Electricity’s self insurance cost we do not need to speculate on how large these bushfire liabilities may be in total, but hold the view there is a relatively high potential for a loss that fully erodes the $10 million retention carried by SPI Electricity.60
The AER notes that a 'major' fire event (that is, an event that may be described as a 'one in twenty year' event) has already occurred on SP AusNet's network, in February 2009. The policy deductible for bushfire claims is $10 million. Aon asserts that for a one in twenty year event, SP AusNet would incur that total cost of the deductible (that is, the liability would be beyond $10 million). However, the AER notes that the liability quantified so far (as at July) for 2009 is only at $1 963 637.61 The full cost of liabilities arising from the February 2009 bushfire event are yet to be quantified. The AER considers that the full costs should be representative of a major fire event and a forward looking self insurance allowance can be based on those losses. As a result, once costs have been quantified (the AER expects that this will happen as part of SP AusNet's revised regulatory proposal, and as the actual costs for 2009 will form the base year for the purposes of forecasting opex over 2011–15), the AER can make an assessment of the actual cost impacts of such an event, and determine an appropriate self insurance allowance for the deductible (if any) to compensate for any future events.
The AER intends to undertake a similar assessment of increased fire risks for Powercor, once 2009 actual costs are available, as Powercor also experienced major bushfires on its network in 2009.
The AER has considered the loss experience for general liability for Powercor, SP AusNet and United Energy to date. For general liability, the AER notes that the incurred annual losses over the current regulatory control period (2006–10) that the DNSPs have covered through their opex allowance, are representative of future expected losses (apart from 2009 bushfire losses for Powercor and SP AusNet, which the AER will assess as part of its final distribution determination). The historical losses are recurrent and have been included in the DNSPs’ base year opex. The AER does not consider it necessary to allow additional compensation for these risks. Accordingly, the AER rejects the general liability allowances for Powercor, SP AusNet and United Energy, and replaces them with $0. However, the AER notes that it will revisit the actual liability costs for 2009 arising from bushfire events for
60 Aon, SP AusNet self insurance report, p. 9 61 Aon, SP AusNet self insurance report, appendix 1, attachment 1.
256 VICTORIAN DRAFT DISTRIBUTION DETERMINATION—DRAFT DECISION
Powercor and SP AusNet and use these costs to determine an appropriate self insurance allowance (if any) to compensate for one in twenty year bushfire events.
Jemena proposed self insurance allowances for damage to third party property ($33 400 per annum), public fatalities ($10 100 per annum), and public injury ($60 800 per annum). The AER considers that these costs should be recovered. The AER accepts the self insurance amounts for damage to third party property, public fatalities and public injury for Jemena as these costs relate to a below deductible amount held on external insurance policies.
Property risks (including third party damage to DNSP assets)
CitiPower, Powercor, Jemena and United Energy each proposed an allowance for property risks.62 SP AusNet and United Energy also proposed allowances for poles and wires risks. Jemena further categorised their property risks into allowances for the following sub categories:
substations—catastrophic or component failure ($20 560 per annum)
other assets—lightning and storms ($11 400 per annum)
other assets—pole fires ($7 100 per annum)
third party damage to Jemena’s assets ($10 630 per annum).
Jemena sought a self insurance allowance for catastrophic failure and component failure at its zone substations. However, the AER notes Jemena's statement that:
When catastrophic or component failure of substations occurs, the resulting costs relate to asset replacement or repair and are generally capitalised.63
Given Jemena's capitalisation policy, the AER notes that any expenditure associated with zone station catastrophic or component failures will be rolled into Jemena's RAB at the end of the forthcoming regulatory control period, even if these costs are not included within the capex forecast. Accordingly, Jemena will recover these costs in future regulatory periods through the return on / return of asset building blocks. The only residual costs to Jemena are the financing costs between the time the expenditure is incurred and the end of the regulatory control period when these costs are rolled into the RAB. However, as these costs are not likely to be significant, the AER considers that these costs are unlikely to outweigh the upside risks enjoyed by Jemena such that Jemena does not face negative asymmetric risks in aggregate.
The AER rejects the self insurance allowance for other assets—storms and lightning. Although this allowance relates to a deductible for an external insurance policy, the Marsh report states:
62 United Energy, Regulatory proposal, p. 80; CitiPower Regulatory proposal pp.179–184; Powercor
Regulatory proposal pp. 178–184; Jemena, Regulatory proposal, pp. 138 –140. 63 Jemena, Regulatory proposal, p.139.
APPENDIX M—SELF INSURANCE 257
JEN experiences a high number of lightning strikes each year. In 2008, there were 23 lightning strikes hitting high foliage assets causing $2K of damage on average.64
On storms, the Marsh report further states:
In 2008, JEN had four storms events… JEN have received independent advice from AECOM that storm activity will increase from 2008 level due to climate change. This has led them to include an additional allowance for 2.3 high wind days over and above the 2008 level. That is the total number of days incorporate within JEN's adjusted opex is based on 6.3 days - a lower number of days that the historical average of 7.1 days. 65
The above statements imply that the costs associated with lightning and storms have already been incorporated into the base year, as they are recurrent in nature. On this basis, the AER notes that these risks are already compensated for in the opex forecasts for the 2011–15 regulatory control period.
Jemena experiences a number of lightening strikes and storms each year which result in costs. While some expenditure incurred will already be in Jemena's base year (and consequently already in its forecast opex), essentially Marsh argues that the frequency of the events in the base year is not representative of an average year.
Based on data provided by Jemena, Marsh has calculated the difference between the number of events in the base year and the long term average number of events and multiplied this difference by the average cost per event. For this purpose Marsh has assumed that 2008 is the base year. However, 2008 is only being used as the base year in this draft decision as a 'placeholder' estimate. The AER has accepted Jemena's proposal to use 2009 as the base year, and accordingly will update for 2009 expenditure in the final decision (audited 2009 expenditure was not available for this draft decision). However, it is not clear to the AER that 2009 is not a more 'representative' year in terms of frequency of lightning strikes and storms, and no data on 2009 has been provided to the AER. If Jemena provides substantiated frequency data for 2009 in its revised proposal then the AER will consider whether any self insurance allowance is required at the time of the final distribution determination, but for the purposes of this draft determination, rejects this allowance. In addition, the average costs in the Marsh report in support of Jemena's proposal have not been substantiated.
The AER rejects the self insurance allowance for pole fires. In calculating the self insurance allowance for pole fires, Marsh stated:
JEN experience 8 pole fires in 2008… the cost to repair/replace a pole is approximately $3K per incident. Thus, JEN's capital expenditure budget includes $18k in relation to pole fires. 66
This statement implies that Jemena capitalises the costs of replacing poles destroyed by pole fires. As such, any poles destroyed and subsequently replaced in the 2011–15 regulatory control period will be rolled into the RAB at the beginning of the 2016–20 64 Marsh, Jemena self insurance report, pp. 26–27. 65 ibid. 66 ibid., pp. 29–30.
258 VICTORIAN DRAFT DISTRIBUTION DETERMINATION—DRAFT DECISION
regulatory control period, even if those capex costs were not forecast as part of this distribution determination. The only cost borne by Jemena would be the cost of finance in the interim period between the capex being incurred and the beginning of the following regulatory control period.
There are several problems with Jemena's inclusion and quantification of pole fire risk in its self insurance allowance. Marsh stated:
JEN experienced 8 pole fires in 2008. We understand that the cost to repair / replace a pole is approximately $3k per incident. Thus, JEN's capital expenditure budget includes $18k in relation to poles.67
Marsh formed the view that eight incidents in a year does not represent a typical year.68 Marsh proceeded to adjust the probability of pole fires accordingly. However, with data from only two years presented, the AER considers Marsh has not demonstrated that eight is not a representative number of events. The eight events also relate to 2008 whereas 2009 expenditure will be used as the base opex in the final decision. In addition, the average costs in the Marsh report in support of Jemena's proposal have not been substantiated.
Moreover, from the above quote there appears to already be some costs associated with pole fires in Jemena's capex forecast, though the amount might be in error (that is, $18 000 is not the multiplication of eight and $3 000). Also, as the cost relates to repairs and replacement, Jemena may recognise this expenditure as capex, in which case this expenditure will be rolled into Jemena's RAB at the end of the forthcoming regulatory control period and recovered in future regulatory control periods. The only residual costs to Jemena are the financing costs between the time the expenditure is incurred and the end of the regulatory control period when these costs are rolled into the RAB. However, as these costs are not likely to be significant, the AER considers that these costs are unlikely to outweigh the upside risks enjoyed by Jemena such that it does not face negative asymmetric risk in aggregate.
SP AusNet and United Energy both proposed annual self insurance allowances for damage to pole assets (of $541 697 per annum and $1.8 million per annum respectively).69
The Aon report for SP AusNet cited bushfire events in February 2009 as an example of damage to poles and wires.70 SP AusNet, in its regulatory proposal, states that it has removed poles and wires expenditure incurred in 2009 from its base year.71 Whilst the AER accepts that this may be the case (and acknowledges that these costs are not capitalised), the AER considers that they are relatively minor when compared to the upside risks faced by the DNSPs. That is, the upside risks would outweigh the negative risks, such that there is unlikely to be net asymmetric downside risk to be compensated by a self insurance allowance. The AER therefore rejects SP AusNet's
67 Jemena, Regulatory proposal—Appendix 7.9: Marsh, Jemena—Self insurance risk quantification—
Final report, 7 October 2009, p.29. 68 As in 2003 there were 20 incidents. 69 United Energy, Regulatory proposal, pp.82–84, SP AusNet, Regulatory proposal, p. 232. 70 Aon, SP AusNet self insurance report, pp. 12–13. 71 SP AusNet, p.231.
APPENDIX M—SELF INSURANCE 259
proposed self insurance allowance for damage to poles and wires, and replaces it with an allowance of $0.
The Aon self insurance report for United Energy cited the storms of April 2008 and January 2009 as examples of poles and wires damage on each network.72 2009 will be used as the base year for United Energy opex forecast for the 2011–15 regulatory control period. The AER notes that actual costs incurred from poles and wires risk have not been excluded from United Energy 's base year, and that the Aon report commissioned by United Energy notes that losses of $1.8 million (approximately) were incurred in the base year.73 The AER further notes that if these costs are not recovered through other areas of the regulatory regime, they would be rejected on the basis that they are relatively small and would be likely outweighed by the upside risks faced by the DNSPs. The AER therefore rejects the poles and wires self insurance allowance proposed by United Energy and replaces it with an allowance of $0.
For CitiPower and Powercor (each proposed allowances of $362 417 and $465 536 per annum respectively), the AER notes that property losses used in these calculations (spanning from 2006–2009 for Powercor and 2005–2006 for CitiPower) both include losses incurred in the base year—approximately $450 000 for CitiPower and $380 000 for Powercor.74 Accordingly, the AER considers that these risks have already been compensated for in the base year for 2011–15 regulatory control period. On this basis, the AER rejects the property risks self insurance allowances for CitiPower and Powercor and replaces them with an allowance of $0.
For United Energy, the Aon report notes that expected costs associated with property risks have not been incorporated into the forecast capex and opex for the 2011–15 regulatory control period. However, the AER notes that the main property loss under this category was a $1.78 million transformer fire in 2004. The AER notes that the replacement cost associated with this would have likely been a capital cost. All incurred capex is rolled into the RAB, and recovered by United Energy. Should this event occur within the 2011–15 regulatory control period, it would be rolled into the RAB and recovered in the 2016–20 regulatory control period. To allow a self insurance allowance for this risk would mean that United Energy would recover these costs twice. On this basis, the AER rejects the property risks self insurance allowance proposed by United Energy and replaces it with an allowance of $0.
In relation to the third party damage to DNSP's assets risk proposed by Jemena, Marsh stated:
JEN incur a low level of annual costs in relation to property by third parties. The amounts are relatively immaterial and are already incorporated into the Opex. It is estimated that annual costs are approximately $175k p.a.75
72 Aon, United Energy Self insurance report, pp. 16–17, also see Appendix 3 which provides data
from losses in 2009. 73 Aon, United Energy Self insurance report, appendix 3, attachment 1. 74 Aon, Powercor self insurance report, appendix 1, attachment 1, Aon, CitiPower self insurance
report, appendix 1, attachment 1. 75 Jemena, Regulatory proposal—Appendix 7.9: Marsh, Jemena—Self insurance risk quantification—
Final report, 7 October 2009, p.30.
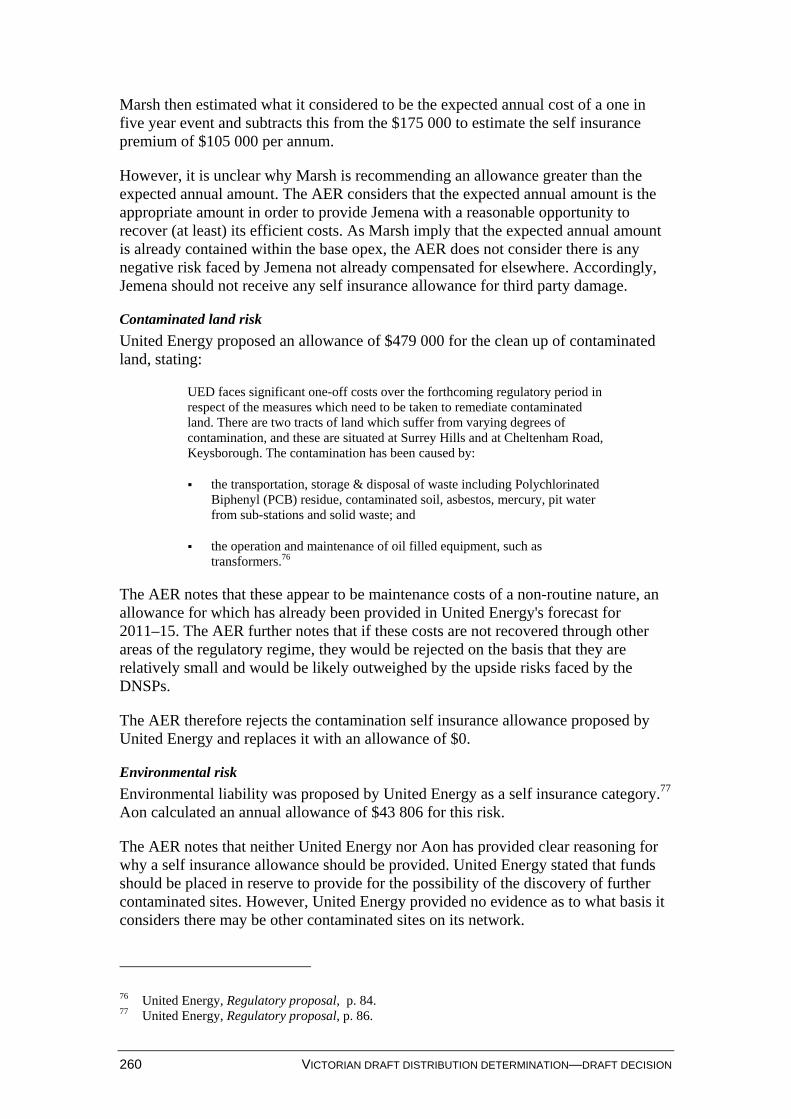
260 VICTORIAN DRAFT DISTRIBUTION DETERMINATION—DRAFT DECISION
Marsh then estimated what it considered to be the expected annual cost of a one in five year event and subtracts this from the $175 000 to estimate the self insurance premium of $105 000 per annum.
However, it is unclear why Marsh is recommending an allowance greater than the expected annual amount. The AER considers that the expected annual amount is the appropriate amount in order to provide Jemena with a reasonable opportunity to recover (at least) its efficient costs. As Marsh imply that the expected annual amount is already contained within the base opex, the AER does not consider there is any negative risk faced by Jemena not already compensated for elsewhere. Accordingly, Jemena should not receive any self insurance allowance for third party damage.
Contaminated land risk
United Energy proposed an allowance of $479 000 for the clean up of contaminated land, stating:
UED faces significant one-off costs over the forthcoming regulatory period in respect of the measures which need to be taken to remediate contaminated land. There are two tracts of land which suffer from varying degrees of contamination, and these are situated at Surrey Hills and at Cheltenham Road, Keysborough. The contamination has been caused by:
the transportation, storage & disposal of waste including Polychlorinated Biphenyl (PCB) residue, contaminated soil, asbestos, mercury, pit water from sub-stations and solid waste; and
the operation and maintenance of oil filled equipment, such as transformers.76
The AER notes that these appear to be maintenance costs of a non-routine nature, an allowance for which has already been provided in United Energy's forecast for 2011–15. The AER further notes that if these costs are not recovered through other areas of the regulatory regime, they would be rejected on the basis that they are relatively small and would be likely outweighed by the upside risks faced by the DNSPs.
The AER therefore rejects the contamination self insurance allowance proposed by United Energy and replaces it with an allowance of $0.
Environmental risk
Environmental liability was proposed by United Energy as a self insurance category.77 Aon calculated an annual allowance of $43 806 for this risk.
The AER notes that neither United Energy nor Aon has provided clear reasoning for why a self insurance allowance should be provided. United Energy stated that funds should be placed in reserve to provide for the possibility of the discovery of further contaminated sites. However, United Energy provided no evidence as to what basis it considers there may be other contaminated sites on its network.
76 United Energy, Regulatory proposal, p. 84. 77 United Energy, Regulatory proposal, p. 86.
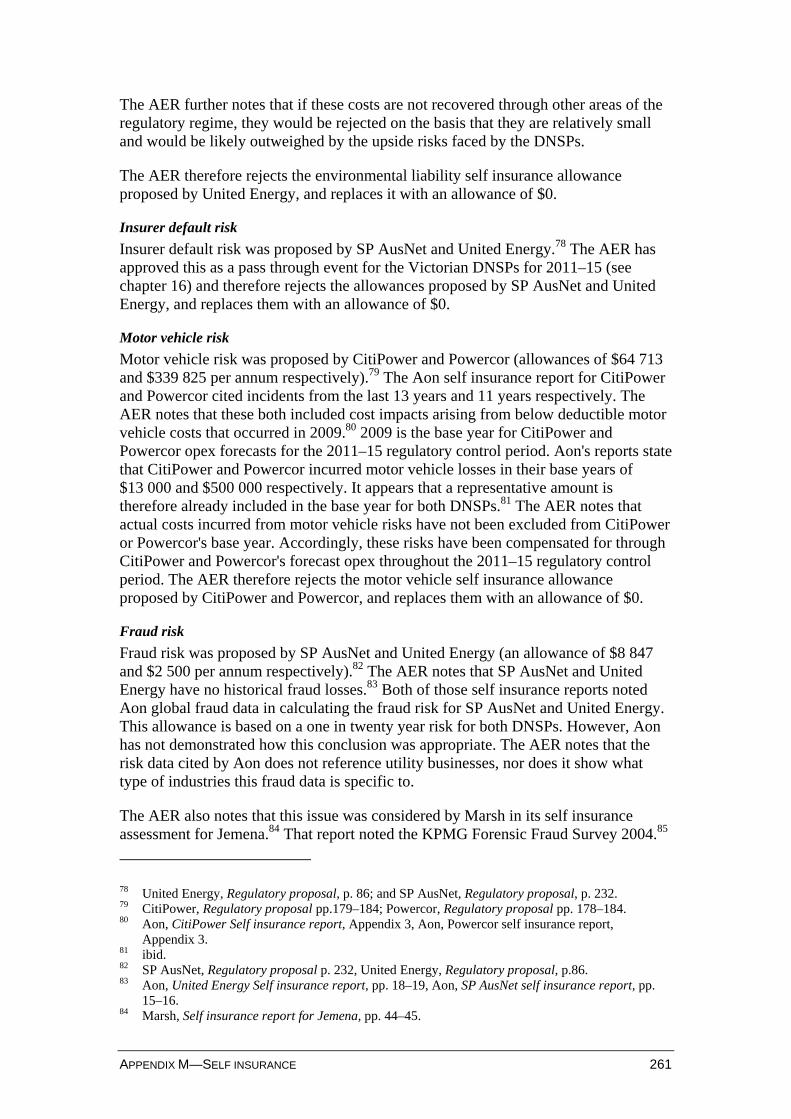
APPENDIX M—SELF INSURANCE 261
The AER further notes that if these costs are not recovered through other areas of the regulatory regime, they would be rejected on the basis that they are relatively small and would be likely outweighed by the upside risks faced by the DNSPs.
The AER therefore rejects the environmental liability self insurance allowance proposed by United Energy, and replaces it with an allowance of $0.
Insurer default risk
Insurer default risk was proposed by SP AusNet and United Energy.78 The AER has approved this as a pass through event for the Victorian DNSPs for 2011–15 (see chapter 16) and therefore rejects the allowances proposed by SP AusNet and United Energy, and replaces them with an allowance of $0.
Motor vehicle risk
Motor vehicle risk was proposed by CitiPower and Powercor (allowances of $64 713 and $339 825 per annum respectively).79 The Aon self insurance report for CitiPower and Powercor cited incidents from the last 13 years and 11 years respectively. The AER notes that these both included cost impacts arising from below deductible motor vehicle costs that occurred in 2009.80 2009 is the base year for CitiPower and Powercor opex forecasts for the 2011–15 regulatory control period. Aon's reports state that CitiPower and Powercor incurred motor vehicle losses in their base years of $13 000 and $500 000 respectively. It appears that a representative amount is therefore already included in the base year for both DNSPs.81 The AER notes that actual costs incurred from motor vehicle risks have not been excluded from CitiPower or Powercor's base year. Accordingly, these risks have been compensated for through CitiPower and Powercor's forecast opex throughout the 2011–15 regulatory control period. The AER therefore rejects the motor vehicle self insurance allowance proposed by CitiPower and Powercor, and replaces them with an allowance of $0.
Fraud risk
Fraud risk was proposed by SP AusNet and United Energy (an allowance of $8 847 and $2 500 per annum respectively).82 The AER notes that SP AusNet and United Energy have no historical fraud losses.83 Both of those self insurance reports noted Aon global fraud data in calculating the fraud risk for SP AusNet and United Energy. This allowance is based on a one in twenty year risk for both DNSPs. However, Aon has not demonstrated how this conclusion was appropriate. The AER notes that the risk data cited by Aon does not reference utility businesses, nor does it show what type of industries this fraud data is specific to.
The AER also notes that this issue was considered by Marsh in its self insurance assessment for Jemena.84 That report noted the KPMG Forensic Fraud Survey 2004.85
78 United Energy, Regulatory proposal, p. 86; and SP AusNet, Regulatory proposal, p. 232. 79 CitiPower, Regulatory proposal pp.179–184; Powercor, Regulatory proposal pp. 178–184. 80 Aon, CitiPower Self insurance report, Appendix 3, Aon, Powercor self insurance report,
Appendix 3. 81 ibid. 82 SP AusNet, Regulatory proposal p. 232, United Energy, Regulatory proposal, p.86. 83 Aon, United Energy Self insurance report, pp. 18–19, Aon, SP AusNet self insurance report, pp.
15–16. 84 Marsh, Self insurance report for Jemena, pp. 44–45.
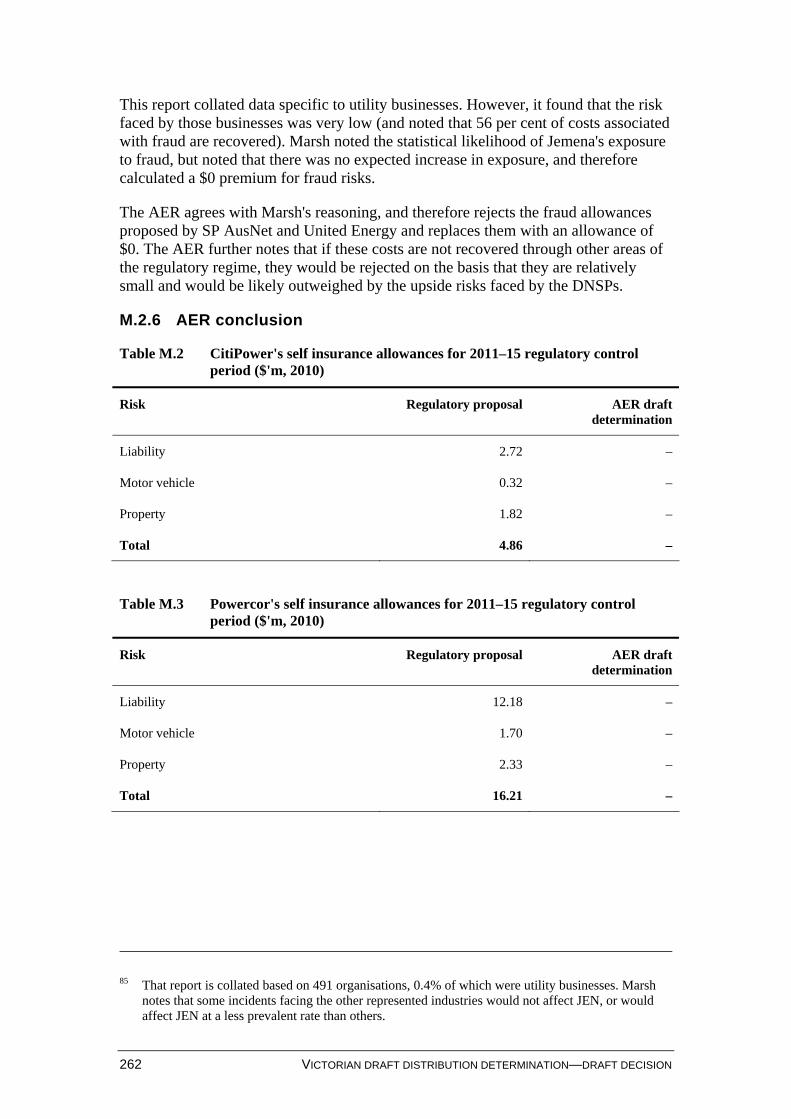
262 VICTORIAN DRAFT DISTRIBUTION DETERMINATION—DRAFT DECISION
This report collated data specific to utility businesses. However, it found that the risk faced by those businesses was very low (and noted that 56 per cent of costs associated with fraud are recovered). Marsh noted the statistical likelihood of Jemena's exposure to fraud, but noted that there was no expected increase in exposure, and therefore calculated a $0 premium for fraud risks.
The AER agrees with Marsh's reasoning, and therefore rejects the fraud allowances proposed by SP AusNet and United Energy and replaces them with an allowance of $0. The AER further notes that if these costs are not recovered through other areas of the regulatory regime, they would be rejected on the basis that they are relatively small and would be likely outweighed by the upside risks faced by the DNSPs.
M.2.6 AER conclusion
Table M.2 CitiPower's self insurance allowances for 2011–15 regulatory control period ($'m, 2010)
Risk Regulatory proposal AER draft determination
Liability 2.72 –
Motor vehicle 0.32 –
Property 1.82 –
Total 4.86 –
Table M.3 Powercor's self insurance allowances for 2011–15 regulatory control period ($'m, 2010)
Risk Regulatory proposal AER draft determination
Liability 12.18 –
Motor vehicle 1.70 –
Property 2.33 –
Total 16.21 –
85 That report is collated based on 491 organisations, 0.4% of which were utility businesses. Marsh
notes that some incidents facing the other represented industries would not affect JEN, or would affect JEN at a less prevalent rate than others.
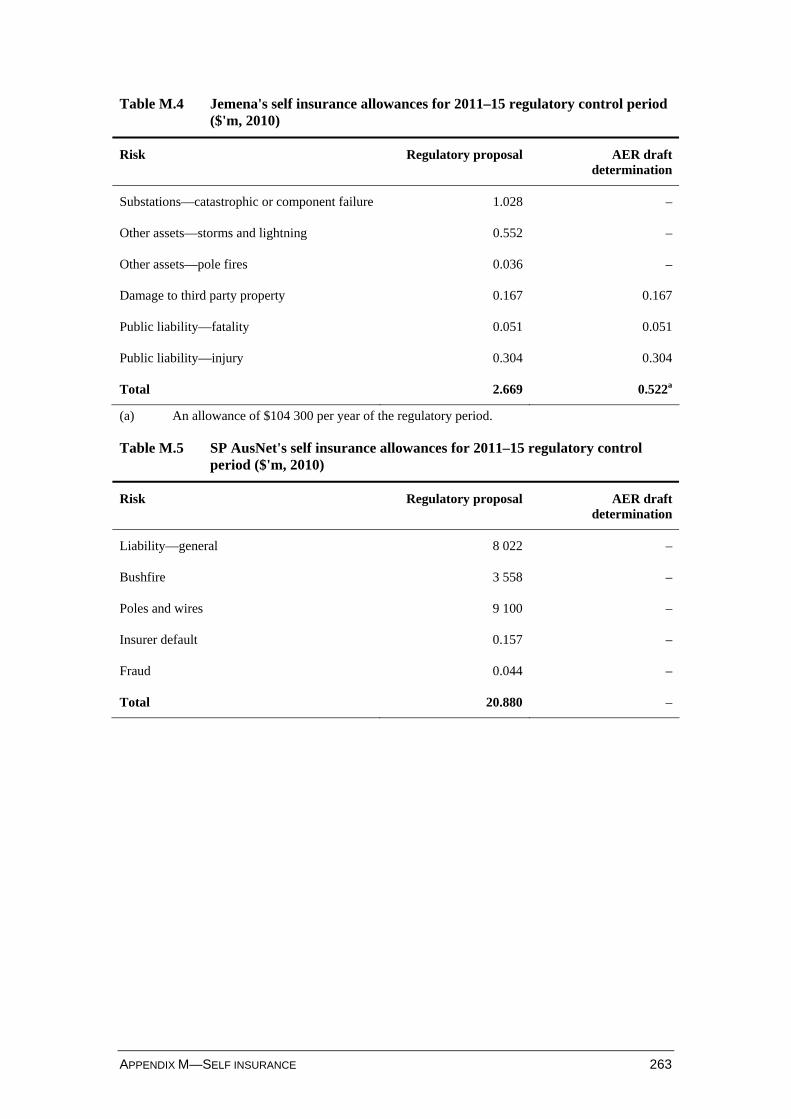
APPENDIX M—SELF INSURANCE 263
Table M.4 Jemena's self insurance allowances for 2011–15 regulatory control period ($'m, 2010)
Risk Regulatory proposal AER draft determination
Substations—catastrophic or component failure 1.028 –
Other assets—storms and lightning 0.552 –
Other assets—pole fires 0.036 –
Damage to third party property 0.167 0.167
Public liability—fatality 0.051 0.051
Public liability—injury 0.304 0.304
Total 2.669 0.522a
(a) An allowance of $104 300 per year of the regulatory period.
Table M.5 SP AusNet's self insurance allowances for 2011–15 regulatory control period ($'m, 2010)
Risk Regulatory proposal AER draft determination
Liability—general 8 022 –
Bushfire 3 558 –
Poles and wires 9 100 –
Insurer default 0.157 –
Fraud 0.044 –
Total 20.880 –
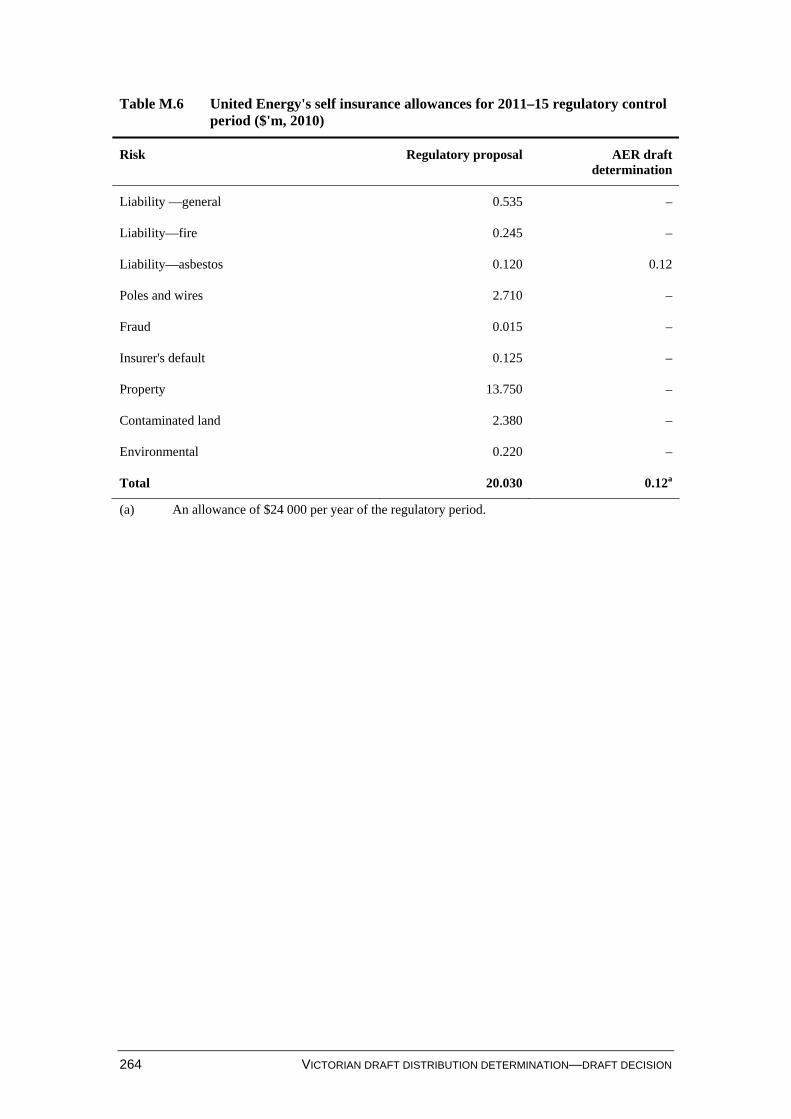
264 VICTORIAN DRAFT DISTRIBUTION DETERMINATION—DRAFT DECISION
Table M.6 United Energy's self insurance allowances for 2011–15 regulatory control period ($'m, 2010)
Risk Regulatory proposal AER draft determination
Liability —general 0.535 –
Liability—fire 0.245 –
Liability—asbestos 0.120 0.12
Poles and wires 2.710 –
Fraud 0.015 –
Insurer's default 0.125 –
Property 13.750 –
Contaminated land 2.380 –
Environmental 0.220 –
Total 20.030 0.12a
(a) An allowance of $24 000 per year of the regulatory period.
APPENDIX N—EQUITY RAISING COSTS 265
N Equity raising costs
N.1 Introduction Equity raising costs, such as legal fees, marketing costs and other transaction costs, are incurred in raising new equity capital. These are upfront expenses, with little or no ongoing costs over the life of the equity. While the majority of the equity a firm will raise is typically obtained at its inception, there may be points in the life of a firm—for example, during capital expansion—where it chooses additional external equity funding (instead of debt or internal funding) as a source of capital, and accordingly may incur equity raising costs.
The AER has accepted that equity raising costs for new issuance are a legitimate cost for a benchmark efficient firm only where external equity funding is the least cost option available.1 A distribution network service provider (DNSP) should only be provided an allowance for equity raising costs where cheaper sources of funding—for example, retained earnings—are insufficient, subject to the gearing ratio and other assumptions about financing decisions being consistent with regulatory benchmarks.
N.2 Regulatory requirements The revenue and pricing principles in the NER set out that each DNSP should be provided with a reasonable opportunity to recover at least its efficient costs.2 It is also pertinent that regard should be had to the potential for under or over investment, a matter that may be materially impacted by equity raising costs.3 The opex criteria (or capex criteria as the case may be) require that the total of the forecast opex (or capex) reasonably reflects the efficient costs and the costs that a prudent operator in the circumstances of the relevant DNSP would require.4 Further, the forecast opex (or capex as the case may be) is assessed with regard to the benchmark opex (or capex) that would be incurred by an efficient DNSP over the regulatory control period.5
The AER has jointly assessed the benchmark equity raising costs of the Victorian distribution network service providers (Victorian DNSPs) on this basis. In particular, where consultant reports have been submitted by one of the Victorian DNSPs, to the extent that the information is pertinent to all Victorian DNSPs, the information has been jointly considered within this appendix.
For convenience, within this appendix references to the benchmark firm should be interpreted as a reference to a benchmark efficient DNSP that is a pure play regulated electricity network operating in Australia without parent ownership.
1 AER, Final decision, Powerlink Queensland transmission determination 2007–08 to 2011–12, 14
June 2007, p. 100; AER, Final decision, SP AusNet transmission determination 2008–09 to 2013–14, January 2008, p. 144 ; AER, Final decision, ElectraNet transmission determination 2008–09 to 2013–14, 11 April 2008, p. 88.
2 For electricity, this means efficient costs associated with direct control network services and regulatory obligations; see NEL, section 7A.
3 NEL, s.7A(6). 4 NER, cll. 6.5.6(c)(1), 6.5.6(c)(2), 6.5.7(c)(1) and 6.5.7(c)(2). 5 NER, cll. 6.5.6(e)(4) and 6.5.7(e)(4).
266 VICTORIAN DRAFT DISTRIBUTION DETERMINATION—DRAFT DECISION
Past AER considerations
In April 2009, the AER released final decisions (April 2009 final decisions) covering regulatory and revenue determinations for electricity distribution and transmission networks in New South Wales (NSW), the Australian Capital Territory (ACT) and Tasmania which included a common appendix dealing with benchmark debt and equity raising costs.6 The final decisions set out the AER’s analysis and considerations with regard to the efficient costs of raising capital prior to the commencement of other AER decisions.
For simplicity, references to the April 2009 final decisions in this appendix are made in reference to the ACT final decision only.
Similarly in November 2009, the AER released draft decisions (November 2009 draft decisions) covering regulatory and revenue draft determinations for electricity distribution networks in Queensland and South Australia which included a common appendix dealing with benchmark equity raising costs.7 These draft decisions set out the AER's updated analysis and considerations with regard to the efficient costs of raising capital prior to the commencement of the current processes for the Victorian DNSPs.
For simplicity, the references to the November 2009 decisions in this appendix are made in reference to the SA draft decision only.
N.3 Summary of Victorian DNSP regulatory proposals Of the five Victorian DNSPs only CitiPower, Jemena Electricity Networks (Jemena) and Powercor Australia (Powercor) have requested equity raising costs in their regulatory proposals which are outlined in table N.1
6 AER, Australian Capital Territory distribution determination 2009–10 to 2013–14, Final
decision, April 2009, appendix H; AER, New South Wales distribution determination 2009–10 to 2013–14, Final decision, April 2009, appendix N; AER, Final decision, TransGrid transmission determination 2009–10 to 2013–14, 28 April 2009; appendix E; and AER, Transend transmission determination 2009–10 to 2013–14, Final decision, April 2009, appendix E.
7 AER, Draft decision, South Australian distribution determination 2010–11 to 2014–15, 25 November 2009, appendix J; and AER, Draft decision, Queensland distribution determination 2010–11 to 2014–15, 25 November 2009, appendix M.
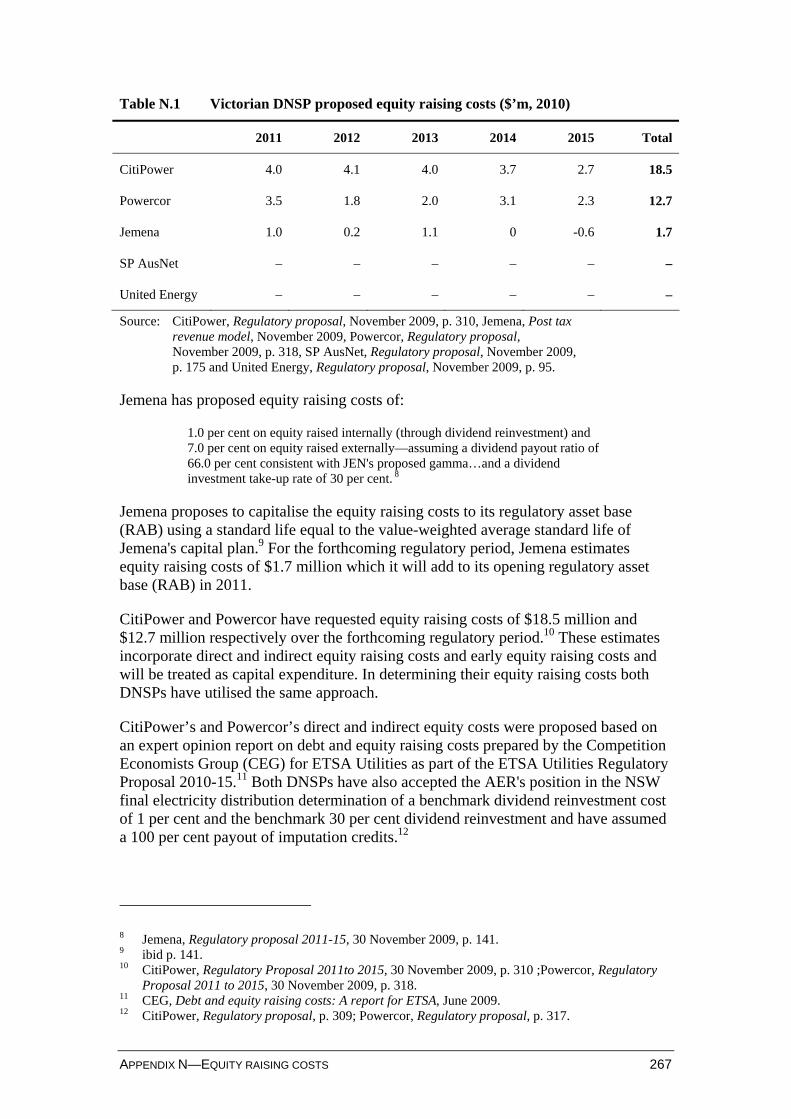
APPENDIX N—EQUITY RAISING COSTS 267
Table N.1 Victorian DNSP proposed equity raising costs ($’m, 2010)
2011 2012 2013 2014 2015 Total
CitiPower 4.0 4.1 4.0 3.7 2.7 18.5
Powercor 3.5 1.8 2.0 3.1 2.3 12.7
Jemena 1.0 0.2 1.1 0 -0.6 1.7
SP AusNet – – – – – –
United Energy – – – – – –
Source: CitiPower, Regulatory proposal, November 2009, p. 310, Jemena, Post tax revenue model, November 2009, Powercor, Regulatory proposal, November 2009, p. 318, SP AusNet, Regulatory proposal, November 2009, p. 175 and United Energy, Regulatory proposal, November 2009, p. 95.
Jemena has proposed equity raising costs of:
1.0 per cent on equity raised internally (through dividend reinvestment) and 7.0 per cent on equity raised externally—assuming a dividend payout ratio of 66.0 per cent consistent with JEN's proposed gamma…and a dividend investment take-up rate of 30 per cent. 8
Jemena proposes to capitalise the equity raising costs to its regulatory asset base (RAB) using a standard life equal to the value-weighted average standard life of Jemena's capital plan.9 For the forthcoming regulatory period, Jemena estimates equity raising costs of $1.7 million which it will add to its opening regulatory asset base (RAB) in 2011.
CitiPower and Powercor have requested equity raising costs of $18.5 million and $12.7 million respectively over the forthcoming regulatory period.10 These estimates incorporate direct and indirect equity raising costs and early equity raising costs and will be treated as capital expenditure. In determining their equity raising costs both DNSPs have utilised the same approach.
CitiPower’s and Powercor’s direct and indirect equity costs were proposed based on an expert opinion report on debt and equity raising costs prepared by the Competition Economists Group (CEG) for ETSA Utilities as part of the ETSA Utilities Regulatory Proposal 2010-15.11 Both DNSPs have also accepted the AER's position in the NSW final electricity distribution determination of a benchmark dividend reinvestment cost of 1 per cent and the benchmark 30 per cent dividend reinvestment and have assumed a 100 per cent payout of imputation credits.12
8 Jemena, Regulatory proposal 2011-15, 30 November 2009, p. 141. 9 ibid p. 141. 10 CitiPower, Regulatory Proposal 2011to 2015, 30 November 2009, p. 310 ;Powercor, Regulatory
Proposal 2011 to 2015, 30 November 2009, p. 318. 11 CEG, Debt and equity raising costs: A report for ETSA, June 2009. 12 CitiPower, Regulatory proposal, p. 309; Powercor, Regulatory proposal, p. 317.
268 VICTORIAN DRAFT DISTRIBUTION DETERMINATION—DRAFT DECISION
Finally, both DNSPs have proposed early equity raising costs to lessen the risk of securing equity and to eliminate exposure to movements in capital markets when the equity is required.13 In support of the early equity raising costs, CitiPower and Powercor have provided an article from Standard and Poor's on refinancing.14 In further support of this article CitiPower and Powercor have also provided a letter from Standard and Poors clarifying their position.15
SP AusNet has not requested any equity raising costs noting that:
using the funding assumptions in the PTRM it has been determined that recourse to external equity is not necessary using regulatory benchmark assumptions. This will be revisited in light of revenues provided for in the AER Draft Decision.16
Similarly, United Energy has not requested any equity raising costs noting:
UED believes the capital expenditure program can be realistically undertaken assuming:
an ability to raise new debt and equity finance based on the proposed WACC. Any reduction in the proposed WACC will challenge that assumption…17
N.4 Issues and AER considerations The AER notes that the Victorian DNSPs have based their proposals on the methodology used by the AER.18 This identifies a hierarchy of three methods for equity raising, with differing equity raising costs and availability for each method:
First, firms use retained earnings as a source of equity. The amount of equity raised in this manner is capped at the amount of available internal funds, determined by benchmark cash flow calculations. It is noted that retained earnings are dependent upon the dividend policy of the benchmark firm, which should be consistent with the assumed value of imputation credits.19
Second, firms use dividend reinvestment plans. The amount of equity raised in this manner is capped at 30 per cent of the value of outgoing dividends. It is noted that this too is related to the dividend policy for the firm.
Third, firms use seasoned equity offerings (SEOs), encompassing both rights issues and placements. Although the AER considers the benchmark firm primarily uses rights issues, previous decisions have recognised that DNSPs consider a
13 CitiPower, Regulatory proposal, p. 309; Powercor, Regulatory proposal, p. 317. 14 Standard and Poors, Ratings Direct: Refinancing And Liquidity Risks Remain, But Australia's
Rated Corporates Are Set To Clear The Debt Logjam, 22 April 2008. 15 Standard and Poors, Letter to Julie Williams, Chief Financial Officer, CitiPower and Powercor, Re:
Liquidity Risk Management Request for Clarification, 30 October 2009. 16 SP AusNet, Electricity Distribution Price Review, Regulatory Proposal, November 2009, p. 175. 17 United Energy, Regulatory Proposal for Distribution Prices and Services January 2011–December
2015, November 2009, p. 95. 18 AER, Australian Capital Territory distribution determination 2009-10 to 2013-14, Final decision,
April 2009, appendix H, pp. 251-260. 19 ibid, pp. 251-260.
APPENDIX N—EQUITY RAISING COSTS 269
different balance between rights issues and placements is appropriate. The benchmark firm obtains all the remaining equity required via this method.
The AER's analysis of the Victorian DNSPs equity raising costs covers:
selection of equity raising method
indirect equity raising costs
direct equity raising costs
early equity raising costs
benchmark cash flow analysis—implementation of the equity raising cost allowance.
N.4.1 Selection of equity raising method
Victorian DNSP regulatory proposals
The Victorian DNSPs have based their proposals on the methodology used by the AER in its April 2009 decisions.20 As discussed above, this identifies a sequence of equity raising methods for use by the benchmark firm, with the use of retained earnings and dividend reinvestment plans, and finally use of a SEO. The AER notes that SEO requirements are based on rights issues (although some consideration is given to placements).21
The only point of contention with the AER methodology proposed by the Victorian DNSPs is contained in the CEG report submitted by CitiPower and Powercor which presents data on the incidence of equity raising types in the Australian markets and further proposes that the format of the SEO should be a placement, although including some rights issues as anecdotal evidence.22
AER considerations
The AER notes that the arguments put forward in the CEG report were previously considered by the AER in the November 2009 draft decisions and are reflected in this draft decision.23
CEG states that Australian Securities Exchange (ASX) data supports adopting placements over rights issues for use by the benchmark firm.24 CEG observed that in 2006–07 and 2007–08, placements were more than double rights issues (by volume). On the basis of a study by Brown and Chan,25 CEG stated that the level of rights issues is artificially high, since there are government regulations imposing conditions 20 ibid, pp. 251-260. 21 ibid, table 9.14, p 79. 22 CEG, Debt and equity raising costs, June 2009, pp. 23-29. 23 AER, South Australia Draft distribution determination 2010-11 to 2014-15, Draft decision,
November, 2009, appendix J. 24 CEG, Debt and equity raising costs, June 2009, p. 25. 25 Brown, R. and Chan, H., Rights issues versus placements in Australia: Regulation or choice?,
Company and Securities Law Journal, 2004, vol. 22, pp. 301-312.
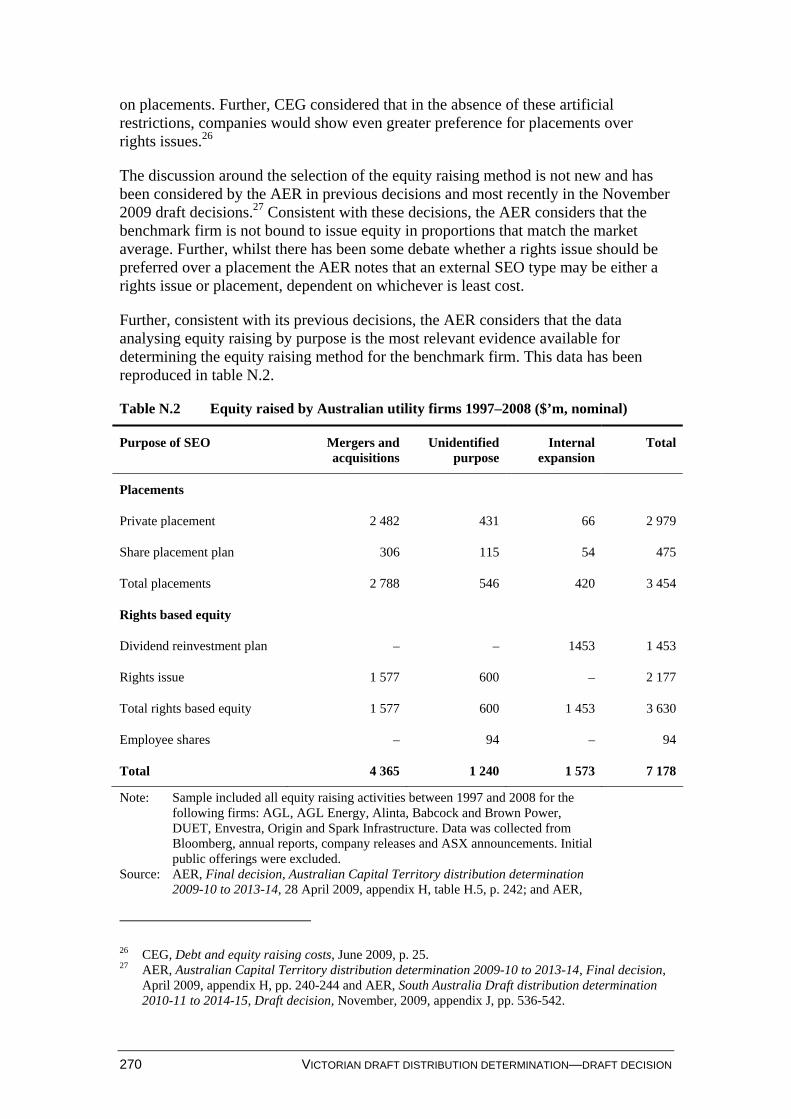
270 VICTORIAN DRAFT DISTRIBUTION DETERMINATION—DRAFT DECISION
on placements. Further, CEG considered that in the absence of these artificial restrictions, companies would show even greater preference for placements over rights issues.26
The discussion around the selection of the equity raising method is not new and has been considered by the AER in previous decisions and most recently in the November 2009 draft decisions.27 Consistent with these decisions, the AER considers that the benchmark firm is not bound to issue equity in proportions that match the market average. Further, whilst there has been some debate whether a rights issue should be preferred over a placement the AER notes that an external SEO type may be either a rights issue or placement, dependent on whichever is least cost.
Further, consistent with its previous decisions, the AER considers that the data analysing equity raising by purpose is the most relevant evidence available for determining the equity raising method for the benchmark firm. This data has been reproduced in table N.2.
Table N.2 Equity raised by Australian utility firms 1997–2008 ($’m, nominal)
Purpose of SEO Mergers and acquisitions
Unidentified purpose
Internal expansion
Total
Placements
Private placement 2 482 431 66 2 979
Share placement plan 306 115 54 475
Total placements 2 788 546 420 3 454
Rights based equity
Dividend reinvestment plan – – 1453 1 453
Rights issue 1 577 600 – 2 177
Total rights based equity 1 577 600 1 453 3 630
Employee shares – 94 – 94
Total 4 365 1 240 1 573 7 178
Note: Sample included all equity raising activities between 1997 and 2008 for the following firms: AGL, AGL Energy, Alinta, Babcock and Brown Power, DUET, Envestra, Origin and Spark Infrastructure. Data was collected from Bloomberg, annual reports, company releases and ASX announcements. Initial public offerings were excluded.
Source: AER, Final decision, Australian Capital Territory distribution determination 2009-10 to 2013-14, 28 April 2009, appendix H, table H.5, p. 242; and AER,
26 CEG, Debt and equity raising costs, June 2009, p. 25. 27 AER, Australian Capital Territory distribution determination 2009-10 to 2013-14, Final decision,
April 2009, appendix H, pp. 240-244 and AER, South Australia Draft distribution determination 2010-11 to 2014-15, Draft decision, November, 2009, appendix J, pp. 536-542.
APPENDIX N—EQUITY RAISING COSTS 271
Draft decision, South Australia Draft distribution determination 2010-11 to 2014-15, 25 November, 2009, appendix J. p. 541.
The AER notes that the starting point for the data presented in table N.2 was analysis of Bloomberg statistics on the value of equity raised by each company each year. The AER then examined each company's annual report, for each year in the sample, which generally contained a clear statement on the purpose of that year's equity raising activities. Where this was not sufficient to identify the purpose of the additional equity, the AER obtained individual ASX notices (and associated press releases) to further clarify the purpose. If, at this point, it was not able to clearly categorise the purpose as either internal expansion or merger/acquisition, the figure was assigned to the unidentified purpose category.
The AER notes that table N.2 shows that dividend reinvestment plans are the predominant source of new equity for Australian utilities for the purposes of internal expansion. This is consistent with the current AER cash flow methodology for equity raising, which assigns a higher priority to dividend reinvestment plans than either rights issues or placements. That is, the benchmark firm uses all equity available from a dividend reinvestment plan before turning to an external SEO.
The AER methodology caps the amount of equity available from dividend reinvestment plans at 30 per cent of the total dividends paid out by the firm. This may result in all equity being sourced via retained earnings and dividend reinvestment plans. To the extent that there is an extremely large equity raising requirement, it may be that the dividend reinvestment plan provides less than 5 per cent of the total amount, with the remaining required equity being sourced from SEOs (rights issues and placements).
AER conclusions
The AER has considered the material presented by the Victorian DNSPs and the CEG report on the relevance of various equity raising methods for the benchmark firm. The AER concludes that:
the use of retained earnings in preference to all other sources of equity has been accepted by all Victorian DNSPs
the most relevant analysis of equity raising methods—conducted by the AER on Australian unity firms raising equity for internal expansion—support the use of dividend reinvestment plans before either rights issues or placements
an external SEO type may be either a rights issue or placement, dependent on whichever is least cost.
On this basis, the AER considers that the methodology implemented by the AER in its April 2009 final decisions and the May 2010 final decisions remains appropriate for estimating benchmark equity raising costs.
272 VICTORIAN DRAFT DISTRIBUTION DETERMINATION—DRAFT DECISION
N.4.2 Indirect equity raising costs
Victorian DNSP regulatory proposals
CitiPower and Powercor have explicitly requested in their proposals an allowance for equity raising costs which includes indirect costs.28 This allowance has been based on the CEG report, which proposed an indirect cost only for SEOs, of 3 per cent of the total amount of equity raised via this method.
Whilst not explicitly stated, the higher per cent proposed for externally raised equity in Jemena's proposal is assumed by the AER to include both direct and indirect costs. However, Jemena have provided little basis on how their external equity raising costs have been calculated and therefore the AER has not commented on Jemena's approach in this draft decision. Therefore, the AER's response to the proposed allowance for indirect costs will be primarily in response to the arguments put forward in the CEG report submitted by CitiPower and Powercor.
AER considerations
The AER has previously considered the issues raised in the CEG report in the November 2009 draft decisions and these considerations are reflected in this draft decision.29 In analysing the CEG report the AER has focused on four key considerations:
Relationship between indirect and direct costs
Regulatory framework and indirect costs
Transaction costs
Wealth transfer
Relationship between indirect and direct costs
The key argument of CEG is the equivalence of indirect and direct costs. CEG stated:
CEG has previously submitted to the AER on the need for direct and indirect costs to both be estimated and for these costs to be jointly estimated in a consistent manner. As a matter of economics, these costs are equivalent and these can be easily demonstrated. 30
CEG goes on to give examples of how both indirect and direct costs are incurred by a firm seeking to raise new equity.
CEG further describes the relationship between indirect and direct costs:
28 CitiPower, Regulatory proposal, pp. 308-309; Powercor, Regulatory proposal, pp. 316-318 and
CEG, Debt and equity raising costs, June 2009, pp. 27-28. 29 AER, South Australia Draft distribution determination, Draft decision, November 2009, appendix
J. 30 CEG, Debt and equity raising costs, June 2009, p. 13.
APPENDIX N—EQUITY RAISING COSTS 273
The higher the indirect costs (lower the price) the lower will be the direct costs of marketing the capital. By contrast, the lower the indirect cost (higher the price) the higher will be the direct costs. 31
In economic terms, CEG claimed that indirect costs and direct costs are substitutes, that is an increase in one leads to a decrease in the other. Alternatively, it may be conceived that a given total cost of raising capital can be split in any proportion of indirect and direct costs. Given that the AER has already indicated that direct equity raising costs are a legitimate cost for the benchmark firm, at face this could lead to the conclusion that the AER should also allow indirect costs since any indirect cost could be replaced by a direct cost of exactly the same amount.
However, the AER considers that for such a logic chain to hold, there must be an observed and interdependent relationship—where each may exactly substitute for the other—between indirect and direct costs. The AER notes that no empirical evidence has been submitted to demonstrate the inextricable link between indirect and direct equity raising costs.
In the November 2009 draft decisions, the AER assessed CEG's claim that indirect and direct costs are substitutes by assessing two statements in its report that could be construed to provide such a link as well as the papers CEG has cited in making these statements.32
In its analysis the AER found that the papers cited by CEG do not support the statement that indirect and direct costs are interdependent substitutes. In summary, the AER considered:
the Altinkilic and Hansen paper does not report or investigate direct equity raising costs, and so makes no statement about the relationship between indirect and direct costs33
the Kim, Palia and Saunders working paper removed indirect costs data and analysis and therefore limited weight should be given to the results and noted that this paper can be interpreted as arguing against the idea that direct and indirect costs are substitutes34
the findings from the Bortolotti et al. paper have been misrepresented by CEG on the 'interrelationship' of underpricing and underwriting costs and that whilst there is some evidence that accelerated transactions in the USA have higher direct costs and lower indirect costs, on an aggregated global perspective the conclusion is that indirect and direct costs vary in the same direction.
The AER concludes that the empirical evidence presented by CEG:
31 ibid, p. 14. 32 AER, South Australia draft distribution determination, Draft decision, November, 2009, appendix
J, pp. 545-547. 33 Altinkilic, O. and Hansen, R., Discounting and underpricing in seasoned equity offers, Journal of
Financial Economics, 2003, vol. 69, pp. 285-323. 34 Kim, D., Palia, D. and Saunders, A., The long-run behaviour of debt and equity underwriting
spreads, Working paper, 2003, pp. 22-24
274 VICTORIAN DRAFT DISTRIBUTION DETERMINATION—DRAFT DECISION
does not present a robust investigation of the relationship between underwriting and underpricing
presents several pieces of tangential evidence that, on balance, suggest indirect and direct costs are not substitutes.
The AER considered that while indirect costs (underpricing) are observed during the issuance of equity capital, there is no evidence that this is substituting for direct costs as posited by CEG.
Consistent with the findings in its November 2009 draft decisions, the AER considers that indirect equity costs have not been justified by demonstrating their equivalence with direct equity raising costs.
Regulatory framework and indirect costs
The AER has not allowed indirect costs (often labelled as 'underpricing') in the previous regulatory determinations.35 The foremost reason underpinning the AER's rejection of indirect costs is that the compensation for such costs is inconsistent with the current regulatory framework. As stated in the NSW draft electricity distribution determination:
Even if underpricing for equity raising does occur, the AER considers that:
no compensation is required for such costs because it would be inconsistent with the benchmark regulatory framework applied to determine the weighted average cost of capital (WACC). 36
There are two aspects of the regulatory framework which are particularly relevant to the assessment of the proposals claims for indirect costs:
the framework requires consideration of outcomes for the benchmark firm, not individual shareholders
the framework requires consistent definitions for all components.
The AER considers that a misapplication of one (or both) of these two points underlies each of the arguments made by CEG for compensation of indirect costs. It is important therefore to revisit the regulatory framework and understand what it does (and does not) state on these issues which are reflected here.
Firm outcomes not individual shareholder outcomes
The AER stated in its April 2009 final decisions:
The regulatory framework does not encapsulate personal transaction costs, including the final income tax paid by personal investors, or the rate of return
35 AER, Australian Capital Territory distribution determination 2009-10 to 2013-14, Final decision,
April 2009, appendix H and AER, South Australia Draft distribution determination, Draft decision, 2010-11 to 2014-15, November, 2009, appendix J.
36 AER, , New South Wales distribution determination 2009-10 to 2013-14, Draft decision, November 2008, p. 190.
APPENDIX N—EQUITY RAISING COSTS 275
given to any individual capital provider (as opposed to investors in aggregate). 37
The AER's consultant, Associate Professor Handley of the University of Melbourne, expressed the essence of this argument as follows:
…the key difficulty with the NSP’s claim for compensation for underpricing costs is that it would be inconsistent with the current regulatory framework. This conclusion applies irrespective of the magnitude of the underpricing and irrespective of the extent to which existing shareholders participate in the issue. The fundamental problem with the NSP’s argument is a failure to recognise an important implication of the fact that underpricing costs associated with raising equity capital are incurred at the shareholder level rather than the firm level i.e. although underpricing is a cost to shareholders it is not a cost to the firm. 38
That is, the NEL and NER are concerned with the determination of the appropriate revenue for the firm as a whole. Components of total revenue relevant to the discussion of indirect costs include opex and return on capital, and the NER includes specific reference on how these are set for the firm.
Since the benchmark firm is owned by its shareholders, any return to equity capital can be viewed as the return provided to shareholders in aggregate. There are therefore times where it is appropriate to discuss the return to shareholders. However, there is no requirement to have regard for any particular shareholder, or a particular subset of shareholders.
Consistent definitions
The requirement for consistency was described by Associate Professor Handley as follows:
The regulatory framework requires the determination of allowed revenues to the regulated firm to be undertaken on … an after company tax, before personal tax, after underpricing costs but before other personal (transactions) costs basis. The consistency principle therefore requires that regulatory cash flows be defined on a similar basis. In other words, cash flows should be after company tax, before personal tax, after underpricing costs but before other personal (transactions) costs. 39
That is, there is a need for first-order consistency between the various components of the model used to determine the appropriate revenue for the DNSP:
the specification of formulae
the delineation of cash flows
37 AER, Australian Capital Territory distribution determination 2009-10 to 2013-14, Final decision,
April 2009, appendix H, p. 234. 38 Handley, J., A note on the costs of raising debt and equity capital: Report prepared for the
Australian Energy Regulator, 12 April 2009, p. 10. 39 Handley, J., A note on the costs of raising debt and equity capital: Report prepared for the
Australian Energy Regulator, 12 April 2009, p. 10.
276 VICTORIAN DRAFT DISTRIBUTION DETERMINATION—DRAFT DECISION
the estimation of parameter values.
Finally, Associate Professor Handley also noted:
It is important to note that not making an explicit adjustment to the cash flows for underpricing or other personal transactions costs does not mean that these costs are either ignored or assumed not to exist. Rather, underpricing and other costs are already implicitly taken into account by investors in determining the required rate of return. 40
Disregarding the consistency principle leads to double counting and systematic over estimation of the efficient costs. Consider the market risk premium (MRP), a parameter that is estimated as a proxy using observed (market) share prices in the presence of underpricing. That is, every time a firm sells new equity at a discount, the (market) share price reduces to reflect the dilution effect on existing shares. This reduces the capital gain (or increases the capital loss) received by the shareholders, and therefore reduces aggregate return. As such, the return to equity based on this MRP implicitly includes the (indirect) cost, and reflects the required return to equity in the presence of underpricing. It would be inconsistent with this parameter estimation to provide a separate allowance (in the cash flows) for underpricing.
The interpretation of clause 6.5.3 of the NER
CEG discussed the interpretation of clause 6.5.3 of the NER. As discussed below, the AER considers that this illustrates the misapplication of the two principles above—benchmark firm outcomes not individual shareholder outcomes, and consistent definitions of all components—by CEG.
As background, the AER made the following statement in its April 2009 final decisions, with footnote as shown:
The AER considers that separate compensation for investor level transaction costs, including investor level taxes is inconsistent with the regulatory framework. The regulatory framework specifies that investor returns are post company tax and pre–investor tax. 631 41
631 The AER notes that this is why imputation credits are deducted from the regulatory building blocks when determining total allowed revenue for the business; to the extent that they will be redeemed, they are not company taxes but pre-payment of personal taxes.
The AER notes that this statement on imputation credits encompasses both a firm-centred view of taxation, and consistency between the various components of the calculation of taxation. CEG cited this paragraph (with footnote) and stated:
In my view, this position is internally inconsistent and attempts to make a false economic distinction between costs being borne by ‘the company’ and
40 Handley, J., A note on the costs of raising debt and equity capital: Report prepared for the
Australian Energy Regulator, 12 April 2009, p. 10. 41 AER, Australian Capital Territory distribution determination, Final decision, April 2009,
appendix H, p. 236. Note that CEG quotes from the NSW DNSP version.
APPENDIX N—EQUITY RAISING COSTS 277
costs borne by ‘the shareholders’ in order to argue that only the former should be compensated. 42
That is, CEG explicitly disagreed with the idea that the regulatory framework is concerned with the firm, not individual shareholders. CEG further explained:
This provision in the NER [6.5.3] explicitly and specifically requires the AER to consider the returns to individual shareholders - which is precisely the opposite of what the AER claims the regulatory framework requires. 43
The AER considers that CEG has not correctly interpreted clause 6.5.3 of the NER. The AER notes that this clause refers to the DNSP, and is focused on the cost of taxation to the entity. The task facing the AER is to determine the return for the regulated business. It is correct that this involves consideration of the return to shareholders (in aggregate) as part of the gamma (imputation credits) parameter, but this does not change the nature of the AER’s task. As stated above, there are times where it is appropriate to discuss the return to shareholders (in aggregate). However, there is no requirement to have regard for any particular individual shareholder, or a particular subset of shareholders.
CEG stated:
While AER is arguing that the NER compensates only for costs borne by the firm and not costs borne by shareholders (such as indirect equity raising costs), what the NER actually requires is that the compensation that firms receive for corporations tax, a cost borne in its entirety by the firm, be offset by the benefit accrued to shareholders through the value of imputation credits. That is, the NER require that a benefit which is accrued by shareholders from the firm be deducted from the firm’s allowed revenue. It is unclear why the AER believes that a cost incurred by shareholders on behalf of the firm should not similarly be added to the firm’s allowed revenue. 44
The AER considers that these statements reflect the incorrect selection of the individual shareholder (instead of the benchmark firm) as the point of concern for the regulatory framework. Although imputation credits are ‘a benefit which is accrued by shareholders’, they can equally be viewed as a benefit generated by the firm. Assessment of shareholder characteristics (in aggregate) occurs during the estimation of gamma (the assumed utilisation of imputation credits), but it occurs only to the extent necessary to value the benefit generated by the firm. Adopting the CEG terminology, the AER considers that a cost borne by the firm (taxation payments made to the Australian Tax Office) is offset against a benefit generated in its entirety by the firm (the assumed utilisation of imputation credits). This is consistent with a regulatory framework that focuses on the benchmark firm, not individual shareholders.45
42 CEG, Debt and equity raising costs, June 2009, p. 18. 43 ibid, p. 18. 44 ibid, p. 19. 45 The consideration of the value of imputation credits does not mean that the regulatory framework
has shifted its concern to the rate of return required by individual shareholders. Consider the case of two shareholders: When a low income shareholder (low marginal tax rate) receives a franked dividend from the benchmark firm, this shareholder will receive the entire amount rebated back by the Australian Tax Office. When a high income shareholder (high marginal tax rate) receives a
278 VICTORIAN DRAFT DISTRIBUTION DETERMINATION—DRAFT DECISION
Transaction costs
The AER observes that there are transaction costs when engaging in any equity raisings—for example, brokerage, search costs, bank fees.46 CEG stated:
A new shareholder requires compensation for the cost of engaging in the equity raising (e.g. liquidating other assets) and the costs of gathering and analysing information on the equity raising. 47
The AER notes that liquidating other assets involves several types of transaction costs—for example, time spent managing the liquidation, broker fees and tax on any crystallised capital gain. Search costs (that is, the costs of gathering and analysing information) are a textbook example of transaction costs.
The AER has previously recognised that transaction costs occur and that they are not part of the direct cost of equity raising.48 However, the AER does not consider that the existence of these costs requires compensation to be provided. As stated previously:
… the AER considers it inappropriate to determine that such transactions are ‘extra’ or ‘forced’ transactions—that would accordingly require compensation–without considering the pattern of transaction costs that an investor in the market ordinarily incurs. 49
Every investor in the market incurs transaction costs when managing their equity portfolio. Although the magnitude of these aggregate transaction costs is not known, the aggregate compensation received across the market is readily identified. It is the return on the market portfolio—the risk–free rate plus the MRP. In this context, the AER considers that CEG is correct to state:
If the shareholders do not expect to be compensated for the total costs that they bear then they will not supply equity capital in the first place. 50
The MRP (and the risk–free rate) are observed based on investor behaviour in the market where transaction costs exist (this holds true for both projections of the MRP from historical data and forward looking MRP projections based on the dividend growth model). No explicit adjustment is made to the MRP to reflect the transaction
franked dividend from the benchmark firm, this shareholder will still be required to pay additional tax on the dividend (since its marginal personal income tax rate is higher than the corporate tax rate). Clearly, the two individual shareholders are receiving a different (post-personal-tax) rate of return on their shareholding. Deducting the value of the franking credit from the company taxation allowance does not involve consideration of the rate of return to either shareholder.
46 AER, Australian Capital Territory distribution determination, Final decision, April 2009, appendix H, p. 237.
47 The AER notes that this text comes from the section labelled 'wealth transfers' (section 3.1.2.1) by CEG, but it conceptually belongs with the discussion of transaction costs as detailed in the text. CEG, Debt and equity raising costs, June 2009, p. 16.
48 AER, New South Wales distribution determination, Draft decision, November 2008, p. 190; AER, Australian Capital Territory distribution determination, Final decision, April 2009, appendix H, pp. 236-238.
49 AER, Australian Capital Territory distribution determination, Final decision, 28 April 2009, appendix H, p. 237.
50 CEG, Debt and equity raising costs, June 2009, p. 18.
APPENDIX N—EQUITY RAISING COSTS 279
costs incurred, but they are nonetheless present when the MRP is estimated.51 Investors, with an expectation of incurring transaction costs, supply equity capital at this rate of return. It is theoretically and empirically sound to conclude that such an estimate of the MRP therefore provides appropriate compensation for the average level of transaction costs in the market. The treatment of transaction costs is consistent with the estimation of the rate of return.
The key question then becomes whether or not investors in the benchmark firm have transaction costs that differ from the market average, and whether the equity raising strategy of the benchmark firm will alter the transaction costs for the investor. This point was made in the April 2009 final decisions:
The AER considers that to demonstrate the need for an allowance on this issue, empirical evidence is required that shows that the transaction costs incurred by providing equity to the benchmark firm exceed those incurred by the market on average. Such evidence would demonstrate that regulated firms incur higher equity raising costs than the market on average, for which the market risk premium is estimated. No such evidence has been provided. 52
The AER set out strong conceptual grounds for considering that an investor in the benchmark firm will in fact have lower transaction costs than the market average investor (even after allowing for the equity raising strategy of the firm).53 Further, no empirical evidence has been presented that supports higher transaction costs for these investors relative to the market average.
In contrast to the AER’s considerations on this matter, CEG chose to label the AER position as ‘costs borne by shareholders must be ignored’.54 CEG further characterised the AER argument as:
In summary, the AER appears to be arguing that the NER compensates investors only for the costs that are incurred by the firm and not for the costs that they personally incur on behalf of the firm. 55
Adopting the CEG terminology, the AER does not consider that these costs are incurred on behalf of the firm. Rather, they are incurred by each individual investor on their own behalf. Further, the AER considers that each investor is compensated for the costs they incur on their own behalf, through the market risk premium applied in the capital asset pricing model (CAPM), which implicitly includes compensation for the market average transaction costs. The AER considers that this is already a conservative estimate, since the investor in the benchmark firm is likely to have below average transaction costs relative to the market.
51 The AER clarifies that this is the intended meaning of 'The market risk premium is estimated on a
market portfolio that is exclusive of the transaction costs involved in maintaining that portfolio.' AER, Final decision, Australian Capital Territory distribution determination 2009-10 to 2013-14, 28 April 2009, appendix H, p. 236.
52 ibid, p. 237. 53 ibid, pp. 236-238. 54 CEG, Debt and equity raising costs, June 2009, p. 17. 55 ibid, p. 18.
280 VICTORIAN DRAFT DISTRIBUTION DETERMINATION—DRAFT DECISION
Wealth transfer
Wealth transfer was described by Associate Professor Handley as:
If a firm raises capital by issuing shares at a discount to the current market price then there is a transfer of wealth from the owners of the existing shares to the owners of the new shares i.e. underpricing represents the transfer of wealth (claim on the existing assets of the firm) from the owners of the existing shares to the owners of the new shares. 56
CEG agreed that if the old and new shareholders were identical, no wealth transfer occurs.57 However, they stated that for sales to new investors, the wealth transfer represents a real cost.58
The AER considers that this perspective is incorrect because it does not consider shareholders in aggregate. The transfer is within the group of shareholders, so there can be no net loss or gain in aggregate. For each shareholder worse off as a result of a wealth transfer, there is a shareholder better off by the exact same amount. The AER notes that the CEG report does not justify the selective identification of those shareholders who are worse off while ignoring those who are better off. This is best understood with regard to the specific arguments made by CEG:
In my view the AER’s stance simply cannot be true. The regulatory framework must be designed to compensate shareholders for all efficiently incurred costs – whether the cost involves the company writing a cheque to a third party for $10m or selling shares to a third party at a $10m discount to the market price. Both reduce the value of the shares held by the shareholder by $10m. 59
The AER notes that CEG referred to ‘shareholders’ (plural) in the second sentence of the above paragraph, and that this may be read as referring to shareholders in aggregate. The AER considers that, if read this way, the statement is correct: the regulatory framework is designed to compensate shareholders (in aggregate) for efficiently incurred costs (in aggregate). However, the ‘shareholders’ could also be construed to mean a number of shareholders each considered individually. This appears to be CEG’s interpretation, since it is the only reading that makes sense of the change to the singular ‘shareholder’ in the final sentence:
Both reduce the value of the shares held by the shareholder by $10m. 60
This statement may be true in the context of an individual (existing) shareholder. It is demonstrably false in the context of shareholders in aggregate. Prior to the issuance of the new shares, let the value of the existing shares be X and the amount of capital that will be injected Y. After the discounted issuance of new equity, the value of the new and existing shares (in aggregate) will be (X+Y). That is, the total value is unchanged, even though the distribution of that wealth may vary. By contrast, writing a cheque to
56 Handley, J., A note on the costs of raising debt and equity capital: Report prepared for the
Australian Energy Regulator, 12 April 2009, p. 6. 57 CEG, Debt and equity raising costs, June 2009, p. 16. 58 ibid, p. 16. 59 ibid, p. 18. 60 CEG, Debt and equity raising costs, June 2009, p. 18.
APPENDIX N—EQUITY RAISING COSTS 281
a third party reduces the total wealth of shareholders (in aggregate), thus demonstrating the difference between direct and indirect costs.
The AER considers that CEG has not properly taken account of the relevant perspective of the shareholders in aggregate. In every transaction between two investors, there is a winner and a loser. Both are shareholders; in aggregate, they will receive the required return.
The AER notes that even if this wealth transfer required compensation—for clarity, the AER considers it does not—the introduction of an indirect cost allowance by a regulator does not address the inequality. This was explained by the AER in its April 2009 final decisions.61 However, CEG specifically considered that the AER was wrong to state:
…the outside investors who took up new shares would also be overcompensated, since they experience no dilution effect (they had no shares to begin with) but still share in the underpricing allowance (paid to the firm as a whole). 62
CEG stated that this constituted an error of financial logic, and noted:
The price new shareholders are willing to pay for the new equity will include the expected value of all future cash-flows from that equity. If the AER commits to pay for underpricing costs associated with an equity raising then, as the AER correctly points out, new shareholders will receive higher cash-flows per share purchased. However, what the AER logic fails to appreciate is that they will pay more for their shares as a consequence of such a decision. The net beneficiaries of the decision will be the existing shareholders who are selling them the issue – ie the beneficiaries will be precisely the shareholders who bear the costs. 63
The AER considers that this statement relies on an unreasonable assumption, involves an error of (mathematical) logic and is internally inconsistent.
The statement by CEG presupposes that the decision by the AER to allow for underpricing is not known in advance by the existing shareholders; since if they were aware of the allowance beforehand their price per share evaluation would itself adjust, with no change to the absolute underpricing level. Given that the AER issues publicly available regulatory determinations for a five year period, this is clearly an untenable assumption.
The AER also considers the logical endpoint of the underpricing allowance is not that the net beneficiaries are the existing shareholders. This is best understood with a brief mathematical exposition.
Define the following variables:
u total underpricing (and therefore total value of the underpricing
61 AER, Australian Capital Territory distribution determination, Final decision, April 2009,
appendix H, pp. 238-239. 62 ibid, p. 239; cited by CEG, Debt and equity raising costs, June 2009, p. 17. 63 CEG, Debt and equity raising costs, June 2009, p. 17.
282 VICTORIAN DRAFT DISTRIBUTION DETERMINATION—DRAFT DECISION
allowance)
m number of existing shares
n number of newly issued shares
Wealth transfer as a result of the new share issue:
Existing shares change by m
u
New shares change by n
u
Total change is 0
uu
n
un
m
um (no net change)
The underpricing allowance, paid to the firm, is of value to all shares:
All shares change bynm
u
The combined effect of the wealth transfer and underpricing allowance:
Existing shares change by
m
u
nm
u
New shares changes by
n
u
nm
u
Therefore the total effect on shares in aggregate is:
un
u
nm
un
m
u
nm
um
(underpricing allowance is aggregate gain)
From the perspective of existing shares:
vem
u
nm
u
m
u
nm
u
0 (existing shares lose value)
From the perspective of new shares, two outcomes are possible.
If the value of the underpricing allowance per share was not included in the price paid:
ven
u
nm
u
(new shares gain value)
If the value of the underpricing allowance per share was included in the price
APPENDIX N—EQUITY RAISING COSTS 283
paid:
ven
u
nm
u
n
u
nm
u
(new shares gain value)
Even if the new shareholders are willing to raise their per-share evaluation by the full value of the underpricing allowance to them, the difference will never be recovered. New shareholders remain net beneficiaries, existing shareholders who do not take up new shares remain net losers; and existing shareholders who do take up new shares are indeterminate.64 The allowance proposed by CEG cannot eliminate the problem that it is designed to address.
The AER also notes it is internally inconsistent for CEG to attempt to apply a net present value (NPV) calculation to the underpricing allowance, without considering the NPV of the other components of the transaction. Prior to this point, underpricing has been defined by CEG with regard to the market price of the share. A consistent application of NPV assessment would show that the underpricing does not require compensation.
Consider a company that has a current (market) share price of $10. The potential new investor undertakes an analysis of the NPV of the future cash flows of the business and arrives at a value of $9 per share, which is the asking price for new equity. The new investors’ assessment may be either correct or incorrect.
If the assessment of a $9 per share NPV for all future cash flows is accurate, then the current market share price is overvalued. Selling new equity at $9 does not present a loss to the company, since it will gain $9 in new capital in exchange for a claim on future cash flows worth $9 per share. Although there may be a wealth transfer away from existing shareholders on paper, this does not reflect any actual variation in the NPV of future cash flows accruing to the existing shareholder.
Since the market share price after the equity raising will fall, these existing shareholders have lost the opportunity for a windfall gain by selling the share (worth $9) at $10 on the secondary market. However, the regulatory framework is not concerned with providing such an opportunity for windfall gain. Further, any sale at this price would be a windfall loss to the shareholder who buys on the share market at $10—in aggregate, there is no net gain to shareholders. In summary, the AER considers that if the NPV of the share is below the market share price, the underpricing does not represent a cost to the shareholders in aggregate, and requires no compensation. This occurs even in the absence of an indirect cost allowance.
The AER observes that there is a large body of academic evidence supporting the idea that firms issue shares when equity prices are overvalued.65 Accordingly, the scenario 64 Existing shareholders who do take up new shares will be either net beneficiaries or net donor
dependent upon the relative proportions of existing and new shares. The case of these participating shareholders is addressed in more detail later in the appendix.
65 Myers, S. C. and Majluf, N. S., Corporate financing and investment decisions when firms have information that investors do not have, Journal of Financial Economics, 1984, vol. 13(2), pp. 187–221; Karpoff, J. M. and Lee, D., Insider Trading Before New Issue Announcements, Financial Management, Spring 1991, vol. 20(1); Spiess, K. D. and Affleck–Graves, J., Underperformance in
284 VICTORIAN DRAFT DISTRIBUTION DETERMINATION—DRAFT DECISION
where the NPV of future cash flows is below the market price could plausibly account for the underpricing observed by CEG.
Alternatively, consider the scenario where the $9 per share NPV is inaccurate, and the market share price of $10 accurately reflects the NPV of future cash flows. If the new investor purchases the share at $9 then a wealth transfer occurs. The new investor gains more than $9 per share in NPV, and there is an offsetting loss for existing shareholders.66 However, there is no change in the aggregate NPV of free cash flows, and therefore no loss to shareholders in aggregate that requires compensation.
If an indirect cost allowance is provided by the regulator, this will affect the NPV both before and after the new shares are issued.67 The wealth transfer cannot be eliminated, since the allowance raises both the NPV of the prospective investor and the true NPV of the company. In summary, the AER considers that if the new investors’ calculation of NPV is below the true NPV of the share, although a wealth transfer occurs, the underpricing does not represent a cost to the shareholders in aggregate, and requires no compensation. Further, adding an indirect cost allowance does not eliminate the wealth transfer.
The AER considers that the key question then becomes why the prospective investor arrived at a lower NPV than the true NPV of free cash flows. There are important theoretical information asymmetry considerations here, since the potential investor must obtain information about the timing and certainty of the firm’s future cash flows.68 This is why the regulator makes allowance for direct equity raising costs, ensuring that the firm can communicate (via prospectus or other avenues) its current financial status. However, information asymmetry is vastly reduced for the regulated firm, given that the regulator sets out the cash flows for the business in advance, and this information is publicly available. The only remaining reason for arriving at a lower NPV is the adoption of a higher discount rate. The AER notes that this is at odds with the adoption of the CAPM, which requires that all investors have the same risk profile and require the same return to equity.
In a related matter, CEG stated that the AER had inappropriately used the word ‘benefit’:
Whether or not new shareholders ‘benefit’ from this payment is irrelevant – just as it is irrelevant whether the printing firm used by the firm to print its prospectuses ‘benefits’ from being paid to perform this task. Both new
long–run stock returns following seasoned equity offerings, Journal of Financial Economics, 1995, vol. 38(3), pp. 243–267; Bayless, M. and Chaplinsky, S. J., Is There A Window of Opportunity for Seasoned Equity Issuance?, Journal of Finance, March 1996, vol. 51(1); Jindra, J., Seasoned Equity Offerings, Overvaluation, and Timing, 2000; and Brown, P., Gallery, G. and Goei, O., Does market misevaluation help explain share market long–run underperformance following a seasoned equity issue?, Accounting and Finance, 2006, vol. 46, pp. 191–219.
66 The exact balance of gain and loss per share will depend on the proportion of new shares to existing shares, and the proportion of existing shareholders who take up new shares.
67 Absent the CEG assumption that the regulator can surprise the business and provide an allowance it had not indicated it would provide.
68 For example, see Eckbo, B. E. and Masulis, R. W., Adverse selection and the rights offer paradox, Journal of Financial Economics, 1992, vol. 32, pp. 293-332.
APPENDIX N—EQUITY RAISING COSTS 285
investors and the printing firm benefit in some sense from the payments that they receive. 69
The AER considers that examining the statement in context makes clear how the word ‘benefit’ should be read:
The AER considers that under such a scenario, two sources of overcompensation would likely result. Original shareholders who bought new shares would be overcompensated, since the dilution effect would already be offset by the new shares they purchased, and they would also receive the benefit of the proposed underpricing allowance. Additionally, outside investors who took up new shares would also be overcompensated…70
The full paragraph reveals that the benefit is the payment received by the shareholder (or printer, to use the CEG example). There is overcompensation because payment made to the entity is of greater value than the item exchanged for the payment (the capital contribution of the shareholder, or the prospectus from the printer).
With this understanding, the printing example put by CEG can be recast to correctly illustrate the issue. Consider two printers, who can produce identical prospectuses (required for the equity raising) but quote differing prices: one quotes $1 million, the other $2 million. The AER considers that providing an allowance to the regulated firm to pay the latter printer $2 million would be overcompensation, since the efficient cost of printing the prospectus is $1 million. The NER requires the level of opex to reasonably reflect the efficient costs,71 so (in this case) the AER would not set direct equity raising costs above $1 million.
In the context of potential investors, offering a higher price for the new equity equates to requiring a lower return on capital. Clearly, if there are two investors, with the same risk profile, offering to provide equity to the benchmark firm, but one requires a lower return on capital than the other, the AER considers that the efficient return on capital is the lower of the two. This is the correct context for interpretation of ‘overcompensation’—where the capital provider receives a greater return on capital (payment) than the true worth of the capital (the item exchanged for the payment).
Participating shareholders
The AER observes that CEG perpetuates an error—that no existing shareholders participate in placements—that was addressed in the April 2009 final decisions:
Associate Professor Handley observed that CEG and Carlton assume that no existing shareholders participate in their benchmark firm placements and stated this was an unrealistic assumption. The AER concurs with Associate Professor Handley’s view. The AER considers that it is more plausible to
69 CEG, Debt and equity raising costs, June 2009, p. 16. 70 AER, Australian Capital Territory distribution determination 2009-10 to 2013-14, Final decision,
April 2009, appendix H, p. 239. 71 NER, clause 6.5.6(c)(1).
286 VICTORIAN DRAFT DISTRIBUTION DETERMINATION—DRAFT DECISION
infer that placements are regularly taken up by a mix of old and new shareholders.72
The AER considers that, for any capital raising, there are three categories of shareholders:
new shareholders, who did not previously own the shares but take up the new equity offer
non–participating shareholders, who hold existing shares but do not take up the new equity offer
participating shareholders, who hold existing shares and in addition take up the new equity offer.
Participating shareholders both pay out the wealth transfer (as existing shareholders) and receive the wealth transfer (as new shareholders), so there is no indirect cost, even at an individual shareholder level.73 This is of course, the reason why the underpricing discount is irrelevant for a non–renounceable rights offer, since all shareholders are participating shareholders.74
CEG failed to account for the existence of participating shareholders in an equity raising.75 Any market observed measure of underpricing needs to be adjusted for the proportion of that placement taken up by participating shareholders. CEG, without presenting any empirical evidence on the matter, assume that there are zero participating shareholders, in spite of the strong conceptual argument that this will not be the case. Each of the presented estimates of indirect costs therefore systematically overestimates the true extent of the wealth transfer.
CEG’s arguments also fail on a longitudinal analysis of shareholder returns. Consider an investor who currently holds no shares of the benchmark firm but intends to do so by taking part in the next capital raising by the firm. According to the CEG perspective, at the next capital raising the investor must be paid (via underpricing) by the existing shareholders to take up the share and become a new shareholder. At subsequent capital raisings, this shareholder is now an existing shareholder, and must pay (via underpricing) other prospective investors to become new shareholders. This continues until the existing shareholder decides it no longer wants to hold shares of the benchmark firm and sells out.
At each capital raising, the exact loss or gain to a particular shareholder depends on the extent of underpricing, the relative proportion of shares offered to new shareholders, and whether they themselves take part in providing new capital. The 72 AER, Australian Capital Territory distribution determination 2009-10 to 2013-14, Final decision,
April 2009, appendix H, p. 239; source document is Handley, J., A note on the costs of raising debt and equity capital: Report prepared for the Australian Energy Regulator, 12 April 2009, p. 6.
73 The AER notes that the exact impact of underpricing depends on the proportion of new shares taken up by the participating shareholder relative to the proportion of new shares issued by the firm as a whole. Nonetheless, this does not affect the core of this argument.
74 This point is specifically acknowledged by CEG. CEG, Debt and equity raising costs, June 2009, p. 16.
75 CEG, Debt and equity raising costs, June 2009, p. 23-28.
APPENDIX N—EQUITY RAISING COSTS 287
aggregate amount paid (via underpricing) to new shareholders must be paid (via underpricing) by existing shareholders. Further, every existing shareholder was initially a new shareholder—so this is a zero sum game. Identification of a subset of shareholders who are net losers from the underpricing transfers necessarily involves the identification of a complementary subset of shareholders who are net winners. Any claim for an increased return on capital to compensate the net losers should be consequent on a claim to reduce the return on capital to those who are net winners from underpricing.
CEG stated that the AER’s position:
…is untenable can be shown by reflecting upon a hypothetical efficient regulated business which is considering raising equity in two ways:
method 1 involves directs [sic] costs (cheques written by the company) of $5m and indirect costs borne by shareholders of $5m; or
method 2 involves direct costs of $1m and indirect costs borne by shareholders of $12m.
Clearly, method 1 is most efficient with the lowest total cost ($10m). Method 2, with $13m in total costs is higher cost. However, method 2 has the lowest direct costs. How would the AER and Professor Handley suggest that the NER requires the firm to be compensated? 76
The question appears difficult to answer only because of the incorrect phrasing of the problem. Following the reasoning above, the indirect component must consist of personal transaction costs (for this example, set at $1 million) and wealth transfer between groups of shareholders. A correct description of the problem then becomes:
Method one involves:
$5 million in direct costs
$1 million in indirect costs, reflecting personal transaction costs of shareholders
$4 million in indirect costs that reflects transfers from one group of shareholders to another group of shareholders.
Method two involves:
$1 million in direct costs
$1 million in indirect costs, reflecting personal transaction costs of shareholders
$11 million in indirect costs, reflecting transfers from one group of shareholders to another group of shareholders.
The AER therefore considers that the NER requires the efficient equity raising cost be $1 million, using method two. The shareholders will recover their personal transaction
76 CEG, Debt and equity raising costs, June 2009, p. 21.
288 VICTORIAN DRAFT DISTRIBUTION DETERMINATION—DRAFT DECISION
costs via the return on equity, since this is consistent with the estimation of the MRP as an input to the CAPM. The transfer represents no net cost to the business, or to shareholders in aggregate, and requires no compensation at the firm level. Further, to the extent that shareholders appear in both transfer groups—that is, they are existing shareholders who participate in the capital raising—there is no net cost on the individual shareholder level. Finally, to the extent that repeated capital raisings occur across time, the transfer groups will have identical membership—since all new shareholders become existing shareholders—and there will be no net cost on the individual shareholder level.
AER conclusions
The AER has considered the material presented by the Victorian DNSPs and their consultants on the inclusion of indirect equity raising costs. The AER concludes that:
there is no evidence to support the claim that indirect costs require compensation simply because of their relationship with direct costs
the Victorian DNSPs (and their consultants) have not correctly interpreted the regulatory framework with regard to:
the consideration of consistent formulae, cash flows and parameters
the consideration of the benchmark firm outcome, not individual shareholder outcomes
an indirect cost allowance for personal transaction costs is not consistent with a cost of equity estimated in the presence of personal transaction costs. That is, compensation for personal transaction costs is already included in the market risk premium and therefore the cost of equity
an indirect cost allowance for wealth transfer is not consistent with consideration of the benchmark firm outcome (as opposed to individual shareholder outcomes) since there is no loss of wealth in aggregate. Further, the indirect cost allowance would not eliminate the existence of wealth transfers in any case.
Having regard to the benchmark expenditure that would be incurred by an efficient DNSP, and other opex factors (or capex factors as the case may be), the AER considers that the proposed indirect equity raising costs do not reasonably reflect efficient costs of achieving the opex objectives (or capex objectives as the case may be) and the costs that a prudent operator in the circumstances of the relevant DNSP would require to achieve the objectives.77 There is therefore no reasonable basis for provision of such an allowance.
N.4.3 Direct equity raising costs
Victorian DNSP regulatory proposals
CitiPower and Powercor proposed direct costs for:
77 NER, cll. 6.5.6(c), 6.5.6(e), 6.5.7(c) and 6.5.7(e).
APPENDIX N—EQUITY RAISING COSTS 289
dividend reinvestment plans of 1 per cent of the equity raised via this method
SEOs of 4 per cent of equity raised via this method.
As discussed above, Jemena have proposed equity raising costs of 7 per cent but have provided little basis on how these costs have been calculated and whether they include both direct and indirect costs. Therefore, the AER's response to the proposed allowance for direct costs will be primarily in response to the arguments put forward in the CEG report submitted by CitiPower and Powercor and the AER's position in previous decisions.
AER considerations
Retained earnings
The AER notes that the Victorian DNSPs have adopted the AER's approach for the cash flow analysis, which does not include any direct costs associated with the use of retained earnings to fund the equity requirements of the benchmark firm.
Consistent with its April 2009 decisions, the AER accepts this aspect of the Victorian DNSPs proposals and considers that there is no direct cost to be applied in the use of retained earnings.78
Dividend reinvestment plans
In its April 2009 final decisions, the AER analysed the costs of raising equity using a sample of five dividend reinvestment plans by three Australian energy network businesses.79 Based on this analysis the AER estimated a median direct cost of raising equity of 0.75 per cent of the total equity raised through dividend reinvestment plans. The AER considered that a conservative estimate of 1 per cent was appropriate.80
The AER considers that it is appropriate to limit the sample to energy network businesses or firms with similar characteristics to a regulated business (that is, stable cash flows). However, given the small sample size, in order to achieve a more statistically robust estimate the AER has also estimated the direct costs of dividend reinvestment plans using a sample of 20 ASX listed Australian firms, as shown in table N.3. Based on the larger sample the median direct cost of raising equity through dividend reinvestment plans is 0.54 per cent.
78 AER, Australian Capital Territory distribution determination, Final decision, April 2009,
appendix H, pp. 247-250 79 ibid, p. 258. 80 ibid, p. 258.
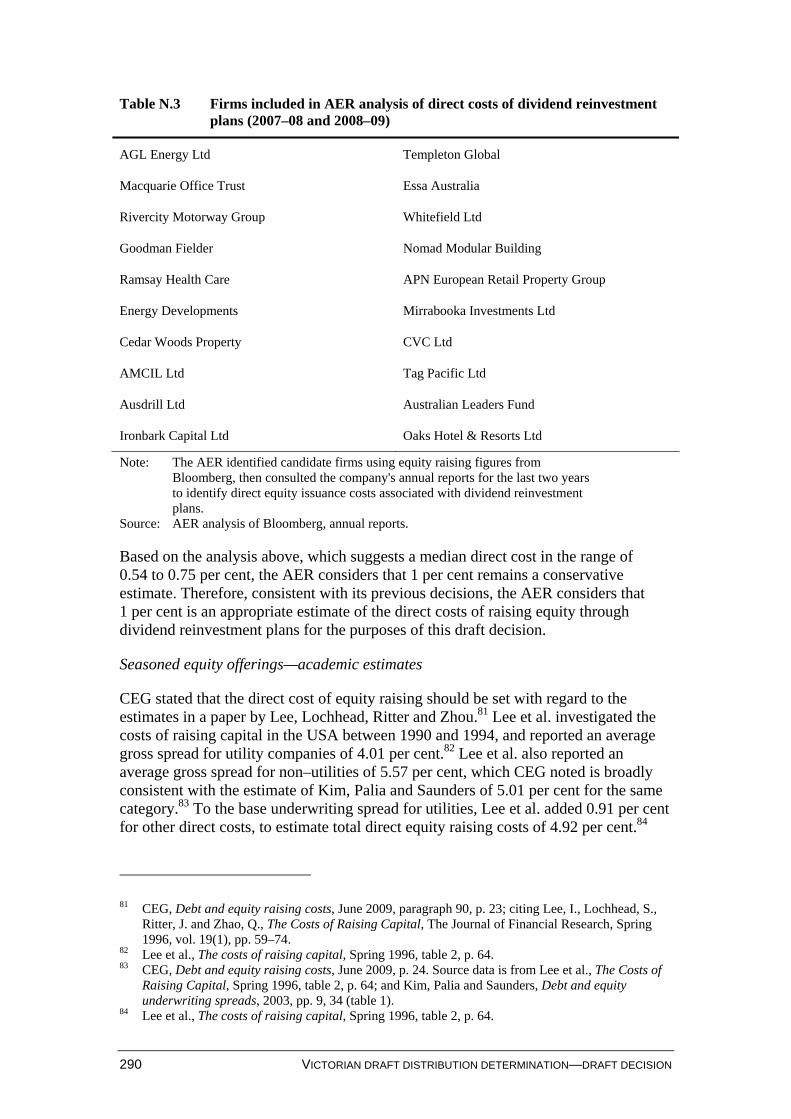
290 VICTORIAN DRAFT DISTRIBUTION DETERMINATION—DRAFT DECISION
Table N.3 Firms included in AER analysis of direct costs of dividend reinvestment plans (2007–08 and 2008–09)
AGL Energy Ltd Templeton Global
Macquarie Office Trust Essa Australia
Rivercity Motorway Group Whitefield Ltd
Goodman Fielder Nomad Modular Building
Ramsay Health Care APN European Retail Property Group
Energy Developments Mirrabooka Investments Ltd
Cedar Woods Property CVC Ltd
AMCIL Ltd Tag Pacific Ltd
Ausdrill Ltd Australian Leaders Fund
Ironbark Capital Ltd Oaks Hotel & Resorts Ltd
Note: The AER identified candidate firms using equity raising figures from Bloomberg, then consulted the company's annual reports for the last two years to identify direct equity issuance costs associated with dividend reinvestment plans.
Source: AER analysis of Bloomberg, annual reports.
Based on the analysis above, which suggests a median direct cost in the range of 0.54 to 0.75 per cent, the AER considers that 1 per cent remains a conservative estimate. Therefore, consistent with its previous decisions, the AER considers that 1 per cent is an appropriate estimate of the direct costs of raising equity through dividend reinvestment plans for the purposes of this draft decision.
Seasoned equity offerings—academic estimates
CEG stated that the direct cost of equity raising should be set with regard to the estimates in a paper by Lee, Lochhead, Ritter and Zhou.81 Lee et al. investigated the costs of raising capital in the USA between 1990 and 1994, and reported an average gross spread for utility companies of 4.01 per cent.82 Lee et al. also reported an average gross spread for non–utilities of 5.57 per cent, which CEG noted is broadly consistent with the estimate of Kim, Palia and Saunders of 5.01 per cent for the same category.83 To the base underwriting spread for utilities, Lee et al. added 0.91 per cent for other direct costs, to estimate total direct equity raising costs of 4.92 per cent.84
81 CEG, Debt and equity raising costs, June 2009, paragraph 90, p. 23; citing Lee, I., Lochhead, S.,
Ritter, J. and Zhao, Q., The Costs of Raising Capital, The Journal of Financial Research, Spring 1996, vol. 19(1), pp. 59–74.
82 Lee et al., The costs of raising capital, Spring 1996, table 2, p. 64. 83 CEG, Debt and equity raising costs, June 2009, p. 24. Source data is from Lee et al., The Costs of
Raising Capital, Spring 1996, table 2, p. 64; and Kim, Palia and Saunders, Debt and equity underwriting spreads, 2003, pp. 9, 34 (table 1).
84 Lee et al., The costs of raising capital, Spring 1996, table 2, p. 64.
APPENDIX N—EQUITY RAISING COSTS 291
CEG also noted that a more conservative estimate based on the Lee et al. study would be to exclude small equity raisings (those below US$20 million), which brings the total direct equity raising costs down to 4.06 per cent (comprising 3.60 per cent underwriting spread and 0.46 per cent for other direct costs).85
The AER observes that the Lee et al. paper showed that direct equity costs, as percentage of total equity raised, decreased as the equity raising size increased.86 A more conservative estimate from the same paper would be to only include equity raisings larger than US$100 million, which would further lower the direct equity raising costs to 3.07 per cent (2.89 per cent for underwriting spread, and 0.18 per cent for other direct costs).87 The AER notes that this would be a more appropriate equity issue size for the Victorian DNSPs and that the benchmark firm has some ability to aggregate its equity raising activities within the regulatory control period to minimise costs. Further, the AER observes that if CEG considered the Saunders et al. estimate (5.57 per cent) to be ‘broadly consistent’ with the Lee et al. estimate for the same category (5.01 per cent) then it should similarly find the Lee et al. estimate of 3.07 per cent (based on a more appropriate equity issue size) was ‘broadly consistent’ with the AER’s estimate of 2.75 per cent.88
The AER considers that the circumstances of firms studied in the Lee et al. paper do not closely match the circumstances of the benchmark firm. Aside from the concerns with country source of data (US firms instead of Australian firms) and age of the results (now more than 15 years old), the Lee et al. study excludes all rights issues, which is considered to be the principal means of raising external equity for the benchmark firm. The AER has previously set out this issue and cautioned reliance on the Lee et al. study.89
CEG also stated that the costs of raising equity in the US are lower than the costs of raising equity in Australia—so even if firms in the US are not a perfect match for the benchmark firm, the Lee et al. estimates based on US data provide a lower bound estimate for the Australian costs.90 The AER considers that, although it may be plausible that the costs of raising equity are lower in the US, this does not imply that the costs of equity for every category of firm and every type of equity raising will be lower.91
85 CEG, Debt and equity raising costs, June 2009, p. 23; citing Lee et al., The Costs of Raising
Capital, Spring 1996, table 2, p. 64. 86 Lee et al., The Costs of Raising Capital, Spring 1996, pp. 63–64. 87 AER analysis of Lee et al., The costs of raising capital, Spring 1996, table 2, p. 64. 88 There is 11.2 per cent difference between the Saunders et al. and Lee et al. estimates for gross
underwriting costs for non–utilities, and 11.6 per cent difference between the AER (April 2009) and the Lee et al. estimates for total underwriting costs for utilities raising over $100 million.
89 AER, Australian Capital Territory distribution determination, Final decision, April 2009, appendix H, p. 250.
90 CEG, Debt and equity raising costs, June 2009, pp. 24–25. 91 The AER notes that the only paper cited by CEG that deals with international comparison of equity
costs is that by Bortolotti, Megginson and Smart. This deals with global capital flows at a very high level, such that it is difficult to make any comparison with the circumstances of the benchmark firm. For example, it makes no attempt to assess the cost of capital for utilities or regulated firms, and aggregates all placements and rights issues. See Bortolotti, Megginson and Smart, Accelerated seasoned equity underwritings, 2008.
292 VICTORIAN DRAFT DISTRIBUTION DETERMINATION—DRAFT DECISION
CEG stated that the exclusion of rights issues is not an issue because placements are the more common form of equity raising in the Australian market.92 The AER considers that CEG is assuming that the market average will automatically define the situation of the benchmark firm, and that this error has been addressed in section N.4.1 of this draft decision. Further, the most relevant evidence on equity raising activities by Australian utilities in the circumstances of the benchmark firm indicates that rights issues are the predominant form of equity raising.
Accordingly, the AER considers that the estimate of direct raising costs from the Lee et al. study cannot be relied on to determine the benchmark direct cost of equity raising.
Seasoned equity offerings—updated analysis
CEG submitted that direct equity raising costs are 3 per cent of the total amount raised.93 This is based on a report by Lee et al. and recent equity raisings by three existing Australian utilities—Envestra, DUET and SP AusNet. As discussed above, the AER does not consider that the Lee at al. report provides a reliable basis for estimating direct equity raising costs for the purposes of this draft decision. Further, although the selection of three recent equity raisings by Australian utilities provides anecdotal evidence of equity raising costs, this does not form a robust data set from which to establish a benchmark allowance.
The AER is not satisfied that the estimates of direct equity raising costs submitted by CEG are reasonable. The AER considers that the methodology it used in the April 2009 final decisions remains the best approach for estimating direct equity raising costs.94 This methodology is based on that recommended by ACG in its 2004 report prepared for the ACCC and uses the costs of SEOs issued by Australian firms to estimate direct equity raising costs.95
In its April 2009 final decisions the AER estimated the direct costs of raising equity to be 2.75 per cent.96 The AER has updated this estimate using the latest available data on 30 SEOs issued by Australian firms between 2007 and 2009.
The AER notes that the recommended methodology in the 2004 ACG report was to use a sample of Australian companies with stable cash flows to estimate the direct equity raising costs for regulated businesses. However, the AER considers that while it is preferable to analyse only those companies with similar characteristics to a regulated firm (for example, stable cash flows), this would result in a very small sample size using the available data—such as the three firms referred to by CEG.
92 CEG, Debt and equity raising costs, June 2009, p. 25. 93 ibid, p. 26. 94 AER, Australian Capital Territory Distribution determination,, Final decision, April 2009,
appendix H, pp. 251, 261. 95 ACG, Debt and equity raising costs, December 2004. 96 AER, Australian Capital Territory Distribution determination,, Final decision, April 2009, p. 261
and AER, New South Wales Distribution determination, Final decision, April 2009, p. 588.
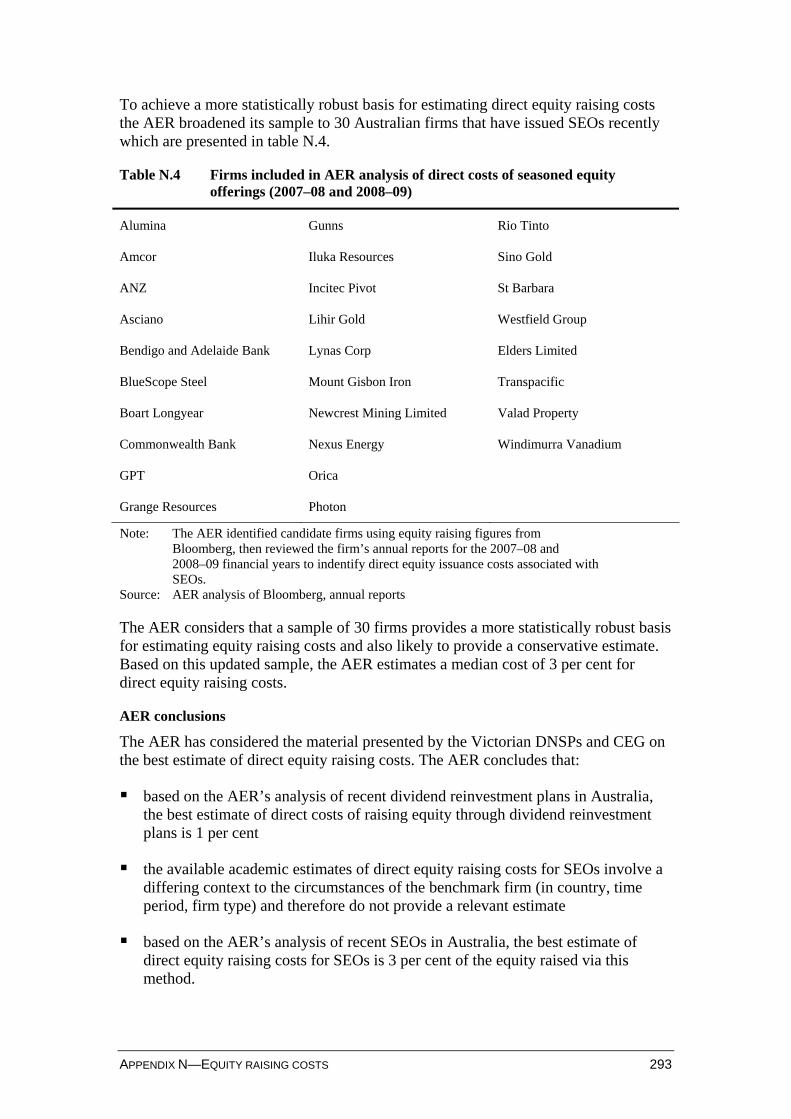
APPENDIX N—EQUITY RAISING COSTS 293
To achieve a more statistically robust basis for estimating direct equity raising costs the AER broadened its sample to 30 Australian firms that have issued SEOs recently which are presented in table N.4.
Table N.4 Firms included in AER analysis of direct costs of seasoned equity offerings (2007–08 and 2008–09)
Alumina Gunns Rio Tinto
Amcor Iluka Resources Sino Gold
ANZ Incitec Pivot St Barbara
Asciano Lihir Gold Westfield Group
Bendigo and Adelaide Bank Lynas Corp Elders Limited
BlueScope Steel Mount Gisbon Iron Transpacific
Boart Longyear Newcrest Mining Limited Valad Property
Commonwealth Bank Nexus Energy Windimurra Vanadium
GPT Orica
Grange Resources Photon
Note: The AER identified candidate firms using equity raising figures from Bloomberg, then reviewed the firm’s annual reports for the 2007–08 and 2008–09 financial years to indentify direct equity issuance costs associated with SEOs.
Source: AER analysis of Bloomberg, annual reports
The AER considers that a sample of 30 firms provides a more statistically robust basis for estimating equity raising costs and also likely to provide a conservative estimate. Based on this updated sample, the AER estimates a median cost of 3 per cent for direct equity raising costs.
AER conclusions
The AER has considered the material presented by the Victorian DNSPs and CEG on the best estimate of direct equity raising costs. The AER concludes that:
based on the AER’s analysis of recent dividend reinvestment plans in Australia, the best estimate of direct costs of raising equity through dividend reinvestment plans is 1 per cent
the available academic estimates of direct equity raising costs for SEOs involve a differing context to the circumstances of the benchmark firm (in country, time period, firm type) and therefore do not provide a relevant estimate
based on the AER’s analysis of recent SEOs in Australia, the best estimate of direct equity raising costs for SEOs is 3 per cent of the equity raised via this method.
294 VICTORIAN DRAFT DISTRIBUTION DETERMINATION—DRAFT DECISION
On this basis, the AER considers that the use of these unit costs represent the best estimate of direct equity raising costs for the benchmark firm. These unit costs should be used in the context of the AER’s methodology from the April 2009 final decisions, which is based on benchmark cash flow analysis to determine the amount of retained earnings and the magnitude of the dividend reinvestment plan.
N.4.4 Early equity raising costs
Victorian DNSP regulatory proposals
In addition to the request for direct and indirect equity raising costs discussed above, CitiPower and Powercor have proposed equity financing that occurs earlier than when the funds are actually required by the DNSP. The AER notes that the arguments put forward by CitiPower and Powercor for early equity raising costs are similar to those put forward for debt raising costs. For consistency the early equity financing approach taken by these DNSPs will be referred to as the completion method.
CitiPower and Powercor have proposed the completion method given the current state of the global economy and as a means to:
ensure funding requirements can be assured when needed;
avoid any fluctuations in the capital markets when equity is required; and
avoid any negative rating consequences from rating agencies.97
In support of the completion method CitiPower and Powercor refer to a paper produced by Standard and Poor's regarding their broad view on how firms should approach their debt refinancing arrangements.98 Whilst the Standard and Poor's paper is debt refinancing oriented, the AER notes that CitiPower and Powercor have further submitted a letter from Standard and Poor's which notes their broad view on the timing of equity funding for capital investment, which is broadly consistent with their approach to debt refinancing.99
In dealing with the completion method, CitiPower, and Powercor have proposed early equity raising costs to:100
…issue equity (via a dividend reinvestment plan or new equity raising) three months prior to maturity, at the benchmark cost of equity, and invest the early issued equity in Treasury notes over those three months.
In determining the completion method the DNSPs have applied the benchmark cost of equity and Treasury note interest rates as measured over 15 days in October 2009. The DNSPs further note that these values will be recalculated over their proposed measurement periods for the AER's Final Decision.
97 CitiPower, Regulatory proposal, p. 309; Powercor, Regulatory proposal, p. 317. 98 Standard and Poors, Ratings Direct: Refinancing And Liquidity Risks Remain, But Australia's
Rated Corporates Are Set To Clear The Debt Logjam, 22 April 2008, p. 6-7. 99 Standard and Poors, Letter to Julie Williams, Chief Financial Officer, CitiPower and Powercor, Re:
Liquidity Risk Management Request for Clarification, 30 October 2009. 100 CitiPower, Regulatory proposal, p. 309; Powercor, Regulatory proposal, p. 317.
APPENDIX N—EQUITY RAISING COSTS 295
AER considerations
The AER notes that in the above statement both CitiPower and Powercor have proposed issuing equity three months prior to 'maturity'. As equity does not mature, the AER considers that this is either a typing error, and should be considered as issuing equity three months prior to its requirement, or that both DNSPs are requiring the early equity raising costs as part of their debt refinancing requirements. Since CitiPower and Powercor did not state in their regulatory proposals that they require the completion method for equity for the latter reason the AER assumes that the completion method is required for equity raising purposes only.
The AER considers that it is prudent for the benchmark firm to manage equity financing risks. The benchmark firm maintains an investment grade credit rating (BBB+) and therefore should meet the requirement of credit rating agencies such as Standard and Poor's for a firm of this credit rating. The AER considers that the benchmark firm will use a broad range of actions to manage equity financing risks. However the AER notes that the managing of equity financing risk is not new and has not arisen due to the current state of the global economy but has been a long term fundamental requirement.
The AER also notes that the completion method is one of a number of options available to firms to ensure that their equity financing will be assured at the time it is required and thus not affecting their credit rating. CitiPower and Powercor both recognise this in their proposals stating that they:
…must implement one of a number of options well in advance of the equity requirement…101
This is also recognised by Standard and Poor's letter which states:
…we would want to see that the company has a credible strategy for financing itself.102
However, neither CitiPower nor Powercor have proposed either an alternative approach or alternative strategy in their respective proposals or provided appropriate reasoning as to why the completion method has been chosen over these other approaches.
Based on the AER's discussion and analysis of the similar information put forward by the Victorian DNSPs for the completion method for debt raising costs (see chapter 7), the AER concludes that alternative approaches include the commitment method and the underwriting method.
As stated above, the AER uses the ACG methodology in determining equity raising costs. The ACG methodology analyses the cost of raising equity using a sample of appropriate business or firms. The AER notes that ACG states that cost components for businesses raising equity through a dividend reinvestment plan or a SEO include underwriting costs. In respect of dividend reinvestment plans ACG state:
101 CitiPower, Regulatory proposal, p. 309; Powercor, Regulatory proposal, p. 317. 102 Standard and Poors, Letter to Julie Williams, Chief Financial Officer, CitiPower and Powercor, Re:
Liquidity Risk Management Request for Clarification, 30 October 2009.
296 VICTORIAN DRAFT DISTRIBUTION DETERMINATION—DRAFT DECISION
Companies will often underwrite a DRP with a broker since there may be only a 30% take-up rate on the DRP.103
In respect of SEOs, ACG note that the cost and fee structures mirror that of an initial public offering (IPO) but occur at a lower respective cost. ACG breaks down the IPO cost components which explicitly state that underwriting fees are included.104 In demonstrating the lower costs of an SEO in comparison to an IPO, ACG explicitly noted that the median underwriting fee for an SEO is lower than the median underwriting fee for an IPO.105
Through its analysis of the completion method for debt raising costs, the AER considers that the underwriting method is a direct alternative to the commitment and completion approaches. Further the AER considers in its analysis of debt raising costs, that the underwriting method is the most efficient cost in comparison to the commitment and completion approaches.
Further, the AER notes that the proposal for costs associated with the completion method is in addition to the equity raising costs allowance based on the ACG methodology. However there are strong grounds to consider that the equity raising costs already includes sufficient provision for managing equity financing risk considering that:
the 2004 ACG report was a comprehensive review of the transaction costs involved in raising equity (and debt)
the issue of equity financing risk was known and relevant when the ACG undertook its analysis
the AER considers that it is reasonable to conclude that ACG took into account the need to mitigate equity financing risk (to an appropriate level) when estimating a benchmark for equity raising costs
the (standard) equity raising cost allowance still uses the approach recommended by ACG which implicitly includes an underwriting cost component.
Therefore, on balance, the AER considers that the ACG analysis provides the most comprehensive total estimate of the costs involved in raising equity.
In managing their equity raising risks, the set of comparator firms use a variety of actions which may include the use of the completion, commitment or underwriting methods but is not limited to these and will encompass a broader range of actions. The AER determines the benchmark equity raising costs on the observations of these comparator firms equity raising costs and sets the benchmark at a conservative level. The AER therefore considers that the standard equity raising costs already includes an underwriting component, and the underwriting component is a direct alternative to the completion method.
103 ACG, Debt and equity raising costs, December 2004, p. 63. 104 ibid, p. 57. 105 ibid, p. 65.
APPENDIX N—EQUITY RAISING COSTS 297
AER conclusions
The AER considers that the benchmark firm should be compensated for the efficient costs of an equity financing plan. However, the AER does not consider that the allowance proposed by CitiPower and Powercor should be added to the (standard) equity raising costs allowance based on the ACG methodology. The AER considers that this would double count the costs of managing equity financing risk.
The AER considers that the allowance for (standard) equity raising costs already includes the efficient costs of an equity financing plan and that no increase in these costs is required.
N.4.5 Benchmark cash flow analysis—implementation of the equity raising cost allowance
Victorian DNSP regulatory proposals
As discussed above, the Victorian DNSPs have adopted the benchmark cash flow analysis—as determined by the AER in its April 2009 final decisions—in order to determine the amount of equity raising required. In summary, the analysis calculated the amount of retained earnings (taking account of dividend reinvestment plans), which was deducted from the equity portion of forecast capex.
The AER has undertaken an assessment of the benchmark cash flows calculated in the PTRM by the Victorian DNSPs to model the equity raising cost allowance and considers some adjustments (as well as the adjustments to unit costs for dividend reinvestment plans and SEOs as set out in this appendix) are required.
Dividend payout ratio
Jemena have assumed a dividend payout ratio of 66 per cent which it argued is consistent with its proposed imputation credit payout ratio in its discussion on gamma.106 However, as discussed in chapter 11 the AER has rejected the 66 per cent imputation pay out ratio and adopted the position of a 100 per cent payout ratio as a simplifying assumption. Under the assumption of a 100 per cent imputation payout ratio, the AER considers Jemena’s proposed 66 per cent dividend pay out ratio would be insufficient to pay out all of the imputation credits. Therefore, in calculating Jemena’s equity raising costs for this draft decision, the AER has adjusted dividends to the level required to distribute 100 per cent of imputation credits.
Amortisation of allowance
In its April 2009 final decisions, the AER adopted the approach to treat an allowance for equity raising costs as part of the RAB—that is, to amortise the allowance.107
This approach was consistent with the AER’s previous treatment in the 2006 Powerlink transmission determination, which considered the benchmark cash flow
106 Jemena, Regulatory proposal, p. 14. The AER notes that the dividend payout ratio and imputation
payout ratio are two separate concepts. However, the dividend payout ratio must be sufficiently high enough to payout the number of franking credits created assumed in the cash flow modelling.
107 See for example AER, TransGrid transmission determination 2009–10 to 2013–14, Final decision, pp. 96–97, 246.
298 VICTORIAN DRAFT DISTRIBUTION DETERMINATION—DRAFT DECISION
analysis to determine the extent of equity raising cost associated with forecast capex. The AER considers that although the amortisation treatment is equivalent in NPV terms to a perpetuity income stream provided as part of the opex allowance, there are several advantages to the former approach:
it ensures a transparent link between the equity raising cost and the capex that required the equity raising
it eases administrative implementation in future regulatory resets
it implements the recommendation made by ACG.108
In accordance with the AER’s previous approach, the benchmark equity raising cost allowances for the Victorian DNSPs will be amortised over the weighted average standard life of their RABs to provide the equity raising cost allowance associated with forecast capex in the forthcoming regulatory control period.
The AER observes that CitiPower and Powercor have included the standard lives of public lighting and standard metering assets in calculating the weighted average standard life for the amortisation of equity raising costs in the RAB. The AER notes that due to historical regulatory practices some public lighting and standard metering assets exist in some of the Victorian DNSPs RABs. However these services are no longer standard control services and therefore no additional assets regarding these services will be added to the RAB in the forthcoming regulatory period. These residual assets are gradually being removed from the RAB through amortisation. Further, the AER notes that equity raising costs for the forthcoming period will not be utilised in raising equity for either of these purposes. Therefore the AER considers it inappropriate to include these assets when calculating the weighted average standard life for amortising equity raising costs. Consequently the AER has removed the standard lives of these assets in calculating the weighted average standard life for amortising equity raising costs both CitiPower and Powercor. The AER notes that by making these adjustments (after taking into account the adjustments to unit costs for dividend reinvestment plans and SEOs) the outcome has an immaterial effect for both CitiPower and Powercor.
N.5 AER conclusion The AER has considered the arguments made by the Victorian DNSPs on equity raising costs, including consultant reports and submissions.
The AER considers that there is no evidence that the benchmark firm must use equity raising methods in market average proportions. The most relevant analysis of equity raising methods supports the AER methodology, with a hierarchy of retained earnings and dividend reinvestment plans, then SEOs (placements and rights issues).
The AER considers that there is no basis on which to accept an allowance for indirect equity raising costs. The AER notes that personal transaction costs are not an appropriate justification for an allowance under the regulatory framework. Similarly,
108 ACG, Debt and equity raising costs, December 2004, p. xiii.
APPENDIX N—EQUITY RAISING COSTS 299
the AER notes that arguments relying on wealth transfer between investors are not appropriate justification for an allowance, since the regulatory framework specifies investor returns in aggregate.
Further, the AER does not consider that the costs of the completion method proposed by the DNSPs represent efficient costs incurred by a benchmark network service provider. The AER considers that the allowance for (standard) equity raising costs already includes the efficient costs of an equity financing plan and that no increase in these costs is required.
The AER considers that the best estimate of the direct costs of raising equity varies depending on the method employed:
0 per cent of equity obtained via retained earnings
1 per cent of equity obtained via dividend reinvestment plans
3 per cent of equity obtained via external SEOs (placements and rights issues).
These benchmark unit costs include updates to previously applied figures based on recent data. The AER rejects the alternative estimates of direct equity raising costs proposed by the Victorian DNSPs on the grounds that they deviate substantially from the equity raising conditions relevant to the benchmark firm.
For each Victorian DNSP, the AER will apply the benchmark cash flow analysis and determine the amount that will be available from retained earnings and the amount reinvested via dividend reinvestment plans, and the amount of external equity required for the forthcoming regulatory control period from SEOs (placements and rights issues). Each component will be added to arrive at a total benchmark equity raising cost for each Victorian DNSP.
The AER's conclusion on benchmark equity raising costs for CitiPower, Powercor and Jemena over the forthcoming regulatory period is set out in table N.5. As can be seen Jemena has sufficient retained cash flows for reinvestment for its equity requirements in the forthcoming regulatory control period. Therefore, no benchmark equity raising costs have been provided. The AER has utilised a consistent approach across all Victorian DNSPs and has had regard to the capex factors in coming to its conclusion.
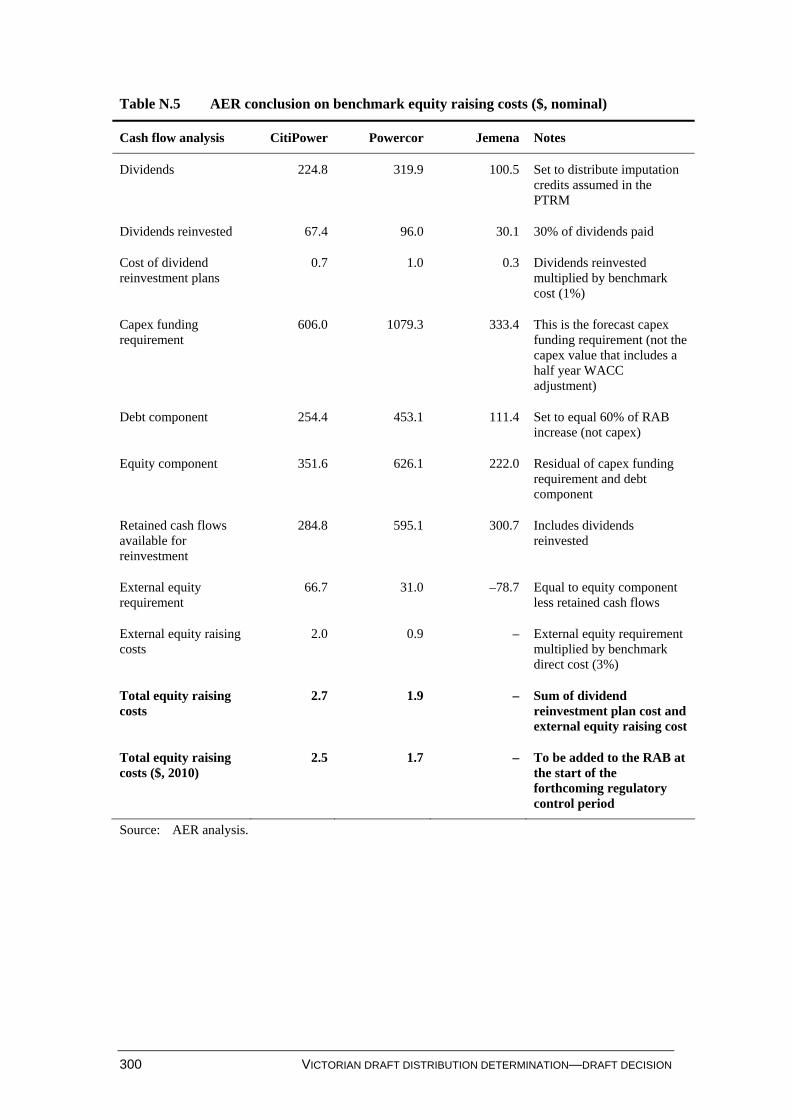
300 VICTORIAN DRAFT DISTRIBUTION DETERMINATION—DRAFT DECISION
Table N.5 AER conclusion on benchmark equity raising costs ($, nominal)
Cash flow analysis CitiPower Powercor Jemena Notes
Dividends 224.8 319.9 100.5 Set to distribute imputation credits assumed in the PTRM
Dividends reinvested 67.4 96.0 30.1 30% of dividends paid
Cost of dividend reinvestment plans
0.7 1.0 0.3 Dividends reinvested multiplied by benchmark cost (1%)
Capex funding requirement
606.0 1079.3 333.4 This is the forecast capex funding requirement (not the capex value that includes a half year WACC adjustment)
Debt component 254.4 453.1 111.4 Set to equal 60% of RAB increase (not capex)
Equity component 351.6 626.1 222.0 Residual of capex funding requirement and debt component
Retained cash flows available for reinvestment
284.8 595.1 300.7 Includes dividends reinvested
External equity requirement
66.7 31.0 –78.7 Equal to equity component less retained cash flows
External equity raising costs
2.0 0.9 – External equity requirement multiplied by benchmark direct cost (3%)
Total equity raising costs
2.7 1.9 – Sum of dividend reinvestment plan cost and external equity raising cost
Total equity raising costs ($, 2010)
2.5 1.7 – To be added to the RAB at the start of the forthcoming regulatory control period
Source: AER analysis.
APPENDIX O––ALTERNATIVE CONTROL SERVICES PRICES AND LABOUR RATES 301
O Alternative control services prices and labour rates
O.1 Public lighting services—proposed prices The following tables provide each of the DNSPs proposed public lighting operation, maintenance and repair (OMR) charges for the 2011–15 regulatory control period.
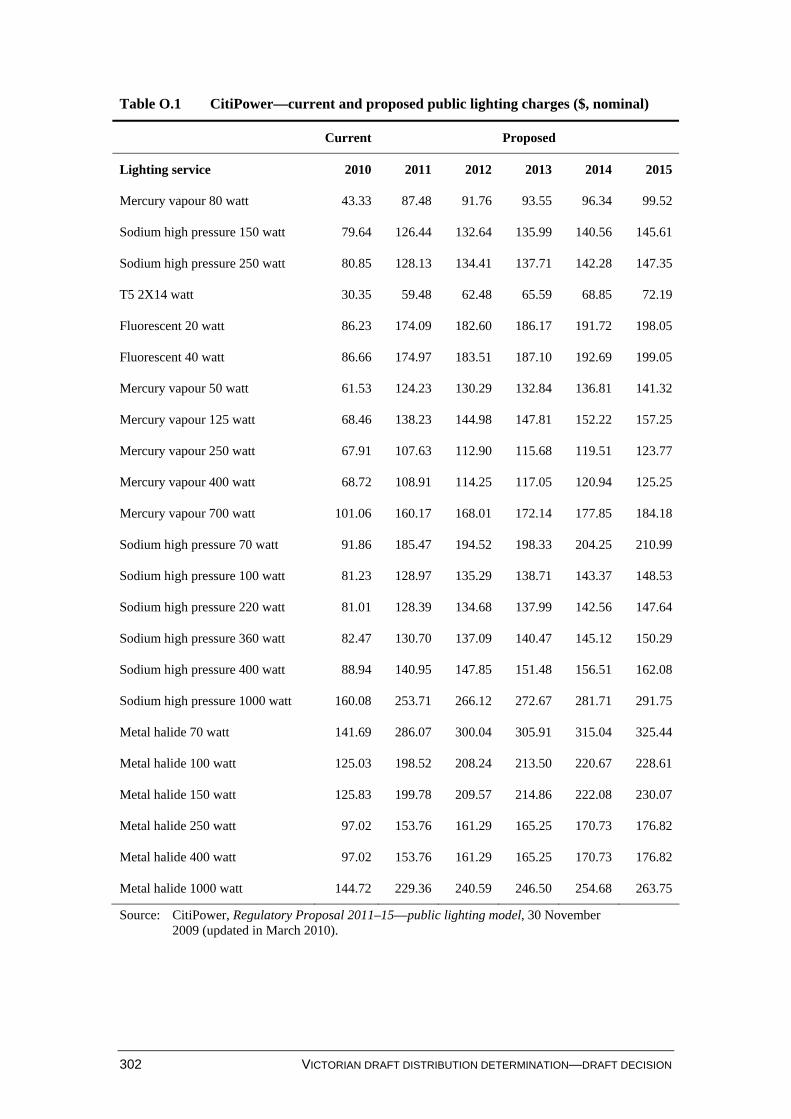
302 VICTORIAN DRAFT DISTRIBUTION DETERMINATION—DRAFT DECISION
Table O.1 CitiPower—current and proposed public lighting charges ($, nominal)
Current Proposed
Lighting service 2010 2011 2012 2013 2014 2015
Mercury vapour 80 watt 43.33 87.48 91.76 93.55 96.34 99.52
Sodium high pressure 150 watt 79.64 126.44 132.64 135.99 140.56 145.61
Sodium high pressure 250 watt 80.85 128.13 134.41 137.71 142.28 147.35
T5 2X14 watt 30.35 59.48 62.48 65.59 68.85 72.19
Fluorescent 20 watt 86.23 174.09 182.60 186.17 191.72 198.05
Fluorescent 40 watt 86.66 174.97 183.51 187.10 192.69 199.05
Mercury vapour 50 watt 61.53 124.23 130.29 132.84 136.81 141.32
Mercury vapour 125 watt 68.46 138.23 144.98 147.81 152.22 157.25
Mercury vapour 250 watt 67.91 107.63 112.90 115.68 119.51 123.77
Mercury vapour 400 watt 68.72 108.91 114.25 117.05 120.94 125.25
Mercury vapour 700 watt 101.06 160.17 168.01 172.14 177.85 184.18
Sodium high pressure 70 watt 91.86 185.47 194.52 198.33 204.25 210.99
Sodium high pressure 100 watt 81.23 128.97 135.29 138.71 143.37 148.53
Sodium high pressure 220 watt 81.01 128.39 134.68 137.99 142.56 147.64
Sodium high pressure 360 watt 82.47 130.70 137.09 140.47 145.12 150.29
Sodium high pressure 400 watt 88.94 140.95 147.85 151.48 156.51 162.08
Sodium high pressure 1000 watt 160.08 253.71 266.12 272.67 281.71 291.75
Metal halide 70 watt 141.69 286.07 300.04 305.91 315.04 325.44
Metal halide 100 watt 125.03 198.52 208.24 213.50 220.67 228.61
Metal halide 150 watt 125.83 199.78 209.57 214.86 222.08 230.07
Metal halide 250 watt 97.02 153.76 161.29 165.25 170.73 176.82
Metal halide 400 watt 97.02 153.76 161.29 165.25 170.73 176.82
Metal halide 1000 watt 144.72 229.36 240.59 246.50 254.68 263.75
Source: CitiPower, Regulatory Proposal 2011–15—public lighting model, 30 November 2009 (updated in March 2010).
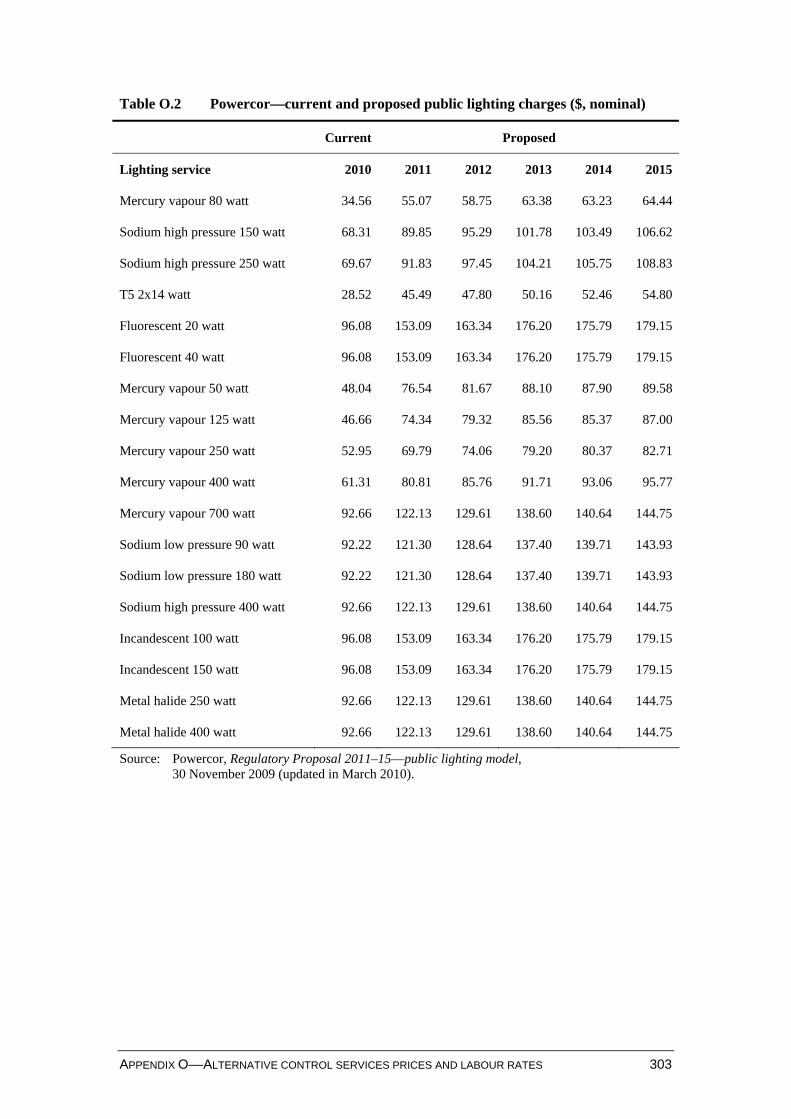
APPENDIX O––ALTERNATIVE CONTROL SERVICES PRICES AND LABOUR RATES 303
Table O.2 Powercor—current and proposed public lighting charges ($, nominal)
Current Proposed
Lighting service 2010 2011 2012 2013 2014 2015
Mercury vapour 80 watt 34.56 55.07 58.75 63.38 63.23 64.44
Sodium high pressure 150 watt 68.31 89.85 95.29 101.78 103.49 106.62
Sodium high pressure 250 watt 69.67 91.83 97.45 104.21 105.75 108.83
T5 2x14 watt 28.52 45.49 47.80 50.16 52.46 54.80
Fluorescent 20 watt 96.08 153.09 163.34 176.20 175.79 179.15
Fluorescent 40 watt 96.08 153.09 163.34 176.20 175.79 179.15
Mercury vapour 50 watt 48.04 76.54 81.67 88.10 87.90 89.58
Mercury vapour 125 watt 46.66 74.34 79.32 85.56 85.37 87.00
Mercury vapour 250 watt 52.95 69.79 74.06 79.20 80.37 82.71
Mercury vapour 400 watt 61.31 80.81 85.76 91.71 93.06 95.77
Mercury vapour 700 watt 92.66 122.13 129.61 138.60 140.64 144.75
Sodium low pressure 90 watt 92.22 121.30 128.64 137.40 139.71 143.93
Sodium low pressure 180 watt 92.22 121.30 128.64 137.40 139.71 143.93
Sodium high pressure 400 watt 92.66 122.13 129.61 138.60 140.64 144.75
Incandescent 100 watt 96.08 153.09 163.34 176.20 175.79 179.15
Incandescent 150 watt 96.08 153.09 163.34 176.20 175.79 179.15
Metal halide 250 watt 92.66 122.13 129.61 138.60 140.64 144.75
Metal halide 400 watt 92.66 122.13 129.61 138.60 140.64 144.75
Source: Powercor, Regulatory Proposal 2011–15—public lighting model, 30 November 2009 (updated in March 2010).
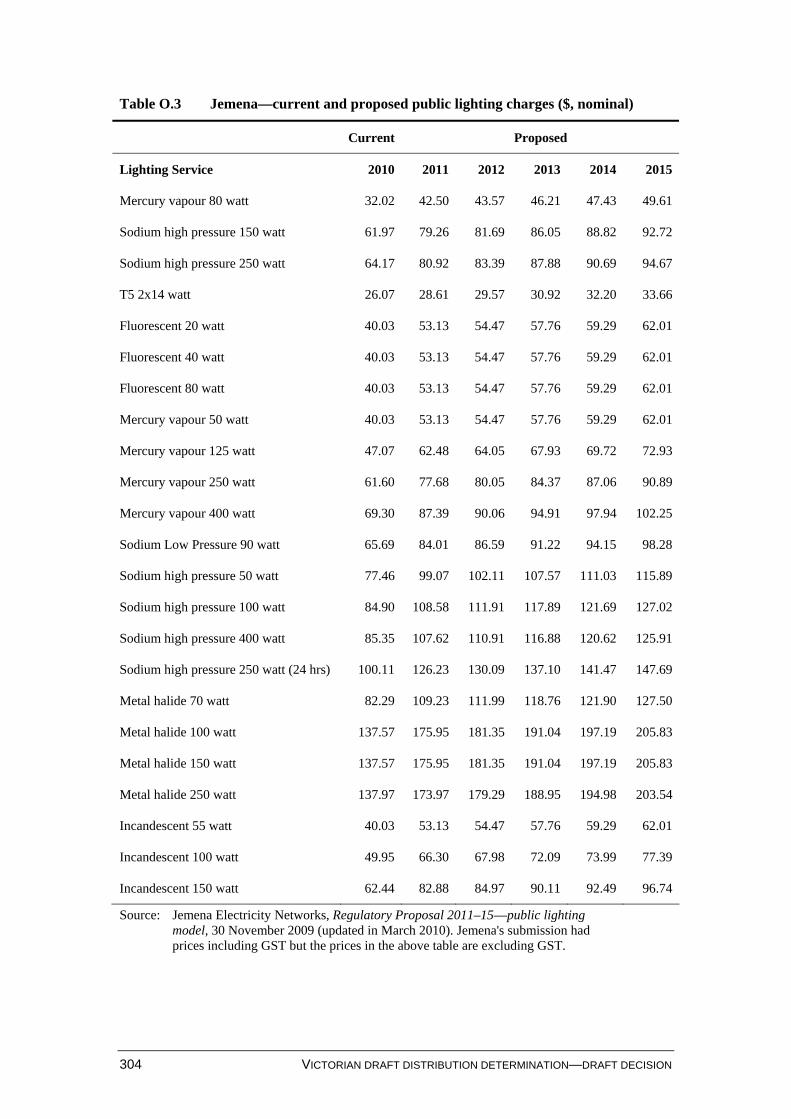
304 VICTORIAN DRAFT DISTRIBUTION DETERMINATION—DRAFT DECISION
Table O.3 Jemena—current and proposed public lighting charges ($, nominal)
Current Proposed
Lighting Service 2010 2011 2012 2013 2014 2015
Mercury vapour 80 watt 32.02 42.50 43.57 46.21 47.43 49.61
Sodium high pressure 150 watt 61.97 79.26 81.69 86.05 88.82 92.72
Sodium high pressure 250 watt 64.17 80.92 83.39 87.88 90.69 94.67
T5 2x14 watt 26.07 28.61 29.57 30.92 32.20 33.66
Fluorescent 20 watt 40.03 53.13 54.47 57.76 59.29 62.01
Fluorescent 40 watt 40.03 53.13 54.47 57.76 59.29 62.01
Fluorescent 80 watt 40.03 53.13 54.47 57.76 59.29 62.01
Mercury vapour 50 watt 40.03 53.13 54.47 57.76 59.29 62.01
Mercury vapour 125 watt 47.07 62.48 64.05 67.93 69.72 72.93
Mercury vapour 250 watt 61.60 77.68 80.05 84.37 87.06 90.89
Mercury vapour 400 watt 69.30 87.39 90.06 94.91 97.94 102.25
Sodium Low Pressure 90 watt 65.69 84.01 86.59 91.22 94.15 98.28
Sodium high pressure 50 watt 77.46 99.07 102.11 107.57 111.03 115.89
Sodium high pressure 100 watt 84.90 108.58 111.91 117.89 121.69 127.02
Sodium high pressure 400 watt 85.35 107.62 110.91 116.88 120.62 125.91
Sodium high pressure 250 watt (24 hrs) 100.11 126.23 130.09 137.10 141.47 147.69
Metal halide 70 watt 82.29 109.23 111.99 118.76 121.90 127.50
Metal halide 100 watt 137.57 175.95 181.35 191.04 197.19 205.83
Metal halide 150 watt 137.57 175.95 181.35 191.04 197.19 205.83
Metal halide 250 watt 137.97 173.97 179.29 188.95 194.98 203.54
Incandescent 55 watt 40.03 53.13 54.47 57.76 59.29 62.01
Incandescent 100 watt 49.95 66.30 67.98 72.09 73.99 77.39
Incandescent 150 watt 62.44 82.88 84.97 90.11 92.49 96.74
Source: Jemena Electricity Networks, Regulatory Proposal 2011–15—public lighting model, 30 November 2009 (updated in March 2010). Jemena's submission had prices including GST but the prices in the above table are excluding GST.
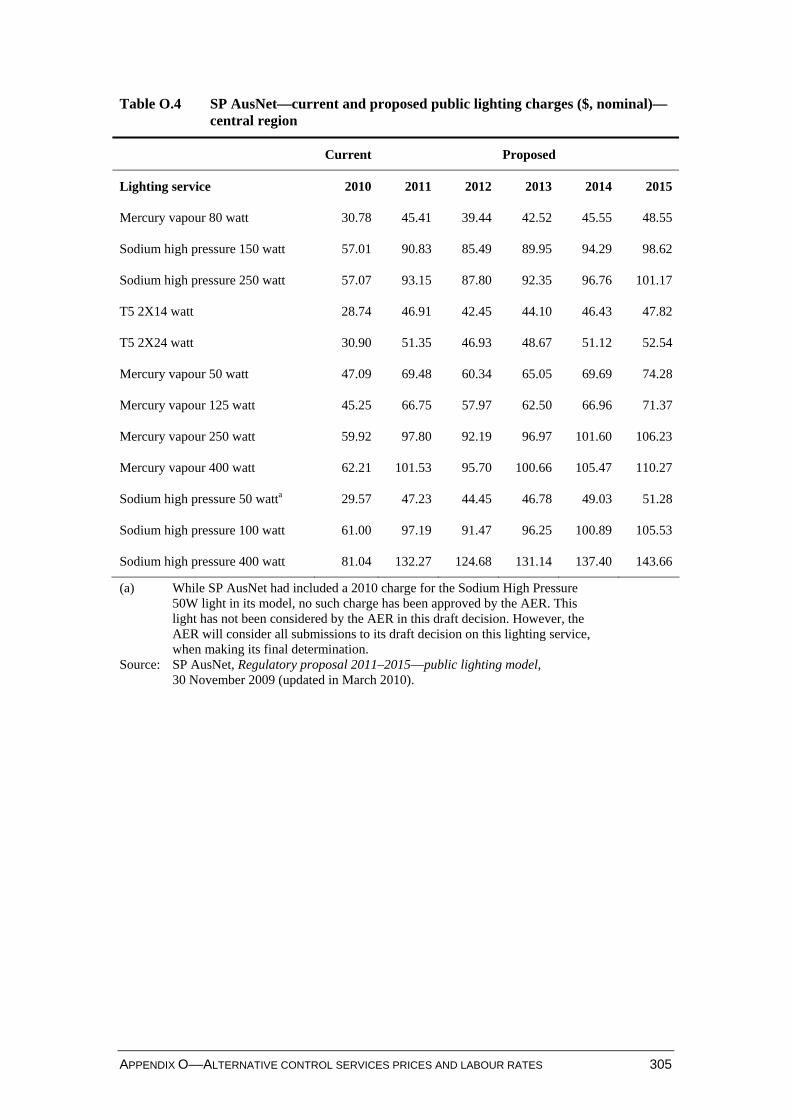
APPENDIX O––ALTERNATIVE CONTROL SERVICES PRICES AND LABOUR RATES 305
Table O.4 SP AusNet—current and proposed public lighting charges ($, nominal)—central region
Current Proposed
Lighting service 2010 2011 2012 2013 2014 2015
Mercury vapour 80 watt 30.78 45.41 39.44 42.52 45.55 48.55
Sodium high pressure 150 watt 57.01 90.83 85.49 89.95 94.29 98.62
Sodium high pressure 250 watt 57.07 93.15 87.80 92.35 96.76 101.17
T5 2X14 watt 28.74 46.91 42.45 44.10 46.43 47.82
T5 2X24 watt 30.90 51.35 46.93 48.67 51.12 52.54
Mercury vapour 50 watt 47.09 69.48 60.34 65.05 69.69 74.28
Mercury vapour 125 watt 45.25 66.75 57.97 62.50 66.96 71.37
Mercury vapour 250 watt 59.92 97.80 92.19 96.97 101.60 106.23
Mercury vapour 400 watt 62.21 101.53 95.70 100.66 105.47 110.27
Sodium high pressure 50 watta 29.57 47.23 44.45 46.78 49.03 51.28
Sodium high pressure 100 watt 61.00 97.19 91.47 96.25 100.89 105.53
Sodium high pressure 400 watt 81.04 132.27 124.68 131.14 137.40 143.66
(a) While SP AusNet had included a 2010 charge for the Sodium High Pressure 50W light in its model, no such charge has been approved by the AER. This light has not been considered by the AER in this draft decision. However, the AER will consider all submissions to its draft decision on this lighting service, when making its final determination.
Source: SP AusNet, Regulatory proposal 2011–2015—public lighting model, 30 November 2009 (updated in March 2010).
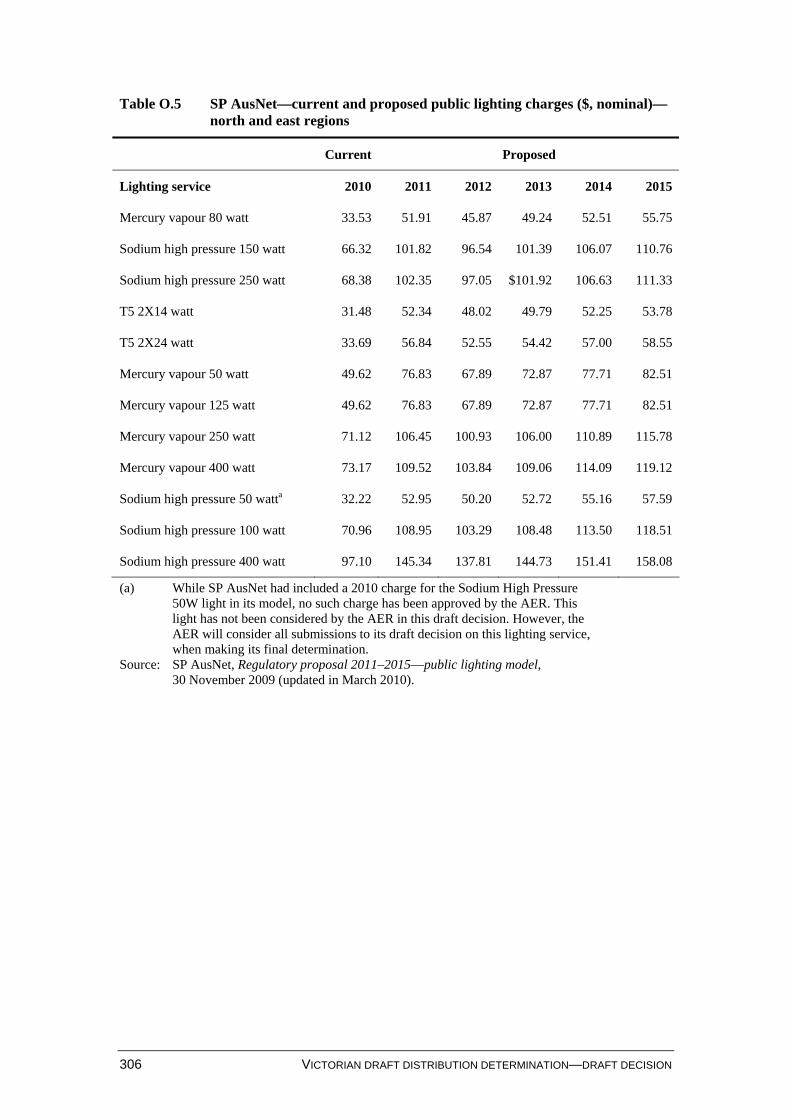
306 VICTORIAN DRAFT DISTRIBUTION DETERMINATION—DRAFT DECISION
Table O.5 SP AusNet—current and proposed public lighting charges ($, nominal)—north and east regions
Current Proposed
Lighting service 2010 2011 2012 2013 2014 2015
Mercury vapour 80 watt 33.53 51.91 45.87 49.24 52.51 55.75
Sodium high pressure 150 watt 66.32 101.82 96.54 101.39 106.07 110.76
Sodium high pressure 250 watt 68.38 102.35 97.05 $101.92 106.63 111.33
T5 2X14 watt 31.48 52.34 48.02 49.79 52.25 53.78
T5 2X24 watt 33.69 56.84 52.55 54.42 57.00 58.55
Mercury vapour 50 watt 49.62 76.83 67.89 72.87 77.71 82.51
Mercury vapour 125 watt 49.62 76.83 67.89 72.87 77.71 82.51
Mercury vapour 250 watt 71.12 106.45 100.93 106.00 110.89 115.78
Mercury vapour 400 watt 73.17 109.52 103.84 109.06 114.09 119.12
Sodium high pressure 50 watta 32.22 52.95 50.20 52.72 55.16 57.59
Sodium high pressure 100 watt 70.96 108.95 103.29 108.48 113.50 118.51
Sodium high pressure 400 watt 97.10 145.34 137.81 144.73 151.41 158.08
(a) While SP AusNet had included a 2010 charge for the Sodium High Pressure 50W light in its model, no such charge has been approved by the AER. This light has not been considered by the AER in this draft decision. However, the AER will consider all submissions to its draft decision on this lighting service, when making its final determination.
Source: SP AusNet, Regulatory proposal 2011–2015—public lighting model, 30 November 2009 (updated in March 2010).
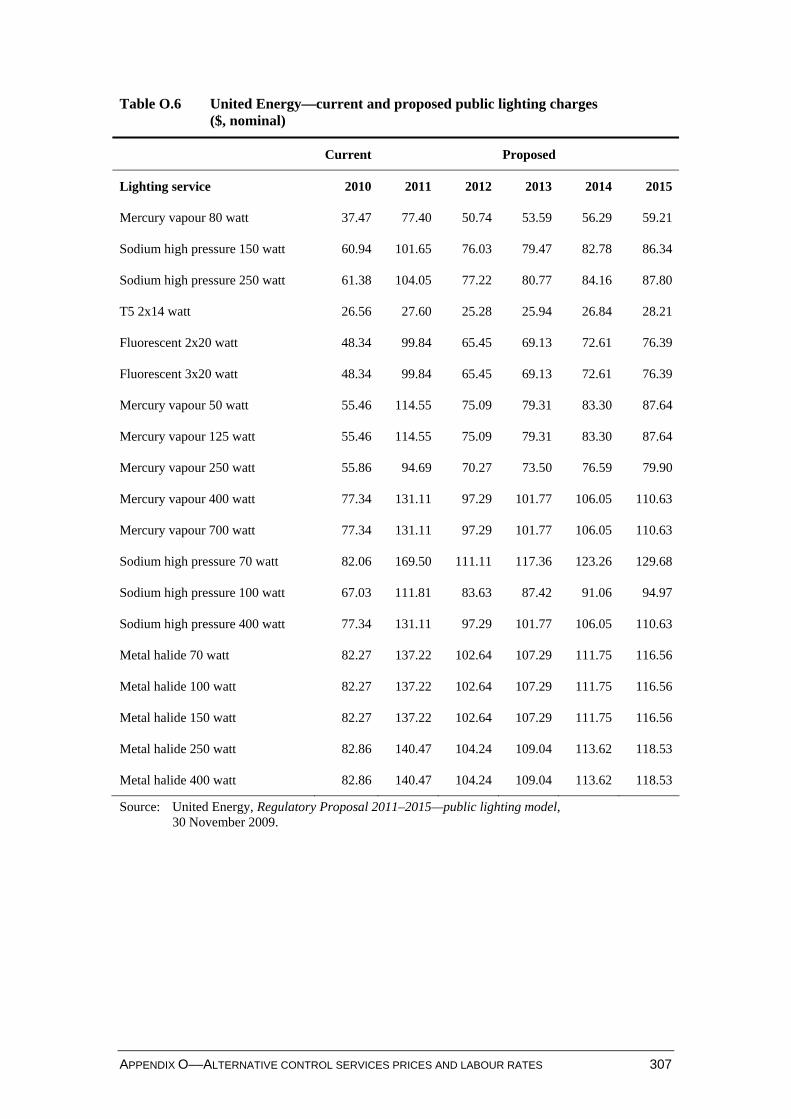
APPENDIX O––ALTERNATIVE CONTROL SERVICES PRICES AND LABOUR RATES 307
Table O.6 United Energy—current and proposed public lighting charges ($, nominal)
Current Proposed
Lighting service 2010 2011 2012 2013 2014 2015
Mercury vapour 80 watt 37.47 77.40 50.74 53.59 56.29 59.21
Sodium high pressure 150 watt 60.94 101.65 76.03 79.47 82.78 86.34
Sodium high pressure 250 watt 61.38 104.05 77.22 80.77 84.16 87.80
T5 2x14 watt 26.56 27.60 25.28 25.94 26.84 28.21
Fluorescent 2x20 watt 48.34 99.84 65.45 69.13 72.61 76.39
Fluorescent 3x20 watt 48.34 99.84 65.45 69.13 72.61 76.39
Mercury vapour 50 watt 55.46 114.55 75.09 79.31 83.30 87.64
Mercury vapour 125 watt 55.46 114.55 75.09 79.31 83.30 87.64
Mercury vapour 250 watt 55.86 94.69 70.27 73.50 76.59 79.90
Mercury vapour 400 watt 77.34 131.11 97.29 101.77 106.05 110.63
Mercury vapour 700 watt 77.34 131.11 97.29 101.77 106.05 110.63
Sodium high pressure 70 watt 82.06 169.50 111.11 117.36 123.26 129.68
Sodium high pressure 100 watt 67.03 111.81 83.63 87.42 91.06 94.97
Sodium high pressure 400 watt 77.34 131.11 97.29 101.77 106.05 110.63
Metal halide 70 watt 82.27 137.22 102.64 107.29 111.75 116.56
Metal halide 100 watt 82.27 137.22 102.64 107.29 111.75 116.56
Metal halide 150 watt 82.27 137.22 102.64 107.29 111.75 116.56
Metal halide 250 watt 82.86 140.47 104.24 109.04 113.62 118.53
Metal halide 400 watt 82.86 140.47 104.24 109.04 113.62 118.53
Source: United Energy, Regulatory Proposal 2011–2015—public lighting model, 30 November 2009.
308 VICTORIAN DRAFT DISTRIBUTION DETERMINATION—DRAFT DECISION
O.2 Fee based alternative control services Following the considerations set out in chapter 20, the following tables set out the current (2010), proposed and AER approved prices for the DNSPs' fee based alternative control services. The tables also present the overall percentage difference between the DNSPs' proposed prices and the AER's draft determination prices. All prices are GST exclusive.
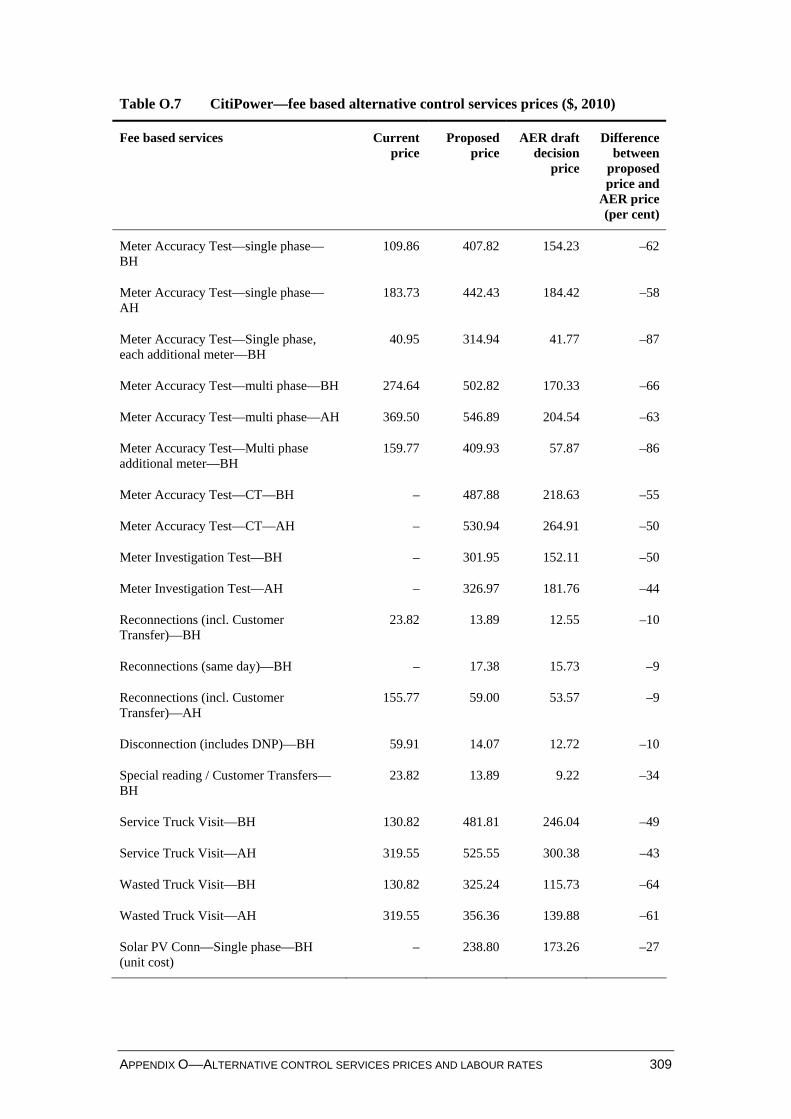
APPENDIX O––ALTERNATIVE CONTROL SERVICES PRICES AND LABOUR RATES 309
Table O.7 CitiPower—fee based alternative control services prices ($, 2010)
Fee based services Current price
Proposed price
AER draft decision
price
Difference between
proposed price and
AER price (per cent)
Meter Accuracy Test—single phase—BH
109.86 407.82 154.23 –62
Meter Accuracy Test—single phase—AH
183.73 442.43 184.42 –58
Meter Accuracy Test—Single phase, each additional meter—BH
40.95 314.94 41.77 –87
Meter Accuracy Test—multi phase—BH 274.64 502.82 170.33 –66
Meter Accuracy Test—multi phase—AH 369.50 546.89 204.54 –63
Meter Accuracy Test—Multi phase additional meter—BH
159.77 409.93 57.87 –86
Meter Accuracy Test—CT—BH – 487.88 218.63 –55
Meter Accuracy Test—CT—AH – 530.94 264.91 –50
Meter Investigation Test—BH – 301.95 152.11 –50
Meter Investigation Test—AH – 326.97 181.76 –44
Reconnections (incl. Customer Transfer)—BH
23.82 13.89 12.55 –10
Reconnections (same day)—BH – 17.38 15.73 –9
Reconnections (incl. Customer Transfer)—AH
155.77 59.00 53.57 –9
Disconnection (includes DNP)—BH 59.91 14.07 12.72 –10
Special reading / Customer Transfers—BH
23.82 13.89 9.22 –34
Service Truck Visit—BH 130.82 481.81 246.04 –49
Service Truck Visit—AH 319.55 525.55 300.38 –43
Wasted Truck Visit—BH 130.82 325.24 115.73 –64
Wasted Truck Visit—AH 319.55 356.36 139.88 –61
Solar PV Conn—Single phase—BH (unit cost)
– 238.80 173.26 –27
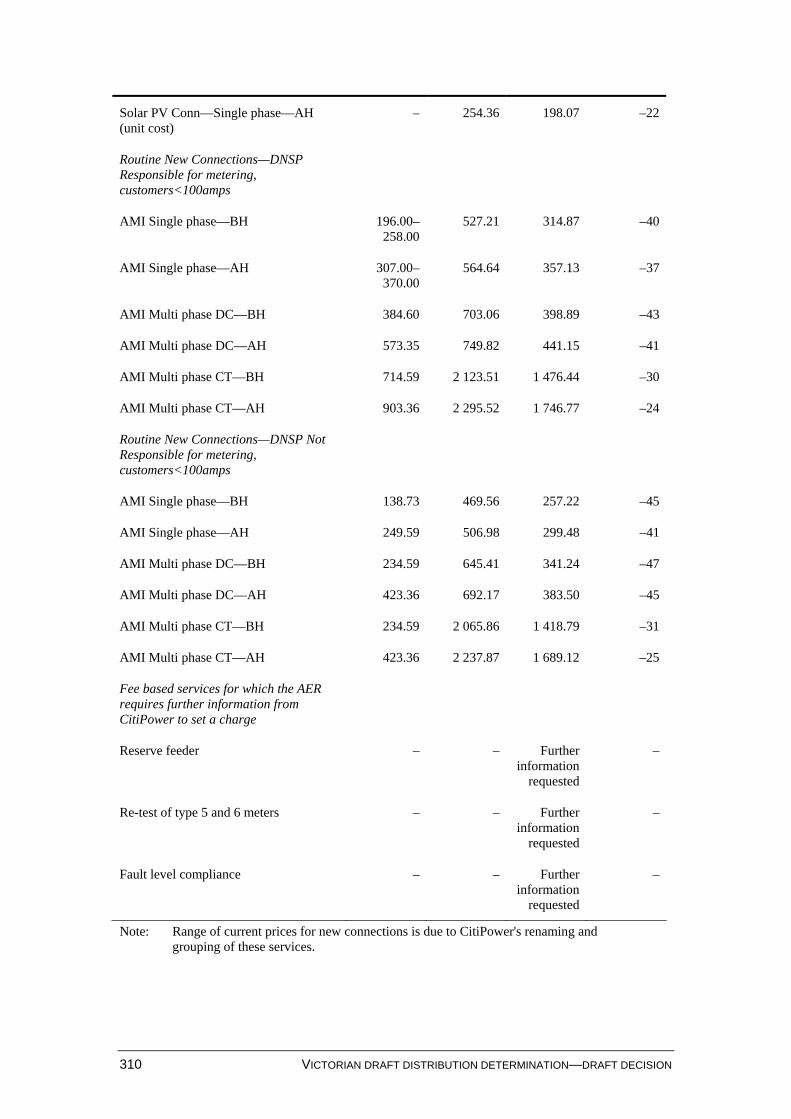
310 VICTORIAN DRAFT DISTRIBUTION DETERMINATION—DRAFT DECISION
Solar PV Conn—Single phase—AH (unit cost)
– 254.36 198.07 –22
Routine New Connections—DNSP Responsible for metering, customers<100amps
AMI Single phase—BH 196.00–258.00
527.21 314.87 –40
AMI Single phase—AH 307.00–370.00
564.64 357.13 –37
AMI Multi phase DC—BH 384.60 703.06 398.89 –43
AMI Multi phase DC—AH 573.35 749.82 441.15 –41
AMI Multi phase CT—BH 714.59 2 123.51 1 476.44 –30
AMI Multi phase CT—AH 903.36 2 295.52 1 746.77 –24
Routine New Connections—DNSP Not Responsible for metering, customers<100amps
AMI Single phase—BH 138.73 469.56 257.22 –45
AMI Single phase—AH 249.59 506.98 299.48 –41
AMI Multi phase DC—BH 234.59 645.41 341.24 –47
AMI Multi phase DC—AH 423.36 692.17 383.50 –45
AMI Multi phase CT—BH 234.59 2 065.86 1 418.79 –31
AMI Multi phase CT—AH 423.36 2 237.87 1 689.12 –25
Fee based services for which the AER requires further information from CitiPower to set a charge
Reserve feeder – – Further information
requested
–
Re-test of type 5 and 6 meters – – Further information
requested
–
Fault level compliance – – Further information
requested
–
Note: Range of current prices for new connections is due to CitiPower's renaming and grouping of these services.
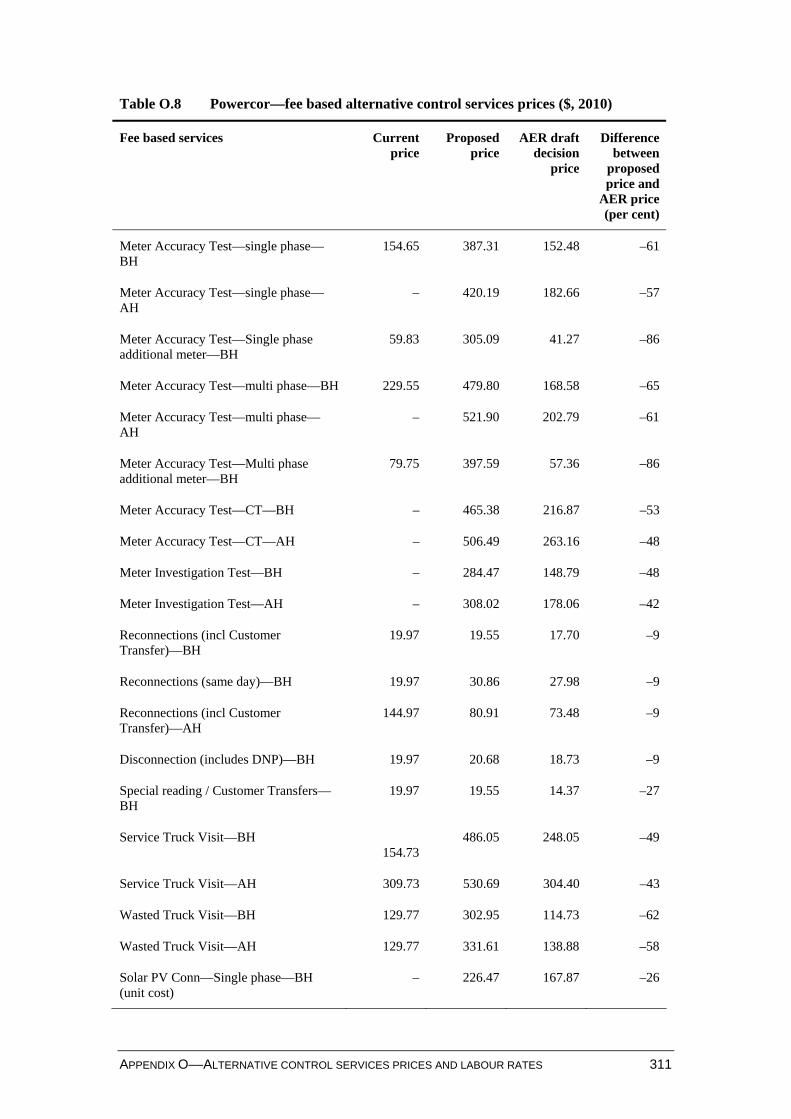
APPENDIX O––ALTERNATIVE CONTROL SERVICES PRICES AND LABOUR RATES 311
Table O.8 Powercor—fee based alternative control services prices ($, 2010)
Fee based services Current price
Proposed price
AER draft decision
price
Difference between
proposed price and
AER price (per cent)
Meter Accuracy Test—single phase—BH
154.65 387.31 152.48 –61
Meter Accuracy Test—single phase—AH
– 420.19 182.66 –57
Meter Accuracy Test—Single phase additional meter—BH
59.83 305.09 41.27 –86
Meter Accuracy Test—multi phase—BH 229.55 479.80 168.58 –65
Meter Accuracy Test—multi phase—AH
– 521.90 202.79 –61
Meter Accuracy Test—Multi phase additional meter—BH
79.75 397.59 57.36 –86
Meter Accuracy Test—CT—BH – 465.38 216.87 –53
Meter Accuracy Test—CT—AH – 506.49 263.16 –48
Meter Investigation Test—BH – 284.47 148.79 –48
Meter Investigation Test—AH – 308.02 178.06 –42
Reconnections (incl Customer Transfer)—BH
19.97 19.55 17.70 –9
Reconnections (same day)—BH 19.97 30.86 27.98 –9
Reconnections (incl Customer Transfer)—AH
144.97 80.91 73.48 –9
Disconnection (includes DNP)—BH 19.97 20.68 18.73 –9
Special reading / Customer Transfers—BH
19.97 19.55 14.37 –27
Service Truck Visit—BH 154.73
486.05 248.05 –49
Service Truck Visit—AH 309.73 530.69 304.40 –43
Wasted Truck Visit—BH 129.77 302.95 114.73 –62
Wasted Truck Visit—AH 129.77 331.61 138.88 –58
Solar PV Conn—Single phase—BH (unit cost)
– 226.47 167.87 –26
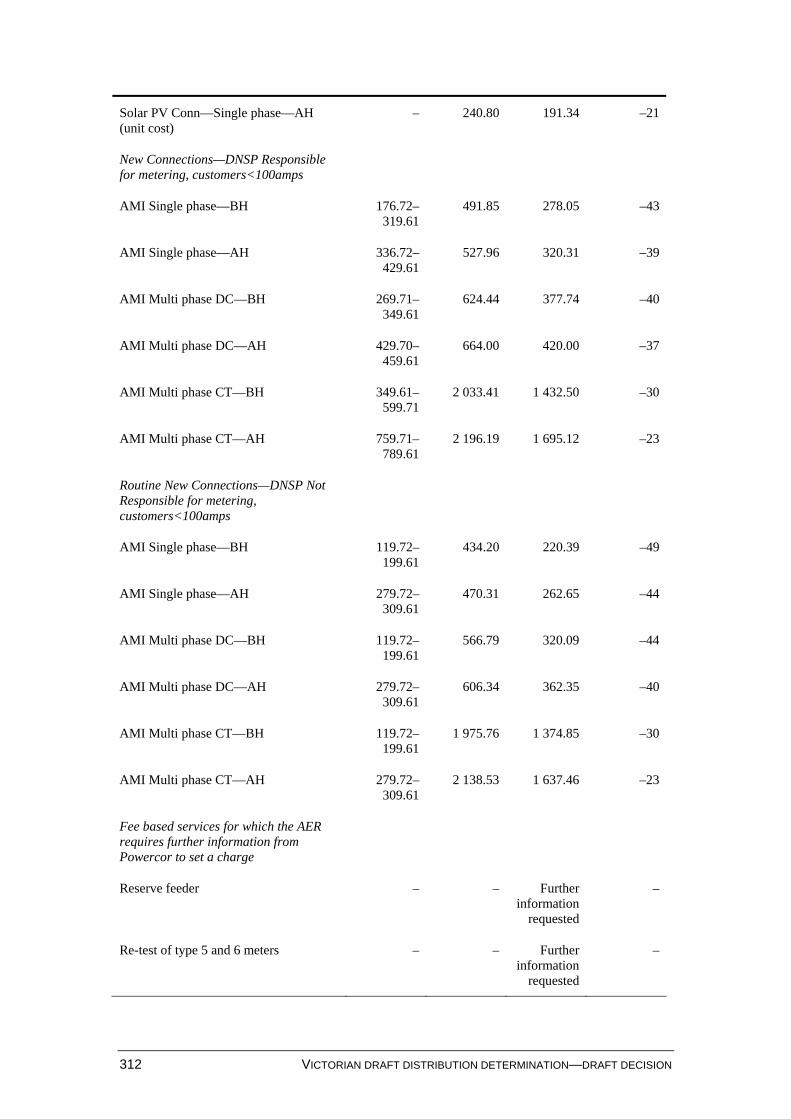
312 VICTORIAN DRAFT DISTRIBUTION DETERMINATION—DRAFT DECISION
Solar PV Conn—Single phase—AH (unit cost)
– 240.80 191.34 –21
New Connections—DNSP Responsible for metering, customers<100amps
AMI Single phase—BH 176.72– 319.61
491.85 278.05 –43
AMI Single phase—AH 336.72– 429.61
527.96 320.31 –39
AMI Multi phase DC—BH 269.71– 349.61
624.44 377.74 –40
AMI Multi phase DC—AH 429.70– 459.61
664.00 420.00 –37
AMI Multi phase CT—BH 349.61– 599.71
2 033.41 1 432.50 –30
AMI Multi phase CT—AH 759.71– 789.61
2 196.19 1 695.12 –23
Routine New Connections—DNSP Not Responsible for metering, customers<100amps
AMI Single phase—BH 119.72–199.61
434.20 220.39 –49
AMI Single phase—AH 279.72–309.61
470.31 262.65 –44
AMI Multi phase DC—BH 119.72–199.61
566.79 320.09 –44
AMI Multi phase DC—AH 279.72–309.61
606.34 362.35 –40
AMI Multi phase CT—BH 119.72–199.61
1 975.76 1 374.85 –30
AMI Multi phase CT—AH 279.72–309.61
2 138.53 1 637.46 –23
Fee based services for which the AER requires further information from Powercor to set a charge
Reserve feeder – – Further information
requested
–
Re-test of type 5 and 6 meters – – Further information
requested
–
APPENDIX O––ALTERNATIVE CONTROL SERVICES PRICES AND LABOUR RATES 313
Note: Range of current prices for new connections is due to Powercor's renaming and grouping of these services.
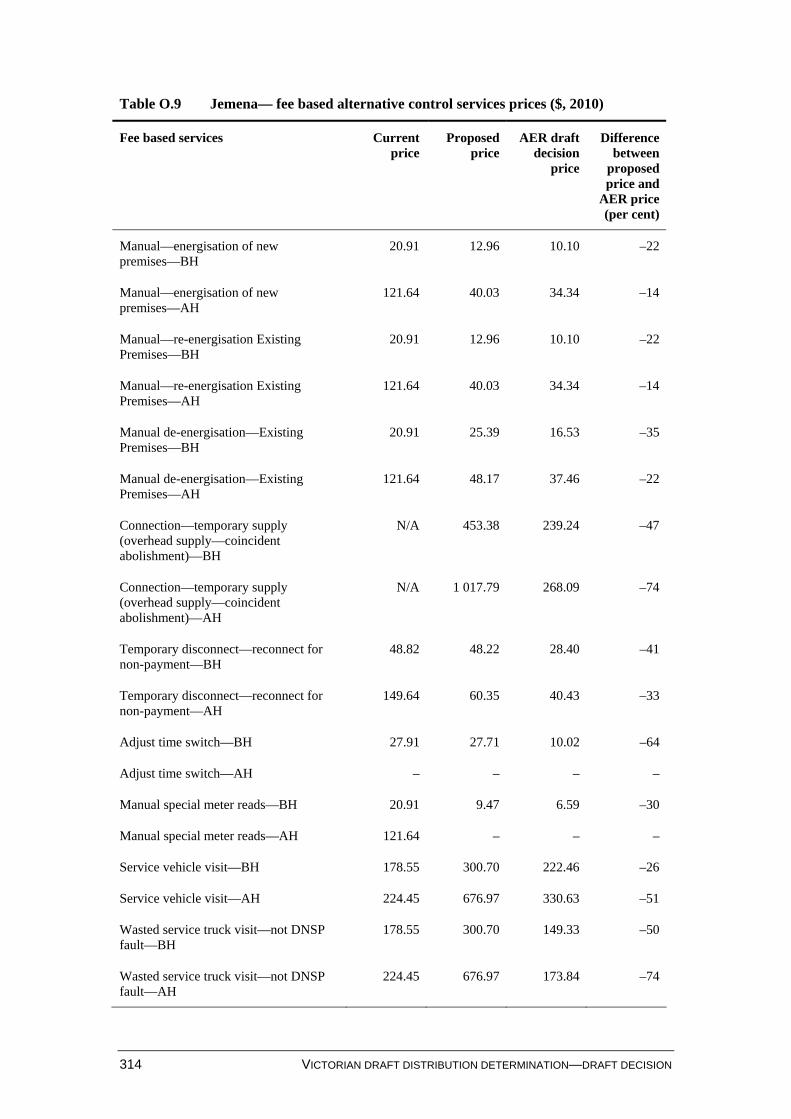
314 VICTORIAN DRAFT DISTRIBUTION DETERMINATION—DRAFT DECISION
Table O.9 Jemena— fee based alternative control services prices ($, 2010)
Fee based services Current price
Proposed price
AER draft decision
price
Difference between
proposed price and
AER price (per cent)
Manual—energisation of new premises—BH
20.91 12.96 10.10 –22
Manual—energisation of new premises—AH
121.64 40.03 34.34 –14
Manual—re-energisation Existing Premises—BH
20.91 12.96 10.10 –22
Manual—re-energisation Existing Premises—AH
121.64 40.03 34.34 –14
Manual de-energisation—Existing Premises—BH
20.91 25.39 16.53 –35
Manual de-energisation—Existing Premises—AH
121.64 48.17 37.46 –22
Connection—temporary supply (overhead supply—coincident abolishment)—BH
N/A 453.38 239.24 –47
Connection—temporary supply (overhead supply—coincident abolishment)—AH
N/A 1 017.79 268.09 –74
Temporary disconnect—reconnect for non-payment—BH
48.82 48.22 28.40 –41
Temporary disconnect—reconnect for non-payment—AH
149.64 60.35 40.43 –33
Adjust time switch—BH 27.91 27.71 10.02 –64
Adjust time switch—AH – – – –
Manual special meter reads—BH 20.91 9.47 6.59 –30
Manual special meter reads—AH 121.64 – – –
Service vehicle visit—BH 178.55 300.70 222.46 –26
Service vehicle visit—AH 224.45 676.97 330.63 –51
Wasted service truck visit—not DNSP fault—BH
178.55 300.70 149.33 –50
Wasted service truck visit—not DNSP fault—AH
224.45 676.97 173.84 –74
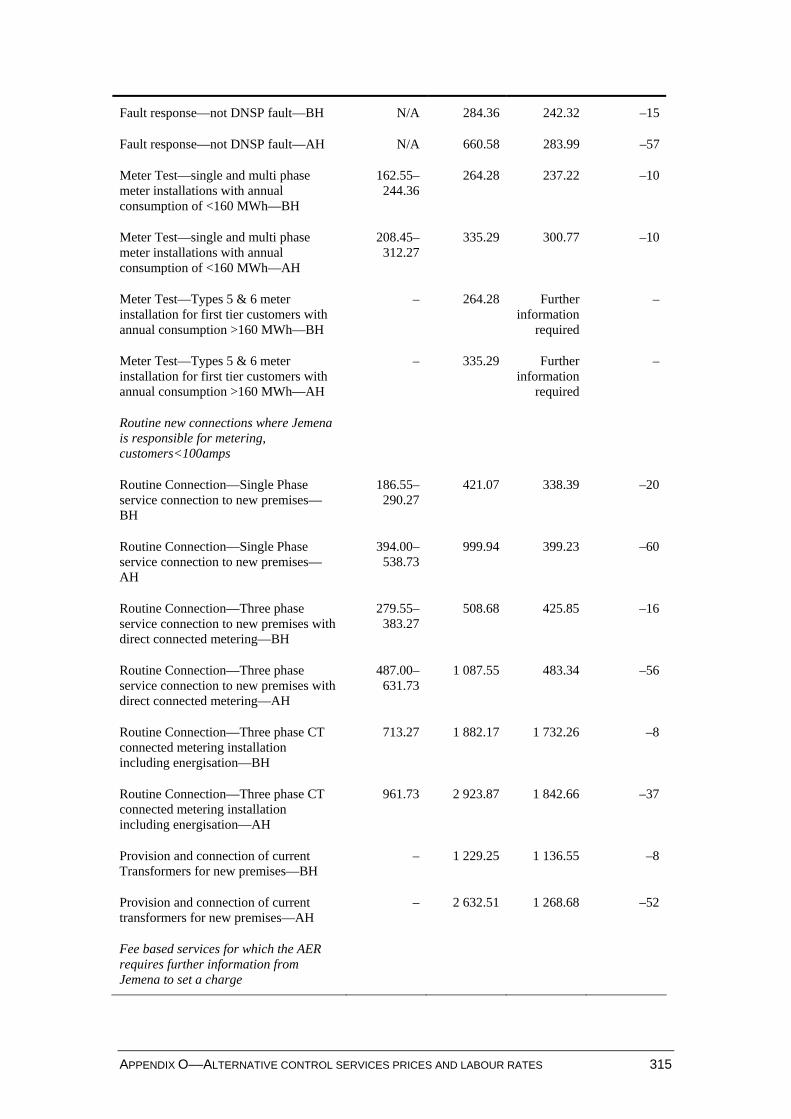
APPENDIX O––ALTERNATIVE CONTROL SERVICES PRICES AND LABOUR RATES 315
Fault response—not DNSP fault—BH N/A 284.36 242.32 –15
Fault response—not DNSP fault—AH N/A 660.58 283.99 –57
Meter Test—single and multi phase meter installations with annual consumption of <160 MWh—BH
162.55– 244.36
264.28 237.22 –10
Meter Test—single and multi phase meter installations with annual consumption of <160 MWh—AH
208.45– 312.27
335.29 300.77 –10
Meter Test—Types 5 & 6 meter installation for first tier customers with annual consumption >160 MWh—BH
– 264.28 Further information
required
–
Meter Test—Types 5 & 6 meter installation for first tier customers with annual consumption >160 MWh—AH
– 335.29 Further information
required
–
Routine new connections where Jemena is responsible for metering, customers<100amps
Routine Connection—Single Phase service connection to new premises—BH
186.55–290.27
421.07 338.39 –20
Routine Connection—Single Phase service connection to new premises—AH
394.00–538.73
999.94 399.23 –60
Routine Connection—Three phase service connection to new premises with direct connected metering—BH
279.55–383.27
508.68 425.85 –16
Routine Connection—Three phase service connection to new premises with direct connected metering—AH
487.00–631.73
1 087.55 483.34 –56
Routine Connection—Three phase CT connected metering installation including energisation—BH
713.27 1 882.17 1 732.26 –8
Routine Connection—Three phase CT connected metering installation including energisation—AH
961.73 2 923.87 1 842.66 –37
Provision and connection of current Transformers for new premises—BH
– 1 229.25 1 136.55 –8
Provision and connection of current transformers for new premises—AH
– 2 632.51 1 268.68 –52
Fee based services for which the AER requires further information from Jemena to set a charge
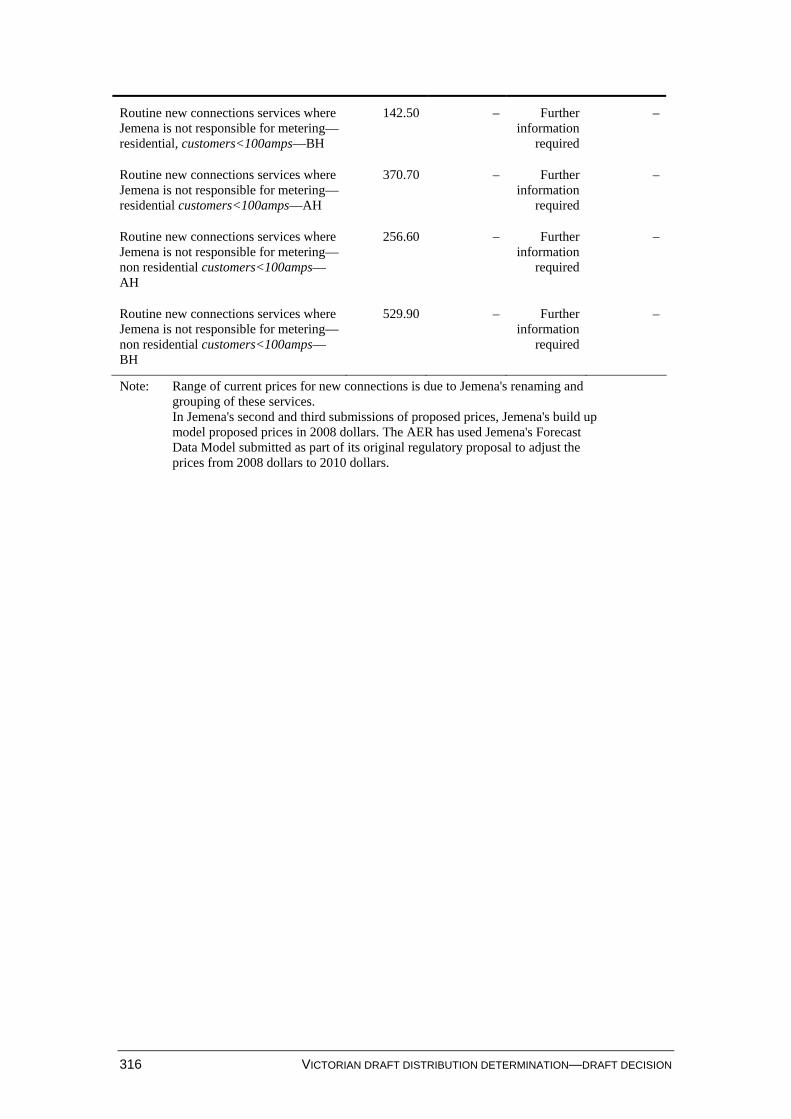
316 VICTORIAN DRAFT DISTRIBUTION DETERMINATION—DRAFT DECISION
Routine new connections services where Jemena is not responsible for metering—residential, customers<100amps—BH
142.50 – Further information
required
–
Routine new connections services where Jemena is not responsible for metering—residential customers<100amps—AH
370.70 – Further information
required
–
Routine new connections services where Jemena is not responsible for metering—non residential customers<100amps—AH
256.60 – Further information
required
–
Routine new connections services where Jemena is not responsible for metering—non residential customers<100amps—BH
529.90 – Further information
required
–
Note: Range of current prices for new connections is due to Jemena's renaming and grouping of these services.
In Jemena's second and third submissions of proposed prices, Jemena's build up model proposed prices in 2008 dollars. The AER has used Jemena's Forecast Data Model submitted as part of its original regulatory proposal to adjust the prices from 2008 dollars to 2010 dollars.
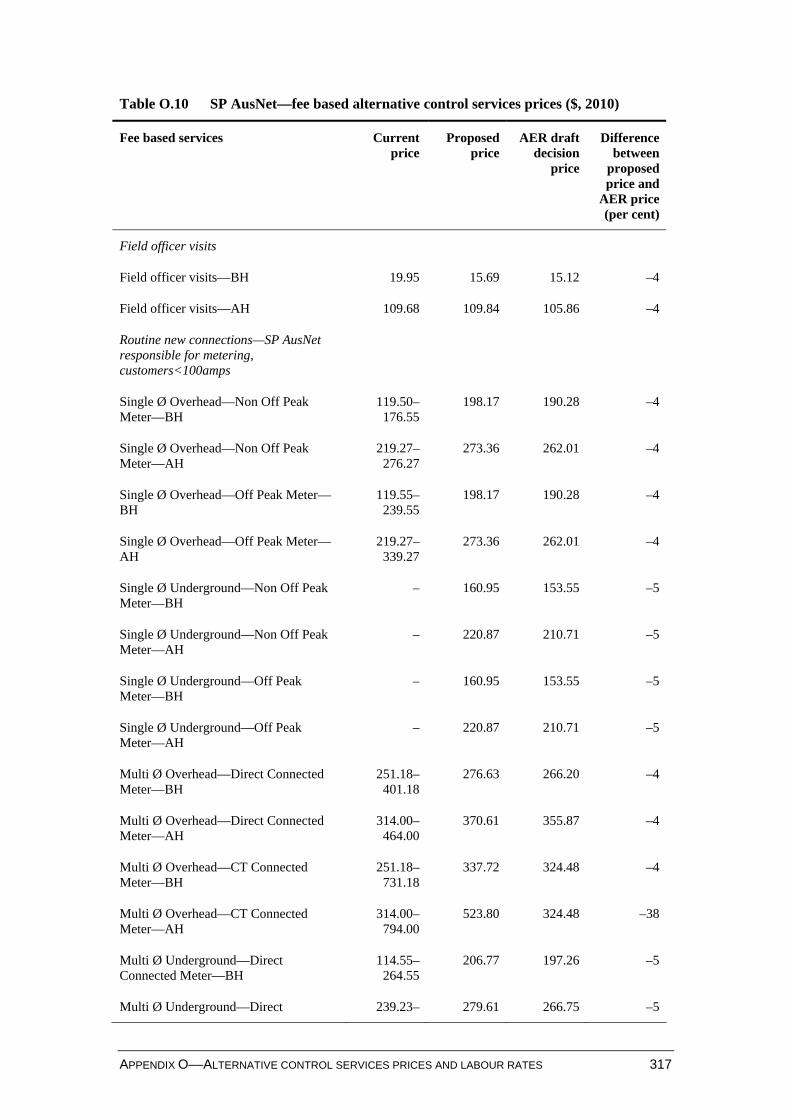
APPENDIX O––ALTERNATIVE CONTROL SERVICES PRICES AND LABOUR RATES 317
Table O.10 SP AusNet—fee based alternative control services prices ($, 2010)
Fee based services Current price
Proposed price
AER draft decision
price
Difference between
proposed price and
AER price (per cent)
Field officer visits
Field officer visits—BH 19.95 15.69 15.12 –4
Field officer visits—AH 109.68 109.84 105.86 –4
Routine new connections—SP AusNet responsible for metering, customers<100amps
Single Ø Overhead—Non Off Peak Meter—BH
119.50–176.55
198.17 190.28 –4
Single Ø Overhead—Non Off Peak Meter—AH
219.27–276.27
273.36 262.01 –4
Single Ø Overhead—Off Peak Meter—BH
119.55–239.55
198.17 190.28 –4
Single Ø Overhead—Off Peak Meter—AH
219.27–339.27
273.36 262.01 –4
Single Ø Underground—Non Off Peak Meter—BH
– 160.95 153.55 –5
Single Ø Underground—Non Off Peak Meter—AH
– 220.87 210.71 –5
Single Ø Underground—Off Peak Meter—BH
– 160.95 153.55 –5
Single Ø Underground—Off Peak Meter—AH
– 220.87 210.71 –5
Multi Ø Overhead—Direct Connected Meter—BH
251.18–401.18
276.63 266.20 –4
Multi Ø Overhead—Direct Connected Meter—AH
314.00–464.00
370.61 355.87 –4
Multi Ø Overhead—CT Connected Meter—BH
251.18–731.18
337.72 324.48 –4
Multi Ø Overhead—CT Connected Meter—AH
314.00–794.00
523.80 324.48 –38
Multi Ø Underground—Direct Connected Meter—BH
114.55–264.55
206.77 197.26 –5
Multi Ø Underground—Direct 239.23– 279.61 266.75 –5
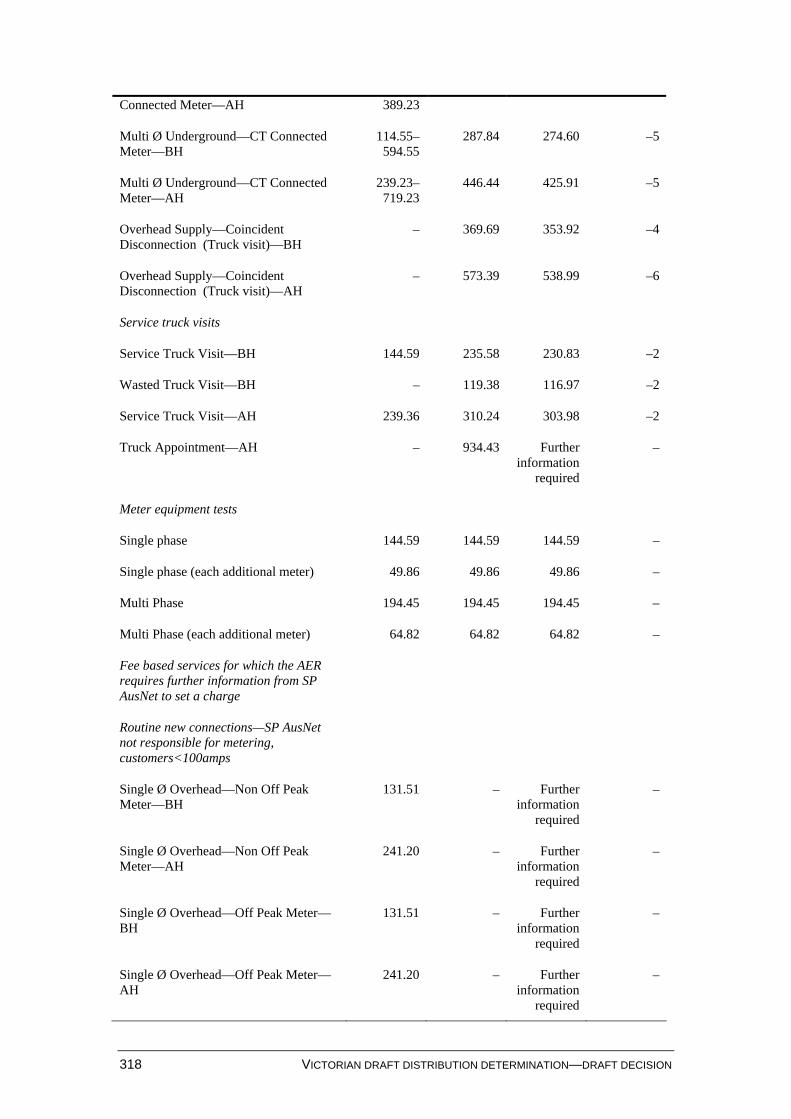
318 VICTORIAN DRAFT DISTRIBUTION DETERMINATION—DRAFT DECISION
Connected Meter—AH 389.23
Multi Ø Underground—CT Connected Meter—BH
114.55–594.55
287.84 274.60 –5
Multi Ø Underground—CT Connected Meter—AH
239.23–719.23
446.44 425.91 –5
Overhead Supply—Coincident Disconnection (Truck visit)—BH
– 369.69 353.92 –4
Overhead Supply—Coincident Disconnection (Truck visit)—AH
– 573.39 538.99 –6
Service truck visits
Service Truck Visit—BH 144.59 235.58 230.83 –2
Wasted Truck Visit—BH – 119.38 116.97 –2
Service Truck Visit—AH 239.36 310.24 303.98 –2
Truck Appointment—AH – 934.43 Further information
required
–
Meter equipment tests
Single phase 144.59 144.59 144.59 –
Single phase (each additional meter) 49.86 49.86 49.86 –
Multi Phase 194.45 194.45 194.45 –
Multi Phase (each additional meter) 64.82 64.82 64.82 –
Fee based services for which the AER requires further information from SP AusNet to set a charge
Routine new connections—SP AusNet not responsible for metering, customers<100amps
Single Ø Overhead—Non Off Peak Meter—BH
131.51 – Further information
required
–
Single Ø Overhead—Non Off Peak Meter—AH
241.20 – Further information
required
–
Single Ø Overhead—Off Peak Meter—BH
131.51 – Further information
required
–
Single Ø Overhead—Off Peak Meter—AH
241.20 – Further information
required
–
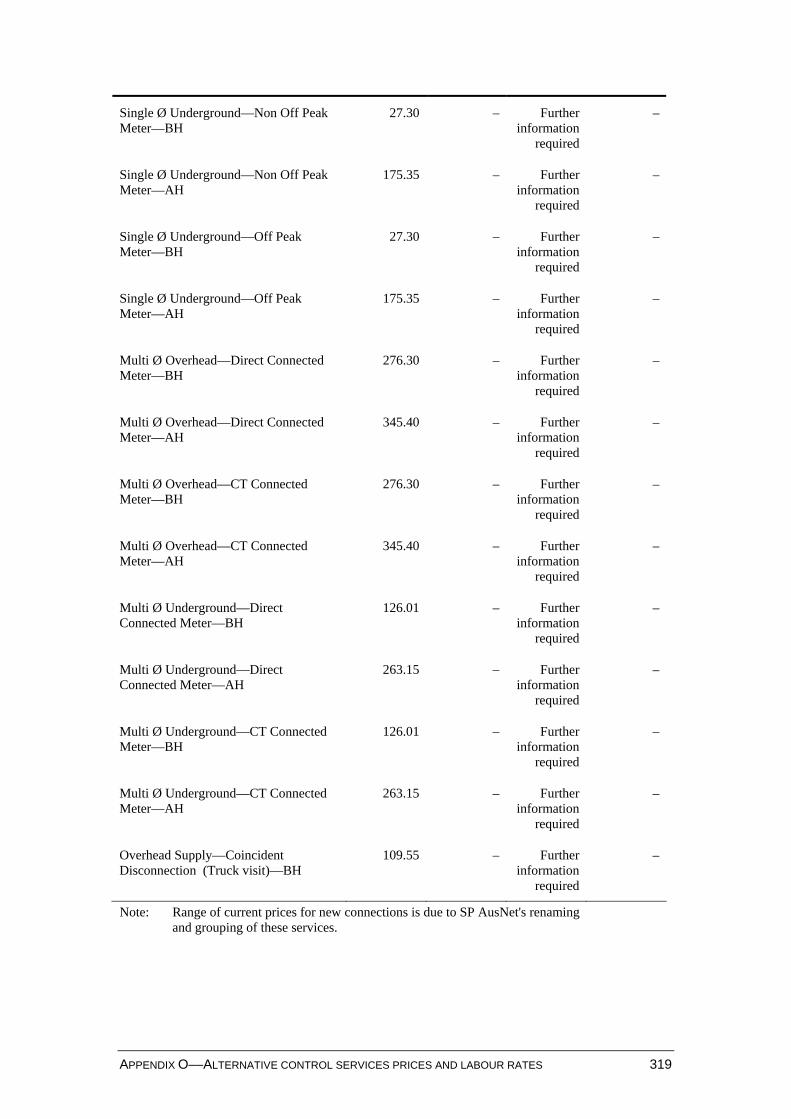
APPENDIX O––ALTERNATIVE CONTROL SERVICES PRICES AND LABOUR RATES 319
Single Ø Underground—Non Off Peak Meter—BH
27.30 – Further information
required
–
Single Ø Underground—Non Off Peak Meter—AH
175.35 – Further information
required
–
Single Ø Underground—Off Peak Meter—BH
27.30 – Further information
required
–
Single Ø Underground—Off Peak Meter—AH
175.35 – Further information
required
–
Multi Ø Overhead—Direct Connected Meter—BH
276.30 – Further information
required
–
Multi Ø Overhead—Direct Connected Meter—AH
345.40 – Further information
required
–
Multi Ø Overhead—CT Connected Meter—BH
276.30 – Further information
required
–
Multi Ø Overhead—CT Connected Meter—AH
345.40 – Further information
required
–
Multi Ø Underground—Direct Connected Meter—BH
126.01 – Further information
required
–
Multi Ø Underground—Direct Connected Meter—AH
263.15 – Further information
required
–
Multi Ø Underground—CT Connected Meter—BH
126.01 – Further information
required
–
Multi Ø Underground—CT Connected Meter—AH
263.15 – Further information
required
–
Overhead Supply—Coincident Disconnection (Truck visit)—BH
109.55 – Further information
required
–
Note: Range of current prices for new connections is due to SP AusNet's renaming and grouping of these services.
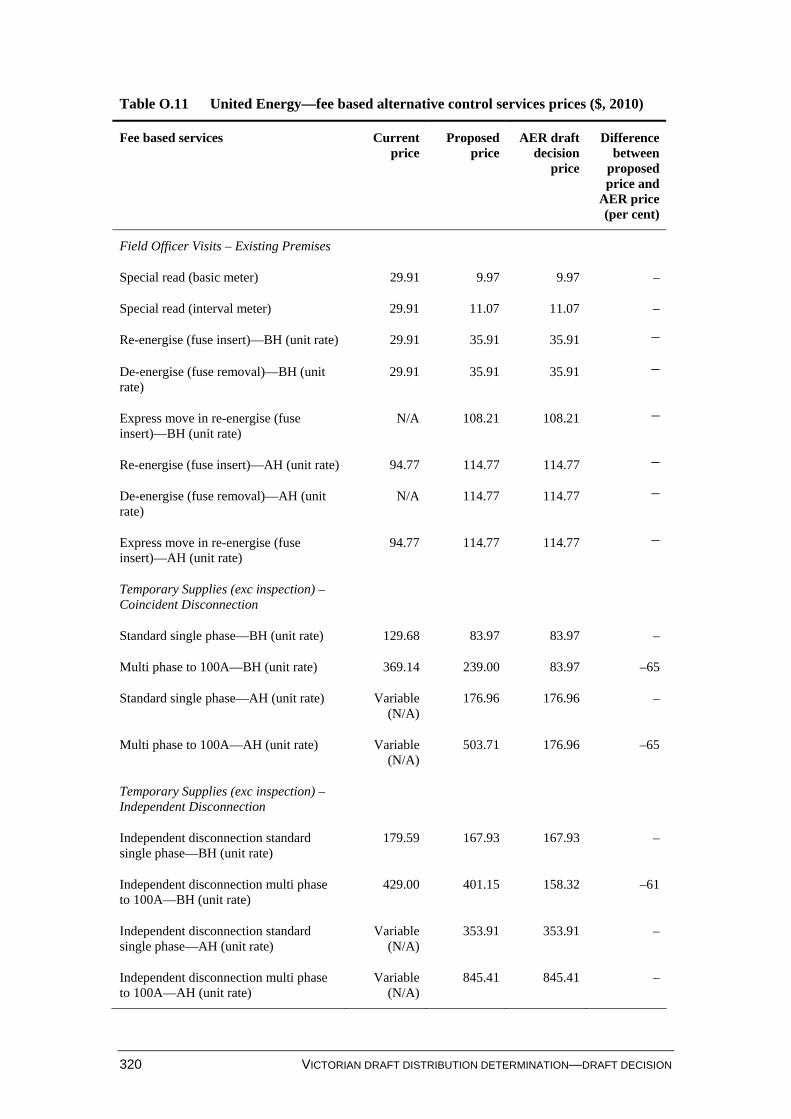
320 VICTORIAN DRAFT DISTRIBUTION DETERMINATION—DRAFT DECISION
Table O.11 United Energy—fee based alternative control services prices ($, 2010)
Fee based services Current price
Proposed price
AER draft decision
price
Difference between
proposed price and
AER price (per cent)
Field Officer Visits – Existing Premises
Special read (basic meter) 29.91 9.97 9.97 –
Special read (interval meter) 29.91 11.07 11.07 –
Re-energise (fuse insert)—BH (unit rate) 29.91 35.91 35.91 –
De-energise (fuse removal)—BH (unit rate)
29.91 35.91 35.91 –
Express move in re-energise (fuse insert)—BH (unit rate)
N/A 108.21 108.21 –
Re-energise (fuse insert)—AH (unit rate) 94.77 114.77 114.77 –
De-energise (fuse removal)—AH (unit rate)
N/A 114.77 114.77 –
Express move in re-energise (fuse insert)—AH (unit rate)
94.77 114.77 114.77 –
Temporary Supplies (exc inspection) – Coincident Disconnection
Standard single phase—BH (unit rate) 129.68 83.97 83.97 –
Multi phase to 100A—BH (unit rate) 369.14 239.00 83.97 –65
Standard single phase—AH (unit rate) Variable (N/A)
176.96 176.96 –
Multi phase to 100A—AH (unit rate) Variable (N/A)
503.71 176.96 –65
Temporary Supplies (exc inspection) – Independent Disconnection
Independent disconnection standard single phase—BH (unit rate)
179.59 167.93 167.93 –
Independent disconnection multi phase to 100A—BH (unit rate)
429.00 401.15 158.32 –61
Independent disconnection standard single phase—AH (unit rate)
Variable (N/A)
353.91 353.91 –
Independent disconnection multi phase to 100A—AH (unit rate)
Variable (N/A)
845.41 845.41 –
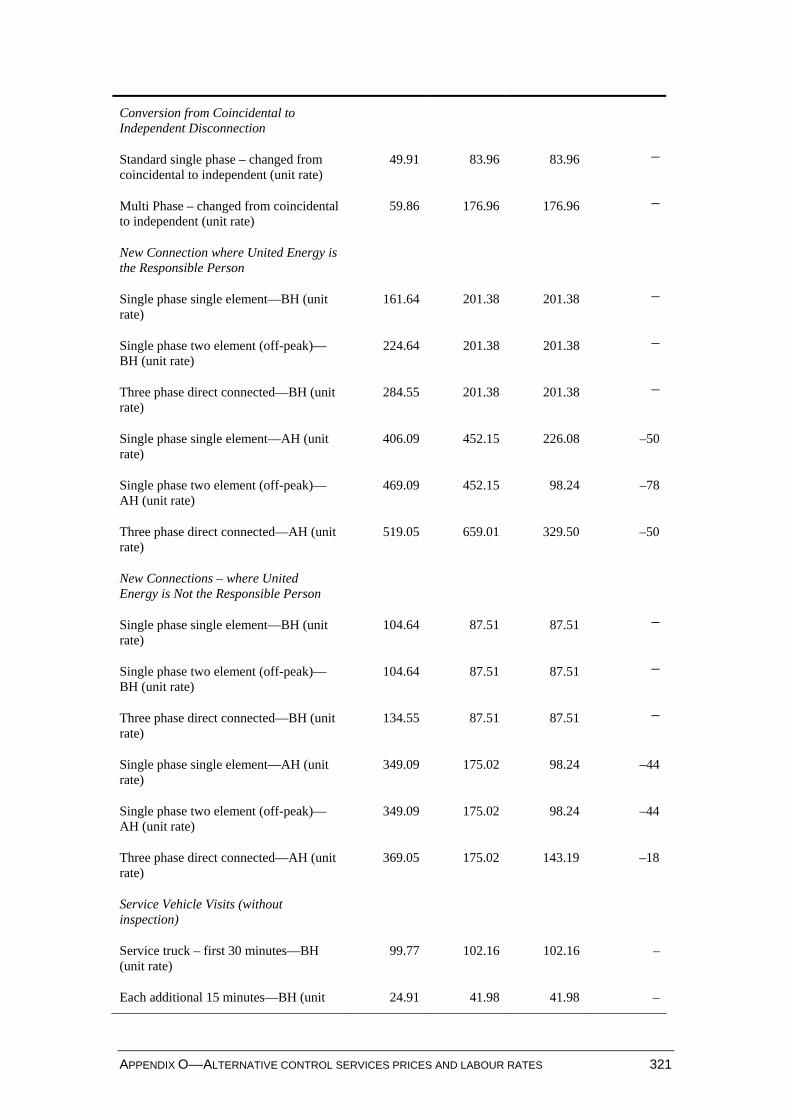
APPENDIX O––ALTERNATIVE CONTROL SERVICES PRICES AND LABOUR RATES 321
Conversion from Coincidental to Independent Disconnection
Standard single phase – changed from coincidental to independent (unit rate)
49.91 83.96 83.96 –
Multi Phase – changed from coincidental to independent (unit rate)
59.86 176.96 176.96 –
New Connection where United Energy is the Responsible Person
Single phase single element—BH (unit rate)
161.64 201.38 201.38 –
Single phase two element (off-peak)—BH (unit rate)
224.64 201.38 201.38 –
Three phase direct connected—BH (unit rate)
284.55 201.38 201.38 –
Single phase single element—AH (unit rate)
406.09 452.15 226.08 –50
Single phase two element (off-peak)—AH (unit rate)
469.09 452.15 98.24 –78
Three phase direct connected—AH (unit rate)
519.05 659.01 329.50 –50
New Connections – where United Energy is Not the Responsible Person
Single phase single element—BH (unit rate)
104.64 87.51 87.51 –
Single phase two element (off-peak)—BH (unit rate)
104.64 87.51 87.51 –
Three phase direct connected—BH (unit rate)
134.55 87.51 87.51 –
Single phase single element—AH (unit rate)
349.09 175.02 98.24 –44
Single phase two element (off-peak)—AH (unit rate)
349.09 175.02 98.24 –44
Three phase direct connected—AH (unit rate)
369.05 175.02 143.19 –18
Service Vehicle Visits (without inspection)
Service truck – first 30 minutes—BH (unit rate)
99.77 102.16 102.16 –
Each additional 15 minutes—BH (unit 24.91 41.98 41.98 –
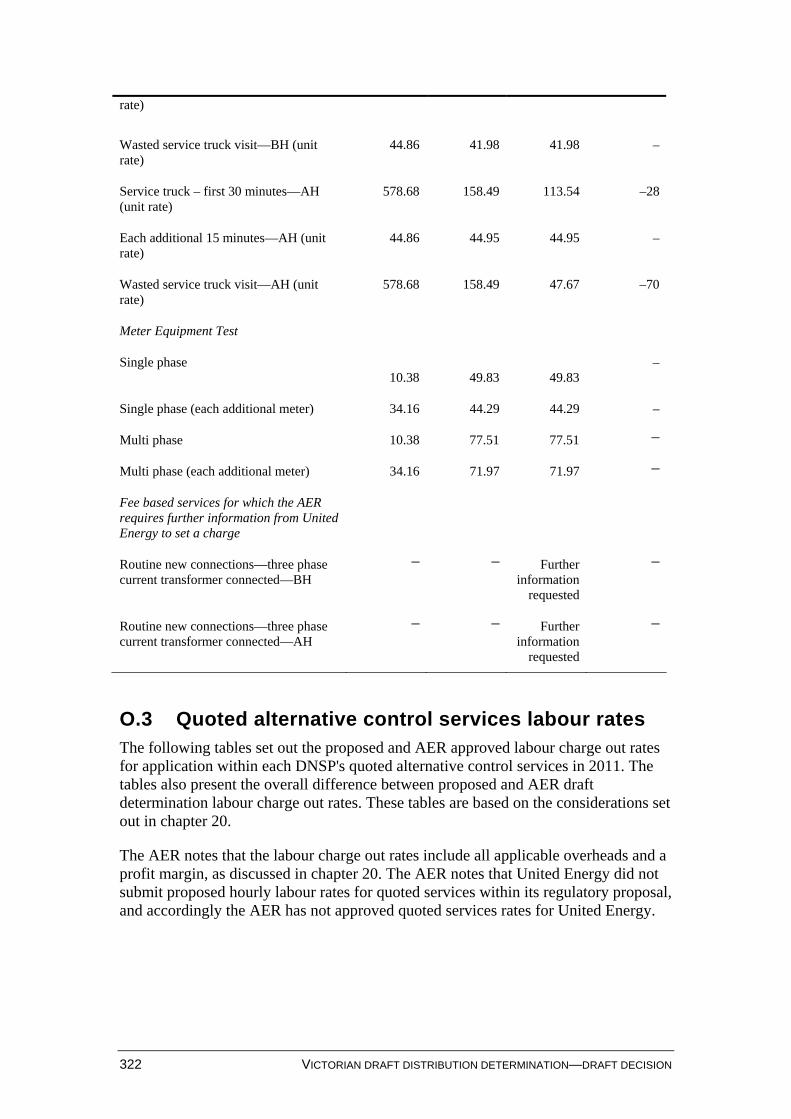
322 VICTORIAN DRAFT DISTRIBUTION DETERMINATION—DRAFT DECISION
rate)
Wasted service truck visit—BH (unit rate)
44.86 41.98 41.98 –
Service truck – first 30 minutes—AH (unit rate)
578.68 158.49 113.54 –28
Each additional 15 minutes—AH (unit rate)
44.86 44.95 44.95 –
Wasted service truck visit—AH (unit rate)
578.68 158.49 47.67 –70
Meter Equipment Test
Single phase 10.38
49.83
49.83
–
Single phase (each additional meter) 34.16 44.29 44.29 –
Multi phase 10.38 77.51 77.51 –
Multi phase (each additional meter) 34.16 71.97 71.97 –
Fee based services for which the AER requires further information from United Energy to set a charge
Routine new connections—three phase current transformer connected—BH
– – Further information
requested
–
Routine new connections—three phase current transformer connected—AH
– – Further information
requested
–
O.3 Quoted alternative control services labour rates The following tables set out the proposed and AER approved labour charge out rates for application within each DNSP's quoted alternative control services in 2011. The tables also present the overall difference between proposed and AER draft determination labour charge out rates. These tables are based on the considerations set out in chapter 20.
The AER notes that the labour charge out rates include all applicable overheads and a profit margin, as discussed in chapter 20. The AER notes that United Energy did not submit proposed hourly labour rates for quoted services within its regulatory proposal, and accordingly the AER has not approved quoted services rates for United Energy.
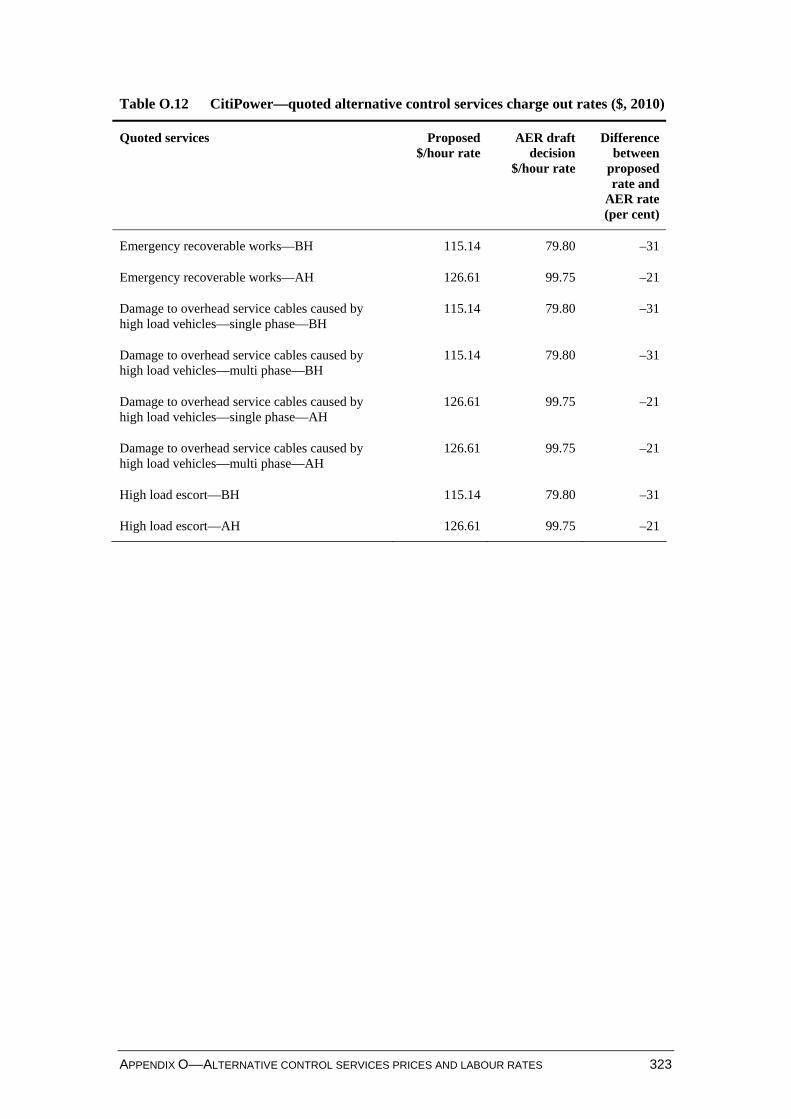
APPENDIX O––ALTERNATIVE CONTROL SERVICES PRICES AND LABOUR RATES 323
Table O.12 CitiPower—quoted alternative control services charge out rates ($, 2010)
Quoted services Proposed $/hour rate
AER draft decision
$/hour rate
Difference between
proposed rate and
AER rate (per cent)
Emergency recoverable works—BH 115.14 79.80 –31
Emergency recoverable works—AH 126.61 99.75 –21
Damage to overhead service cables caused by high load vehicles—single phase—BH
115.14 79.80 –31
Damage to overhead service cables caused by high load vehicles—multi phase—BH
115.14 79.80 –31
Damage to overhead service cables caused by high load vehicles—single phase—AH
126.61 99.75 –21
Damage to overhead service cables caused by high load vehicles—multi phase—AH
126.61 99.75 –21
High load escort—BH 115.14 79.80 –31
High load escort—AH 126.61 99.75 –21
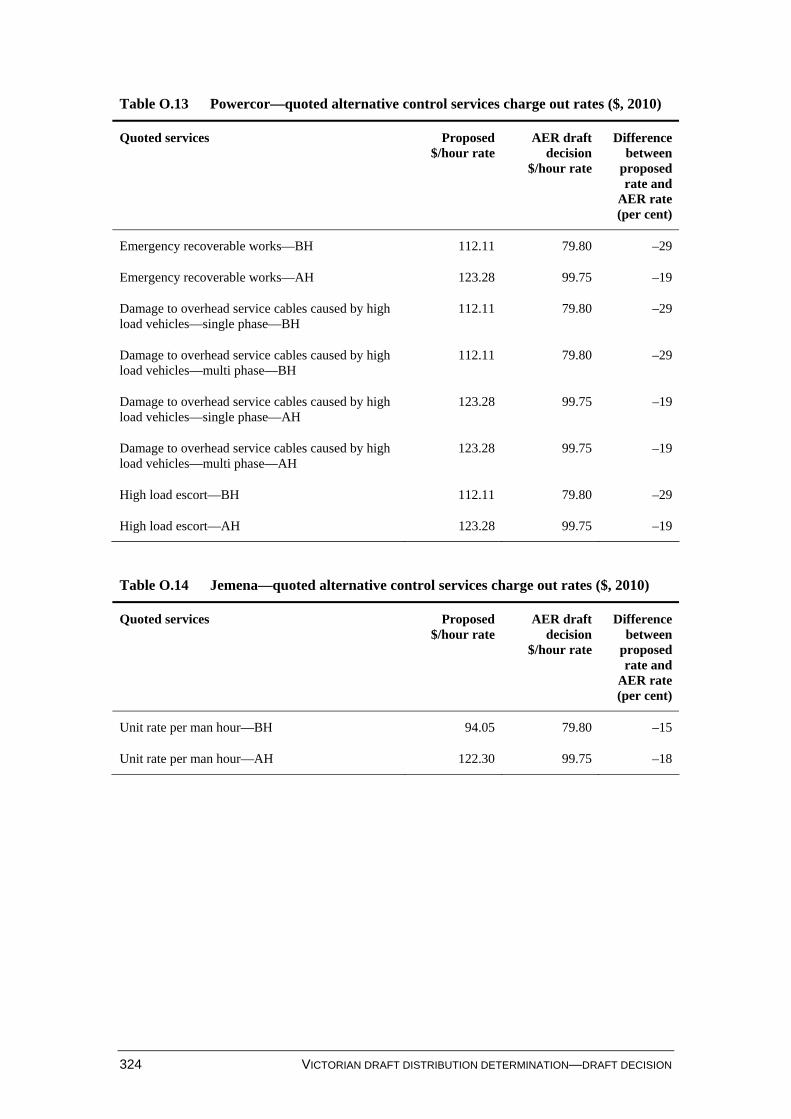
324 VICTORIAN DRAFT DISTRIBUTION DETERMINATION—DRAFT DECISION
Table O.13 Powercor—quoted alternative control services charge out rates ($, 2010)
Quoted services Proposed $/hour rate
AER draft decision
$/hour rate
Difference between
proposed rate and
AER rate (per cent)
Emergency recoverable works—BH 112.11 79.80 –29
Emergency recoverable works—AH 123.28 99.75 –19
Damage to overhead service cables caused by high load vehicles—single phase—BH
112.11 79.80 –29
Damage to overhead service cables caused by high load vehicles—multi phase—BH
112.11 79.80 –29
Damage to overhead service cables caused by high load vehicles—single phase—AH
123.28 99.75 –19
Damage to overhead service cables caused by high load vehicles—multi phase—AH
123.28 99.75 –19
High load escort—BH 112.11 79.80 –29
High load escort—AH 123.28 99.75 –19
Table O.14 Jemena—quoted alternative control services charge out rates ($, 2010)
Quoted services Proposed $/hour rate
AER draft decision
$/hour rate
Difference between
proposed rate and
AER rate (per cent)
Unit rate per man hour—BH 94.05 79.80 –15
Unit rate per man hour—AH 122.30 99.75 –18
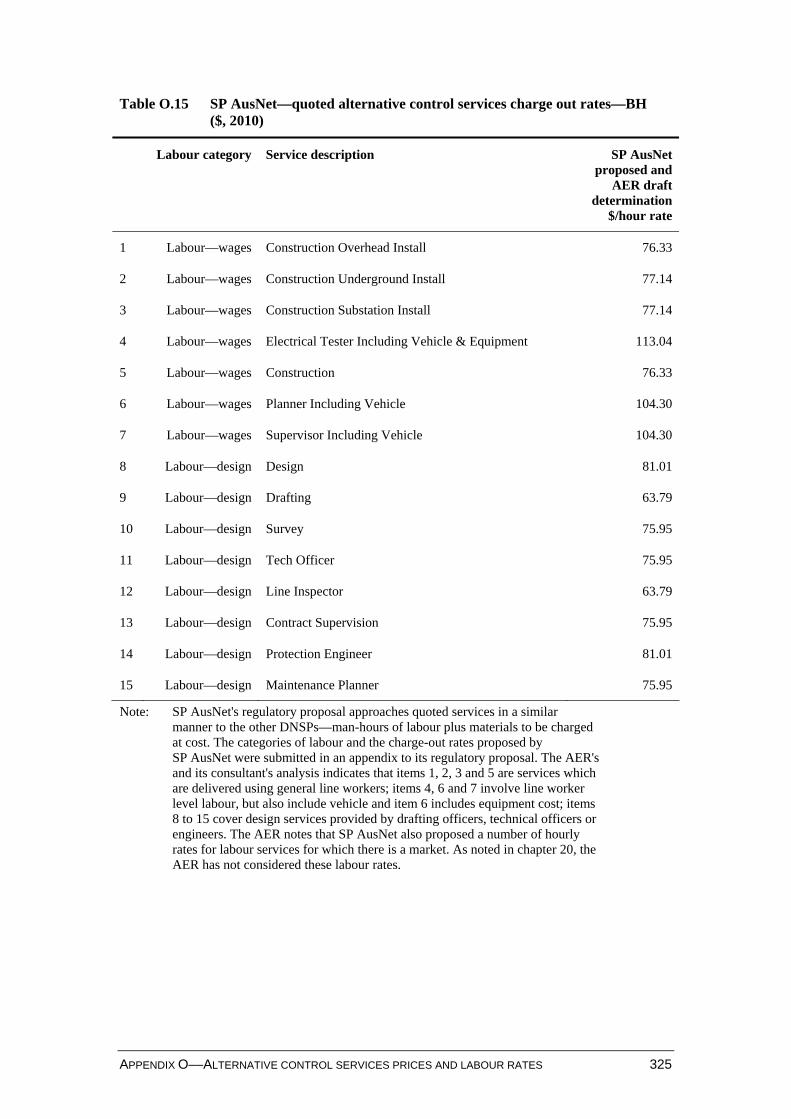
APPENDIX O––ALTERNATIVE CONTROL SERVICES PRICES AND LABOUR RATES 325
Table O.15 SP AusNet—quoted alternative control services charge out rates—BH ($, 2010)
Labour category Service description SP AusNet proposed and
AER draft determination
$/hour rate
1 Labour—wages Construction Overhead Install 76.33
2 Labour—wages Construction Underground Install 77.14
3 Labour—wages Construction Substation Install 77.14
4 Labour—wages Electrical Tester Including Vehicle & Equipment 113.04
5 Labour—wages Construction 76.33
6 Labour—wages Planner Including Vehicle 104.30
7 Labour—wages Supervisor Including Vehicle 104.30
8 Labour—design Design 81.01
9 Labour—design Drafting 63.79
10 Labour—design Survey 75.95
11 Labour—design Tech Officer 75.95
12 Labour—design Line Inspector 63.79
13 Labour—design Contract Supervision 75.95
14 Labour—design Protection Engineer 81.01
15 Labour—design Maintenance Planner 75.95
Note: SP AusNet's regulatory proposal approaches quoted services in a similar manner to the other DNSPs—man-hours of labour plus materials to be charged at cost. The categories of labour and the charge-out rates proposed by SP AusNet were submitted in an appendix to its regulatory proposal. The AER's and its consultant's analysis indicates that items 1, 2, 3 and 5 are services which are delivered using general line workers; items 4, 6 and 7 involve line worker level labour, but also include vehicle and item 6 includes equipment cost; items 8 to 15 cover design services provided by drafting officers, technical officers or engineers. The AER notes that SP AusNet also proposed a number of hourly rates for labour services for which there is a market. As noted in chapter 20, the AER has not considered these labour rates.
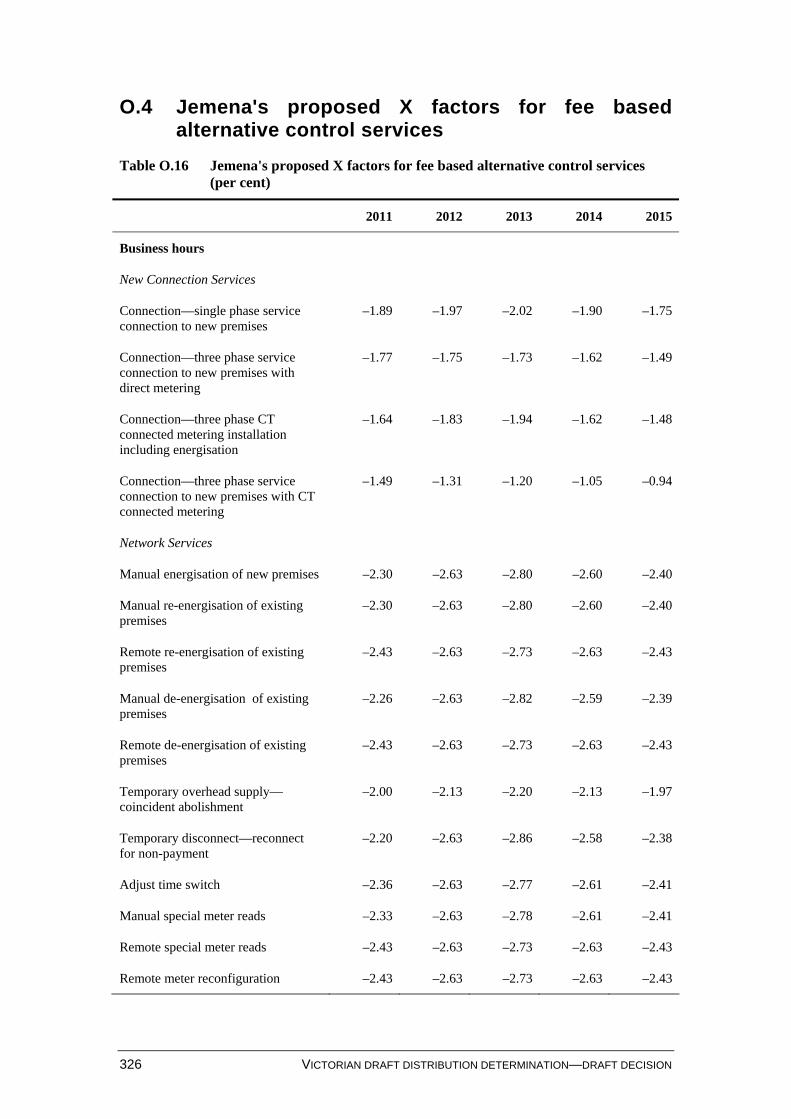
326 VICTORIAN DRAFT DISTRIBUTION DETERMINATION—DRAFT DECISION
O.4 Jemena's proposed X factors for fee based alternative control services
Table O.16 Jemena's proposed X factors for fee based alternative control services (per cent)
2011 2012 2013 2014 2015
Business hours
New Connection Services
Connection—single phase service connection to new premises
–1.89 –1.97 –2.02 –1.90 –1.75
Connection—three phase service connection to new premises with direct metering
–1.77 –1.75 –1.73 –1.62 –1.49
Connection—three phase CT connected metering installation including energisation
–1.64 –1.83 –1.94 –1.62 –1.48
Connection—three phase service connection to new premises with CT connected metering
–1.49 –1.31 –1.20 –1.05 –0.94
Network Services
Manual energisation of new premises –2.30 –2.63 –2.80 –2.60 –2.40
Manual re-energisation of existing premises
–2.30 –2.63 –2.80 –2.60 –2.40
Remote re-energisation of existing premises
–2.43 –2.63 –2.73 –2.63 –2.43
Manual de-energisation of existing premises
–2.26 –2.63 –2.82 –2.59 –2.39
Remote de-energisation of existing premises
–2.43 –2.63 –2.73 –2.63 –2.43
Temporary overhead supply— coincident abolishment
–2.00 –2.13 –2.20 –2.13 –1.97
Temporary disconnect—reconnect for non-payment
–2.20 –2.63 –2.86 –2.58 –2.38
Adjust time switch –2.36 –2.63 –2.77 –2.61 –2.41
Manual special meter reads –2.33 –2.63 –2.78 –2.61 –2.41
Remote special meter reads –2.43 –2.63 –2.73 –2.63 –2.43
Remote meter reconfiguration –2.43 –2.63 –2.73 –2.63 –2.43
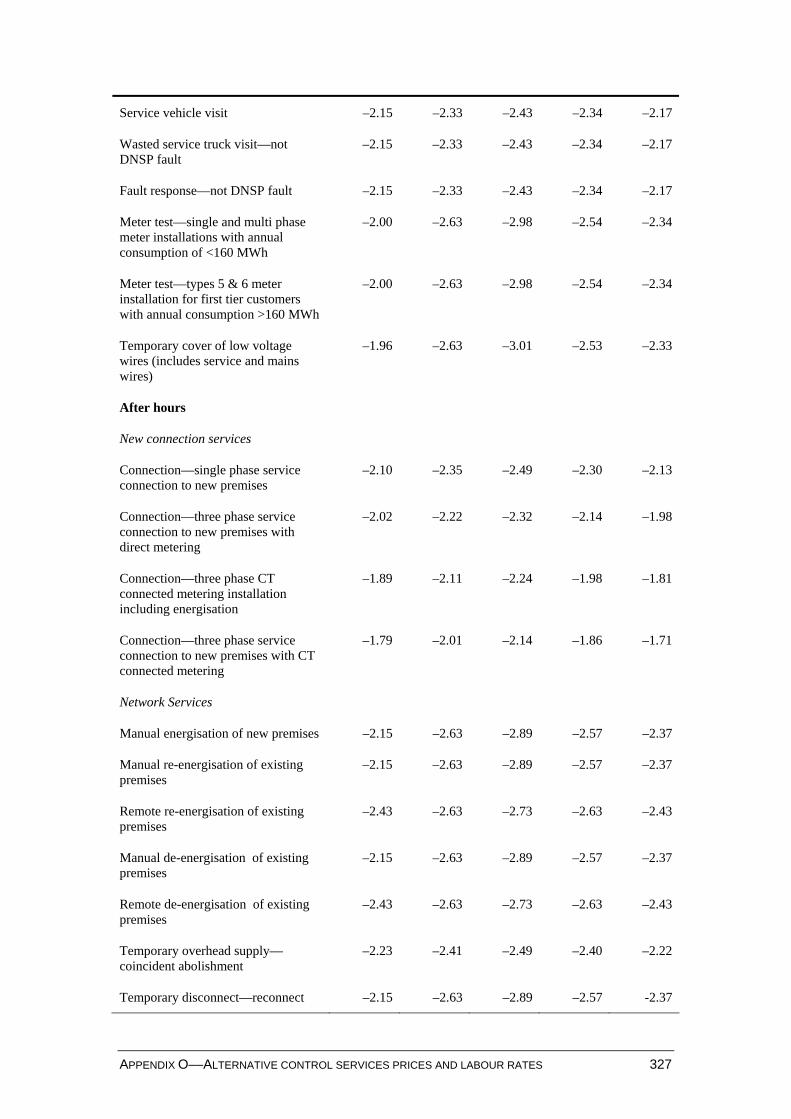
APPENDIX O––ALTERNATIVE CONTROL SERVICES PRICES AND LABOUR RATES 327
Service vehicle visit –2.15 –2.33 –2.43 –2.34 –2.17
Wasted service truck visit—not DNSP fault
–2.15 –2.33 –2.43 –2.34 –2.17
Fault response—not DNSP fault –2.15 –2.33 –2.43 –2.34 –2.17
Meter test—single and multi phase meter installations with annual consumption of <160 MWh
–2.00 –2.63 –2.98 –2.54 –2.34
Meter test—types 5 & 6 meter installation for first tier customers with annual consumption >160 MWh
–2.00 –2.63 –2.98 –2.54 –2.34
Temporary cover of low voltage wires (includes service and mains wires)
–1.96 –2.63 –3.01 –2.53 –2.33
After hours
New connection services
Connection—single phase service connection to new premises
–2.10 –2.35 –2.49 –2.30 –2.13
Connection—three phase service connection to new premises with direct metering
–2.02 –2.22 –2.32 –2.14 –1.98
Connection—three phase CT connected metering installation including energisation
–1.89 –2.11 –2.24 –1.98 –1.81
Connection—three phase service connection to new premises with CT connected metering
–1.79 –2.01 –2.14 –1.86 –1.71
Network Services
Manual energisation of new premises –2.15 –2.63 –2.89 –2.57 –2.37
Manual re-energisation of existing premises
–2.15 –2.63 –2.89 –2.57 –2.37
Remote re-energisation of existing premises
–2.43 –2.63 –2.73 –2.63 –2.43
Manual de-energisation of existing premises
–2.15 –2.63 –2.89 –2.57 –2.37
Remote de-energisation of existing premises
–2.43 –2.63 –2.73 –2.63 –2.43
Temporary overhead supply—coincident abolishment
–2.23 –2.41 –2.49 –2.40 –2.22
Temporary disconnect—reconnect –2.15 –2.63 –2.89 –2.57 -2.37
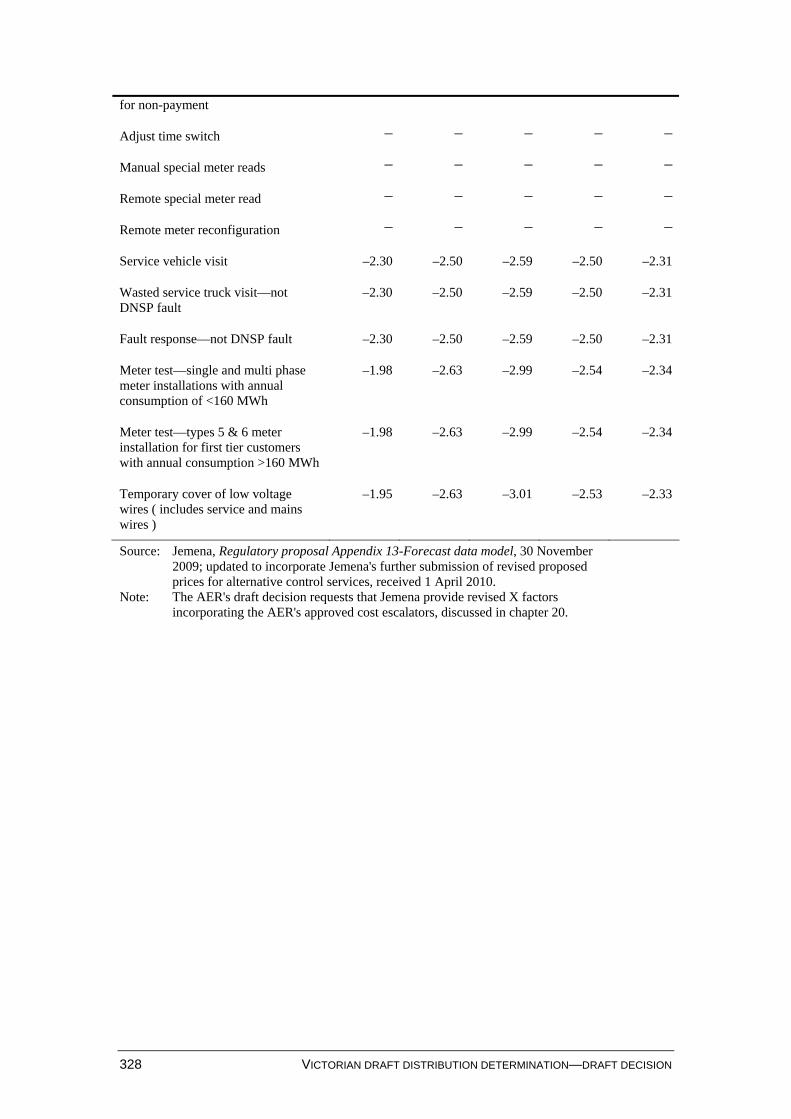
328 VICTORIAN DRAFT DISTRIBUTION DETERMINATION—DRAFT DECISION
for non-payment
Adjust time switch – – – – –
Manual special meter reads – – – – –
Remote special meter read – – – – –
Remote meter reconfiguration – – – – –
Service vehicle visit –2.30 –2.50 –2.59 –2.50 –2.31
Wasted service truck visit—not DNSP fault
–2.30 –2.50 –2.59 –2.50 –2.31
Fault response—not DNSP fault –2.30 –2.50 –2.59 –2.50 –2.31
Meter test—single and multi phase meter installations with annual consumption of <160 MWh
–1.98 –2.63 –2.99 –2.54 –2.34
Meter test—types 5 & 6 meter installation for first tier customers with annual consumption >160 MWh
–1.98 –2.63 –2.99 –2.54 –2.34
Temporary cover of low voltage wires ( includes service and mains wires )
–1.95 –2.63 –3.01 –2.53 –2.33
Source: Jemena, Regulatory proposal Appendix 13-Forecast data model, 30 November 2009; updated to incorporate Jemena's further submission of revised proposed prices for alternative control services, received 1 April 2010.
Note: The AER's draft decision requests that Jemena provide revised X factors incorporating the AER's approved cost escalators, discussed in chapter 20.
APPENDIX P—DEBT RAISING COSTS 329
P Debt raising costs
P.1 Introduction Debt raising costs are incurred each time debt is rolled over, and may include underwriting fees, legal fees, company credit rating fees and other transaction costs. The AER has accepted that debt raising costs are a legitimate expense for which a distribution network service provider (DNSP) should be provided an allowance.1
P.2 Regulatory requirements The revenue and pricing principles set out that each of the DNSPs should be provided with a reasonable opportunity to recover at least its efficient costs.2 Also relevant is the potential for under or over investment, a matter that is particularly relevant to debt raising costs.3 The opex criteria require that the total of the forecast opex reasonably reflects the efficient costs and the costs that a prudent operator in the circumstances of the relevant DNSP would require.4 Further, the forecast opex is assessed with regard to, among other things, the benchmark opex that would be incurred by an efficient DNSP over the regulatory control period.5
The AER has jointly assessed the benchmark debt raising costs of the Victorian distribution network service providers (Victorian DNSPs) on this basis. Where consultant reports have been submitted by one of the DNSPs, to the extent that the information is pertinent to all DNSPs the information has been jointly considered within this appendix.
For convenience, within this section references to the benchmark firm should be interpreted as a reference to a benchmark efficient DNSP that is a pure play regulated electricity network operating in Australia without parent ownership.
P.3 Direct debt raising costs The Victorian DNSPs proposed debt raising costs as a component of their operating expenditure forecasts. The direct debt raising costs proposed by the DNSPs, to be applied to the benchmark proportion of the regulatory asset base (RAB) that is financed by debt, are outlined in table P.1.
1 AER, Decision, Powerlink Queensland transmission network revenue cap 2007–08 to 2011–12, 14
June 2007, pp. 94–97; AER, Final decision, SP AusNet transmission determination 2008–09 to 2013–14, January 2008, pp. 148–150 and AER, Final decision, ElectraNet transmission determination 2008–09 to 2013–14, 11 April 2008, pp. 84–85.
2 For electricity, this means efficient costs associated with direct control network services and regulatory obligations; see NEL, section 7A.
3 NEL, section 7A(6). 4 NER, clauses 6.5.6(c)(1) and 6.5.6(c)(2). 5 NER, clause 6.5.6(e).
330 VICTORIAN DRAFT DISTRIBUTION DETERMINATION—DRAFT DECISION
Table P.1 Victorian DNSP proposed direct debt raising costs (basis points, per annum)
CitiPower Powercor Jemena SP AusNet United Energy
12.3 12.3a 12.0 12.0 11.8
(a) Powercor in their regulatory proposal have proposed direct debt raising costs of 12 basis points per annum however in their supporting documentation Powercor have proposed direct debt raising costs of 12.3 basis points per annum. The AER believes this error is due to rounding.
Source: CitiPower, Regulatory proposal, p. 173, Powercor, Regulatory proposal, p. 169, Jemena, Regulatory proposal, p. 141, SP AusNet, Regulatory proposal, p. 231, United Energy, Regulatory proposal, p. 149.
In determining their respective direct debt raising costs, CitiPower, Powercor, SP AusNet and United Energy have all drawn on an expert opinion report on debt and equity raising costs prepared by the Competition Economists Group (CEG) for ETSA Utilities as part of the ETSA Utilities Regulatory Proposal 2010-15.6 In support of the CEG report, CitiPower and Powercor have also provided a letter prepared by CEG (CEG letter) which provided an update of the CEG report by incorporating new data and utilising a prescribed discount rate for amortisation.7
Jemena's proposal on debt raising costs noted that they would be consistent with a benchmark efficient firm.8 Jemena did not refer to any third party consultation in determining its direct debt raising costs.
In addition to direct debt raising costs, CitiPower, Powercor and SP AusNet proposed early debt refinancing costs of 16.6 basis points per annum to refinance their debt three to six months prior to the date it was required.9 This early debt refinancing cost approach was first submitted by ETSA Utilities in its regulatory proposal for the South Australian draft electricity distribution determination and was referred to as the 'completion method'. For convenience any reference to this early debt refinancing cost approach here will be referred to as the completion method.
In support of the completion method, CitiPower, Powercor and SP AusNet provided an article from Standard and Poor’s on refinancing.10 In further support of this article CitiPower and Powercor also provided a letter from Standard and Poor’s clarifying their position on debt refinancing.11 CitiPower and Powercor in their respective proposals noted the Treasury Risk Management Policy of CHEDHA12 Group (the
6 CEG, Debt and equity raising costs: A report for ETSA, June 2009. 7 CEG, Letter to Mark De Villiers, Manager Financial and Regulatory Strategy, CitiPower and
Powercor, Update to June 2009 Report: Debt and Equity Raising Costs, 20 November 2009. 8 Jemena, Regulatory Proposal 2011-15, 30 November 2009, p. 141. 9 CitiPower, Regulatory Proposal 2011 to 2015, 30 November 2009 p. 173, Powercor, Regulatory
Proposal 2011 to 2015, 30 November 2009, p. 170 and SP AusNet, Electricity Distribution Price Review, Regulatory Proposal, November 2009 p. 232.
10 Standard and Poor’s, Ratings Direct: Refinancing And Liquidity Risks Remain, But Australia's Rated Corporates Are Set To Clear The Debt Logjam, 22 April 2008.
11 Standard and Poor’s, Letter to Julie Williams, Chief Financial Officer, CitiPower and Powercor, Re: Liquidity Risk Management Request for Clarification, 30 October 2009.
12 Cheung Kong Infrastructure Ltd and Hong Kong Electric Holdings Ltd Electricity Distribution Holdings (Australia) Pty Ltd.
APPENDIX P—DEBT RAISING COSTS 331
holding company for CitiPower and Powercor investments) which requires debt funding requirements to be in place six months prior to the requirement for funding.13 In line with this, SP AusNet also provided confidential extracts from an internal Board meeting regarding the update of its Treasury Risk Policy to address the "change in the philosophy of the agencies"14 in refinancing debt.
Taking into account the early debt financing costs of CitiPower, Powercor and SP AusNet the proposed debt raising costs for the Victorian DNSPs are set out in table P.2.
Table P.2 Victorian DNSP forecast benchmark debt raising costs ($'m, 2010)
2011 2012 2013 2014 2015 Total
CitiPower 4.0 4.3 4.4 4.5 4.5 22
Jemena 0.5 0.6 0.6 0.7 0.7 3.1
Powercor 6.4 6.4 6.7 7.0 7.0 33
SP AusNet 3.5 3.7 4.0 4.3 4.6 20
United Energy 1.0 1.1 1.1 1.2 1.2 5.6
Source: CitiPower, Regulatory proposal, p. 174, Powercor, Regulatory proposal, p. 170, Jemena, Regulatory proposal, p. 142, SP AusNet, Regulatory proposal, p. 234, United Energy, Regulatory proposal, p. 87. Note: Totals may not add due to rounding.
P.4 Issues and AER considerations
P.4.1 Direct debt raising costs
Victorian DNSP regulatory proposals
The methodology utilised by the AER in recent decisions for estimating the benchmark direct debt raising costs is one based on the 2004 report commissioned by the Australian Competition and Consumer Commission (ACCC) from Allen Consulting Group (ACG).15 This methodology involved the calculation of the cost of a benchmark bond size issue ($200 million), and the number of such bond issues required to rollover the benchmark debt share (60 per cent) of the RAB. The allowance for the benchmark bond issue was based on the (standard) direct costs of raising debt, such as underwriting fees, legal fees and credit rating fees. This methodology has been updated and applied in recent decisions including in the AER's South Australian and Queensland draft and final electricity distribution determinations.16
13 Citipower, Regulatory proposal, p. 173 and Powercor, Regulatory proposal, p. 170. 14 SP AusNet, Regulatory proposal, p. 233. 15 ACG, Debt and equity raising transaction costs, December 2004. 16 See: AER, Draft decision, South Australia Draft distribution determination 2010–11 to 2014–15,
25 November, 2009, appendix I and AER, Final decision, South Australia distribution determination, May 2010.
332 VICTORIAN DRAFT DISTRIBUTION DETERMINATION—DRAFT DECISION
As stated above, four of the five Victorian DNSPs submitted the CEG report prepared for ETSA Utilities’ regulatory proposal. The AER has previously considered the issues raised in the CEG report in the South Australian draft and final electricity distribution determinations. Consistent with these determinations the AER’s views on the issues raised in the CEG report are reflected here.17
The key issues put forward in the CEG report primarily refer to the approach taken in the AER's New South Wales final electricity distribution determination. The report focused on three key issues:
Underwriting costs
Treatment of other direct costs
Comparison to other estimates of direct debt-raising costs.
Underwriting costs
The issues raised by CEG regarding underwriting costs are:
a proposed move from the simple averaging method for annualising upfront underwriting fees to a amortisation approach to better reflect the time value of money,
the AER's apparent departure from the 'rolling' five year period calculations as applied under the ACG methodology in the New South Wales final electricity distribution determination where it did not roll forward the five year window but added data to existing data making it in practice a ten year period, and
the AER's failure to include all 'live' bond issues in its analysis. 18
CEG concluded from its analysis that based on Bloomberg data and its proposed approach, underwriting costs should be no lower than 9.1 basis points.19
United Energy drew on this underwriting costs output from the CEG report to determine its debt raising costs and has added its own build up of other direct costs to determine 12.2 basis points per annum for a single issue of $200 million.20 United Energy outlined that to fund its debt requirements over the forthcoming regulatory control period it would require four issues of $200 million ($800 million) and therefore requested 11.8 basis points per annum per issue.
In response to these CEG report issues, the AER in the South Australian draft electricity distribution determination conceded that whilst the ACG methodology for annualising upfront underwriting costs is simple and relatively accurate, in certain circumstances it can under compensate the service provider. Through this analysis the 17 AER, Draft decision, South Australia Draft distribution determination 2010–11 to 2014–15,
25 November, 2009 and AER, Final decision, South Australia distribution determination 2010–11 to 2014–15, May 2010.
18 CEG, Debt and equity raising costs: A report for ETSA, June 2009, pp. 4–8. 19 ibid., p. 4. 20 United Energy, Regulatory proposal, pp. 149–150.
APPENDIX P—DEBT RAISING COSTS 333
AER was able to illustrate that depending on the discount rate, the amortisation approach could be higher or lower than the ACG's method of a simple division of five year costs. The AER therefore concluded that this demonstrated the possibility of under compensation which it considered inappropriate to maintain. The AER noted:
Having considered the issues raised and the operation of the PTRM which multiplies the benchmark debt raising cost allowance in basis points per annum by the notional nominal debt amount each year, the AER has amortised the upfront costs of debt raising costs over ten years at the nominal vanilla WACC relevant to each business for this draft decision. This refined approach is to be used for future regulatory decision requiring benchmark debt raising cost allowances. 21
As stated, consistent with the ten year term for a benchmark bond in setting the debt risk premium, the AER considered in the South Australian draft electricity distribution determination that the appropriate bond length for amortisation must also be a ten year term.22
The AER in the South Australian draft electricity distribution determination also undertook an extensive investigation into the claims put forward by CEG regarding the data set used for the New South Wales final electricity distribution determination. The outcome saw changes to the data set with the exclusion of bonds outside the rolling five year window, inclusion of some of the bonds indentified by CEG and the update of data to April 2009.23 Further consideration of bonds to be included in the data set for determining the debt raising costs was undertaken by the AER in the South Australian final electricity distribution determination in response to particular exclusions raised by ETSA Utilities in their revised regulatory proposal.24 However, the AER again did not accept the claims for the inclusion of these bonds.
After the update of bonds in the data set in the South Australian draft electricity distribution determination the AER noted that there was little overall impact on the pattern of debt raising costs.25
Other direct costs
In relation to other direct costs, CEG raised:
using the same approach to annualise other direct costs as it had proposed for underwriting fees including the use of a consistent nominal rate of return
the AER's increase in benchmark bond issue size from the ACG's original amount without applying any inflation to non-underwriting transaction costs.26
21 AER, Draft decision, South Australia Draft distribution determination, 2010–11 to 2014–15, 25
November, 2009,appendix I, p. 529. 22 ibid., p. 530. 23 ibid., pp. 518–524. 24 AER, Final decision, South Australian distribution determination 2010–11 to 2014–15, May
2010, pp. 125–132. 25 AER, Draft decision, South Australia Draft distribution determination, 2010–11 to 2014–15, 25
November, 2009, appendix I, p. 524. 26 CEG, Debt and equity raising costs: A report for ETSA, June 2009, pp. 8–12.
334 VICTORIAN DRAFT DISTRIBUTION DETERMINATION—DRAFT DECISION
CEG concluded that when utilising the proposed approach to annualising both underwriting and other direct costs, an appropriate benchmark for debt raising costs would be no less than 11.8 basis points.27 CEG noted that if its proposed inflation is applied which utilises a method which relies primarily on the Australian Bureau of Statistics (ABS) Financial and Insurance services index to the non-underwriting transaction costs, this benchmark would increase from 11.8 to 12.0 basis points.28
SP AusNet has relied on this analysis from the CEG report to determine its debt raising costs of 12.0 basis points per annum.29
In response to these issues the AER in the South Australian draft electricity distribution determination noted that consistent with its decision to accept the approach to annualise underwriting costs through amortisation, other direct costs would also be annualised utilising the same approach.
In relation to CEG's claim that the lack of inflation on non-underwriting transaction costs was not consistent with the AER's increase in the benchmark bond issue, the AER has previously noted that the benchmark bond issue was not explicitly inflated but rather increased in line with the ACG methodology during the 2006 update of bonds.30 Consistent with this approach the AER increased the benchmark bond issue in the South Australian draft electricity distribution determination. The refined ACG methodology will be applied for the Victorian draft electricity determination and adjustments made where appropriate. However, the AER noted in the South Australian draft electricity distribution determination that the ACG methodology had no corresponding approach to increasing fixed costs which leads to the deflation that CEG refer to.31 In response the AER investigated the non-underwriting transaction costs and agreed that this issue should be rectified.
Whilst the AER noted in the South Australian draft electricity distribution determination that the deflation effect proposed by CEG only affected the legal/roadshow costs and the registry fees, all non-underwriting transaction costs were to be updated during this process. Through its analysis the AER confirmed the following updated cost components for the ACG debt raising methodology and the appropriate method to be used to update the inputs.
27 ibid., p. 9. 28 ibid., p. 11. The AER notes that the CEG report refers to this increase as ‘11.8% to 12.0%’ which
the AER believes is meant to read basis points instead of percentage. 29 SP AusNet, Regulatory proposal, p. 233. 30 AER, Draft decision, South Australia Draft distribution determination, 2010–11 to 2014–15,
25 November, 2009, appendix I, p. 525. 31 ibid., p. 525.
APPENDIX P—DEBT RAISING COSTS 335
Table P.3 Updated values for the ACG debt raising methodology
Category Previous value and basis Update method New value and basis
Legal and roadshow
$100 000 up front per issue (range $80 000 to $100 000 per annum)
CPI $115 000 up front per issue
Company credit rating
$50 000 per annum (range $30 000 to $50 000 per annum)
Issuer information $50 000 per annum (ongoing issuers)
Issue credit rating
3.5 basis points up front per issue Issuer information 4 basis points up front per issue
Registry fees $3 000 up front per issue CPI $3 500 up front per issue
Paying fees $4/$1 million per annum Below materiality threshold
$4/$1 million per annum
Median bond size
$200 million Rolling 5 year window
$250 million
Source: Cited in the AER Draft decision, South Australia Draft distribution determination, 2010-11 to 2014-15, 25 November, 2009, appendix I, 25 November, 2009, p. 527.
The AER notes that where the CEG report draws primarily on the ABS Financial and Insurance services index the AER utilises the ABS Consumer Price Index as it considers this to be a more appropriate measure of general inflation.32 The AER has also rounded values where this has been appropriate and applied a materiality threshold to the paying fees. Where a range of values are possible, the AER has been conservative in its approach and applied the upper boundary of this range. The AER notes that this approach will provide the DNSPs with at least an efficient benchmark cost.
As noted above, both CitiPower and Powercor requested CEG to provide them with an update of information used in the CEG report and to use a 10.19 per cent discount rate for amortisation purposes. Utilising the same methodology as the CEG report, the updated information adds estimates of underwriting costs on debt issues by Bloomberg between 1 June and 16 November 2009.33 This update has increased underwriting costs from 9.1 basis points in the CEG report to 9.4 basis points in the CEG letter.
CEG again approached the issue of updating non-underwriting debt raising costs for inflation using a method primarily based on the ABS Financial and Insurance services index.34 However, the AER notes that the CEG letter was prepared prior to the
32 AER, Draft decision, South Australia Draft distribution determination, 2010–11 to 2014–15, 25
November, 2009,appendix I, p. 526. 33 CEG, Letter to Mark De Villiers, Manager Financial and Regulatory Strategy, CitiPower and
Powercor, Update to June 2009 Report: Debt and Equity Raising Costs, 20 November 2009, p. 1. 34 ibid., p. 3.
336 VICTORIAN DRAFT DISTRIBUTION DETERMINATION—DRAFT DECISION
South Australian draft distribution determination being released and therefore does not fully reflect the above considerations of the AER.
CitiPower and Powercor have drawn upon this analysis from the CEG report and subsequent CEG letter to determine their respective debt raising costs of 12.3 basis points per annum.
Other estimates of direct debt-raising costs
In support of its proposed methodology, CEG drew on a report by Lee, Lochead, Titter and Zhao which focuses on US corporations raising debt and equity during the early 1990's.35 CEG concluded that the findings of Lee et al gave strength to the CEG argument that underwriting costs should be no lower than 9.1 basis points.
The Lee et al. report has been considered by the AER in previous decisions.36 In these decisions the data limitations of this report have been analysed. In particular, the AER notes that the Lee et al. report is based on US firms, is over fifteen years old and uses a selection of bonds and a categorisation of data that is questionable regarding whether it applies to the conditions of an Australian benchmark firm. Whilst the AER acknowledges that CEG has included the Lee et al. report in support of its own analysis, consistent with previous decisions, the AER has determined that due to the data limitations of the Lee et al. report it is not an appropriate comparison in determining the benchmark debt raising cost for an Australian regulated utility issuing investment grade debt under prevailing market conditions. Therefore the AER considers that the report is not relevant.
AER conclusions (direct debt raising costs)
The AER notes that the main arguments put forward by the Victorian DNSPs, including the basis of the CEG report and other reports have been previously considered by the AER in the South Australian draft and final electricity distribution determinations. The outcome of this analysis was an update of the selection of bonds to fully align with the ACG methodology as well as some refinements to the ACG methodology itself which is also applied here.
Following the updates to the cost components for the ACG debt raising methodology, the indicative direct debt raising costs for the Victorian DNSPs are shown in table P.4.
35 CEG, Debt and equity raising costs: A report for ETSA, June 2009, pp. 11–12. 36 AER, Draft decision, South Australia Draft distribution determination, 2010–11 to 2014–15, 25
November, 2009,appendix I, pp. 516-517 and AER, Final Decision, ACT distribution determination, 28 April 2009, p. 250.
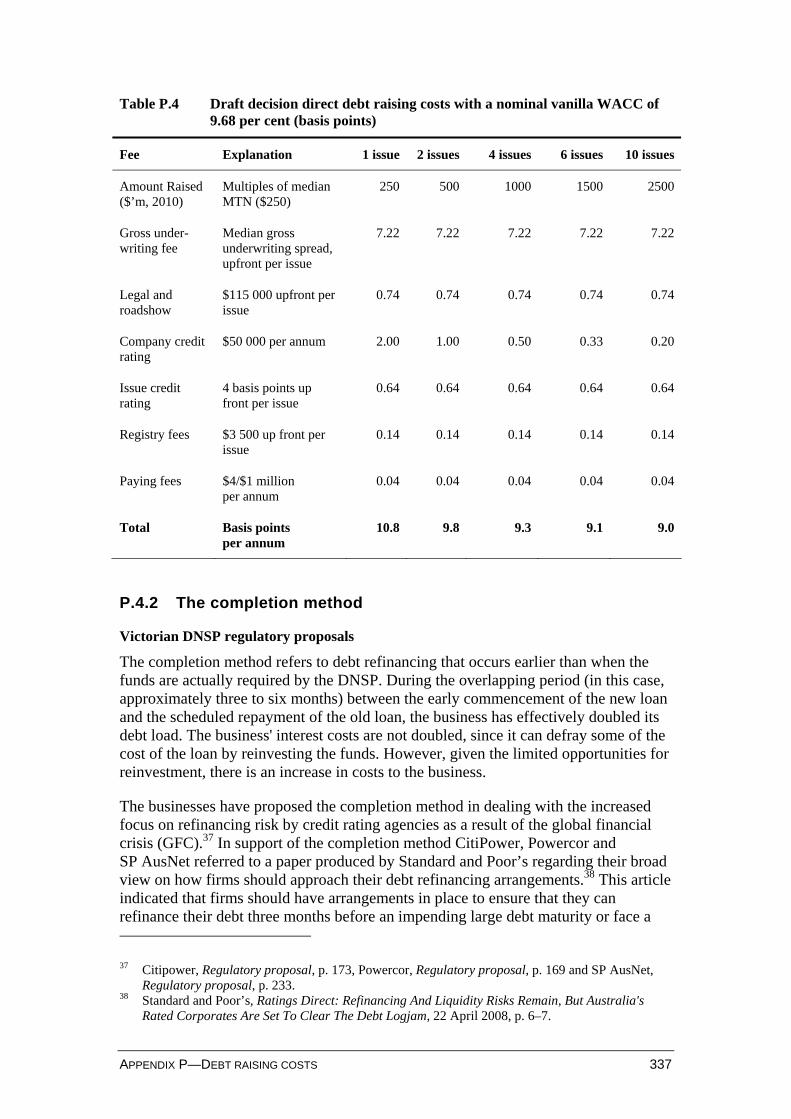
APPENDIX P—DEBT RAISING COSTS 337
Table P.4 Draft decision direct debt raising costs with a nominal vanilla WACC of 9.68 per cent (basis points)
Fee Explanation 1 issue 2 issues 4 issues 6 issues 10 issues
Amount Raised ($’m, 2010)
Multiples of median MTN ($250)
250 500 1000 1500 2500
Gross under-writing fee
Median gross underwriting spread, upfront per issue
7.22 7.22 7.22 7.22 7.22
Legal and roadshow
$115 000 upfront per issue
0.74 0.74 0.74 0.74 0.74
Company credit rating
$50 000 per annum 2.00 1.00 0.50 0.33 0.20
Issue credit rating
4 basis points up front per issue
0.64 0.64 0.64 0.64 0.64
Registry fees $3 500 up front per issue
0.14 0.14 0.14 0.14 0.14
Paying fees $4/$1 million per annum
0.04 0.04 0.04 0.04 0.04
Total Basis points per annum
10.8 9.8 9.3 9.1 9.0
P.4.2 The completion method
Victorian DNSP regulatory proposals
The completion method refers to debt refinancing that occurs earlier than when the funds are actually required by the DNSP. During the overlapping period (in this case, approximately three to six months) between the early commencement of the new loan and the scheduled repayment of the old loan, the business has effectively doubled its debt load. The business' interest costs are not doubled, since it can defray some of the cost of the loan by reinvesting the funds. However, given the limited opportunities for reinvestment, there is an increase in costs to the business.
The businesses have proposed the completion method in dealing with the increased focus on refinancing risk by credit rating agencies as a result of the global financial crisis (GFC).37 In support of the completion method CitiPower, Powercor and SP AusNet referred to a paper produced by Standard and Poor’s regarding their broad view on how firms should approach their debt refinancing arrangements.38 This article indicated that firms should have arrangements in place to ensure that they can refinance their debt three months before an impending large debt maturity or face a 37 Citipower, Regulatory proposal, p. 173, Powercor, Regulatory proposal, p. 169 and SP AusNet,
Regulatory proposal, p. 233. 38 Standard and Poor’s, Ratings Direct: Refinancing And Liquidity Risks Remain, But Australia's
Rated Corporates Are Set To Clear The Debt Logjam, 22 April 2008, p. 6–7.
338 VICTORIAN DRAFT DISTRIBUTION DETERMINATION—DRAFT DECISION
possible risk of having their credit rating downgraded. As this paper was produced in April 2008, CitiPower and Powercor have further submitted a letter from Standard and Poor’s which confirms that this approach is still supported.39
In dealing with the completion method, CitiPower, Powercor and SP AusNet have all proposed early debt financing costs of 16.6 basis points per annum. In support of their requests the businesses have provided evidence of their respective Treasury Risk Policies that require them to have their debt funding requirements committed, underwritten or fully funded three to six months prior to actual refunding.40 The businesses assume:
,,, that a DNSP will annually refinance one tenth of its debt three months prior to maturity, at the benchmark cost of debt, and invest the early refinanced debt in Treasury notes over those three months. 41
In determining their early debt financing costs the businesses have applied their respective average costs of debt and Treasury note interest rates as measured over 15 days in October 2009. These values will be recalculated over their proposed measurement periods for the AER's Final Decision.
The AER notes that the completion method was first proposed in ETSA Utilities’ regulatory proposal for the South Australian draft electricity distribution determination.42 The AER notes that the completion method was proposed by ETSA Utilities as one of three competing alternatives to manage refinancing risk. The AER’s response through its draft determination and subsequent recent analysis of the ETSA Utilities’ revised regulatory proposal and the PricewaterhouseCoopers (PwC) report has advanced from the information provided by the Victorian DNSPs on this issue in their regulatory proposals. Therefore in addressing the proposals made by CitiPower, Powercor and SP AusNet, the AER refers to its considerations in the South Australian draft and final electricity distribution determinations which are reflected here.
The AER in the South Australian draft electricity distribution determination did not support costs for the completion method noting that:
the specific circumstances of ETSA Utilities do not define the benchmark firm
Standard and Poor’s indicated that a firm without an implemented finance plan prior to debt maturity would not incur automatic rating action. 43
In response and to support its claims for adoption of the completion method in the AER’s final distribution determination, ETSA Utilities submitted a report from PwC.
39 Standard and Poor’s, Letter to Julie Williams, Chief Financial Officer, CitiPower and Powercor,
Re: Liquidity Risk Management Request for Clarification, 30 October 2009. 40 Citipower, Regulatory proposal, p. 173, Powercor, Regulatory proposal, p. 170 and SP AusNet,
Regulatory proposal, p. 233–234. 41 Citipower, Regulatory proposal, p. 173, Powercor, Regulatory proposal, p. 170 and SP AusNet,
Regulatory proposal, p. 234. 42 AER, Draft decision, South Australia Draft distribution determination, 2010–11 to 2014–15, 25
November, 2009,appendix K. 43 AER, Final decision, South Australia distribution determination 2010–11 to 2014–15, May 2010,
appendix J, p. 371.
APPENDIX P—DEBT RAISING COSTS 339
The PwC report estimated the likely costs to be incurred by a benchmark service provider under three scenarios:
the completion method—the refinancing transaction was wholly executed three months prior to the date it was required
the commitment method—contracts to commit parties to the refinancing were signed three months prior to the date of the actual funds transfer
the underwriting method—three months prior to the refinancing, the service provider engages a third party to underwrite the issuance of bonds.44
PwC concluded that the completion method results in the lowest cost to the service provider and is common practice in financial markets.45
The AER engaged Associate Professor John Handley to review ETSA Utilities’ revised regulatory proposal and the PwC report. Handley found that there were conceptual grounds to support the claim for debt raising costs associated with the completion method: Refinancing costs have already been referred to by the AER as a legitimate
expense for which a DNSP should be provided an efficient allowance.
It is prudent for a benchmark DNSP to have a refinancing plan—that is, a plan to eliminate refinancing risk, which may incorporate one of the completion, commitment or underwriting methods identified by PwC.
The set of comparator firms that inform the benchmark do use refinancing plans, including, observed use of the completion method. 46
However, Handley stated that there were practical difficulties with implementing the allowance proposed by PwC: There may be overlap between the current allowance for standard debt raising
costs and the new proposal.
In particular, the current allowance for standard debt raising costs already includes an underwriting component, and the underwriting method is a direct alternative to the completion method.
The inclusion of a credit margin premium—effectively underpricing of the debt—would be double counting, since this was already included in appropriate estimates of the cost of debt.
The time value of money was not consistently handled.47
44 PwC, ETSA Utilities: Distribution network service provider refinancing costs: Final report,
February 2010 (PwC, DNSP refinancing costs, February 2010), pp.8–9. 45 PwC, DNSP refinancing costs, February 2010, p. 5. 46 Handley, A note on the completion method, Report prepared for the Australian Energy Regulator,
Final version, 13 April 2010, pp. 6–8. 47 ibid, pp. 9–11.
340 VICTORIAN DRAFT DISTRIBUTION DETERMINATION—DRAFT DECISION
Handley noted that although a DNSP may adopt different arrangements, the allowance approved by the AER would be based on the efficient costs incurred by a benchmark DNSP, which would be the lowest cost option available.48
Framework for assessment
In response to the PwC and Handley reports, the AER in the South Australian final electricity distribution determination considered the framework for assessment and noted that any evaluation of completion method costs should be undertaken in the context of a benchmark firm. The current allowance for (standard) debt raising costs is based upon a benchmark analysis conducted by ACG in 2004.49
Consistent with the ACG report,50 the AER in determining a benchmark establishes a comparator set, which is comprised of businesses that closely resemble the theoretical benchmark—that is, the benchmark is informed by the observed actions of the comparator set. The operating expenditure of a DNSP is assessed with regard to prudence, as required by clause 6.5.6(c)2 of the NER, and in the assessment the AER must have regard to benchmark opex that would be incurred by an efficient DNSP, as required by clause 6.5.6(e)4. Therefore, where close comparators to the benchmark firm are observed to undertake a particular action, this supports the conclusion that such an action is prudent.
Consistent with the ACG report,51 the AER also notes that the cornerstone of an incentive based framework is that a particular DNSP does not have to follow the behaviour of the theoretical benchmark firm. The DNSP is free to adopt an alternative approach, accepting the benefits or detriments that arise as a consequence of deviation from the benchmark.
Key Questions
In assessing the information proposed by ETSA Utilities and PwC regarding refinancing risk, the AER considered in the South Australian final distribution determination that there were three interrelated assessments which need to be made:
a. To what extent should the benchmark firm act to reduce refinancing risk?
b. Which of three alternative methods is the most efficient means to reduce refinancing risk—that is, to the extent required by (a)?
c. Does the current allowance for (standard) debt raising costs already encompass the appropriate actions to reduce refinancing risk—that is, use of the most efficient method under (b) to the extent required by (a)?52
48 ibid, p. 8. 49 ACG, Final report, Debt and equity raising costs, Report to the Australian Competition and
Consumer Commission, December 2004, p. vii. 50 ibid., p. vii. 51 ibid., p. 3. 52 AER, Final decision, South Australia distribution determination 2010–11 to 2014–15, May 2010,
appendix J, p. 374.
APPENDIX P—DEBT RAISING COSTS 341
Validity of a refinancing plan
The AER considers that it is prudent for the benchmark firm to manage refinancing risk. The benchmark firm maintains an investment grade credit rating (BBB+) and therefore should meet the requirement of credit rating agencies such as Standard and Poor’s for a firm of this credit rating. The AER considers that the benchmark firm will manage its refinancing risk through a refinancing plan and notes:
the refinancing plan will set out a timeline for actions by the firm to ensure that it does not default on its debt
may include the use of the completion, commitment or underwriting methods but is not limited to these and will encompass a broader range of actions by the firm
the refinancing plan also includes management of maturity dates, cash reserves and other credit facilities (such as working capital account) to reduce refinancing risk.
Further the AER notes:
managing refinancing risk did not arise with the GFC but has been a long term fundamental requirement
from a theoretical perspective, there will be a point where the marginal cost to further reduce refinancing risk outweighs the marginal benefit to do so. In this respect the AER will only allow the costs for the benchmark firm to take the minimum actions required to maintain the benchmark credit rating.
Evaluating the three PwC approaches
The AER in the South Australian final electricity distribution determination undertook a comprehensive evaluation of the three approaches to reduce refinancing risk as presented in the PwC report.53
Overall, the AER found that the PwC estimates were higher than those of its own analysis. A summary of the PwC estimates and the AER's conclusion of the costs of the three approaches in the South Australian final electricity distribution determination are presented in table P.5
53 AER, Final decision, South Australia distribution determination 2010–11 to 2014–15, May 2010,
appendix J. pp. 376–382.
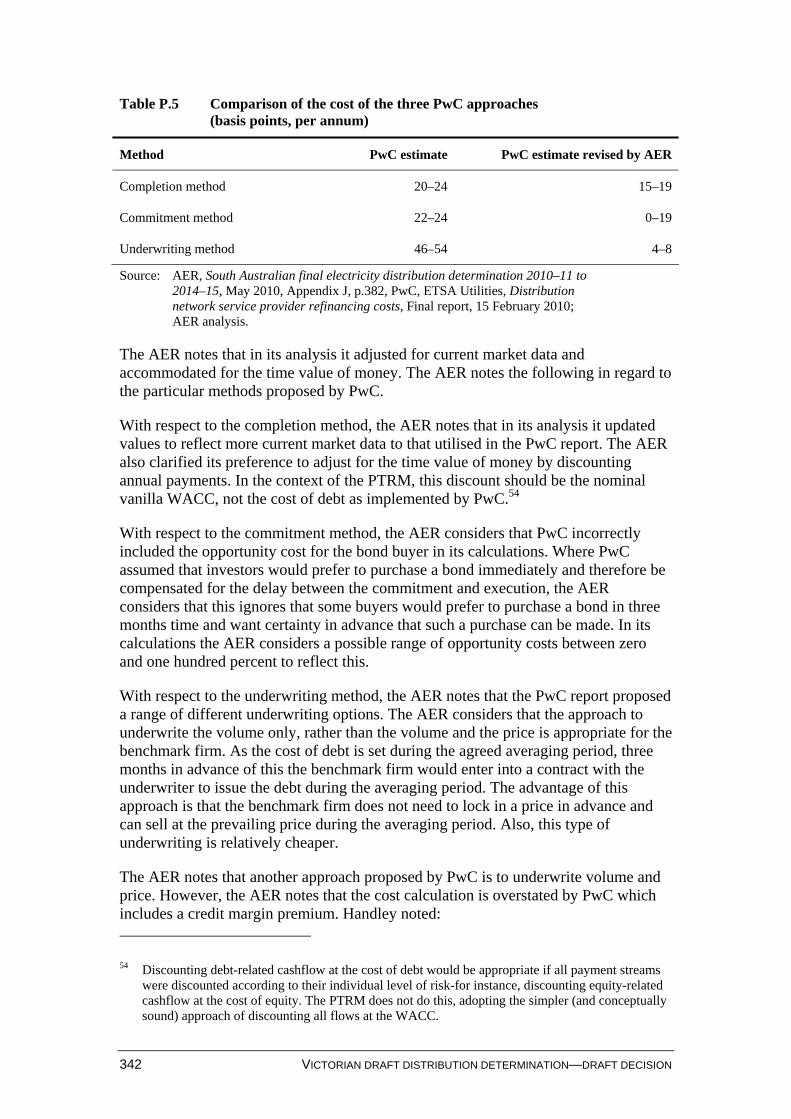
342 VICTORIAN DRAFT DISTRIBUTION DETERMINATION—DRAFT DECISION
Table P.5 Comparison of the cost of the three PwC approaches (basis points, per annum)
Method PwC estimate PwC estimate revised by AER
Completion method 20–24 15–19
Commitment method 22–24 0–19
Underwriting method 46–54 4–8
Source: AER, South Australian final electricity distribution determination 2010–11 to 2014–15, May 2010, Appendix J, p.382, PwC, ETSA Utilities, Distribution network service provider refinancing costs, Final report, 15 February 2010; AER analysis.
The AER notes that in its analysis it adjusted for current market data and accommodated for the time value of money. The AER notes the following in regard to the particular methods proposed by PwC.
With respect to the completion method, the AER notes that in its analysis it updated values to reflect more current market data to that utilised in the PwC report. The AER also clarified its preference to adjust for the time value of money by discounting annual payments. In the context of the PTRM, this discount should be the nominal vanilla WACC, not the cost of debt as implemented by PwC.54
With respect to the commitment method, the AER considers that PwC incorrectly included the opportunity cost for the bond buyer in its calculations. Where PwC assumed that investors would prefer to purchase a bond immediately and therefore be compensated for the delay between the commitment and execution, the AER considers that this ignores that some buyers would prefer to purchase a bond in three months time and want certainty in advance that such a purchase can be made. In its calculations the AER considers a possible range of opportunity costs between zero and one hundred percent to reflect this.
With respect to the underwriting method, the AER notes that the PwC report proposed a range of different underwriting options. The AER considers that the approach to underwrite the volume only, rather than the volume and the price is appropriate for the benchmark firm. As the cost of debt is set during the agreed averaging period, three months in advance of this the benchmark firm would enter into a contract with the underwriter to issue the debt during the averaging period. The advantage of this approach is that the benchmark firm does not need to lock in a price in advance and can sell at the prevailing price during the averaging period. Also, this type of underwriting is relatively cheaper.
The AER notes that another approach proposed by PwC is to underwrite volume and price. However, the AER notes that the cost calculation is overstated by PwC which includes a credit margin premium. Handley noted: 54 Discounting debt-related cashflow at the cost of debt would be appropriate if all payment streams
were discounted according to their individual level of risk-for instance, discounting equity-related cashflow at the cost of equity. The PTRM does not do this, adopting the simpler (and conceptually sound) approach of discounting all flows at the WACC.
APPENDIX P—DEBT RAISING COSTS 343
However, it appears that this credit margin premium may in effect represent underpricing of the new debt. As discussed in an earlier report, assuming allowed revenues are determined using an appropriate estimate of the cost of debt then it is my view that, underpricing should not be allowed as a (direct) cost of raising debt capital (otherwise double counting would result). In this case, the relevant PwC estimate for compensation purposes would then appear to be the upfront underwriting fee of 16-4 basis points per annum.55
The AER notes that extensive prior analysis of empirical evidence found that the methodology used to set the debt risk premium accurately prices the cost of debt, such that there is no requirement to add an underpricing allowance.56 Since refinancing risk is a long term problem, it would be reasonable to assume that the credit margin premium described by PwC has been encapsulated in this empirical data. Based on its analysis and outcomes which are summarised in table P.5, the AER notes that the least cost option may be the commitment method which has a cost range that extends down to 0 basis points per annum. However, there is considerable uncertainty in the cost estimate for this method, which extends up to 19 basis points per annum. The AER therefore concludes that the efficient cost of a refinancing plan, based on the PwC report, is between 4 and 8 basis points per annum, using the underwriting method.
Comparison with the (standard) debt raising allowance
The AER notes that the proposal for costs associated with the completion method is in addition to the (standard) debt raising costs allowance based on the ACG methodology. The AER in the South Australian final electricity distribution determination examined the ACG methodology to ensure that there is no double counting of costs.57
In particular the AER noted:
the PwC terms of reference made no reference to excluding costs that are already included in the (standard) debt raising cost allowance, undermining the findings in the PwC report58
there are strong grounds to consider that (standard) debt raising costs already includes sufficient provision for managing refinancing risk considering:
the 2004 ACG report was a comprehensive review of the transaction costs involved in raising debt (and equity)
the issue of refinancing risk was known and relevant when ACG undertook its analysis
55 Handley, A note on the completion method, Report prepared for the Australian Energy Regulator,
Final version, 13 April 2010, p. 11. 56 AER, Final decision, NSW distribution determination 2009–10 to 2013–14, 28 April 2009,
pp. 543–550. 57 AER, South Australian final electricity distribution determination 2010–11 to 2014–15, May 2010,
Appendix J, pp. 382–384. 58 ibid., pp. 382–384.
344 VICTORIAN DRAFT DISTRIBUTION DETERMINATION—DRAFT DECISION
the AER considers that it is reasonable to conclude that ACG took into account the need for a refinancing plan to mitigate refinancing risk (to an appropriate level) when estimating a benchmark for debt raising costs
although the figures have been updated since 2004, the (standard) debt raising cost allowance still uses the same cost components recommended by ACG which explicitly includes an underwriting component, currently estimated at 7.2 basis points per annum.59
The AER notes that the underwriting description from the ACG report matches that in the PwC report. In particular, PwC included a ‘volume only’ underwriting method, where the underwriter did not guarantee the price at which the debt would be raised.60 ACG explicitly noted this type of underwriting, although it used a different label:
With “best efforts” underwriting, a “bookbuild” is undertaken to determine the market–clearing price.61
The AER notes that the underwriting cost estimate based on the ACG methodology (7.2 basis points per annum) falls within the AER revised cost range based on the PwC report (4 to 8 basis points per annum), albeit at the upper end of this range. The AER has decided to continue to use the ACG-derived estimate of 7.2 basis points per annum for the underwriting component, noting that this is conservative relative to the midpoint of 6 basis points per annum that would apply based on the PwC range. The AER considers that this supports both internal consistency—all components of the allowance are based on the same source—and regulatory consistency—since this figure is based on the same methodology as applied in previous regulatory decisions.
Finally, the AER considers that the ACG report presents a more comprehensive assessment of the benchmark costs associated with debt raising than the PwC report. ACG explicitly models—in addition to underwriting fees—legal and roadshow fees, company credit rating fees, issue credit rating fees, registry fees and paying fees.62 ACG added these categories to the underwriting fee to derive a range for debt raising costs of between 9 and 11 basis points per annum.63
PwC did not state whether any of these components have been included in its considerations. If they were included in the overall cost estimates, this was not indicated. In one instance, PwC stated that it explicitly excluded legal costs:
This amount does not reflect the additional administrative and legal costs that would be incurred as a consequence of negotiating a deferred settled bond transaction for a period of as long as 3 months. 64
On balance, the AER considers that the ACG methodology provides the most comprehensive total estimate of the costs involved in raising debt, including non-underwriting components.
59 ibid., pp. 382–383. 60 PwC, DNSP refinancing costs, February 2010, p. 19. 61 ACG, Debt and equity raising costs, December 2004, p. 38. 62 ibid., pp. 51–52. 63 This cost varies based on the size of the debt assumed. 64 PwC, DNSP refinancing costs, February 2010, p. 17.
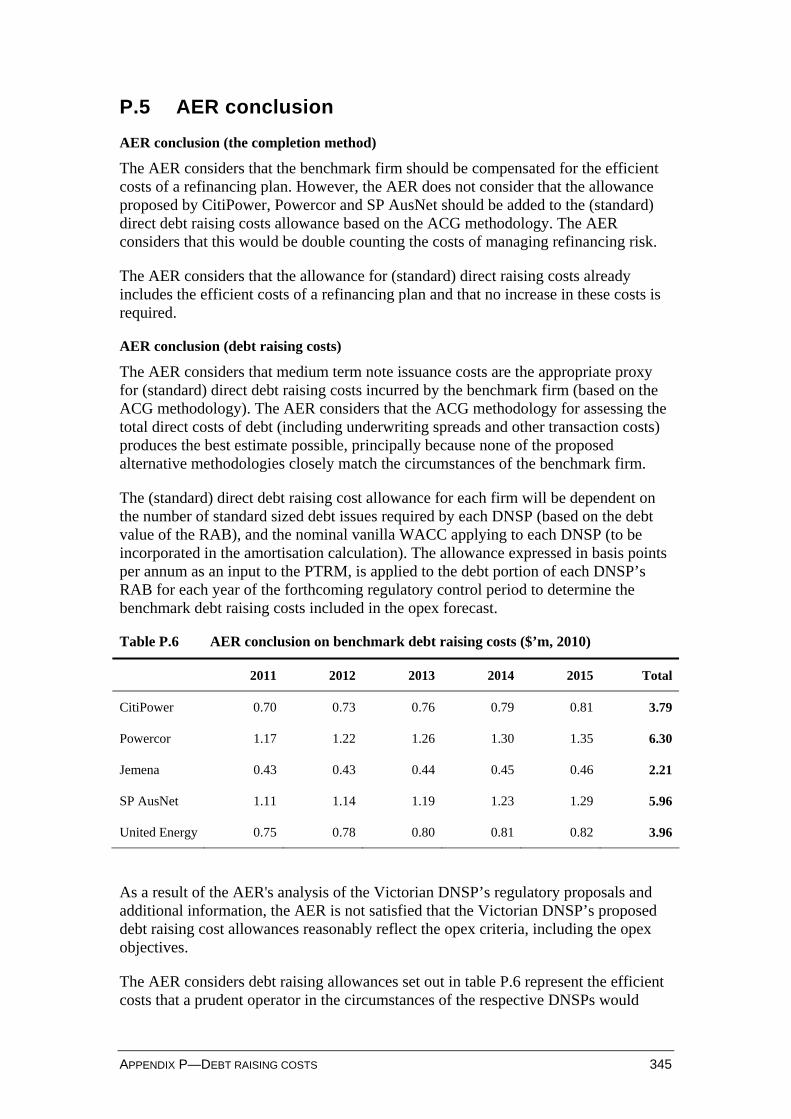
APPENDIX P—DEBT RAISING COSTS 345
P.5 AER conclusion
AER conclusion (the completion method)
The AER considers that the benchmark firm should be compensated for the efficient costs of a refinancing plan. However, the AER does not consider that the allowance proposed by CitiPower, Powercor and SP AusNet should be added to the (standard) direct debt raising costs allowance based on the ACG methodology. The AER considers that this would be double counting the costs of managing refinancing risk.
The AER considers that the allowance for (standard) direct raising costs already includes the efficient costs of a refinancing plan and that no increase in these costs is required.
AER conclusion (debt raising costs)
The AER considers that medium term note issuance costs are the appropriate proxy for (standard) direct debt raising costs incurred by the benchmark firm (based on the ACG methodology). The AER considers that the ACG methodology for assessing the total direct costs of debt (including underwriting spreads and other transaction costs) produces the best estimate possible, principally because none of the proposed alternative methodologies closely match the circumstances of the benchmark firm.
The (standard) direct debt raising cost allowance for each firm will be dependent on the number of standard sized debt issues required by each DNSP (based on the debt value of the RAB), and the nominal vanilla WACC applying to each DNSP (to be incorporated in the amortisation calculation). The allowance expressed in basis points per annum as an input to the PTRM, is applied to the debt portion of each DNSP’s RAB for each year of the forthcoming regulatory control period to determine the benchmark debt raising costs included in the opex forecast.
Table P.6 AER conclusion on benchmark debt raising costs ($’m, 2010)
2011 2012 2013 2014 2015 Total
CitiPower 0.70 0.73 0.76 0.79 0.81 3.79
Powercor 1.17 1.22 1.26 1.30 1.35 6.30
Jemena 0.43 0.43 0.44 0.45 0.46 2.21
SP AusNet 1.11 1.14 1.19 1.23 1.29 5.96
United Energy 0.75 0.78 0.80 0.81 0.82 3.96
As a result of the AER's analysis of the Victorian DNSP’s regulatory proposals and additional information, the AER is not satisfied that the Victorian DNSP’s proposed debt raising cost allowances reasonably reflect the opex criteria, including the opex objectives.
The AER considers debt raising allowances set out in table P.6 represent the efficient costs that a prudent operator in the circumstances of the respective DNSPs would
346 VICTORIAN DRAFT DISTRIBUTION DETERMINATION—DRAFT DECISION
require to achieve the opex objectives. In coming to this view the AER has had regard to the opex factors.