Embed Size (px)
Citation preview

1
Overview• IGov wrote a blog about distribution service providers (DSPs), and this power point is an update to that with a few slides which are
intended to help explain what a DSP does. [we also ran an event on DSPs in May 2016 – DSP Roundtable]
• Slide 2 uses the NY Reforming the Energy Vision to show that DSPs are a new value proposition and become the ‘heart’ of the
electricity system .
• Slide 3 explains how a DSP is the opposite of a traditional network company in relation to system optimisation and energy services.
• Slide 4 shows what the role of a traditional network utility, and the key incentives of its rate of return or capital based regulation
• Slide 5 shows the role of a DSP, and how it is primarily regulated through performance based regulation, linked to desired outcomes.
• Slide 6 shows that as a market facilitator, DSPs can undertake coordinated management control to better increase system efficiency.
The DSPs are the market facilitators or managers of platforms - they are not the do-ers. So they can facilitate aggregators, but can
also add co-ordination to aggregation.
• Slide 7 shows the fundamental pitch of the NY REV that utilities may make more if they meet certain outputs through their output based
regulation revenue but that this should lead to reduce system costs overall and bring down , or at least hold stead, customer bills.
• Slide 8 shows the challenges and opportunities faced by energy system stakeholders – whether it be Government, regulators, small or
large companies and so on.
• Slides 9 shows to what extent current regulation in NY state meets those challenges or captures those opportunities.
• Slides 10 shows how the NY REV restructuring is meant to meet those challenges or captures those opportunities.
• Slide 11 explains how DSPs may make money out of certain Earning Adjustment Mechanisms (EAMs)
• Slide 12 sets out various issues which are being assessed – known as scorecards – which may become EAMs in the future
• Slide 13 sets out the rate design principles of the NY REV
• Slide 14 conceptually shows the sources of DSP revenue going into the future
• Slide 15 conceptually shows the potential configuration of DSP markets and vertical market coupling
• Slide 16 shows where DSPs fit into the IGov framework
• Slide 17 compares DSOs to DSPs
• Slide 18 ranks DNOs, DSOs and DSPs
• Slide 19 looks at system interconnectionSome of these slides are developed from: CSIRO and Energy Networks Association 2015, Electricity Network Transformation Roadmap: Interim Program Report; from Rich Sedano, Power Sector Transformation – the
case of the NY REV, RAP https://www.raponline.org/search/site/?q=NY%20REV; or from Verschae R., Kawashima H., Kato T., Matsuyama T., Coordinated energy management for inter-community imbalance
minimization, Renewable Energy, Volume 87, Part 2, March 2016, Pages 922-935, ISSN 0960-1481, http://dx.doi.org/10.1016/j.renene.2015.07.039

NY State as an Example of Transformative
Governance? Too early to say?
2
Traditional NY REV
Generator
ISOWholesale/Pool
TO
Distribution
Customer
Service
ISO / Wholesale
PoolDistribution
Service Provider/ Local Markets
Customer
TransmissionOperator

Example: distribution service providers (market
facilitators at the distribution level)
Distribution SystemIntegrator i.e. DSO
Intelligent GridOperator
Traditional Network Company
Distribution Service Provider
‘Beyond the Meter’ Services
Information Services
Customer-focussed system optimisation
Centralised & supply led
Energy Units Energy Services
Source: Adapted from CSIRO and Energy Networks Association 2015, Electricity Network Transformation Roadmap: Interim Program Report

4
What is a traditional distribution network
utility?
Distribution Network Operator
• Supplying energy units to customers• Maintaining certain operational standards• Making a rate of return on capital assets, so incentive to add capital assets
Maintaining a safegrid
Maximising asset infrastructure
Rate of Return Regulation
Source: Adapted from CSIRO and Energy Networks Association 2015, Electricity Network Transformation Roadmap: Interim Program Report

5
What is a Distribution Service Provider?
Distribution Service Provider
• Integrating all types of DER via increased system and energy efficiency • Enabling customers to provide and be paid for services to D-grid• Facilitating services between 3rd party providers and customers• Reveal value• Becoming ‘active’
Maintaining a safe &
resilient grid
Increasing system
efficiency
Optimisinginfrastructure
Support/ enable public policies
Enabling highlyreliable & resilient energy services
Bring forwardcost-effective ways of achieving outcomes
Providetransparent data
Higher proportion of Performance Based Regulation to Revenue
Source: Adapted from CSIRO and Energy Networks Association 2015, Electricity Network Transformation Roadmap: Interim Program Report

6
Coordination at Distribution level important
Source: adapted from Vercschae, Kato, Kawashima & Matsuyam (2015) http://vision.kuee.kyoto-u.ac.jp/japanese/happyou/pdf/Rodrigo_ASN_2015.pdf
Demand Management (demand response) Co-ordinated energy management
Electricity, heat &
transport/DER
Aggregator
Supply-side Demand-side
Supply Management (operating reserve)
Top down signal
Consumers (EMS)
Electricity, heat &
transport/DER
Co-ordination
• Cluster of single actor best effort• Limited control ability
• Actors communicate to coordinate• control feedback
• Community best effort• Higher control ability

7
The idea: the DSP could make a higher return if it
met PBR goals but overall energy system cost to
customers would be lower with increased services
Source: Richard Sedano: Power Sector Transformation: The Case of New York REV, 2015
12%
10%
8%
6%
4%
2%
0%
8% 8%
3%
Normal Return
Incorporating a Performance Component into the Rate of Return
Earn
ed R
ate
or
Ret
urn
• A zero-based approach Before performance is
considered, utility earns X % based on rate base o You can also start at
normal return and go up and down
• Normally allowed return consistent with compliance-based performance
• Higher return available for increasing, exemplary level of measured performance via PBR

8
Current Challenges to be met in energy system
Opportunities of Change to be Captured
• To transfer from the current energy system to a decarbonised on
o requires ‘new’ energy system which implies new roles (institutions, utilities, customers, providers, intermediaries , business models, etc), new governance and regulatory environment, new value propositions; speeding up
• New technologies (supply, demand, ICT) enable a more efficient energy system through greater coordination: utilise infrastructure assets more fully; reduce total infrastructure needs; and reduce costs
• Infrastructure (including ICT) has to be upgraded, and paid for
• Ability to meet customer wishes and develop new business models to do so
• Need to keep prices as low as possible for customers
• New institutional ops to keep prices as low as possible for customers
• Have to keep up with change: decentralisation, rapidly changing technology costs, system economics and operation enabled by ICT, customer and civil society preferences, varying incumbent v new entrant wishes
•Ability to be more resilient to change –whether weather, technologies, customer preferences, policy requirements – and to be more flexible and nimble
•Altering where value currently is in system to where we need it to be to enable innovation
•Attracting appropriate investment

9
Past NY State Governance
Past Regulation Incentivises Suited to challenges / opportunities? NO
Rate of Return on Capital Assets
Passive Management and Operation
Customer prices will have to go up to pay for upgrades because of inefficient system operation
Small % related to PBR Adding capital assets Not sufficiently resilient to change
Payment per unit transferred across network
Supply orientated system operation
Lags technological change and social preferences
Does not meet policy goals of sustainable, resilient and affordable ES

10
Governance Incentivises and therefore meets challenges
Captures opportunities? YES
Various revenue streams More active Management and Operation, including asset utilisation
Efficient infrastructure development
Improved resilience, reliability and efficiency of system operation, including the demand side
Customer focus central to Vision, so customer preferences enabled
Meeting policy goals Attracts new entrants and new ideas
Increased customer choice of services and leverage of customer involvement
Allows markets and operation to evolve as value for new services is revealed
Keeps system costs down, including infrastructure spend
It is a way to access demand reduction and flexibility
Keeps customer prices down New ICT key enabler
Keeps up with technological change and social preference
Allows new business models fornew services
NY Reforming the Energy Vision

11
Earnings Adjusted Mechanisms (p53)
Staff Prioritised Outcomes Staff Implementation issues
Peak reduction: oriented toward near-term system savings and development of DER resources;
Existing rate incentive measures should be retained but should be reviewed for their continued usefulness;
Energy efficiency: oriented toward integrating efficiency with demand reduction and increasing the total amount of efficiency activity;
New EAMs should be positive-only in direction, with the exception of customer engagement and interconnection, which should be symmetrical;
Customer Engagement: oriented toward near-term activities to educate and engage customers and provide access to data;
Positive-only EAMs in the longer term should be tied to a bill impact metric;
Affordability: oriented toward promotion of low-income customer participation in DER, and toward reduction in terminations and arrearages; and
EAMs may be oriented toward outcomes that utilities can influence and need not be confined to activities over which utilities have direct control;
Interconnection: oriented toward increasing the speed and affordability of interconnection of distributed generation.
Most EAMs should be on a multi-year basis rather than annual, to allow time to develop desired outcomes;
EAMs should be compensated or charged via accounts that are reconciled in rate cases;
All utilities should have EAMs for the same categories, while details may vary among utilities; and
NB EAMs are intended to be near-term requirements to enable distribution level markets to function; and a bridge until a more market-orientated time
Total size of revenues at stake need to be determined on a case by case basis.

12
Scorecards May Become EAMs p93-96 Staff recommended metrics Commissioner comments
System utilization and efficiency: this would encompass load factor, T&D system utilization, fuel diversity, and overall system heat rate;
More collaborative work needed
DER penetration: this would focus on the penetration of distributed generation, dynamic load management, and energy efficiency as a percentage of total utility load;
Think about affordability
Time-of-use rate efficacy: this would measure the rate of adoption of opt-in TOU rates, and the ability of customers to reduce their bills via these rates;
Maybe carbon an EAM but work through CES
Market-based revenues: this would track the amount, and sources, of utility revenues from platform and value-added services, to reflect the degree of market uptake and the success of utilities in adjusting their business models;
Add resilience as a metric
Carbon reduction: this would track the market penetration of carbon-free sources as a percentage of total load within each utility’s service territory;
These metrics likely to become EAMs in future once data available
Conversion of fossil-fueled end uses: this would track the adoption rates of electric vehicles and conversion of combustion appliances to high-efficiency electric appliances;
Customer satisfaction: this would utilize existing indices that measure customer satisfaction, complaint response time, escalated complaint response time, and pending cases; and
Customer enhancement: this would be a broader index encompassing the affordability metric, customer engagement in markets, customer satisfaction, and HEFPA compliance rates.

13
Rate Design Reform
Types of customers Customer granularity to be developed
Rate design principles to guide reforms
Traditional consumers Temporal Cost causation
Active consumers Locational Encourage outcomes
Prosumers Attribute Policy transparency
Decision-making
Fair value
Customer-orientation
Stability
Access
Gradualism
NB Consumers who rent their homes, reside in multi-family or mixed-use facilities, and/or do not have individual metering may lack either an economic incentive or practical access to manage their energy usage by investing in DER

Sources of Utility Revenue within NY REV

15
DSP Markets
PUC/PSR/regulator
DSP Marketfacilitator
regulated Market A
Market B
Market C
Customerfor service A
Customerfor service B
Customerfor service C + Z’
Aa Ab Ac Ba Bb Bc Ca Cb CcProviders
Multiple program support for renewable energy, energy efficiency, electric vehicles, etc
Z’
Competition no market on market platform
SystemOperator /Wholesale
Market
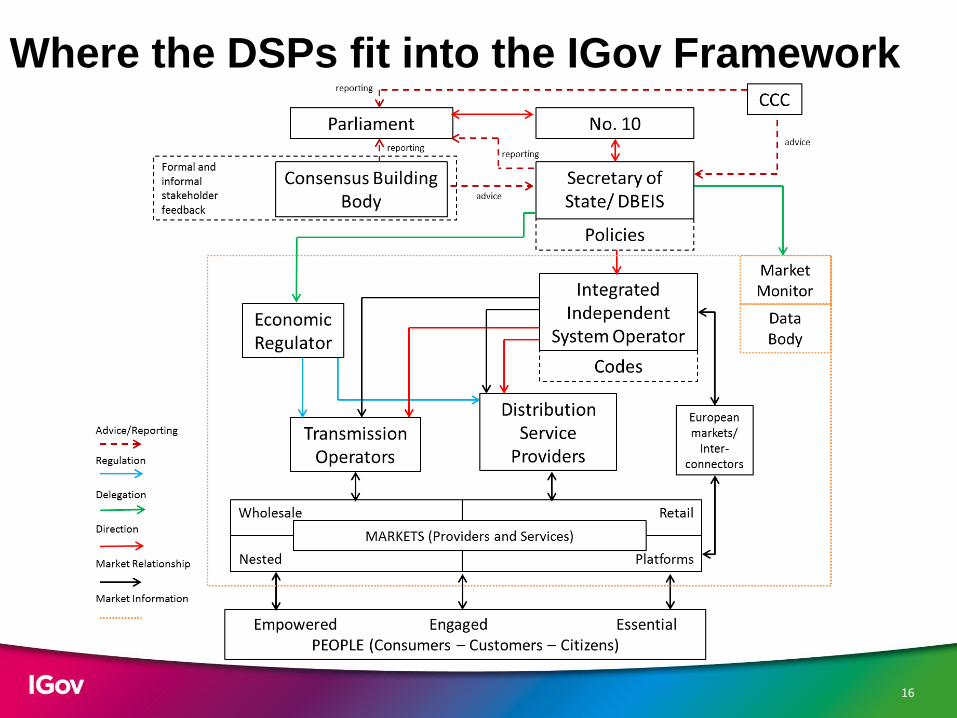
16
Where the DSPs fit into the IGov Framework

17
DSOs vs DSPs
Challenges DSP
Better than now, but not much granularity
Better than now, but not much
Certain customers
Better than now but not much
Some, but complex
Some
Enables this
Enables this
Enables this
Enables this
Both government targets / goals and PBR
Yes, and helps to reduce regulatory lag
D system needs co-ordination, granularity of value and data access
Transparent and legitimate policy making, with direction
Customer / people focused
Promotes energy efficiency, DSM, integration, flexibility, LEM
Operation and regulation to minimise infrastructure cost
Regulated to meet desired outputs, simply
Regulated to encourage transactions / innovation of practice / new entrants
DSO
Not really Greater coherence of decision-making, direction &
less delegation from BEIS

18
DNO DSO DSP
1 2 3 4 5 6 7 8 9 1 0
If a distribution service provider is 10, and DNO 1,
where is a DSO?

19
Increasing System Inter-connection
DSPDNO transferred to DSP for PSO reasons
TariffsBasis of new DER services and flexibility
IISOAs director to meet CCC targets
DER Value- Allows ‘new’ ES economics
to be revealed- Allows functioning local
markets- basis of
democratisation- basis of flexibility- basis of EE / DSR
Impacts on
Network Charging
Impacts on
Market Designenables coordinating / balancing at local level
Impacts on
Regulatory MechanismPBR on outputs
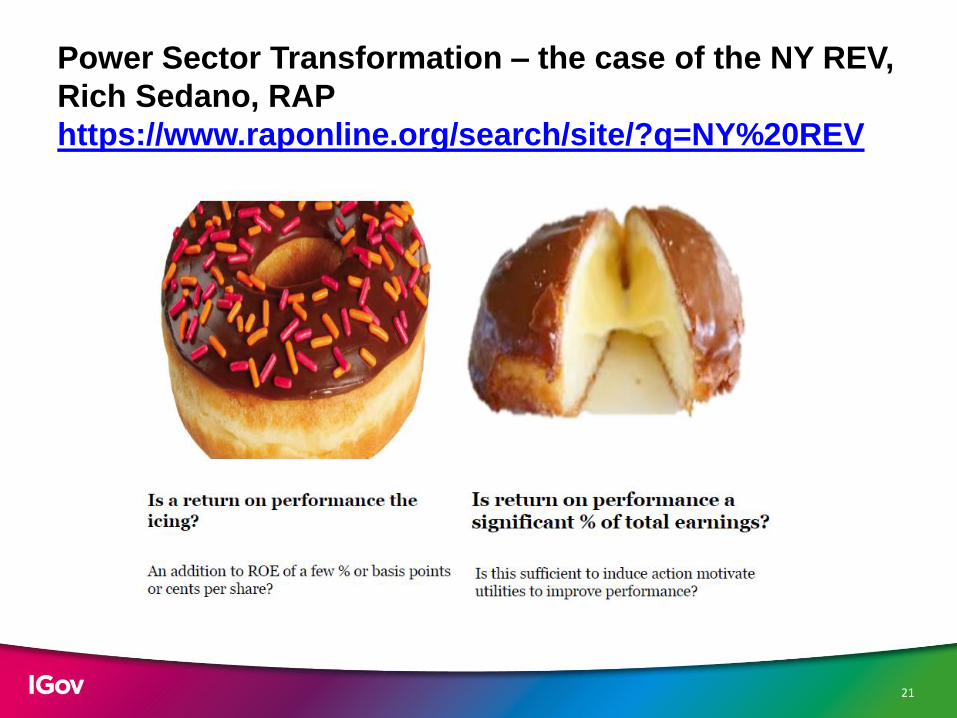
21
Power Sector Transformation – the case of the NY REV,
Rich Sedano, RAP
https://www.raponline.org/search/site/?q=NY%20REV