Embed Size (px)
Citation preview
1
Vibrational spectroscopy of the phosphate mineral kovdorskite – Mg2PO4 2O
Ray L. Frosta , Andrés Lópeza, Yunfei Xia, Amanda Granjab, Ricardo Scholzb, Rosa
Malena Fernandes Limac
a School of Chemistry, Physics and Mechanical Engineering, Science and Engineering
Faculty, Queensland University of Technology, GPO Box 2434, Brisbane Queensland 4001,
Australia.
b Geology Department, School of Mines, Federal University of Ouro Preto, Campus Morro do
Cruzeiro, Ouro Preto, MG, 35,400-00, Brazil
c Mining Engineering Department, School of Mines, Federal University of Ouro Preto,
Campus Morro do Cruzeiro, Ouro Preto, MG, 35,400-00, Brazil
Abstract:
The mineral kovdorskite Mg2PO4(OH) 2O was studied by electron microscopy, thermal
analysis and vibrational spectroscopy. A comparison of the vibrational spectroscopy of
kovdorskite is made with other magnesium bearing phosphate minerals and compounds.
Electron probe analysis proves the mineral is very pure. The Raman spectrum is characterized
by a band at 965 cm-1 attributed to the PO43-
1 symmetric stretching mode. Raman bands at
1057 and 1089 cm-1 are attributed to the PO43-
3 antisymmetric stretching modes. Raman
bands at 412, 454 and 485 cm-1 are assigned to the PO43-
2 bending modes. Raman bands at
536, 546 and 574 cm-1 are assigned to the PO43-
4 bending modes. The Raman spectrum in
the OH stretching region is dominated by a very sharp intense band at 3681 cm-1 assigned to
the stretching vibration of OH units. Infrared bands observed at 2762, 2977, 3204, 3275 and
3394 cm-1 are attributed to water stretching bands. Vibrational spectroscopy shows that no
carbonate bands are observed in the spectra; thus confirming the formula of the mineral as
Mg2PO4 2O.
Key words: kovdorskite, phosphate, pegmatite, Raman spectroscopy, infrared spectroscopy
Author to whom correspondence should be addressed ([email protected])P +61 7 3138 2407 F: +61 7 3138 1804
2
Introduction
Kovdorskite is a rare magnesium phosphate hydrate with general chemical formula expressed
by Mg2PO4(OH)·3(H2O) [1]. The only known occurrence for kovdorskite in the world is the
Kovdor alkaline massif, Kola Peninsula, Russia [2]. This mineral is found in nests of eruptive
breccia carbonate in close association with magnesite and hydrotalcite. Usually the mineral is
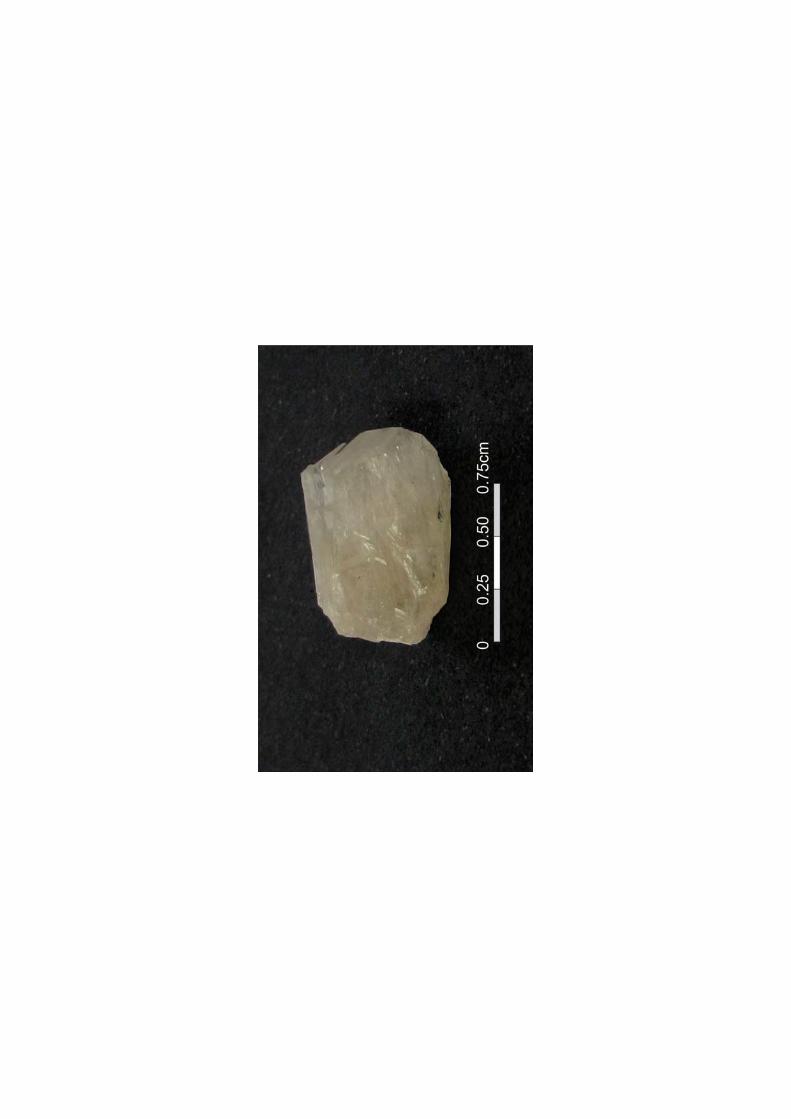
transparent, ranging from light shades of pink to blue. This mineral was discovered by
Kapustin et al. [2] and the crystal structure was refined by Ovchinnikov et al. [3].
Kovdorskite is optically biaxial negative, with 2V= 80° – 82°. The mineral belongs to
monoclinic crystal system. The structure was determined by Ovchinnikov et al. [3] and latter
refined by Morrison [4]. The refined unit cell parameters are: a = 10.4785 (1) Å; b = 12.9336
(2) Å; c = 4.7308 (1) = 105.054 (1)°. Space group is P21/a with Z = 4. The genesis
of kovdorskite is related to temperature not exceeding 300 ° due to the stability of the
structure at or below this temperature. In the microscope, the mineral is transparent and
colorless. The variation of the iron content gives rise to greenish blue while traces of
manganese cause a pink color [5].
According to Morrison et al. [4], the crystal structure of kovdorskite is characterized
by clusters of four-sharing MgO6 octahedra that are interconnected by PO4 tetrahedra and
hydrogen bonds, forming columns and channels parallel to [001]. Within each cluster there
are two special corners where three octahedral are joined. These corners are occupied by
hydroxyl ions. The hydrogen-bonding system is mainly formed by the H atoms of H2O units,
which are all directed toward the channels.
To the best knowledge of the authors, data about vibrational spectroscopic characterization of
kovdorskite are restricted to the database of the University of Arizona (rruff.info); however
no interpretation is given, however, in recent years, the application of spectroscopic
techniques to understand the structure of phosphates has been increasing.
Farmer [6] divided the vibrational spectra of phosphates according to the presence, or
absence of water and hydroxyl units in the minerals. In aqueous systems, Raman spectra of
1) at 938 cm , the antisymmetric
3
3) at 1017 cm 2) at 420 cm 4
mode at 567 cm . 1 symmetric stretching vibration of PO4 units as
determined by infrared spectroscopy was also described. The position of the symmetric
stretching vibration is mineral dependent and a function of the cation and crystal structure.
The fact that the symmetric stretching mode is observed in the infrared spectrum affirms a
reduction in symmetry of the PO4 units. The 2 symmetric bending vibration of
PO4 units as determined by infrared spectroscopy was given as 438 cm (augelite), 452 cm
(wavellite), 440 and 415 cm (rockbridgeite), 455, 435 and 415 cm (dufrenite) and 470 and
450 cm (beraunite). The observation of multiple bending modes provides an indication of
symmetry reduction of the PO4 units. This symmetry reduction is also observed through the
3 antisymmetric stretching vibrations was also described by Frost et al. (2004).
In this work, a sample of the rare mineral kovdorskite from the type locality was studied.
Characterization includes chemistry via scanning electron microscopy (SEM) in the EDS
mode and spectroscopic characterization of the structure with infrared and Raman.
Thermogravimetric analysis was also applied to determine the mass loss and the thermal
stability of the mineral.
Experimental
Occurrence, samples description and preparation
The kovdorskite sample studied in this work was obtained from the collection of the Geology
Department of the Federal University of Ouro Preto, Minas Gerais, Brazil, with sample code
SAA-129. The sample is from the Kola Peninsula, Russia, and can be considered a reference
material or type mineral.
The Kola Peninsula, the northeastern segment of the Precambrian Baltic Shield, is
characterized by complicated block structures, which were reactivated during several tectono-
magmatic episodes. During the Devonian, numerous ultramafic, alkaline and carbonatitic
intrusions were emplaced over an area of more than 100,000 km2 which extends from eastern
Finland to the eastern Kola Peninsula, and comprise the Kola Alkaline Province (KAP).These
various ultramafic and alkaline silicate rocks found in Kovdor are considered to have been
formed from several batches of a carbonated olivine melanephelinite parental magma by a
mechanism involving fractional crystallization, magma mixing and/or contamination [7].
4
The Kovdor massif is a typical ultrabasic- alkaline complex bearing a wide compositional
range of magmatic and metasomatic rocks, including olivinite, pyroxenite, ijolite- melteigite,
turjaite, melilitolite and various phoscorites and carbonatites. The Kovdor massif is an
important source of industrial minerals such as magnetite, apatite, baddeleyite, phlogopite
and vermiculite [8]. The massif is also the type locality of a number of rare minerals
The sample was gently crushed and prepared to be analyzed by different methods. The
kovdorskite sample was phase analyzed by X-ray diffraction. Scanning electron microscopy
(SEM) was applied to support the mineralogical chemical
Scanning electron microscopy (SEM)
Experiments and analyses involving electron microscopy were performed in the Center of
Microscopy of the Universidade Federal de Minas Gerais, Belo Horizonte, Minas Gerais,
Brazil (http://www.microscopia.ufmg.br).
A fragment of a kovdorskite single crystal was prepared in a carbon tape. Due to the low
vacuum conditions the sample was not metalized. Secondary Electron and Backscattering
Electron images were obtained using a JEOL JSM-6360LV equipment. Qualitative and semi-
quantitative chemical analyses in the EDS mode were performed with a ThermoNORAN
spectrometer model Quest and were applied to support the mineral characterization.
Thermogravimetric analysis – TG/DTG
Thermogravimetric analysis of kovdorskite was obtained by using TA Instruments Inc. Q50
high- resolution TGA operating at a 10 °C/min ramp with data sample interval of 0.50 s/pt
from room temperature to 1000 °C in a high-purity flowing nitrogen atmosphere (100
cm3/min). A total mass of 24.62 mg of finely ground samples were heated in an open
platinum crucible.
Raman microprobe spectroscopy
A kovdorskite single crystal was placed on a polished metal surface on the stage of an
Olympus BHSM microscope, which is equipped with 10x, 20x, and 50x objectives. The
microscope is part of a Renishaw 1000 Raman microscope system, which also includes a
monochromator, a filter system and a CCD detector (1024 pixels). The Raman spectra were
5
excited by a Spectra-Physics model 127 He-Ne laser producing highly polarized light at 633
nm and collected at a nominal resolution of 2 cm-1 and a precision of ± 1 cm-1 in the range
between 200 and 4000 cm-1. Repeated acquisitions on the crystals using the highest
magnification (50x) were accumulated to improve the signal to noise ratio of the spectra.
Raman Spectra were calibrated using the 520.5 cm-1 line of a silicon wafer. The Raman
spectrum of at least 10 crystals was collected to ensure the consistency of the spectra.
Infrared spectroscopy
Infrared spectra were obtained using a Nicolet Nexus 870 FTIR spectrometer with a smart
endurance single bounce diamond ATR cell. Spectra over the 4000 525 cm-1 range were
obtained by the co-addition of 128 scans with a resolution of 4 cm-1 and a mirror velocity of
0.6329 cm/s. Spectra were co-added to improve the signal to noise ratio.
Spectral manipulation such as baseline correction/adjustment and smoothing were performed
using the Spectracalc software package GRAMS (Galactic Industries Corporation, NH,
USA). Band component analysis was undertaken using the Jandel ‘Peakfit’ software package
that enabled the type of fitting function to be selected and allows specific parameters to be
fixed or varied accordingly. Band fitting was done using a Lorentzian-Gaussian cross-product
function with the minimum number of component bands used for the fitting process. The
Gaussian-Lorentzian ratio was maintained at values greater than 0.7 and fitting was
undertaken until reproducible results were obtained with squared correlations of r2 greater
than 0.995.
Results and discussion
Chemical characterization
The SEM image of kovdorskite sample studied in this work is presented as supplementary
information in Figure S1. Qualitative chemical analysis shows a homogeneous phase,
composed by P and Mg. No other cations were observed (please see Figure S2). The mineral
can be considered as a standard sample of kovdorskite.
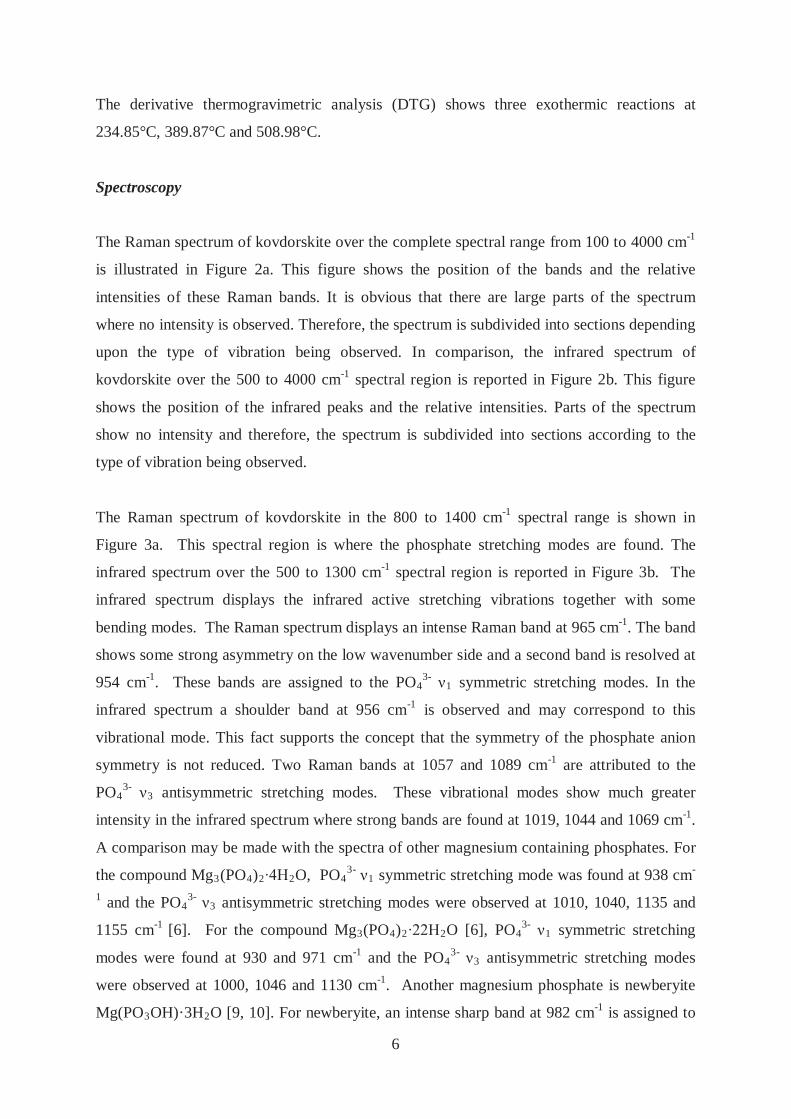
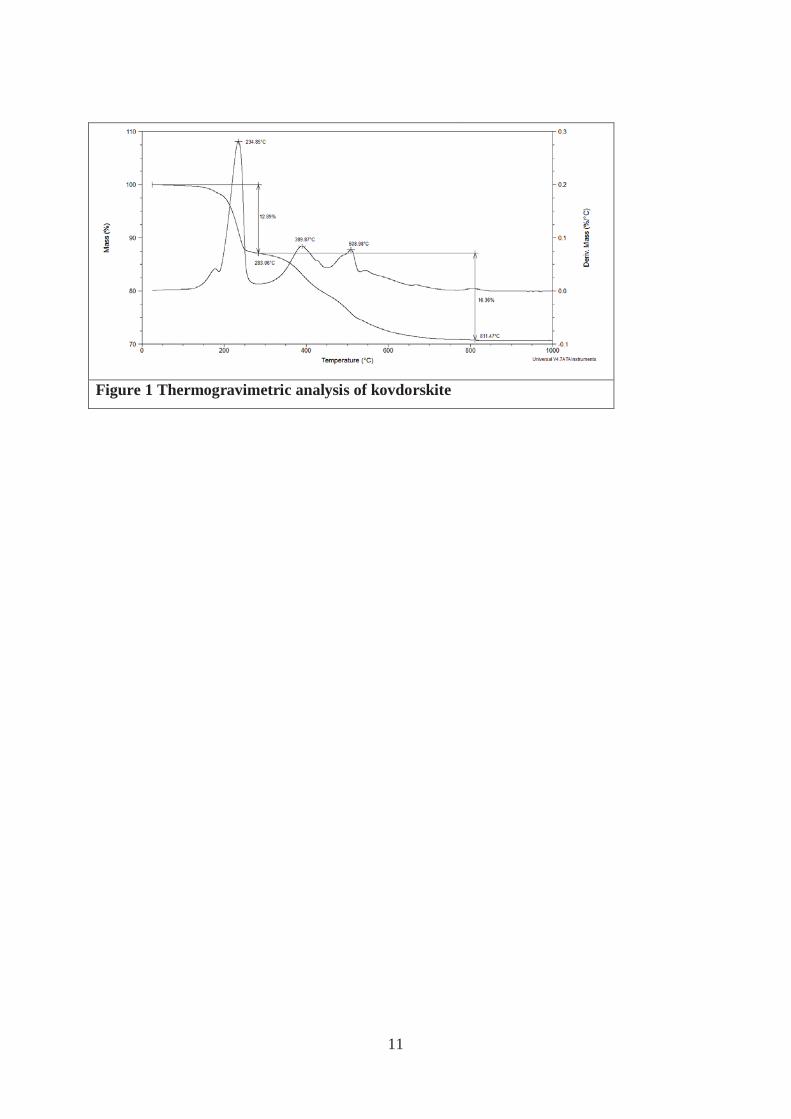
Thermogravimetric (TG) analyses were carried out to give support in the chemical
characterization. The TG curve is shown in Figure 1. Kovdorskite shows a total mass loss up
of 29.25%. This result is in agreement with chemical data published by Morrison et al. [4].
6
The derivative thermogravimetric analysis (DTG) shows three exothermic reactions at
234.85°C, 389.87°C and 508.98°C.
Spectroscopy
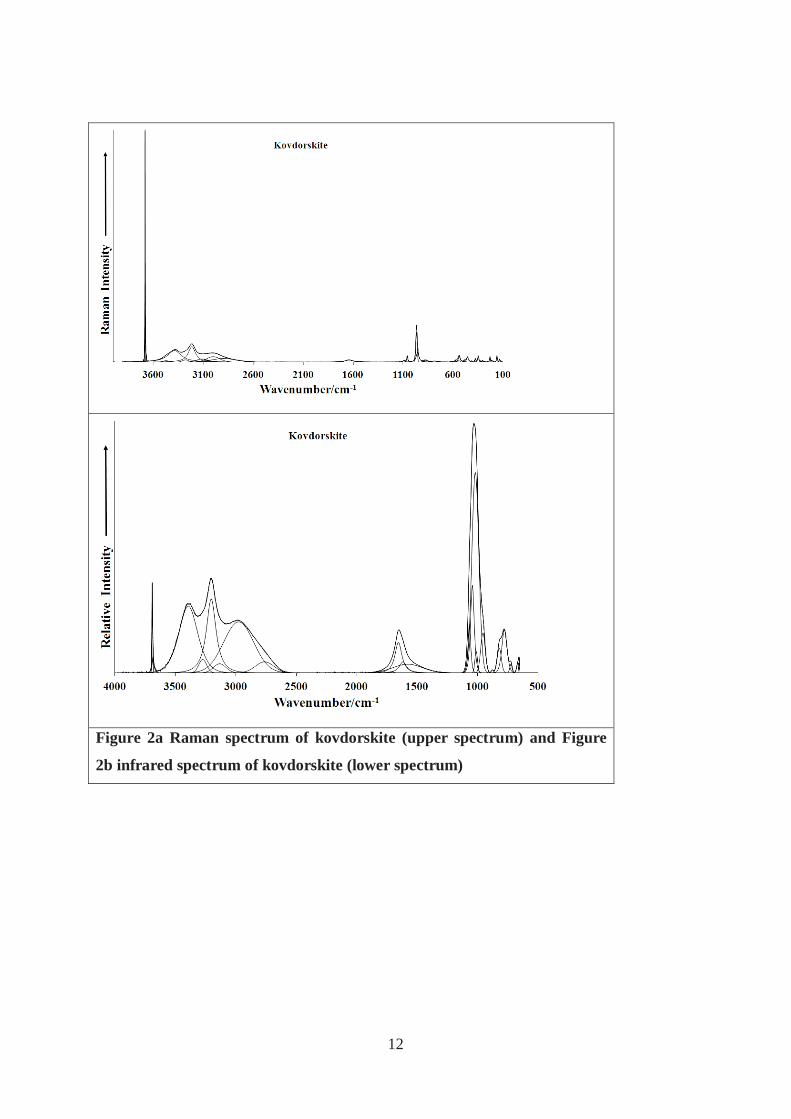
The Raman spectrum of kovdorskite over the complete spectral range from 100 to 4000 cm-1
is illustrated in Figure 2a. This figure shows the position of the bands and the relative
intensities of these Raman bands. It is obvious that there are large parts of the spectrum
where no intensity is observed. Therefore, the spectrum is subdivided into sections depending
upon the type of vibration being observed. In comparison, the infrared spectrum of
kovdorskite over the 500 to 4000 cm-1 spectral region is reported in Figure 2b. This figure
shows the position of the infrared peaks and the relative intensities. Parts of the spectrum
show no intensity and therefore, the spectrum is subdivided into sections according to the
type of vibration being observed.
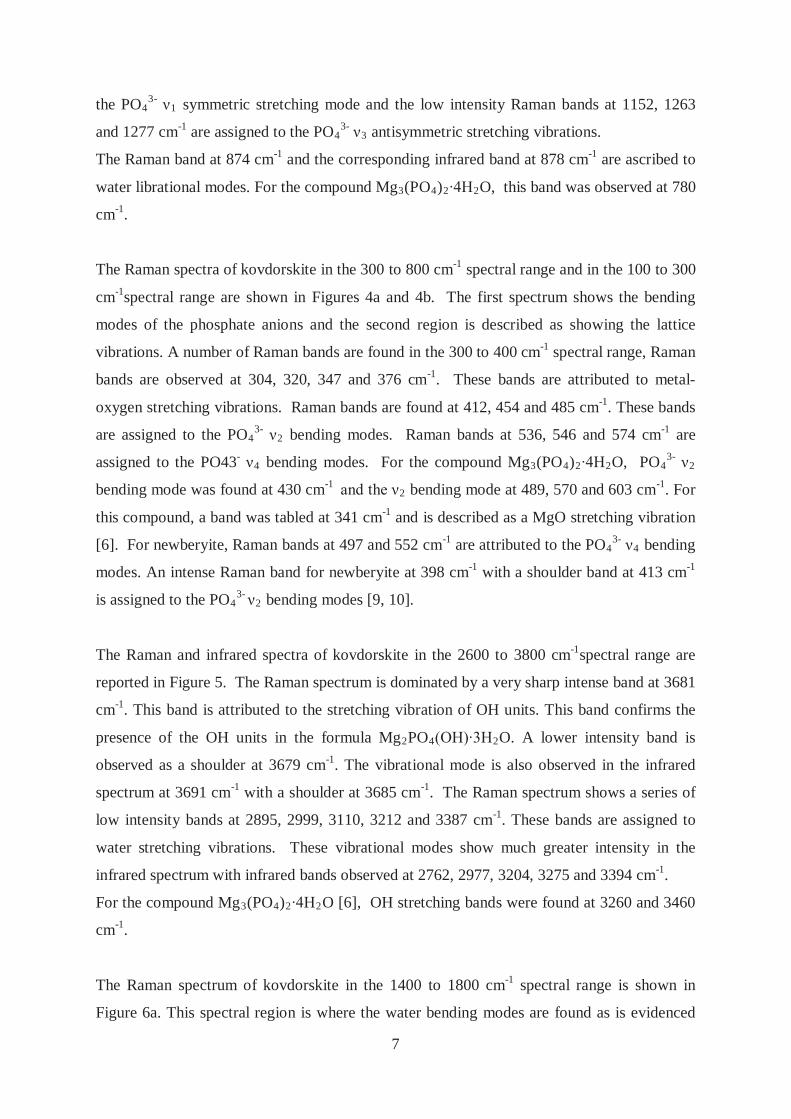
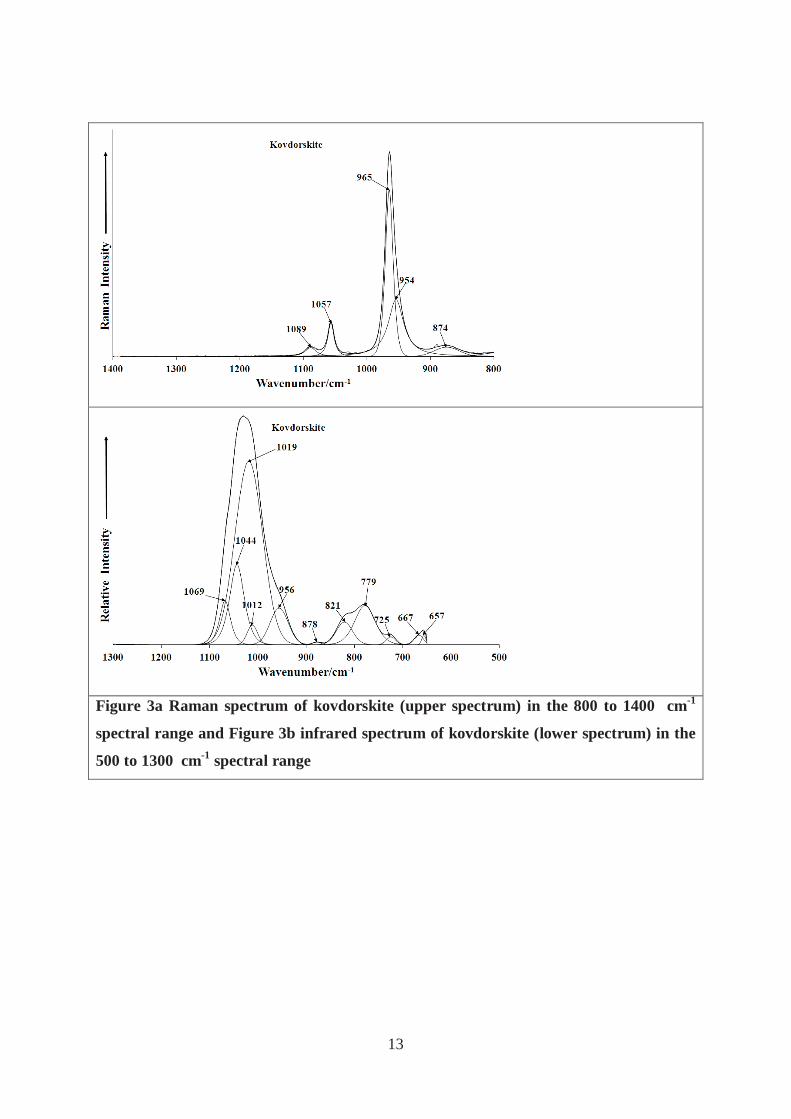
The Raman spectrum of kovdorskite in the 800 to 1400 cm-1 spectral range is shown in
Figure 3a. This spectral region is where the phosphate stretching modes are found. The
infrared spectrum over the 500 to 1300 cm-1 spectral region is reported in Figure 3b. The
infrared spectrum displays the infrared active stretching vibrations together with some
bending modes. The Raman spectrum displays an intense Raman band at 965 cm-1. The band
shows some strong asymmetry on the low wavenumber side and a second band is resolved at
954 cm-1. These bands are assigned to the PO43-
1 symmetric stretching modes. In the
infrared spectrum a shoulder band at 956 cm-1 is observed and may correspond to this
vibrational mode. This fact supports the concept that the symmetry of the phosphate anion
symmetry is not reduced. Two Raman bands at 1057 and 1089 cm-1 are attributed to the
PO43-
3 antisymmetric stretching modes. These vibrational modes show much greater
intensity in the infrared spectrum where strong bands are found at 1019, 1044 and 1069 cm-1.
A comparison may be made with the spectra of other magnesium containing phosphates. For
the compound Mg3(PO4)2 2O, PO43-
1 symmetric stretching mode was found at 938 cm-
1 and the PO43-
3 antisymmetric stretching modes were observed at 1010, 1040, 1135 and
1155 cm-1 [6]. For the compound Mg3(PO4)2 2O [6], PO43-
1 symmetric stretching
modes were found at 930 and 971 cm-1 and the PO43-
3 antisymmetric stretching modes
were observed at 1000, 1046 and 1130 cm-1. Another magnesium phosphate is newberyite
Mg(PO3OH)·3H2O [9, 10]. For newberyite, an intense sharp band at 982 cm-1 is assigned to
7
the PO43-
1 symmetric stretching mode and the low intensity Raman bands at 1152, 1263
and 1277 cm-1 are assigned to the PO43-
3 antisymmetric stretching vibrations.
The Raman band at 874 cm-1 and the corresponding infrared band at 878 cm-1 are ascribed to
water librational modes. For the compound Mg3(PO4)2 2O, this band was observed at 780
cm-1.
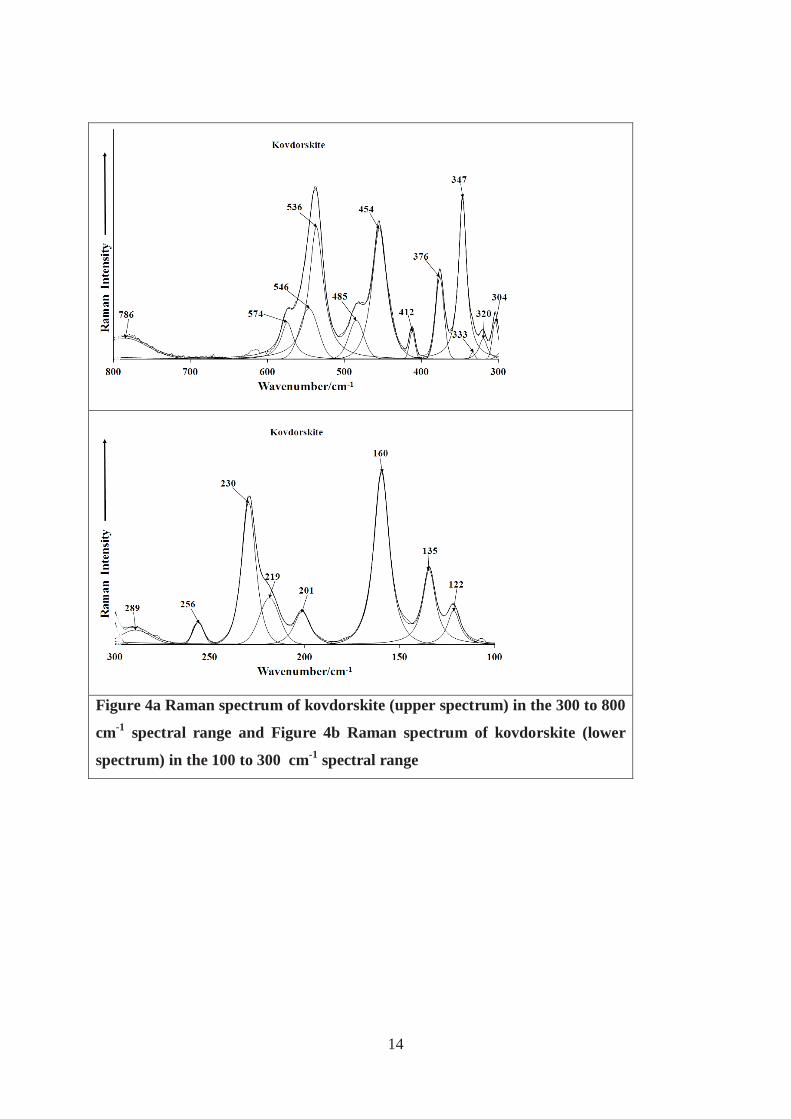
The Raman spectra of kovdorskite in the 300 to 800 cm-1 spectral range and in the 100 to 300
cm-1spectral range are shown in Figures 4a and 4b. The first spectrum shows the bending
modes of the phosphate anions and the second region is described as showing the lattice
vibrations. A number of Raman bands are found in the 300 to 400 cm-1 spectral range, Raman
bands are observed at 304, 320, 347 and 376 cm-1. These bands are attributed to metal-
oxygen stretching vibrations. Raman bands are found at 412, 454 and 485 cm-1. These bands
are assigned to the PO43-
2 bending modes. Raman bands at 536, 546 and 574 cm-1 are
assigned to the PO43-4 bending modes. For the compound Mg3(PO4)2 2O, PO4
3-2
bending mode was found at 430 cm-12 bending mode at 489, 570 and 603 cm-1. For
this compound, a band was tabled at 341 cm-1 and is described as a MgO stretching vibration
[6]. For newberyite, Raman bands at 497 and 552 cm-1 are attributed to the PO43-
4 bending
modes. An intense Raman band for newberyite at 398 cm-1 with a shoulder band at 413 cm-1
is assigned to the PO43-
2 bending modes [9, 10].
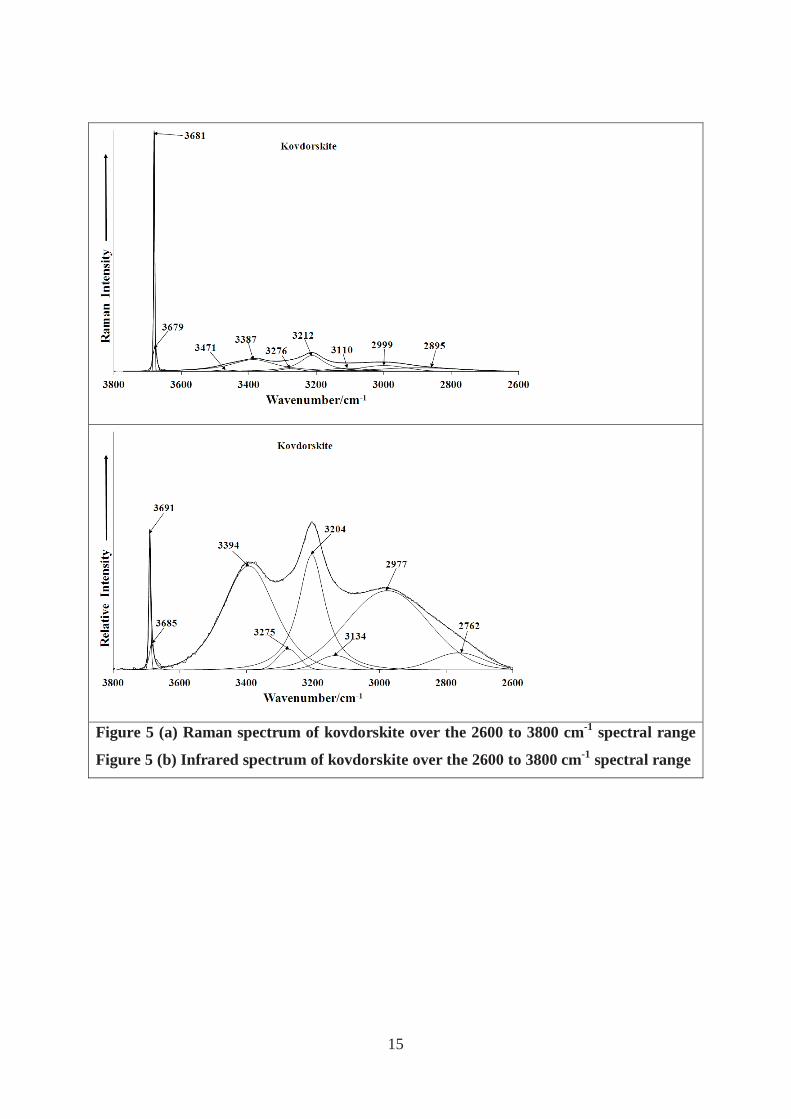
The Raman and infrared spectra of kovdorskite in the 2600 to 3800 cm-1spectral range are
reported in Figure 5. The Raman spectrum is dominated by a very sharp intense band at 3681
cm-1. This band is attributed to the stretching vibration of OH units. This band confirms the
presence of the OH units in the formula Mg2PO4 2O. A lower intensity band is
observed as a shoulder at 3679 cm-1. The vibrational mode is also observed in the infrared
spectrum at 3691 cm-1 with a shoulder at 3685 cm-1. The Raman spectrum shows a series of
low intensity bands at 2895, 2999, 3110, 3212 and 3387 cm-1. These bands are assigned to
water stretching vibrations. These vibrational modes show much greater intensity in the
infrared spectrum with infrared bands observed at 2762, 2977, 3204, 3275 and 3394 cm-1.
For the compound Mg3(PO4)2 2O [6], OH stretching bands were found at 3260 and 3460
cm-1.
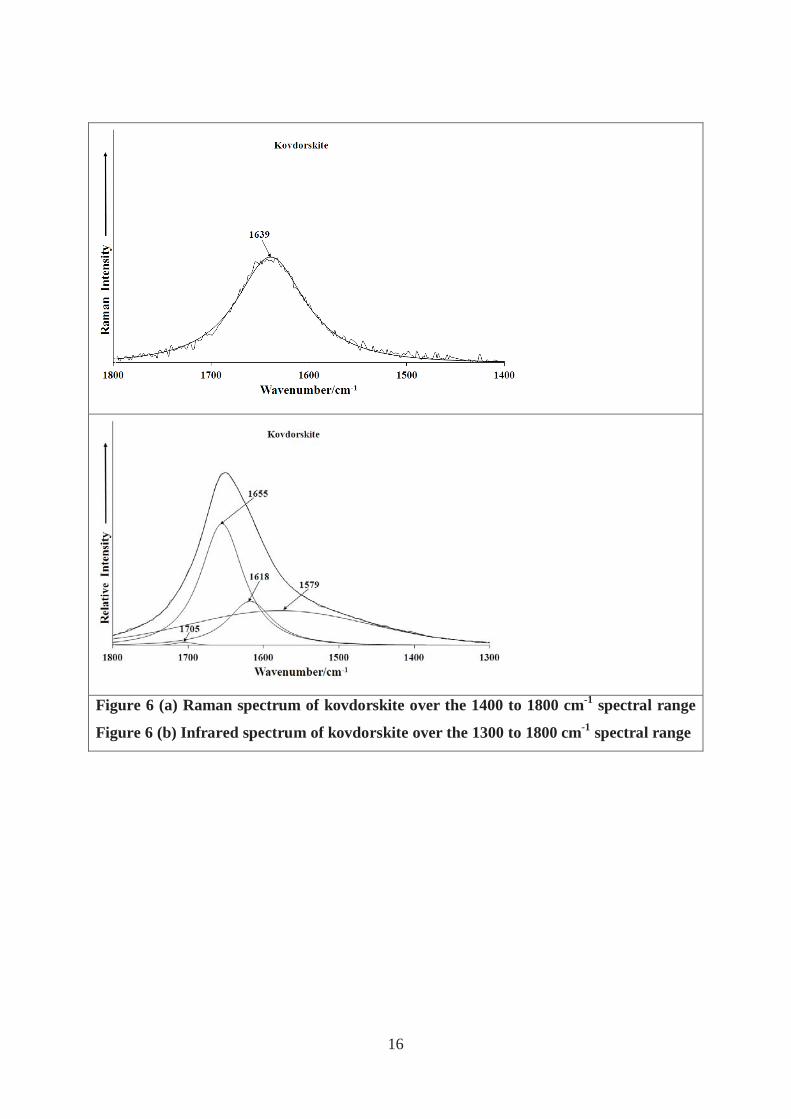
The Raman spectrum of kovdorskite in the 1400 to 1800 cm-1 spectral range is shown in
Figure 6a. This spectral region is where the water bending modes are found as is evidenced
8
by the low intensity Raman band at 1639 cm-1. The position of this band gives an indication
that the water in the kovdorskite structure is strongly hydrogen bonded. The infrared
spectrum of kovdorskite in the 1300 to 1800 cm-1 spectral range is reported in Figure 6b. The
spectrum shows overlapping bands at 1618 and 1655 cm-1 with broad bands at 1579 and 1705
cm-1. The infrared band at 1655 cm-1 is assigned to the bending mode of water involved in
strong hydrogen bonding. The position and assignation of the band is in harmony with the
Raman band at 1639 cm-1.
The mineral has been written with the formula Mg5(PO4)2(CO3)(OH)2 2O). [see for
example http://webmineral.com/data/Kovdorskite.shtml] However, no evidence of any
carbonate bands was found in this research. Our research, based upon our results of
vibrational spectroscopy confirms the formula as Mg2PO4 2O.
Conclusions
We have studied the phosphate mineral kovdorskite Mg2PO4 2O. The SEM/EDS
analysis shows that the studied sample is composed by a single phase. The molecular
structure of the mineral has been assessed by vibrational spectroscopy. Raman spectroscopy
shows that the phosphate units are characterized by Raman bands at 965, 1057 and 1089 cm-1
which are typical of the phosphate anion. No bands attributable to hydrogen phosphate or
even dihydrogen phosphate units were found. No bands which could be attributed to
carbonate vibrations were found. Thus, the formula of the mineral is confirmed as
Mg2PO4 2O.
Acknowledgements
The financial and infra-structure support of the Discipline of Nanotechnology and Molecular
Science, Science and Engineering Faculty of the Queensland University of Technology, is
gratefully acknowledged. The Australian Research Council (ARC) is thanked for funding the
instrumentation. The authors would like to acknowledge the Center of Microscopy at the
Universidade Federal de Minas Gerais (http://www.microscopia.ufmg.br) for providing the
equipment and technical support for experiments involving electron microscopy. R. Scholz
thanks to FAPEMIG – Fundação de Amparo à Pesquisa do Estado de Minas Gerais, (grant
No. CRA - APQ-03998-10).
9
References
[1] M.E. Back, J.A. Mandarino, Fleischer`s glossary of mineral species, Mineralogical Record, 2008.
[2] Y.L. Kapustin, A.V. Bykova, Z.V. Pudovkina, Zap. Vses. Min. Obs. 109 (1980) 341-347.
[3] V.E. Ovchinnikov, L.P. Solov'eva, Z.V. Pudovkina, Y.L. Kapustin, N.V. Belov, Doklady Akad. Nauk. 255 (1980) 351-354 .
[4] S.M. Morrison, R.T. Downs, H. Yang, Acta Crystallog. E68 (2012) i12-i13.
[5] E.V. Ponomareva, N.I. Krasnova, Zap. Vses. Min. Obs. 119 (1990) 92-100.
[6] V.C. Farmer, Mineralogical Society Monograph 4: The Infrared Spectra of Minerals, published by the Mineralogical Society, London, 1974.
[7] M.J. Lee, J.I. Lee, S.D. Hur, Y. Kim, J. Moutte, E. Balaganskaya, Lithos, 91 (2006) 250-261.
[8] A. Zaitsev, K. Bell, Contr. Min. Petr. 121 (1995) 324-335.
[9] R.L. Frost, S.J. Palmer, R.E. Pogson, Spectrochim. Acta, A79 (2011) 1149-1153.
[10] R.L. Frost, M.L. Weier, W.N. Martens, D.A. Henry, S.J. Mills, Spectrochim. Acta, 62A (2005) 181-188.
10
List of Figures
Figure 1 Thermogravimetric analysis of kovdorskite.
Figure 2 (a) Raman spectrum of kovdorskite over the 100 to 4000 cm-1 spectral range
(b) Infrared spectrum of kovdorskite over the 500 to 4000 cm-1 spectral range
Figure 3 (a) Raman spectrum of kovdorskite over the 800 to 1400 cm-1 spectral range
(b) Infrared spectrum of kovdorskite over the 500 to 1300 cm-1 spectral range
Figure 4 (a) Raman spectrum of kovdorskite over the 300 to 800 cm-1 spectral range (b)
Raman spectrum of kovdorskite over the 100 to 300 cm-1 spectral range
Figure 5 (a) Raman spectrum of kovdorskite over the 2600 to 3800 cm-1 spectral range
(b) Infrared spectrum of kovdorskite over the 2600 to 3800 cm-1 spectral range
Figure 6 (a) Raman spectrum of kovdorskite over the 1400 to 1800 cm-1 spectral range
(b) Infrared spectrum of kovdorskite over the 1300 to 1800 cm-1 spectral range
11
Figure 1 Thermogravimetric analysis of kovdorskite
12
Figure 2a Raman spectrum of kovdorskite (upper spectrum) and Figure
2b infrared spectrum of kovdorskite (lower spectrum)
13
Figure 3a Raman spectrum of kovdorskite (upper spectrum) in the 800 to 1400 cm-1
spectral range and Figure 3b infrared spectrum of kovdorskite (lower spectrum) in the
500 to 1300 cm-1 spectral range
14
Figure 4a Raman spectrum of kovdorskite (upper spectrum) in the 300 to 800
cm-1 spectral range and Figure 4b Raman spectrum of kovdorskite (lower
spectrum) in the 100 to 300 cm-1 spectral range
15
Figure 5 (a) Raman spectrum of kovdorskite over the 2600 to 3800 cm-1 spectral range
Figure 5 (b) Infrared spectrum of kovdorskite over the 2600 to 3800 cm-1 spectral range
16
Figure 6 (a) Raman spectrum of kovdorskite over the 1400 to 1800 cm-1 spectral range
Figure 6 (b) Infrared spectrum of kovdorskite over the 1300 to 1800 cm-1 spectral range

17

We have studied the mineral kovdorskite Mg2PO4 2O by electron microscopy
and vibrational spectroscopy.
A comparison of the vibrational spectroscopy of kovdorskite is made with other
magnesium bearing phosphate minerals and compounds.
Electron probe analysis proves the mineral is very pure.
The Raman spectrum is characterised by a band at 965 cm-1 attributed to the PO43-
1
symmetric stretching mode.
Vibrational spectroscopy shows that no carbonate bands are present
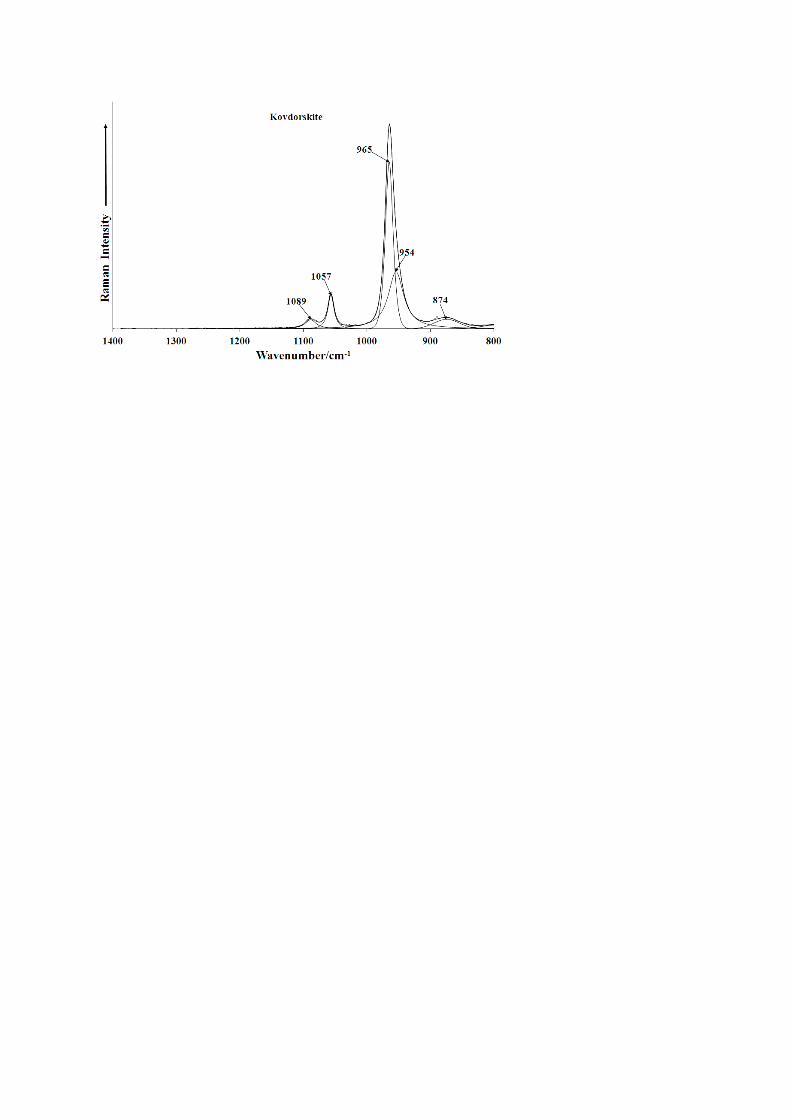
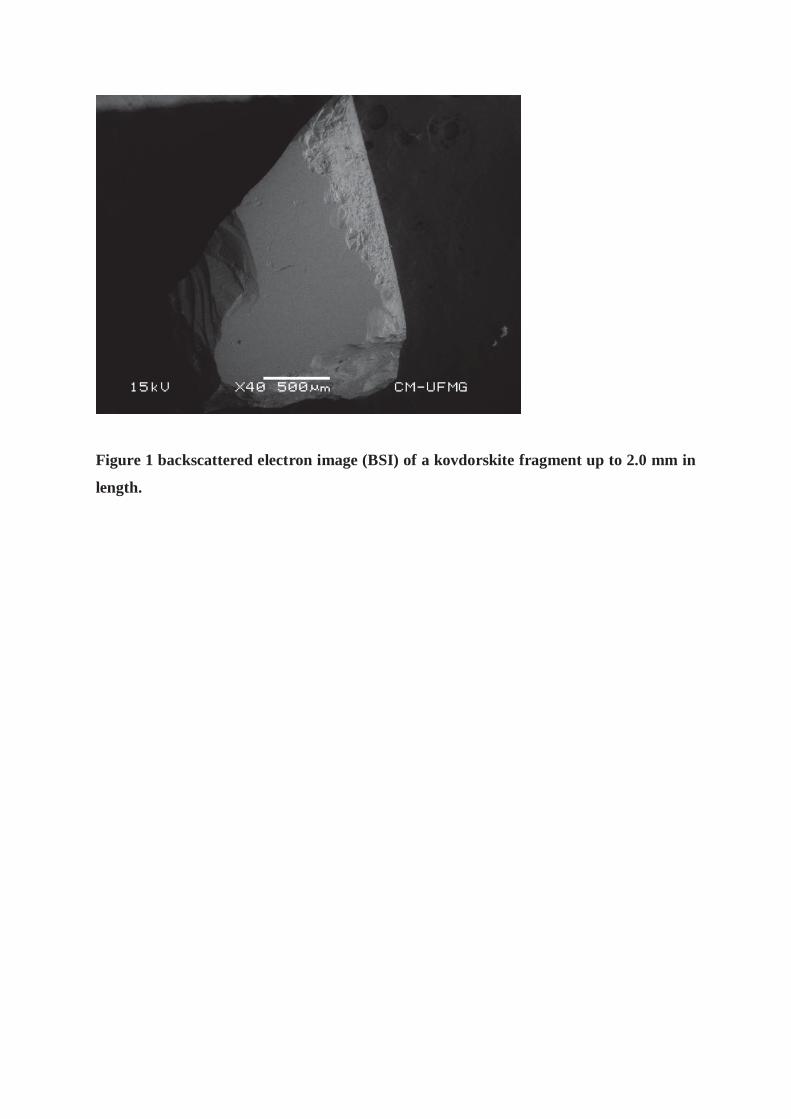
Figure 1 backscattered electron image (BSI) of a kovdorskite fragment up to 2.0 mm in
length.
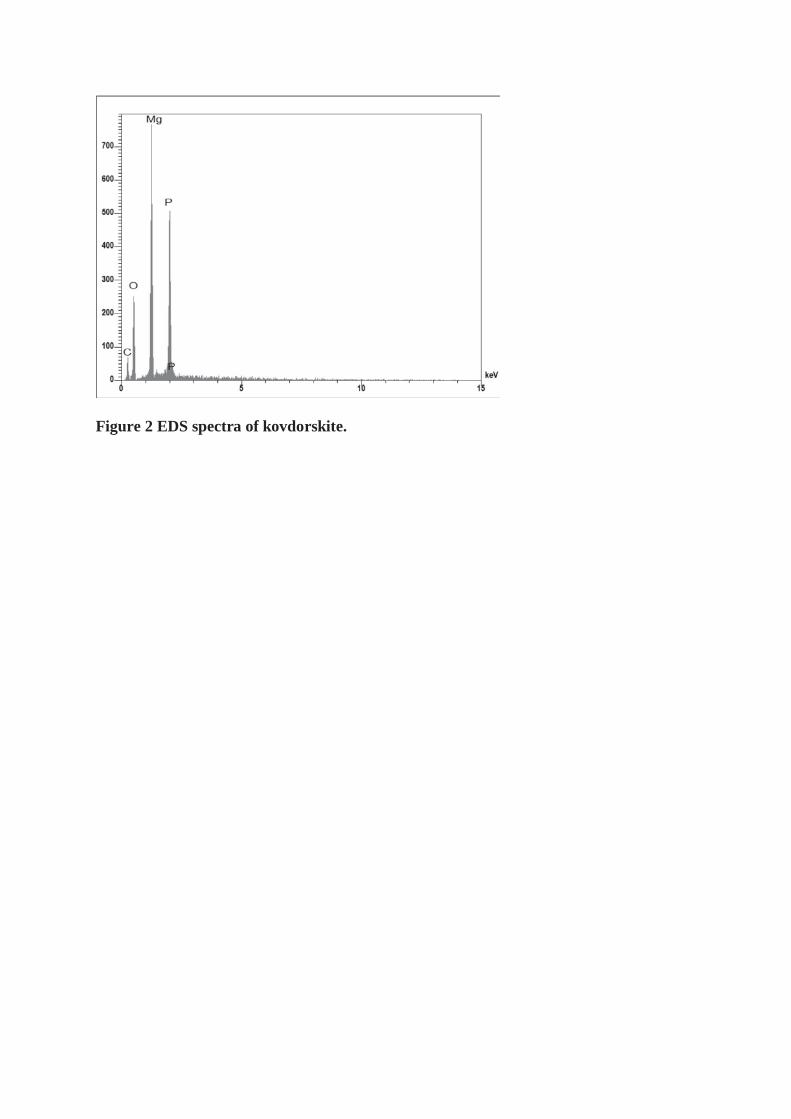
Figure 2 EDS spectra of kovdorskite.

Figure S1 backscattered electron image (BSI) of a kovdorskite fragment up to 2.0 mm
in length.
Figure S2 EDS spectra of kovdorskite.


![About ergodicity in the family of limac¸on billiards · ergodic billiards see [18] or in the standard map with large parameter see [19]. However, we cannot rule out that ergodicity](https://img.pdfslide.us/doc/110x75/5b4bc6777f8b9a9a408b4f62/about-ergodicity-in-the-family-of-limacon-billiards-ergodic-billiards-see.jpg)

![About ergodicity in the family of limac¸on billiards · 2018. 10. 31. · where ε∈ [0,1] is the family parameter. This family of billiards has received a lot of attention, especially](https://img.pdfslide.us/doc/110x75/60a9e8fc25f75d01af78b132/about-ergodicity-in-the-family-of-limacon-billiards-2018-10-31-where-a.jpg)