Embed Size (px)
Citation preview
VIBRATION STUDY FOR CONSOLIDATION OF
PORTLAND CEMENT CONCRETE
Final Report For
MLR-95-4
MARCH 1999
Project Development Division
l!la Iowa Department 'ill of Transportation
r
Vibration Study for Consolidation of Portland Cement Concrete
Final Report for Iowa DOT
Research Project MLR-95-4
By
Shane Tymkowicz, P .E. Northwest Iowa Transportation Center Materials Engineer
Phone 712-276-0933 Fax 712-276-2822
Northwest Iowa Transportation Center Iowa Department of Transportation
Sioux City, Iowa 50010
Robert Steffes Assistant to the Research Engineer
Phone 515-239-1392 Fax 515-239-1092 Office of Materials
Project Development Division Iowa Department of Transportation
Ames, Iowa 50010
March 1999

DISCLAIMER
The contents of this report reflect the views of the authors and do not necessarily reflect the official views of the Iowa Department of Transportation. This report does not constitute any standard, specification or regulation.
TECHNICAL REPORT DOCUMENTATION PAGE
1. REPORT NO.
MLR-95-4
3. TITLE & SUBTITLE
Vibration Study for Consolidation of Portland Cement Concrete
5. AUTHOR(S)
Shane Tymkowicz NWITC Materials Engineer
and Robert Steffes Assistant to the Research Engineer
2. REPORT DATE
March 1999
4. TYPE OF REPORT & PERIOD COVERED
Final Report, September 95 to March 99
6. PERFORMING ORGANIZATION ADDRESS
Iowa Department of Transportation Materials Department 800 Lincoln Way Ames, Iowa 500 IO
7. ACKNOWLEDGMENT OF COOPERATING ORGANIZATIONS
8. ABSTRACT
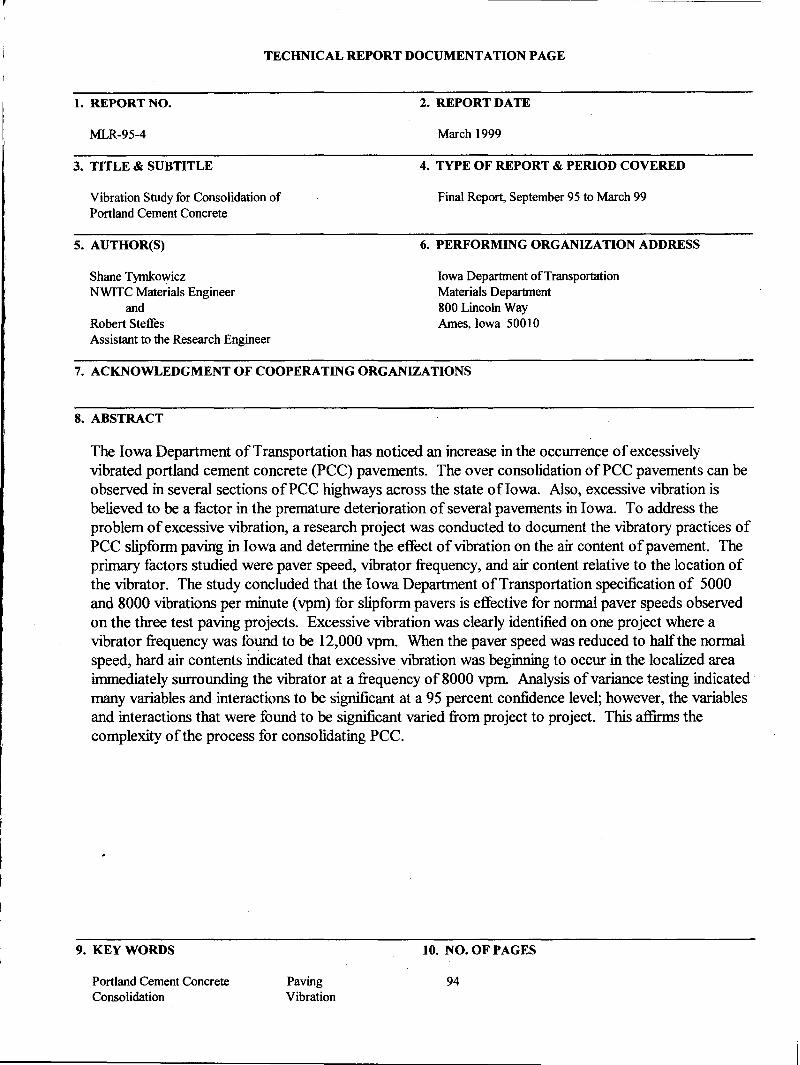
The Iowa Department of Transportation has noticed an increase in the occurrence of excessively vibrated portland cement concrete (PCC) pavements. The over consolidation of PCC pavements can be observed in several sections of PCC highways across the state oflowa. Also, excessive vibration is believed to be a factor in the premature deterioration of several pavements in Iowa. To address the problem of excessive vibration, a research project was conducted to document the vibratory practices of PCC slipform paving in Iowa and determine the effect of vibration on the air content of pavement. The primary factors studied were paver speed, vibrator frequency, and air content relative to the location of the vibrator. The study concluded that the Iowa Department of Transportation specification of 5000 and 8000 vibrations per minute (vpm) for slipform pavers is effective for normal paver speeds observed on the three test paving projects. Excessive vibration was clearly identified on one project where a vibrator frequency was found to be 12,000 vpm. When the paver speed was reduced to half the normal speed, hard air contents indicated that excessive vibration was beginning to occur in the localized area immediately surrounding the vibrator at a frequency of 8000 vpm. Analysis of variance testing indicated many variables and interactions to be significant at a 95 percent confidence level; however, the variables and interactions that were found to be significant varied from project to project. This affirms the complexity of the process for consolidating PCC.
9. KEYWORDS
Portland Cement Concrete Consolidation
Paving Vibration
10. NO. OF PAGES
94
TABLE OF CONTENTS
Introduction 1 Background Information 1
Portland Cement Concrete 1 Air Voids 2 Mechanics of Consolidation and Vibration 3 Methods of Measuring Vibrator Frequency 5 Slipform Pavers 6 Effect of Vibration on Air Content 7
Premature Pavement Failures in Iowa. 8 Purpose of Research 11 Experiment Design 11 Projects 13
Project A 14 Project B 15 Project C 15
Observed PCC Consolidation Practices 16 Vibrator Frequencies 16 Vibrator Positioning . 1 7
Results. 18 Visual Observations of Cores . 18 Iowa High Pressure Air Test 19 Raw Data 20 Project A2 20 ~~~ n Project B 23 Project C 24 Comparisons of All Projects 25
Phase II 27 Conclusions 27 Additional Research 28 Additional Developments 29 References 30 Appendix A, Figures . 33
Figure 1, Vibrating reed tachometer attached to steel rod 34 Figure 2, Longitudinal and joint cracking on US 20 in Webster County 35 Figure 3, Longitudinal crack on I-80 in Dallas Count~ 36 Figure 4, Vibrator trail in the pavement surface on US 65 in Polk County 37 Figure 5, Distortion of pavement surface in a vibrator trail . 38 Figure 6, Longitudinal distortion in the surface of a diamond ground pavement 39 Figure 7, Aggregate separation in vibrator trail of a diamond ground pavement 40 Figure 8, Location of cores relative to vibrator trails . 41
Figure 9, Variation in elevation of vibrators relative to paver pan 42 Figure 10, Cores from project B showing aggregate segregation near the top 43 Figure 11, Cores from project C revealing a vibrator trail 44
Appendix B, Tables . 45 Table 1, Experimental Design. 46 Table 2, Paver and Project Data 47 Table 3, Descriptive Statistics of Entrained Air for Project A2 48 Table 4, ANOV A for Project A2 49 Table 5, Descriptive Statistics of Entrained Air for Project A3 50 Table 6, ANOV A for Project A3 51 Table 7, Descriptive Statistics of Entrained Air for Project B 52 Table 8, ANOV A for Project B 53 Table 9, Average Entrained Air Contents by Treatment for Project C 54 Table 10, Average Entrained Air Contents for the Top of the Cores In Project C 55 Table 11, Descriptive Statistics of Entrained Air for Project Cat 8000 vpm. 56 Table 12, ANOV A for Project C at 8000 vpm 57 Table 13, Entrained Air Content Sorted by VPM and Portion of Core for Slow
Paver Speed on Project C . 58 Table 14, 95 Percent Probability of Significance for All Projects 59
Appendix C, Graphs . 61 Graph 1, Average entrained air content by variable for project A2 62 Graph 2, Interactions of variables for project A2 63 Graph 3, Average entrained air content by variable for project A3 64 Graph 4, Interactions of variables for project A3 65 Graph 5, Average entrained air content by variable for project B 66 Graph 6, Interactions of variables for project C 67 Graph 7, Average entrained air for portion 1 of project Cat 8000 vpm 68 Graph 8, Average entrained air contents for portion 2 of project C 69
Appendix D, Test Methods 71 Iowa DOT High Pressure Air Test 72 Vibra-tak TM • 79 Vibrating Reed Tachometer 80
Appendix E, Raw Data 85 Summary of Core Data · 86 Summary of High Pressure Air Testing 91
1
INTRODUCTION
Portland cement concrete has provided durable highway pavements for decades in the state of
Iowa. When properly designed and constructed, the expected service life is 40 years according to
Iowa DOT design standards. In some cases a PCC pavement may suffer premature deterioration
due to poor design, materials, or construction procedures.
Excessive vibration of PCC during placement can lead to premature deterioration in a portland
cement concrete pavement. Excessive vibration of PCC will cause coarse aggregate to segregate,
and it will decrease the entrained air content of the concrete. The reduced entrained air content
compromises the air void system that protects the PCC from damage caused by the freezing and
thawing of moisture within the concrete. The air voids allow the pressures that develop during
the freezing of moisture within the concrete to be reduced (1, 19). The segregation of the PCC
may initiate abnormal cracking during the hydration of the cement (1). The cracking is caused by
differential drying shrinkage between areas of differing paste and aggregate contents.
BACKGROUND INFORMATION
This section covers some of the basic concepts of paving with portland cement concrete. These
concepts include the basics of PCC, consolidation, and slip form paving.
Portland Cement Concrete
Portland cement concrete is primarily a mixture of aggregate and paste. The aggregates are
usually separated into two classes. These classes are fine aggregate and coarse aggregate. The
2
paste is composed primarily of portland cement, water, and mineral admixtures. The cement
paste for Iowa DOT pavement mixes is approximately one third of the total concrete mix by
volume (2). Portland cement is a hydraulic cement that hardens by reacting with water. Thus the
paste acts like a glue by binding together the aggregate in the PCC.
The fine aggregates are sometimes referred to as the sand portion of the PCC mix. The fine
aggregate is usually considered to be an aggregate whose gradation will pass through a 9.5 mm
(3/8 inch) sieve (1). The coarse aggregate is usually an aggregate with a gradation that is almost
completely retained on a 1.18 mm (number 16) sieve and has aggregate particles that normally
range up to a maximum size of25 or 38 mm (1 or 1 Yi inches) in nominal diameter (1).
Air Voids
The paste in the PCC will contain air voids. The air voids are separated into two classifications.
The classifications are entrapped air voids and entrained air voids. Entrapped air is generally
considered to have a diameter larger than 1 mm (0.04 inches) ( 1, 17). Entrapped air voids do not
provide adequate protection from freeze-thaw cycles. Entrapped air voids are actually
detrimental to the concrete, since they reduce the strength of the PCC (3). In addition they are a
potential reservoir for water that can later freeze inside the concrete. Entrained air voids are very
small in size. Entrained air ranges from 10 µm to 1000 µm (0.0004 to 0.04 inches) in diameter.
These bubbles significantly improve the resistance of concrete to freezing and thawing (1 ).
3
Entrained air is formed by the adding an air entraining agent to the portland cement concrete as it
is being mixed. The air entraining agent is a surfactant that helps to stabilize the microscopic
bubbles that form during mechanical mixing of PCC. Uniform dispersion of the entrained air is
important for effective resistance to freeze-thaw cycles (1,19). Without an air entraining agent
portland cement concrete will only have an entrained air content of approximately 1.5 percent
(1). For environments that are subjected to numerous freeze-thaw cycles an entrained air content
of about 6 percent is desired in the hardened concrete. The desired air content is determined by
severity of exposure, availability of water, use of deicing chemicals, and the nominal maximum
aggregate size ( 1 ).
Mechanics of Consolidation and Vibration
Consolidation of PCC is the removal of entrapped air voids by hand or mechanical methods.
Most mechanical methods utilize some form of vibratory energy. In nearly all large PCC
operations mechanical vibrators are used for consolidation. Vibration can be either internally or
externally applied to the PCC.
Slipform pavers use internal vibrators to consolidate concrete. Internal vibrators are immersed in
the concrete and consolidate by direct physical contact with the plastic concrete (4). Internal
vibrators have an external housing that protects a rotating eccentric weight. This eccentric
weight causes the vibrator to rotate in a circular orbit. The amplitude or size of the orbit depends
on the total weight of the vibrator, the weight of the eccentric, the frequency of the vibrator, and
the eccentric weights moment (4, 5). The orbiting vibrator induces a simple harmonic wave to
4
the concrete.
The frequency of the vibrator is measured by the number of rotations of the eccentric weight per
minute. This frequency is termed vpm (vibrations per minute). The frequency effects the radius
of action of the vibrator. The radius of action is the distance from the vibrator that the vibrator
delivers enough force to reduce internal friction so entrapped air voids may be removed.
Generally the radius of action is increased as the frequency of the vibrator is increased (4).
Low slump concrete is required for slip form paving. This indicates a slump of less than three
inches when tested according to ASTM C 143 - 90a. Low slump concrete, as defined by
American Concrete Institute (ACI), tends to have an entrapped air content of 5 to 20 percent ( 4).
Consolidation by vibration attempts to remove the entrapped air. When plastic concrete is
vibrated, it passes through two stages. The first stage is the slumping of the concrete. The
harmonic vibration causes the particles to behave as a near liquid. This behavior is caused by the
reduction of internal friction in the concrete. During this stage the unstable mix becomes denser,
and it will flow as a viscous liquid to reach a lower level. The second stage is the deaeration of
the concrete. In this stage the entrapped air voids rise toward the surface of the concrete. The
concrete should be vibrated until nearly all of the entrapped air is released, this level of
consolidation usually will leave an entrapped air content of approximately 1.5 percent (10).
However, care should be taken not to excessively vibrate the concrete. Excessive vibration of the
concrete will cause the entrained air to be vibrated out of the mix. The effect of the vibration on
5
a mix is dependent on the vibrator frequency, amplitude, length of vibration time, and the
distance from the vibrator (5).
Most slipform pavers utilize a vibrator with a diameter of 50 to 90 mm (2 to 3 Yi inches) (4).
The force of the vibration is typically in the range of 3100 to 8900 N (700 to 2000 lbs) (4). All
vibrators observed on Iowa DOT projects during this research had a diameter of 60 mm (2 3/8
inches) and a centrifugal force of either 5560 or 7870 N (1250 or 1770 lbs) at 10000 vpm.
The American Concrete Institute recommends that vibrators of this size and eccentric moment
operate at a frequency of 8000 to 12000 vpm (4). This frequency range is intended to result in a
radius of action of 180 to 360 mm (7 to 14 inches). This size of vibrator is recommended for use
in stiff plastic concrete with a slump ofless than 80 mm (3 inches). The ACI recommends this
class of vibrators for slip form paving. There are some recommendations that these vibrators
should be used at a frequency of 6000 to 9000 vpm ( 15).
Methods of Measuring Vibrator Frequency
The vibrators on pavers do not have a device that indicates their frequency. Each vibrator is
controlled by a needle valve. The valve regulates the flow of hydraulic fluid that drives the
vibrator. However, these valves do not give a reliable indication of the vibrator's frequency. In
fact a valve may be set for maximum fluid flow, but the vibrator may not be vibrating if its
bearings or seals are worn out. Therefore, external means are required to monitor the frequencies
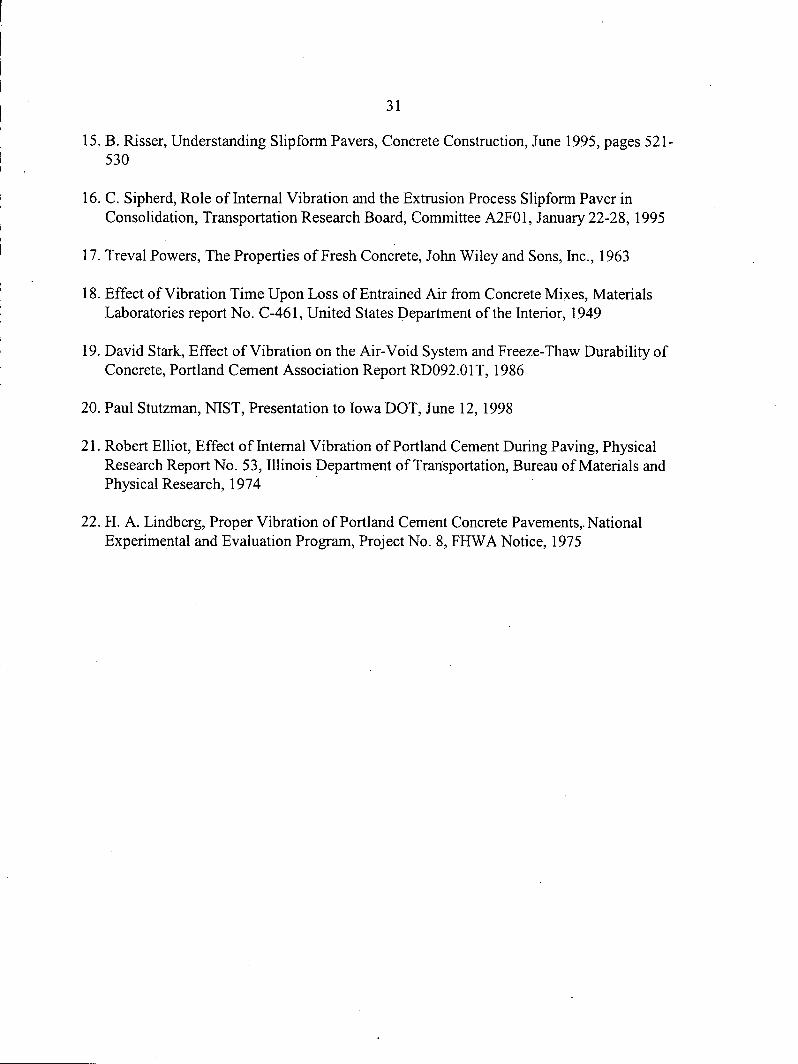
of vibrators. A vibrating reed can be used to determine the frequency of the vibrator. Two types
6
of reeds are commonly used. These are an adjustable single reed vibration indicator like a
"Vibra-tak™" (Appendix D), or a multiple reed vibration indicator like a "Standco™" vibrating
reed tachometer (Appendix D).
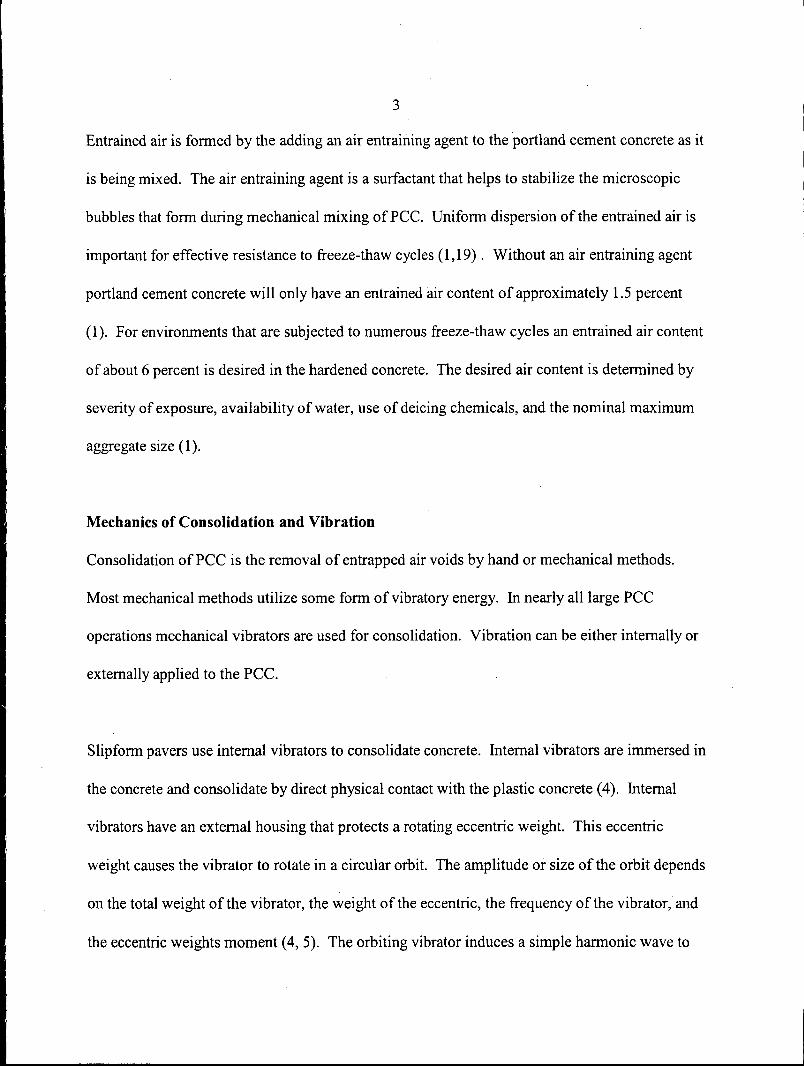
Neither type ofreed can be placed on the vibrator since the vibrator will be submerged in the
concrete. The vibrators amplitude is too large for continuous contact to be made between the
vibrator and a vibrating reed. Often these problems are overcome by using a rod attached to a
vibrating reed (Figure 1, Appendix A). The end of the rod is placed against the hydraulic hose or
on the protective covering of the hose near the vibrator. The hose has a much smaller amplitude,
and it vibrates with the same frequency as the vibrator it is attached to.
Currently, vibrator manufactures are experimenting with digital displays for vibrators. Some of
these prototype displays have already been field tested in Iowa, but they are not yet currently used
in normal paving operations.
Slipform Pavers
The slipform paver is an extrusion process for forming a concrete pavement. An example of
extrusion that everyone can relate to is toothpaste. When a tube of toothpaste is squeezed, the
toothpaste is extruded onto the tooth brush. The toothpaste is in the shape of the mold.
Pavement is molded in a similar manner with a slipform paver. However a pavement is much
larger and the concrete is much heavier than toothpaste, so more energy is required to extrude the
pavement.
7
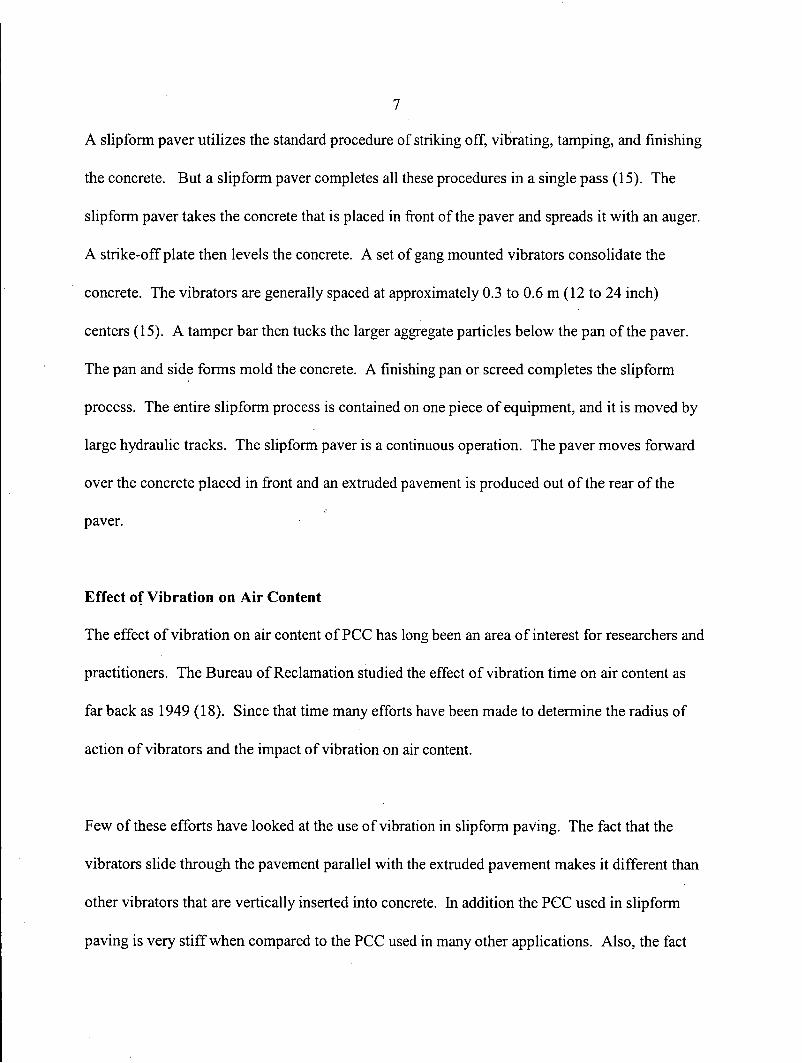
A slipform paver utilizes the standard procedure of striking off, vibrating, tamping, and finishing
the concrete. But a slip form paver completes all these procedures in a single pass ( 15). The
slip form paver takes the concrete that is placed in front of the paver and spreads it with an auger.
A strike-off plate then levels the concrete. A set of gang mounted vibrators consolidate the
concrete. The vibrators are generally spaced at approximately 0.3 to 0.6 m (12 to 24 inch)
centers (15). A tamper bar then tucks the larger aggregate particles below the pan of the paver.
The pan and side forms mold the concrete. A finishing pan or screed completes the slipform
process. The entire slipform process is contained on one piece of equipment, and it is moved by
large hydraulic tracks. The slipform paver is a continuous operation. The paver moves forward
over the concrete placed in front and an extruded pavement is produced out of the rear of the
paver.
Effect of Vibration on Air Content
The effect of vibration on air content of PCC has long been an area of interest for researchers and
practitioners. The Bureau of Reclamation studied the effect of vibration time on air content as
far back as 1949 (18). Since that time many efforts have been made to determine the radius of
action of vibrators and the impact of vibration on air content.
Few of these efforts have looked at the use of vibration in slipform paving. The fact that the
vibrators slide through the pavement parallel with the extruded pavement makes it different than
other vibrators that are vertically inserted into concrete. In addition the PCC used in slipform
paving is very stiff when compared to the PCC used in many other applications. Also, the fact
8
that there are many vibrators being used simultaneously makes slipform pavers a special case of
vibration. Some states such as Colorado (12), Kansas (13) and Illinois (21) initiated studies into
the impact of vibratory consolidation. The FHWA initiated a National Experimental and
Evaluation Program (NEEP) study of consolidation for slipform paving (22). However these
studies researched the density and relative strength of the concrete. The objective was to find out
how much vibration was required to obtain a desired strength or density. The exception to this
was the Illinois study. It suggested the possibility of segregation when a large vibratory force
was applied to the PCC (21 ). But the study still did not evaluate low entrained air conte~t as
part of the excessive vibration. Because of these early studies, paver manufactures began
building larger and more powerful pavers. This ensured that enough vibration energy could be
provided to consolidate the pavement.
The more is better approach is not always the best. A new problem emerged from these larger
pavers. The possibility of excessive consolidation now became the concern, rather than the lack
of consolidation (19). The excessive vibration usually resulted in the excessive removal of
entrained air voids and the segregation of the portland cement concrete mix.
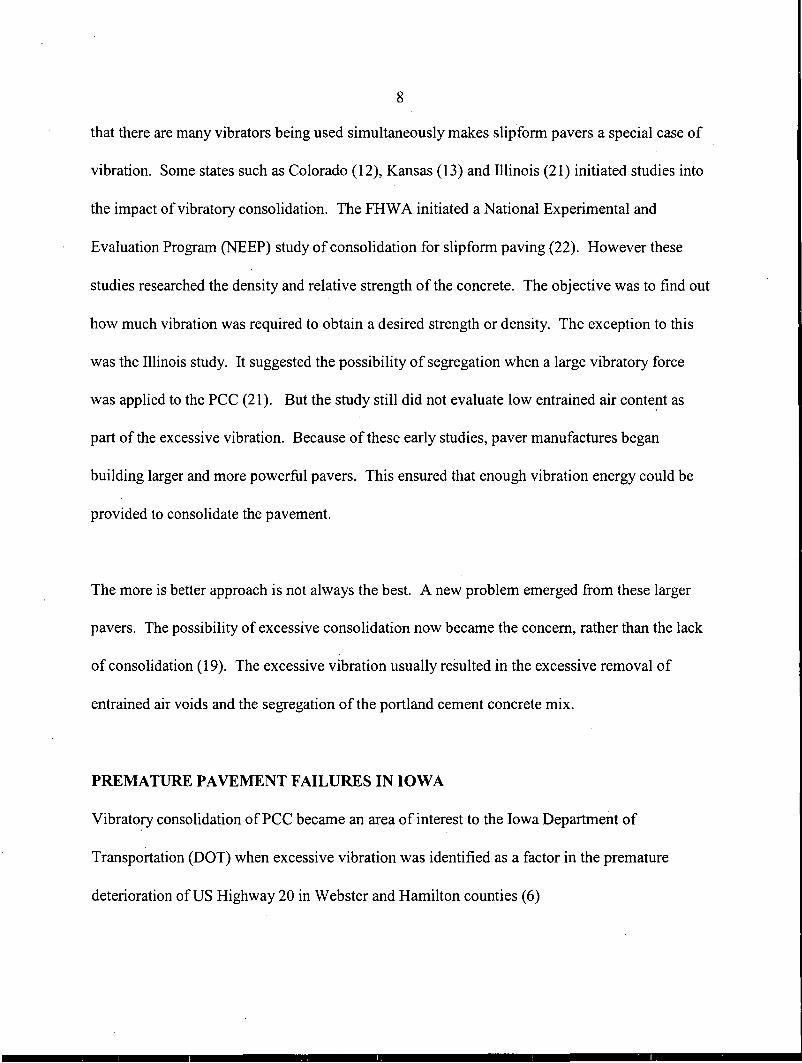
PREMATURE PAVEMENT FAILURES IN IOWA
Vibratory consolidation of PCC became an area of interest to the Iowa Department of
Transportation (DOT) when excessive vibration was identified as a factor in the premature
deterioration of US Highway 20 in Webster and Hamilton counties (6)
9
Deterioration of US 20 was initially noticed in May of 1990. The deterioration was unexpected
since the pavement was only three years old. The characteristics of the early stages of the
deterioration were similar to the staining and cracking associated with D-cracking. Initially the
cracks were tight and had dark stains. Investigators originally identified the primary source of
the deterioration as either ettrignite formation in the air voids or alkali-silica reactivity (7, 8).
Later work identified that the air void system may have been compromised (20). The
deterioration continued at a rapid rate. In 1998 the PCC pavement had to be resurfaced with
asphalt cement concrete because traffic was causing portions of the pavement to crumble, and
large areas of the pavement were completely map cracked.
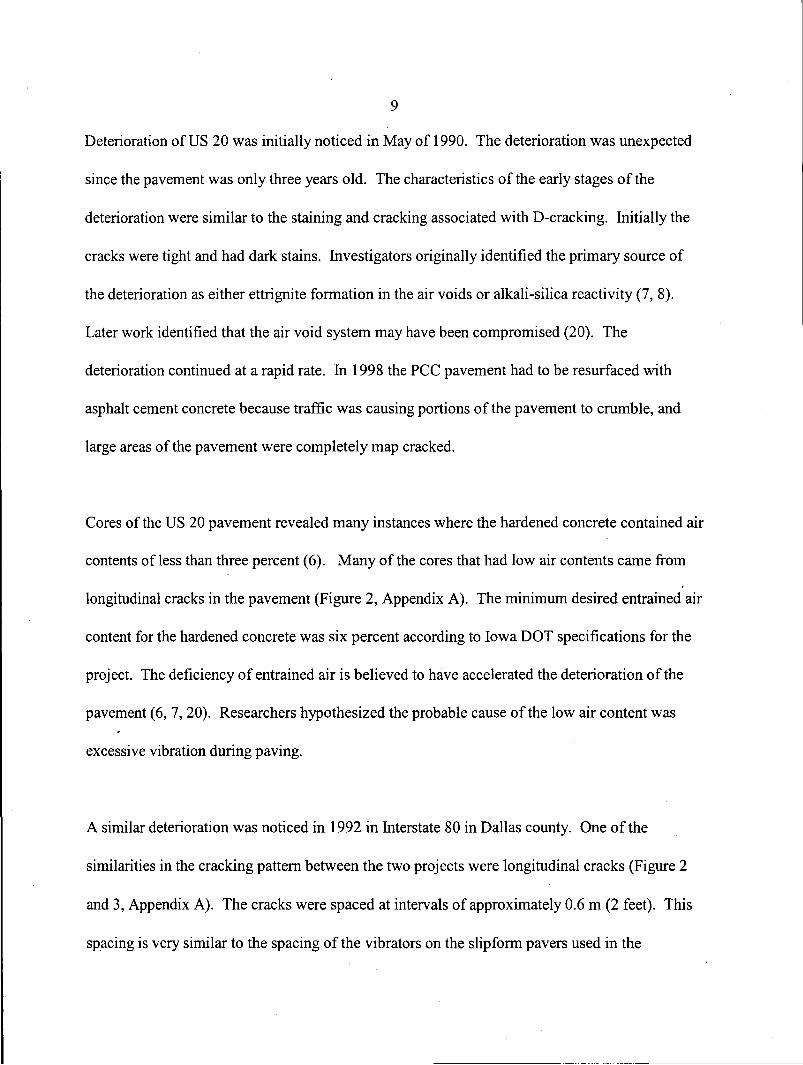
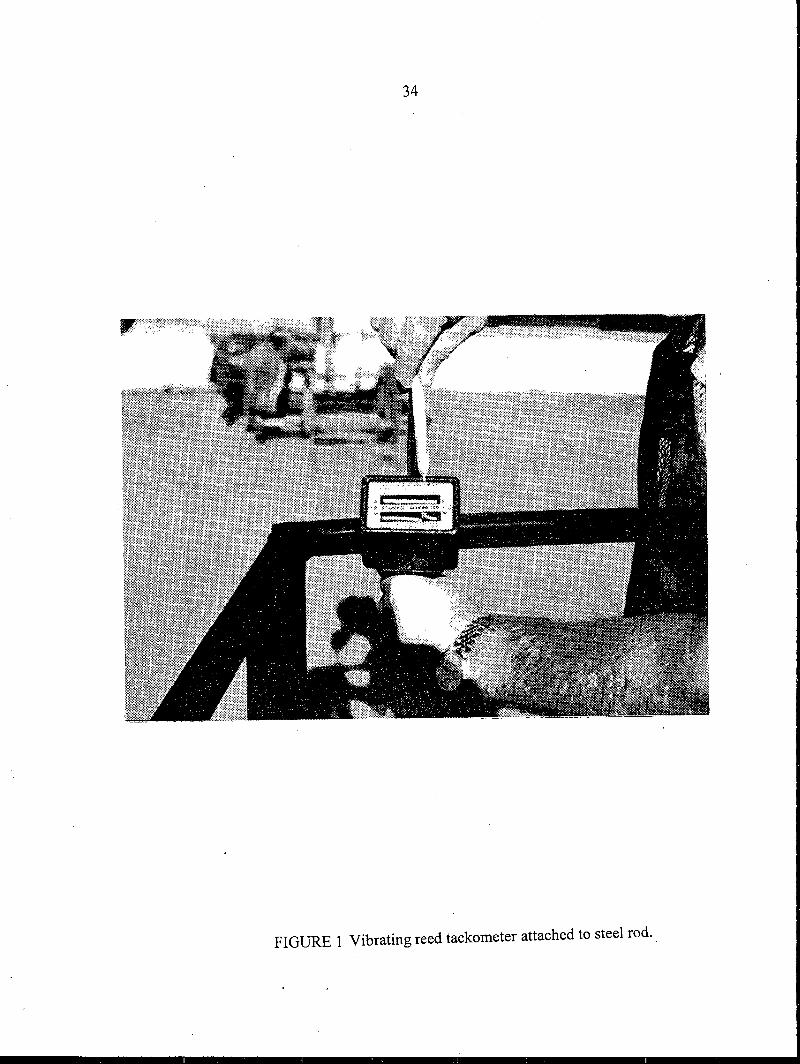
Cores of the US 20 pavement revealed many instances where the hardened concrete contained air
contents of less than three percent (6). Many of the cores that had low air contents came from
longitudinal cracks in the pavement (Figure 2, Appendix A). The minimum desired entrained air
content for the hardened concrete was six percent according to Iowa DOT specifications for the
project. The deficiency of entrained air is believed to have accelerated the deterioration of the
pavement (6, 7, 20). Researchers hypothesized the probable cause of the low air content was
excessive vibration during paving.
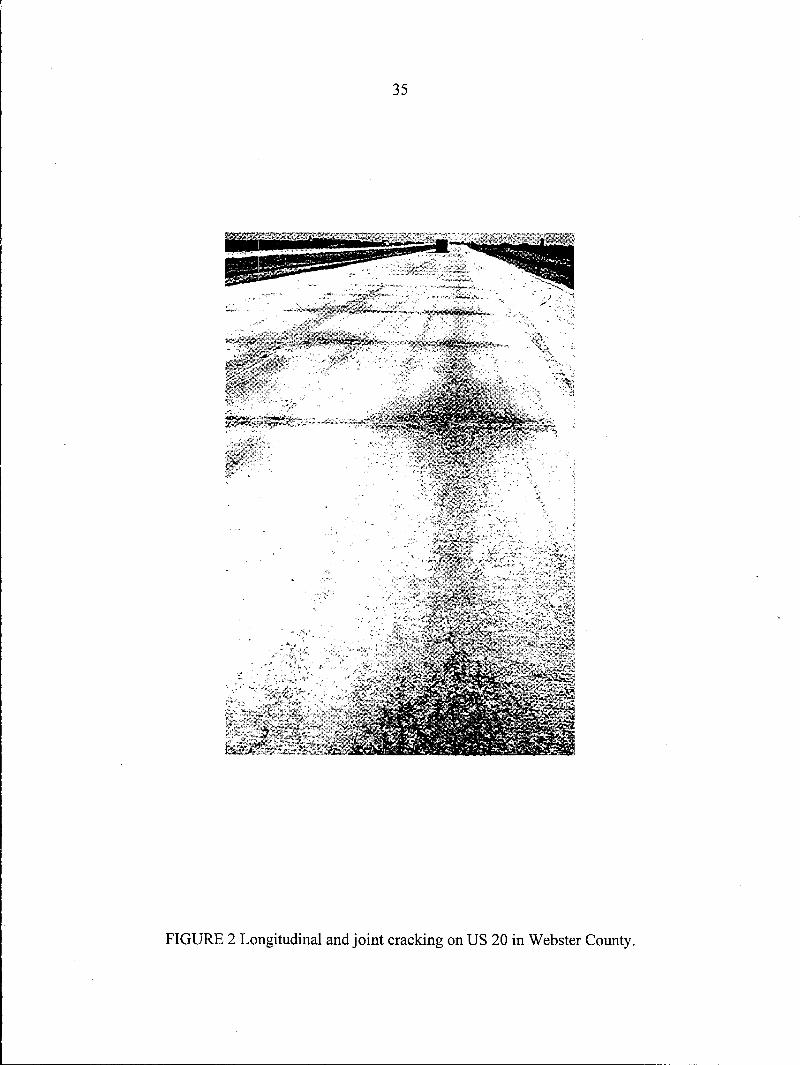
A similar deterioration was noticed in 1992 in Interstate 80 in Dallas county. One of the
similarities in the cracking pattern between the two projects were longitudinal cracks (Figure 2
and 3, Appendix A). The cracks were spaced at intervals of approximately 0.6 m (2 feet). This
spacing is very similar to the spacing of the vibrators on the slip form pavers used in the
10
construction of the PCC pavements. In Dallas county, cores taken from the longitudinal cracks
in the pavement contained entrained air contents of approximately of 3 percent in the top half,
and 6 percent in the bottom half (11 ). The longitudinal cracking pattern and the reduced air
content indicate the possibility of excessive vibration; since, the vibrators were positioned near
the surface of the pavement.
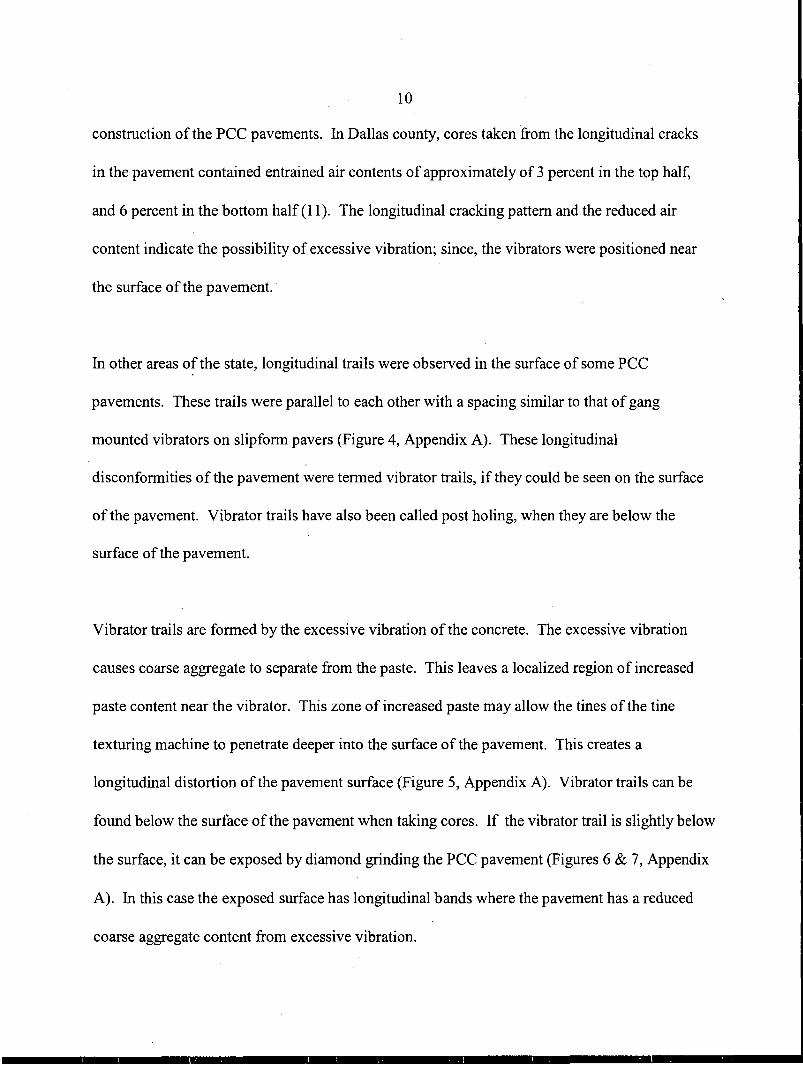
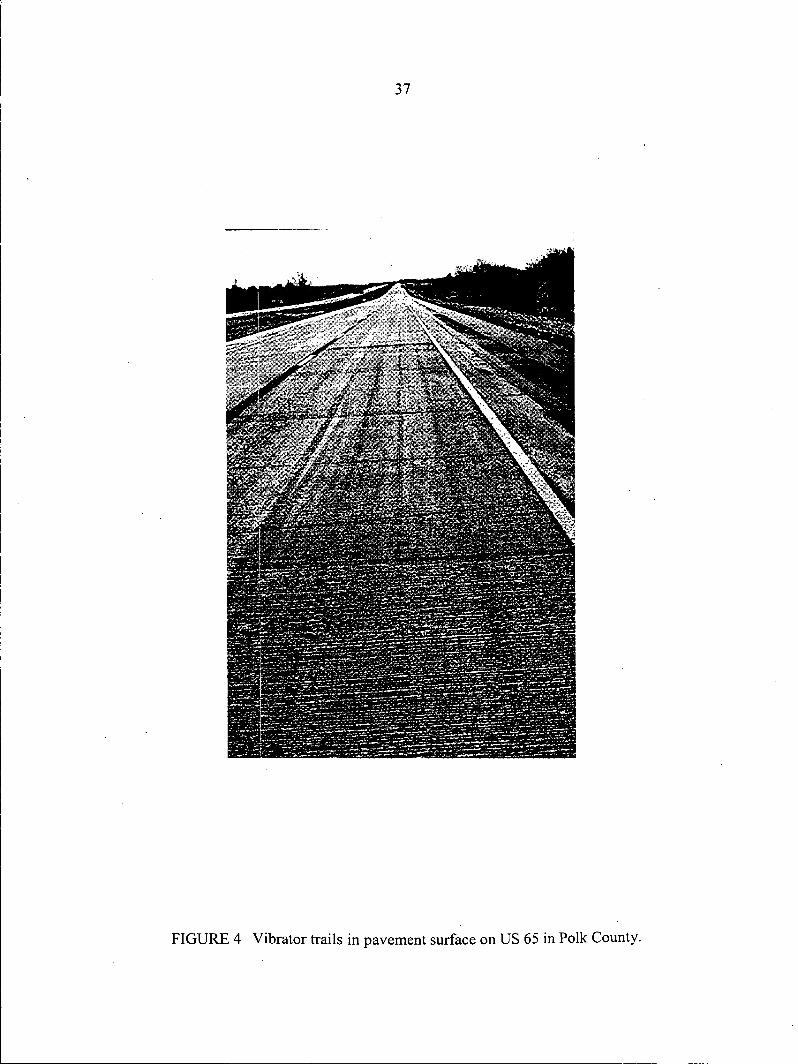
In other areas of the state, longitudinal trails were observed in the surface of some PCC
pavements. These trails were parallel to each other with a spacing similar to that of gang
mounted vibrators on slipform pavers (Figure 4, Appendix A). These longitudinal
disconformities of the pavement were termed vibrator trails, if they could be seen on the surface
of the pavement. Vibrator trails have also been called post holing, when they are below the
surface of the pavement.
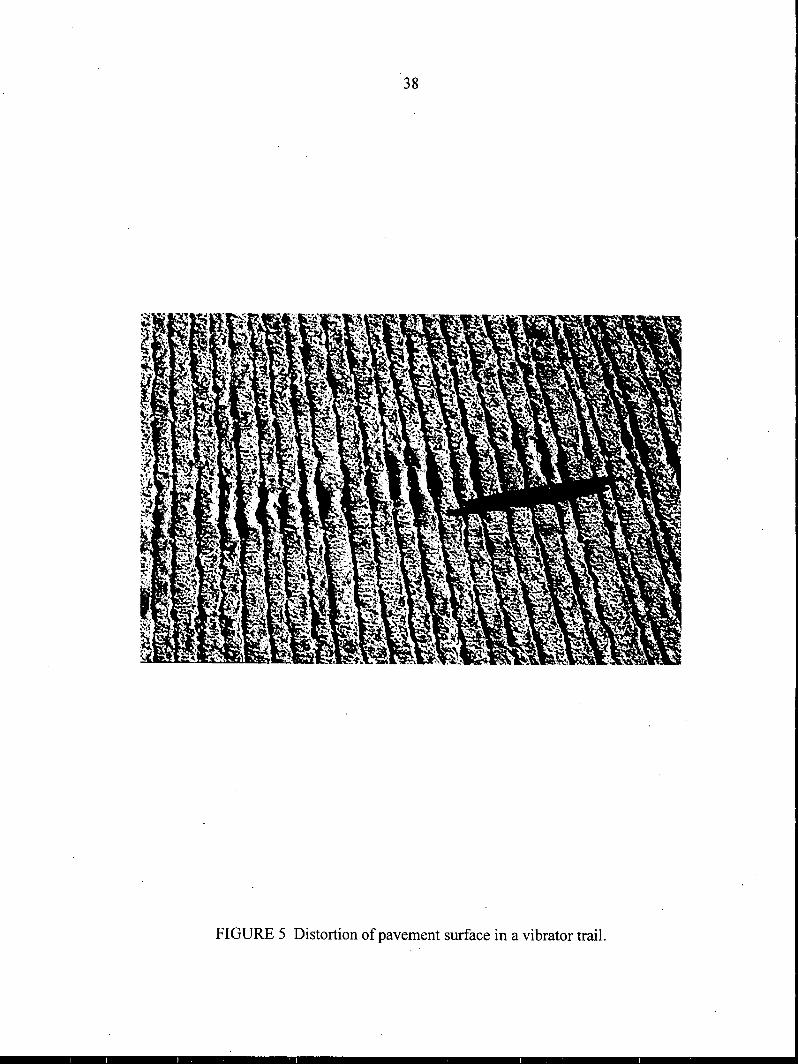
Vibrator trails are formed by the excessive vibration of the concrete. The excessive vibration
causes coarse aggregate to separate from the paste. This leaves a localized region of increased
paste content near the vibrator. This zone of increased paste may allow the tines of the tine
texturing machine to penetrate deeper into the surface of the pavement. This creates a
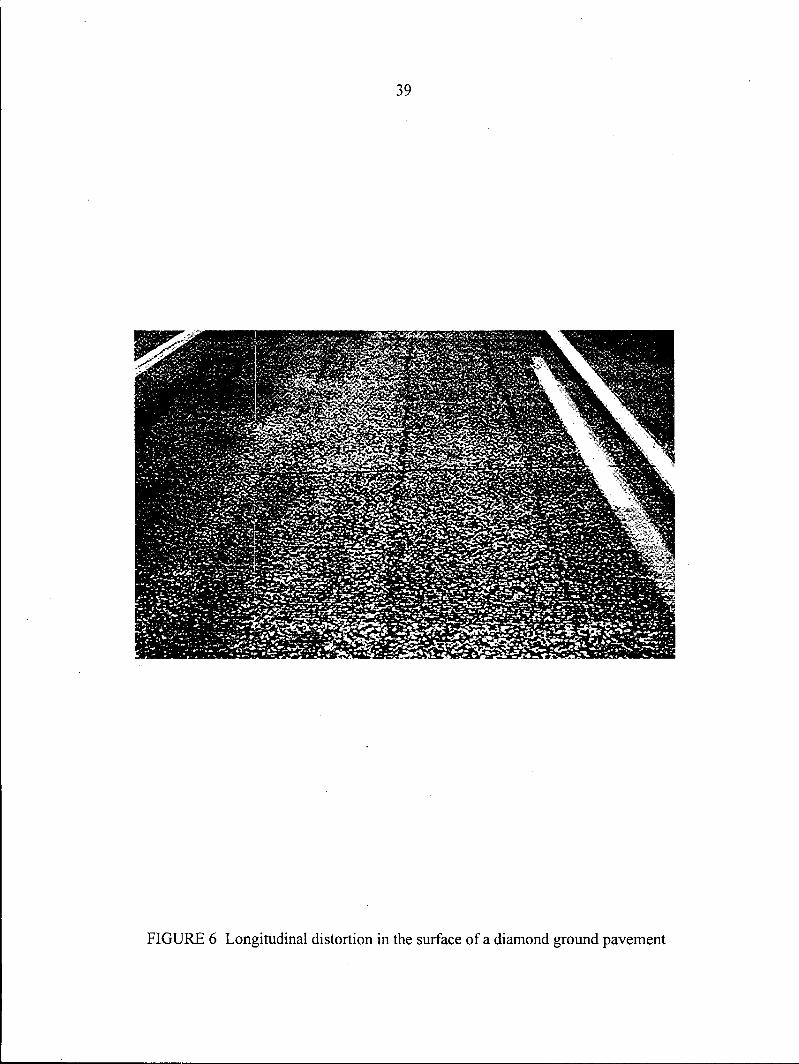
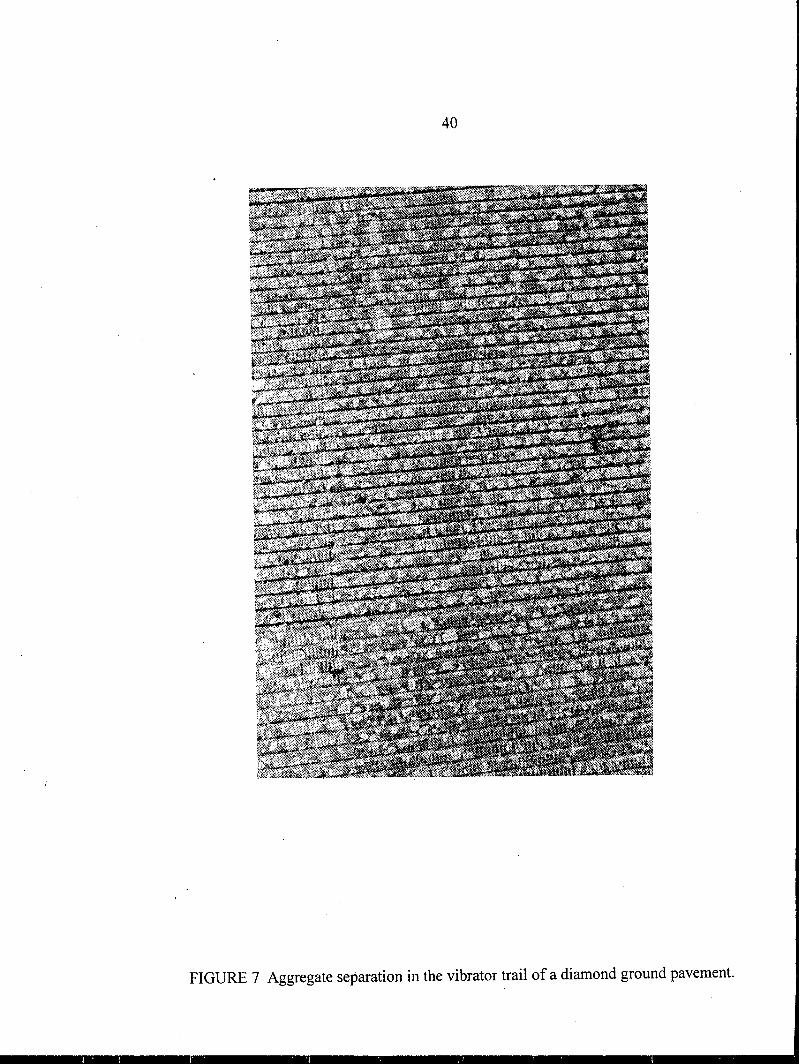
longitudinal distortion of the pavement surface (Figure 5, Appendix A). Vibrator trails can be
found below the surface of the pavement when taking cores. If the vibrator trail is slightly below
the surface, it can be exposed by diamond grinding the PCC pavement (Figures 6 & 7, Appendix
A). In this case the exposed surface has longitudinal bands where the pavement has a reduced
coarse aggregate content from excessive vibration.
11
PURPOSE OF RESEARCH
As a result of the observations made while investigating slip form pavers, a research project was
initiated in 1995 to evaluate the practices of vibration during slipform PCC paving and to
determine the effect of a new vibration specification for the frequency of vibrators. The new
specification limited the frequency of vibrators to a range of 5,000 to 8,000 vpm. Prior to this
specification there were no limits on the frequency of vibrators.
The primary factors studied for their effect on entrained air content were vibrator frequency,
paver speed, and distance from the vibrator. The research was conducted on three interstate
paving projects. On each project a test section was paved where the paver speed was recorded
and vibrator frequencies were set to known values. The lateral distance between each vibrator
was carefully measured, so the relative position of the vibrator to the location of a core would be
known.
EXPERIMENT DESIGN
The experiment was designed to be a matrix of paver speed and vibrator frequency. The test
sections were a matrix of two paver speeds and three vibrator frequencies. The speeds selected
were normal paver speed and a slow speed which was set at half the normal paver speed.
Because the normal speed for the pavers was found to be 1.2 to 2.1 m (4 to 7 feet) per minute, the
normal paver speed was set at 1.5 m (5 feet) per minute. The three vibrator frequencies were
5000, 6500, and 8000 vpm. This range covered the Iowa DOT specification for internal vibrators
on slipform pavers. This range was established to prevent the formation of vibrator trails and
12
was based on preliminary work conducted during the summer of 1994 by the Iowa DOT
Materials Research Section.
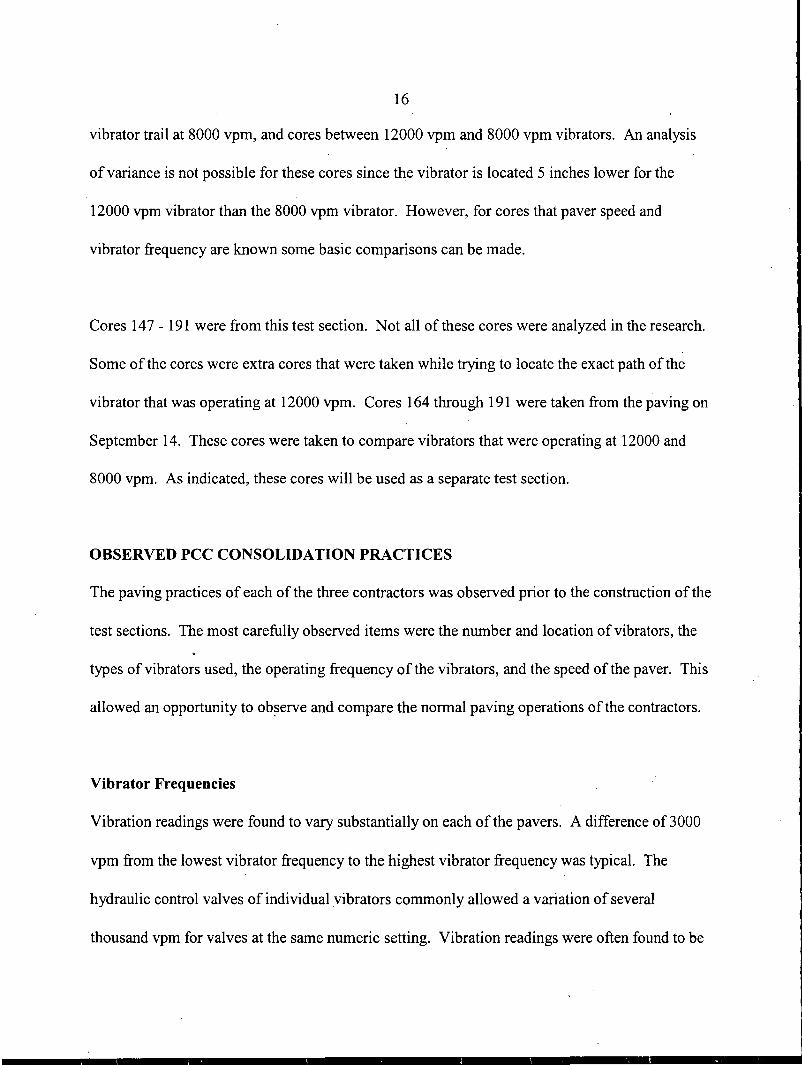
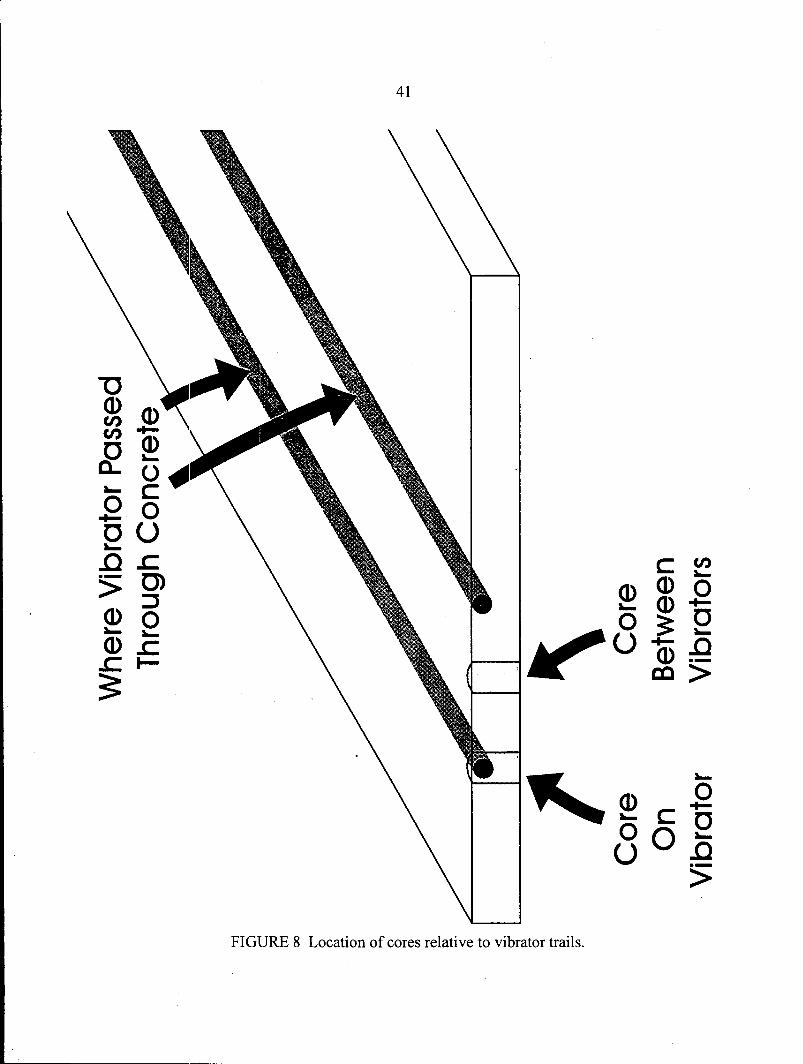
A consecutive pair of vibrators was selected to be controlled at the indicated test frequency. This
allowed cores to be taken in the vibrator trail and at the midpoint between the two controlled
vibrators (Figure 8, Appendix A). The other vibrators on the paver were maintained at their
normal operational frequency set by the contractor. The frequency of these vibrators was also
recorded. In some instances this allowed a comparison between a vibrator set within
specification limits and vibrators that were found to be operating outside the specification.
Three cores were taken from both the vibrator trail and between the vibrator trails in each
division of the design matrix. The cores were cut into thirds to determine the air content of the
top, middle, and bottom of the core. Air content results were obtained through high pressure
testing by the Iowa Department of Transportation test method number Iowa 407-B. A vertical
slice was taken from each core prior to the high pressure air test for possible image analysis
testing.
Careful measurements were taken of the vibrator spacing, vibrator location relative to the edge of
the pavement, and vibrator location relative to the edge of the pavers pan. The brand and model
of each vibrator was documented. In addition the mix design, weather conditions, type of paver,
tilt of the vibrators relative to the pavement surface, type of base, pavement design thickness, and
slump were recorded. These factors were held as constant as possible for each individual project.
13
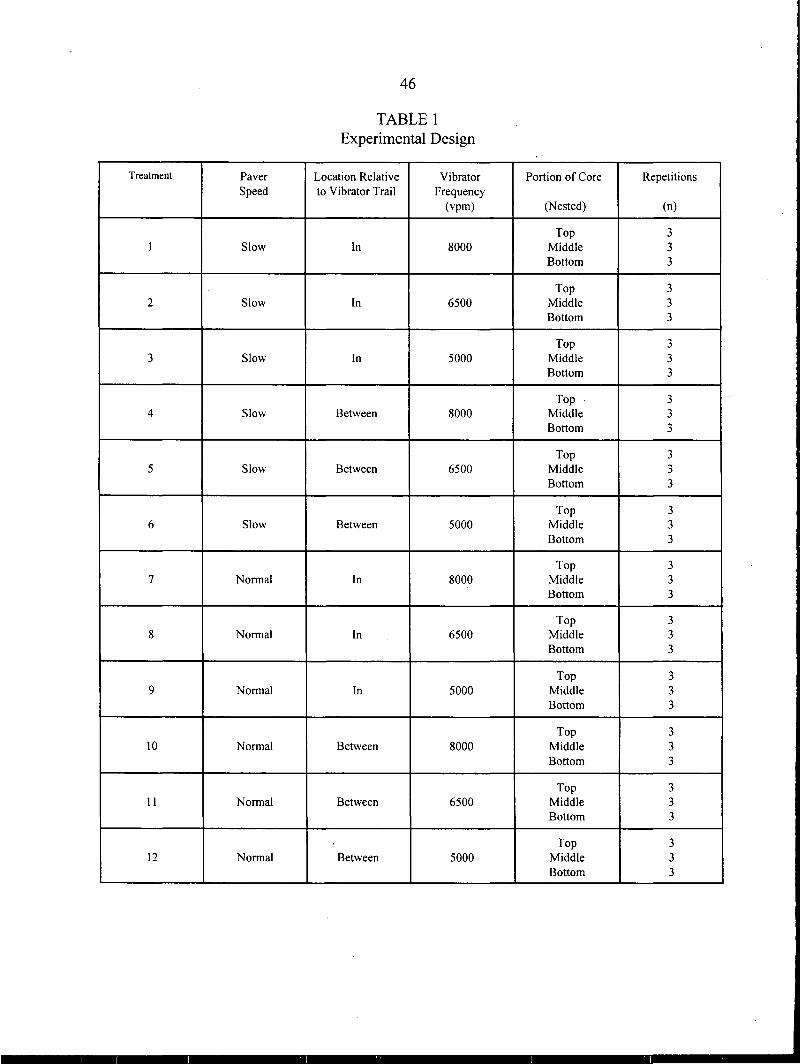
The result of this research is a design matrix that treats cores as independent samples. The cores
each come from a separate load of concrete taken to the project. The treatments that affect the
core are vibrator frequency, paver speed, and location relative to the vibrator (in or between the
vibrator trails). Nested within each core is the top, middle, and bottom air content. This results
in a 2x3x3 factorial design of 12 treatment combinations with three additional treatment levels
nested inside each of the 12 treatment combinations. Three repetitions were taken for each
treatment, so a total of 108 air tests were performed for each project. Table 1 in Appendix B lists
the resulting experimental design.
PROJECTS
Three projects were selected for the experiment. The projects are identified as A, B, and C.
Each project was paved by a different paving contractor. Each contractor had a different
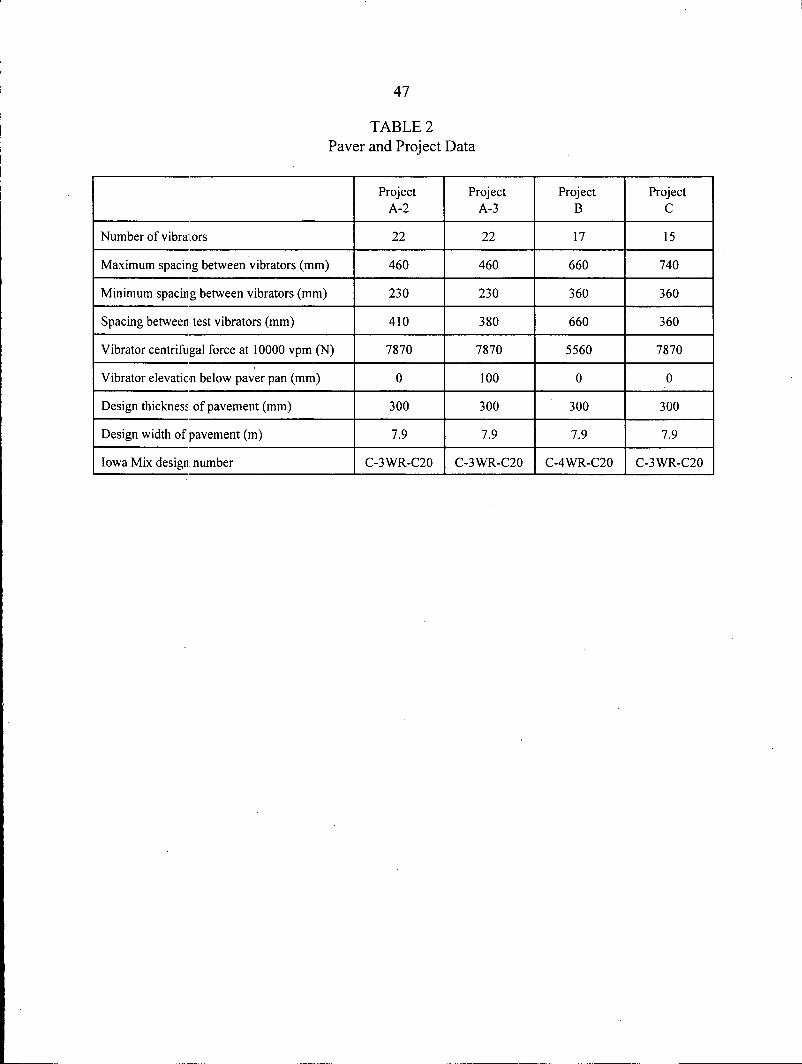
methodology on how to utilize vibration to consolidate the concrete. The spacings and
consolidating forces of the vibrators used by each paver are in Table 2 (Appendix B). All the
vibrator trail cores were taken from the path of the second vibrator from the pavement edge. The
between vibrators were taken between the second and third vibrators from the edge. Appendix E
lists the edge of slab the cores were measured from, the distance from the edge of the slab to the
center of the core, and the station of the core. Table 3 (Appendix B) lists the high pressure air
testing results of all cores. Appendix E contains all the raw data for the high pressure testing.
14
Project A
Project A was in Jasper County on Interstate 80. Project A had three separate research test
sections. These sections were named Al, A2, and A3. Al and A2 were in the west bound lanes.
A3 was in the east bound lanes.
The first test section, Al, was a limited trial of the experiment. This trial section was paved on
June 16, 19, and 20of1995. This section had all the variables used in the experiment design
except for paver speed. Only the normal paver speed was used. Cores 1 through 31 were taken
from this project. The data from these cores were not analyzed in this research, but this test run
showed that this research was feasible. This initial trial refined procedures of measuring and
recording paver speed, vibrator frequency, and location of the vibrators.
The second section, A2, was the first complete test. Section A2 was paved on July 13, 1995.
Cores 32 through 67 are from this project. The contractor for this section had the top of the
vibrators parallel with the paving pan.
Project A3 was nearly a duplicate of project A2 except for the position of the vibrators. The
contractor lowered the vibrators 100 mm ( 4 inches) below the paving pan. Section A3 was paved
on August 9, 1995. Cores 68 through 109 were taken from this portion.of project A.
15
Project B
This section was conducted on the southbound lanes of Interstate 29 in Pottawattamie County.
The test section was paved on August 14, 1995. The vibrators for project B had a smaller
eccentric force than projects A and C and had the largest spacing for the test vibrators (Table 2,
Appendix B). This project has the smallest vibrator consolidation energy for the research test
sections. The top of the vibrators were positioned level with the paving pan. Cores 110 through
146 were from this project.
Project C
This test section was on the west bound lanes of Interstate 80 in Scott County. The test section
was paved on September 12, 1995. Additional cores were also taken from the paving of
September 14. A complete test section was not possible for this project. At low vibration
frequencies the pavement surface was excessively open in the area between the vibrators. At the
request of the contractor the test sections were stopped. Half of the test sections were completed.
The completed test sections were the slow paver speed at 8000 vpm and the normal paver speed
at 5000 vpm and 8000 vpm.
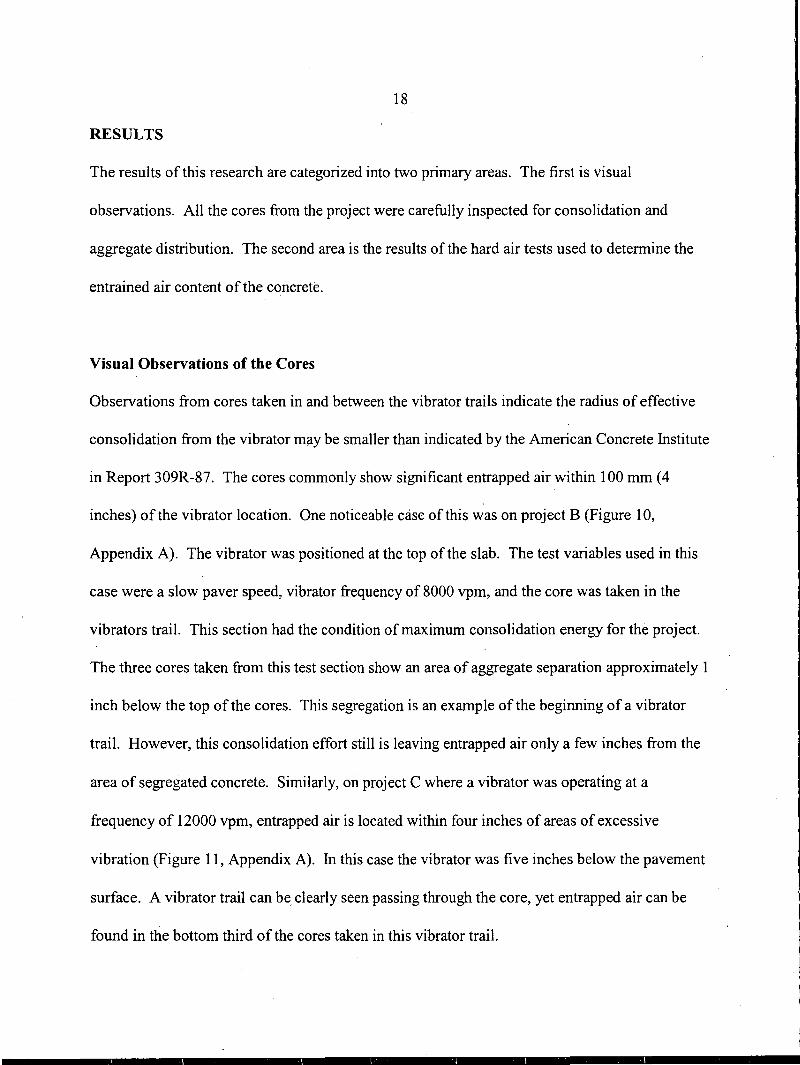
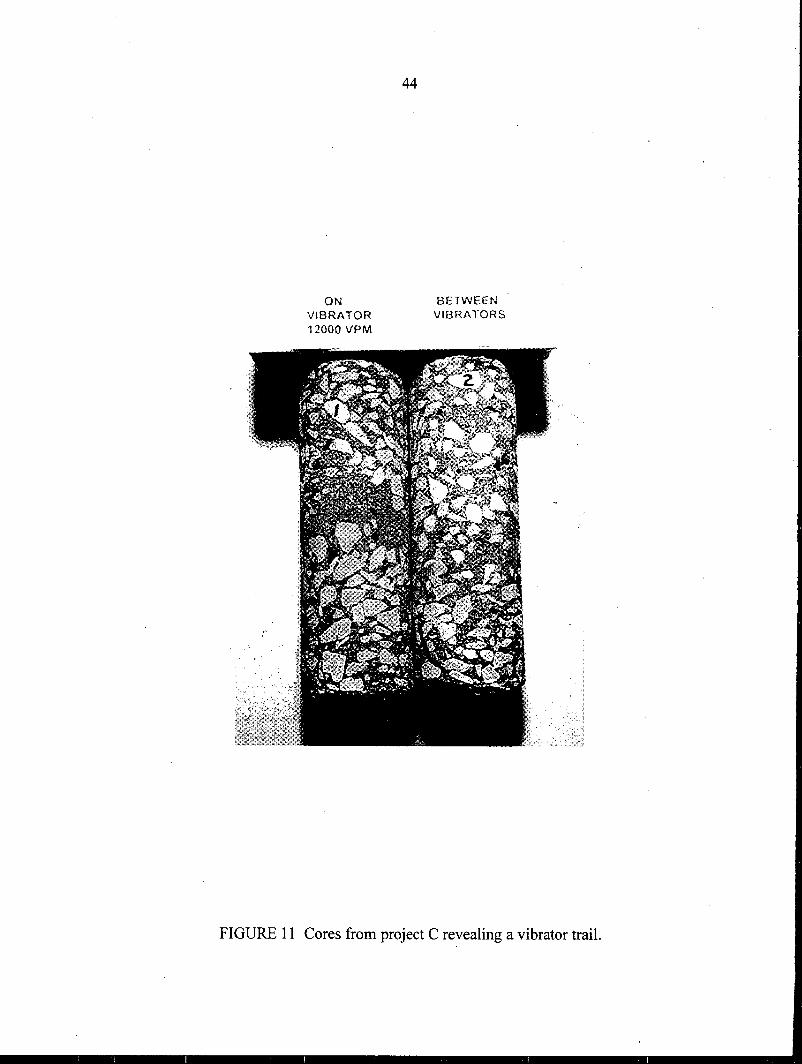
However, a vibrator on this project was found operating at a frequency of 12000 vpm. This
allowed comparisons to be made between the controlled test conditions and the 12000 vpm
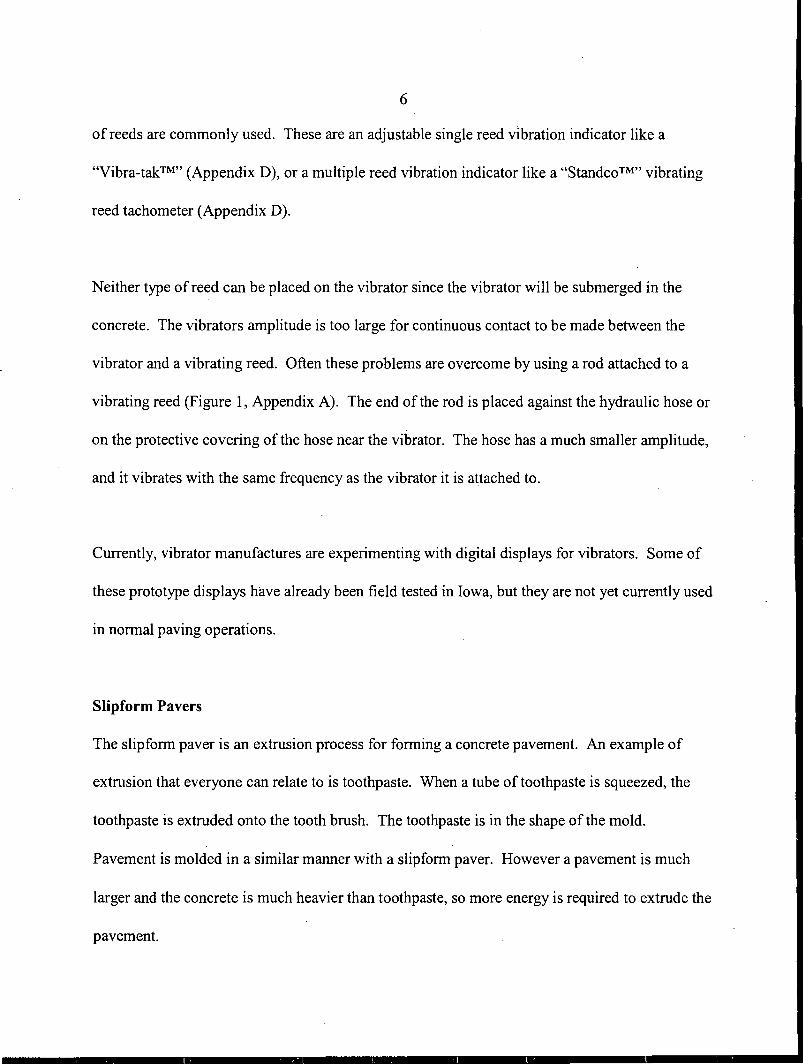
vibrator. Cores from the vibrator trail revealed the vibrator was 125 mm (5 inches) below the
surface. This was clearly evident by the vibrator trail in the cores (Figure 11, Appendix A).
These cores allowed for a comparison of consolidation in a vibrator trail at 12000 vpm, in a
16
vibrator trail at 8000 vpm, and cores between 12000 vpm and 8000 vpm vibrators. An analysis
of variance is not possible for these cores since the vibrator is located 5 inches lower for the
12000 vpm vibrator than the 8000 vpm vibrator. However, for cores that paver speed and
vibrator frequency are known some basic comparisons can be made.
Cores 147 - 191 were from this test section. Not all of these cores were analyzed in the research.
Some of the cores were extra cores that were taken while trying to locate the exact path of the
vibrator that was operating at 12000 vpm. Cores 164 through 191 were taken from the paving on
September 14. These cores were taken to compare vibrators that were operating at 12000 and
8000 vpm. As indicated, these cores will be used as a separate test section.
OBSERVED PCC CONSOLIDATION PRACTICES
The paving practices of each of the three contractors was observed prior to the construction of the
test sections. The most carefully observed items were the number and location of vibrators, the
types of vibrators used, the operating frequency of the vibrators, and the speed of the paver. This
allowed an opportunity to ob~erve and compare the normal paving operations of the contractors.
Vibrator Frequencies
Vibration readings were found to vary substantially on each of the pavers. A difference of 3000
vpm from the lowest vibrator frequency to the highest vibrator frequency was typical. The
hydraulic control valves of individual vibrators commonly allowed a variation of several
thousand vpm for valves at the same numeric setting. Vibration readings were often found to be
17
outside the specification limits of 5000 to 8000 vpm. In most cases when the frequency was
outside the specification, the vibrator was operating above the specification limit. In one
instance a vibrator was found to be operating at 12000 vpm.
Vibrator Positioning
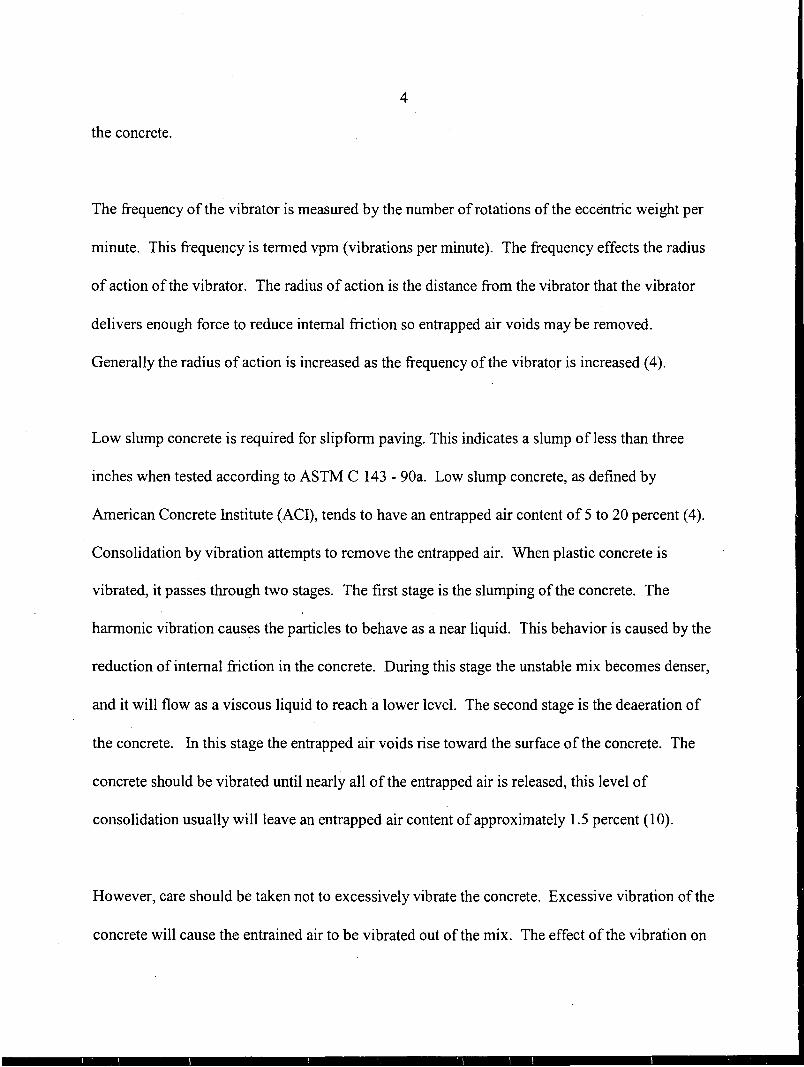
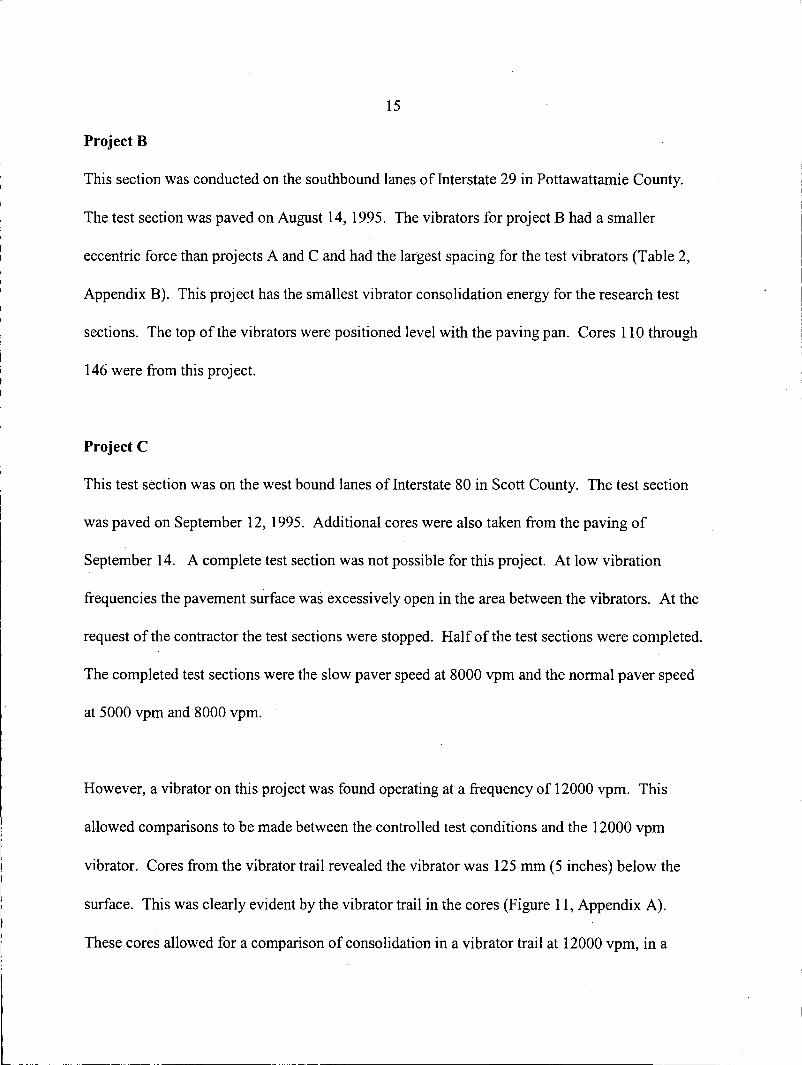
Inspection of the pavers revealed that in most cases the vibrators were positioned at the level of
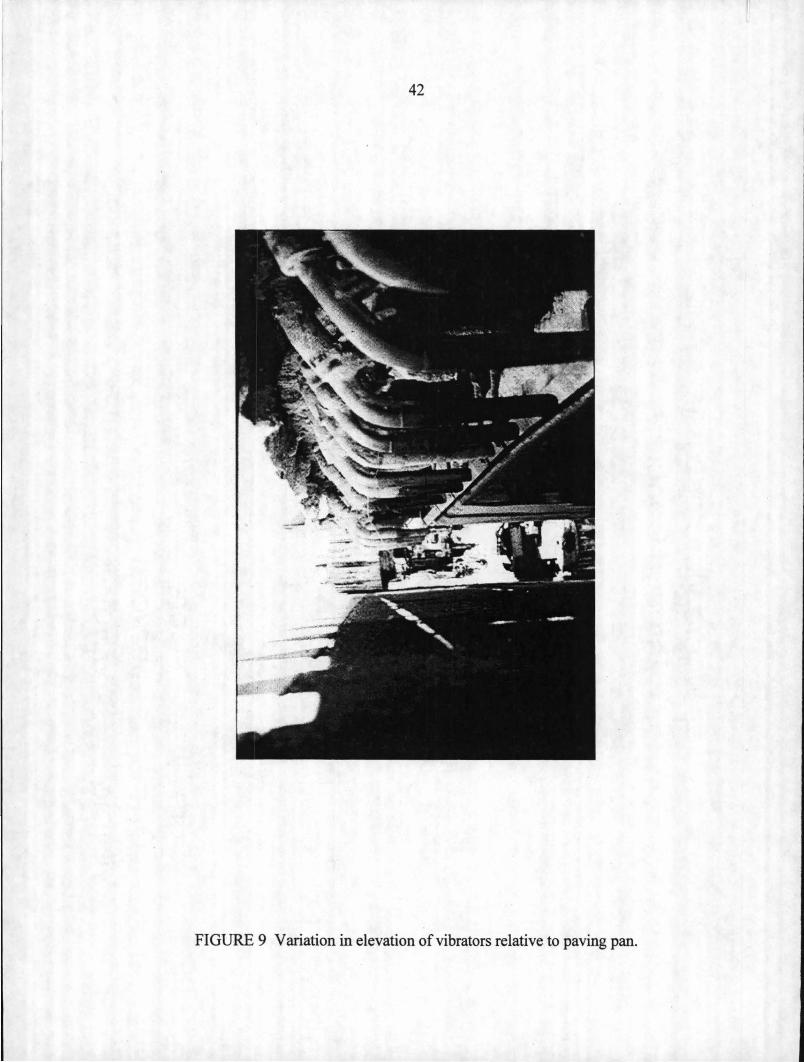
the pavering pan and in a horizontal position. However, some pavers had a large variation in
horizontal position of the vibrators. In one case the center of the vibrators ranged from 50 mm (2
inches) above the pan to 75 mm (3 inches) below the pan (Figure 9, Appendix A). In another
case, a paver operator indicated the vibrators were level with the pan; however, evidence from
cores showed the vibrators were as far as 125 mm (5 inches) below the pan. The change in
position can occur from an inaccurate position indicator, sag due to oil leakage in the hydraulic
system that holds the gang mounted vibrators in position, or loose bolts that hold an individual
vibrator in position.
Placing the vibrators parallel to the pavement surface minimizes the frontal area or cross
sectional area o.f the vibrator. In this position the possibility of excessive vibration is probably
increased since all the available energy from a vibrator is applied to a minimal cross sectional
area of concrete.
18
RESULTS
The results of this research are categorized into two primary areas. The first is visual
observations. All the cores from the project were carefully inspected for consolidation and
aggregate distribution. The second area is the results of the hard air tests used to determine the
entrained air content of the concrete.
Visual Observations of the Cores
Observations from cores taken in and between the vibrator trails indicate the radius of effective
consolidation from the vibrator may be smaller than indicated by the American Concrete Institute
in Report 309R-87. The cores commonly show significant entrapped air within 100 mm (4
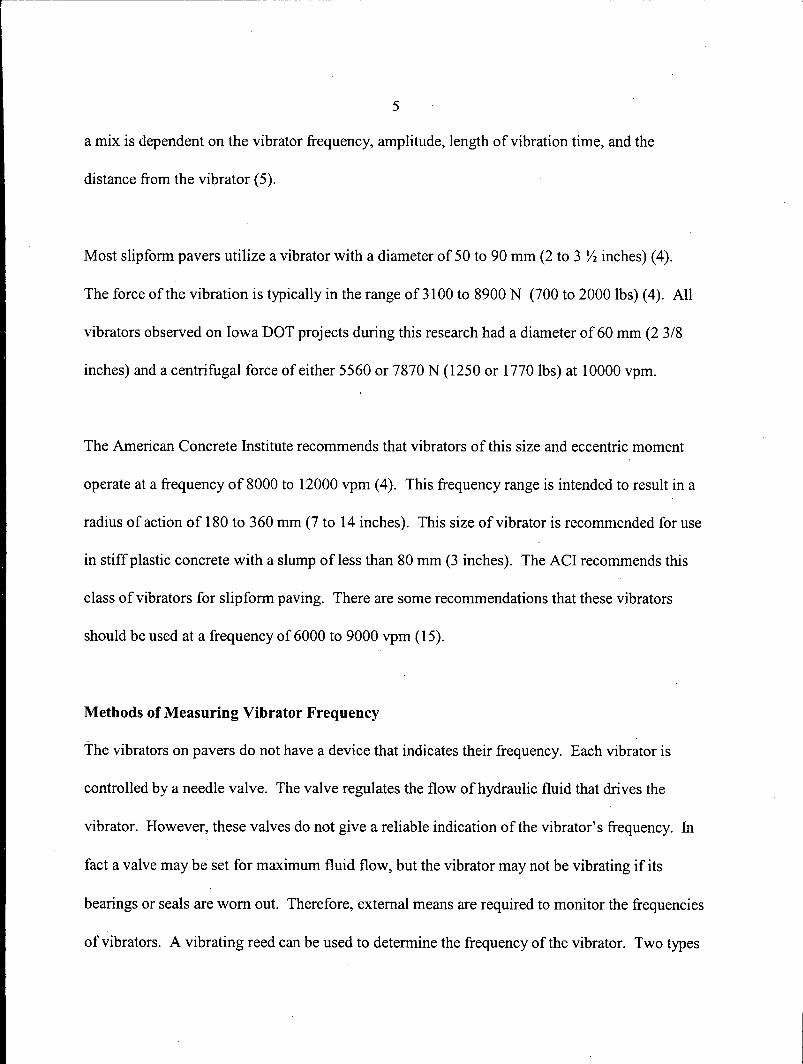
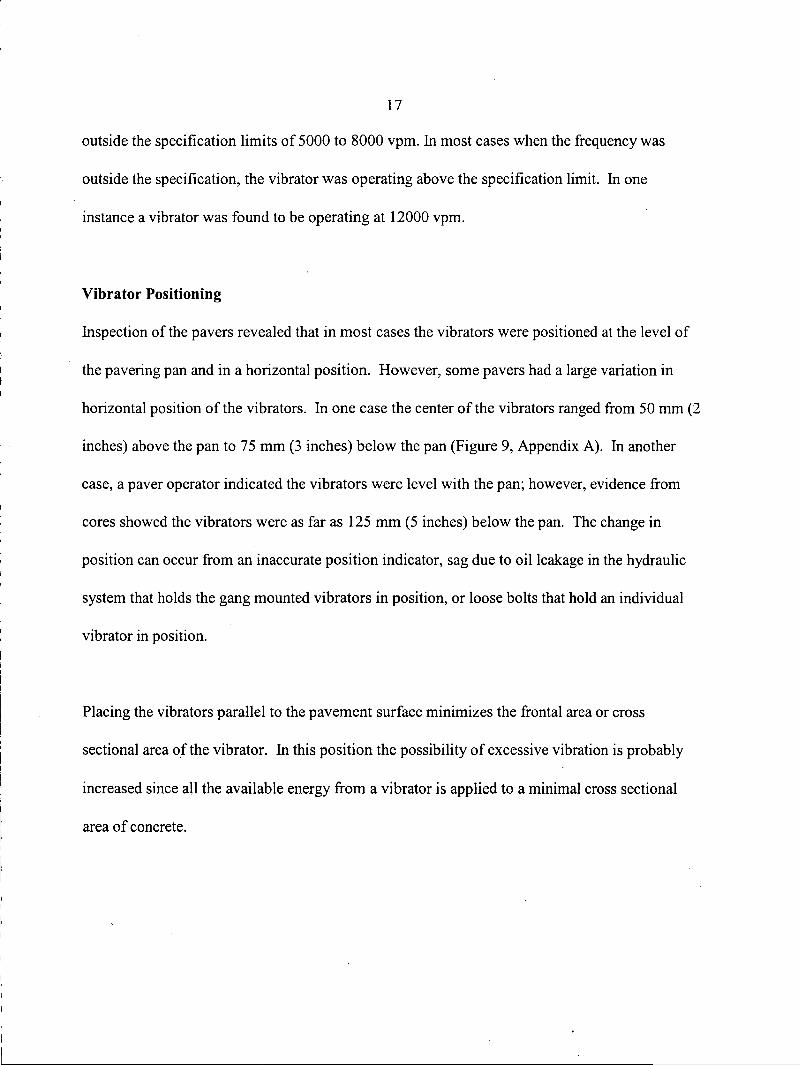
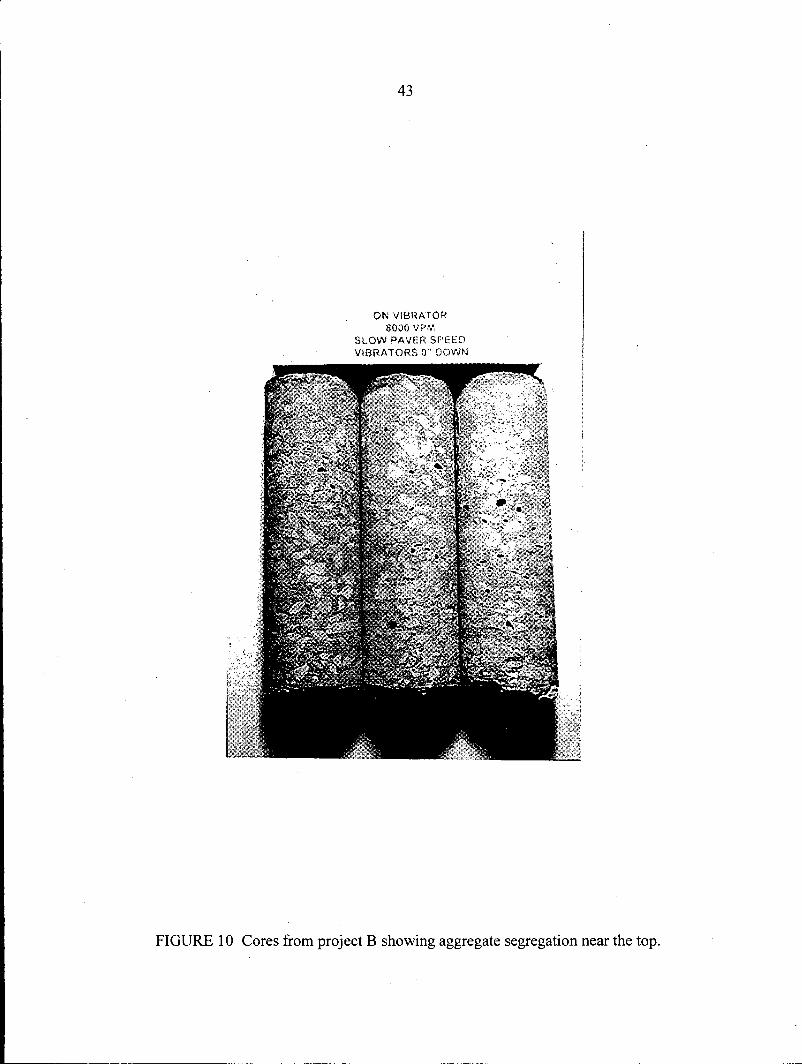
inches) of the vibrator location. One noticeable case of this was on project B (Figure 10,
Appendix A). The vibrator was positioned at the top of the slab. The test variables used in this
case were a slow paver speed, vibrator frequency of 8000 vpm, and the core was taken in the
vibrators trail. This section had the condition of maximum consolidation energy for the project.
The three cores taken from this test section show an area of aggregate separation approximately 1
inch below the top of the cores. This segregation is an example of the beginning of a vibrator
trail. However, this consolidation effort still is leaving entrapped air only a few inches from the
area of segregated concrete. Similarly, on project C where a vibrator was operating at a
frequency of 12000 vpm, entrapped air is located within four inches of areas of excessive
vibration (Figure 11, Appendix A). In this case the vibrator was five inches below the pavement
surface. A vibrator trail can be, clearly seen passing through the core, yet entrapped air can be
found in the bottom third of the cores taken in this vibrator trail.
19
Visual observations also revealed that the cores from the 5000 vpm test sections had significantly
more entrapped air than the 6500 and 8000 vpm test sections, especially under the test conditions
of normal paving speed. The impact of the increased entrapped air was not studied, but it
appears that the frequency of a vibrator should not be below 5000 vpm to ensure adequate
consolidation.
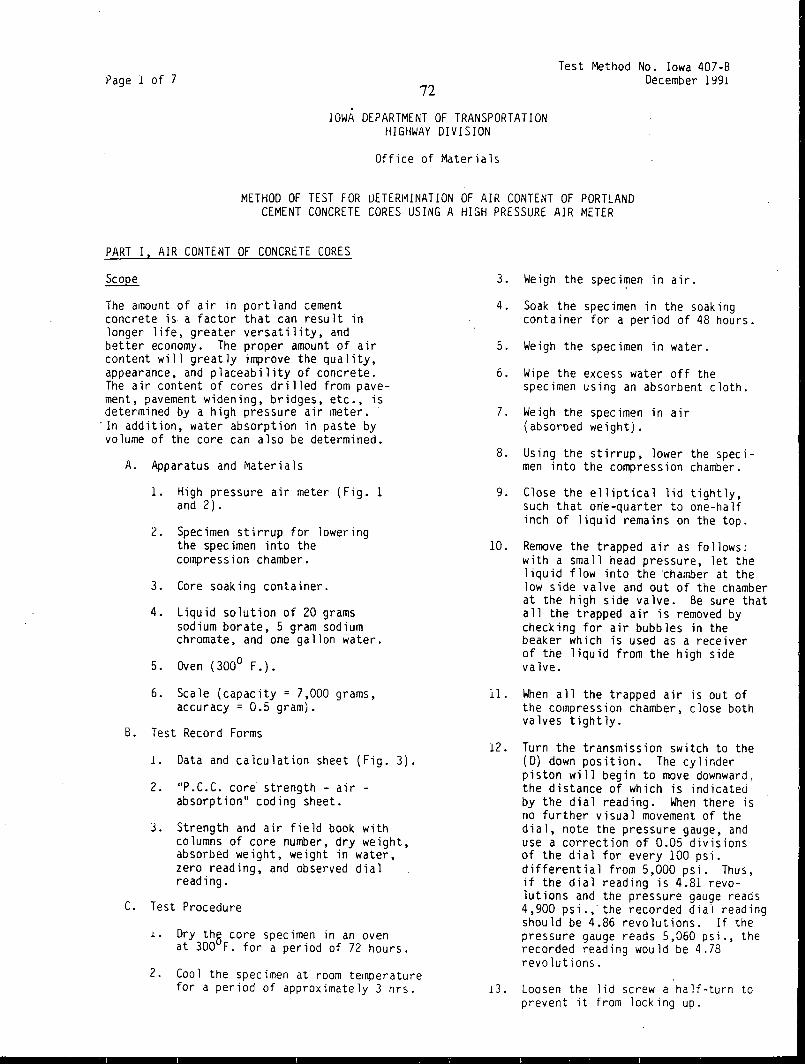
Iowa High Pressure Air Test
Iowa DOT test method number Iowa 407-B is the "Method of Test for Determination of Air
Content of Portland Cement Concrete Cores Using a High Pressure Air Meter." (Appendix D)
The test estimates the entrained air content of the hardened PCC. This is done by first oven
drying the hardened PCC concrete and weighing the specimen. The oven dry PCC is then soaked
in water and weighed in water and air. The water that penetrates into the PCC during this time
fills the voids in the PCC that are accessible to water. This void space is capillary pores and
entrapped air that are not going to allow for the additional volume of the water as it freezes. The
specimen is then submerged in a pressure tank, and a pressure of 34.47 MPa (5000 psi) is applied
to the specimen. The volume change of the pressure chamber is recorded. This volume change
is then used to calculate the additional voids that water can penetrate when pressure is applied.
This volume also estimates the volume of entrained air that is in the PCC concrete. This method
is not as exacting as linear traverse or image analysis, and it does not indicate void size
distribution and spacing. However the Iowa DOT has had success in correlating plastic air tests
with the high pressure test over an extended period of time. This test method allows for a higher
rate of test production and has a lower cost for each test.
20
Raw Data
The results of the high pressure testing of the PCC cores are in Appendix E. The results of the
high air pressure test yield four responses. The primary response is the estimated entrained air
content. The test also yields an estimate of the entrapped air content, the density of the core with
all air voids, and the density of the core with only the entrained air voids. These statistics are all
listed in Appendix E. However, this research will only look at the estimated entrained air
content.
Project A2
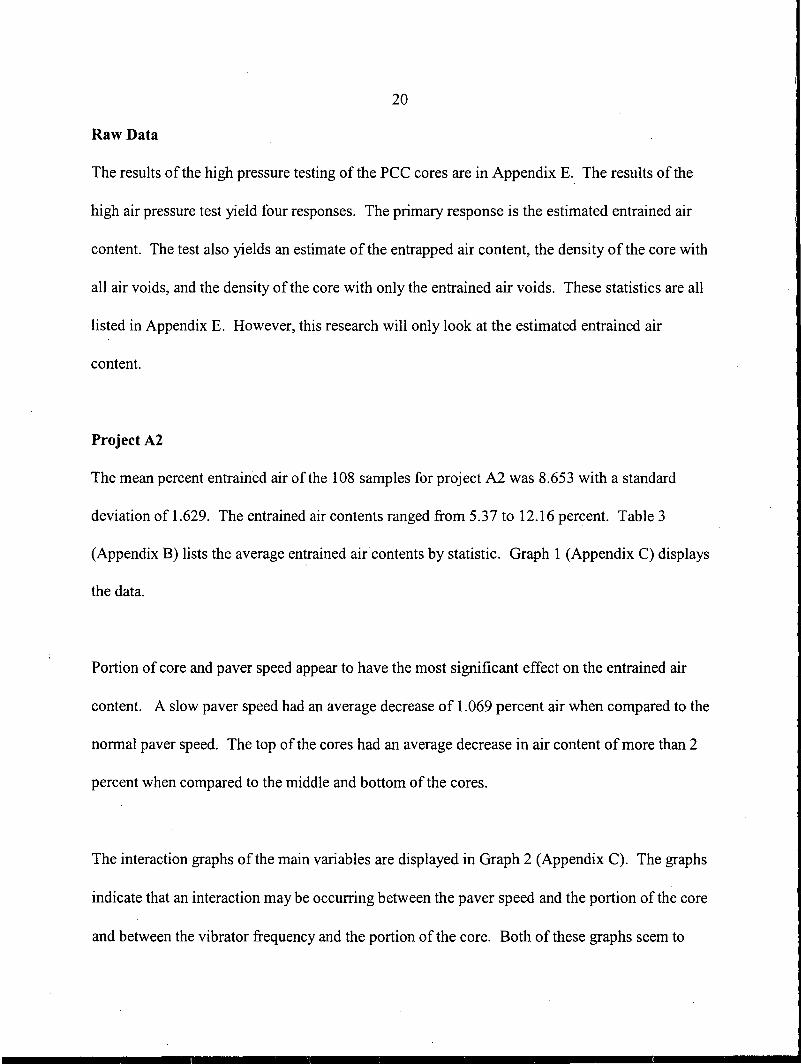
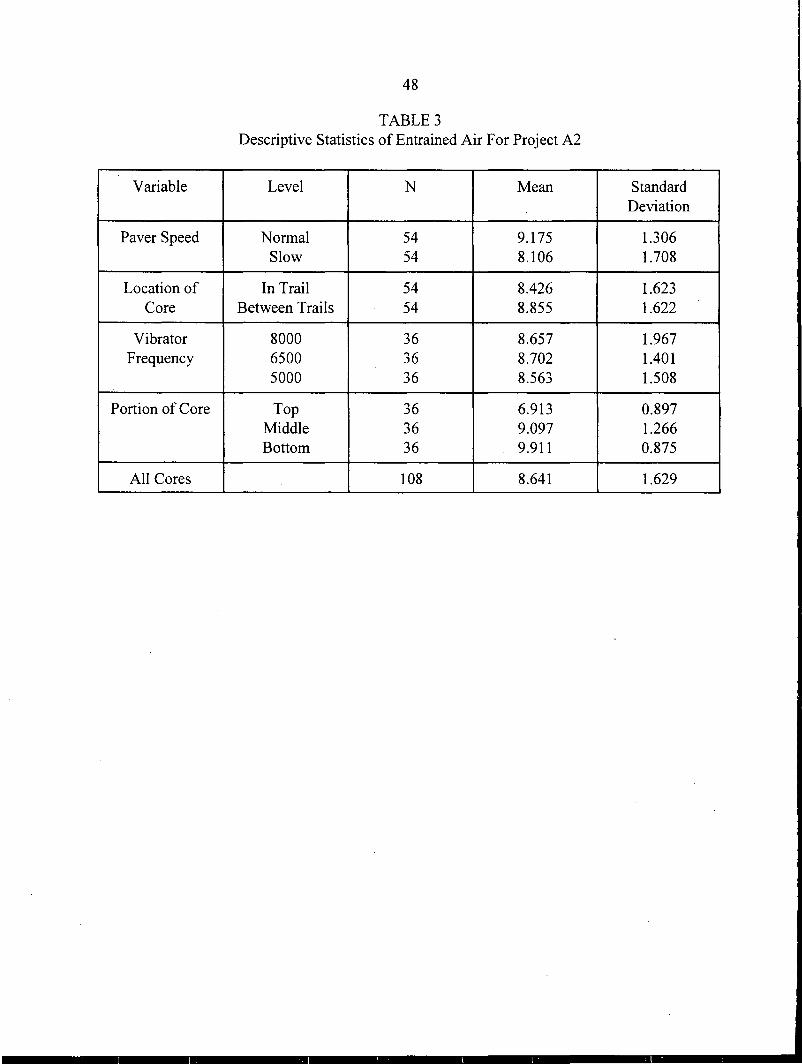
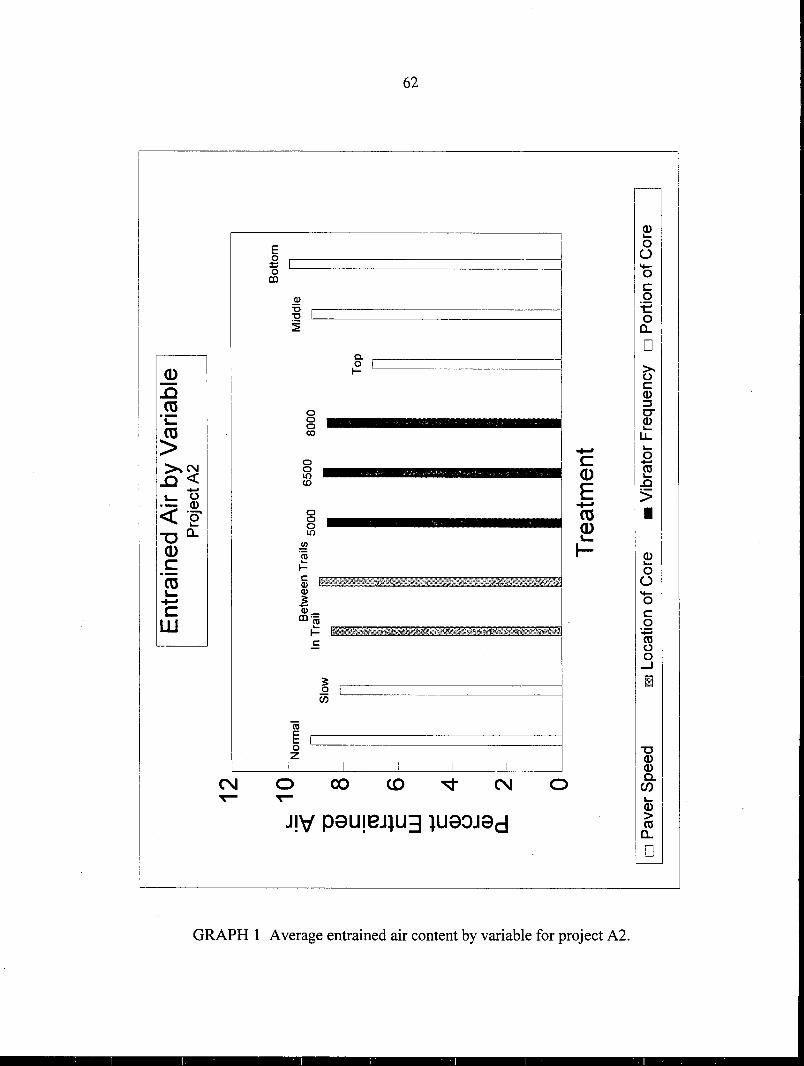
The mean percent entrained air of the 108 samples for project A2 was 8.653 with a standard
deviation of 1.629. The entrained air contents ranged from 5.37 to 12.16 percent. Table 3
(Appendix B) lists the average entrained air contents by statistic. Graph 1 (Appendix C) displays
the data.
Portion of core and paver speed appear to have the most significant effect on the entrained air
content. A slow paver speed had an average decrease of 1.069 percent air when compared to the
normal paver speed. The top of the cores had an average decrease in air content of more than 2
percent when compared to the middle and bottom of the cores.
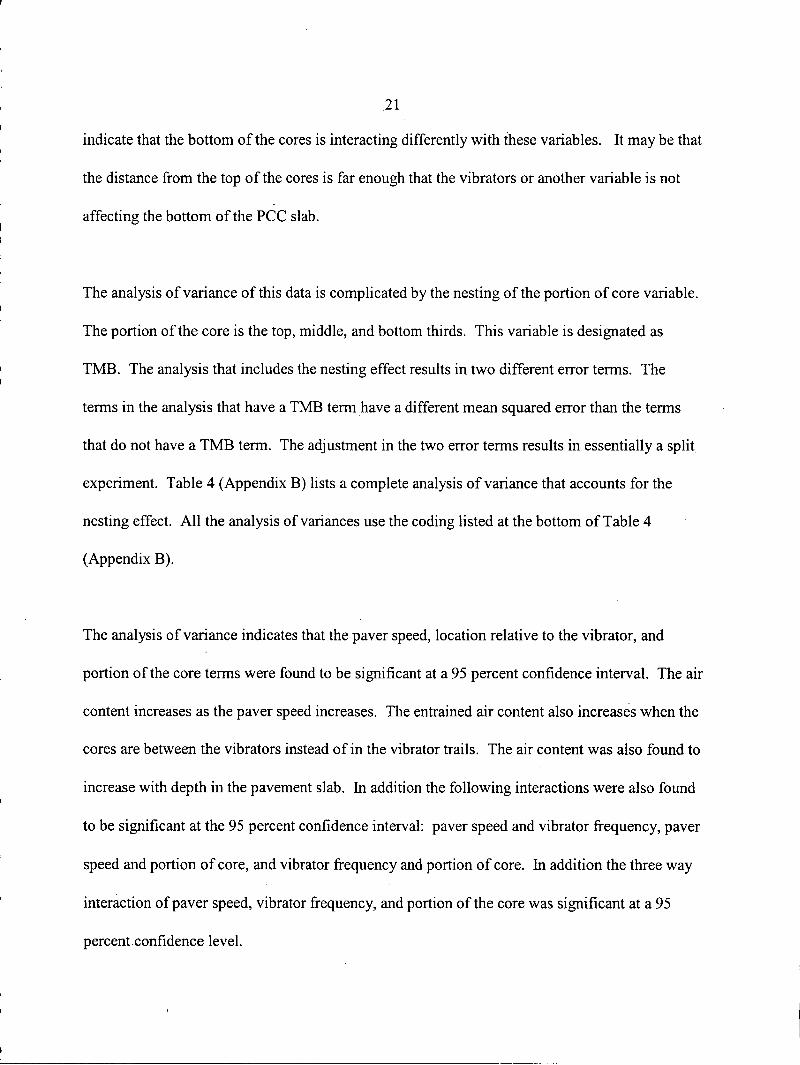
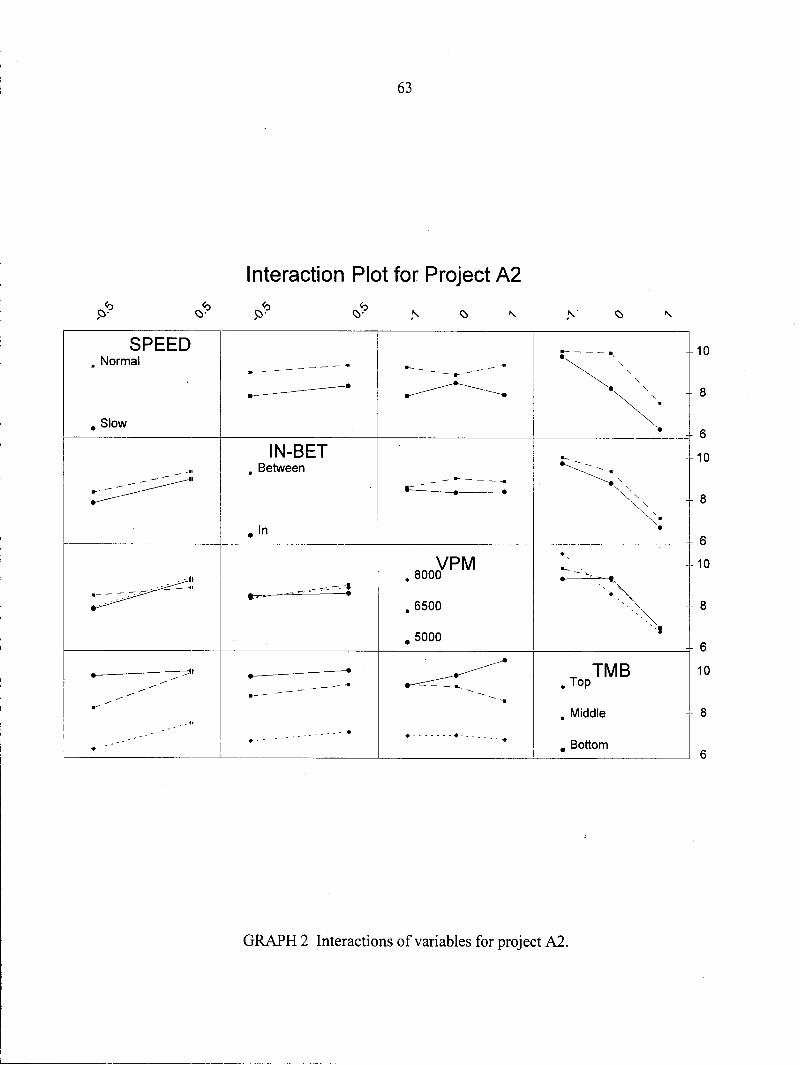
The interaction graphs of the main variables are displayed in Graph 2 (Appendix C). The graphs
indicate that an interaction may be occurring between the paver speed and the portion of the core
and between the vibrator frequency and the portion of the core. Both of these graphs seem to
21
indicate that the bottom of the cores is interacting differently with these variables. It may be that
the distance from the top of the cores is far enough that the vibrators or another variable is not
affecting the bottom of the PCC slab.
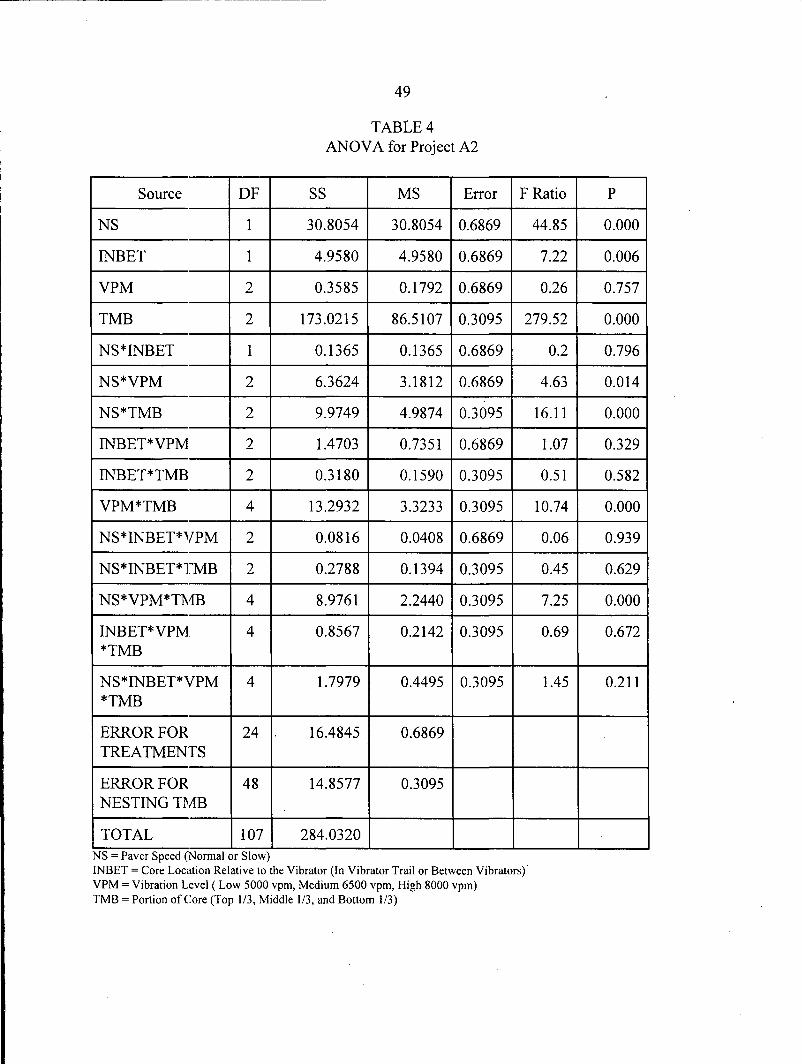
The analysis of variance of this data is complicated by the nesting of the portion of core variable.
The portion of the core is the top, middle, and bottom thirds. This variable is designated as
TMB. The analysis that includes the nesting effect results in two different error terms. The
terms in the analysis that have a TMB term have a different mean squared error than the terms
that do not have a TMB term. The adjustment in the two error terms results in essentially a split
experiment. Table 4 (Appendix B) lists a complete analysis of variance that accounts for the
nesting effect. All the analysis of variances use the coding listed at the bottom of Table 4
(Appendix B).
The analysis of variance indicates that the paver speed, location relative to the vibrator, and
portion of the core terms were found to be significant at a 95 percent confidence interval. The air
content increases as the paver speed increases. The entrained air content also increases when the
cores are between the vibrators instead of in the vibrator trails. The air content was also found to
increase with depth in the pavement slab. In addition the following interactions were also found
to be significant at the 95 percent confidence interval: paver speed and vibrator frequency, paver
speed and portion of core, and vibrator frequency and portion of core. In addition the three way
interaction of paver speed, vibrator frequency, and portion of the core was significant at a 95
percentconfidence level.
22
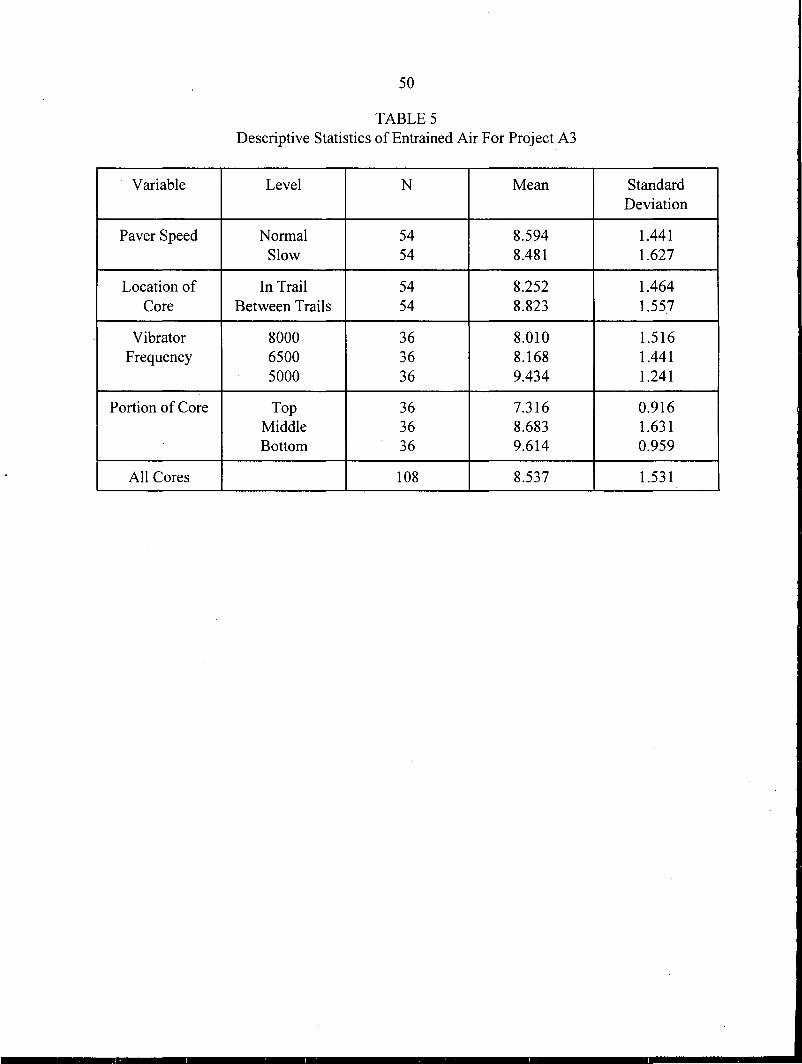
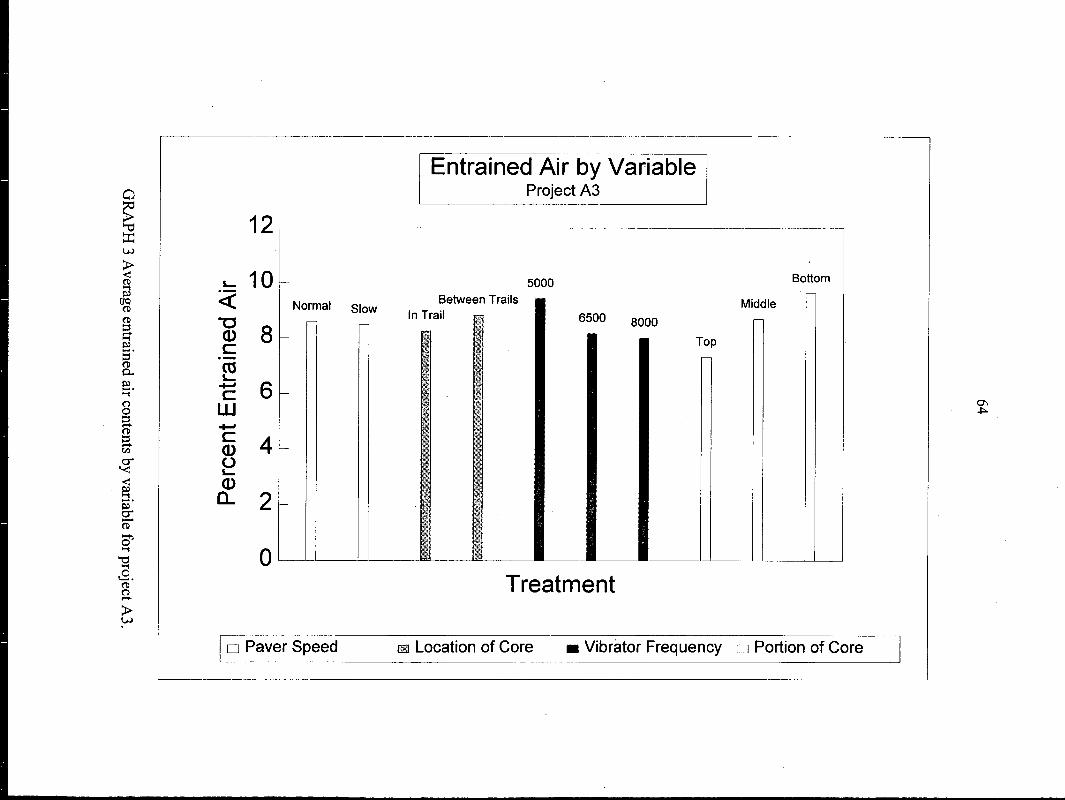
Project A3
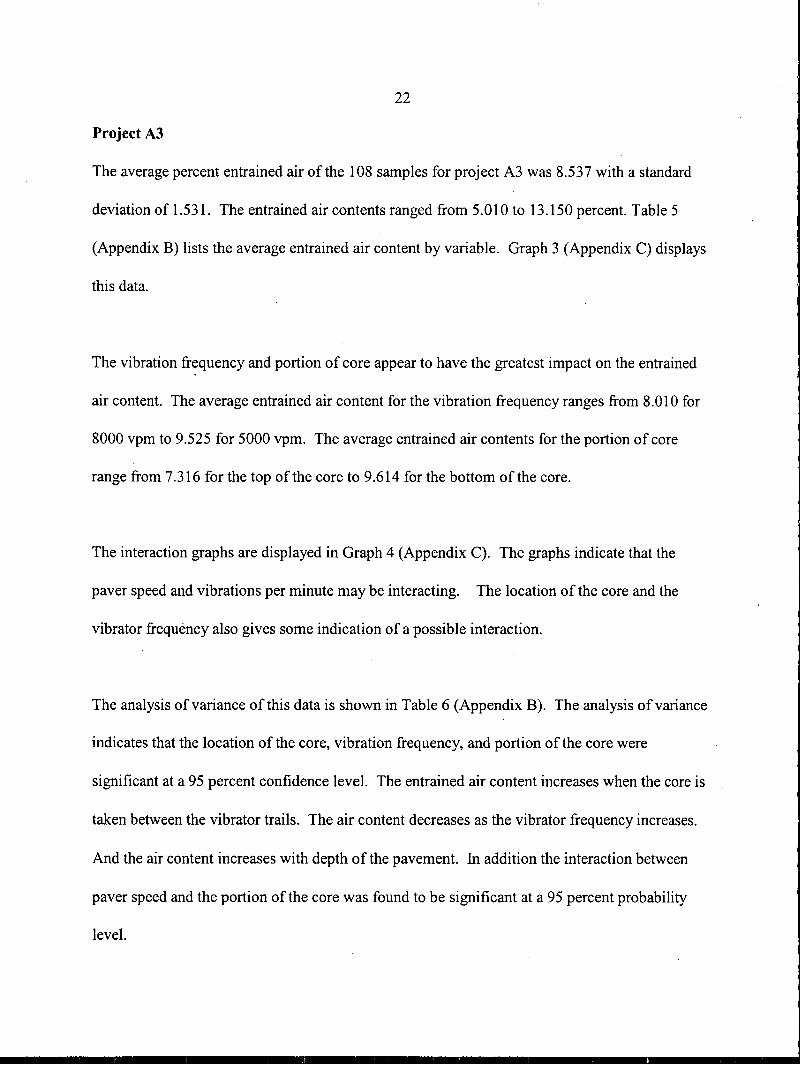
The average percent entrained air of the 108 samples for project A3 was 8.537 with a standard
deviation of 1.531. The entrained air contents ranged from 5.010 to 13.150 percent. Table 5
(Appendix B) lists the average entrained air content by variable. Graph 3 (Appendix C) displays
this data.
The vibration frequency and portion of core appear to have the greatest impact on the entrained
air content. The average entrained air content for the vibration frequency ranges from 8.010 for
8000 vpm to 9.525 for 5000 vpm. The average entrained air contents for the portion of core
range from 7.316 for the top of the core to 9.614 forthe bottom of the core.
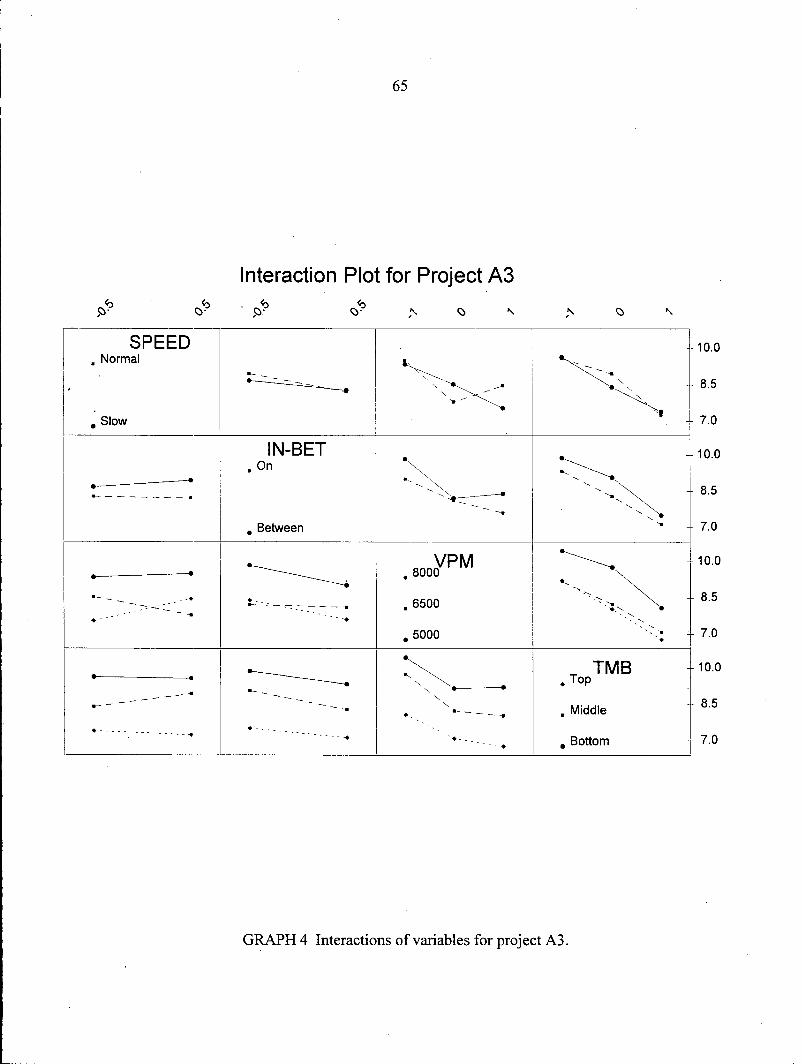
The interaction graphs are displayed in Graph 4 (Appendix C). The graphs indicate that the
paver speed and vibrations per minute may be interacting. The location of the core and the
vibrator frequency also gives some indication of a possible interaction.
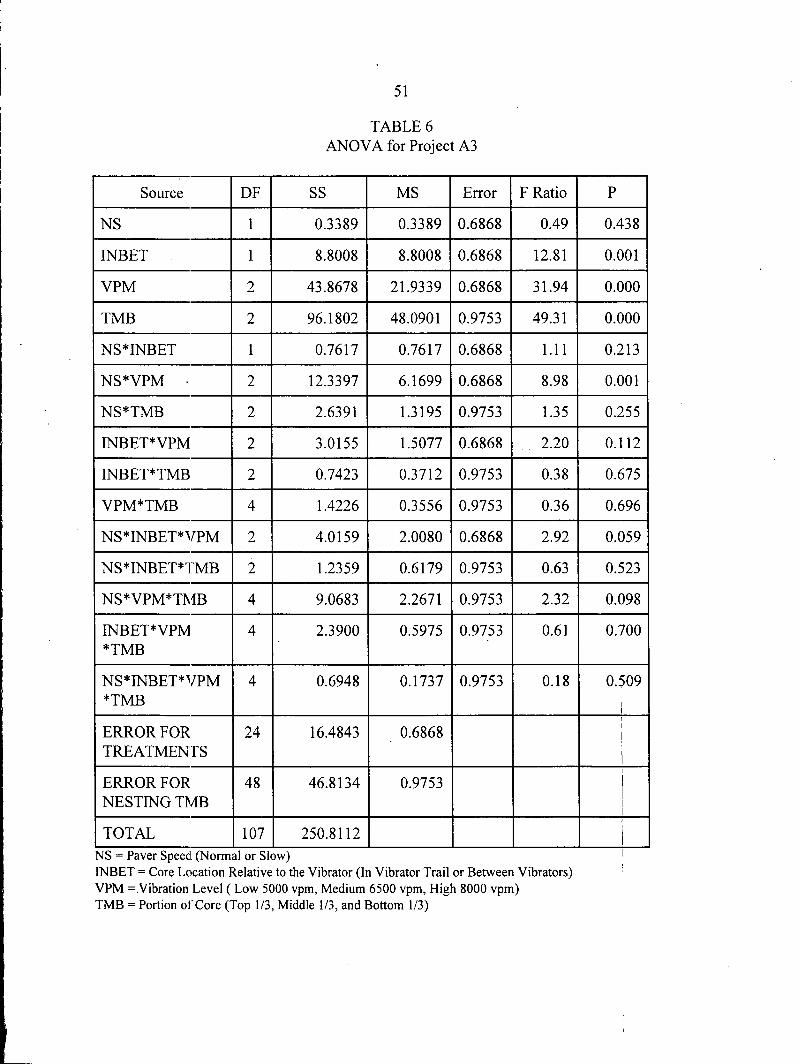
The analysis of variance of this data is shown in Table 6 (Appendix B). The analysis of variance
indicates that the location of the core, vibration frequency, and portion of the core were
significant at a 95 percent confidence level. The entrained air content increases when the core is
taken between the vibrator trails. The air content decreases as the vibrator frequency increases.
And the air content increases with depth of the pavement. In addition the interaction between
paver speed and the portion of the core was found to be significant at a 95 percent probability
level.
23
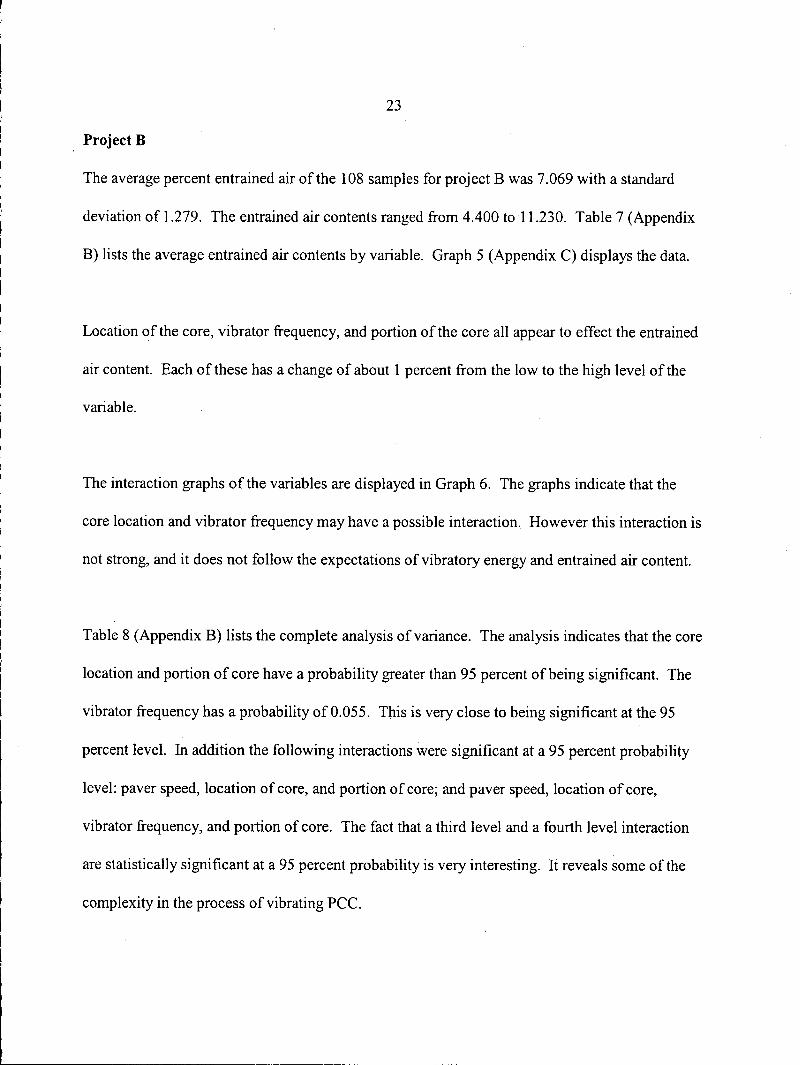
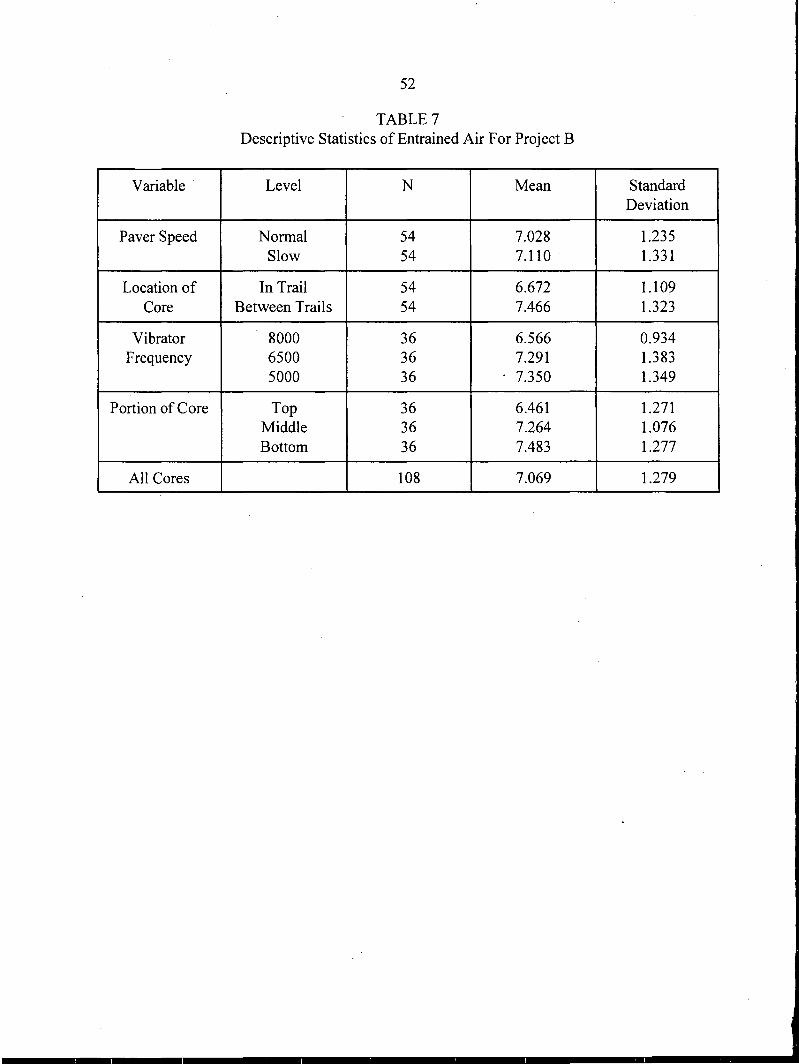
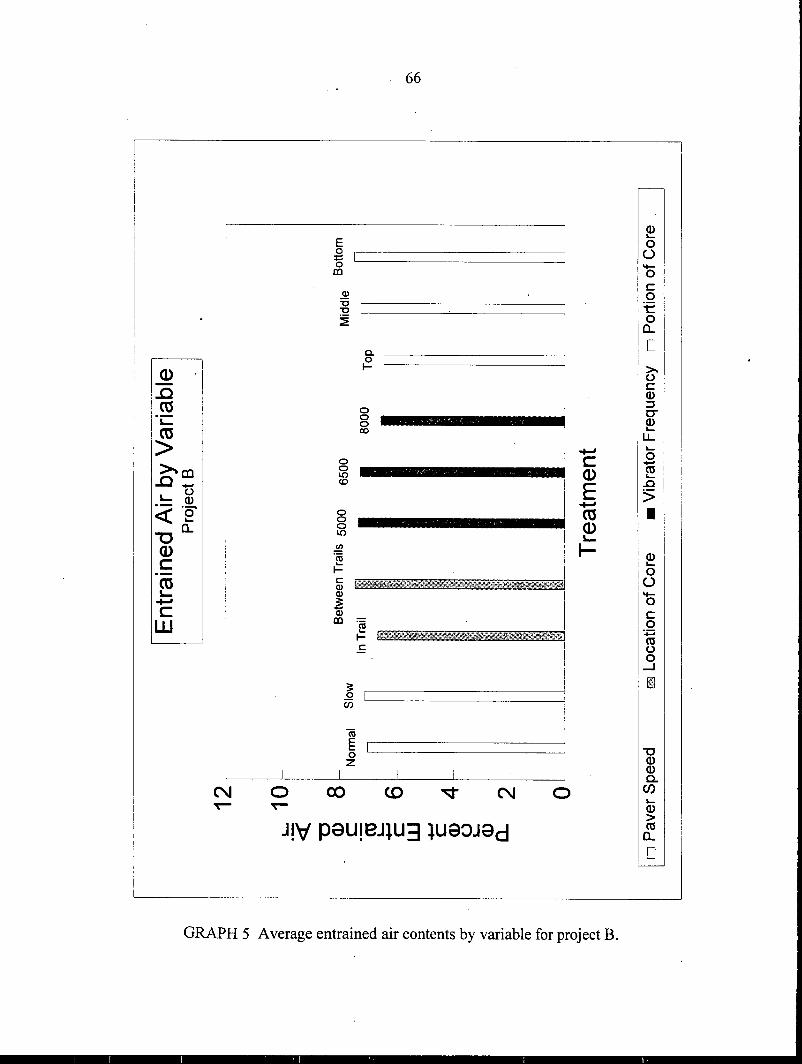
Project B
The average percent entrained air of the 108 samples for project B was 7. 069 with a standard
deviation of 1.279. The entrained air contents ranged from 4.400 to 11.230. Table 7 (Appendix
B) lists the average entrained air contents by variable. Graph 5 (Appendix C) displays the data.
Location of the core, vibrator frequency, and portion of the core all appear to effect the entrained
air content. Each of these has a change of about 1 percent from the low to the high level of the
variable.
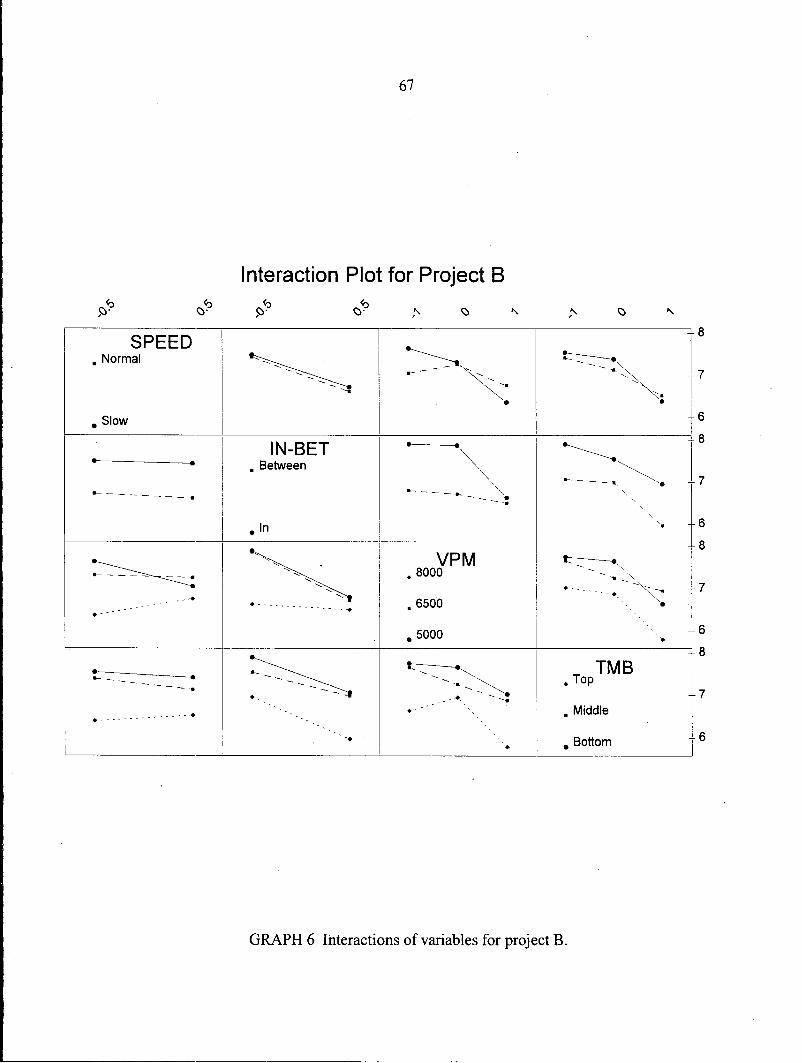
The interaction graphs of the variables are displayed in Graph 6. The graphs indicate that the
core location and vibrator frequency may have a possible interaction. However this interaction is
not strong, and it does not follow the expectations of vibratory energy and entrained air content.
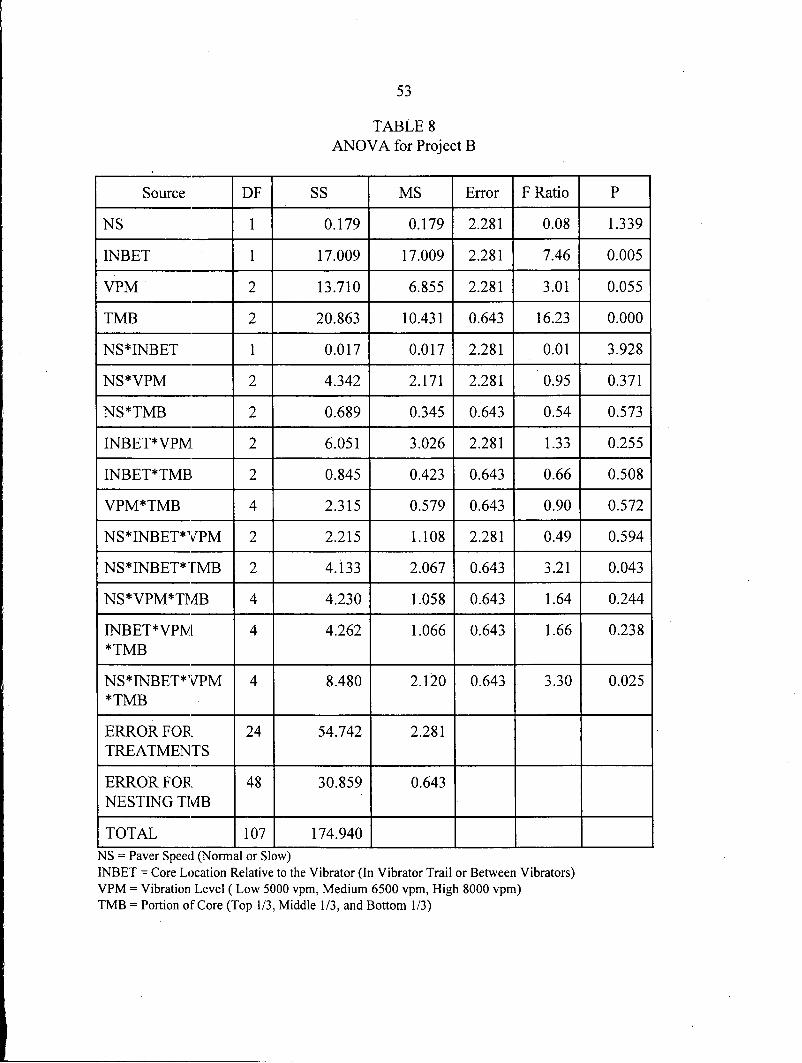
Table 8 (Appendix B) lists the complete analysis of variance. The analysis indicates that the core
location and portion of core have a probability greater than 95 percent of being significant. The
vibrator frequency has a probability of 0.055. This is very close to being significant at the 95
percent level. In addition the following interactions were significant at a 95 percent probability
level: paver speed, location of core, and portion of core; and paver speed, location of core,
vibrator frequency, and portion of core. The fact that a third level and a fourth level interaction
are statistically significant at a 95 percent probability is very interesting. It reveals some of the
complexity in the process of vibrating PCC.
24
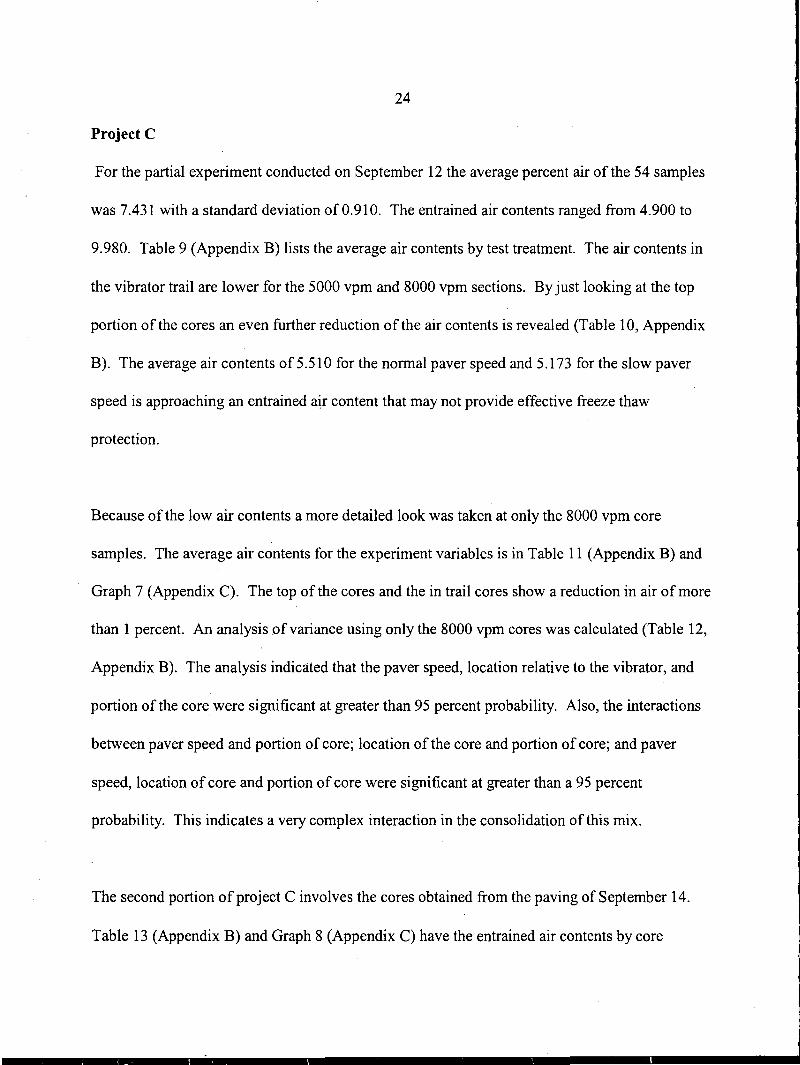
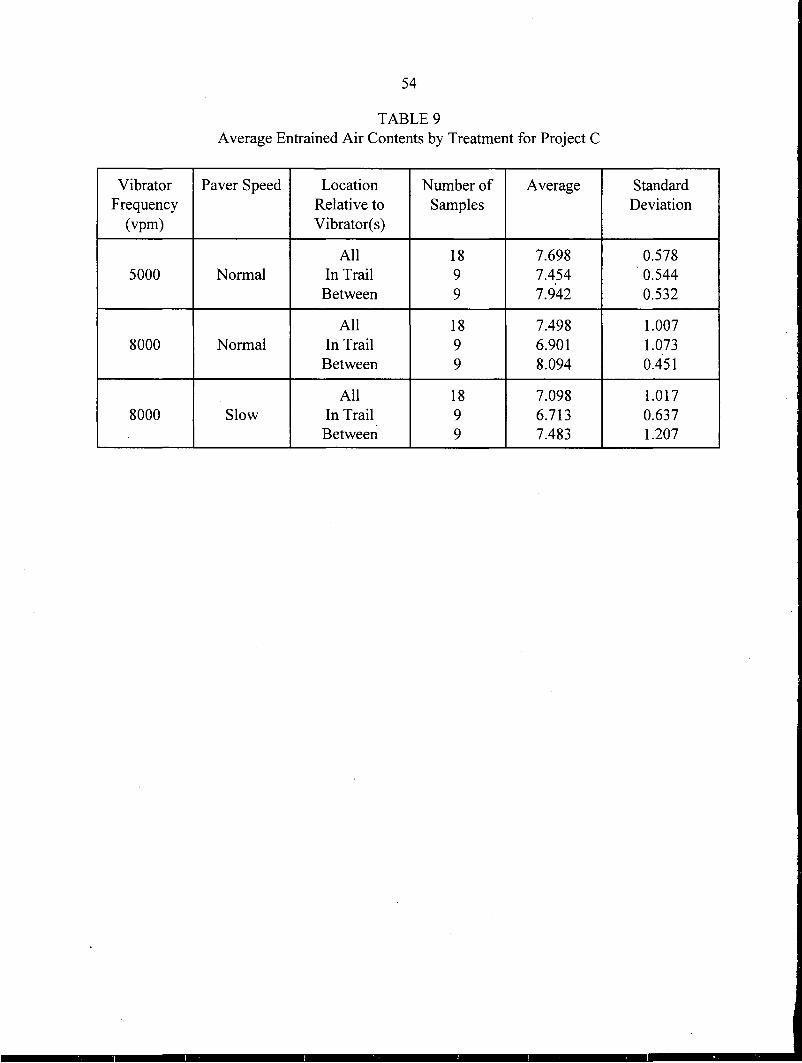
Project C
For the partial experiment conducted on September 12 the average percent air of the 54 samples
was 7.431 with a standard deviation of 0.910. The entrained air contents ranged from 4.900 to
9.980. Table 9 (Appendix B) lists the average air contents by test treatment. The air contents in
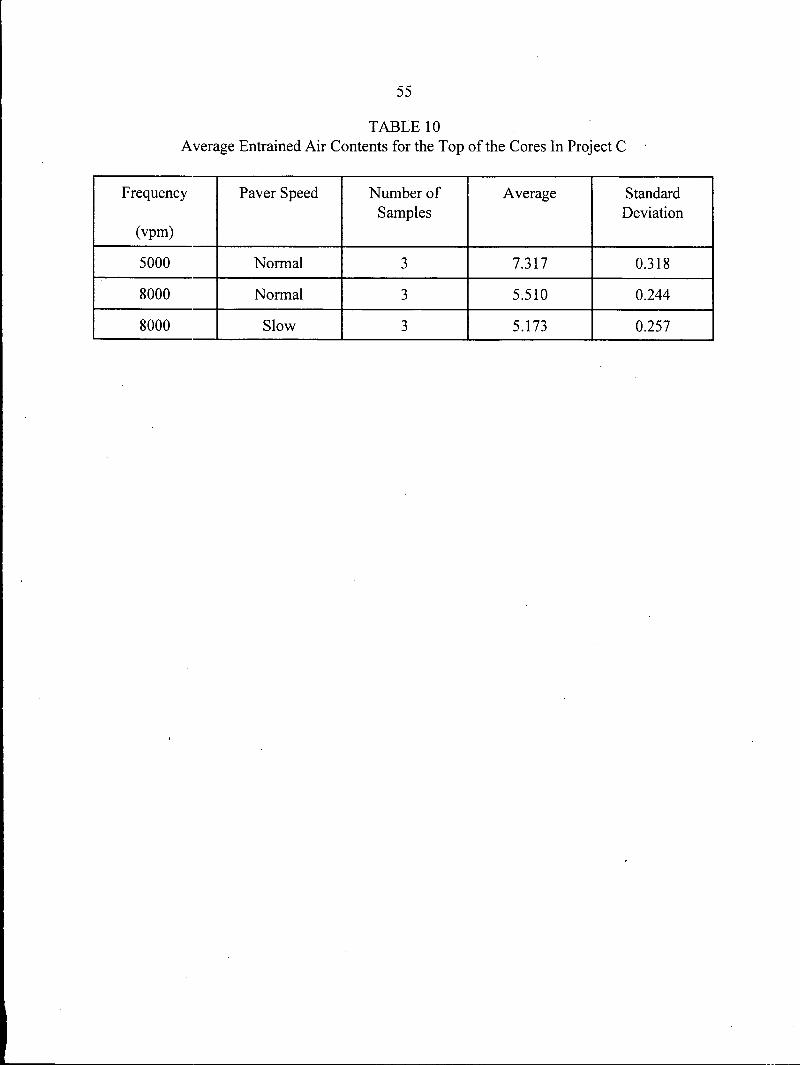
the vibrator trail are lower for the 5000 vpm and 8000 vpm sections. By just looking at the top
portion of the cores an even further reduction of the air contents is revealed (Table 10, Appendix
B). The average air contents of 5.510 for the normal paver speed and 5.173 for the slow paver
speed is approaching an entrained air content that may not provide effective freeze thaw
protection.
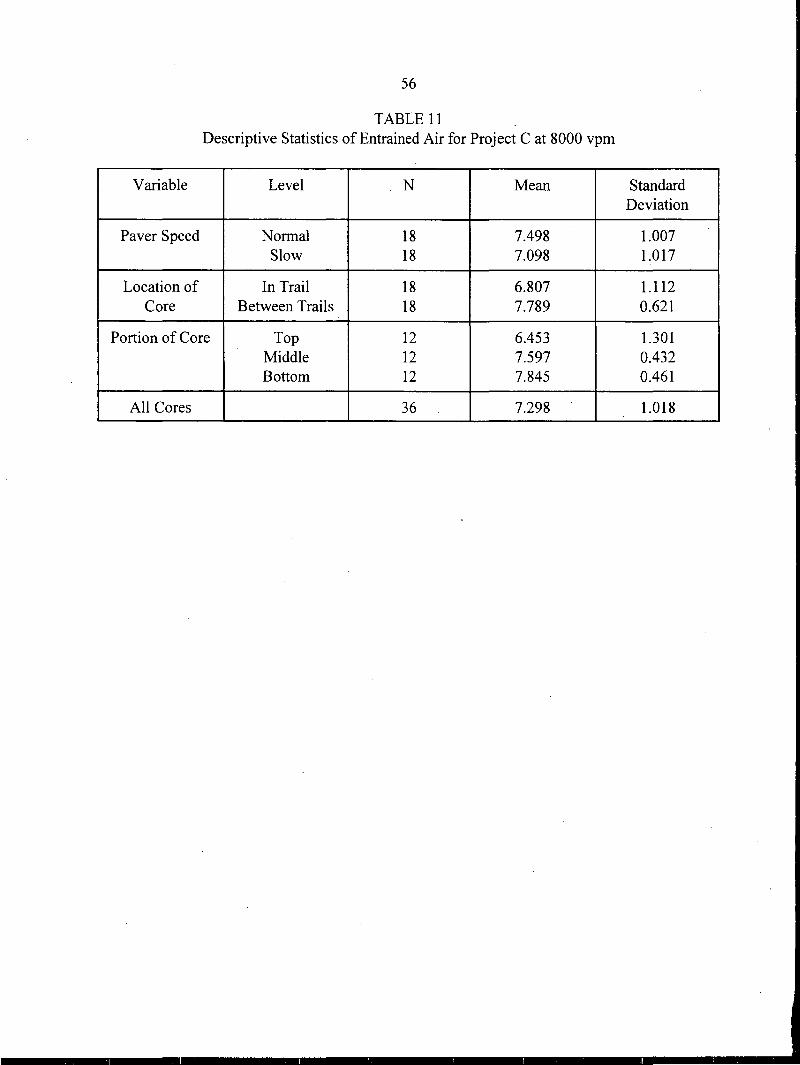
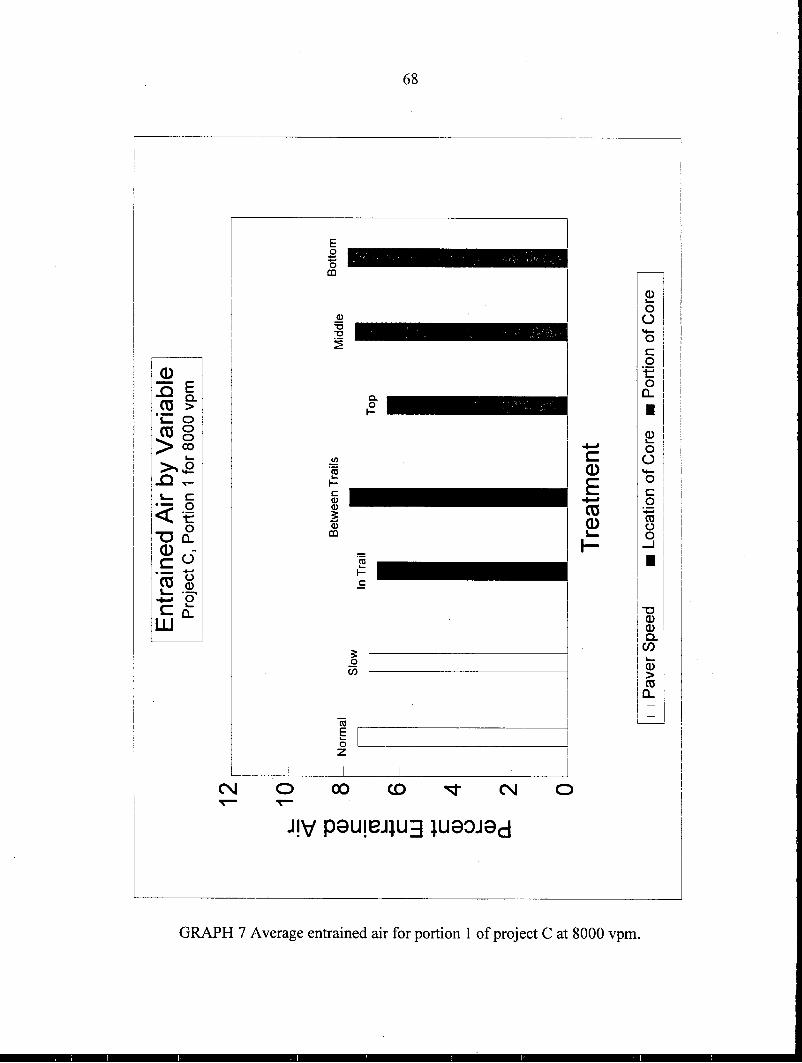
Because of the low air contents a more detailed look was taken at only the 8000 vpm core
samples. The average air contents for the experiment variables is in Table 11 (Appendix B) and
Graph 7 (Appendix C). The top of the cores and the in trail cores show a reduction in air of more
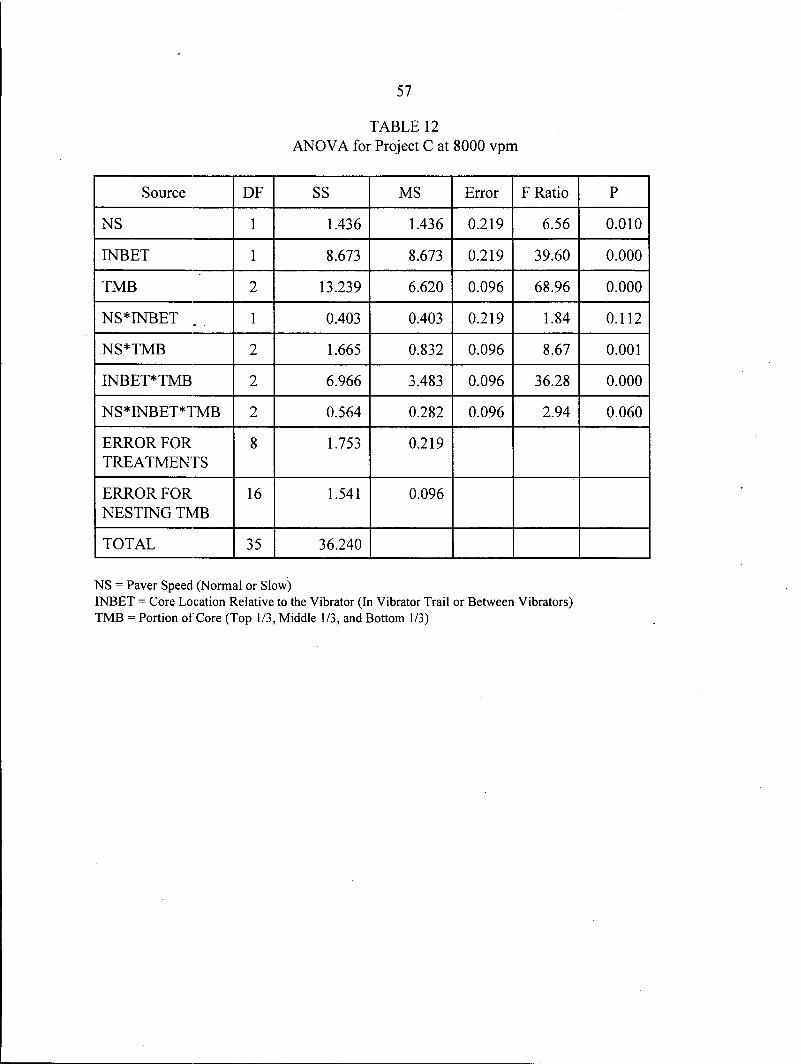
than 1 percent. An analysis of variance using only the 8000 vpm cores was calculated (Table 12,
Appendix B). The analysis indicated that the paver speed, location relative to the vibrator, and
portion of the core were significant at greater than 95 percent probability. Also, the interactions
between paver speed and portion of core; location of the core and portion of core; and paver
speed, location of core and portion of core were significant at greater than a 95 percent
probability. This indicates a very complex interaction in the consolidation of this mix.
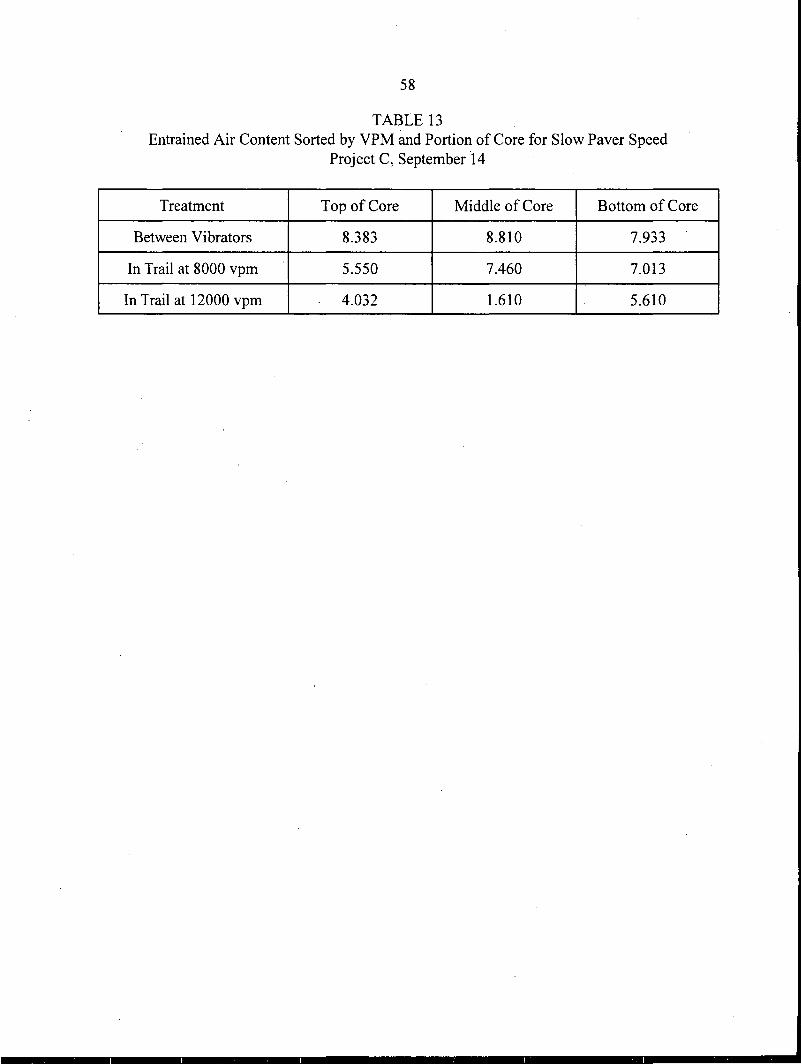
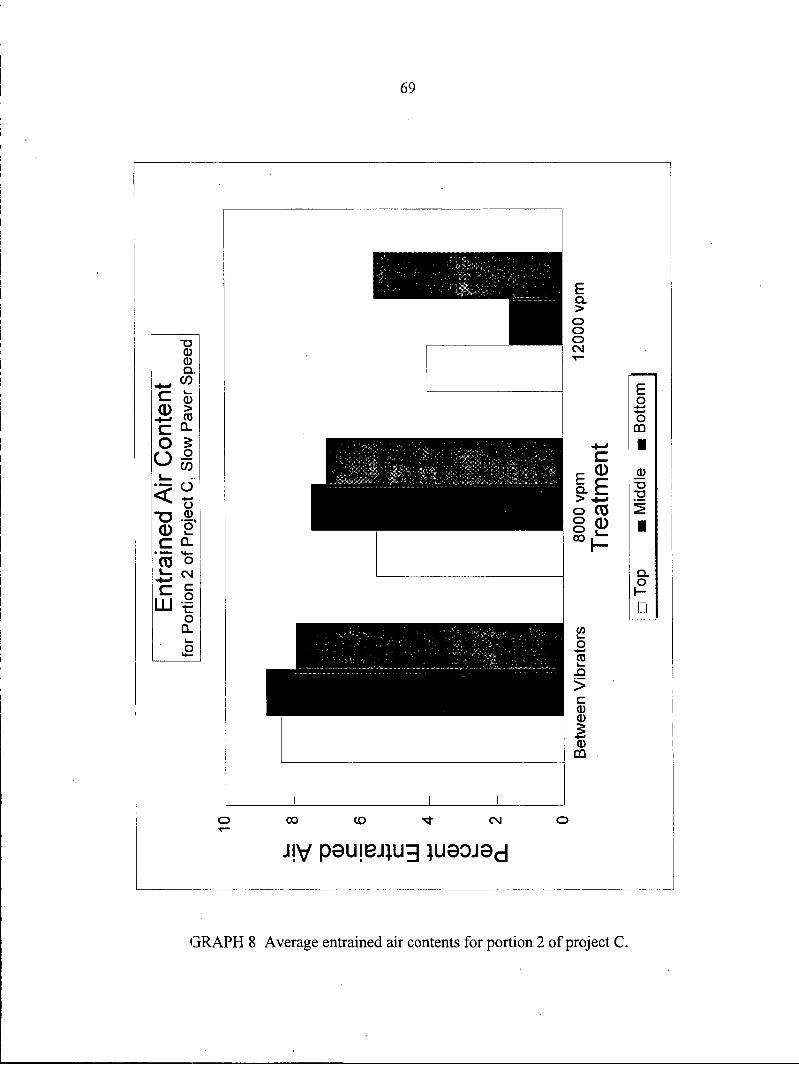
The second portion of project C involves the cores obtained from the paving of September 14.
Table 13 (Appendix B) and Graph 8 (Appendix C) have the entrained air contents by core
25
location, paver speed, and portion of the core. The top of the cores from the 8000 vpm vibrator
trail has an air content of 5.550 percent. This is similar to the top of the core at 8000 vpm from
September 12. This air content is more than 1 percent lower than the rest of the core on the
vibrator trail and more than 2 percent lower than the cores from between the vibrators.
However, the reduction in air content at 12000 vpm and in the vibrator trial is even more
dramatic. The top of these cores have an average air content of 4.032 percent and the middle of
these cores have an average air content of 1.610 percent. The fact that the middle has the lowest
entrained air content is due to the vibrator being 125 mm (5 inches) below the pan. This puts the
vibrator trail in the top of the middle portion of the core.
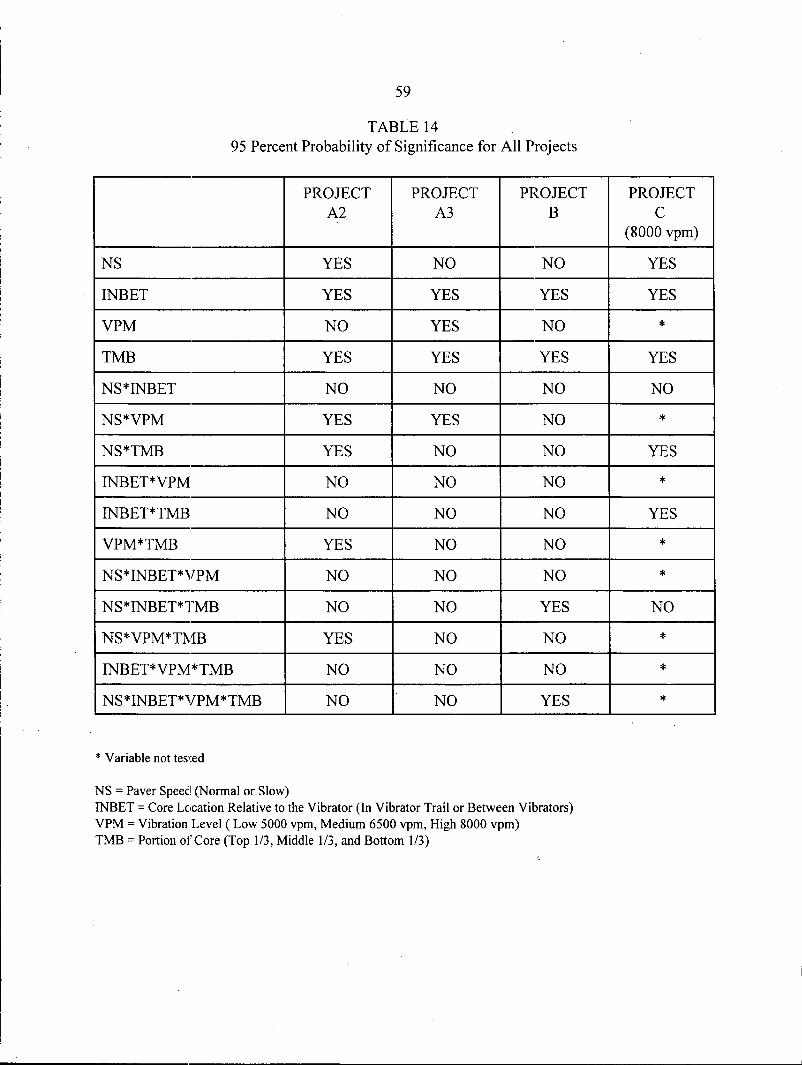
Comparisons of All Projects
A summary of the analysis of variances for all the projects is given in Table 14 (Appendix B).
This table indicates if a treatment had a 95 percent or greater probability of being significant.
The vibrator location and the portion of the core were the only variable to be found significant
for all four of the projects. Each of the variables was found to be significant on at least one
project. Four of the six two way interactions were found to be significant on at least one project.
Two of the four three way interactions were found to be significant on at least one project and the
four variable interaction was significant on one project.
Project A2 and A3 are an interesting comparison. By lowering the vibrators into the slab the
paver speed was not significant on project A3 as it was for A2. Conversely, the vibrator
26
frequency was significant for A3 and not for A2. In addition only the interaction of paver speed
and vibrator frequency was significant for both projects. Actually this was the only interaction
that was significant for A3, compared to A2 that had four different interactions that were
significant.
Project Bis very interesting; because, only four treatments were significant, but two of these
treatments were a three and four variable interaction. The fact that the interaction of all the
variables was found to be significant shows the complexity of vibrator consolidation.
Project C found many variables to be significant. Even though the vibrator frequency variable
was not included in the analysis of this project, the other three variables were significant and two
of the four interactions were significant.
The variability in which treatments were significant might be in the other uncontrolled variables
in this experiment. Each project (A, B, C) had a different paver with different vibrators and
spacing. The materials used in the PCC for each project was different. But, these variables exist
in real life and any potential method of controlling pavement consolidation must account for
these types of variables. In addition variability in the entrained air content may be effected by
variation in mix production, aggregate gradation, mix proportions, personnel, test methods,
temperature, humidity, head in grout box, pavement depth, pavement base, vibrator eccentric
weight, amplitude of vibrator, diameter of vibrator, vibrator shape, and vibrator positioning.
27
PHASE II
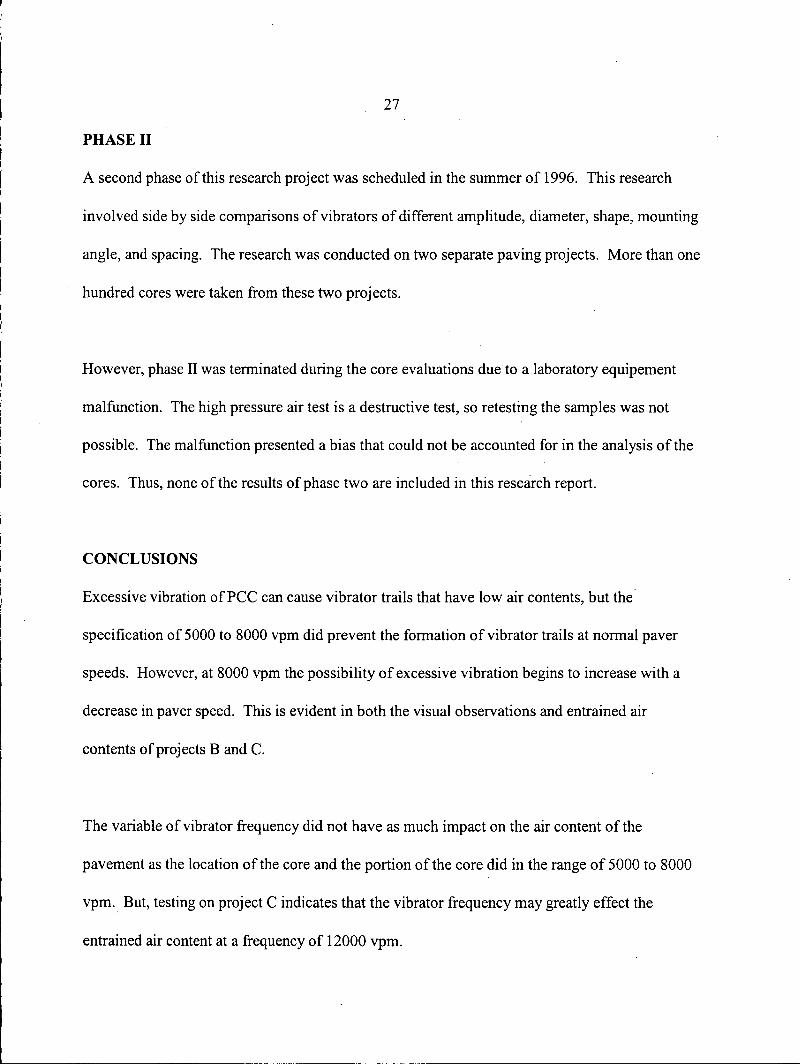
A second phase of this research project was scheduled in the summer of 1996. This research
involved side by side comparisons of vibrators of different amplitude, diameter, shape, mounting
angle, and spacing. The research was conducted on two separate paving projects. More than one
hundred cores were taken from these two projects.
However, phase II was terminated during the core evaluations due to a laboratory equipement
malfunction. The high pressure air test is a destructive test, so retesting the samples was not
possible. The malfunction presented a bias that could not be accounted for in the analysis of the
cores. Thus, none of the results of phase two are included in this research report.
CONCLUSIONS
Excessive vibration of PCC can cause vibrator trails that have low air contents, but the.
specification of 5000 to 8000 vpm did prevent the formation of vibrator trails at normal paver
speeds. However, at 8000 vpm the possibility of excessive vibration begins to increase with a
decrease in paver speed. This is evident in both the visual observations and entrained air
contents of projects Band C.
The variable of vibrator frequency did not have as much impact on the air content of the
pavement as the location of the core and the portion of the core did in the range of 5000 to 8000
vpm. But, testing on project C indicates that the vibrator frequency may greatly effect the
entrained air content at a frequency of 12000 vpm.
28
The variability in the analysis of variance affirms the complexity of the vibratory consolidation of
PCC. To overcome this complexity the number of variables introduced into the consolidation
process should be minimized by a contractor. The contractor should try to have a uniform
vibrator frequency, spacing and paver speed. This will allow the contractor to have a better
opportunity to control the consolidation and entrained air content of the PCC.
ADDITIONAL RESEARCH
More research needs to' be conducted to find ways to more uniformly consolidate PCC pavements
and to reduce the occurrence of excessive vibration and the associated loss of entrained air. The
following areas need to be researched in greater detail to determine their impact on pavement
consolidation.
I) Tilting the vibrators at an angle of I 0 to 20 degrees from the horizontal plane of the pavement
surface to increase the area of influence of the vibrator.
2) Develop a maximum vibrator spacing to ensure that the slab is uniformly consolidated based
on a study of vibrator spacings.
3) Determine the effect of vibrator diameters and amplitudes on the consolidation of PCC for
slipform paving.
4) Determine the relationship between mix design and the vibratory consolidation of PCC.
29
ADDITIONAL DEVELOPMENTS
Since the completion of this research, the Iowa DOT has been working to develop an electronic
vibratory frequency measuring device. The device will be directly linked to each vibrator, and it
will digitally display the vibrator frequency of each vibrator. These electronic devices will be
required on some paving projects in 1999. This will help contractors and inspectors reduce the
likelihood of excessive consolidation.
Also, research is continuing in the area of consolidation effort and its effect on entrained air
contents. James Cable oflowa State University is conducting a research project that involves
looking at the impact of using electronic vibration monitoring devices to control the entrained air
content of PCC in slipform paving. Image analysis is being used to determine the entrained air in
the concrete.
30
REFERENCES
1. Portland Cement Association, Design and Control of Concrete Mixtures, Thirteenth Edition, 1988
2. Iowa Department of Transportation, Office of Materials Instructional Memorandum 527, May 1998
3. Ken Hover, "Why is there air in concrete?", Concrete Construction, January 1993, pages 11-15.
4. American Concrete Institute, "Guide for Consolidation of Concrete", ACI 309R-87, 1987
5. American Concrete Institute, "Behavior of Fresh Concrete During Vibration'', ACI 309.lR-93, 1993
6. K. Jones, "Evaluation of Deterioration on US 20 in Webster County", Final Report for Iowa DOT Research Project MLR-91-1, Ames, Iowa, January 1991.
7. VJ. Marks and W.G. Dubberke, A Different Perspective for Investigation of PCC Pavement Deterioration," Interim Report for Iowa DOT Research Project HR-2074, January 1995
8. D. Starks, "Investigation of Pavement Cracking in US 20 and I-35 in Central Iowa," Construction Technologies Laboratories, Inc. , September 1992.
9. L. Forssblad ans Stif Sallstrom, "Concrete Vibration - What's Adequate?", Concrete International, September 1995, pages 42-48
10. Walker, H. N. 1992, Petrographic Methods of Examining hardened Concrete: A Petrographic Manual, VTRC Report No. 92-R14, Virginia Transportation Research Council
11. Iowa Department of Transportation Test Reports, John Lane P .E., 1993
12. Lawrence C. Bower and Burrell B. Gerhardt, The Effect of Good Vibration on the Durability of Concrete Pavement, HRR No. 357, Highway Research Board, 1971
13. W.A. Legge, Slipform Concrete pavement Consolidation Study, Bureau of Materials and Research, Kansas Department of Transportation, 1982
14. Efficient Consolidation of Concrete Using the Resonance Phenomenon, Innotech International, Inc, April 1996
31
15. B. Risser, Understanding Slipform Pavers, Concrete Construction, June 1995, pages 521-530
16. C. Sipherd, Role of Internal Vibration and the Extrusion Process Slipform Paver in Consolidation, Transportation Research Board, Committee A2F01, January 22-28, 1995
17. Treva! Powers, The Properties of Fresh Concrete, John Wiley and Sons, Inc., 1963
18. Effect of Vibration Time Upon Loss of Entrained Air from Concrete Mixes, Materials Laboratories report No. C-461, United States Department of the Interior, 1949
19. David Stark, Effect of Vibration on the Air-Void System and Freeze-Thaw Durability of Concrete, Portland Cement Association Report RD092.01T, 1986
20. Paul Stutzman, NIST, Presentation to Iowa DOT, June 12, 1998
21. Robert Elliot, Effect of Internal Vibration of Portland Cement During Paving, Physical Research Report No. 53, Illinois Department of Transportation, Bureau of Materials and Physical Research, 1974
22. H. A. Lindberg, Proper Vibration of Portland Cement Concrete Pavements,. National Experimental and Evaluation Program, Project No. 8, FHWA Notice, 1975

33
APPENDIX A FIGURES
34
FIGURE 1 Vibrating reed tackometer attached to steel rod ..
35
FIGURE 2 Longitudinal and joint cracking on US 20 in Webster County.
37
FIGURE 4 Vibrator trails in pavement surface on US 65 in Polk County.
38
FIGURE 5 Distortion of pavement surface in a vibrator trail.
39
FIGURE 6 Longitudinal distortion in the surface of a diamond ground pavement
40
FIGURE 7 Aggregate separation in the vibrator trail of a diamond ground pavement.
u ()) ()) Cl) +Cl) ())
0 Jo..
a.. () ~ ..... c 0 0 Ou ..... ..c .r::::. ·- O> > ::J ()) 0 ..... Jo..
()) .r::::. .r::. I-
~
41
()) .....
--~8
FIGURE 8 Location of cores relative to vibrator trails.
c Cl) ()) Jo..
()) .9 ~ 2 +- .n ()) ·cc >
42
FIGURE 9 Variation in elevation of vibrators relative to paving pan.
43
ON VIBRATOR 8000 VPM
SLOW Pf, VER SPEED VIBRATOHS O" OOWN
FIGURE 10 Cores from project B showing aggregate segregation near the top.
ON VIBRATOR 12000 VPM
44
BETWEEN VIBRATORS
FIGURE 11 Cores from project C revealing a vibrator trail.

45
APPENDIXB TABLES
Treatment Paver Speed
1 Slow
2 Slow
3 Slow
4 Slow
5 Slow
6 Slow
7 Normal
8 Normal
9 Normal
10 Normal
11 Normal
12 Normal
46
TABLE 1 Experimental Design
Location Relative Vibrator to Vibrator Trail Frequency
(vpm)
In 8000
In 6500
In 5000
Between 8000
Between 6500
Between 5000
In 8000
In 6500
In 5000
Between 8000
Between 6500
Between 5000
Portion of Core Repetitions
(Nested) (n)
Top 3 Middle 3 Bottom 3
Top 3 Middle 3 Bottom 3
Top 3 Middle 3 Bottom 3
Top . 3 Middle 3 Bottom 3
Top 3 Middle 3 Bottom 3
Top 3 Middle 3 Bottom 3
Top 3 Middle 3 Bottom 3
Top 3 Middle 3 Bottom 3
Top 3 Middle 3 Bottorri 3
Top 3 Middle 3 Bottom 3
Top 3 Middle 3 Bottom 3
Top 3 Middle 3 Bottom 3
47
TABLE2 Paver and Project Data
Project Project Project Project A-2 A-3 B c
Number of vibrators 22 22 17 15
Maximum spacing between vibrators (mm) 460 460 660 740
Minimum spacing between vibrators (mm) 230 230 360 360
Spacing between test vibrators (mm) 410 380 660 360
Vibrator centrifugal force at 10000 vpm (N) 7870 7870 5560 7870
Vibrator elevation below paver pan (mm) 0 100 0 0
Design thicknes5 of pavement (mm) 300 300 300 300
Design width of pavement (m) 7.9 7.9 7.9 7.9
Iowa Mix design number C-3WR-C20 C-3WR-C20 C-4WR-C20 C-3WR-C20
48
TABLE3 Descriptive Statistics of Entrained Air For Project A2
Variable Level N Mean Standard Deviation
Paver Speed Normal 54 9.175 1.306 Slow 54 8.106 1.708
Location of In Trail 54 8.426 1.623 Core Between Trails 54 8.855 1.622
Vibrator 8000 36 8.657 1.967 Frequency 6500 36 8.702 1.401
5000 36 8.563 1.508
Portion of Core Top 36 6.913 0.897 Middle 36 9.097 1.266 Bottom 36 9.911 0.875
All Cores 108 8.641 1.629
Source DF
NS 1
INBET 1
VPM 2
TMB 2
NS*INBET 1
NS*VPM 2
NS*TMB 2
INBET*VPM 2
INBET*TMB 2
VPM*TMB 4
NS*INBET*VPM 2
NS*INBET*TMB 2
NS*VPM*TMB 4
INBET*VPM 4 *TMB
NS*INBET*VPM 4 *TMB
ERROR FOR 24 TREATMENTS
ERROR FOR 48 NESTINGTMB
TOTAL 107 NS= Paver Speed (Normal or Slow)
49
TABLE4 ANOV A for Project A2
SS MS Error
30.8054 30.8054 0.6869
4.9580 4.9580 0.6869
0.3585 0.1792 0.6869
173.0215 86.5107 0.3095
0.1365 0.1365 0.6869
6.3624 3.1812 0.6869
9.9749 4.9874 0.3095
1.4703 0.7351 0.6869
0.3180 0.1590 0.3095
13.2932 3.3233 0.3095
0.0816 0.0408 0.6869
0.2788 0.1394 0.3095
8.9761 2.2440 0.3095
0.8567 0.2142 0.3095
1.7979 0.4495 0.3095
16.4845 0.6869
14.8577 0.3095
284.0320
F Ratio
44.85
7.22
0.26
279.52
0.2
4.63
16.11
1.07
0.51
10.74
0.06
0.45
7.25
0.69
1.45
INBET =Core Location Relative to the Vibrator (In Vibrator Trail or Between Vibrators)· VPM =Vibration Level ( Low 5000 vpm, Medium 6500 vpm, High 8000 vpm) TMB =Portion of Core (Top 1/3, Middle 1/3, and Bottom 1/3)
p
0.000
0.006
0.757
0.000
0.796
0.014
0.000
0.329
0.582
0.000
0.939
0.629
0.000
0.672
0.211
50
TABLES Descriptive Statistics of Entrained Air For Project A3
· Variable Level N Mean Standard Deviation
Paver Speed Normal 54 8.594 1.441 Slow 54 8.481 1.627
Location of In Trail 54 8.252 1.464 Core Between Trails 54 8.823 1.557
Vibrator 8000 36 8.010 1.516 Frequency 6500 36 8.168 1.441
5000 36 9.434 1.241
Portion of Core Top 36 7.316 0.916 Middle 36 8.683 1.631 Bottom 36 9.614 0.959
All Cores 108 8.537 1.531
,------------------
Source DF
NS 1
INBET 1
VPM 2
TMB 2
NS*INBET 1
NS*VPM 2
NS*TMB 2
INBET*VPM 2
INBET*TMB 2
VPM*TMB 4
NS*INBET*VPM 2
NS*INBET*TMB 2
NS*VPM*TMB 4
INBET*VPM 4 *TMB
NS*INBET*VPM 4 *TMB
ERROR FOR 24 TREATMENTS
ERROR FOR 48 NESTINGTMB
TOTAL 107 NS= Paver Speed (Normal or Slow)
51
TABLE 6 ANOV A for Project A3
SS MS Error
0.3389 0.3389 0.6868
8.8008 8.8008 0.6868
43.8678 21.9339 0.6868
96.1802 48.0901 0.9753
0.7617 0.7617 0.6868
12.3397 6.1699 0.6868
2.6391 1.3195 0.9753
3.0155 1.5077 0.6868
0.7423 0.3712 0.9753
1.4226 0.3556 0.9753
4.0159 2.0080 0.6868
1.2359 0.6179 0.9753
9.0683 2.2671 0.9753
2.3900 0.5975 0.9753
0.6948 0.1737 0.9753
16.4843 0.6868
46.8134 0.9753
250.8112
F Ratio
0.49
12.81
31.94
49.31
1.11
8.98
1.35
2.20
0.38
0.36
2.92
0.63
2.32
0.61
0.18
INBET =Core Location Relative to the Vibrator (In Vibrator Trail or Between Vibrators) VPM =Vibration Level (Low 5000 vpm, Medium 6500 vpm, High 8000 vpm) TMB =Portion of Core (Top 1/3, Middle 1/3, and Bottom 1/3)
p
0.438
0.001
0.000
0.000
0.213
0.001
0.255
0.112
0.675
0.696
0.059
0.523
0.098
0.700
0.509 I I
I !
I I
I
52
TABLE 7 Descriptive Statistics of Entrained Air For Project B
Variable Level N Mean Standard Deviation
Paver Speed Normal 54 7.028 1.235 Slow 54 7.110 1.331
Location of In Trail 54 6.672 1.109 Core Between Trails 54 7.466 1.323
Vibrator 8000 36 6.566 0.934 Frequency 6500 36 7.291 1.383
5000 36 7.350 1.349
Portion of Core Top 36 6.461 1.271 Middle 36 7.264 1.076 Bottom 36 7.483 1.277
All Cores 108 7.069 1.279
Source DF
NS 1
INBET 1
VPM 2
TMB 2
NS*INBET 1
NS*VPM 2
NS*TMB 2
INBET*VPM 2
INBET*TMB 2
VPM*TMB 4
NS*INBET*VPM 2
NS*INBET*TMB 2
NS*VPM*TMB 4
INBET*VPM 4 *TMB
NS*INBET*VPM 4 *TMB
ERROR FOR 24 TREATMENTS
ERROR FOR 48 NESTINGTMB
TOTAL 107
NS= Paver Speed (Normal or Slow)
53
TABLE 8 ANOV A for Project B
SS MS Error
0.179 0.179 2.281
17.009 17.009 2.281
13.710 6.855 2.281
20.863 10.431 0.643
0.017 0.017 2.281
4.342 2.171 2.281
0.689 0.345 0.643
6.051 3.026 2.281
0.845 0.423 0.643
2.315 0.579 0.643
2.215 1.108 2.281
4.133 2.067 0.643
4.230 1.058 0.643
4.262 1.066 0.643
8.480 2.120 0.643
54.742 2.281
30.859 0.643
174.940
F Ratio
0.08
7.46
3.01
16.23
0.01
0.95
0.54
1.33
0.66
0.90
0.49
3.21
1.64
1.66
3.30
INBET =Core Location Relative to the Vibrator (In Vibrator Trail or Between Vibrators) VPM =Vibration Level (Low 5000 vpm, Medium 6500 vpm, High 8000 vpm) TMB =Portion of Core (Top 1/3, Middle 1/3, and Bottom 1/3)
p
1.339
0.005
0.055
0.000
3.928
0.371
0.573
0.255
0.508
0.572
0.594
0.043
0.244
0.238
0.025
54
TABLE9 Average Entrained Air Contents by Treatment for Project C
Vibrator Paver Speed Location Number of Average Standard Frequency Relative to Samples Deviation
(vpm) Vibrator(s)
All 18 7.698 0.578 5000 Normal In Trail 9 7.454 0.544
Between 9 7.942 0.532
All 18 7.498 1.007 8000 Normal In Trail 9 6.901 1.073
Between 9 8.094 0.451
All 18 7.098 1.017 8000 Slow In Trail 9 6.713 0.637
Between 9 7.483 1.207
55
TABLE IO Average Entrained Air Contents for the Top of the Cores In Project C
Frequency Paver Speed
(vpm)
5000 Normal
8000 Normal
8000 Slow
Number of Samples
3
3
3
Average
7.317
5.510
5.173
Standard Deviation
0.318
0.244
0.257
56
TABLE 11 Descriptive Statistics of Entrained Air for Project C at 8000 vpm
Variable Level N Mean Standard Deviation
Paver Speed Normal 18 7.498 1.007 Slow 18 7.098 1.017
Location of In Trail 18 6.807 1.112 Core Between Trails 18 7.789 0.621
Portion of Core Top 12 6.453 1.301 Middle 12 7.597 0.432 Bottom 12 7.845 0.461
All Cores 36 7.298 1.018
57
TABLE12 ANOV A for Project C at 8000 vpm
Source DF SS MS Error F Ratio
NS 1 1.436 1.436 0.219 6.56
INBET 1 8.673 8.673 0.219 39.60
TMB 2 13.239 6.620 0.096 68.96
NS*INBET 1 0.403 0.403 0.219 1.84 ..
NS*TMB 2 1.665 0.832 0.096 8.67
INBET*TMB 2 6.966 3.483 0.096 36.28
NS*INBET*TMB 2 0.564 0.282 0.096 2.94
ERROR FOR 8 1.753 0.219 TREATMENTS
ERROR FOR 16 1.541 0.096 NESTINGTMB
TOTAL 35 36.240
NS= Paver Speed (Normal or Slow) INBET =Core Location Relative to the Vibrator (In Vibrator Trail or Between Vibrators) TMB =Portion of Core (Top 1/3, Middle 1/3, and Bottom 1/3)
p
0.010
0.000
0.000
0.112
0.001
0.000
0.060
58
TABLE 13 Entrained Air Content Sorted by VPM and Portion of Core for Slow Paver Speed
Project C, September 14
Treatment Top of Core Middle of Core Bottom of Core
Between Vibrators 8.383 8.810 7.933
In Trail at 8000 vpm 5.550 7.460 7.013
In Trail at 12000 vpm 4.032 1.610 5.610
59
TABLE14 95 Percent Probability of Significance for All Projects
PROJECT PROJECT PROJECT A2 A3 B
NS YES NO NO
INBET YES YES YES
VPM NO YES NO
TMB YES YES YES
NS*INBET NO NO NO
NS*VPM YES YES NO
NS*TMB YES NO NO
INBET*VPM NO NO NO
INBET*TMB NO NO NO
VPM*TMB YES NO NO
NS *INBET*VPM NO NO NO
NS *INBET*TMB NO NO YES
NS*VPM*TMB YES NO NO
INBET*VPM *TMB NO NO NO
NS *INBET*VPM*TMB NO NO YES
* Variable not tested
NS = Paver Speed! (Normal or Slow) INBET =Core Location Relative to the Vibrator (In Vibrator Trail or Between Vibrators) VPM =Vibration Level (Low 5000 vpm, Medium 6500 vpm, High 8000 vpm) TMB =Portion of Core (Top 1/3, Middle 1/3, and Bottom 1/3)
PROJECT c
(8000 vpm)
YES
YES
*
YES
NO
*
YES
*
YES
*
*
NO
*
*
*

61
APPENDIXC GRAPHS
62
-
Q) ..... 0
(..) -0
I
E 0 = I 0
CD c: 0 t I 0 a.. I
J!1 "O
I "O
~
0 I
a. >- I
I (.)
I c: Q)
Q)
.c 0 I I-
::J C" Q) ..... u.
~ .....
c 0 -Q) m .....
E .0 5
~
I co Q) s.... ..... Q) .....
0 (..) -0 I c: 0
+:: m (.)
10 .....J
co ·c
i co
I > ~N .c <( -s.... (.)
<( (I)
·e-1 I ""O a.. i
Q) I
c co s.... ~
c UJ
0 0 0 co
0 0 LO <D
0 I 0
! 0 LO
.!!1 "iii .... I-ai @:t;.tr.:tpif¥£#1k~i.5A'fffW%!?:-'/)Vl1Jf,A1.,~2rl'.b:~t>J;'!~ s-:-:.:;~--.:z~J1tt~y:;hi-'£t~y.-r5 . .-:.-,y~.1
i= I ~
i;;-·~--1
@j ~ ! O I U5 ~~~~~~~~~~~~~---;
m E .... I 0 "'O z (I)
' I I I I I (I)
i N 0 co <.O ~ N 0 ~I I
""""" T""" (I) '
J!V' pau!eJlLI3 lU8:>J8d ~ GRAPH 1 Average entrained air content by variable for project A2.
SPEED . Normal
•Slow
_.,
---~· =-------------
~I I 0-
•
- -_, ------...-
-·· . -
63
Interaction Plot for Project A2
~>', - - - .. ,.__ - ... .---- - - -- .... - ------ ------------·--- ~ '.
" ~.
IN-BET .__ . Between ~" -__ ..... _____
a:: • • ~' '··""'',.
• In '• •
• aood'PM .__
• -~ .... - co--~-,. -~ ._, ~-- - . -. • 6500 --~
'>-• 5000
,,
- ~ TMB - •Top - .. - - - -0- - - - - -.
• Middle
-- --- - - - ... . - - - - - - - ·- - - - - - - ... ·- - - - - • Bottom
GRAPH 2 Interactions of variables for project A2.
1 1 I
10
8
6
10
8
6
10
8
6
10
8
6
0
~ ""C :::c: w > <: (!) >; Pl
(JQ (!)
(!)
a >; Pl -· ::s (!) 0.. Pl ::;· (') 0 ::s -(!)
a Vl
r::r '<: <: ~. §. (D'"
S' >;
"C >;
.£. (!) (') -> w
12
"- 10 -
<c Normal
"O Q) 8 -
c co "-.,._,
6 c f--
w .,._, c 4 Q) f--
(.) "-Q)
a... 2 -
0
I o Paver Speed
Slow -
--~-----·--·-·--·-·------------------~-----~
Entrained Air by Variable Project A3
Between Trails In Trail
5000
6500
Treatment
8000
Top
Bottom
Middle -
MJ Location of Core •Vibrator Frequency o Portion of Core
~·---------------------------------~---------~
65
Interaction Plot for Project A3
I
SPEED • Normal
~><: ~~, I ·-
1·
-~ . ' ~.
• Slow
10.0
8.5
7.0
I IN-BET
• On ~~ =~ 1 I
~
• ' ' ', '~ ---------·· --~ '•
1 -- ........................... ~ -· ' • Between 'o
I I ·~ i
~ • 8oodf PM I - i " I •,__ -~ ·-
I
_, - - -· . - - • 6500
-_, - ::-: --:: :_ ...... ---:_::-:_-:----- -_, - ._........ .
--.
I - -" . - - -· --"
• 5000 __ , .
•
10.0
8.5
7.0
10.0
8.5
7.0
= ---- ~ TMB - •Top "- ' . •
t - - - -II - - - ' - - -
0- - - - - ' - --. -- • Middle • - ---. - - - - -.- - - - - - - - - - .. . - - - --- -- --- - --- ... ·- - •Bottom - ~ T
10.0
8.5
7.0
GRAPH 4 Interactions of variables for project A3.
I
66
Q)
~ Ir-~~~~~~~~~~~
~
0 0 LO <O
0 0 0 LO
.!E. -~ I-
ro
~ 1~~~~~~~~~~----1
I-
0 0 0 co
E 1'--~~~~~~~~~~----1 0 z
I I I
co <.O N 0
+J c Q)
E +J ro Q) Lo
I-
GRAPH 5 Average entrained air contents by variable for project B.
~ 0 () -0 c 0 t
,Q
I~ I
..... 0 -~ ..c 5 I
~ 0 () -0 c 0
:.;::::; rn (.)
0 ....J
i~
"O Q) Q) a.
U) ..... ~ rn a.. 0
SPEED • Normal
• Slow
--------- ...
• • - - - - - - .. . - - - - - - - - - - - - - - - ..
67
Interaction Plot for Project B
>~. . .
IN-BET • Between
• In
. --.
•
1
8
:::-:----. ---.~
----~ -17 ~.
• I
•Top TMB
• Middle
•Bottom
'•
ls I
6
7
GRAPH 6 Interactions of variables for project B.
Q) .C E ro g·co ro o >~ .... ~.E .c ...-
!..... c: ·- 0 <( :e "'C ci: Q) -c () -ro ~ s..... .......
..... 0
'c 0: jUJ
N 0
E 0
::::: 0
CD
21 ·~ IC Q) Q)
~ Q)
CD
m § 0 z
co
68
~ 0 () -0 c: 0 :e 0 a.. I Q) ..... .... 0 c ()
Q) -E 0 c: ..... 0 ro ~
Q) ctl (.) s..... 0
I- ....J
I i
I I -c I Q)
I Q) I C.. I U)
I~ 1~ tD L_____J
N 0
GRAPH 7 Average entrained air for portion 1 of project C at 8000 vpm.
[J.1 c © Q) >
+-' co c (L 0 ~ () 0
Cl) s.... ·- () ~ t5 "'C -~. m e c (L
·- -· mo: !:;N c c::
0 Wt:
0 (L
69
N
E a. >
0 0 0
!N
0
~
E 0 ~ 0 co
+-' I c
E Q) a>
g. .5 ~ om ~ g ~ I co I-
I
~-f!! 0 -~ .c 5 c:: Q)
~ Q)
co
GRAPH 8 Average entrained air contents for portion 2 of project C.

71
APPENDIXD TEST METHODS
Page l of 7 72
Test Method No. Iowa 407-B December 1991
IOWA DEPARTMENT OF TRANSPORTATION HIGHWAY DIVISION
Office of Materials
METHOD OF TEST FOR UETERMINATION OF AIR CONTENT OF PORTLAND CEMENT CONCRETE CORES USING A HIGH PRESSURE AIR METER
PART I, AIR CONTENT OF CONCRETE CORES
Scope
The amount of air in portland cement concrete is a factor that can result in longer life, greater versatility, and better economy. The proper amount of air content will greatly improve the quality, appearance, and placeability of concrete. The air content of cores drilled from pavement, pavement widening, bridges, etc., is determined by a high pressure air meter.
·In addition, water absorption in paste by volume of the core can also be determined.
A. Apparatus and Materials
1. High pressure air meter (Fig. 1 and 2).
2. Specimen stirrup for lowering the specimen into the compression chamber.
3. Core soaking container.
4. Liquid solution of 20 grams sodium borate, 5 gram sodium chromate, and one gallon water.
5. Oven (300° F .) •
6. Scale (capacity= 7,000 grams, accuracy= 0.5 gram).
B. Test Record Forms
l. Data and calculation sheet (Fig. 3).
2. "P.C.C. core strength - air -absorption" coding sheet.
J. Strength and air field book with columns of core number, dry weight, absorbed weight, weight in water, zero reading, and observed dial reading.
C. Test Procedure
l. Dry th~ core specimen in an oven at 300 F. for a period of 72 hours.
2. Cool the spec irnen at room temperature for a period of approximately 3 hrs.
3. Weigh the speci~en in air.
4. Soak the specimen in the soaking container for a period of 48 hours.
5. Weigh the specimen in water.
6. Wipe the excess water off the specimen using an absorbent cloth.
7. Weigh the specimen in air (absorbed weight).
8. Using the stirrup, lower the spec i -men into the compression chamber.
9. Close the elliptical lid tightly, such that one-quarter to one-half inch of liquid remains on the top.
10. Remove the trapped air as follows: with a small head pressure, let the liquid flow into the ·chamber at the low side valve and out of the chamber at the high side valve. Be sure that all the trapped air is removed by checking for air bubbles in the beaker which is used as a receiver of the liquid from the high side valve.
il. When all the trapped air is out of the compression chamber, close both valves tightly.
12. Turn the transmission switch to the (D) down position. The cylinder piston will begin to move downward, the distance of which is indicated by the dial reading. When there is no further visual movement of the dial, note the pressure gauge, and use a correction of 0.05 divisions of the dial for every 100 psi. differential from 5,000 psi. Thus, if the dial reading is 4.81 revolutions and the pressure gauge reads 4,900 psi., the recorded dial reading should be 4.86 revolutions. If the pressure gauge reads 5,060 psi., the recorded reading would be 4.78 revolutions.
i3. Loosen the lid screw a half-turn to prevent it from locking up.
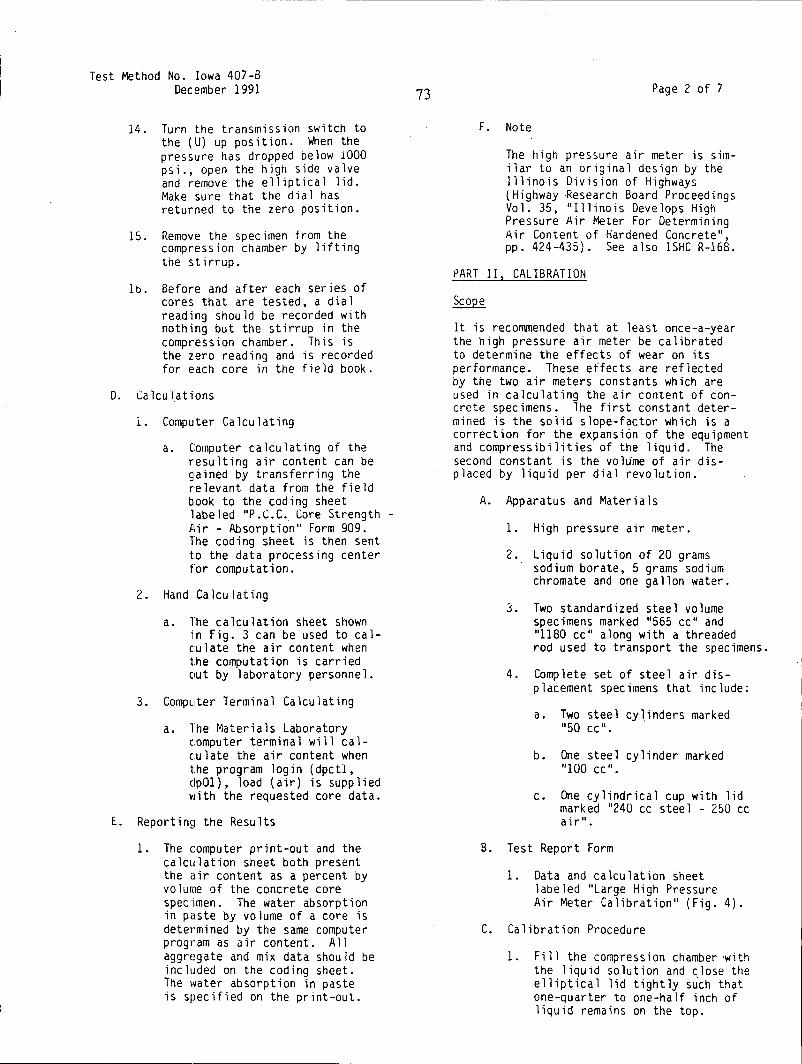
Test Method No. Iowa 407-B Dec ember 1991
14. Turn the transmission switch to the (U) up position. When the pressure has dropped below 1000 psi., open the high side valve and remove the e 11 ipt ica l lid. Make sure that the dial has returned to the zero position.
15. Remove the specimen from the compression chamber by lifting the stirrup.
lb. Before and after each series of cores that are tested, a dial reading should be recorded with nothing but the stirrup in the compression chamber. This is the zero reading and is recorded for each core in the field book.
0. Calcu.lations
i. Computer Calculating
a. Computer calculating of the resulting air content can be gained by transferring the relevant data from the field book to the coding sheet labeled "P .C.C. Core Strength -P.ir - Absorption" Form 909. The coding sheet is then sent to the data processing center for computation.
2. Hand Calculating
a. The calculation sheet shown in Fig. 3 can be used to calculate the air content when the computation is carried out by laboratory personnel.
3. Computer Terminal Calculating
a. The Materials Laboratory computer terminal will calculate the air content when the program login (dpctl, clpOl), load (air) is supplied with the requested core data.
E. Report i n~1 the Results
1. The computer print-out and the calculation sheet both present the air content as a percent by volume of the concrete core specimen. The water absorption in paste by volume of a core is determined by the same computer program as air content. All aggregate and mix data should be included on the coding sheet. The water absorption in paste is specified on the print-out.
73 Page 2 of 7
F. Note
The high pressure air meter is sirni lar to an original design by the Illinois Division of Highways (Highway Research Board Proceedings Vol. 35, "Illinois Develops High Pressure Air Meter For Determining Air Content of Hardened Concrete", pp. 424-435). See also ISHC R-168.
PART II, CALIBRATION
Scope
It is recommended that at least once-a-year the high pressure air meter be calibrated to determine the effects of wear on its performance. These effects are reflected by the two air meters constants which are used in calculating the air content of concrete specimens. The first constant determined is the solid slope-factor which is a correction for the expansion of the equipment and compressibilities of the liquid. The second constant is the vol~me of air displaced by liquid per dial revolution.
A. Apparatus and Materials
1. High pressure air meter.
2. Liquid solution of 20 grams sodium borate, 5 grams sodium chromate and one gallon water.
3. Two standardized steel volume specimens marked "565 cc" and "1180 cc" along with a threaded rod used to transport the specimens.
4. Complete set of steel air displacement specimens that include:
a. Two steel cyl_inders marked "50 cc".
b. One steel cylinder marked "100 cc".
c. One cylindrical cup with lid marked "240 cc steel - 250 cc air".
B. Test Report Form
1. Data and ca lcu lat ion sheet labeled "Large High Pressure Air Meter Calibration" (Fig. 4).
C. Calibration Procedure
1. Fi 11 the compression chamber ·with the liquid solution and close the elliptical lid tightly such that one-quarter to one-half inch of liquid remains on the top.
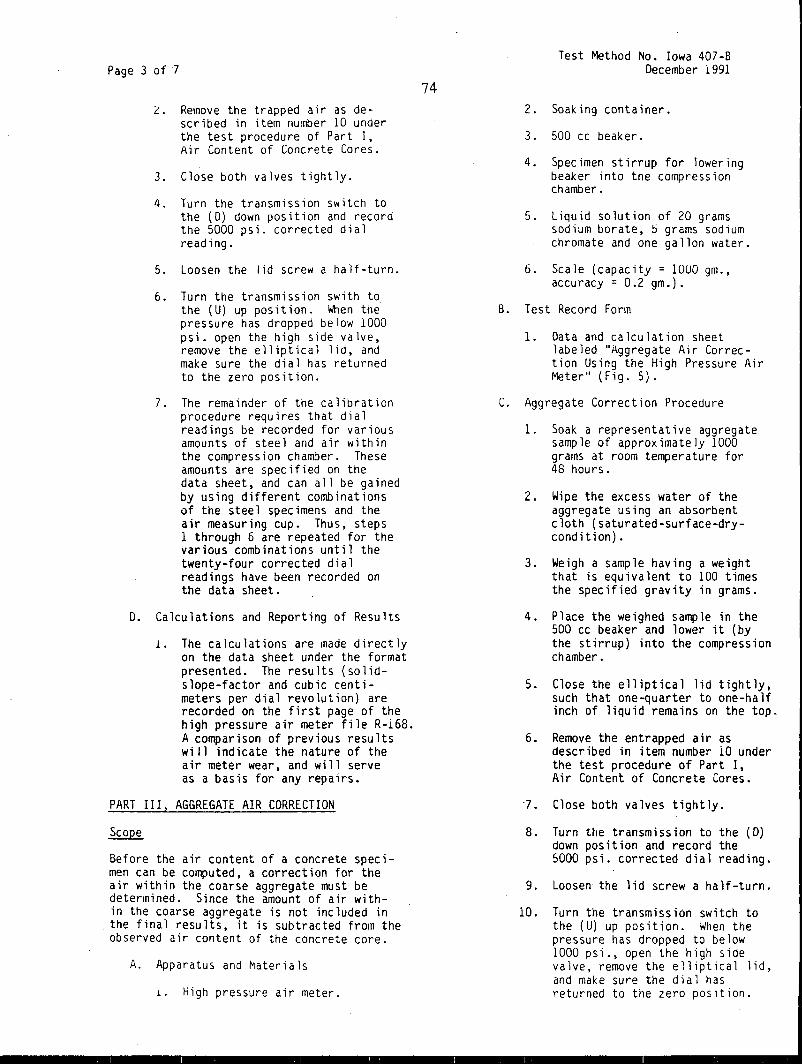
Page 3 of 1
i. Remove the trapped air as described in item number 10 under the test procedure of Part I, Air Content of Concrete Cores.
3. Close both valves tightly.
4. Turn the transmission switch to the (0) down position and record the 5000 psi. corrected dial reading.
5. Loosen the lid screw a half-turn.
6. Turn the transmission swith to the (U) up position. When the pressure has dropped below 1000 psi. open the high side valve, remove the elliptical lid, and make sure the dial has returned to the zero position.
7. The remainder of the calibration procedure requires that dial readings be recorded for various amounts of steel and air within the compression chamber. These amounts are specified on the data sheet, and can all be gained by using different combinations of the steel specimens and the air measuring cup. Thus, steps 1 through 6 are repeated for the various combinations until the twenty-four corrected dial readings have been recorded on the data sheet.
0. Calculations and Reporting of Results
l. The calculations are made directly on the data sheet under the format presented. The results (solidslope-factor and cubic centimeters per dial revolution) are recorded on the first page of the high pressure air meter file R-168. A comparison of previous results wi 11 indicate the nature of the air meter wear, and will serve as a basis for any repairs.
PART Ill, AGGREGATE AIR CORRECTION
Scope
Before the air content of a concrete specimen can be computed, a correction for the air within the coarse aggregate must be determined. Since the amount of air within the coarse aggregate is not included in the fina·1 results, it is subtracted from the observed air content of the concrete core.
A. Apparatus and tv1aterials
i. High pressure air meter.
74
Test Method No. Iowa 407 -B December 1991
2. Soaking container.
3. 500 cc beaker.
4. Specimen stirrup for lowering beaker into the compression chamber.
5. Liquid solution of 20 grams sodium borate, S grams sodium chromate and one gallon water.
6. Scale (capacity= 1000 gm., accuracy= 0.2 gm.).
B. Test Record Form
1. Data and calculation sheet labeled "Aggregate Air Correction Using the High Pressure Air Meter" (Fig. 5).
C. Aggregate Correction Procedure
1. Soak a representative aggregate sample of approximately 1000 grams at room temperature for 48 hours.
2. Wipe the excess water of the aggregate using an absorbent cloth (saturated-surface-drycondition).
3. Weigh a sample having a weight that is equivalent to 100 times the specified gravity in grams.
4. Place the weighed sample in the 500 cc beaker and lower it (by the stirrup) into the compression chamber.
5. Close the elliptical lid tightly, such that one-quarter to one-half inch of liquid remains on the top.
6. Remove the entrapped air as described in item number 10 under the test procedure of Part I, Air Content of Concrete Cores.
·1. Close both valves tightly.
8. Turn the transmission to the (D) down position and record the 5000 psi. corrected dial reading.
9. Loosen the lid screw a half-turn.
10. Turn the transmission switch to the (U) up position. When the pressure has dropped to below 1000 psi., open the high side valve, remove the elliptical lid, and make sure the dial has returned to the zero position.
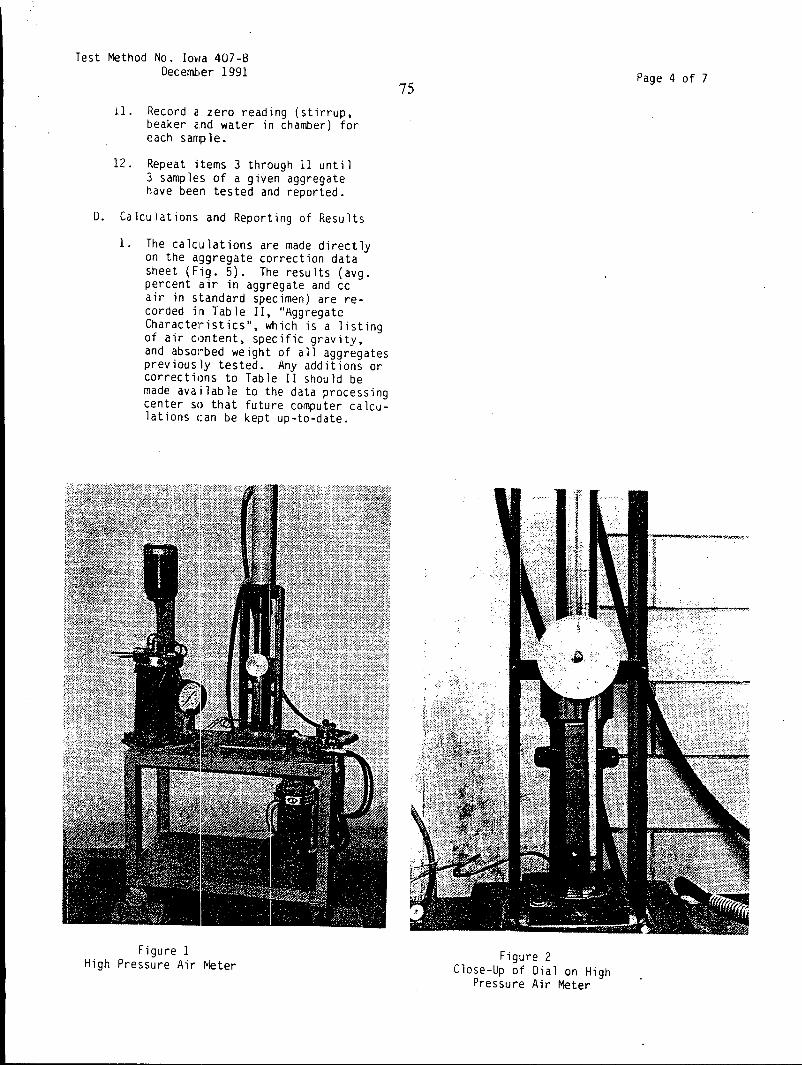
Test Method No. Io~1a 407-B December 1991
11. Record a zero reading (stirrup, beaker a.nd water in chamber) for each sample.
12. Repeat items 3 through 11 until 3 samples of a given aggregate have been tested and reported.
D. Calculations and Reporting of Results
1. The calculations are made directly on the aggregate correction data sheet (Fig. 5). The results (avg. percent air in aggregate and cc air in standard specimen) are recorded in Table II, "Aggregate Characte:rist ics", which is a listing of air content, specific gravity, and absorbed weight of all aggregates previously tested. Any additions or corrections to Table II should be made available to the data processing center so that future computer calculations can be kept up-to-date.
Figure 1 High Pressure Air ~~ter
75
Figure 2 Close-Up of Dial on High
Pressure Air Meter
Page 4 of 7
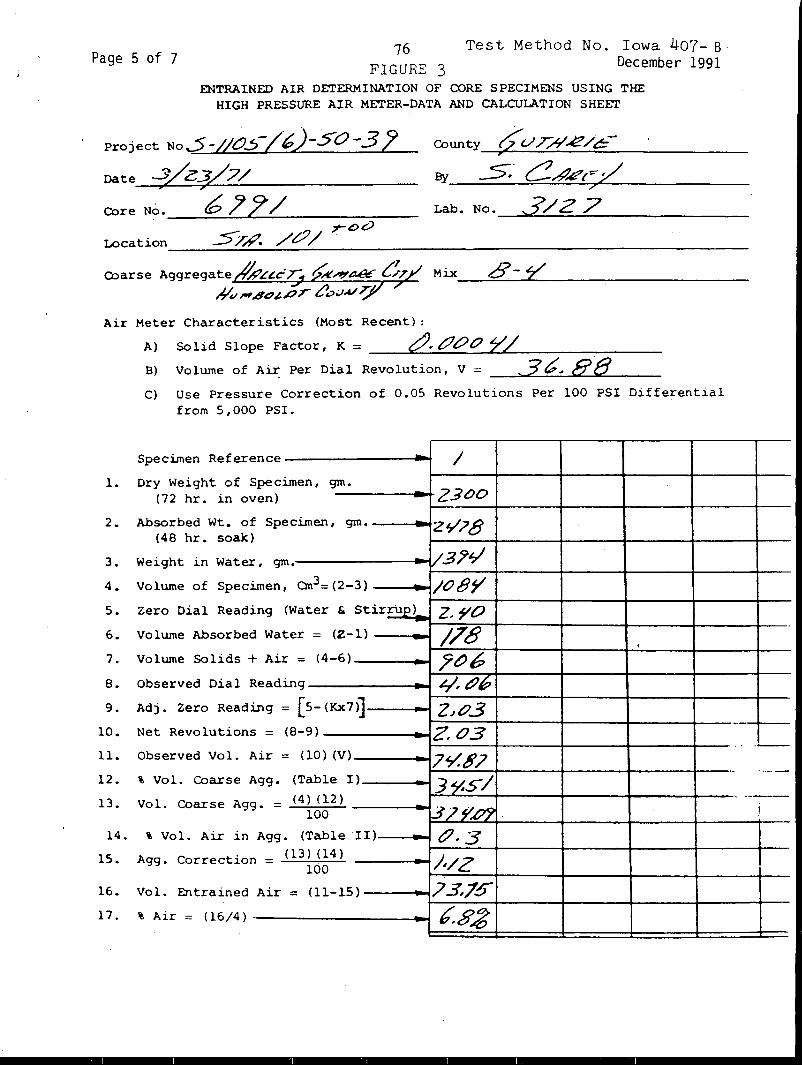
76 Test Method No. Iowa 407- B · Page 5 of 7
FIGURE 3 December 1991 '
ENTRAINED AIR DETERMINATION OF CORE SPECIMENS USING THE HIGH PRESSURE AIR ME'TER-DATA AND CALCULATION SHEET
Project NoJ'-l/CJ.5-/6)-50-3 J County 6ur,#.R/e:->
Date .J/z3/?/ By _s-.· C#~,~ / > > /
Core No. 6/?/ Lab. No. 3/27
5T#. /t:?/ r-oc:J
Location
Coarse Aggregate~L£e/.. ~,,,.a8!" l~7/ Mix 8-7" #v,,, .IUJ~ P ;r t'"J..V Ti
r
Air Meter Characteristics (Most Recent):
A) Solid Slope Factor, K = ~*t/OCJ 5// B) Volume of Aiz: Per Dial Revolution, V = ,.36, BB C) Use Pressure Correction of 0.05 Revolutions Per 100 PSI Differential
from 5, 000 PSI.
Specimen Reference - I l. Dry Weight of Specimen, gm.
(72 hr. in oven) 2300
2. Absorbed Wt. of Specimen, gm. 21/?8 (48 hr. soak)
3. Weight in Water, gm. - 37~
4. Volwne of Specimen, an3=(2-3) ;o8y 5. Zero Dial Reading (Water & Stirrup) z.yo 6. Volwne Absorbed (Z-1) /78
-Water = .
7. Volume Solids + Air = (4-6) J't()6 8. Observed Dial Reading ¥.t?6 9. Adj. Zero Reading = [s- (Kx7>] 2J03
-10. Net Revolutions = (8-9) Z.03
·--11. Observed Vo 1. Air = (10) (V) 7~ef7 .. ·---12. % Vol. Coarse Agg. (Table I) 3~S/ 13. Vol. Coarse Agg. = (4) (12) ~----
-100 37¥.CJJ !
14. % Vol. Air in Agg. (Table II) tl.3 15. Agg. Correction = (13) (14) /,/z 100
16. Vol. Entrained Air = (11-15) 73,/5 17. % Air = ( 16/4) b.8$
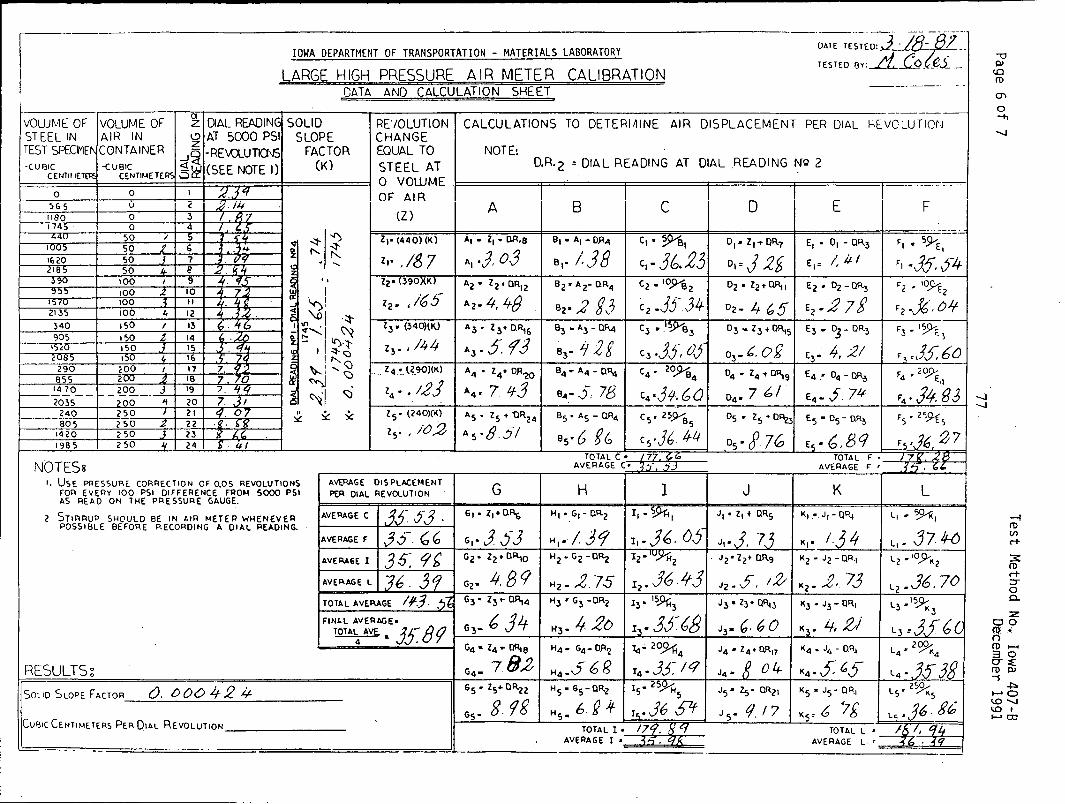
,---- -~ATE TE-~~~O: j . 78_--i3f ~-IOWA DEPARTMENT OF TRANSPORTATION - MATERIALS.LABORATORY
TESTED 6Y:A cOZe.i _ LARGE HIGH PRESSURE AIR METER CALIBRATION
-------· - . CATA ANO CALCULATION SHEET
--VOLUME OF VOLUME OF
a DIAL READING SOLID RE'/OLUTLON CALCULATIONS TO DETERIAINE AIR DISPLACEMENT PER DIAL hE vc :_u T 1m~ z
STEEL IN AIR IN ~ AT 5000 PSI SLOPE CHANGE
TEST SPECIMEI\ CONTAINER _/5 -RE\U..UTIO\JS FACTOR EQUAL TO NOTE:
·CUSIC -<U81C 4<t (SEE NOTE I) (K) STEEL AT D.R. 2 " DIAL READING AT DIAL _READING NQ 2
C Ef4Tll-IETER: CSNTIME T(R'.: .slil 0 VOWME. ---- ...
0 0 I 2. -,q OF AIR
I '.:>G 5 0 2 .2. i.11 A B c D E F 1180 0 3 I . '/ (Z) 1745 0 4 I , -~ - - --=---<;<tU 50 I 5 ''J, ~1~ Z1•(440)(K) A1 • Z1 • D.R,9 81 • A1 -0.1'1.4 C1• ~. 0 1 • Z1.,. OR.7 E1 • 01 - OR.3 Fl • 59-'E, <l 100, 50 f 6 . 1-+ 1 "' " Al • .J, o.3 s,. !.38 ci-30 . .23 IG20 so J 7
. ' . ...... Z1• .18 7 01=J2& E1= I, iJ. I F1 -J5.S4 2185 so i: e ~ . I(;.
~ ·390 9 . "- '' lz• (390XKl C2 • 10.9"82 --100 I Az• 22•0R.12 8 2" A 2- O.R.4 Oz• Z2•ClRi1 Ez • Dz - OR.3 ., • 10Ji2 9:>:> 100 .2 10 7 w I
ma 100 • II cc
~! Zz • .105 Az• If, 4-8 8 2· 2 9J cz.JS34 E2 • ,2 7 g • 2 -JG·. Oif - Oz. 4 05 2135 100 " 12 .. ·~ <f
'\i> I . ::t c 340 150 I 13 b. ''b I
~'I ~ z 3 • (340)(1<.) A3 • Z3• 0.~6 63 • A3 - Qf<.4 C3 "-'~63 03 • Z3 •DP.is E3 - D3- OR3 F3 •I~~ 905 150 .t 14 ' . °//'I '! - I il).l- z3 • / /44 A3.5.f3 83- i/2i 15;0 150 f 15 . q4
. ~ I :::t- '> C3°JJ, OJ o3-'· Of (3
• 4, ;2/ ., :JS. 60 iOB:> 150 " 11; 'fl) I"-290 200 I 17 7. ~ ?
~ ~i '~ .... Z 4 .~. l2.90)(K) A4 • z4 + ORzo B4 • A4 - 0~ C4 • 2°..9'84 04 • Z4 -t DR,9 E4 .• D4. ~ F4 • 2<?9f: 855 2'"' 1- 18 7 70 ~ . z4 •• 1,2J A4• 7. If 3 4
14 70 200 J 19 7. ~q
~ ~·1 ~ 84• S 78 C4 ·31/-. G () 04· 7 t:, I E4- .j JLf F4• J4. 86 1.----- L.-- ---· 7 . . 51 2035 '00 it 20
240 250 I 21 ·"· 07 II ~ ~ ls. (240)(K) AS • Z5 + U1'~24 65 • A5 - QR4 ( 5 r 25.9'0 o5 • z5 ~ o~ Es• 05- Q~ F5 • 2~9-f 5 805 250 2 22 . H( ~
z5• , /0,2 5 1420 250 J 23 LC. As·8.5/ 85• 6 gr;, Cs•Jb. /;-/_/ Os· J170 E~· 6,BC/ F~·.16 :2 7 198 5 250 " 24 q. I
TOTAL(• /77 G.IO TOTAL F • 17'2 2H
NOTESs AVERAGE C• '.l:i· .,. ·1 AVERAGE F : 1~·"" I, USE PRESSURE CORRECTION OF 0.05 REVOLUTIONS A~GE DIS PLACEMENT
G H l J K L FOP. EVERY 100 PSI Dll'FERENCE FROM SOOO PSI PE?. DIAL REVOLUTION AS READ ON THE PRESSURE GAUGL
2 STIRRUP SHOULD BE IN t.IR METER WHENEVER AVERAGE C .?S SJ. G1. z,+u~ H1 • G1-0R.z Ii-~, JI • Z1 t UR.5 K1 .•.J1-QR4 L1 ·~1 POS518LE BEFORE P.ECORDING A OIAL READING.
G1• J. SJ H1• / 39 11-J6. OS J1·3. ?.) 1.3 4 L1 • .37. /f() AVERAGE F JS.(;(; K1•
AVERAGE I 3 s-. 9b Gz· Zz+OR.10 Hz. G2 -O.R.z Iz·TU~2 . J2• 2z+ OR.9 1<2 • Jz -aR.1 L2 • 10_9--K2
AVEP.AGE L 36. 39 Gz• 4.8<? Hz- ,1,_l-5 Iz. J6 · -'f 3 J2. 5, ;Z, K2• _2, 73 L2 .J6. 70 TOTAL AVERAGE IP.3. ,,1 G3 • Z3t- OR,4 HJ, G3 -OR.2 l3• ·~3 J3 • Z3• Ol'\i3 K3 • J3 - OR.1 L3·1~3 FINS..L AVERAGE•
G3- b JI+ HJ• 4 20 13• 3J~68 J3. (;. 6 0 K3. '-f, ZI Lp3f 6l TOTA~ AVE. ,,_ }!/ 8? G4 • Z4.- ~8 H4• G4-D.R'2 ~~ 20..91:; K4. J4 - D.R~ 2~
4 J4 • Z4 + D.R17 L4, K4
RESULTS~ G4
• 7fJ_2 H4.5 6 g I4 • 33~ /C/ J4• i 04 K4.s C,j L4• 353~ Souo SLOPE FACTOR cJ. 000 42 4 65 • Z5 .. UR.22 HS• GS - OR.z 15• zsYH5 Js• Zs• 0Rz1 l<s•J5·QR.1 L • 2~ 5 K5
Gs- 8. 9& H 6 §.If- r~-J6 SZf- J s· f/_ I 7 Ks' b lg Lo> J6 ·gr; s• Cuf31C CENTIMETERS PER Q1AL REVOLUTION TOTAL l • 17C/. S(q TOTAL L • 1[<)1, q4
AVERAGE t • -<-=--.UC.- AVERAGE L , :u .. ~Q - .. - -· .. -· - .
-l ro Vl rt
3: ro rt :::r 0 0.
:::z 00 ~ ~ ro ..... 30 er~ ro Ill ) ~
t-'O ~......,
~I ..... ro
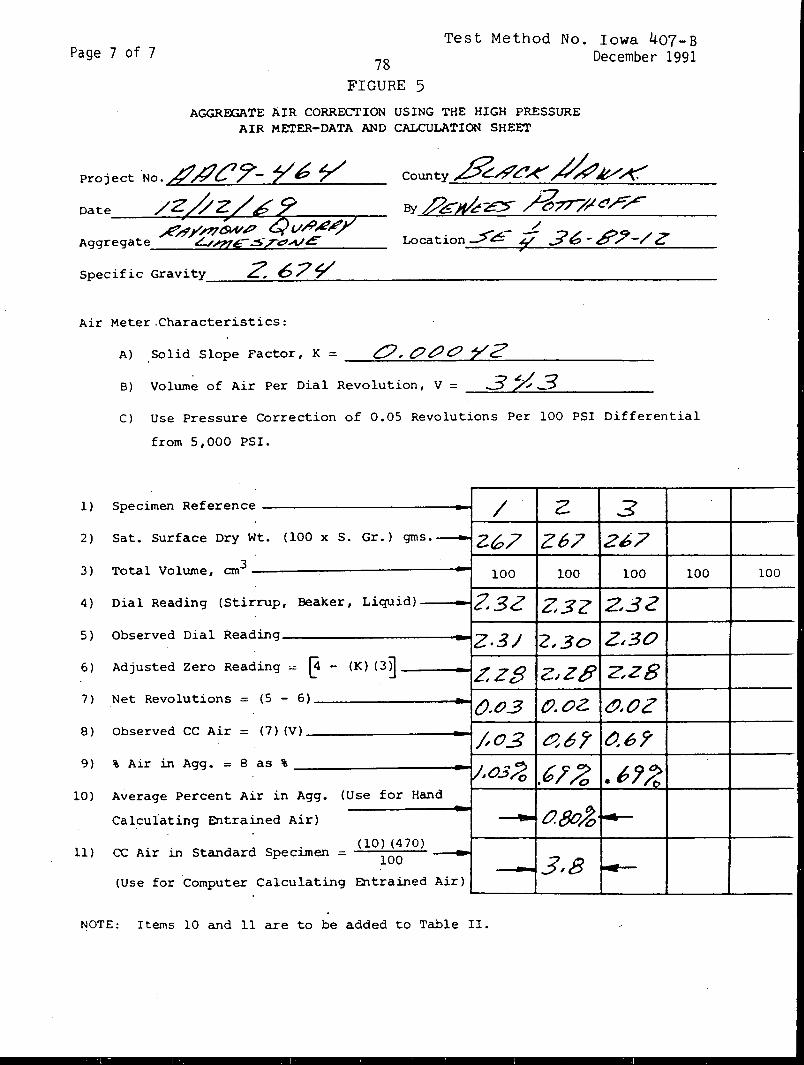
Page 7 of 7 78
FIGURE 5
Test Method No. Iowa 407-B December 1991
AGGREGATE AIR CORRECTION USING THE HIGH PRESSURE AIR METER-DATA AND CALCULATION SHEET
Air Meter.Characteristics:
County~,,?7e7,<' ~~K By &!lk~- /l~~r/
/ Location~6- ,Y- 36-R.?-/ Z
A) Solid Slope Factor, K = 0, t?t:/CJ YZ
B) Volume of Air Per Dial Revolution, V = _...;::3=-...£/{_,,--=-3:.:;...._ ____ _
C) Use Pressure Correction of 0.05 Revolutions Per 100 PSI Differential
from 5,000 PSI.
1) Specimen Reference -------------.! / 2 3 2) Sat. surface Dry Wt. (100 x S. Gr.) gms. - 267 z 67 267
3) Total Volume, cm3 -----------__.,.-i 100 100 100
4) Dial Reading
5) Observed Dial
(Stirrup, Beaker,
:Reading
Liquid) -~2.3Z Z3Z Z32
z.3/ 2,30 Z~30 6) Adjusted Zero Reading - ti - (K) (3~
7) Net Revolutions = (5 - 6)
8) Observed CC Air = ( 7) (V)
9) \ Air in Agg. = 8 as %
10) Average Percent Air in Agg. (Use for Hand
Calculating Entrained Air)
11) cc Air in Standard Specimen = (10) (470) 100 ___..
().~3 tJ. oz &.oz
100 100
(Use for Computer Calculating Entrained Air) ...._ __ --1. ___ _._ ___ ..J....--~L-----
NOTE: Items 10 and 11 are to be added to Table II.
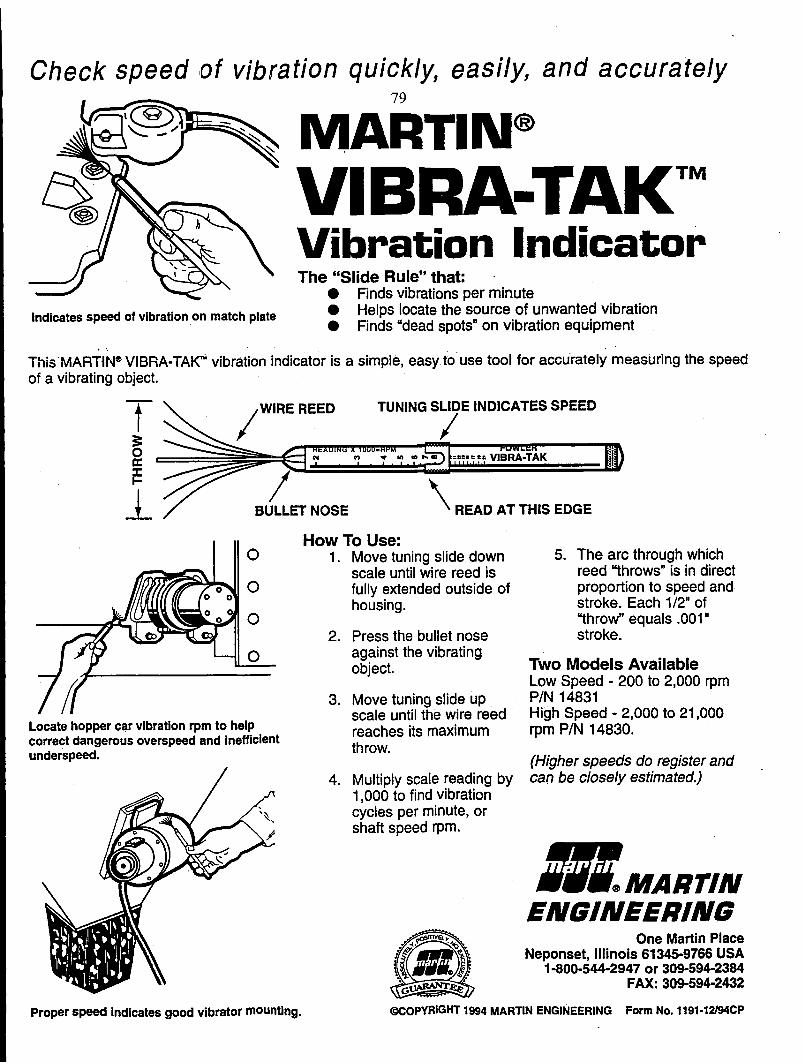
Check speed of vibration quickly, easily, and accurately
Indicates speed of vibration.on match plate
79
MARTIN® VIBRA-TAKTM Vibration Indicator The "Slide Rule" that:
• Finds vibrations per minute • Helps locate the source of unwanted vibration • Finds "dead spots" on vibration equipment
This MARTI Ne VI BRA-TAK"' vibration indicator is a simple, easy.to use tool for accurately measuring the speed of a vibrating object.
T 3: 0 a: i=
TUNING SLIDE INDICATES SPEED
I
J_ BULLET NOSE \ READ AT THIS EDGE
0
0
0
0
Locate hopper car vibration rpm to help correct dangerous overspeed and Inefficient underspeed.
Proper speed Indicates good vibrator mounting.
How To Use: 1. Move tuning slide down
scale until wire reed is fully extended outside of housing.
2. Press the bullet nose against the vibrating object.
3. Move tuning slide up scale until the wire reed reaches its maximum throw.
4. Multiply scale reading by 1,000 to find vibration cycles per minute, or shaft speed rpm.
5. The arc through which reed "throws" is in direct proportion to speed and stroke. Each 1/2" of "throw" equals .001 • stroke.
Two Models Available Low Speed - 200 to 2,000 rpm P/N 14831 High Speed - 2,000 to 21,000 rpm P/N 14830.
(Higher speeds do register and can be closely estimated.)
-MARTIN ENGINEER/NG
One Martin Place Neponset, Illinois 61345-9766 USA
1-800-544-2947 or 309-594-2384 FAX: 309-594-2432
@COPYRIGHT 1994 MARTIN ENGINEERING Form No.1191-12/94CP
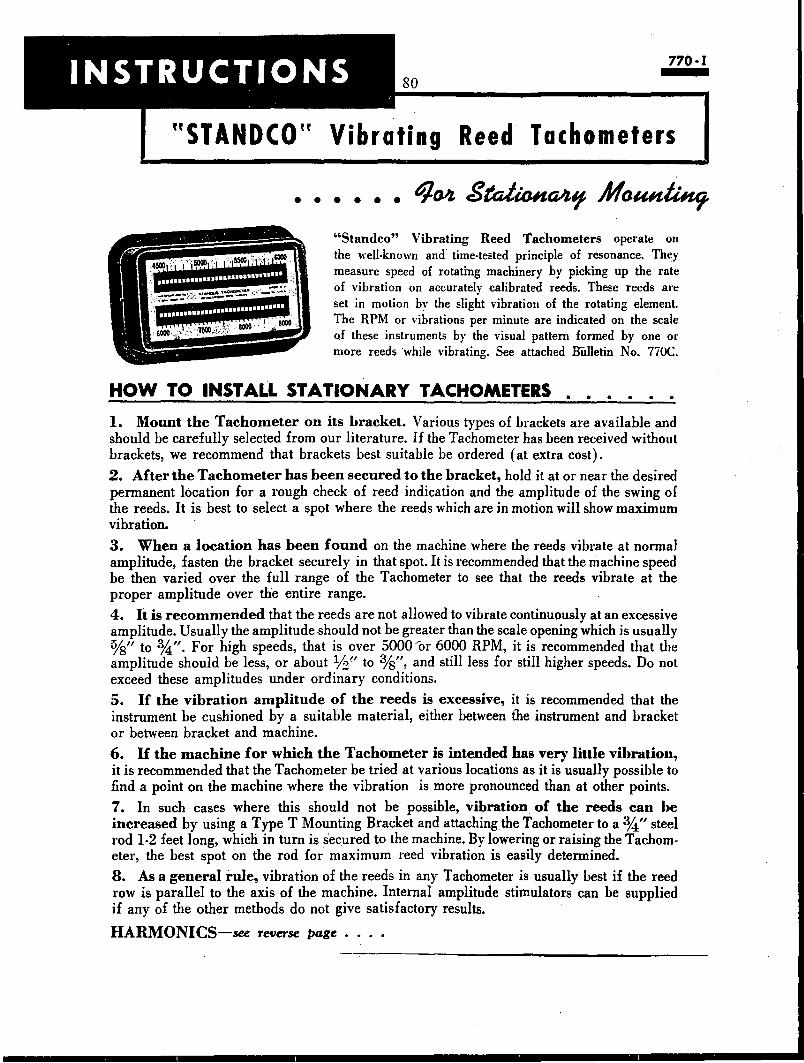
INSTRUCTIONS 80
770·1
"STANDCO" Vibrating Reed Tachometers
• • • • • • "Stan<lco" Vibrating Reed Tachometers operate on the well-known and time-tested principle of resonance. They measure speed of rotating machinery by picking up the rate of vibration on accurately calibrated reeds. These reeds arc set in motion by the slight vibratiou of the rotating element. The RPM or vibrations per minute are indicated on the scale of these instruments by the visual pattern formed by one or more reeds while vibrating. See attached BUiletin No. 770C.
HOW TO INSTALL STATIONARY TACHOMETERS
I. Mount the Tachometer on its bracket. Various types of Lrackets are available and should be carefully selected from our literature. If the Tachometer has been received without brackets, we recommend that brackets best suitable be ordered (at extra cost).
2. After the Tachometer has been secured to the bracket, hold it at or near the desired permanent location for a rough check of reed indication and the amplitude of the swing of the reeds. It is best to select a spot where the reeds which are in motion will show maximum vibration.
3. When a location has been found on the machine where the reeds vibrate at normal amplitude, fasten the bracket securely in that spot. It is recommended that the machine speed be then varied over the full range of the Tachometer to see that the reeds vibrate at the proper amplitude over the entire range.
4. It is recommended that the reeds are not allowed to vibrate continuously at an excessive amplitude. Usually the amplitude should not be greater than the scale opening which is usually o/s" to 34". For high speeds, that is over 5000,,.or 6000 RPM, it is recommended that the amplitude should be less, or about 1h~' to %", and still less for still higher speeds. Do not exceed these amplitudes under ordinary conditions.
5. If the vibration amplitude of the reeds is excessive, it is recommended that the instrument be cushioned by a suitable material, either between tbe instrument and bracket or between bracket and machine.
6. If the machine for which the Tachometer is intended has very little vibration, it is recommended that the Tachometer be tried at various locations as it is usually possible to find a point on the machine where the vibration is more pronounced than at other points.
7. In such cases where this should not be possible, vibration of the reeds can be increased by using a Type T Mounting Bracket and attaching the Tachometer to a 34" steel rod 1-2 feet long, which in turn is _secured to the machine. By lowering or raising the Tachometer, the best spot on the rod for maximum reed vibration is easily determined.
8. As a general rule, vibration of the reeds in any Tachometer is usually best if the reed row is parallel to the axis of the machine. Internal amplitude stimulators can be supplied if any of the other methods do not give satisfactory results.
HARMONICS-see Tet1erse page ••••
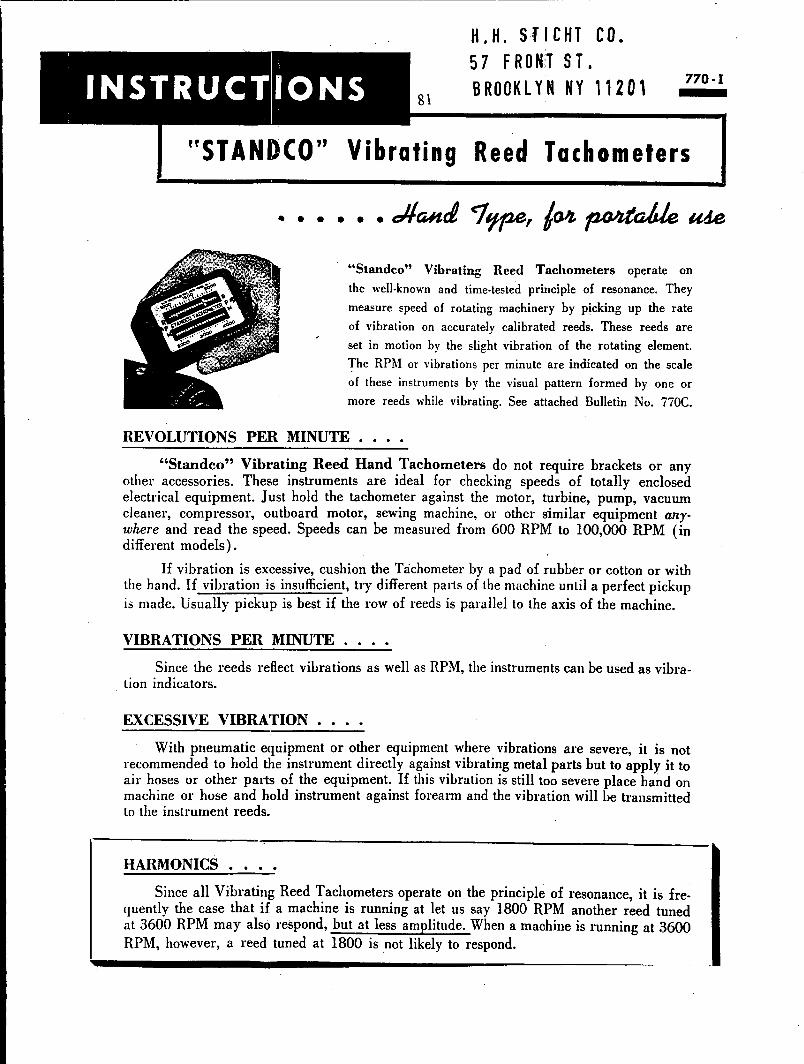
H.H. SflCHT CO.
. INSTRUcrj10Ns 81
5 7 F R 0 Nil s T I BROOKLYN NY 11201 770-I
"STANDCO" Vibrating Reed Tachometers
"Standco" Vibrating Reed Tachometers operate on
the well-known and time-tested principle of resonance. They
measure speed of rotating machinery by picking up the rate
of vibration on accurately calibrated reeds. These reeds are
set in motion by the slight vibration of the rotating element.
'fhe RPl\1 or vibrations per minute are indicated on the scale
of these instruments by the visual pattern formed by one or
more reeds while vibrating. See attached Bulletin No. 770C.
REVOLUTIONS PER MINUTE . • . .
"Standco" Vibrating Reed Hand Tachometers do not require brackets or any other accessories. These instruments are ideal for checking speeds of totally enclosed electrical equipment. Just hold the tachometer against the motor, turbine, pump, vacuum cleaner, compressor, outboard motor, sewing machine, or other similar equipment anywhere and read the speed. Speeds can be measured from 600 RPM to 100,000 RPM (in different models).
If vibration is excessive, cushion the Tachometer by a pad of rubber or cotton or with the hand. If vibration is insufficient, try different parts of the machine until a perfect pickup is made. Usually pickup is best if the row of reeds is parallel to the axis of the machine.
VIBRATIONS PER MINUTE ...•
Since the reeds reflect vibrations as well as RPM, the instruments can be used as vibration indicators.
EXCESSIVE VIBRATION
With pneumatic equipment or other equipment where vibrations are severe, It is not recommended to hold the instrument directly against vibrating metal parts but to apply it to air hoses or other pa1ts of the equipment. If this vibration is still too severe place hand 011
machine or hose and hold instrument against forearm and the vibration will be transmitted to the instrument reeds.
HARMONICS ••
Since all Vibrating Reed Tachometers operate on the principle of resonance, it is frequently the case that if a machine is running at let us say 1800 RPM another reed tuned at 3600 RPM may also respond, but at less amplitude. When a machine is running at 3600 RPM, however, a reed tuned at 1800 is not likely to respond.
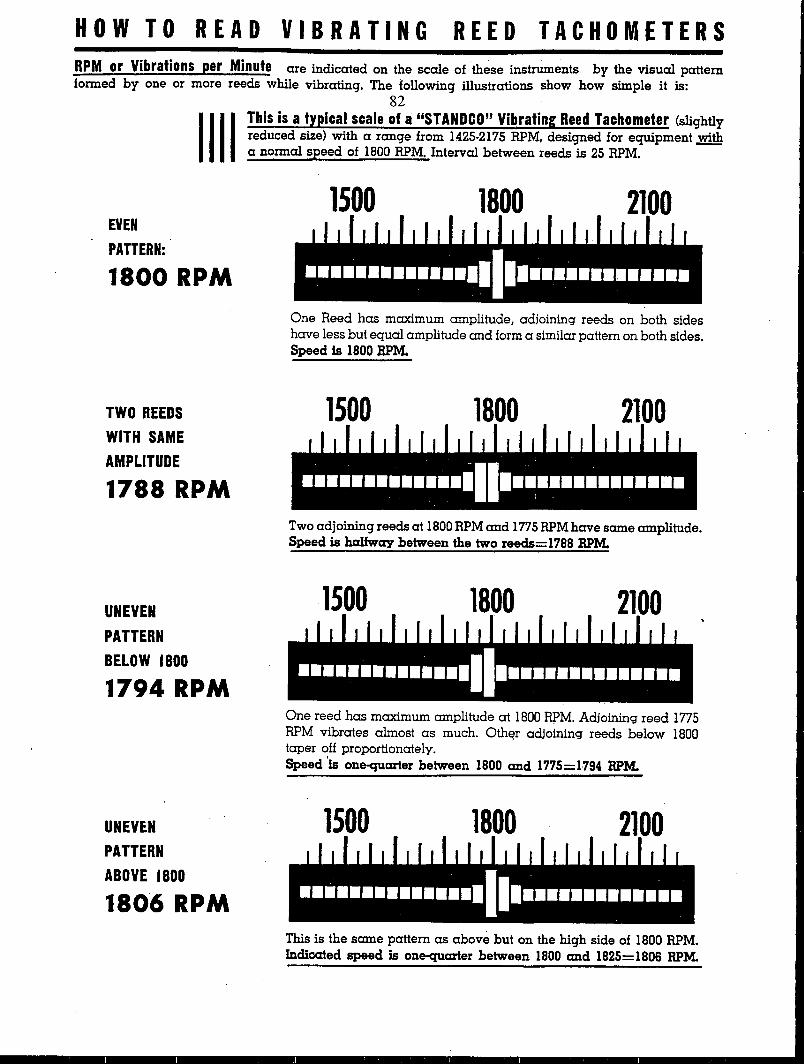
HOW TO READ VIBRATING REED TACHOMETERS RPM or Vibrations per Minute are indicated on the scale of these instruments by the visual pattern formed by one or more reeds while vibrating. The following illustrations show how simple it is:
82
1111 This is a typical scale of a "STANDCO" Vibrating Reed Tachometer (slightly reduced size) with a range from 1425-2175 RPM. designed for equipment with a normal speed of 1800 RPM. Interval between reeds is 25 RPM.
EVEN
PATTERN:
1800 RPM
TWO REEDS
WITH SAME
AMPLITUDE
1788 RPM
UNEVEN
PATTERN
BELOW 1800
1794 RPM
UNEVEN
PATTERN
ABOVE 1800
1806 RPM
1500 1800
One Reed has maximum amplitude, adjoining reeds on both sides have less but equal amplitude and form a similar pattern on both sides. Speed is 1800 RPM.
1500 1800 2100
Two adjoining reeds at 1800 RPM and 1775 RPM have same amplitude. Speed is halfway between the two reeds= 1788 RPM.
1500 1800
One reed has maximum amplitude at 1800 RPM. Adjoining reed 1775 RPM vibrates almost as much. Oth~r adjoining reeds below 1800 taper off proportionately. Speed
0
is one-qumter between 1800 and 1775=l794 RPM.
1500 1800
This is the same pattern as above but on the high side of 1800 RPM. Indicated speed is one-qumter between 1800 and 1825=1806 RPM.
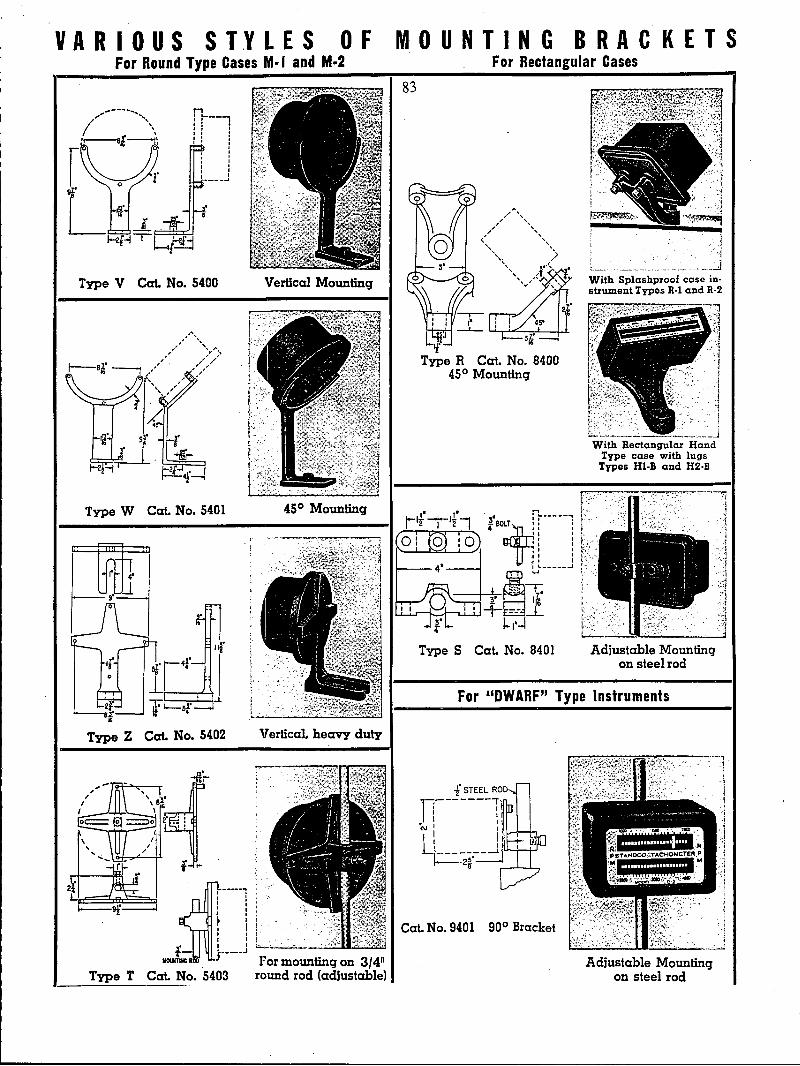
VARIOUS ST.YLES 0 F For Round Type Cases M· f and M·2
.., : r----, '' ' '' ' i: j
' ' ' ' ' ' ' , _____ J
Type V Cat. No. 5400
Type W Cat. No. 5401
Type Z Cat. No. 5402
Type T Cat. No. 5403 For mounting on 3/4"
round rod (adjustable)
MOUNTING BRACKETS
83
For Rectangular Cases
Type S Cat. No. 8401
j ·. .j
............ : .... _. _____ ........ J With Splashproof case instrument Types R·l and R-2
Lh;,~'.):;~.0~ . . ' -1 . . '
_._ ___________ , .. , .... --~ With Rectangular Hand
Type case with lugs Types Hl·B and H2·B
Adjustable Mounting on steel rod
For "DWARF" Type Instruments
f STEEL ROD
n~------T , I Ii
"'I '1
L! ! 1----------'-1 t---·2i ~-'--'~
Cat. No. 9401 90° Bracket
Adjustable Mounting on steel rod

85
APPENDIXE RAW DATA
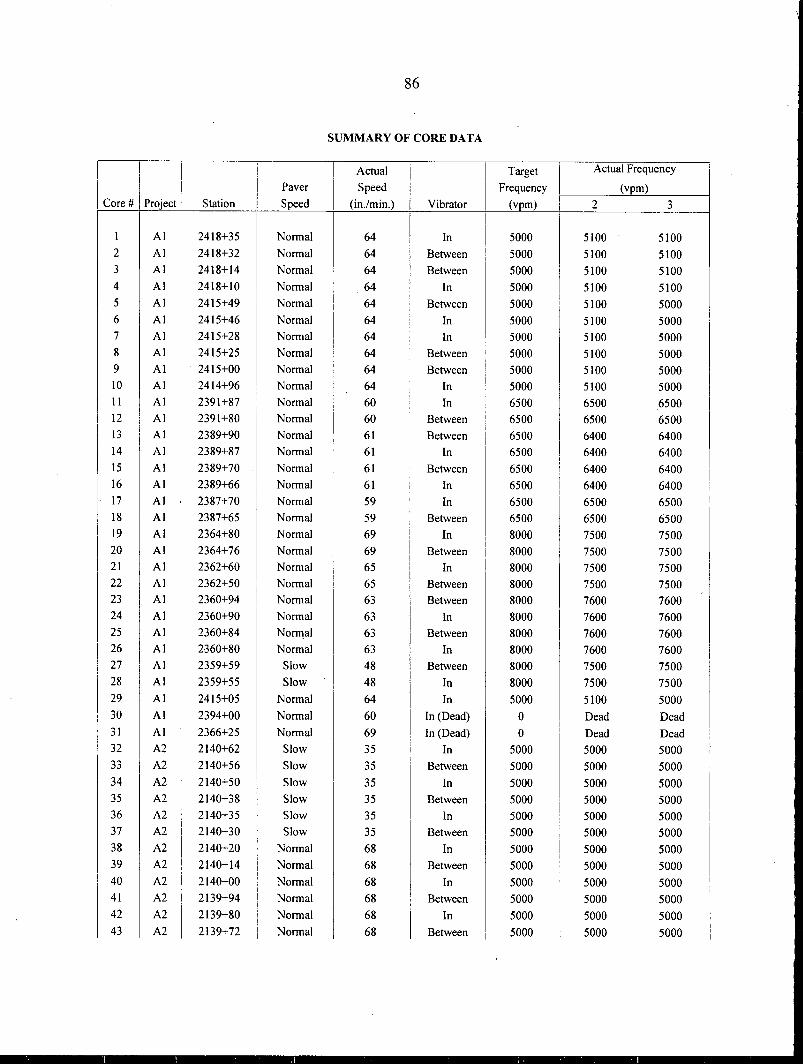
86
SUMMARY OF CORE DATA
I I ..
I Actual Frequency : Actual Target
I Core# Paver
I
Speed Frequency (vpm) Project Station Speed (inJmin.) Vibrator (vpm) 2 3
1 Al 2418+35 Normal 64 In 5000 5100 5100 2 Al 2418+32 Normal 64 Between 5000 5100 5100 3 Al 2418+14 Normal 64 Between 5000 5100 5100 4 Al 2418+10 Normal 64 In 5000 5100 5100 5 Al 2415+49 Normal 64 Between 5000 5100 5000 6 Al 2415+46 Normal 64 In 5000 5100 5000 7 Al 2415+28 Normal 64 In 5000 5100 5000 8 Al 2415+25 Normal 64 Between 5000 5100 5000 9 Al . 2415+00 Normal 64 Between 5000 5100 5000 JO Al 2414+96 Normal 64 In 5000 5100 5000 II Al 2391+87 Normal 60 In 6500 6500 6500 12 Al 2391+80 Normal 60 Between 6500 6500 6500 13 Al 2389+90 Normal 61 Between 6500 6400 6400 14 Al 2389+87 Normal 61 In 6500 6400 6400 15 Al 2389+70 Normal 61 Between 6500 6400 6400 16 Al 2389+66 Normal 61 In 6500 6400 6400 17 Al 2387+70 Normal 59 In 6500 6500 6500 18 Al 2387+65 Normal 59 Between 6500 6500 6500 19 Al 2364+80 Normal 69 In 8000 7500 7500 20 Al 2364+76 Normal 69 Between 8000 7500 7500 21 Al 2362+60 Normal 65 In 8000 7500 7500 22 Al 2362+50 Normal 65 Between 8000 7500 7500 23 Al 2360+94 Normal 63 Between 8000 7600 7600 24 Al 2360+90 Normal 63 In 8000 7600 7600 25 Al 2360+84 NorIJ\al 63 Between 8000 7600 7600 26 Al 2360+80 Normal 63 In 8000 7600 7600 27 Al 2359+59 Slow 48 Between 8000 7500 7500 28 Al 2359+55 Slow 48 In 8000 7500 7500 29 Al 2415+05 Normal 64 In 5000 5100 5000 30 Al 2394+00 Normal 60 In (Dead) 0 Dead Dead 31 Al 2366+25 Normal 69 In (Dead) 0 Dead Dead 32 A2 2140+62 Slow 35 In 5000 5000 5000 33 A2 2140+56 Slow 35 Between 5000 5000 5000 34 A2 2140+50 Slow 35 In 5000 5000 5000 35 A2 2140+38 Slow 35 Between 5000 5000 5000 36 A2 2140+35 Slow 35 In 5000 5000 5000 37 A2 2140+30 Slow 35 Between 5000 5000 5000 38 A2 2140+20 Normal 68 In 5000 5000 5000 39 A2 2140+14 Normal 68 Between 5000 5000 5000 40 A2 2140+00 Normal 68 In 5000 5000 5000 41 A2 2139+94 Normal 68 Between 5000 5000 5000 42 A2 2139+80 Normal 68 In 5000 5000 5000 43 A2 2139+72 Normal 68 Between 5000 5000 5000
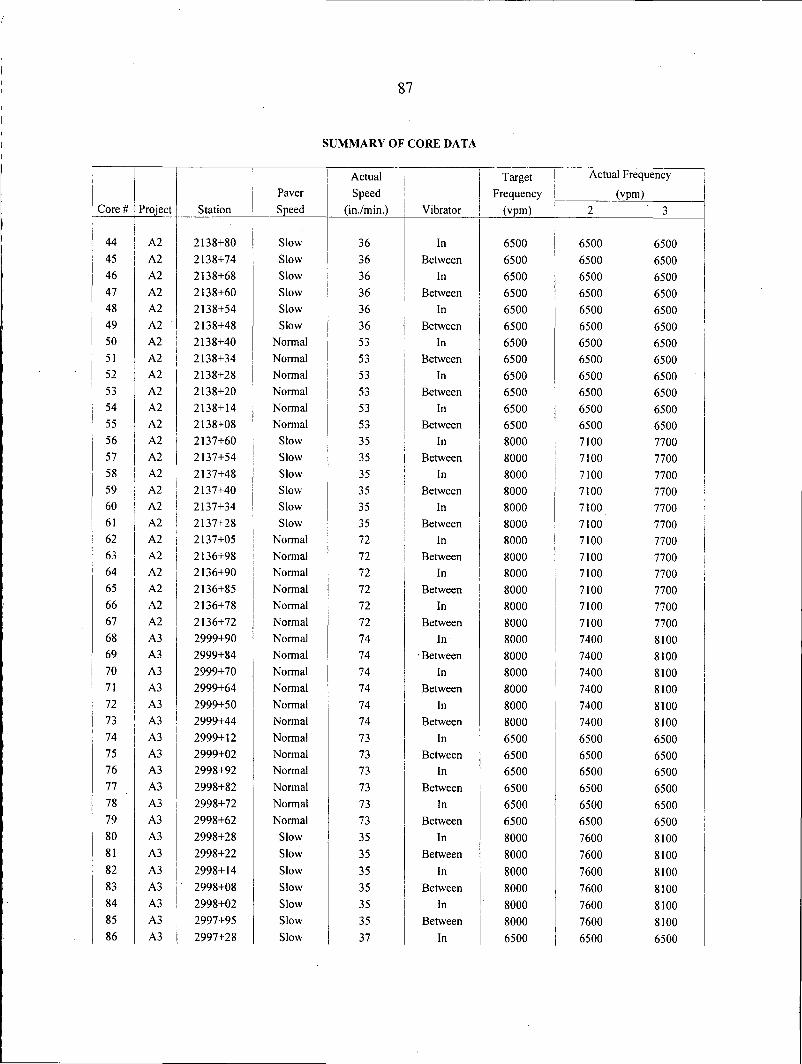
87
SUMMARY OF CORE DA TA
I
i I Actual I
Target
I
Actual Frequency I
Paver Speed I Frequency (vpm) Core# ! Project Station Speed (in.Im in.) I Vibrator (vpm) I 2 3
44 A2 2138+80 Slow 36 In 6500 6500 6500 45 A2 2138+74 Slow 36 Between 6500 6500 6500 46 A2 2138+68 Slow 36 In 6500 6500 6500 47 A2 2138+60 Slow 36 Between 6500 6500 6500 48 A2 2138+54 Slow 36 In 6500 6500 6500 49 A2 2138+48 Slow 36 Between 6500 6500 6500 50 A2 2138+40 Normal 53 In 6500 6500 6500 51 A2 2138+34 Normal 53 Between 6500 6500 6500 52 A2 2138+28 Normal 53 In 6500 6500 6500 53 A2 2138+20 Normal 53 Between 6500 6500 6500 54 A2 2138+14 Normal 53 In 6500 6500 6500 55 A2 2138+08 Normal 53 Between 6500 6500 6500 56 A2 2137+60 Slow 35 In 8000 7100 7700 57 A2 2137+54 ! Slow 35 Between 8000 7100 7700 58 A2 2137+48 Slow 35 In 8000 7100 7700 59 A2 2137+40 Slow 35 Between 8000 7100 7700 60 A2 2137+34 Slow 35 In 8000 7100 7700 61 A2 2137+28 Slow 35 Between 8000 7100 7700 62 A2 2137+05 Normal 72 In 8000 7100 7700 63 A2 2136+98 Normal 72 i Between 8000 7100 7700 !
64 A2 2136+90 Normal 72 In 8000 7100 7700 65 A2 2136+85 Normal 72 Between 8000 7100 7700 66 A2 2136+78 Normal 72 In 8000 7100 7700 67 A2 2136+72 Normal 72 Between 8000 7100 7700 68 A3 2999+90 Normal 74 Jn 8000 7400 8100 69 A3 2999+84 Normal 74 ·Between 8000 7400 8100 70 A3 2999+70 Normal 74 In 8000 7400 8100 71 A3 2999+64 Normal 74 Between 8000 7400 8100 72 A3 2999+50 Normal 74 In 8000 7400 8100 73 A3 2999+44 Normal 74 Between 8000 7400 8100 74 A3 2999+12 Normal 73 In 6500 6500 6500 75 A3 2999+02 Normal 73 Between 6500 6500 6500 76 A3 2998+92 Normal 73 In 6500 6500 6500 77 A3 2998+82 Normal 73 Between 6500 6500 6500 78 A3 2998+72 Normal 73 In 6500 6500 6500 79 A3 2998+62 Normal 73 Between 6500 6500 6500 80 A3 2998+28 Slow 35 In 8000 7600 8100 81 A3 2998+22 Slow 35 Between 8000 7600 8100 82 A3 2998+14 Slow 35 In 8000 7600 8100 83 A3 2998+08 Slow 35 Between 8000 7600 8100 84 A3 2998+02 Slow 35 In 8000 7600 8100 85 A3 2997+95 Slow 35 Between 8000 7600 8100 86 A3 2997+28 Slow 37 In 6500 6500 6500
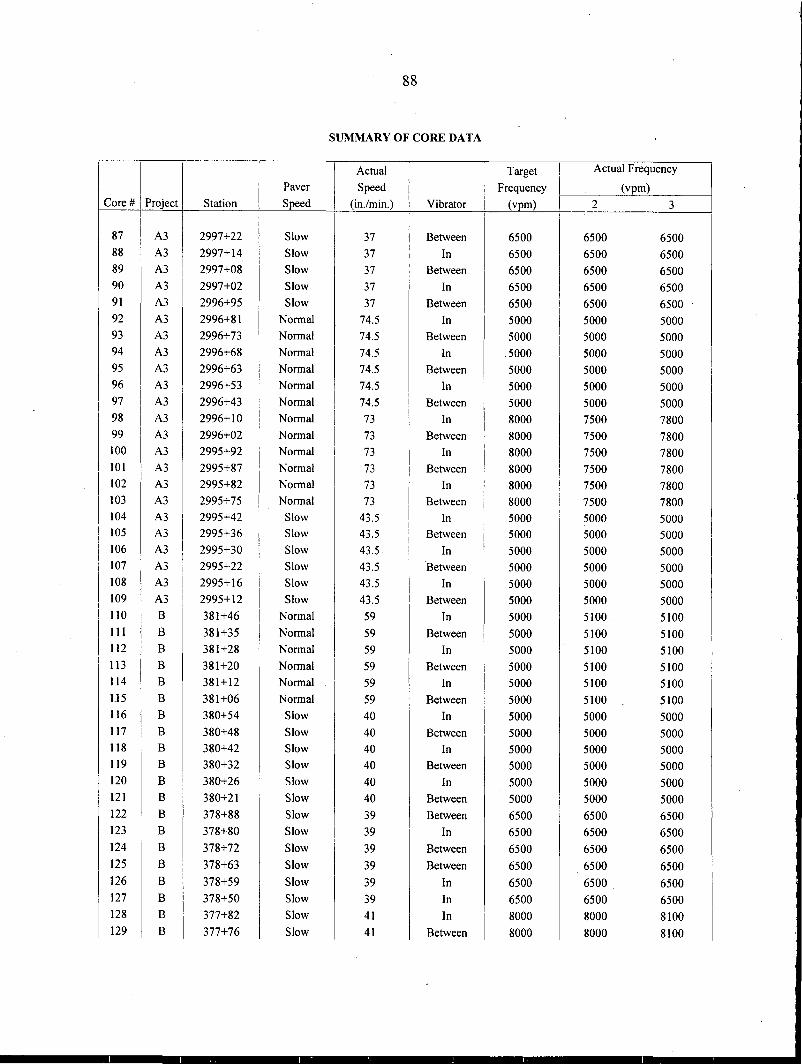
88
SUMMARY OF CORE DATA
Actual
I Target ! Actual Frequency
Paver Speed Frequency I (vpm) Core# Project Station Speed (in.Im in.) I Vibrator (vpm) 2 3 I
i
i i I
I I 87 I A3 2997+22 Slow 37 ! Between 6500 6500 6500 I
88 A3 2997+14 Slow 37 In 6500 6500 6500 89 A3 2997+08 Slow 37 Between 6500 6500 6500 90 A3 2997+02 Slow 37 In 6500 6500 6500 91 A3 2996+95 Slow 37 Between 6500 6500 6500 92 A3 2996+81 Normal 74.5 In 5000 5000 5000 93 A3 2996+73 Normal 74.5 Between 5000 5000 5000 94 A3 2996+68 Normal 74.5 In .5000 5000 5000 95 A3 2996+63 Normal 74.5 Between 5000 5000 5000 96 A3 2996+53 Normal 74.5 In 5000 5000 5000 97 A3 2996+43 Normal 74.5 Between 5000 5000 5000 98 A3 2996+10 Normal 73 In 8000 7500 7800 99 A3 2996+02 Normal 73 Between 8000 7500 7800 100 A3 2995+92 Normal 73 In 8000 7500 7800 101 A3 2995+87 Normal 73 Between 8000 7500 7800 102 A3 2995+82 Normal 73 In 8000 7500 7800 103 A3 2995+75 Normal 73 Between 8000 7500 7800 104 A3 2995+42 Slow 43.5 In 5000 5000 5000 105 A3 2995+36 Slow 43.5 Between
! 5000 5000 5000
106 A3 2995+30 Slow 43.5. i In 5000 5000 5000 107 A3 2995+22 Slow 43.5 Between 5000 5000 5000 108 A3 2995+16 Slow 43.5 In 5000 5000 5000 109 A3 2995+12 Slow 43.5 Between 5000 5000 5000 110 B 381+46 Normal 59 In 5000 5100 5100 111 B 381+35 Normal 59 Between 5000 5100 5100 112 B 381+28 Normal 59 In 5000 5100 5100 113 B 381+20 Normal 59 Between 5000 5100 5100 114 B 381+ 12 Normal 59 In 5000 5100 5100 l.l 5 B 381+06 Normal 59 Between 5000 5100 5100 116 B 380+54 Slow 40 In 5000 5000 5000 117 B 380+48 Slow 40 Between 5000 5000 5000 118 B 380+42 Slow 40 In 5000 5000 5000 119 B 380+32 Slow 40 Between 5000 5000 5000 120 B 380+26 Slow 40 In 5000 5000 5000 121 B 380+21 Slow 40 Between 5000 5000 5000 122 B 378+88 Slow 39 Between 6500 6500 6500 123 B 378+80 Slow 39 In 6500 6500 6500 124 B 378+72 Slow 39 Between 6500 6500 6500 125 B 378+63 Slow 39 Between 6500 6500 6500 126 B 378+59 Slow 39 In 6500 6500 6500 127 B 378+50 Slow 39 In 6500 6500 6500 128 B 377+82 Slow 41 In 8000 8000 8100 129 B 377+76 Slow 41 Between 8000 8000 8100
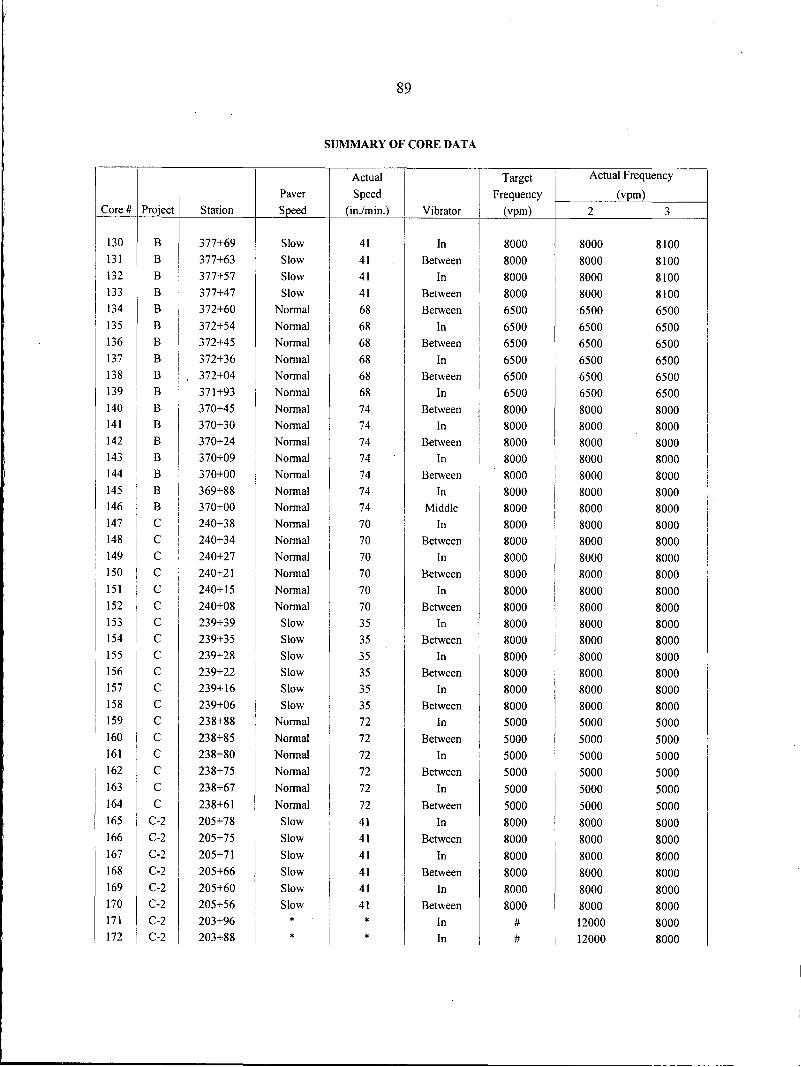
-~ ~
j
89
SUMMARY OF CORE DAT A
I
Actual Target Actual Freque
Paver Speed Frequency (vpm) I ! Core# Project Station Speed (in./min.) Vibrator (vpm) 2
ncy
3
130 B 377+69 Slow 41 In 8000 8000 8100 131 B 377+63 Slow 41 Between 8000 8000 8100 132 B 377+57 Slow 41 In 8000 8000 8100 133 B 377+47 Slow 41 Between 8000 8000 8100 134 B 372+60 Normal 68 Between 6500 6500 6500 135 B 372+54 Normal 68 In 6500 6500 6500 136 B 372+45 Normal 68 Between 6500 6500 6500 137 B 372+36 Normal 68 In 6500 6500 6500 138 B 372+04 Normal 68 Between 6500 6500 6500 139 B 371+93 Normal 68 In 6500 6500 6500 140 B 370+45 Normal 74 Between 8000 8000 8000 141 B 370+30 Normal 74 In 8000 8000 8000 142 B 370+24 Normal 74 Between 8000 8000 8000 143 B 370+09 Normal 74 In 8000 8000 8000 144 B 370+00 Normal 74 Between 8000 8000 8000 145 B 369+88 Normal 74 In 8000 8000 8000 146 B 370+00 Normal 74 Middle 8000 8000 8000 147 c 240+38 Normal 70 In 8000 8000 8000 148 c 240+34 Normal 70 Between 8000 8000 8000 149 c 240+27 Normal 70 In 8000 8000 8000 150 c 240+21 Normal 70 Between 8000 8000 8000 151 c 240+15 Normal 70 In 8000 8000 8000 152 c 240+08 Normal 70 Between 8000 8000 8000 153 c 239+39 Slow 35 In 8000 8000 8000 154 c 239+35 Slow 35 Between 8000 8000 8000 155 c 239+28 Slow 35 In 8000 8000 8000 156 c 239+22 Slow 35 Between 8000 8000 8000 157 c 239+16 Slow 35 In 8000 8000 8000 158 c 239+06 Slow 35 Between 8000 8000 8000
I 159 c 238+88 Normal 72 In 5000 5000 5000 160 c 238+85 Normal 72 Between 5000 5000 5000 161 c 238+80 Normal 72 In 5000 5000 5000 162 c 238+75 Normal 72 Between 5000 5000 5000 163 c 238+67 Normal 72 In 5000 5000 5000 164 c 238+61 Normal 72 Between 5000 5000 5000 165 C-2 205+78 Slow 41 In 8000 8000 8000 166 C-2 205+75 Slow 41 Between 8000 8000 8000 167 C-2 205+71 Slow 41 In 8000 8000 8000 168 C-2 205+66 Slow 41 Between 8000 8000 8000 169 C-2 205+60 Slow 41 In 8000 8000 8000 170 C-2 205+56 Slow 41 Between 8000 8000 8000 171 C-2 203+96 * * In # 12000 8000 172 C-2 203+88 * * In # 12000 8000
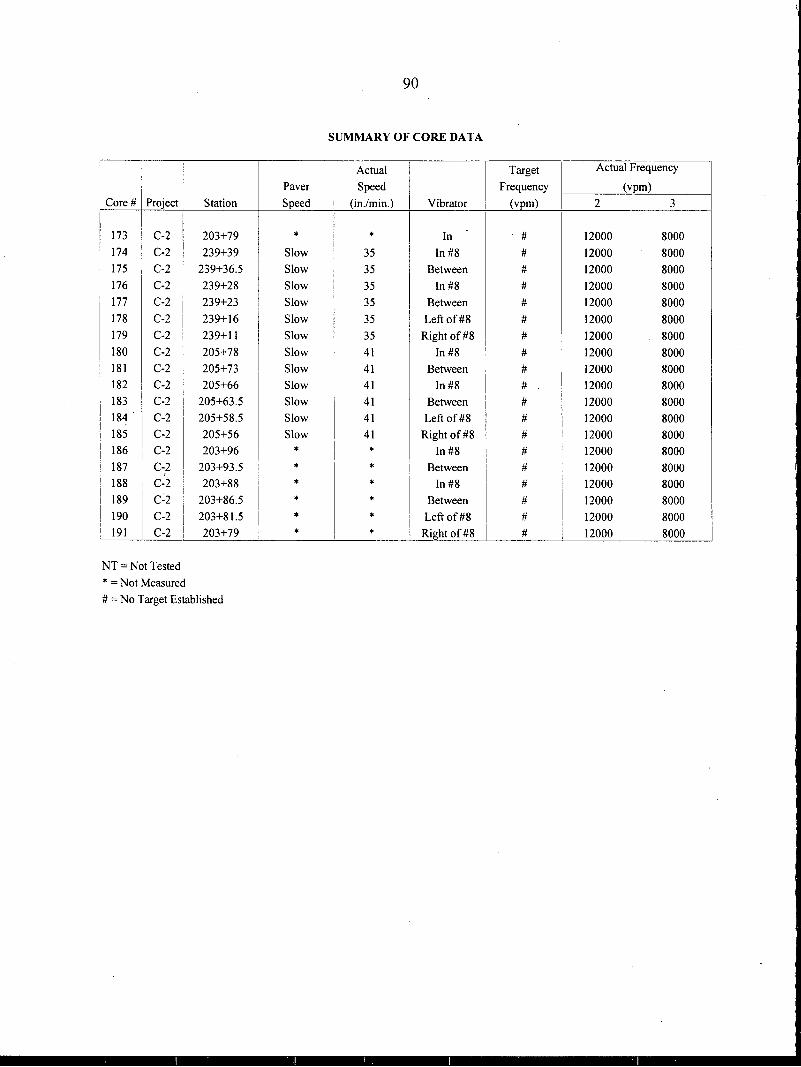
! I
I I
i
Core# Project
173 I C-2
174 C-2
175 C-2
176 C-2
177 C-2
178 C-2
179 C-2
180 C-2
181 C-2
182 C-2
183 I
C-2 I 184. I C-2
185 C-2
186 C-2
187 C-2 I !
188 I C-2 !
189 C~2
190 C-2 I 191 C-2
NT= Not Tested
* =Not Measured
Station
203+79
239+39
239+36.5
239+28
239+23
239+16
239+11
205+78
205+73
205+66
205+63.5
205+58.5
205+56
203+96
203+93.5
203+88
203+86.5
203+81.5
203+79
#=No Target Established
Paver
Speed
* Slow
Slow
Slow
Slow
Slow
Slow
Slow
Slow
Slow
Slow
Slow
Slow
* * * * * *
90
SUMMARY OF CORE DATA
I
Actual i Target Actual Frequency
Speed Frequency (vpm)
(in.Im in.) Vibrator i (vpm) 2 3 I
* In # 12000 8000
35 In #8 # 12000 8000
35 Between # 12000 8000
35 In #8 # 12000 8000
35 Between # 12000 8000
35 Left of#8 # 12000 8000
35 Right of#8 # 12000 8000
41 In #8 # 12000 8000
41 Between # 12000 8000
41 In #8 # 12000 8000
41 Between # 12000 8000
41 Left of#8 # 12000 8000
41 Right of#8 # 12000 8000
* In #8 # 12000 8000
* Between # 12000 8000
* In #8 # 12000 8000
* Between # 12000 8000
* Left of#8 # 12000 8000
* Right of#8 # : 12000 8000
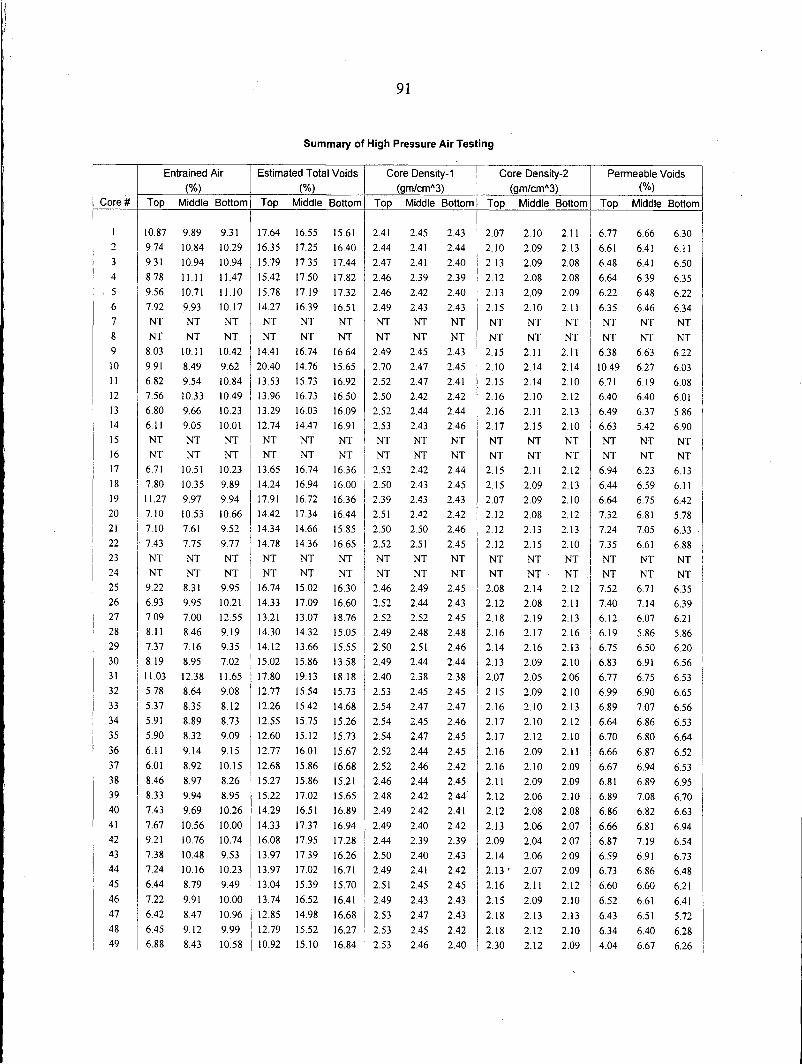
91
Summary of High Pressure Air Testing
Entrained Air Estimated Total Voids Core Density-1 Core Density-2 Permeable Voids (%) (%) (gm/cm"3) (gm/cm"3) (%)
Core# Top Middle Bottom Top Middle Bottom Top Middle Bottom Top Middle Bottom Top Middle Bottom
I 10.87 9.89 9.31 17.64 16.55 15.61 2.41 2.45 2.43 2.07 2.10 2.11 6.77 6.66 6.30 2 9.74 10.84 10.29 16.35 17.25 16.40 2.44 2.41 2.44 2.10 2.09 2.13 6.61 6.41 6.11 3 9.31 10.94 10.94 15.79 17.35 17.44 2.47 2.41 2.40 2.13 2.09 2.08 6.48 6.41 6.50 4 8.78 11.11 11.47 15.42 17.50 17.82 2.46 2.39 2.39 2.12 2.08 2.08 6.64 6.39 6.35 5 9.56 10.71 11.10 15.78 17.19 17.32 2.46 2.42 2.40 2.13 2.09 2.09 6.22 6.48 6.22 6 7.92 9.93 10.17 14.27 16.39 16.51 2.49 2.43 2.43 2.15 2.10 2.11 6.35 6.46 6.34 7 NT NT NT NT NT NT NT NT NT NT NT NT NT NT NT 8 NT NT NT NT NT NT NT NT NT NT NT NT NT NT NT 9 8.03 IO.I I 10.42 14.41 16.74 16.64 2.49 2.45 2.43 2.15 2.11 2.11 6.38 6.63 6.22 10 9.91 8.49 9.62 20.40 14.76 15.65 2.70 2.47 2.45 2.10 2.14 2.14 10.49 6.27 603 II 6.82 9.54 10.84 13.53 15.73 16.92 2.52 2.47 2.41 2.15 2.14 2.10 6.71 6.19 6.08 12 7.56 10.33 10.49 13.96 16.73 16.50 2.50 2.42 2.42 2.16 2.10 2.12 6.40 6.40 6.01 13 6.80 9.66 10.23 13.29 16.03 16.09 2.52 2.44 2.44 2.16 2.11 2.13 6.49 6.37 5.86 14 6.11 9.05 10.01 12.74 14.47 16.91 2.53 2.43 2.46 2.17 2.15 2.10 6.63 5.42 6.90 15 NT NT NT NT NT NT NT NT NT NT NT NT NT NT NT 16 NT NT NT NT NT NT NT NT NT NT NT NT NT NT NT 17 6.71 10.51 10.23 13.65 16.74 16.36 2.52 2.42 2.44 2.15 2.11 2.12 6.94 6.23 6.13 18 7.80 10.35 9.89 14.24 16.94 16.00 2.50 2.43 2.45 2.15 2.09 2.13 6.44 6.59 6.11 19 11.27 9.97 9.94 17.91 16.72 16.36 2.39 2.43 2.43 2.07 2.09 2.10 6.64 6.75 6.42 20 7.10 10.53 10.66 14.42 17.34 16.44 2.51 2.42 2.42 2.12 2.08 2.12 7.32 6.81 5.78 21 7.10 7.61 9.52 14.34 14.66 15.85 2.50 2.50 2.46 2.12 2.13 2.13 7.24 7.05 6.33 22 7.43 7.75 9.77 14.78 14.36 16.65 2.52 2.51 2.45 2.12 2.15 2.10 7.35 6.61 6.88 23 NT NT NT NT NT NT NT NT NT NT NT NT NT NT NT 24 NT NT NT NT NT NT NT NT NT NT NT NT NT NT NT 25 9.22 8.31 9.95 16.74 15.02 16.30 2.46 2.49 2.45 2.08 2.14 2.12 7.52 6.71 6.35 26 6.93 9.95 10.21 14.33 17.09 16.60 2.52 2.44 2.43 2.12 2.08 2.11 7.40 7.14 6.39 27 7.09 7.00 12.55 13.21 13.07 18.76 2.52 2.52 2.45 2.18 2.19 2.13 6.12 6.07 6.21 28 8.11 8.46 9.19 14.30 14.32 15.05 2.49 2.48 2.48 2.16 2.17 2.16 6.19 5.86 5.86 29 7.37 7.16 9.35 14.12 13.66 15.55 2.50 2.51 2.46 2.14 2.16 2.13 6.75 6.50 6.20 30 8.19 8.95 7.02 15.02 15.86 13.58 2.49 2.44 2.44 2.13 2.09 2.10 6.83 6.91 6.56 31 11.03 12.38 11.65 17.80 19.13 18.18 2.40 2.38 2.38 2.07 2.05 2.06 6.77 6.75 6.53 32 5.78 8.64 9.08 12.77 15.54 15.73 2.53 2.45 2.45 2.15 2.09 2.10 6.99 6.90 6.65 33 5.37 8.35 8.12 12.26 15.42 14.68 2.54 2.47 2.47 2.16 2.10 2.13 6.89 7.07 6.56 34 5.91 8.89 8.73 12.55 15.75 15.26 2.54 2.45 2.46 2.17 2.10 2.12 6.64 6.86 6.53 35 5.90 8.32 9.09 12.60 15.12 15.73 2.54 2.47 2.45 2.17 2.12 2.10 6.70 6.80 6.64 36 6.11 9.14 9.15 12.77 16.01 15.67 2.52 2.44 2.45 2.16 2.09 2.11 6.66 6.87 6.52 37 6.01 8.92 10.15 12.68 15.86 16.68 2.52 2.46 2.42 2.16 2.10 2.09 6.67 6.94 6.53 38 8.46 8.97 8.26 15.27 15.86 15.21 2.46 2.44 2.45 2.11 2.09 2.09 6.81 6.89 6.95 39 8.33 9.94 8.95 15.22 17.02 15.65 2.48 2.42 2.44 2.12 2.06 2.10 6.89 7.08 6.70 40 7.43 9.69 10.26 14.29 16.51 16.89 2.49 2.42 2.41 2.12 2.08 2.08 6.86 6.82 6.63 41 7.67 10.56 10.00 14.33 17.37 16.94 2.49 240 2.42 2.13 2.06 2.07 6.66 6.81 6.94 42 9.21 10.76 10.74 16.08 17.95 17.28 2.44 2.39 2.39 2.09 2.04 2.07 6.87 7.19 6.54 43 7.38 10.48 9.53 13.97 17.39 16.26 2.50 2.40 2.43 2.14 2.06 2.09 6.59 6.91 6.73 44 7.24 10.16 10.23 13.97 17.02 16.71 2.49 2.41 2.42 2.13. 2.07 2.09 6.73 6.86 6.48 45 6.44 8.79 9.49 13.04 15.39 15.70 2.51 2.45 2.45 2.16 2.11 2.12 6.60 6.60 6.21 46 7.22 9.91 10.00 13.74 16.52 16.41 2.49 2.43 2.43 2.15 2.09 2.10 6.52 6.61 6.41 47 6.42 8.47 10.96 12.85 14.98 16.68 2.53 2.47 2.43 2.18 2.13 2.13 6.43 6.51 5.72 48 6.45 9.12 9.99 12.79 15.52 16.27 2.53 2.45 2.42 2.18 2.12 2.10 6.34 6.40 6.28 49 6.88 8.43 10:58 10.92 15.10 16.84 2.53 2.46 2.40 2.30 2.12 2.09 4.04 6.67 6.26
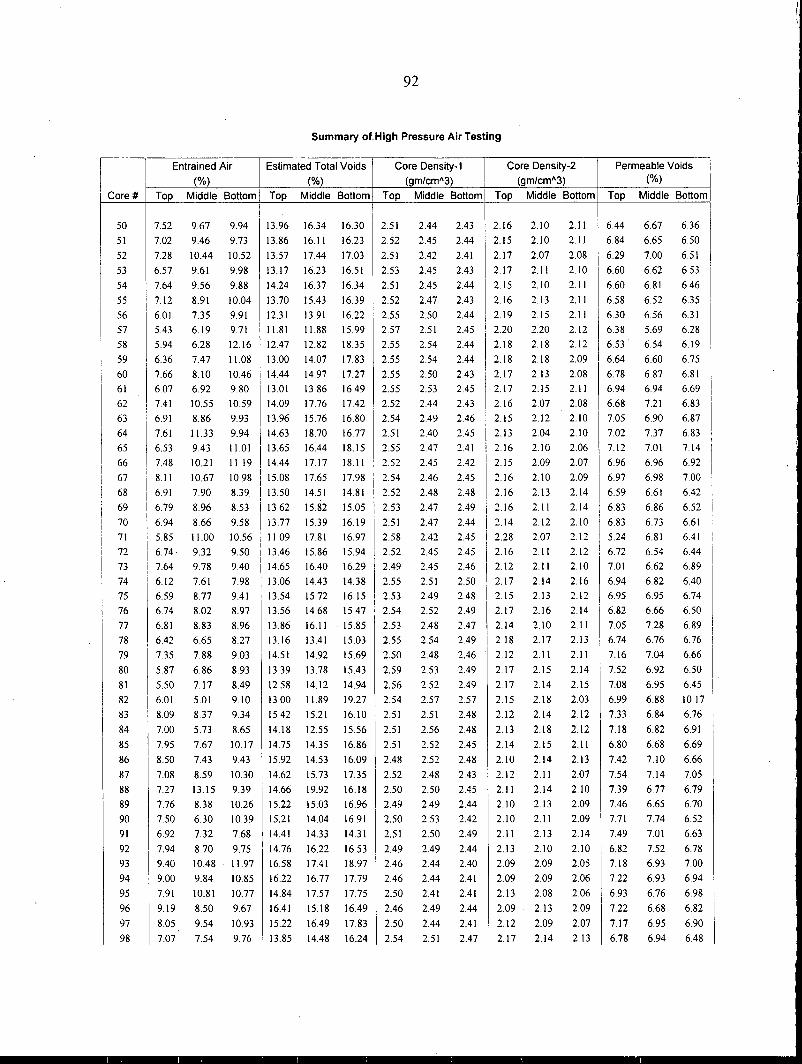
92
Summary of.High Pressure Air Testing
I Entrained Air Estimated Total Voids Core Density-1 Core Density-2 Permeable Voids i
(%) (%) (gm/cm"3) (gm/cm"3) (%) I
Core# Top Middle Bottom Top Middle Bottom Top Middle Bottom Top Middle Bottom Top Middle Bottom
50 7.52 9.67 9.94 13.96 16.34 16.30 2.51 2.44 2.43 2.16 2.10 2.1 l 6.44 6.67 6.36
51 7.02 9.46 9.73 13.86 16.11 16.23 2.52 2.45 2.44 2.15 2.10 2.11 6.84 6.65 6.50
52 7.28 10.44 10.52 13.57 17.44 17.03 2.51 2.42 2.41 2.17 2.07 2.08 6.29 7.00 6.51
53 6.57 9.61 9.98 13.17 16.23 16.51 2.53 2.45 2.43 2.17 2.11 2.10 6.60 6.62 6.53
54 7.64 9.56 9.88 14.24 16.37 16.34 2.51 2.45 2.44 2.15 2.10 2.11 6.60 6.81 6.46
55 7.12 8.91 10.04 13.70 15.43 16.39 2.52 2.47 2.43 2.16 2.13 2.11 6.58 6.52 6.35
56 6.01 7.35 9.91 12.31 13.91 16.22 2.55 2.50 2.44 2.19 2.15 2.11 6.30 6.56 6.31
57 5.43 6.19 9.71 11.81 11.88 15.99 2.57 2.51 2.45 2.20 2.20 2.12 6.38 5.69 6.28
58 5.94 6.28 12.16 12.47 12.82 18.35 2.55 2.54 2.44 2.18 2.18 2.12 6.53 6.54 6.19
59 6.36 7.47 11.08 13.00 14.07 17.83 2.55 2.54 2.44 2.18 2.18 2.09 6.64 6.60 6.75
60 7.66 8.10 10.46 14.44 14.97 17.27 2.55 2.50 2.43 2.17 2.13 2.08 6.78 6.87 6.81
61 607 6.92 9.80 13.01 13.86 16.49 2.55 2.53 2.45 2.17 2.15 2.11 6.94 6.94 6.69
62 741 10.55 10.59 14.09 17.76 17.42 2.52 2.44 2.43 2.16 207 2.08 6.68 7.21 6.83
63 6.91 8.86 9.93 13.96 15.76 16.80 2.54 2.49 2.46 2.15 2.12 2.10 7.05 6.90 6.87
64 7.61 11.33 9.94 14.63 18.70 16.77 2.51 2.40 2.45 2.13 2.04 2.10 7.02 7.37 6.83 '
65 6.53 9.43 11.01 13.65 16.44 18.15 2.55 2.47 2.41 2.16 2.10 2.06 7.12 7.01 7.14
66 7.48 10.21 11.19 14.44 17.17 18.11 2.52 2.45 2.42 2.15 2.09 2.07 6.96 6.96 6.92
67 8.11 10.67 10.98 15.08 17.65 17.98 2.54 2.46 2.45 2.16 2.10 2.09 6.97 6.98 7.00
68 6.91 7.90 8.39. 13.50 14.51 14.81 2.52 2.48 2.48 2.16 2.13 2.14 6.59 6.61 6.42
69 6.79 8.96 8.53 13.62 15.82 15.05 2.53 2.47 2.49 2.16 2.11 2.14 6.83 6.86 6.52
70 6.94 8.66 9.58 13.77 15.39 16.19 2.51 2.47 2.44 2.14 2.12 2.10 6.83 6.73 6.61
71 5.85 11.00 10.56 11.09 17.81 16.97 2.58 2.42 2.45 2.28 207 2.12 5.24 6.81 6.41
72 6.74. 9.32 9.50 13.46 15.86 15.94 2.52 2.45 2.45 2.16 2.11 2.12 6.72 6.54 6.44
73 7.64 9.78 9.40 14.65 16.40 16.29 2.49 2.45 2.46 2.12 2.11 2.10 7.01 6.62 6.89
74 6.12 7.61 7.98 13.06 14.43 14.38 2.55 2.51 2.50 2.17 2.14 2.16 6.94 6.82 6.40
75 6.59 8.77 9.41 13.54 15.72 16.15 2.53 2.49 2.48 2.15 2.13 2.12 6.95 6.95 6.74
76 6.74 8.02 8.97 13.56 14.68 15.47 2.54 2.52 2.49 2.17 2.16 2.14 6.82 6.66 6.50
77 6.81 8.83 8.96 13.86 16.11 . 15.85 2.53 2.48 2.47 2.14 2.10 2.11 7.05 7.28 6.89
78 6.42 6.65 8.27 13.16 13.41 15.03 2.55 2.54 2.49 2.18 2.17 2.13 6.74 6.76 6.76
79 7.35 7.88 9.03 14.51 14.92 15.69 2.50 2.48 2.46 2.12 2.11 2.11 7.16 7.04 6.66
80 5.87 6.86 8.93 13.39 13.78 15.43 2.59 2.53 2.49 2.17 2.15 2.14 7.52 6.92 6.50
81 5.50 7.17 8.49 12.58 14.12 14.94 2.56 2.52 2.49 2.17 2.14 2.15 7.08 6.95 6.45
82 6.01 5.01 9.10 13.00 11.89 19.27 2.54 2.57 2.57 2.15 2.18 2.03 6.99 6.88 10.17
83 8.09 8.37 9.34 15.42 15.21 16.10 2.51 2.51 2.48 2.12 2.14 2.12 7.33 6.84 6.76
84 7.00 5.73 8.65 14.18 12.55 15.56 2.51 2.56 2.48 2.13 2.18 2.12 7.18 6.82 6.91
85 7.95 7.67 10.17 14.75 14.35 16.86 2.51 2.52 2.45 2.14 2.15 2.11 6.80 6.68 6.69
86 8.50 7.43 9.43 15.92 14.53 16.09 2.48 2.52 2.48 2.10 2.14 2.13 7.42 710 6.66
87 7.08 8.59 10.30 14.62 15.73 17.35 2.52 2.48 2.43 2.12 2.11 2.07 7.54 7.14 7.05
88 7.27 13.15 9.39 14.66 19.92 16.18 2.50 2.50 2.45 2.11 2.14 2.10 7.39 6.77 6.79
89 7.76 8.38 10.26 15.22 15.03 16.96 2.49 2.49 2.44 2.10 2.13 2.09 7.46 6.65 6.70
90 7.50 6.30 10.39 15.21 14.04 16.91 2.50 2.53 2.42 2.10 2.11 2.09 7.71 7.74 6.52
91 6.92 7.32 7.68 14.41 14.33 14.31 2.51 2.50 2.49 2.11 2.13 2.14 7.49 7.01 6.63
92 7.94 8.70 9.75 14.76 16.22 16.53 2.49 2.49 2.44 2.13 2.10 2.10 6.82 7.52 6.78
93 9.40 10.48 11.97 16.58 17.41 18.97 2.46 2.44 2.40 2.09 2.09 2.05 7.18 6.93 7.00
94 9.00 9.84 10.85 16.22 16.77 17.79 2.46 2.44 2.41 2.09 2.09 206 7.22 6.93 6.94
95 7.91 10.81 10.77 14.84 17.57 17.75 2.50 2.41 2.41 2.13 2.08 206 6.93 6.76 6.98
96 9.19 8.50 9.67 16.41 15.18 16.49 2.46 2.49 2.44 2.09 2.13 209 7.22 6.68 6.82
97 8.05 9.54 10.93 15.22 16.49 17.83 2.50 2.44 2.41 2.12 2.09 2.07 7.17 6.95 6.90
98 7.07 7.54 9.76 13.85 14.48 16.24 2.54 2.51 2.47 2.17 2.14 2.13 6.78 6.94 6.48
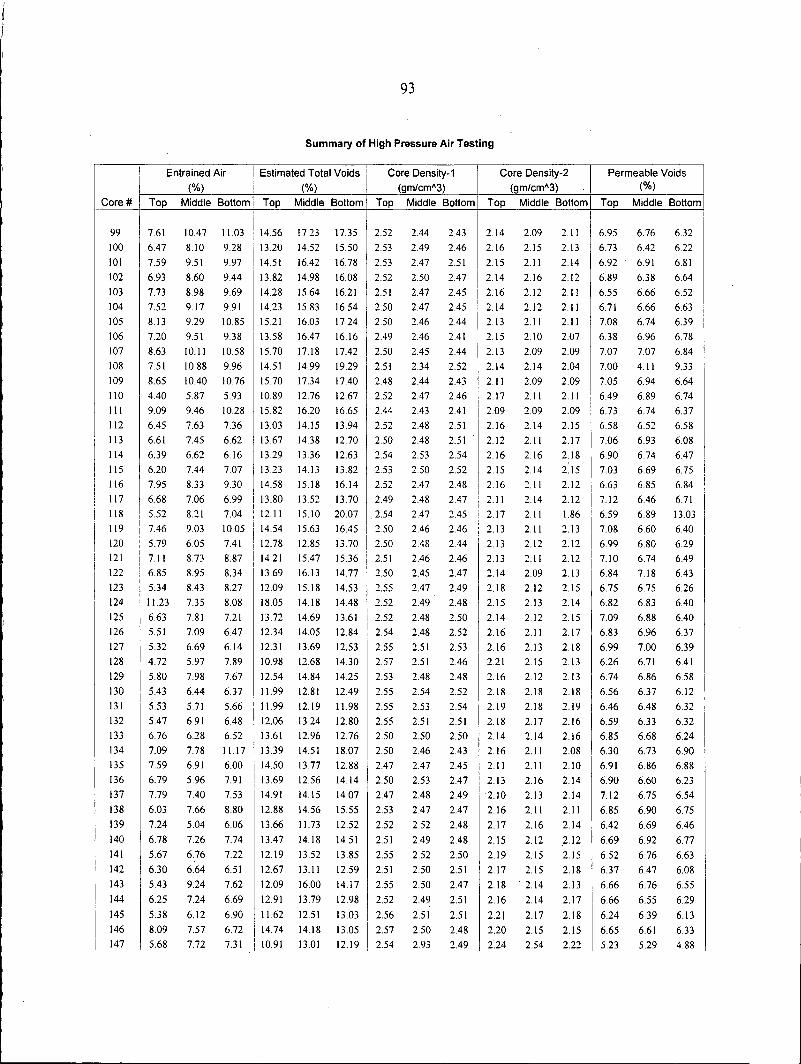
I
I I I
93
Summary of High Pressure Air Testing
Entrained Air Estimated Total Voids 'I Core Density-1 I Core Density-2 Permeable Voids c--~~~(~%~)~~~+--~~--'--(%~o)~~~-+-~~(g~m_/c_m_A_3~)~~;--~~(g~m_l_c_m_A3~)~~+--~~~(%_o)~~~~
,__C_or_e_#--+-_T_o~p~M~id_d_le_B_o_tt_o_m-+-_To~p~_M_id_d_le~B_o_tto_m--+-_T_o~p~M_i_dd_le~B_o_tt_om--+-_T_o~p~_M_id_d_le_B_o_tt_o_m-+-_T~op~_M_id_d_le~B_o_tto_m~
99
100
101
102
103
104
105
106
107
108
109
110
Ill
112
113
114
115
116
117
118
119
120
121
122
123
124
125
126
127
128
129
130
131
132
133
134
135
136
137
138
139
140
141
142
143
144
145
7.61
6.47
7.59
6.93
7.73
7.52
8.13
7.20
8.63
7.51
8.65
4.40
909
6.45
6.61
6.39
10.47 11.03 14.56 17.23 17.35 2.52
2.53
2.53
2.52
2.51
2.50
2.50
2.49
2.50
2.51
2.48
2.52
2.44
2.52
2.50
2.54
8.10 9.28 13.20 14.52 15.50
9.51 9.97 14.51 16.42 16.78
8.60 9.44 13.82 14.98 16.08
8.98 9.69 14.28 15.64 16.21
9.17 9.91 14.23 15.83 16.54
9.29 10.85 15.21 16.03 17.24
9.51 9.38 13.58 16.47 16.16
IO.I I 10.58 15.70 17.18 17.42
10.88 9.96 14.51 14.99 19.29
10.40 10.76 15.70 17.34 17.40
5.87 5.93 10.89 12.76 12.67
9.46 10.28 15.82 16.20 16.65
7.63 7.36 13.03 14.15 13.94
7.45 6.62 13.67 14.38 12.70
6.62 6.16 13.29 13.36 12.63
6.20 7.44 7.07 13.23 14.13 13.82 2.53
7.95 8.33 9.30 14.58 15.18 16.14 2.52
6.68 7.06 6.99 13.80 13.52 13. 70 2.49
5.52 8.21 7.04 12.11 15.10 2007 2.54
7.46 9 03 I 0.05 14.54 15.63 16.45 2.50
5.79 6.05 7.41 12.78 12.85 13.70 2.50
7.11 8.73 8.87 14.21 15.47 15.36 2.51
6.85 8.95 8.34 13.69 16.13 14.77 2.50
5.34 8.43 8.27 12.09 15.18 14.53 2.55
11.23 7.35 8.08 18.05 14.18 14.48 2.52
6.63 7.81 7.21 13.72 14.69 13.61 2.52
5.51 7.09 6.47 12.34 14.05 12.84 2.54
5.32 6.69 6.14 12.31 13.69 12.53 2.55
4.72 5.97 7.89 10.98 12.68 14.30 2.57
5.80 7.98 7.67 12.54 14.84 14.25 2.53
5.43 6.44 6.37 11.99 12.81 12.49 2.55
5.53 5.71 5.66 11.99 12.19 11.98 2.55
5.47 6.91 6.48 12.06 13.24 12.80 2.55
6.76 6.28 6.52 13.61 12.96 12.76 2.50
7.09 7.78 11.17 13.39 14.51 18.07 2.50
7.59 6.91 6.00 14.50 13.77 12.88 2.47
6.79 5.96 7.91 13.69 12.56 14.14 2.50
7.79 7.40 7.53 14.91 14.15 14.07 2.47
6.03 7.66 8.80 12.88 14.56 15.55 2.53
7.24 5.04 6.06 13.66 11.73 12.52 2.52
6.78 7.26 7.74 13.47 14.18 14.51 2.51
5.67 6.76 7.22 12.19 13.52 13.85 2.55
6.30 6.64 6.51 12.67 13.11 12.59 2.51
5.43 9.24 7.62 12.09 16.00 14.17 2.55
6.25 7.24 6.69 12.91 13.79 12.98 2.52
5.38 6.12 6.90 11.62 12.51 13.03 2.56
2.44
2.49
2.47
2.50
2.47
2.47
2.46
2.46
2.45
2.34
2.44
2.47
2.43
2.48
2.48
2.53
2.50
2.47
2.48
2.47
2.46
2.48
2.46
2.45
2.47
2.49
2.48
2.48
2.51
2.51
2.48
2.54
2.53
2.51
2.50
2.46
2.47
2.53
2.48
2.47
2.52
2.49
2.52
2.50
2.50
2.49
2.51
2.43
2.46
2.51
2.47
2.45
2.45
2.44
2.41
2.44
2.52
2.43
2.46
2.41
2.51
2.51
2.54
2.14
2.16
2.15
2.14
2.16
2.14
2.13
2.15
2.13
2.14
2.11
2.17
2.09
2.16
2.12
2.16
2.52 2.15
2.48 2.16
2.47 2.11
2.45 2.17
2.46 2.13
2.44 2.13
2.46 2.13
2.47 2.14
2.49 2.18
2.48 2.15
2.50 2.14
2.52 2.16
2.53 2.16
2.46 2.21
2.48 2.16
2.52 2.18
2.54 2.19
2.51 2.18
2.50 2.14
2.43 2.16
2.45 2.11
2.47 2.13
2.49 2.10
2.47 2.16
2.48 2.17
2.48 2.15
2.50 2.19
2.51 2.17
2.47 2.18
2.51 2.16
2.51 2.21
2.09
2.15
2.11
2.16
2.12
2.12
2.11
2.10
2.09
2.14
2.09
2.11
2.09
2.14
2.11
2.16
2.14
2.11
2.14
2.11
2.11
2.12
2.11
2.09
2.12
2.13
2.12
2.11
2.13
2.15
2.12
2.18
2.18
2.17
2.14
2.11
2.11
2.16
2.13
2.11
2.16
2.12
2.15
2.15
2.14
2.14
2.17
2.11
2.13
2.14
2.12
2.11
2.11
2.11
2.07
2.09
2.04
2.09
2.11
2.09
2.15
2.17
2.18
2.15
2.12
2.12
1.86
2.13
2.12
2.12
2.13
2.15
2.14
2.15
2.17
2.18
2.13
2.13
2.18
2.19
2.16
2.16
2.08
2.10
2.14
2.14
2.11
2.14
2.12
2.15
2.18
2.13
2.17
2.18
6.95
6.73
6.92
6.89
6.55
6.71
7.08
6.38
7.07
7.00
7.05
6.49
6.73
6.58
7.06
6.90
7.03
6.63
7.12
6.59
7.08
6.99
7.10
6.84
6.75
6.82
7.09
6.83
6.99
6.26
6.74
6.56
6.46
6.59
6.85
6.30
6.91
6.90
7.12
6.85
6.42
6.69
6.52
6.37
6.66
6.66
6.24
6.76
6.42
6.91
6.38
6.66
6.66
6.74
6.96
7.07
4.11
6.94
6.89
6.74
6.52
6.93
6.74
6.32
6.22
6.81
6.64
6.52
6.63
6.39
6.78
6.84
9.33
6.64
6.74
6.37
6.58
6.08
6.47
6.69 6.75
6.85 6.84
6.46 6.71
6.89 13 03
6.60 6.40
6.80 6.29
6.74 6.49
7.18 6.43
6.75 6.26
6.83 6.40
6.88 6.40
6.96 6.37
7.00 6.39
6.71 6.41
6.86 6.58
6.37 6.12
6.48 6.32
6.33 6.32
6.68 6.24
6.73 6.90
6.86 6.88
6.60 6.23
6.75 6.54
6.90 6.75
6.69 6.46
6.92 6.77
6.76 6.63
6.47 6.08
6.76 6.55
6.55 6.29
6.39 6.13
146 8.09 7.57 6.72 14.74 14.18 13.05 2.57 2.50 2.48 2.20 2.15 2.15 6.65 6.61 6.33
147 5.68 7.72 7.31 10.91 13.01 12.19 2.54 2.93 2.49 2.24 2.54 2.22 5.23 5.29 4.88
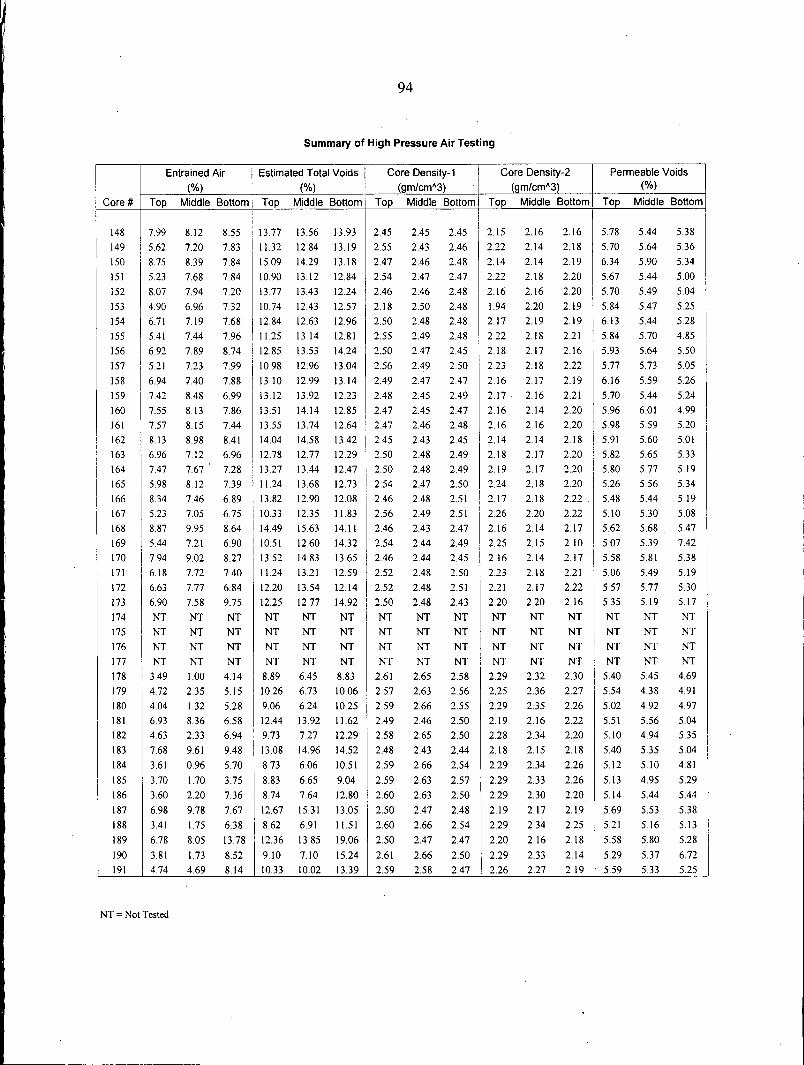
94
Summary of High Pressure Air Testing
I Entrained Air Estimated Total Voids I Core Density-1 Core Density-2 Permeable Voids
: (%) (%) I (gm/cm"3) (gm/cm"3) (%)
I Core# Top Middle Bottom Top Middle Bottom i Top Middle Bottom Top Middle Bottom Top Middle Bottom
113.77
'
148 7.99 8.12 8.55 13.56 13.93 2.45 2.45 2.45 i
2.15 2.16 2.16 5.78 5.44 5.38
149 l 5.62 7.20 7.83 i 11.32 12.84 13.19 2.55 2.43 2.46 2.22 2.14 2.18 5.70 5.64 5.36
150 i 8.75 8.39 7.84 15.09 14.29 13.18 2.47 2.46 2.48 2.14 2.14 2.19 6.34 5.90 5.34
151 5.23 7.68 7.84 10.90 13.12 12.84 2.54 2.47 2.47 2.22 2.18 2.20 5.67 5.44 5.00 i 152 8.07 7.94 7.20 13.77 13.43 12.24 2.46 2.46 2.48 2.16 2.16 2.20 I 5.70 5.49 5.04
153 4.90 6.96 7.32 10.74 12.43 12.57 2.18 2.50 2.48 l.94 2.20 2.19 !
5.84 5.47 5.25 I 154 6.71 7.19 7.68 12.84 12.63 12.96 2.50 2.48 2.48 2.17 2.19 2.19 6.13 5.44 5.28 I
155 5.41 7.44 7.96 11.25 13.14 12.81 2.55 2.49 2.48 2.22 2.18 2.21 5.84 5.70 4.85
156 6.92 7.89 8.74 12.85 13.53 14.24 2.50 2.47 2.45 i 2.18 2.17 2.16 5.93 5.64 5.50
157 I 5.21 7.23 7.99 10.98 12.96 13.04 2.56 2.49 2.50 I
2.23 2.18 2.22 5.77 5.73 5.05 I 158 I 6.94 740 7.88 13.10 12.99 13.14 2.49 2.47 2.47 2.16 2.17 2.19 6.16 5.59 5.26
159 7.42 8.48 6.99 13.12 13.92 12.23 2.48 2.45 2.49 2.17 2.16 2.21 5.70 5.44 5.24
160 7.55 8.13 7.86 13.51 14.14 12.85 2.47 2.45 2.47 2.16 2.14 2.20 5.96 6.01 4.99 I
161 7.57 8.15 7.44 13.55 13.74 12.64 2.47 2.46 2.48 2.16 2.16 2.20 5.98 5.59 5.20 i ; 162 8.13 8.98 8.41 14.04 14.58 13.42 2.45 2.43 2.45 2.14 2.14 2.18 5.91 5.60 5.01 \ 2 5
164 7.47 7.67 7.28 13.27 13.44 12.47 2.50 2.48 2.49 2.19 2.17 2.20 ! 5.80 5.77 5.19 '
163 696 712 696 1278 1277 1229 250 248 249 218 217 220 58 65 5 33
165 5.98 8.12 7.39 11.24 13.68 12.73 2.54 2.47 2.50 2.24 2.18 2.20 5.26 5.56 5.34
I I
166 8.34 7.46 6.89 13.82 12.90 12.08 2.46 2.48 2.51 I 2.17 2.18 2.22 . 5.48 5.44 5.19 '
167 5.23 7.05 6.75 10.33 12.35 11.83 I 2.56 2.49 2.51 i
2.26 2.20 2.22 5.10 5.30 5.08 I
168 8.87 9.95 8.64 14.49 15.63 14.11 2.46 2.43 2.47 2.16 2.14 2.17 5.62 5.68 5.47
169 5.44 7.21 6.90 110.51 12.60 14.32 2.54 2.44 2.49 2.25 2.15 2.10 5.07 5.39 7.42
170 7.94 9.02 8.27 i 13.52 14.83 13.65 2.46 2.44 2.45 2.16 2.14 2.17 5.58 5.81 5.38
171 6.18 7.72 7.40 l 11.24 13.21 12.59 2.52 2.48 2.50 2.23 2.18 2.21 5.06 5.49 5.19
172 6.63 7.77 6.84 12.20 13.54 12.14 2.52 2.48 2.51 2.21 2.17 2.22 5.57 5.77 5.30 I
173 6.90 7.58 9.75 12.25 12.77 14.92 2.50 2.48 2.43 2.20 2.20 2.16 5.35 5.19 5.17 i I
174 NT NT NT NT NT NT NT NT NT NT NT NT NT NT NT 175 NT NT NT NT NT NT NT NT NT NT NT NT NT NT NT 176 NT NT NT NT NT NT NT NT NT NT NT NT NT NT NT 177 NT NT NT NT NT NT NT NT NT i NT NT NT NT NT NT I
178 3.49 l.00 4.14 I 8.89 6.45 8.83 2.61 2.65 2.58 2.29 2.32 2.30 5.40 5.45 4.69
179 4.72 2.35 5.15 10.26 6.73 10.06 2.57 2.63 2.56 2.25 2.36 2.27 5.54 4.38 4.91
180 4.04 1.32 5.28 9.06 6.24 10.25 2.59 2.66 2.55 2.29 2.35 2.26 5.02 4.92 4.97
181 6.93 8.36 6.58 12.44 13.92 11.62 2.49 2.46 2.50 2.19 2.16 2.22 5.51 5.56 5.04
182 4.63 2.33 6.94 9.73 7.27 12.29 2.58 2.65 2.50 2.28 2.34 2.20 5.10 4.94 5.35
183 7.68 9.61 9.48 13.08 14.96 14.52 2.48 2.43 2.44 2.18 2.15 2.18 5.40 5.35 5.04 I 184 3.61 0.96 5.70 8.73 6.06 10.51 2.59 2.66 2.54 2.29 2.34 2.26 5.12 5.10 4.81
185 3.70 1.70 3.75 8.83 6.65 9.04 2.59 2.63 2.57 2.29 2.33 2.26 5.13 4.95 5.29
186 3.60 2.20 7.36 8.74 7.64 12.80 2.60 2.63 2.50 2.29 2.30 2.20 5.14 5.44 5.44
187 6.98 9.78 7.67 12.67 15.31 13.05 2.50 2.47 2.48 2.19 2.17 2.19 5.69 5.53 5.38
188 3.41 1.75 6.38 8.62 6.91 11.51 2.60 2.66 2.54 2.29 2.34 2.25 5.21 5.16 5.13
189 6.78 8.05 13.78 12.36 13.85 19.06 2.50 2.47 2.47 2.20 2.16 2.18 5.58 5.80 5.28
190 3.81 1.73 8.52 9.10 7.10 15.24 2.61 2.66 2.50 2.29 2.33 2.14 5.29 5.37 6.72
191 4.74 4.69 8.14 10.33 10.02 13.39 2.59 2.58 2.47 2.26 2.27 2.19 5.59 5.33 5.25
NT= Not Tested