Embed Size (px)
Citation preview
Page 1 of 73
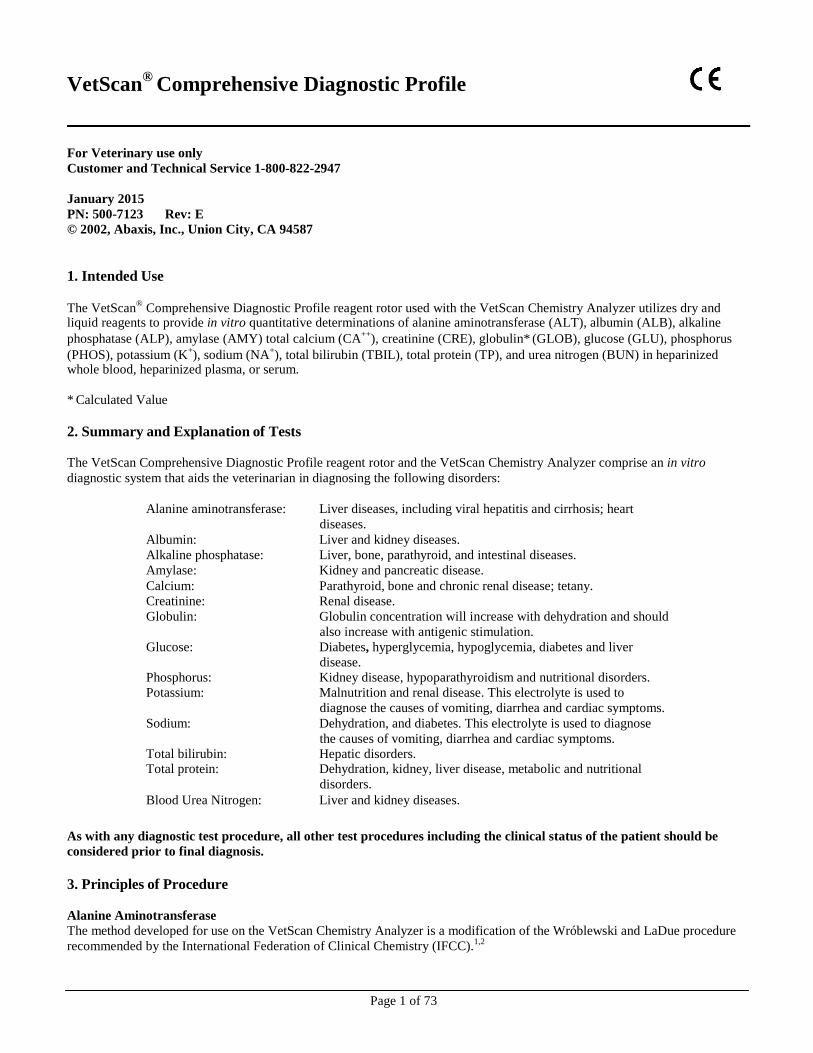
VetScan®
Comprehensive Diagnostic Profile
For Veterinary use only
Customer and Technical Service 1-800-822-2947
January 2015
PN: 500-7123 Rev: E
© 2002, Abaxis, Inc., Union City, CA 94587
1. Intended Use
The VetScan®
Comprehensive Diagnostic Profile reagent rotor used with the VetScan Chemistry Analyzer utilizes dry and liquid reagents to provide in vitro quantitative determinations of alanine aminotransferase (ALT), albumin (ALB), alkaline
phosphatase (ALP), amylase (AMY) total calcium (CA++
), creatinine (CRE), globulin* (GLOB), glucose (GLU), phosphorus
(PHOS), potassium (K+), sodium (NA
+), total bilirubin (TBIL), total protein (TP), and urea nitrogen (BUN) in heparinized
whole blood, heparinized plasma, or serum.
* Calculated Value
2. Summary and Explanation of Tests
The VetScan Comprehensive Diagnostic Profile reagent rotor and the VetScan Chemistry Analyzer comprise an in vitro
diagnostic system that aids the veterinarian in diagnosing the following disorders:
Alanine aminotransferase: Liver diseases, including viral hepatitis and cirrhosis; heart
diseases.
Albumin: Liver and kidney diseases.
Alkaline phosphatase: Liver, bone, parathyroid, and intestinal diseases.
Amylase: Kidney and pancreatic disease.
Calcium: Parathyroid, bone and chronic renal disease; tetany.
Creatinine: Renal disease.
Globulin: Globulin concentration will increase with dehydration and should
also increase with antigenic stimulation.
Glucose: Diabetes, hyperglycemia, hypoglycemia, diabetes and liver
disease.
Phosphorus: Kidney disease, hypoparathyroidism and nutritional disorders.
Potassium: Malnutrition and renal disease. This electrolyte is used to
diagnose the causes of vomiting, diarrhea and cardiac symptoms.
Sodium: Dehydration, and diabetes. This electrolyte is used to diagnose
the causes of vomiting, diarrhea and cardiac symptoms.
Total bilirubin: Hepatic disorders. Total protein: Dehydration, kidney, liver disease, metabolic and nutritional
disorders.
Blood Urea Nitrogen: Liver and kidney diseases.
As with any diagnostic test procedure, all other test procedures including the clinical status of the patient should be
considered prior to final diagnosis.
3. Principles of Procedure
Alanine Aminotransferase
The method developed for use on the VetScan Chemistry Analyzer is a modification of the Wróblewski and LaDue procedure
recommended by the International Federation of Clinical Chemistry (IFCC).1,2
Page 2 of 73
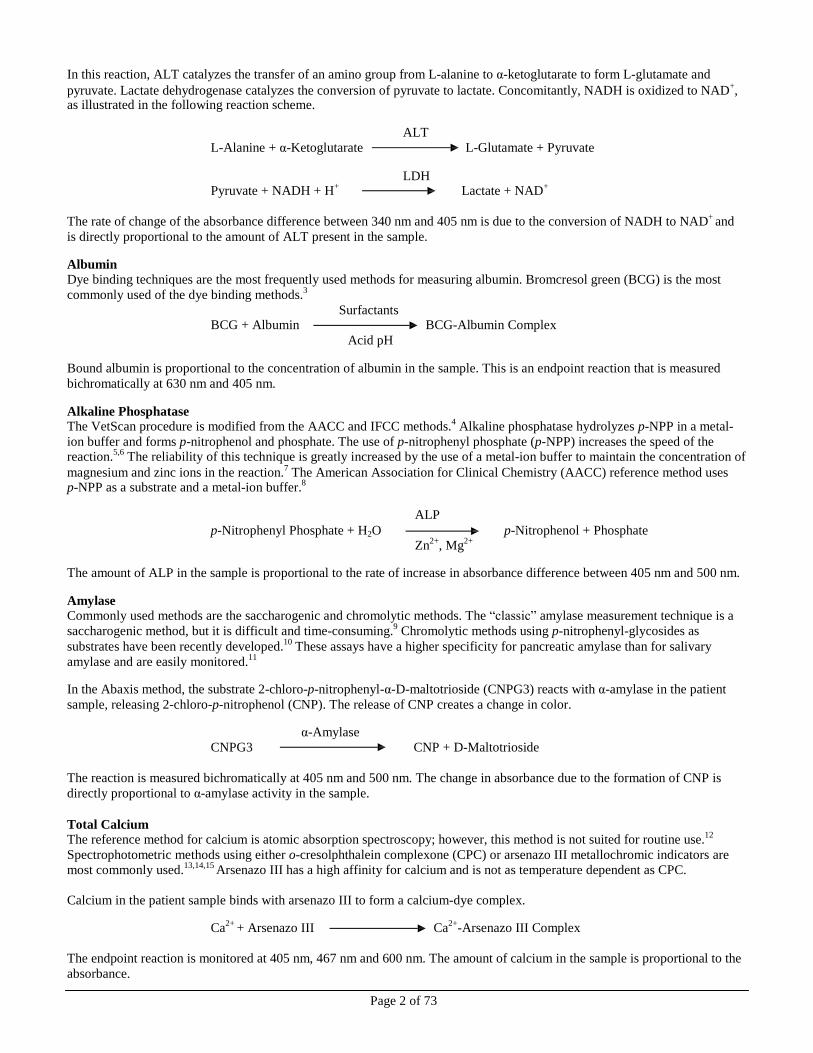
In this reaction, ALT catalyzes the transfer of an amino group from L-alanine to α-ketoglutarate to form L-glutamate and
pyruvate. Lactate dehydrogenase catalyzes the conversion of pyruvate to lactate. Concomitantly, NADH is oxidized to NAD+,
as illustrated in the following reaction scheme.
ALT
L-Alanine + α-Ketoglutarate L-Glutamate + Pyruvate
LDH
Pyruvate + NADH + H+
Lactate + NAD+
The rate of change of the absorbance difference between 340 nm and 405 nm is due to the conversion of NADH to NAD
+ and
is directly proportional to the amount of ALT present in the sample.
Albumin Dye binding techniques are the most frequently used methods for measuring albumin. Bromcresol green (BCG) is the most
commonly used of the dye binding methods.3
Surfactants BCG + Albumin BCG-Albumin Complex
Acid pH
Bound albumin is proportional to the concentration of albumin in the sample. This is an endpoint reaction that is measured
bichromatically at 630 nm and 405 nm.
Alkaline Phosphatase
The VetScan procedure is modified from the AACC and IFCC methods.4
Alkaline phosphatase hydrolyzes p-NPP in a metal-
ion buffer and forms p-nitrophenol and phosphate. The use of p-nitrophenyl phosphate (p-NPP) increases the speed of the reaction.
5,6 The reliability of this technique is greatly increased by the use of a metal-ion buffer to maintain the concentration of
magnesium and zinc ions in the reaction.7 The American Association for Clinical Chemistry (AACC) reference method uses
p-NPP as a substrate and a metal-ion buffer.8
ALP
p-Nitrophenyl Phosphate + H2O p-Nitrophenol + Phosphate Zn
2+, Mg
2+
The amount of ALP in the sample is proportional to the rate of increase in absorbance difference between 405 nm and 500 nm.
Amylase Commonly used methods are the saccharogenic and chromolytic methods. The “classic” amylase measurement technique is a
saccharogenic method, but it is difficult and time-consuming.9
Chromolytic methods using p-nitrophenyl-glycosides as
substrates have been recently developed.10
These assays have a higher specificity for pancreatic amylase than for salivary
amylase and are easily monitored.11
In the Abaxis method, the substrate 2-chloro-p-nitrophenyl-α-D-maltotrioside (CNPG3) reacts with α-amylase in the patient
sample, releasing 2-chloro-p-nitrophenol (CNP). The release of CNP creates a change in color.
α-Amylase
CNPG3 CNP + D-Maltotrioside
The reaction is measured bichromatically at 405 nm and 500 nm. The change in absorbance due to the formation of CNP is
directly proportional to α-amylase activity in the sample.
Total Calcium
The reference method for calcium is atomic absorption spectroscopy; however, this method is not suited for routine use.12
Spectrophotometric methods using either o-cresolphthalein complexone (CPC) or arsenazo III metallochromic indicators are
most commonly used.13,14,15
Arsenazo III has a high affinity for calcium and is not as temperature dependent as CPC.
Calcium in the patient sample binds with arsenazo III to form a calcium-dye complex.
Ca2+
+ Arsenazo III Ca2+
-Arsenazo III Complex
The endpoint reaction is monitored at 405 nm, 467 nm and 600 nm. The amount of calcium in the sample is proportional to the
absorbance.
Page 3 of 73
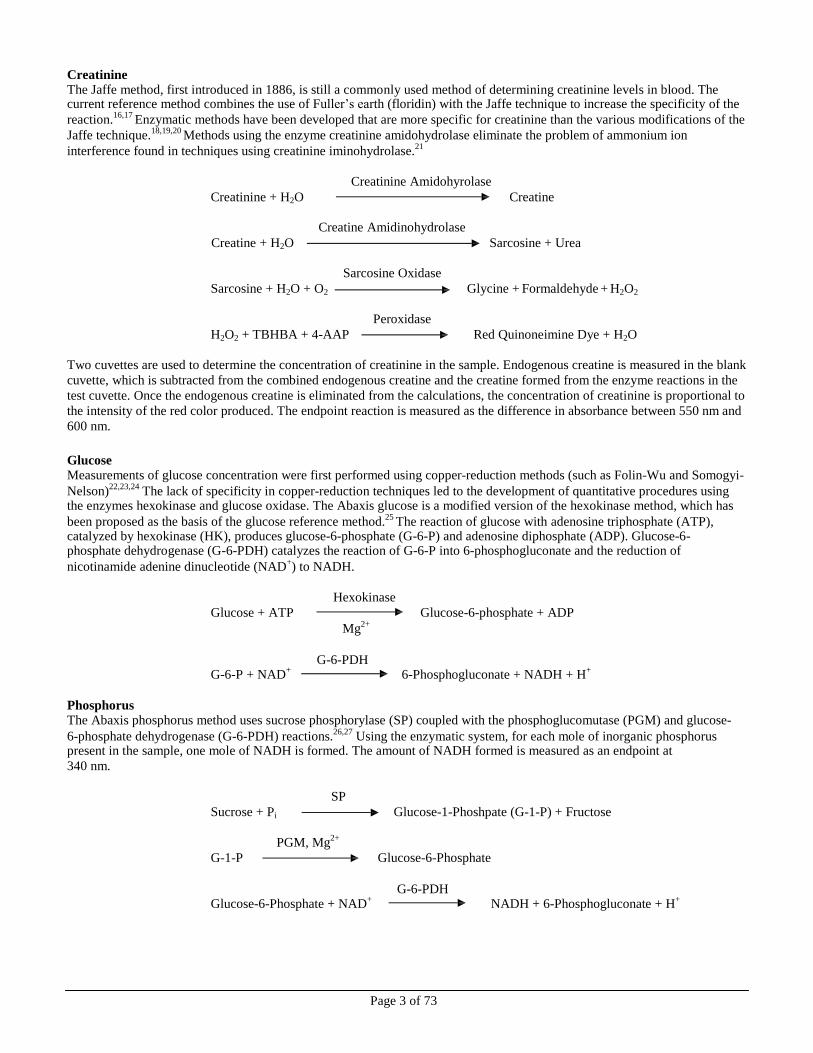
Creatinine The Jaffe method, first introduced in 1886, is still a commonly used method of determining creatinine levels in blood. The current reference method combines the use of Fuller’s earth (floridin) with the Jaffe technique to increase the specificity of the
reaction.16,17
Enzymatic methods have been developed that are more specific for creatinine than the various modifications of the
Jaffe technique.18,19,20
Methods using the enzyme creatinine amidohydrolase eliminate the problem of ammonium ion
interference found in techniques using creatinine iminohydrolase.21
Creatinine Amidohyrolase
Creatinine + H2O Creatine
Creatine Amidinohydrolase
Creatine + H2O Sarcosine + Urea
Sarcosine Oxidase
Sarcosine + H2O + O2 Glycine + Formaldehyde + H2O2
Peroxidase
H2O2 + TBHBA + 4-AAP Red Quinoneimine Dye + H2O
Two cuvettes are used to determine the concentration of creatinine in the sample. Endogenous creatine is measured in the blank
cuvette, which is subtracted from the combined endogenous creatine and the creatine formed from the enzyme reactions in the
test cuvette. Once the endogenous creatine is eliminated from the calculations, the concentration of creatinine is proportional to
the intensity of the red color produced. The endpoint reaction is measured as the difference in absorbance between 550 nm and
600 nm.
Glucose Measurements of glucose concentration were first performed using copper-reduction methods (such as Folin-Wu and Somogyi-
Nelson)22,23,24
The lack of specificity in copper-reduction techniques led to the development of quantitative procedures using the enzymes hexokinase and glucose oxidase. The Abaxis glucose is a modified version of the hexokinase method, which has
been proposed as the basis of the glucose reference method.25
The reaction of glucose with adenosine triphosphate (ATP), catalyzed by hexokinase (HK), produces glucose-6-phosphate (G-6-P) and adenosine diphosphate (ADP). Glucose-6-phosphate dehydrogenase (G-6-PDH) catalyzes the reaction of G-6-P into 6-phosphogluconate and the reduction of
nicotinamide adenine dinucleotide (NAD+) to NADH.
Hexokinase
Glucose + ATP Glucose-6-phosphate + ADP
Mg2+
G-6-PDH
G-6-P + NAD+
6-Phosphogluconate + NADH + H+
Phosphorus The Abaxis phosphorus method uses sucrose phosphorylase (SP) coupled with the phosphoglucomutase (PGM) and glucose-
6-phosphate dehydrogenase (G-6-PDH) reactions.26,27
Using the enzymatic system, for each mole of inorganic phosphorus present in the sample, one mole of NADH is formed. The amount of NADH formed is measured as an endpoint at
340 nm.
SP
Sucrose + Pi Glucose-1-Phoshpate (G-1-P) + Fructose
PGM, Mg2+
G-1-P Glucose-6-Phosphate
G-6-PDH
Glucose-6-Phosphate + NAD+
NADH + 6-Phosphogluconate + H+
Page 4 of 73
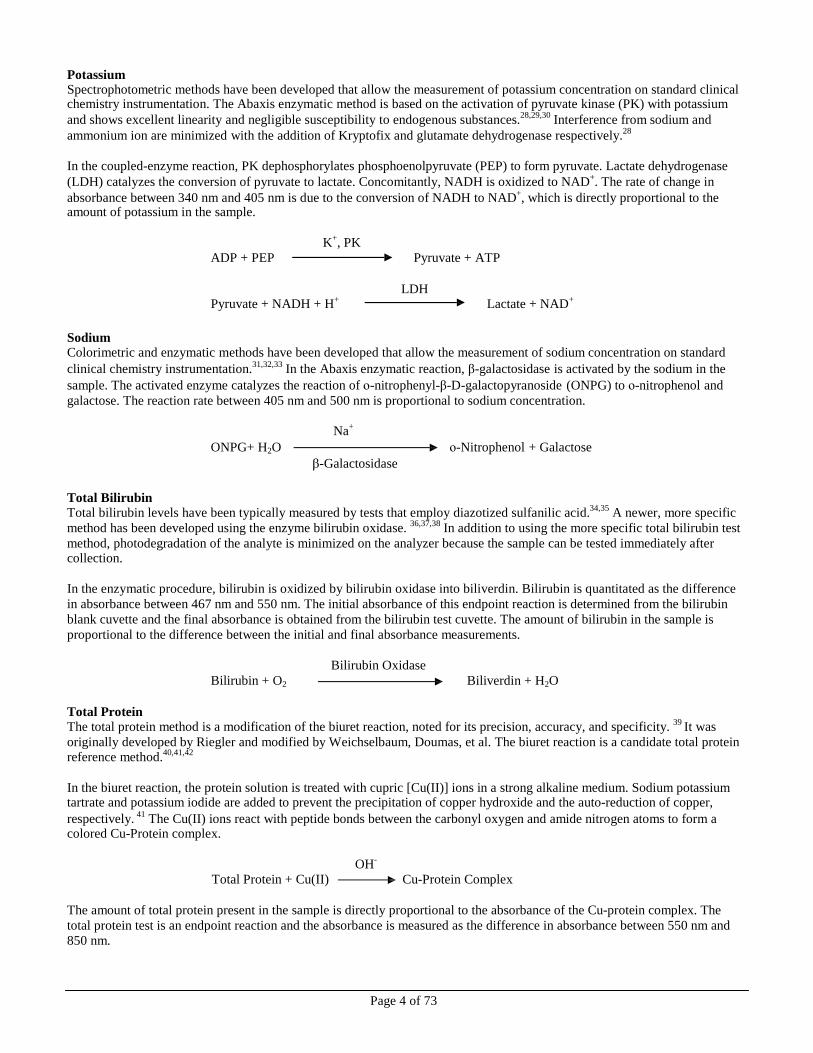
Potassium Spectrophotometric methods have been developed that allow the measurement of potassium concentration on standard clinical chemistry instrumentation. The Abaxis enzymatic method is based on the activation of pyruvate kinase (PK) with potassium
and shows excellent linearity and negligible susceptibility to endogenous substances.28,29,30
Interference from sodium and
ammonium ion are minimized with the addition of Kryptofix and glutamate dehydrogenase respectively.28
In the coupled-enzyme reaction, PK dephosphorylates phosphoenolpyruvate (PEP) to form pyruvate. Lactate dehydrogenase
(LDH) catalyzes the conversion of pyruvate to lactate. Concomitantly, NADH is oxidized to NAD+. The rate of change in
absorbance between 340 nm and 405 nm is due to the conversion of NADH to NAD+, which is directly proportional to the
amount of potassium in the sample.
K+, PK
ADP + PEP Pyruvate + ATP
LDH
Pyruvate + NADH + H+
Lactate + NAD+
Sodium Colorimetric and enzymatic methods have been developed that allow the measurement of sodium concentration on standard
clinical chemistry instrumentation.31,32,33
In the Abaxis enzymatic reaction, β-galactosidase is activated by the sodium in the
sample. The activated enzyme catalyzes the reaction of ο-nitrophenyl-β-D-galactopyranoside (ONPG) to ο-nitrophenol and
galactose. The reaction rate between 405 nm and 500 nm is proportional to sodium concentration.
Na+
ONPG+ H2O ο-Nitrophenol + Galactose
β-Galactosidase
Total Bilirubin
Total bilirubin levels have been typically measured by tests that employ diazotized sulfanilic acid.34,35
A newer, more specific
method has been developed using the enzyme bilirubin oxidase. 36,37,38
In addition to using the more specific total bilirubin test
method, photodegradation of the analyte is minimized on the analyzer because the sample can be tested immediately after collection.
In the enzymatic procedure, bilirubin is oxidized by bilirubin oxidase into biliverdin. Bilirubin is quantitated as the difference
in absorbance between 467 nm and 550 nm. The initial absorbance of this endpoint reaction is determined from the bilirubin
blank cuvette and the final absorbance is obtained from the bilirubin test cuvette. The amount of bilirubin in the sample is
proportional to the difference between the initial and final absorbance measurements.
Bilirubin Oxidase
Bilirubin + O2 Biliverdin + H2O
Total Protein
The total protein method is a modification of the biuret reaction, noted for its precision, accuracy, and specificity. 39
It was
originally developed by Riegler and modified by Weichselbaum, Doumas, et al. The biuret reaction is a candidate total protein reference method.
40,41,42
In the biuret reaction, the protein solution is treated with cupric [Cu(II)] ions in a strong alkaline medium. Sodium potassium tartrate and potassium iodide are added to prevent the precipitation of copper hydroxide and the auto-reduction of copper,
respectively. 41
The Cu(II) ions react with peptide bonds between the carbonyl oxygen and amide nitrogen atoms to form a colored Cu-Protein complex.
OH-
Total Protein + Cu(II) Cu-Protein Complex
The amount of total protein present in the sample is directly proportional to the absorbance of the Cu-protein complex. The
total protein test is an endpoint reaction and the absorbance is measured as the difference in absorbance between 550 nm and
850 nm.
Page 5 of 73
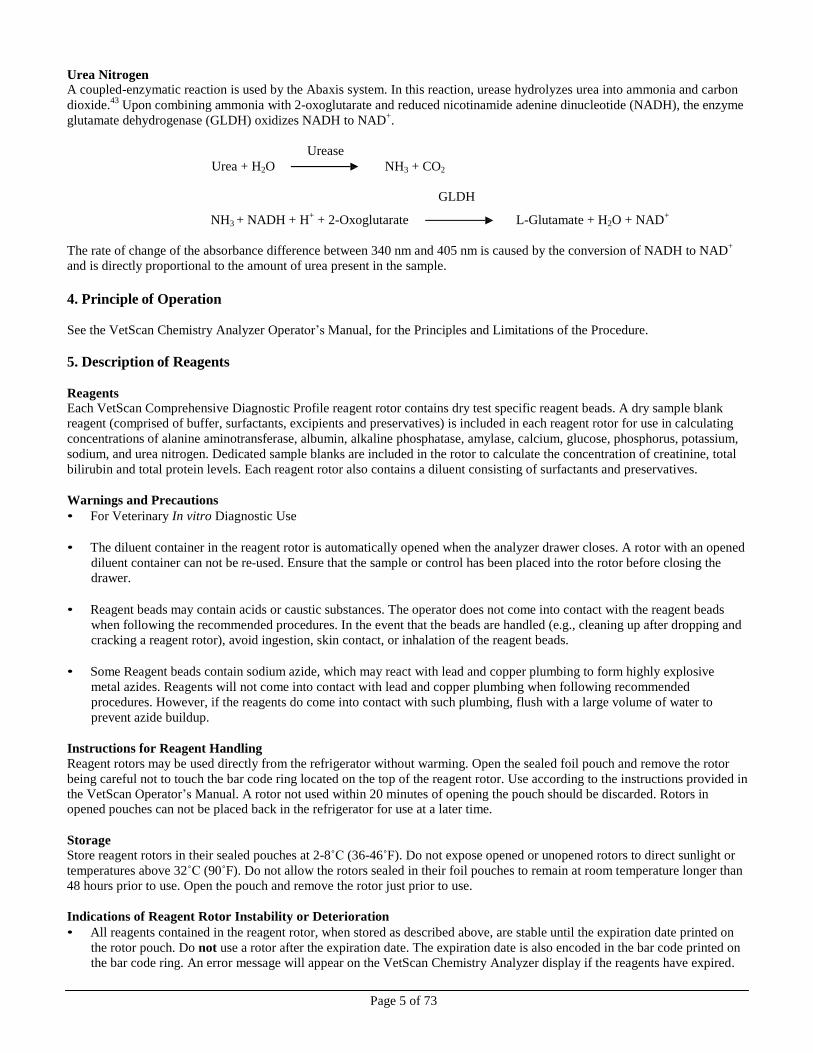
Urea Nitrogen A coupled-enzymatic reaction is used by the Abaxis system. In this reaction, urease hydrolyzes urea into ammonia and carbon
dioxide.43
Upon combining ammonia with 2-oxoglutarate and reduced nicotinamide adenine dinucleotide (NADH), the enzyme
glutamate dehydrogenase (GLDH) oxidizes NADH to NAD+.
Urease
Urea + H2O NH3 + CO2
GLDH
NH3 + NADH + H+
+ 2-Oxoglutarate L-Glutamate + H2O + NAD+
The rate of change of the absorbance difference between 340 nm and 405 nm is caused by the conversion of NADH to NAD+
and is directly proportional to the amount of urea present in the sample.
4. Principle of Operation
See the VetScan Chemistry Analyzer Operator’s Manual, for the Principles and Limitations of the Procedure.
5. Description of Reagents
Reagents Each VetScan Comprehensive Diagnostic Profile reagent rotor contains dry test specific reagent beads. A dry sample blank
reagent (comprised of buffer, surfactants, excipients and preservatives) is included in each reagent rotor for use in calculating
concentrations of alanine aminotransferase, albumin, alkaline phosphatase, amylase, calcium, glucose, phosphorus, potassium,
sodium, and urea nitrogen. Dedicated sample blanks are included in the rotor to calculate the concentration of creatinine, total
bilirubin and total protein levels. Each reagent rotor also contains a diluent consisting of surfactants and preservatives.
Warnings and Precautions
• For Veterinary In vitro Diagnostic Use
• The diluent container in the reagent rotor is automatically opened when the analyzer drawer closes. A rotor with an opened
diluent container can not be re-used. Ensure that the sample or control has been placed into the rotor before closing the
drawer.
• Reagent beads may contain acids or caustic substances. The operator does not come into contact with the reagent beads
when following the recommended procedures. In the event that the beads are handled (e.g., cleaning up after dropping and
cracking a reagent rotor), avoid ingestion, skin contact, or inhalation of the reagent beads.
• Some Reagent beads contain sodium azide, which may react with lead and copper plumbing to form highly explosive
metal azides. Reagents will not come into contact with lead and copper plumbing when following recommended
procedures. However, if the reagents do come into contact with such plumbing, flush with a large volume of water to
prevent azide buildup.
Instructions for Reagent Handling
Reagent rotors may be used directly from the refrigerator without warming. Open the sealed foil pouch and remove the rotor
being careful not to touch the bar code ring located on the top of the reagent rotor. Use according to the instructions provided in
the VetScan Operator’s Manual. A rotor not used within 20 minutes of opening the pouch should be discarded. Rotors in opened pouches can not be placed back in the refrigerator for use at a later time.
Storage Store reagent rotors in their sealed pouches at 2-8˚C (36-46˚F). Do not expose opened or unopened rotors to direct sunlight or
temperatures above 32˚C (90˚F). Do not allow the rotors sealed in their foil pouches to remain at room temperature longer than
48 hours prior to use. Open the pouch and remove the rotor just prior to use.
Indications of Reagent Rotor Instability or Deterioration
• All reagents contained in the reagent rotor, when stored as described above, are stable until the expiration date printed on
the rotor pouch. Do not use a rotor after the expiration date. The expiration date is also encoded in the bar code printed on
the bar code ring. An error message will appear on the VetScan Chemistry Analyzer display if the reagents have expired.
Page 6 of 73
• A torn or otherwise damaged pouch may allow moisture to reach the unused rotor and adversely affect reagent
performance. Do not use a rotor from a damaged pouch.
6. Instrument
See the VetScan Operator’s Manual for complete information on using the analyzer.
7. Sample Collection and Preparation
The minimum required sample size is ~100 µL of heparinized whole blood, heparinized plasma, serum or control. The reagent
rotor sample chamber can contain up to 120 µL of sample.
• Specimens collected in a heparinized micropipette should be dispensed into the reagent rotor immediately following
sample collection.
• Use only lithium heparin (green stopper) evacuated specimen collection tubes for whole blood or plasma samples. Use
no-additive (red stopper) evacuated specimen collection tubes or serum separator tubes (red or red/black stopper) for
serum samples.
• Whole blood samples obtained by venipuncture must be homogenous before transferring a sample to the reagent rotor.
Gently invert the collection tubes several times just prior to sample transfer. Do not shake the collection tube. Shaking
may cause hemolysis.
• The test must be started within 10 minutes of transferring the sample into the reagent rotor.
• Whole blood venipuncture samples should be run within 60 minutes of collection; if this is not possible, separate the
sample and transfer it into a clean test tube.44
Run the separated plasma or serum sample within 5 hours of centrifugation. If this is not possible, refrigerate the sample in a stoppered test tube at 2-8°C (36-46°F) for no longer than 48 hours.
A plasma or serum sample can be stored at -10°C (14°F) for up to 5 weeks in a freezer that does not have a self-defrost cycle.
• Glucose concentrations decrease approximately 5-12 mg/dL in 1 hour in uncentrifuged samples stored at room
temperature.45
• Refrigerating whole blood samples can cause significant changes in concentrations of glucose and creatinine.
46
• Total bilirubin results may be adversely affected by photodegradation.
47 Whole blood samples not run immediately
should be stored in the dark for no longer than 60 minutes. If the sample can not be analyzed within that period, it should
be separated into plasma or serum and stored in a capped sample tube in the dark at low temperatures.48
Known Interfering Substances
• The only anticoagulant recommended for use with the VetScan Chemistry Analyzer is lithium heparin. Sodium heparin
must not be used when collecting blood samples for use with this panel. Abaxis has performed studies demonstrating that
EDTA, fluoride, oxalate, and any anticoagulant containing ammonium ions will interfere with at least one chemistry in the
VetScan Comprehensive Diagnostic Profile reagent rotor.
• Physical interferents (hemolysis, icterus, and lipemia) may cause changes in the reported concentrations of some analytes.
The sample indices are printed on the bottom of each result card to inform the operator about the levels of interferents
present in each sample. The VetScan Chemistry Analyzer suppresses any results that are affected by >10% interference
from hemolysis, lipemia, or icterus. “HEM”, “LIP”, “ICT” is printed on the result card in place of the result.
• Hemolysis may cause erroneously high results in potassium assays. This problem may go undetected when analyzing
whole blood ( release of potassium from as few as 0.5% of the erythrocytes can increase the potassium serum level by 0.5 mmol/L). In particular, even unhemolyzed specimens that are not properly processed may have increased potassium levels
due to intracellular potassium leakage.49
• Bilirubin may interfere with the peroxidase used in the creatinine reaction.50
Creatinine results are lowered when bilirubin
levels are > 10 mg/dL.
Page 7 of 73
• Glucose concentrations are affected by the length of time since the patient has eaten and by the type of sample collected from the patient. To accurately interpret glucose results, samples should be obtained from a patient that has been fasted for
at least 12 hours.51
• Interference may be seen in the total protein test when analyzing samples with a 3 + lipemic index.
52 Samples with a
triglyceride concentration >400 mg/dL may show an increased total protein level.48
The VetScan Chemistry Analyzer suppresses any results that are affected by >10% interference from lipemia. “LIP” is printed on the result card in place of the result.
• The potassium assay in the VetScan system is a coupled pyruvate kinase (PK) / lactate dehydrogenase (LDH) assay.
Therefore, in cases of extreme muscle trauma or highly elevated levels of creatine kinase (CK), the VetScan may recover a
falsely elevated potassium (K+) value. In such cases, unexpected high potassium recoveries need to be confirmed utilizing
a different methodology.
8. Procedure
Materials Provided
• One VetScan Comprehensive Diagnostic Profile Reagent Rotor
Materials Required but not Provided
• VetScan Chemistry Analyzer
Test Parameters The VetScan System operates at ambient temperatures between 15°C and 32°C (59-90°F). The analysis time for each VetScan
Comprehensive Diagnostic Profile Reagent Rotor is less than 14 minutes. The analyzer maintains the reagent rotor at a
temperature of 37°C (98.6°F) over the measurement interval.
Test Procedure The complete sample collection and step-by-step operating procedures are detailed in the VetScan Operator’s Manual.
Calibration
The VetScan Chemistry Analyzer is calibrated by the manufacturer before shipment. The barcode printed on the barcode ring
provides the analyzer with rotor-specific calibration data. Please see the VetScan Operator’s Manual.
Quality Control
Controls may be run periodically on the VetScan Chemistry Analyzer to verify the accuracy of the analyzer. Abaxis
recommends that a serum-based commercially available control be run. Run controls on the reagent rotor in the same manner
as for patient samples. See the VetScan Operator’s Manual to run controls.
9. Results
The VetScan Chemistry Analyzer automatically calculates and prints the analyte concentrations in the sample. Details of the
endpoint and rate reaction calculations are found in the VetScan Operator’s Manual.
10. Limitations of Procedure
General procedural limitations are discussed in the VetScan Systems Operator’s Manual.
• If a result for a particular test exceeds the assay range, the sample should be analyzed by another approved test
method or sent to a referral laboratory.
• Samples with hematocrits in excess of 60% packed red cell volume may give inaccurate results. Samples with high
hematocrits may be reported as hemolyzed. These samples may be spun down and the plasma then re-run in a new reagent
rotor.
Warning: Extensive testing of the VetScan Chemistry Analyzer has shown that in very rare instances, sample dispensed
into the reagent rotor may not flow smoothly into the sample chamber. Due to the uneven flow, an
inadequate quantity of sample may be analyzed and several results may fall outside your established
reference ranges. The sample may be re-run using a new reagent rotor.

Page 8 of 73
11. Expected Values
These normal intervals are provided only as a guideline. The most definitive reference intervals are those established for your
patient population. Test results should be interpreted in conjunction with the patient’s clinical signs. To customize specific
normal ranges in your VetScan Chemistry Analyzer for the “Other” bank, refer to your VetScan Operator’s Manual under the
Menu Key functions.
Table 1: Reference Intervals
Canine Feline Equine
ALT 10-118 U/L (10-118 U/L)
ALB 2.5-4.4 g/dL (25-44 g/L)
ALP 20-150 U/L (20-150 U/L)
AMY 200-1200 U/L (200-1200 U/L)
CA++ 8.6-11.8 mg/dL (2.2-3.0 mmol/L)
CRE 0.3-1.4 mg/dL (27-124 µmol/L)
GLOB 2.3-5.2 g/dL (23-52 g/L)
GLU 60-110 mg/dL (3.3-6.1 mmol/L)
PHOS 2.9-6.6 mg/dL (0.94-2.13 mmol/L)
K+ 3.7-5.8 mmol/L (3.7-5.8 mmol/L)
Na+ 138-160 mmol/L (138-160 mmol/L)
TBIL 0.1-0.6 mg/dL (2-10 µmol/L)
TP 5.4-8.2 g/dL (54-82 g/L)
BUN 7-25 mg/dL (2.5-8.9 mmol/L)
20-100 U/L
(20-100 U/L)
2.2-4.4 g/dL
(22-44 g/L)
10-90 U/L (10-90 U/L)
300-1100 U/L
(300-1100 U/L)
8.0-11.8 mg/dL
(2.0-3.0 mmol/L)
0.3-2.1 mg/dL
(27-186 µmol/L)
1.5-5.7 g/dL
(15-57 g/L)
70-150 mg/dL
(3.9-8.3 mmol/L)
3.4-8.5 mg/dL
(1.10-2.74 mmol/L)
3.7-5.8 mmol/L)
(3.7-5.8 mmol/L)
142-164 mmol/L
(142-164 mmol/L)
0. 1-0.6 mg/dL
(2-10 µmol/L)
5.4-8.2 g/dL (54-82 g/L)
10-30 mg/dL
(3.6-10.7 mmol/L)
5-20 U/L
(5-20 U/L) 2.2-3.7 g/dL
(22-37 g/L)
50-170 U/L
(50-170 U/L)
5-15 U/L
(5-15 U/L) 11.5-14.2 mg/dL
(2.9-3.6 mmol/L)
0.6-2.2 mg/dL
(53-194 µmol/L)
2.7-5.0 g/dL
(27-50 g/L)
65-110 mg/dL
(3.6-6.1 mmol/L)
1.9-4.3 mg/dL
(0.61-1.39 mmol/L)
2.5-5.2 mmol/L
(2.5-5.2 mmol/L)
126-146 mmol/L
(126-146 mmol/L)
0.5-2.3 mg/dL
(9-39 µmol/L)
5.7-8.0 g/dL (57-80 g/L)
7-25 mg/dL
(2.5-8.9 mmol/L)
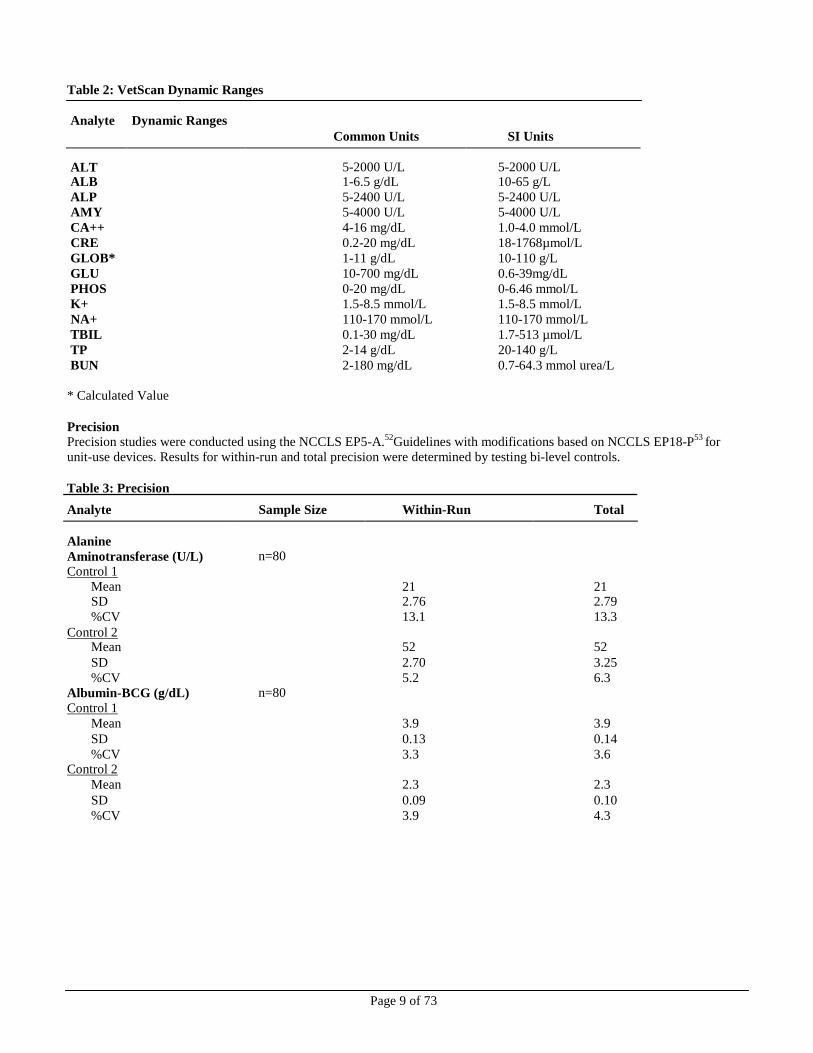
12. Performance Characteristics (Linearity)
The chemistry for each analyte is linear over the dynamic range listed below when the VetScan System is operated according
to the recommended procedure (see the VetScan Operator’s Manual). The Dynamic Range table referenced below represents
the spectrum that the VetScan System can detect. The intervals below do not represent normal ranges.
Page 9 of 73
Analyte Sample Size Within-Run Total
Alanine
Aminotransferase (U/L)
Control 1
Mean
n=80
21
21 SD 2.76 2.79
%CV 13.1 13.3
Mean
52
52
SD 2.70 3.25
%CV
Albumin-BCG (g/dL) Control 1
Mean
n=80
5.2
3.9
6.3
3.9
SD 0.13 0.14
%CV 3.3 3.6
Mean
2.3
2.3
SD 0.09 0.10
%CV 3.9 4.3
Table 2: VetScan Dynamic Ranges
Analyte Dynamic Ranges
Common Units SI Units
ALT
5-2000 U/L
5-2000 U/L ALB 1-6.5 g/dL 10-65 g/L
ALP 5-2400 U/L 5-2400 U/L
AMY 5-4000 U/L 5-4000 U/L
CA++ 4-16 mg/dL 1.0-4.0 mmol/L
CRE 0.2-20 mg/dL 18-1768µmol/L
GLOB* 1-11 g/dL 10-110 g/L
GLU 10-700 mg/dL 0.6-39mg/dL
PHOS 0-20 mg/dL 0-6.46 mmol/L
K+ 1.5-8.5 mmol/L 1.5-8.5 mmol/L
NA+ 110-170 mmol/L 110-170 mmol/L
TBIL 0.1-30 mg/dL 1.7-513 µmol/L
TP 2-14 g/dL 20-140 g/L
BUN 2-180 mg/dL 0.7-64.3 mmol urea/L
* Calculated Value
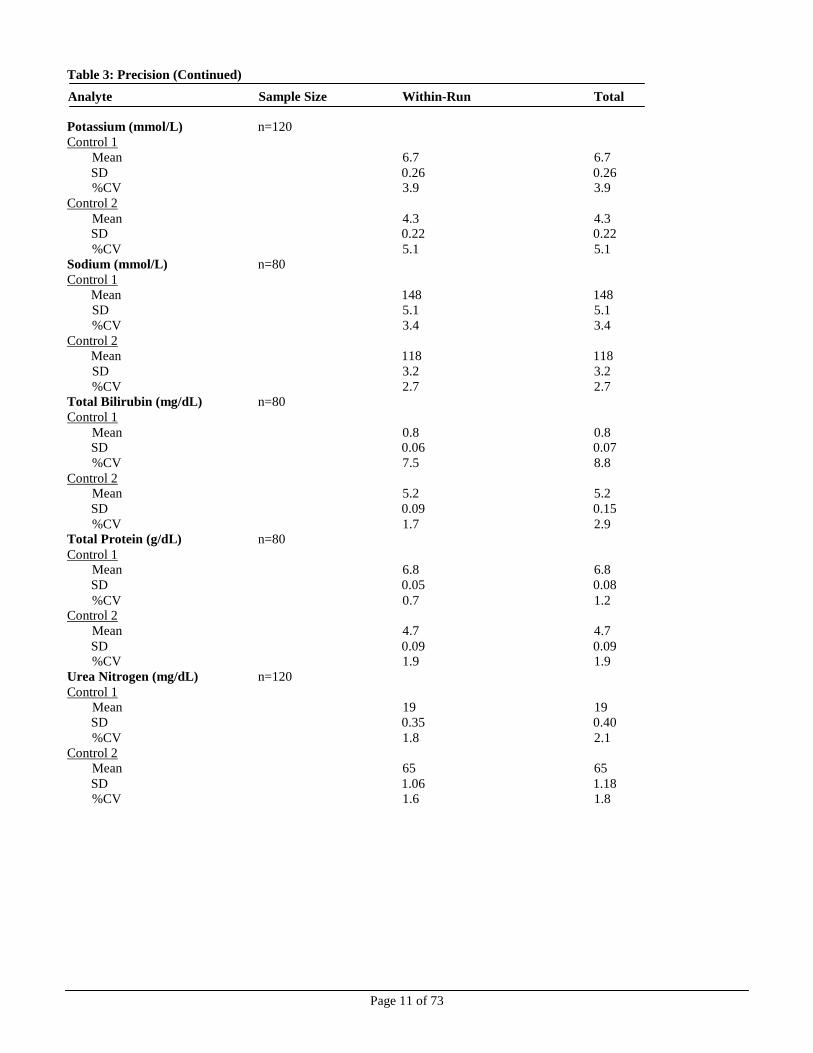
Precision
Precision studies were conducted using the NCCLS EP5-A.52
Guidelines with modifications based on NCCLS EP18-P53
for
unit-use devices. Results for within-run and total precision were determined by testing bi-level controls.
Table 3: Precision
Control 2
Control 2

Page 10 of 73
Table 3: Precision (Continued)
Analyte Sample Size Within-Run Total
Alkaline Phosphatase (U/L) n=80
Control 1
Mean 39 39
SD 1.81 2.29
%CV 4.6 5.9
Control 2
Mean 281 281
SD 4.08 8.75 %CV 1.5 3.1
Amylase (U/L) n=80
Control 1 Mean 46 46
SD 2.40 2.63
%CV 5.2 5.7 Control 2
Mean 300 300
SD 11.15 11.50 %CV 3.7 3.8
Calcium (mg/dL) n=80
Control 1 Mean 8.6 8.6
SD 0.21 0.25
%CV 2.4 2.9 Control 2
Mean 11.8 11.8
SD 0.39 0.40
%CV 3.3 3.4
Creatinine (mg/dL) n=80
Control 1
Mean 1.1 1.1
SD 0.14 0.14
%CV 12.7 12.7
Control 2
Mean 5.2 5.2
SD 0.23 0.27
%CV 4.4 5.2
Glucose (mg/dL) n=80 Control 1
Mean 66 66
SD 0.76 1.03 %CV 1.2 1.6
Control 2
Mean 278 278 SD 2.47 3.84
%CV 0.9 1.4
Phosphorus (mg/dL) n=80 Control 1
Mean 6.9 6.9
SD 0.2 0.2 %CV 2.2 2.6
Control 2 Mean 3.4 3.4
SD 0.1 0.2
%CV 4.1 4.9
Page 11 of 73
Table 3: Precision (Continued)
Analyte Sample Size Within-Run Total
Potassium (mmol/L) n=120
Control 1
Mean 6.7 6.7
SD 0.26 0.26 %CV 3.9 3.9
Control 2
Mean 4.3 4.3 SD 0.22 0.22
%CV 5.1 5.1
Sodium (mmol/L) n=80
Control 1
Mean 148 148
SD 5.1 5.1
%CV 3.4 3.4
Control 2
Mean 118 118
SD 3.2 3.2
%CV 2.7 2.7
Total Bilirubin (mg/dL) n=80
Control 1
Mean 0.8 0.8 SD 0.06 0.07
%CV 7.5 8.8
Control 2 Mean 5.2 5.2
SD 0.09 0.15
%CV 1.7 2.9 Total Protein (g/dL) n=80
Control 1 Mean 6.8 6.8
SD 0.05 0.08
%CV 0.7 1.2 Control 2
Mean 4.7 4.7
SD 0.09 0.09 %CV 1.9 1.9
Urea Nitrogen (mg/dL) n=120
Control 1
Mean 19 19
SD 0.35 0.40
%CV 1.8 2.1
Control 2
Mean 65 65
SD 1.06 1.18
%CV 1.6 1.8

Page 12 of 73
Correlation Field studies were conducted at a veterinary teaching hospital. Serum samples were analyzed by the VetScan Chemistry
Analyzer and a comparative method. Representative correlation statistics are shown in Table 4.
Table 4: Correlation of the VetScan Chemistry Analyzer with Comparative Method(s)
Correlation
Coefficient Slope Intercept N
Sample
Range
Alanine
Aminotransferase
(U/L)
Albumin (g/dL)
Alkaline
Phosphatase (U/L)
Amylase (U/L)
Calcium (mg/dL)
Creatinine (mg/dL)
Glucose (mg/dL)
Phosphorus (mg/dL)
Potassium (mmol/L)
Sodium (mmol/L)
Total Bilirubin
(mg/dL)
Total Protein (g/dL)
Urea Nitrogen
(mg/dL)
Canine
Feline
Equine
Canine
Feline
Equine
Canine
Feline
Equine
Canine
Feline
Equine
Canine
Feline
Equine
Canine
Feline
Equine
Canine
Feline
Equine
Canine
Feline
Equine
Canine
Feline
Equine
Canine
Feline
Equine
Canine
Feline
Equine
Canine
Feline
Equine
Canine
Feline
Equine
1.00
0.98
0.97
0.96
0.75
0.89
1.00
0.97
1.00
0.96
1.0
N/A
0.84
0.77
0.94
0.99 1.00
0.95
0.96
1.00
0.97
0.994
0.916
0.971
0.96
0.91 0.84
0.89
0.86 0.86
0.87
1.00
1.00
0.98 0.97 0.99
1.00
1.00
1.00
0.95
0.92
0.94
0.99
1.02
0.99
0.89
0.81
0.90
0.67
0.74
N/A
1.24
1.24
1.18
1.00 1.01
1.00
1.01
0.97
0.94
1.09
0.80
0.991
0.92
0.92 0.97
0.97
1.08 1.00
0.84 0.92
0.90
1.03
0.96 0.97
0.98
1.07
0.95
0
0
6
0.1
0
-0.6
-5
1
-4
-34
117
N/A
-1.9
-2.1
-0.8
0.0 -0.1
-0.4
-6
3
16
-0.19
0.81
-0.06
0.4
0.5 0.1
4.8
-12.2 -0.01
0.1 -0.3
0.1
0.1
0.4 0.3
-2
-5
-1
22-180
21-55
7-101
22-180
21-55
7-101
22-180
21-55
7-101
22-180
21-55
7-101
22-180
21-55
7-101
22-180 21-55
7-101
22-180
21-55
7-101
22-180
21-55
7-101
22-180
21-55 7-101
22-180
21-55 7-101
22-180 21-55
7-101
22-180
21-55 7-101
22-180
21-55
7-101
10-1549
27-99
11-30
1.3-4.6
2.1-4.8
1.2-3.2
15-1722
6-54
119-1476
366-1991
473-3474
N/A
7.3-13.0
6.3-12.4
7.2-15.1
0.6-10.6 0.3-13.6
0.3-6.2
28-348
52-607
36-353
0.8-87
2.4-6.9
0.8-7.8
3.2-6.9
2.7-5.3 1.8-4.6
118-183
122-166 110-166
0.1-3.2 0.4-15.0
0.6-26.1
2.6-10.7
4.8-8.5 3.0-9.5
4-117
14-165
3-64

Page 13 of 73
13. Bibliography
1. Wróbleski F and LaDue. Serum glutamic-pyruvic transminase in cardiac and hepatic disease. Proc Soc Exp Biol Med.
1956;91:569-71. 2. Bergmeyer HU and Horder M. IFCC methods for the measurement of catalytic concentration of enzymes. Part 3. IFCC
method for alanine aminotransferase. J. Clin Chem Clin Biochem 1980;18:521-34.
3. Webster D, et al. An assessment on the suitability of bromocresol green for the determination of serum albumin. Clin Chim Acta 1974;53:101-8.
4. Bowers GN, et al. IFCC methods for the measurement of catalytic concentration of enzymes. Part 1. General
considerations concerning the determination of the catalytic concentration of an enzyme in the blood serum or plasma of
man. Clin Chim Acta 1979;98:163F-74F.
5. Ohmori Y. Uber die Phosphomomesterase. Enzymologia 1937;4:217-31.
6. Fujita H. Uber die Mikrobestimmung der Blutphosphatase. J Biochem, Japan. 1937;30:69-87.
7. Petitclerc C, et al. Mechanism of action of Mg2+ and Zn2+ on rat placental alkaline phosphatase. I. Studies on the soluble
Zn2+
and Mg2+
alkaline phosphatase. Can J Biochem 1975;53:1089-1100.
8. Tietz NW, et al. A reference method for measurement of alkaline phosphatase activity in human serum. Clin Chem 1983;29:751-61.
9. Somogyi M. Modifications of two methods for the assay of amylase. Clin Chem 1960;6:23-35.
10. Gillard BK, Markman HC and Feig SA. Direct spectrophotometric determination of α-amylase activity in saliva with
p-nitrophenyl α-maltoside as substrate. Clin Chem 1977;23:2279-82.
11. Wallenfels K, et al. The enzymic synthesis, by transglucosylation of a homologous series of glycosidically substituted
malto- ologosaccharides, and their use as amylase substrateds. Carbohydrate Res 1978;61:359-68.
12. Cali JP, Bowers GN, Young DS, et al. A reference method for the determination of total calcium in serum. In: GR Cooper,
ed., Selected methods of Clinical Chemistry. Washington, DC: American Association for Clinical Chemistry; 1977;8:3-8.
13. Kessler G, M Wolfman. An Automated procedure for the simultaneous determination of calcium and phosphorus.
Clin Chem 1964;10: 686-703.
14. Michaylova V, P Ilkova. Photometric determination of micro amounts of calcium with arsenazo III. Anal Chim Acta 1971;53: 194-8.
15. Scarpa A, et al. Metallochromic indicators of ionized calcium. Ann NY Acad Sci 1978;307:86-112.
16. Knoll VE, et al. Spezifische Kreatininbetimmung Im Serum. Z Klin Chemi Clin Biochem. 1970;8:582-587. 17. Haeckel R, et al. Simplified Determinations of the “True” Creatinine Concentration In Serum And Urine. J Cklin Chem
Clin Biochem. 1980;18:385-394.
18. Moss GA, et al. Kinetic Enzymatic Method For Determining Serum Creatinine. Clin Chem 1975;21:1422-1426. 19. Jaynes PK, et al. An Enzymatic, Reaction-Rate Assay For Serum Creatinine With a Centrifugal Analyzer. Clin Chem
1982;28:114-117.
20. Fossati P, et al. Enzymatic Creatinine Assay: A New Colorimetric Method Based on Hydrogen Peroxide Measurement. Clin Chem 1983;29:1494-1496.
21. Whelton A, et al. Nitrogen Metabolites and Renal Function. In:CA Burtis and ER Ashwood, Eds., Tietz Textbook of
Clinical Chemistry, 3rd
Ed. Philadelphia: W.B. Saunders Company. 1999;1513-1575.
22. Folin O, and Wu H. A System of blood analysis. J Biol Chem 1919;38: 81-110.
23. Somogyi M. A reagent for the copper-idiometric determination of very small amounts of sugar. J Biol Chem
1937;117: 771-776. 24. Nelson N. A photometric adaption of the Somogyi method for the determination of glucose. J Biol 1944;
153: 375-380.
25. Kaplan LA. Glucose. In:LA Kaplan and AJ Pesce, eds., Clinical Chemistry: Theory, Analysis, and Correlation,
2nd
ed St. Louis: The C.V. Mosby Company; 1989;850-856.
26. Schulz DW, et al. An Enzymic Method for the Measurement of Inorganic Phosphate Determination Anal Biochem 1967;19:300-14.
27. Tedokon, M Suzuki, et al. Enzymatic Assay of Inorganic Phosphate with Use of Sucrose Phosphorylase and
Phosphoglucomutase. Clin Chem 1992;38:512-5.
28. Berry MN, et al. Enzymatic determination of potassium in serum. Clin Chem 1989;35:817-20.
29. Van Pelt J. Enzymatic determination of sodium, potassium and chloride in serum compared with determination by flame
photometry, coulometry and ion selective electrodes. Clin Chem 1994;40:846-7.
30. Hubl W, et al. Enzymatic determination of sodium, potassium and chloride in abnormal (hemolyzed, icteric, lipemic,
paraprteinemic, or uremic) serum samples compared with indirect determination with ion selective electrodes. Clin Chem
1994;40:1528-31.
31. Helgerson RC, et al. Host-guest Complexation. 50. Potassium and sodium ion-selective chromogenic ionophores.
J Amer Chem Soc 1989;111:6339-50.
32. Kumar A, et al. Chromogenic ionophere-based methods for spectrophotometric assay of sodium and potassium in serum
and plasma. Clin Chem 1988;34:1709-12.
Page 14 of 73
13. Bibliography (Continued)
33. Berry MN, et al. Enzymatic determination of sodium in serum. Clin Chem 1988;34:2295-8.
34. Malloy HT, and Evelyn KA. The determination of bilirubin with the photoelectric colorimeter. J biol Chem 1937;
119:481-90.
35. Meites S. Bilirubin, directing reacting and total, modified Mally-Evelyn method. In: WR Faulkner and S Meites, eds.,
Selected Methods of Clinical Chemistry, Washington, DC: American Association for Clinical Chemistry; 1982;9:119-24.
36. Murao S and Tanaka N. A new enzyme “bilirubin oxidase” produced by Myrothecium verrucaria MT-1. Agric Biol Chem
1981;45:2383-4. 37. Osaki, S and S Anderson. Enzymatic determination of bilirubin. Clin Chem 1982;30:971. (Abstract)
38. Perry B, et al. Measurement of total bilirubin by use of bilirubin oxidase. Clin Chem 1986;32:329-32.
39. Koller A and Kaplan LA. Total serum protein. In: LA Kaplan and AJ Pesce, eds., Clinical Chemistry: Theory, Analysis,
and Correlation, 2nd
ed. St Louis: The C.V. Mosby Company; 1989:1057-60.
40. Reigler E. Eine kolorimetrische Bestimmungsmethods des Eiweisses. Z Anal Chem 1914;53:242-5.
41. Weicheselbaum TE. An accurate and rapid method for determination of proteins in small amounts of blood serum and
plasma. Am J Clin Path 1946;16:40-9.
42. Doumas BT, et al. A candidate reference method for determination of total protein in serum. I. Development and
validation. Clin Chem 1981;27:1642-50.
43. Sampson, EJ MA Baird, CA Burtis, EM Smith, DL Witte, and DD Bayse. A coupled-enzyme equilibrium method
for measuring urea in serum: optimization and evaluation of the AACC study group on urea candidate reference
method. Clin Chem 1980;26: 816-826. 44. National Committee for Clinical Laboratory Standards (NCCLS). Procedures for Handling and Processing of Blood
Specimens; tentative standard. NCCLS document H18-A2. Wayne, PA: NCCLS, 1999. 45. Overfield CV, Savory J, and Heintges MG. Glycosis: a re-evealuation of the effect on blood glucose.
Clin Chim Acta 1972;39:35-40.
46. Rehak NN and Chiang BT. Storage of whole blood: effect of temperature on the measured concentration of
analytes in serum. Clin Chem 1988;34:2111-14.
47. Sherwin JE and Obernolte R. Bilirubin. In:LA Kaplan and AJ Pesce, eds. Clinical Chemistry: Theory, Analysis and
Correlation, 2nd ed. St. Louis: The C.V. Mosby Company; 1989;1009-1015.
48. Henry RJ, Canon DC and Winkelman. Clinical Chemistry Principles and Technics, 2nd
ed. New York: Harper and
Row; 1974;417-21; 127-8.
49. Scott MG, Electrolytes and Blood Gases. In: Burtis CA, Ashwood ER, eds. Tietz Textbook of Clinical Chemistry.
3rd
ed. Philadelphia: WB Saunders Company, 1999:617-721.
50. Witte DL, Brown LF, and RL Williams. Effects of bilirubin on detection of hydrogen peroxide by use of
peroxidase. Clin Chem 1978;24:1778-82.
51. Melnik J and Potter JL. Variance in capillary and venous glucose levels during glucose tolerance test. Am J Med
Tech 1982;48:543-5.
52. National Committee for Clinical Laboratory Standards (NCCLS). Evaluation of precision performance of clinical
chemistry devices; approved guideline NCCLS Document EP5-A. Wayne, PA: NCCLS, 1999. 53. National Committee for Clinical Laboratory Standards (NCCLS). Quality management for unit-use testing;
proposed guideline. NCCLS Document EP18-P. Wayne, PA: NCCLS, 1999.
Page 15 of 73
VetScan® Volldiagnostikprofil
Nur für den veterinärmedizinischen Einsatz
Kundenservice und technischer Support: 1-800-822-2947
Januar 2015
Art.-Nr: 500-7123 Rev: E © 2002, Abaxis, Inc., Union City, CA 94587 USA
1. Verwendungszweck
Die VetScan®-Volldiagnostikprofil-Reagenzdisk für das VetScan-Analysesystem verwendet Trocken- und Flüssigreagenzien
für die quantitative In-vitro-Bestimmung von Alaninaminotransferase (ALT), Albumin (ALB), alkalischer Phosphatase (ALP),
Amylase (AMY), Creatinin (CRE), Gesamtbilirubin (TBIL), Gesamtcalcium (CA++
), Gesamtprotein (TP), Globulin* (GLOB), Glucose (GLU), Harnstoffstickstoff (BUN), Kalium (K+), Natrium (Na+) und Phosphor (PHOS) in heparinisiertem Vollblut, heparinisiertem Plasma oder Serum.
* Berechneter Wert
2. Zusammenfassung und Erläuterung der Tests
Die VetScan-Volldiagnostikprofil-Reagenzdisk und das VetScan-Analysesystem stellen ein In-vitro-Diagnostiksystem dar, das
den Veterinär bei der Diagnose der folgenden Störungen unterstützt:
Alanin-Aminotransferase: Leberkrankungen, einschließlich Virushepatitis und Zirrhose;
Herzkrankheiten.
Albumin: Leber- und Nierenerkrankungen.
Alkaline Phosphatase: Leber-, Knochen-, Nebenschilddrüsen- und Darmerkrankungen.
Amylase: Nieren- und Pankreaserkrankungen.
Calcium: Nebenschilddrüsen-, Knochen- und chronische
Nierenerkrankungen; Tetanie.
Creatinin: Nierenerkrankungen. Globulin: Die Globulinkonzentration steigt bei Dehydration und sollte bei
Antigenstimulation ebenfalls steigen.
Glucose: Diabetes, Hyperglykämie, Hypoglykämie, und
Lebererkrankungen.
Phosphor: Nierenerkrankungen, Hypoparathyroidismus und
Ernährungsstörungen.
Potassium: Mangelernährung und Nierenerkankungen. Dieses Elektrolyt
wird zur Diagnose der Ursachen für Erbrechen, Diarrhoe, und
kardiologische Symptome verwendet.
Natrium: Dehydration, und Diabetes. Dieses Elektrolyt wird zur Diagnose
der Ursachen für Erbrechen, Diarrhoe und kardiologische
Symptome verwendet.
Gesamtbilirubin: Leberfunktionsstörungen
Gesamtprotein: Dehydratation, Nieren- und Lebererkrankungen, Stoffwechsel-
und Ernährungsstörungen.
Harnstoffstickstoff: Leber- und Nierenerkrankungen.
Wie bei allen diagnostischen Testverfahren sind vor der abschließenden Diagnose alle anderen Testverfahren,
einschließlich des klinischen Status des Patienten, in Betracht zu ziehen.

Page 16 of 73
3. Verfahrensprinzip
Alanin-Aminotransferase
Die für das VetScan-Analysesystem entwickelte Methode ist eine Abwandlung des Verfahrens nach Wróblewski und LaDue,
das von der International Federation of Clinical Chemistry (IFCC) empfohlen wird.1,2
Bei dieser Reaktion katalysiert ALT den Transfer einer Aminogruppe von L-Alanin zu α-Ketoglutarat und damit die Bildung von L-Glutamat und Pyruvat. Lactat-Dehydrogenase katalysiert die Umwandlung von Pyruvat zu Lactat. Gleichzeitig wird
NADH wie im folgenden Reaktionsschema dargestellt zu NAD+
oxidiert.
ALT
L-Alanin + α-Ketoglutarat L-Glutamat + Pyruvat
LDH
Pyruvat + NADH + H+
Lactat + NAD+
Die Extinktionsänderungsgeschwindigkeit zwischen 340 nm und 405 nm hängt mit der Umwandlung von NADH zu NAD+
zusammen und ist direkt proportional zur Menge des in der Probe vorhandenen ALT.
Albumin
Farbstoffbindungstechniken sind die am häufigsten gebrauchten Methoden zur Bestimmung von Albumin. Bei den
Farbstoffbindungsmethoden wird Bromkresolgrün (BCG) am häufigsten eingesetzt.3
Tenside
BCG + Albumin BCG-Albumin-Komplex
Säure-pH
Gebundenes Albumin verhält sich proportional zur Albuminkonzentration in der Probe. Es handelt sich hierbei um eine
Endpunktreaktion mit bichromatischer Bestimmung bei 630 nm und 405 nm.
Alkalische Phosphatase Das VetScan-Verfahren ist eine Abwandlung der von der American Association for Clinical Chemistry (AACC) und der IFCC
verwendeten Methoden.4
Alkalische Phosphatase hydrolysiert p-NPP in einem Metallionenpuffer und bildet p-Nitrophenol und
Phosphat. Die Verwendung von p-Nitrophenylphosphat (p-NPP) erhöht die Reaktionsgeschwindigkeit.5,6
Die Zuverlässigkeit dieses Verfahrens verbessert sich durch die Verwendung eines Metallionenpuffers zur Aufrechterhaltung der Konzentration der
Magnesium- und Zinkionen in der Reaktion erheblich.7
Die Referenzmethode der AACC verwendet p-NPP als Substrat und als
Metallionenpuffer.8
ALP
p-Nitrophenylphosphat + H2O p-Nitrophenol + Phosphat Zn
2+, Mg
2+
Die Menge an ALP in der Probe verhält sich proportional zur Anstiegsgeschwindigkeit der Extinktionsdifferenz zwischen 405
nm und 500 nm.
Amylase Häufig angewendete Methoden sind saccharogene und chromolytische Verfahren. Das „klassische“ Verfahren zur
Amylasemessung ist ein saccharogenes Verfahren, doch ist dies schwierig und zeitaufwendig.9
Chromolytische Verfahren mit
p-Nitrophenylglycosiden als Substrate wurden erst vor kurzem entwickelt.10
Diese Assays haben eine höhere Spezifität für
Pankreasamylase als für a-Amylase im Speichel und lassen sich leicht überwachen.11
Beim Abaxis-Verfahren reagiert das Trägermittel 2-Chlor-p-nitrophenyl-α-D-maltotriosid (CNPG3) mit α-Amylase in der
Patientenprobe, wobei 2-Chlor-p-nitrophenol (CNP) freigesetzt wird. Die Freisetzung von CNP bewirkt eine Farbänderung.
α-Amylase
CNPG3 CNP + D-Maltotriosid
Die Reaktion wird bichromatisch bei 405 nm und 500 nm gemessen. Die Extinktionsänderung aufgrund der Bildung von CNP
ist direkt proportional zur α-Amylaseaktivität der Probe.
Page 17 of 73
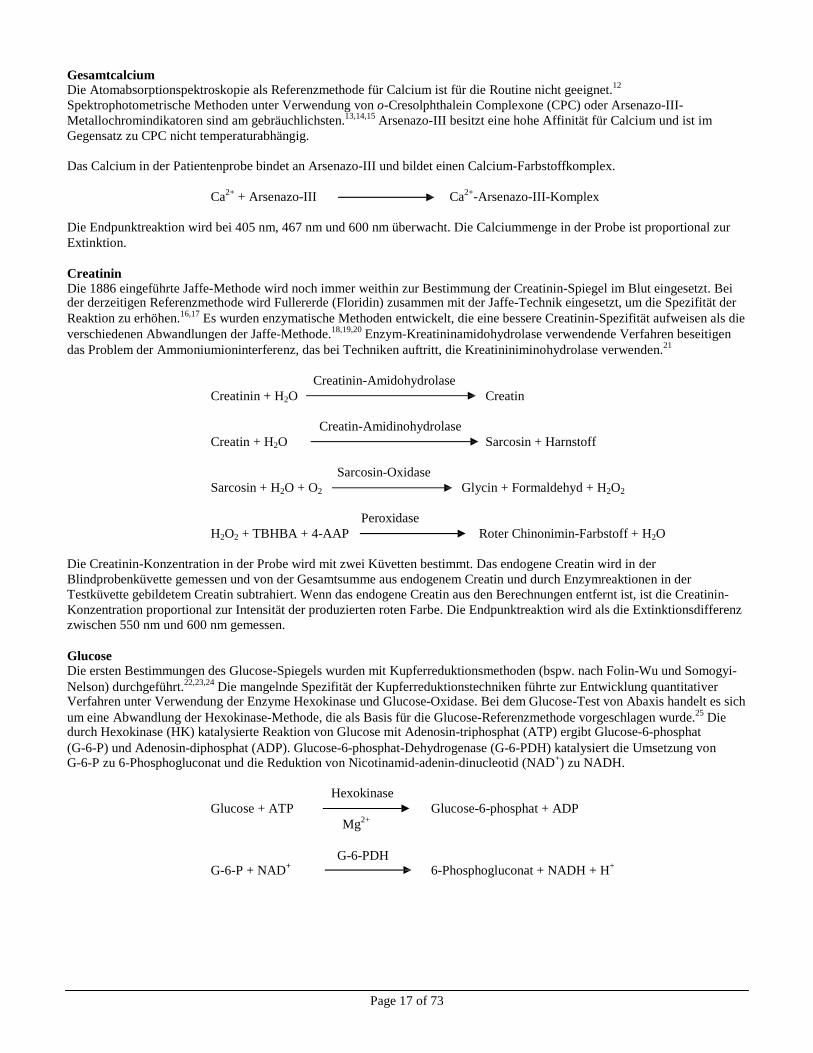
Gesamtcalcium
Die Atomabsorptionspektroskopie als Referenzmethode für Calcium ist für die Routine nicht geeignet.12
Spektrophotometrische Methoden unter Verwendung von o-Cresolphthalein Complexone (CPC) oder Arsenazo-III-
Metallochromindikatoren sind am gebräuchlichsten.13,14,15
Arsenazo-III besitzt eine hohe Affinität für Calcium und ist im
Gegensatz zu CPC nicht temperaturabhängig.
Das Calcium in der Patientenprobe bindet an Arsenazo-III und bildet einen Calcium-Farbstoffkomplex.
Ca
2+ + Arsenazo-III Ca
2+-Arsenazo-III-Komplex
Die Endpunktreaktion wird bei 405 nm, 467 nm und 600 nm überwacht. Die Calciummenge in der Probe ist proportional zur
Extinktion.
Creatinin Die 1886 eingeführte Jaffe-Methode wird noch immer weithin zur Bestimmung der Creatinin-Spiegel im Blut eingesetzt. Bei der derzeitigen Referenzmethode wird Fullererde (Floridin) zusammen mit der Jaffe-Technik eingesetzt, um die Spezifität der
Reaktion zu erhöhen.16,17
Es wurden enzymatische Methoden entwickelt, die eine bessere Creatinin-Spezifität aufweisen als die
verschiedenen Abwandlungen der Jaffe-Methode.18,19,20
Enzym-Kreatininamidohydrolase verwendende Verfahren beseitigen
das Problem der Ammoniumioninterferenz, das bei Techniken auftritt, die Kreatininiminohydrolase verwenden.21
Creatinin-Amidohydrolase
Creatinin + H2O Creatin
Creatin-Amidinohydrolase
Creatin + H2O Sarcosin + Harnstoff
Sarcosin-Oxidase
Sarcosin + H2O + O2 Glycin + Formaldehyd + H2O2
Peroxidase
H2O2 + TBHBA + 4-AAP Roter Chinonimin-Farbstoff + H2O
Die Creatinin-Konzentration in der Probe wird mit zwei Küvetten bestimmt. Das endogene Creatin wird in der
Blindprobenküvette gemessen und von der Gesamtsumme aus endogenem Creatin und durch Enzymreaktionen in der
Testküvette gebildetem Creatin subtrahiert. Wenn das endogene Creatin aus den Berechnungen entfernt ist, ist die Creatinin-
Konzentration proportional zur Intensität der produzierten roten Farbe. Die Endpunktreaktion wird als die Extinktionsdifferenz
zwischen 550 nm und 600 nm gemessen.
Glucose Die ersten Bestimmungen des Glucose-Spiegels wurden mit Kupferreduktionsmethoden (bspw. nach Folin-Wu und Somogyi-
Nelson) durchgeführt.22,23,24
Die mangelnde Spezifität der Kupferreduktionstechniken führte zur Entwicklung quantitativer Verfahren unter Verwendung der Enzyme Hexokinase und Glucose-Oxidase. Bei dem Glucose-Test von Abaxis handelt es sich
um eine Abwandlung der Hexokinase-Methode, die als Basis für die Glucose-Referenzmethode vorgeschlagen wurde.25
Die durch Hexokinase (HK) katalysierte Reaktion von Glucose mit Adenosin-triphosphat (ATP) ergibt Glucose-6-phosphat
(G-6-P) und Adenosin-diphosphat (ADP). Glucose-6-phosphat-Dehydrogenase (G-6-PDH) katalysiert die Umsetzung von
G-6-P zu 6-Phosphogluconat und die Reduktion von Nicotinamid-adenin-dinucleotid (NAD+) zu NADH.
Hexokinase
Glucose + ATP Glucose-6-phosphat + ADP
Mg2+
G-6-PDH
G-6-P + NAD+
6-Phosphogluconat + NADH + H+
Page 18 of 73
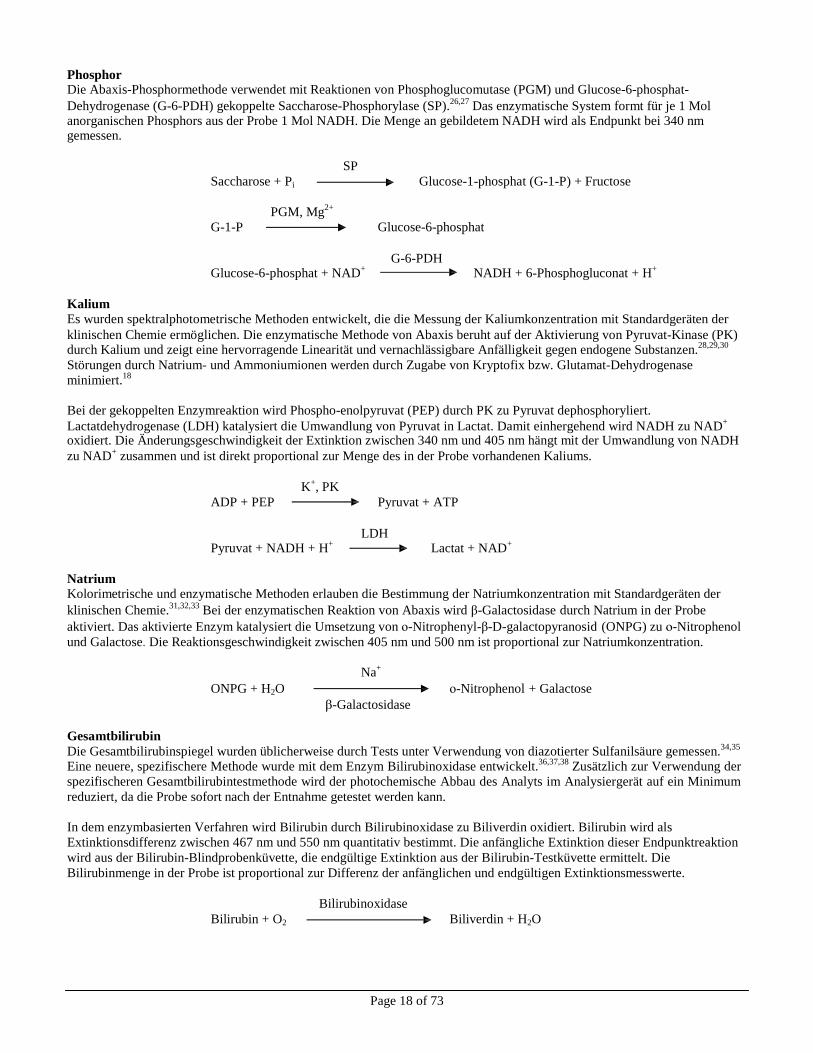
Phosphor Die Abaxis-Phosphormethode verwendet mit Reaktionen von Phosphoglucomutase (PGM) und Glucose-6-phosphat-
Dehydrogenase (G-6-PDH) gekoppelte Saccharose-Phosphorylase (SP).26,27
Das enzymatische System formt für je 1 Mol anorganischen Phosphors aus der Probe 1 Mol NADH. Die Menge an gebildetem NADH wird als Endpunkt bei 340 nm gemessen.
SP
Saccharose + Pi Glucose-1-phosphat (G-1-P) + Fructose
PGM, Mg2+
G-1-P Glucose-6-phosphat
G-6-PDH
Glucose-6-phosphat + NAD+
NADH + 6-Phosphogluconat + H+
Kalium Es wurden spektralphotometrische Methoden entwickelt, die die Messung der Kaliumkonzentration mit Standardgeräten der
klinischen Chemie ermöglichen. Die enzymatische Methode von Abaxis beruht auf der Aktivierung von Pyruvat-Kinase (PK)
durch Kalium und zeigt eine hervorragende Linearität und vernachlässigbare Anfälligkeit gegen endogene Substanzen.28,29,30
Störungen durch Natrium- und Ammoniumionen werden durch Zugabe von Kryptofix bzw. Glutamat-Dehydrogenase
minimiert.18
Bei der gekoppelten Enzymreaktion wird Phospho-enolpyruvat (PEP) durch PK zu Pyruvat dephosphoryliert.
Lactatdehydrogenase (LDH) katalysiert die Umwandlung von Pyruvat in Lactat. Damit einhergehend wird NADH zu NAD+
oxidiert. Die Änderungsgeschwindigkeit der Extinktion zwischen 340 nm und 405 nm hängt mit der Umwandlung von NADH
zu NAD+
zusammen und ist direkt proportional zur Menge des in der Probe vorhandenen Kaliums.
K+, PK
ADP + PEP Pyruvat + ATP
LDH
Pyruvat + NADH + H+
Lactat + NAD+
Natrium Kolorimetrische und enzymatische Methoden erlauben die Bestimmung der Natriumkonzentration mit Standardgeräten der
klinischen Chemie.31,32,33
Bei der enzymatischen Reaktion von Abaxis wird β-Galactosidase durch Natrium in der Probe
aktiviert. Das aktivierte Enzym katalysiert die Umsetzung von ο-Nitrophenyl-β-D-galactopyranosid (ONPG) zu ο-Nitrophenol
und Galactose. Die Reaktionsgeschwindigkeit zwischen 405 nm und 500 nm ist proportional zur Natriumkonzentration.
Na+
ONPG + H2O ο-Nitrophenol + Galactose
β-Galactosidase
Gesamtbilirubin
Die Gesamtbilirubinspiegel wurden üblicherweise durch Tests unter Verwendung von diazotierter Sulfanilsäure gemessen.34,35
Eine neuere, spezifischere Methode wurde mit dem Enzym Bilirubinoxidase entwickelt.36,37,38
Zusätzlich zur Verwendung der
spezifischeren Gesamtbilirubintestmethode wird der photochemische Abbau des Analyts im Analysiergerät auf ein Minimum
reduziert, da die Probe sofort nach der Entnahme getestet werden kann.
In dem enzymbasierten Verfahren wird Bilirubin durch Bilirubinoxidase zu Biliverdin oxidiert. Bilirubin wird als
Extinktionsdifferenz zwischen 467 nm und 550 nm quantitativ bestimmt. Die anfängliche Extinktion dieser Endpunktreaktion
wird aus der Bilirubin-Blindprobenküvette, die endgültige Extinktion aus der Bilirubin-Testküvette ermittelt. Die
Bilirubinmenge in der Probe ist proportional zur Differenz der anfänglichen und endgültigen Extinktionsmesswerte.
Bilirubinoxidase
Bilirubin + O2 Biliverdin + H2O
Page 19 of 73
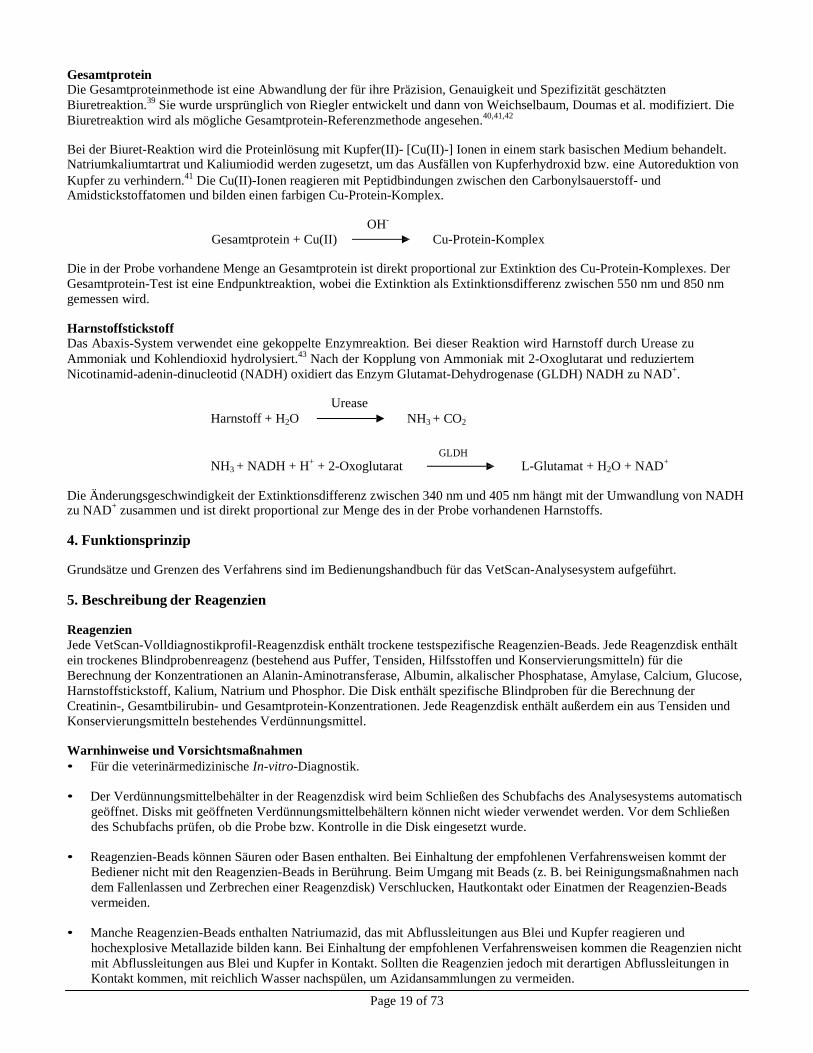
Gesamtprotein Die Gesamtproteinmethode ist eine Abwandlung der für ihre Präzision, Genauigkeit und Spezifizität geschätzten
Biuretreaktion.39
Sie wurde ursprünglich von Riegler entwickelt und dann von Weichselbaum, Doumas et al. modifiziert. Die
Biuretreaktion wird als mögliche Gesamtprotein-Referenzmethode angesehen.40,41,42
Bei der Biuret-Reaktion wird die Proteinlösung mit Kupfer(II)- [Cu(II)-] Ionen in einem stark basischen Medium behandelt. Natriumkaliumtartrat und Kaliumiodid werden zugesetzt, um das Ausfällen von Kupferhydroxid bzw. eine Autoreduktion von
Kupfer zu verhindern.41
Die Cu(II)-Ionen reagieren mit Peptidbindungen zwischen den Carbonylsauerstoff- und Amidstickstoffatomen und bilden einen farbigen Cu-Protein-Komplex.
OH-
Gesamtprotein + Cu(II) Cu-Protein-Komplex
Die in der Probe vorhandene Menge an Gesamtprotein ist direkt proportional zur Extinktion des Cu-Protein-Komplexes. Der
Gesamtprotein-Test ist eine Endpunktreaktion, wobei die Extinktion als Extinktionsdifferenz zwischen 550 nm und 850 nm
gemessen wird.
Harnstoffstickstoff Das Abaxis-System verwendet eine gekoppelte Enzymreaktion. Bei dieser Reaktion wird Harnstoff durch Urease zu
Ammoniak und Kohlendioxid hydrolysiert.43
Nach der Kopplung von Ammoniak mit 2-Oxoglutarat und reduziertem
Nicotinamid-adenin-dinucleotid (NADH) oxidiert das Enzym Glutamat-Dehydrogenase (GLDH) NADH zu NAD+.
Urease
Harnstoff + H2O NH3 + CO2
GLDH
NH3 + NADH + H+
+ 2-Oxoglutarat L-Glutamat + H2O + NAD+
Die Änderungsgeschwindigkeit der Extinktionsdifferenz zwischen 340 nm und 405 nm hängt mit der Umwandlung von NADH
zu NAD+
zusammen und ist direkt proportional zur Menge des in der Probe vorhandenen Harnstoffs.
4. Funktionsprinzip
Grundsätze und Grenzen des Verfahrens sind im Bedienungshandbuch für das VetScan-Analysesystem aufgeführt.
5. Beschreibung der Reagenzien
Reagenzien
Jede VetScan-Volldiagnostikprofil-Reagenzdisk enthält trockene testspezifische Reagenzien-Beads. Jede Reagenzdisk enthält
ein trockenes Blindprobenreagenz (bestehend aus Puffer, Tensiden, Hilfsstoffen und Konservierungsmitteln) für die
Berechnung der Konzentrationen an Alanin-Aminotransferase, Albumin, alkalischer Phosphatase, Amylase, Calcium, Glucose,
Harnstoffstickstoff, Kalium, Natrium und Phosphor. Die Disk enthält spezifische Blindproben für die Berechnung der
Creatinin-, Gesamtbilirubin- und Gesamtprotein-Konzentrationen. Jede Reagenzdisk enthält außerdem ein aus Tensiden und
Konservierungsmitteln bestehendes Verdünnungsmittel.
Warnhinweise und Vorsichtsmaßnahmen
• Für die veterinärmedizinische In-vitro-Diagnostik.
• Der Verdünnungsmittelbehälter in der Reagenzdisk wird beim Schließen des Schubfachs des Analysesystems automatisch
geöffnet. Disks mit geöffneten Verdünnungsmittelbehältern können nicht wieder verwendet werden. Vor dem Schließen
des Schubfachs prüfen, ob die Probe bzw. Kontrolle in die Disk eingesetzt wurde.
• Reagenzien-Beads können Säuren oder Basen enthalten. Bei Einhaltung der empfohlenen Verfahrensweisen kommt der
Bediener nicht mit den Reagenzien-Beads in Berührung. Beim Umgang mit Beads (z. B. bei Reinigungsmaßnahmen nach
dem Fallenlassen und Zerbrechen einer Reagenzdisk) Verschlucken, Hautkontakt oder Einatmen der Reagenzien-Beads
vermeiden.
• Manche Reagenzien-Beads enthalten Natriumazid, das mit Abflussleitungen aus Blei und Kupfer reagieren und
hochexplosive Metallazide bilden kann. Bei Einhaltung der empfohlenen Verfahrensweisen kommen die Reagenzien nicht
mit Abflussleitungen aus Blei und Kupfer in Kontakt. Sollten die Reagenzien jedoch mit derartigen Abflussleitungen in
Kontakt kommen, mit reichlich Wasser nachspülen, um Azidansammlungen zu vermeiden.
Page 20 of 73
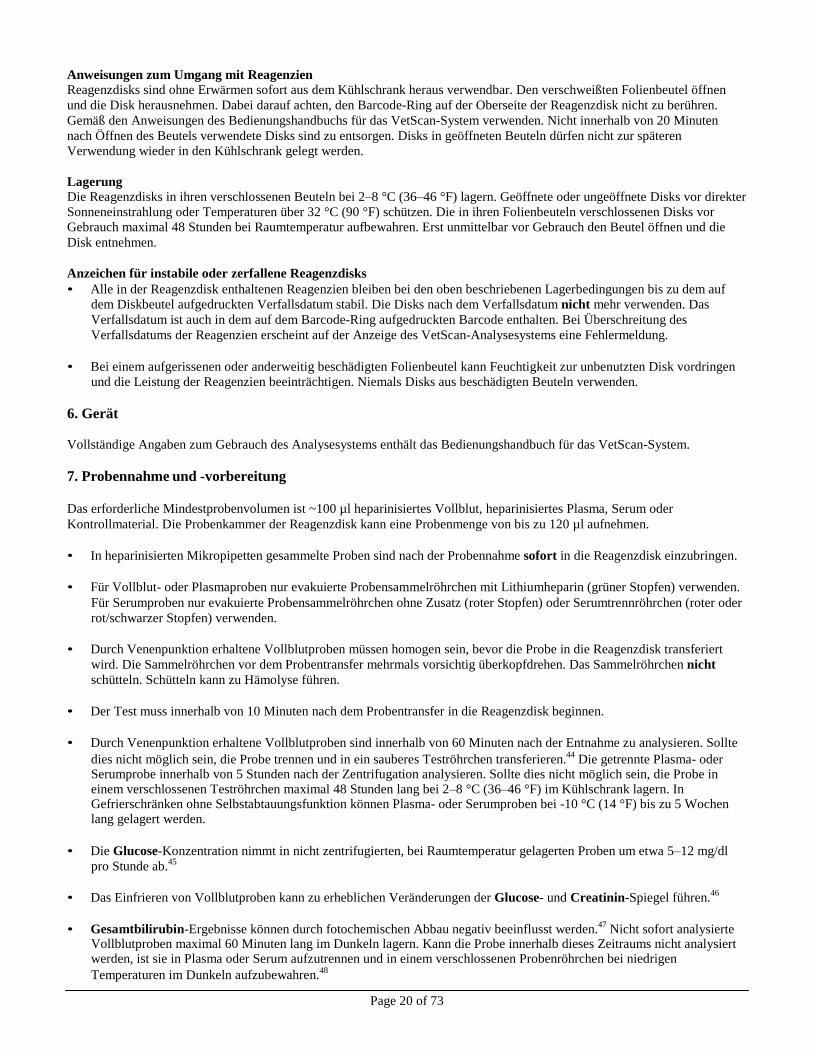
Anweisungen zum Umgang mit Reagenzien Reagenzdisks sind ohne Erwärmen sofort aus dem Kühlschrank heraus verwendbar. Den verschweißten Folienbeutel öffnen
und die Disk herausnehmen. Dabei darauf achten, den Barcode-Ring auf der Oberseite der Reagenzdisk nicht zu berühren.
Gemäß den Anweisungen des Bedienungshandbuchs für das VetScan-System verwenden. Nicht innerhalb von 20 Minuten
nach Öffnen des Beutels verwendete Disks sind zu entsorgen. Disks in geöffneten Beuteln dürfen nicht zur späteren
Verwendung wieder in den Kühlschrank gelegt werden.
Lagerung Die Reagenzdisks in ihren verschlossenen Beuteln bei 2–8 °C (36–46 °F) lagern. Geöffnete oder ungeöffnete Disks vor direkter
Sonneneinstrahlung oder Temperaturen über 32 °C (90 °F) schützen. Die in ihren Folienbeuteln verschlossenen Disks vor
Gebrauch maximal 48 Stunden bei Raumtemperatur aufbewahren. Erst unmittelbar vor Gebrauch den Beutel öffnen und die
Disk entnehmen.
Anzeichen für instabile oder zerfallene Reagenzdisks
• Alle in der Reagenzdisk enthaltenen Reagenzien bleiben bei den oben beschriebenen Lagerbedingungen bis zu dem auf
dem Diskbeutel aufgedruckten Verfallsdatum stabil. Die Disks nach dem Verfallsdatum nicht mehr verwenden. Das
Verfallsdatum ist auch in dem auf dem Barcode-Ring aufgedruckten Barcode enthalten. Bei Überschreitung des
Verfallsdatums der Reagenzien erscheint auf der Anzeige des VetScan-Analysesystems eine Fehlermeldung.
• Bei einem aufgerissenen oder anderweitig beschädigten Folienbeutel kann Feuchtigkeit zur unbenutzten Disk vordringen
und die Leistung der Reagenzien beeinträchtigen. Niemals Disks aus beschädigten Beuteln verwenden.
6. Gerät
Vollständige Angaben zum Gebrauch des Analysesystems enthält das Bedienungshandbuch für das VetScan-System.
7. Probennahme und -vorbereitung
Das erforderliche Mindestprobenvolumen ist ~100 µl heparinisiertes Vollblut, heparinisiertes Plasma, Serum oder
Kontrollmaterial. Die Probenkammer der Reagenzdisk kann eine Probenmenge von bis zu 120 µl aufnehmen.
• In heparinisierten Mikropipetten gesammelte Proben sind nach der Probennahme sofort in die Reagenzdisk einzubringen.
• Für Vollblut- oder Plasmaproben nur evakuierte Probensammelröhrchen mit Lithiumheparin (grüner Stopfen) verwenden.
Für Serumproben nur evakuierte Probensammelröhrchen ohne Zusatz (roter Stopfen) oder Serumtrennröhrchen (roter oder
rot/schwarzer Stopfen) verwenden.
• Durch Venenpunktion erhaltene Vollblutproben müssen homogen sein, bevor die Probe in die Reagenzdisk transferiert
wird. Die Sammelröhrchen vor dem Probentransfer mehrmals vorsichtig überkopfdrehen. Das Sammelröhrchen nicht
schütteln. Schütteln kann zu Hämolyse führen.
• Der Test muss innerhalb von 10 Minuten nach dem Probentransfer in die Reagenzdisk beginnen.
• Durch Venenpunktion erhaltene Vollblutproben sind innerhalb von 60 Minuten nach der Entnahme zu analysieren. Sollte
dies nicht möglich sein, die Probe trennen und in ein sauberes Teströhrchen transferieren.44
Die getrennte Plasma- oder Serumprobe innerhalb von 5 Stunden nach der Zentrifugation analysieren. Sollte dies nicht möglich sein, die Probe in einem verschlossenen Teströhrchen maximal 48 Stunden lang bei 2–8 °C (36–46 °F) im Kühlschrank lagern. In Gefrierschränken ohne Selbstabtauungsfunktion können Plasma- oder Serumproben bei -10 °C (14 °F) bis zu 5 Wochen lang gelagert werden.
• Die Glucose-Konzentration nimmt in nicht zentrifugierten, bei Raumtemperatur gelagerten Proben um etwa 5–12 mg/dl
pro Stunde ab.45
• Das Einfrieren von Vollblutproben kann zu erheblichen Veränderungen der Glucose- und Creatinin-Spiegel führen.
46
• Gesamtbilirubin-Ergebnisse können durch fotochemischen Abbau negativ beeinflusst werden.
47 Nicht sofort analysierte
Vollblutproben maximal 60 Minuten lang im Dunkeln lagern. Kann die Probe innerhalb dieses Zeitraums nicht analysiert werden, ist sie in Plasma oder Serum aufzutrennen und in einem verschlossenen Probenröhrchen bei niedrigen
Temperaturen im Dunkeln aufzubewahren.48
Page 21 of 73
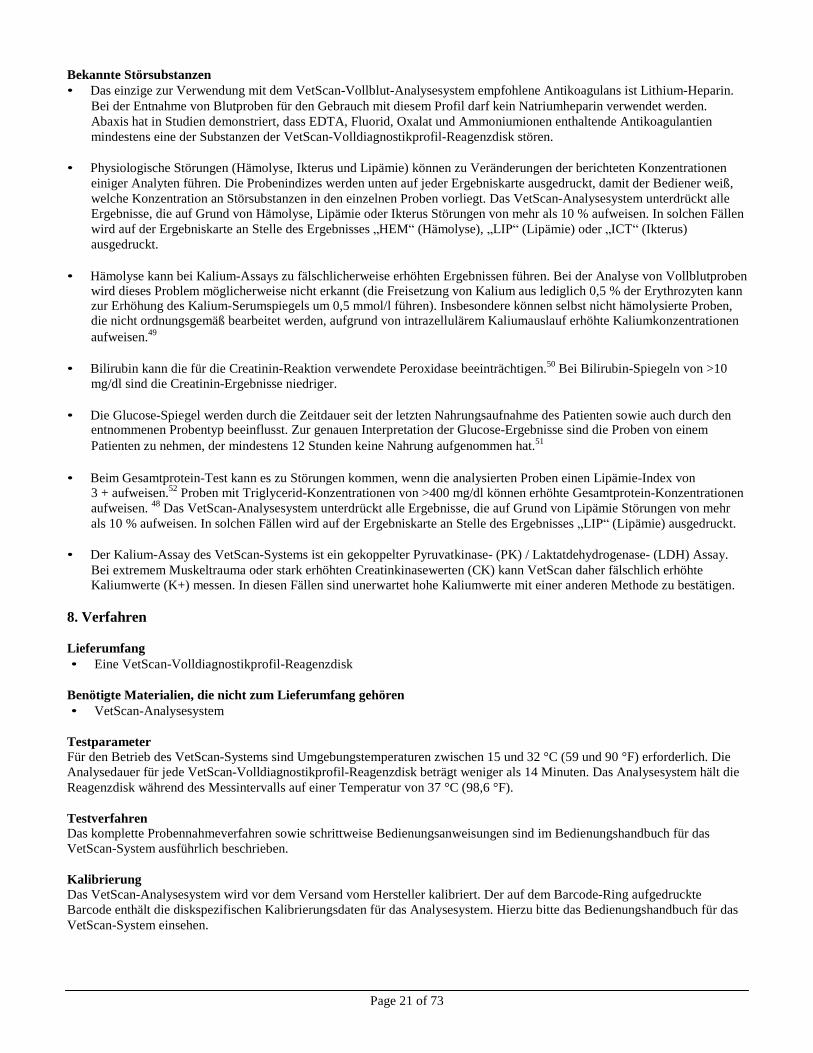
Bekannte Störsubstanzen
• Das einzige zur Verwendung mit dem VetScan-Vollblut-Analysesystem empfohlene Antikoagulans ist Lithium-Heparin.
Bei der Entnahme von Blutproben für den Gebrauch mit diesem Profil darf kein Natriumheparin verwendet werden.
Abaxis hat in Studien demonstriert, dass EDTA, Fluorid, Oxalat und Ammoniumionen enthaltende Antikoagulantien
mindestens eine der Substanzen der VetScan-Volldiagnostikprofil-Reagenzdisk stören.
• Physiologische Störungen (Hämolyse, Ikterus und Lipämie) können zu Veränderungen der berichteten Konzentrationen
einiger Analyten führen. Die Probenindizes werden unten auf jeder Ergebniskarte ausgedruckt, damit der Bediener weiß,
welche Konzentration an Störsubstanzen in den einzelnen Proben vorliegt. Das VetScan-Analysesystem unterdrückt alle
Ergebnisse, die auf Grund von Hämolyse, Lipämie oder Ikterus Störungen von mehr als 10 % aufweisen. In solchen Fällen
wird auf der Ergebniskarte an Stelle des Ergebnisses „HEM“ (Hämolyse), „LIP“ (Lipämie) oder „ICT“ (Ikterus)
ausgedruckt.
• Hämolyse kann bei Kalium-Assays zu fälschlicherweise erhöhten Ergebnissen führen. Bei der Analyse von Vollblutproben
wird dieses Problem möglicherweise nicht erkannt (die Freisetzung von Kalium aus lediglich 0,5 % der Erythrozyten kann zur Erhöhung des Kalium-Serumspiegels um 0,5 mmol/l führen). Insbesondere können selbst nicht hämolysierte Proben, die nicht ordnungsgemäß bearbeitet werden, aufgrund von intrazellulärem Kaliumauslauf erhöhte Kaliumkonzentrationen
aufweisen.49
• Bilirubin kann die für die Creatinin-Reaktion verwendete Peroxidase beeinträchtigen.
50 Bei Bilirubin-Spiegeln von >10
mg/dl sind die Creatinin-Ergebnisse niedriger.
• Die Glucose-Spiegel werden durch die Zeitdauer seit der letzten Nahrungsaufnahme des Patienten sowie auch durch den
entnommenen Probentyp beeinflusst. Zur genauen Interpretation der Glucose-Ergebnisse sind die Proben von einem
Patienten zu nehmen, der mindestens 12 Stunden keine Nahrung aufgenommen hat.51
• Beim Gesamtprotein-Test kann es zu Störungen kommen, wenn die analysierten Proben einen Lipämie-Index von
3 + aufweisen.52
Proben mit Triglycerid-Konzentrationen von >400 mg/dl können erhöhte Gesamtprotein-Konzentrationen
aufweisen. 48
Das VetScan-Analysesystem unterdrückt alle Ergebnisse, die auf Grund von Lipämie Störungen von mehr
als 10 % aufweisen. In solchen Fällen wird auf der Ergebniskarte an Stelle des Ergebnisses „LIP“ (Lipämie) ausgedruckt.
• Der Kalium-Assay des VetScan-Systems ist ein gekoppelter Pyruvatkinase- (PK) / Laktatdehydrogenase- (LDH) Assay.
Bei extremem Muskeltrauma oder stark erhöhten Creatinkinasewerten (CK) kann VetScan daher fälschlich erhöhte Kaliumwerte (K+) messen. In diesen Fällen sind unerwartet hohe Kaliumwerte mit einer anderen Methode zu bestätigen.
8. Verfahren
Lieferumfang
• Eine VetScan-Volldiagnostikprofil-Reagenzdisk
Benötigte Materialien, die nicht zum Lieferumfang gehören
• VetScan-Analysesystem
Testparameter Für den Betrieb des VetScan-Systems sind Umgebungstemperaturen zwischen 15 und 32 °C (59 und 90 °F) erforderlich. Die
Analysedauer für jede VetScan-Volldiagnostikprofil-Reagenzdisk beträgt weniger als 14 Minuten. Das Analysesystem hält die
Reagenzdisk während des Messintervalls auf einer Temperatur von 37 °C (98,6 °F).
Testverfahren Das komplette Probennahmeverfahren sowie schrittweise Bedienungsanweisungen sind im Bedienungshandbuch für das
VetScan-System ausführlich beschrieben.
Kalibrierung Das VetScan-Analysesystem wird vor dem Versand vom Hersteller kalibriert. Der auf dem Barcode-Ring aufgedruckte
Barcode enthält die diskspezifischen Kalibrierungsdaten für das Analysesystem. Hierzu bitte das Bedienungshandbuch für das
VetScan-System einsehen.
Page 22 of 73
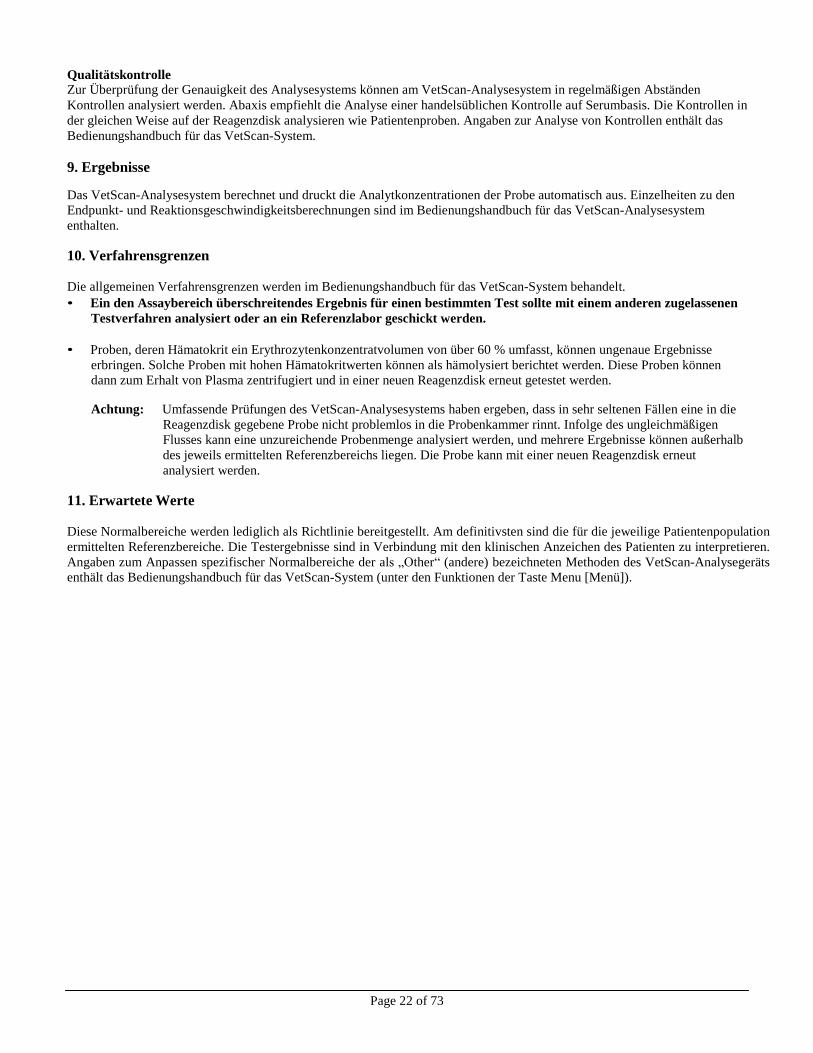
Qualitätskontrolle Zur Überprüfung der Genauigkeit des Analysesystems können am VetScan-Analysesystem in regelmäßigen Abständen
Kontrollen analysiert werden. Abaxis empfiehlt die Analyse einer handelsüblichen Kontrolle auf Serumbasis. Die Kontrollen in
der gleichen Weise auf der Reagenzdisk analysieren wie Patientenproben. Angaben zur Analyse von Kontrollen enthält das
Bedienungshandbuch für das VetScan-System.
9. Ergebnisse
Das VetScan-Analysesystem berechnet und druckt die Analytkonzentrationen der Probe automatisch aus. Einzelheiten zu den
Endpunkt- und Reaktionsgeschwindigkeitsberechnungen sind im Bedienungshandbuch für das VetScan-Analysesystem
enthalten.
10. Verfahrensgrenzen
Die allgemeinen Verfahrensgrenzen werden im Bedienungshandbuch für das VetScan-System behandelt.
• Ein den Assaybereich überschreitendes Ergebnis für einen bestimmten Test sollte mit einem anderen zugelassenen
Testverfahren analysiert oder an ein Referenzlabor geschickt werden.
• Proben, deren Hämatokrit ein Erythrozytenkonzentratvolumen von über 60 % umfasst, können ungenaue Ergebnisse
erbringen. Solche Proben mit hohen Hämatokritwerten können als hämolysiert berichtet werden. Diese Proben können
dann zum Erhalt von Plasma zentrifugiert und in einer neuen Reagenzdisk erneut getestet werden.
Achtung: Umfassende Prüfungen des VetScan-Analysesystems haben ergeben, dass in sehr seltenen Fällen eine in die
Reagenzdisk gegebene Probe nicht problemlos in die Probenkammer rinnt. Infolge des ungleichmäßigen
Flusses kann eine unzureichende Probenmenge analysiert werden, und mehrere Ergebnisse können außerhalb
des jeweils ermittelten Referenzbereichs liegen. Die Probe kann mit einer neuen Reagenzdisk erneut
analysiert werden.
11. Erwartete Werte
Diese Normalbereiche werden lediglich als Richtlinie bereitgestellt. Am definitivsten sind die für die jeweilige Patientenpopulation
ermittelten Referenzbereiche. Die Testergebnisse sind in Verbindung mit den klinischen Anzeichen des Patienten zu interpretieren.
Angaben zum Anpassen spezifischer Normalbereiche der als „Other“ (andere) bezeichneten Methoden des VetScan-Analysegeräts
enthält das Bedienungshandbuch für das VetScan-System (unter den Funktionen der Taste Menu [Menü]).
Page 23 of 73
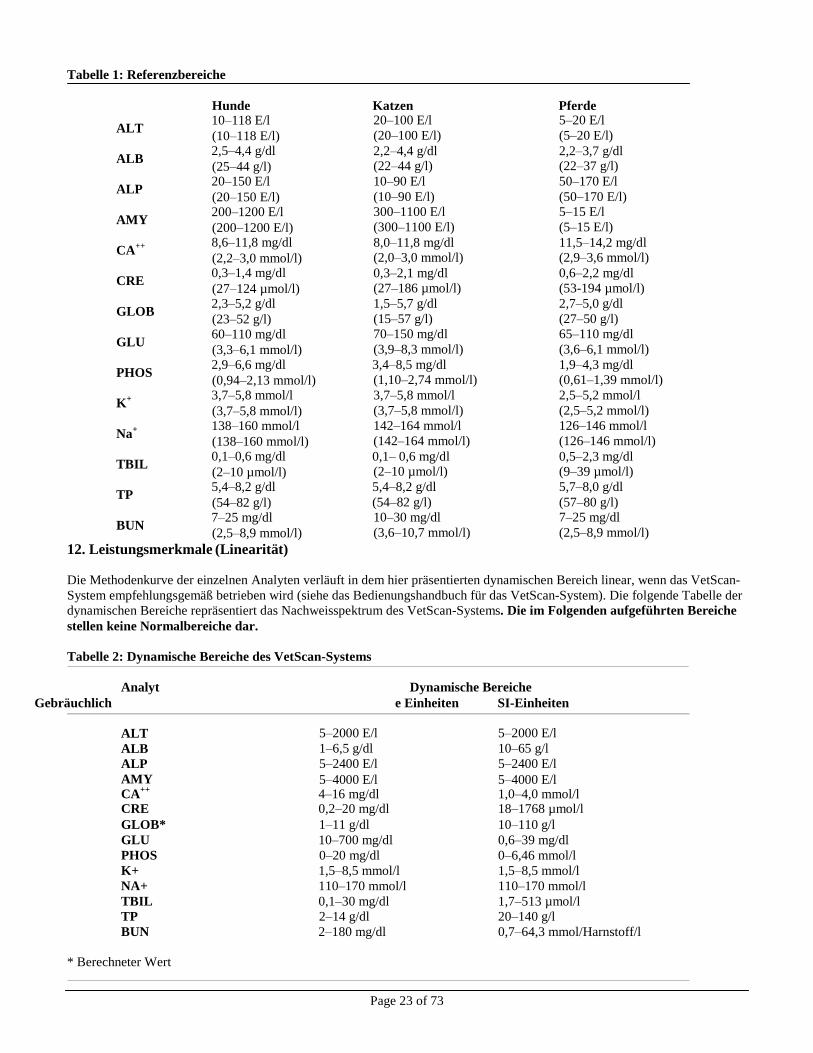
Tabelle 1: Referenzbereiche
Hunde Katzen Pferde
ALT 10–118 E/l (10–118 E/l)
ALB 2,5–4,4 g/dl (25–44 g/l)
ALP 20–150 E/l (20–150 E/l)
AMY 200–1200 E/l (200–1200 E/l)
CA++ 8,6–11,8 mg/dl
(2,2–3,0 mmol/l)
CRE 0,3–1,4 mg/dl (27–124 µmol/l)
GLOB 2,3–5,2 g/dl (23–52 g/l)
GLU 60–110 mg/dl (3,3–6,1 mmol/l)
PHOS 2,9–6,6 mg/dl (0,94–2,13 mmol/l)
K+ 3,7–5,8 mmol/l
(3,7–5,8 mmol/l)
Na+ 138–160 mmol/l
(138–160 mmol/l)
TBIL 0,1–0,6 mg/dl (2–10 µmol/l)
TP 5,4–8,2 g/dl (54–82 g/l)
BUN 7–25 mg/dl (2,5–8,9 mmol/l)
12. Leistungsmerkmale (Linearität)
20–100 E/l
(20–100 E/l)
2,2–4,4 g/dl (22–44 g/l)
10–90 E/l
(10–90 E/l) 300–1100 E/l
(300–1100 E/l)
8,0–11,8 mg/dl (2,0–3,0 mmol/l)
0,3–2,1 mg/dl
(27–186 µmol/l)
1,5–5,7 g/dl
(15–57 g/l)
70–150 mg/dl
(3,9–8,3 mmol/l)
3,4–8,5 mg/dl
(1,10–2,74 mmol/l)
3,7–5,8 mmol/l
(3,7–5,8 mmol/l)
142–164 mmol/l
(142–164 mmol/l)
0,1– 0,6 mg/dl (2–10 µmol/l)
5,4–8,2 g/dl
(54–82 g/l) 10–30 mg/dl
(3,6–10,7 mmol/l)
5–20 E/l
(5–20 E/l)
2,2–3,7 g/dl (22–37 g/l)
50–170 E/l
(50–170 E/l) 5–15 E/l
(5–15 E/l)
11,5–14,2 mg/dl (2,9–3,6 mmol/l)
0,6–2,2 mg/dl
(53-194 µmol/l)
2,7–5,0 g/dl
(27–50 g/l)
65–110 mg/dl
(3,6–6,1 mmol/l)
1,9–4,3 mg/dl
(0,61–1,39 mmol/l)
2,5–5,2 mmol/l
(2,5–5,2 mmol/l)
126–146 mmol/l
(126–146 mmol/l)
0,5–2,3 mg/dl (9–39 µmol/l)
5,7–8,0 g/dl
(57–80 g/l) 7–25 mg/dl
(2,5–8,9 mmol/l)
Die Methodenkurve der einzelnen Analyten verläuft in dem hier präsentierten dynamischen Bereich linear, wenn das VetScan-
System empfehlungsgemäß betrieben wird (siehe das Bedienungshandbuch für das VetScan-System). Die folgende Tabelle der
dynamischen Bereiche repräsentiert das Nachweisspektrum des VetScan-Systems. Die im Folgenden aufgeführten Bereiche
stellen keine Normalbereiche dar.
Tabelle 2: Dynamische Bereiche des VetScan-Systems
Analyt Dynamische Bereiche
Gebräuchlich e Einheiten SI-Einheiten
ALT
ALB
ALP
AMY
5–2000 E/l
1–6,5 g/dl
5–2400 E/l
5–4000 E/l
5–2000 E/l
10–65 g/l
5–2400 E/l
5–4000 E/l CA
++ 4–16 mg/dl 1,0–4,0 mmol/l
CRE 0,2–20 mg/dl 18–1768 µmol/l
GLOB* 1–11 g/dl 10–110 g/l
GLU 10–700 mg/dl 0,6–39 mg/dl
PHOS 0–20 mg/dl 0–6,46 mmol/l
K+ 1,5–8,5 mmol/l 1,5–8,5 mmol/l
NA+ 110–170 mmol/l 110–170 mmol/l
TBIL 0,1–30 mg/dl 1,7–513 µmol/l
TP 2–14 g/dl 20–140 g/l
BUN 2–180 mg/dl 0,7–64,3 mmol/Harnstoff/l
* Berechneter Wert
Page 24 of 73
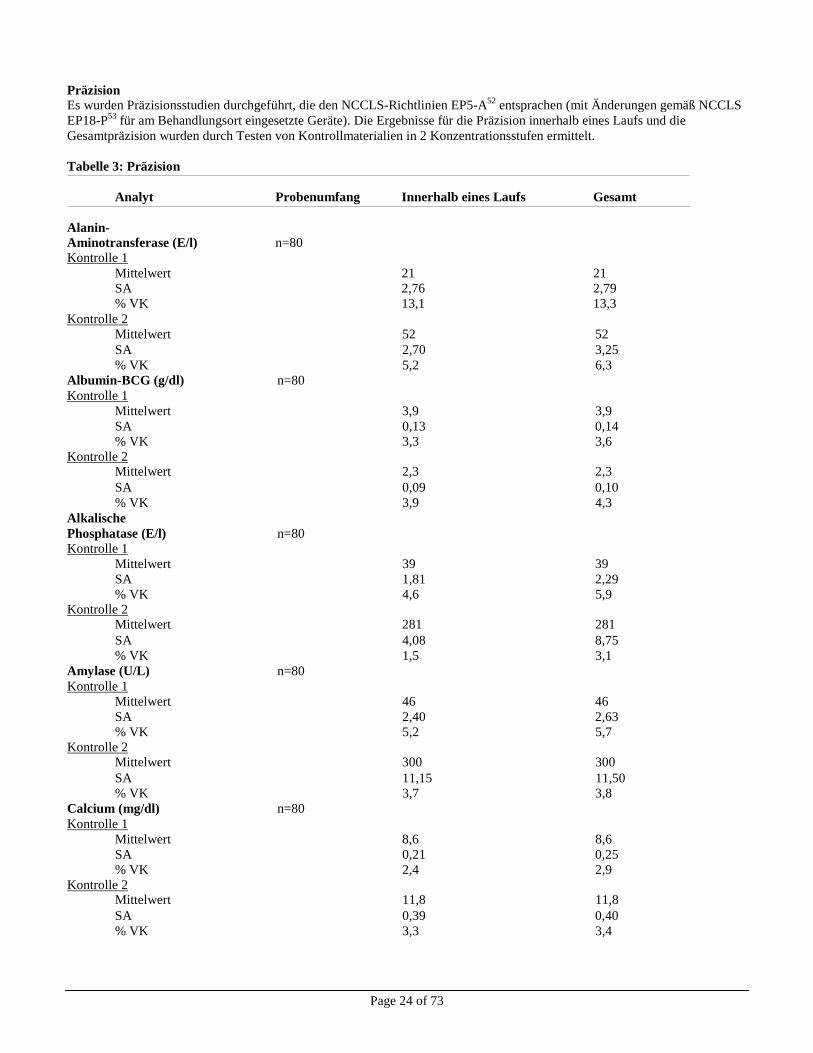
Präzision
Es wurden Präzisionsstudien durchgeführt, die den NCCLS-Richtlinien EP5-A52
entsprachen (mit Änderungen gemäß NCCLS
EP18-P53
für am Behandlungsort eingesetzte Geräte). Die Ergebnisse für die Präzision innerhalb eines Laufs und die
Gesamtpräzision wurden durch Testen von Kontrollmaterialien in 2 Konzentrationsstufen ermittelt.
Tabelle 3: Präzision
Analyt Probenumfang Innerhalb eines Laufs Gesamt
Alanin- Aminotransferase (E/l) n=80 Kontrolle 1
Mittelwert 21 21
SA 2,76 2,79
% VK 13,1 13,3
Kontrolle 2
Mittelwert 52 52
SA 2,70 3,25
% VK 5,2 6,3
Albumin-BCG (g/dl) n=80 Kontrolle 1
Mittelwert 3,9 3,9
SA 0,13 0,14
% VK 3,3 3,6
Kontrolle 2 Mittelwert 2,3 2,3
SA 0,09 0,10
% VK 3,9 4,3
Alkalische Phosphatase (E/l) n=80 Kontrolle 1
Mittelwert 39 39
SA 1,81 2,29
% VK 4,6 5,9 Kontrolle 2
Mittelwert 281 281
SA 4,08 8,75
% VK 1,5 3,1
Amylase (U/L) n=80 Kontrolle 1
Mittelwert 46 46
SA 2,40 2,63
% VK 5,2 5,7
Kontrolle 2 Mittelwert 300 300
SA 11,15 11,50
% VK 3,7 3,8
Calcium (mg/dl) n=80 Kontrolle 1
Mittelwert 8,6 8,6
SA 0,21 0,25
% VK 2,4 2,9
Kontrolle 2 Mittelwert 11,8 11,8
SA 0,39 0,40
% VK 3,3 3,4
Page 25 of 73
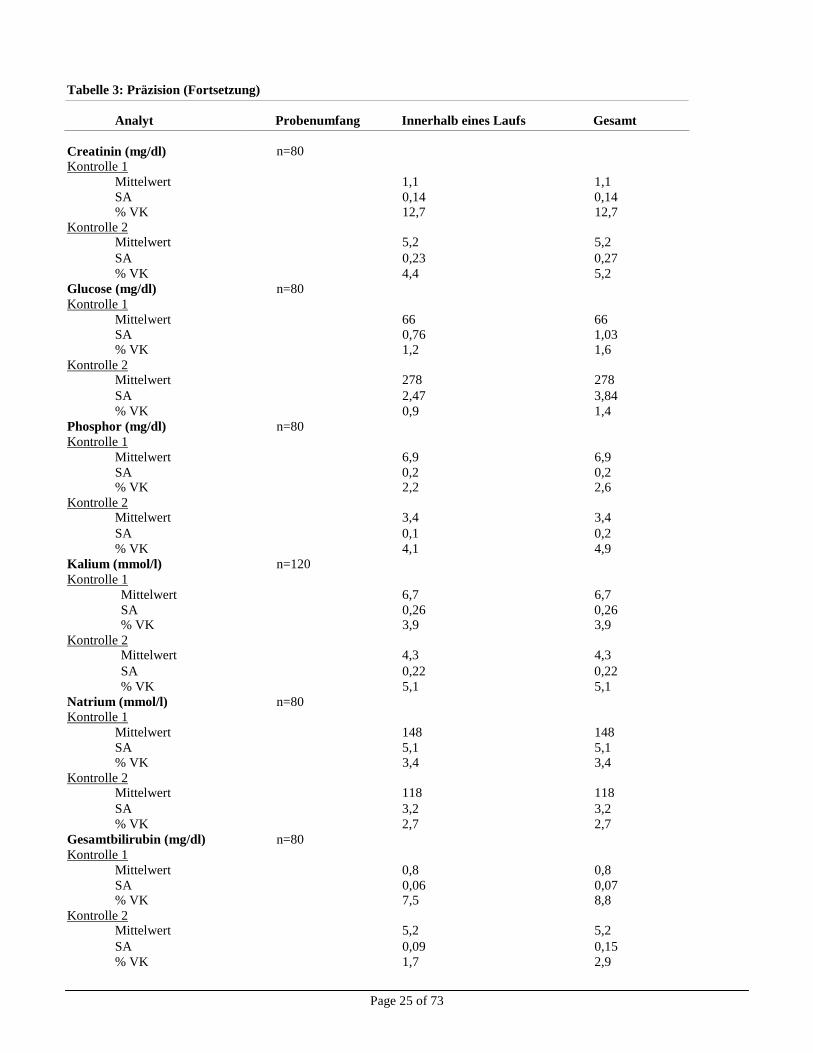
Tabelle 3: Präzision (Fortsetzung)
Analyt Probenumfang Innerhalb eines Laufs Gesamt
Creatinin (mg/dl)
n=80
Kontrolle 1 Mittelwert 1,1 1,1
SA 0,14 0,14 % VK 12,7 12,7
Kontrolle 2 Mittelwert 5,2 5,2
SA 0,23 0,27
% VK 4,4 5,2
Glucose (mg/dl) n=80 Kontrolle 1
Mittelwert 66 66
SA 0,76 1,03 % VK 1,2 1,6
Kontrolle 2 Mittelwert 278 278
SA 2,47 3,84
% VK 0,9 1,4
Phosphor (mg/dl) n=80 Kontrolle 1
Mittelwert 6,9 6,9
SA 0,2 0,2 % VK 2,2 2,6
Kontrolle 2 Mittelwert 3,4 3,4
SA 0,1 0,2
% VK 4,1 4,9
Kalium (mmol/l) n=120 Kontrolle 1
Mittelwert 6,7 6,7
SA 0,26 0,26 % VK 3,9 3,9
Kontrolle 2 Mittelwert 4,3 4,3
SA 0,22 0,22
% VK 5,1 5,1
Natrium (mmol/l) n=80 Kontrolle 1
Mittelwert 148 148
SA 5,1 5,1 % VK 3,4 3,4
Kontrolle 2 Mittelwert 118 118
SA 3,2 3,2
% VK 2,7 2,7
Gesamtbilirubin (mg/dl) n=80 Kontrolle 1
Mittelwert 0,8 0,8
SA 0,06 0,07 % VK 7,5 8,8
Kontrolle 2 Mittelwert 5,2 5,2
SA 0,09 0,15
% VK 1,7 2,9
Page 26 of 73
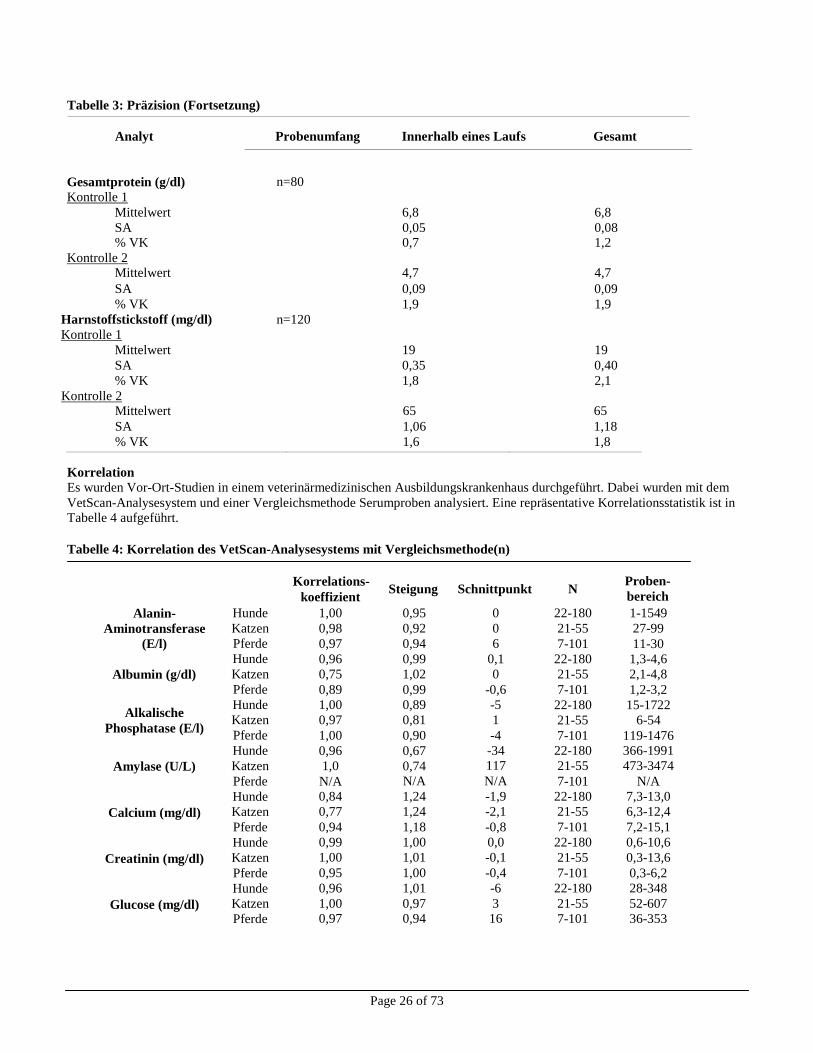
Tabelle 3: Präzision (Fortsetzung)
Analyt Probenumfang Innerhalb eines Laufs Gesamt
Gesamtprotein (g/dl)
n=80
Kontrolle 1 Mittelwert 6,8 6,8
SA 0,05 0,08 % VK 0,7 1,2
Kontrolle 2 Mittelwert 4,7 4,7
SA 0,09 0,09
% VK 1,9 1,9
Harnstoffstickstoff (mg/dl) n=120 Kontrolle 1
Mittelwert 19 19
SA 0,35 0,40
% VK 1,8 2,1
Kontrolle 2 Mittelwert 65 65
SA 1,06 1,18
% VK 1,6 1,8
Korrelation Es wurden Vor-Ort-Studien in einem veterinärmedizinischen Ausbildungskrankenhaus durchgeführt. Dabei wurden mit dem
VetScan-Analysesystem und einer Vergleichsmethode Serumproben analysiert. Eine repräsentative Korrelationsstatistik ist in Tabelle 4 aufgeführt.
Tabelle 4: Korrelation des VetScan-Analysesystems mit Vergleichsmethode(n)
Korrelations-
koeffizient Steigung Schnittpunkt N
Proben-
bereich
Alanin-
Aminotransferase
(E/l)
Albumin (g/dl)
Alkalische
Phosphatase (E/l)
Amylase (U/L)
Calcium (mg/dl)
Creatinin (mg/dl)
Glucose (mg/dl)
Hunde
Katzen
Pferde
Hunde
Katzen
Pferde
Hunde
Katzen
Pferde
Hunde
Katzen
Pferde
Hunde
Katzen
Pferde
Hunde
Katzen
Pferde
Hunde
Katzen
Pferde
1,00
0,98
0,97
0,96
0,75
0,89
1,00
0,97
1,00
0,96
1,0
N/A 0,84
0,77
0,94
0,99
1,00
0,95
0,96
1,00 0,97
0,95
0,92
0,94
0,99
1,02
0,99
0,89
0,81
0,90
0,67
0,74 N/A
1,24
1,24
1,18
1,00
1,01
1,00
1,01
0,97 0,94
0
0
6
0,1
0
-0,6
-5
1
-4
-34 117
N/A
-1,9
-2,1
-0,8
0,0
-0,1
-0,4
-6
3 16
22-180
21-55
7-101
22-180
21-55
7-101
22-180
21-55
7-101 22-180
21-55
7-101
22-180
21-55
7-101
22-180
21-55
7-101
22-180
21-55
7-101
1-1549
27-99
11-30
1,3-4,6
2,1-4,8
1,2-3,2
15-1722
6-54
119-1476 366-1991
473-3474
N/A
7,3-13,0
6,3-12,4
7,2-15,1
0,6-10,6
0,3-13,6
0,3-6,2
28-348
52-607
36-353
Page 27 of 73
Hunde
0,994
1,09
-0,19
22-180
0,8-87 Katzen 0,916 0,80 0,81 21-55 2,4-6,9
Pferde 0,971 0,991 -0,06 7-101 0,8-7,8
Hunde 0,96 0,92 0,4 22-180 3,2-6,9
Katzen 0,91 0,92 0,5 21-55 2,7-5,3
Pferde 0,84 0,97 0,1 7-101 1,8-4,6
Hunde 0,89 0,97 4,8 22-180 118-183
Katzen 0,86 1,08 -12,2 21-55 122-166
Pferde 0,86 1,00 -0,01 7-101 110-166
Hunde 0,87 0,84 0,1 22-180 0,1-3,2 Katzen 1,00 0,92 -0,3 21-55 0,4-15,0
Pferde 1,00 0,90 0,1 7-101 0,6-26,1
Hunde 0,98 1,03 0,1 22-180 2,6-10,7
Katzen 0,97 0,96 0,4 21-55 4,8-8,5
Pferde 0,99 0,97 0,3 7-101 3,0-9,5
Hunde 1,00 0,98 -2 22-180 4-117
Katzen 1,00 1,07 -5 21-55 14-165
Pferde 1,00 0,95 -1 7-101 3-64
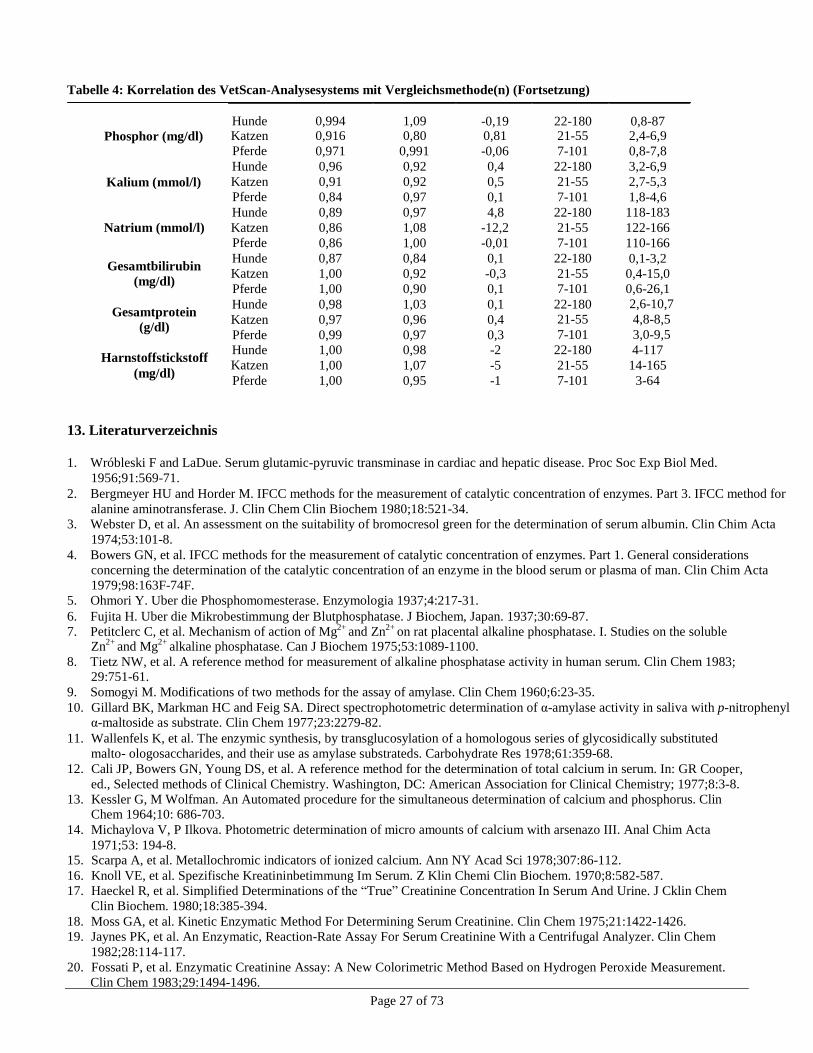
Tabelle 4: Korrelation des VetScan-Analysesystems mit Vergleichsmethode(n) (Fortsetzung)
Phosphor (mg/dl)
Kalium (mmol/l)
Natrium (mmol/l)
Gesamtbilirubin
(mg/dl)
Gesamtprotein
(g/dl)
Harnstoffstickstoff
(mg/dl)
13. Literaturverzeichnis
1. Wróbleski F and LaDue. Serum glutamic-pyruvic transminase in cardiac and hepatic disease. Proc Soc Exp Biol Med.
1956;91:569-71.
2. Bergmeyer HU and Horder M. IFCC methods for the measurement of catalytic concentration of enzymes. Part 3. IFCC method for
alanine aminotransferase. J. Clin Chem Clin Biochem 1980;18:521-34.
3. Webster D, et al. An assessment on the suitability of bromocresol green for the determination of serum albumin. Clin Chim Acta
1974;53:101-8.
4. Bowers GN, et al. IFCC methods for the measurement of catalytic concentration of enzymes. Part 1. General considerations
concerning the determination of the catalytic concentration of an enzyme in the blood serum or plasma of man. Clin Chim Acta
1979;98:163F-74F.
5. Ohmori Y. Uber die Phosphomomesterase. Enzymologia 1937;4:217-31.
6. Fujita H. Uber die Mikrobestimmung der Blutphosphatase. J Biochem, Japan. 1937;30:69-87.
7. Petitclerc C, et al. Mechanism of action of Mg2+ and Zn2+ on rat placental alkaline phosphatase. I. Studies on the soluble
Zn2+
and Mg2+
alkaline phosphatase. Can J Biochem 1975;53:1089-1100.
8. Tietz NW, et al. A reference method for measurement of alkaline phosphatase activity in human serum. Clin Chem 1983; 29:751-61.
9. Somogyi M. Modifications of two methods for the assay of amylase. Clin Chem 1960;6:23-35.
10. Gillard BK, Markman HC and Feig SA. Direct spectrophotometric determination of α-amylase activity in saliva with p-nitrophenyl α-maltoside as substrate. Clin Chem 1977;23:2279-82.
11. Wallenfels K, et al. The enzymic synthesis, by transglucosylation of a homologous series of glycosidically substituted
malto- ologosaccharides, and their use as amylase substrateds. Carbohydrate Res 1978;61:359-68.
12. Cali JP, Bowers GN, Young DS, et al. A reference method for the determination of total calcium in serum. In: GR Cooper,
ed., Selected methods of Clinical Chemistry. Washington, DC: American Association for Clinical Chemistry; 1977;8:3-8.
13. Kessler G, M Wolfman. An Automated procedure for the simultaneous determination of calcium and phosphorus. Clin Chem 1964;10: 686-703.
14. Michaylova V, P Ilkova. Photometric determination of micro amounts of calcium with arsenazo III. Anal Chim Acta
1971;53: 194-8. 15. Scarpa A, et al. Metallochromic indicators of ionized calcium. Ann NY Acad Sci 1978;307:86-112.
16. Knoll VE, et al. Spezifische Kreatininbetimmung Im Serum. Z Klin Chemi Clin Biochem. 1970;8:582-587.
17. Haeckel R, et al. Simplified Determinations of the “True” Creatinine Concentration In Serum And Urine. J Cklin Chem
Clin Biochem. 1980;18:385-394.
18. Moss GA, et al. Kinetic Enzymatic Method For Determining Serum Creatinine. Clin Chem 1975;21:1422-1426.
19. Jaynes PK, et al. An Enzymatic, Reaction-Rate Assay For Serum Creatinine With a Centrifugal Analyzer. Clin Chem
1982;28:114-117.
20. Fossati P, et al. Enzymatic Creatinine Assay: A New Colorimetric Method Based on Hydrogen Peroxide Measurement.
Clin Chem 1983;29:1494-1496.
Page 28 of 73
13. Literaturverzeichnis (Fortsetzung)
21. Whelton A, et al. Nitrogen Metabolites and Renal Function. In:CA Burtis and ER Ashwood, Eds., Tietz Textbook of
Clinical Chemistry, 3rd
Ed. Philadelphia: W.B. Saunders Company. 1999;1513-1575.
22. Folin O, and Wu H. A System of blood analysis. J Biol Chem 1919;38: 81-110.
23. Somogyi M. A reagent for the copper-idiometric determination of very small amounts of sugar. J Biol Chem 1937;117: 771-776.
24. Nelson N. A photometric adaption of the Somogyi method for the determination of glucose. J Biol 1944;
153: 375-380.
25. Kaplan LA. Glucose. In:LA Kaplan and AJ Pesce, eds., Clinical Chemistry: Theory, Analysis, and Correlation, 2nd
ed St. Louis: The C.V. Mosby Company; 1989;850-856.
26. Schulz DW, et al. An Enzymic Method for the Measurement of Inorganic Phosphate Determination Anal Biochem
1967;19:300-14.
27. Tedokon, M Suzuki, et al. Enzymatic Assay of Inorganic Phosphate with Use of Sucrose Phosphorylase and
Phosphoglucomutase. Clin Chem 1992;38:512-5.
28. Berry MN, et al. Enzymatic determination of potassium in serum. Clin Chem 1989;35:817-20.
29. Van Pelt J. Enzymatic determination of sodium, potassium and chloride in serum compared with determination by flame
photometry, coulometry and ion selective electrodes. Clin Chem 1994;40:846-7.
30. Hubl W, et al. Enzymatic determination of sodium, potassium and chloride in abnormal (hemolyzed, icteric, lipemic,
paraprteinemic, or uremic) serum samples compared with indirect determination with ion selective electrodes. Clin Chem
1994;40:1528-31.
31. Helgerson RC, et al. Host-guest Complexation. 50. Potassium and sodium ion-selective chromogenic ionophores. J Amer
Chem Soc 1989;111:6339-50. 32. Kumar A, et al. Chromogenic ionophere-based methods for spectrophotometric assay of sodium and potassium in serum
and plasma. Clin Chem 1988;34:1709-12.
33. Berry MN, et al. Enzymatic determination of sodium in serum. Clin Chem 1988;34:2295-8. 34. Malloy HT, and Evelyn KA. The determination of bilirubin with the photoelectric colorimeter. J biol Chem
1937;119:481-90.
35. Meites S. Bilirubin, directing reacting and total, modified Mally-Evelyn method. In: WR Faulkner and S Meites, eds.,
Selected Methods of Clinical Chemistry, Washington, DC: American Association for Clinical Chemistry; 1982;9:119-24.
36. Murao S and Tanaka N. A new enzyme “bilirubin oxidase” produced by Myrothecium verrucaria MT-1. Agric Biol Chem
1981;45:2383-4.
37. Osaki, S and S Anderson. Enzymatic determination of bilirubin. Clin Chem 1982;30:971. (Abstract)
38. Perry B, et al. Measurement of total bilirubin by use of bilirubin oxidase. Clin Chem 1986;32:329-32.
39. Koller A and Kaplan LA. Total serum protein. In: LA Kaplan and AJ Pesce, eds., Clinical Chemistry: Theory, Analysis,
and Correlation, 2nd
ed. St Louis: The C.V. Mosby Company; 1989:1057-60.
40. Reigler E. Eine kolorimetrische Bestimmungsmethods des Eiweisses. Z Anal Chem 1914;53:242-5.
41. Weicheselbaum TE. An accurate and rapid method for determination of proteins in small amounts of blood serum and
plasma. Am J Clin Path 1946;16:40-9.
42. Doumas BT, et al. A candidate reference method for determination of total protein in serum. I. Development and
validation. Clin Chem 1981;27:1642-50.
43. Sampson, EJ MA Baird, CA Burtis, EM Smith, DL Witte, and DD Bayse. A coupled-enzyme equilibrium method
for measuring urea in serum: optimization and evaluation of the AACC study group on urea candidate reference
method. Clin Chem 1980;26: 816-826.
44. National Committee for Clinical Laboratory Standards (NCCLS). Procedures for Handling and Processing of
Blood Specimens; tentative standard. NCCLS document H18-A2. Wayne, PA: NCCLS, 1999. 45. Overfield CV, Savory J, and Heintges MG. Glycosis: a re-evealuation of the effect on blood glucose. Clin Chim
Acta 1972;39:35-40.
46. Rehak NN and Chiang BT. Storage of whole blood: effect of temperature on the measured concentration of
analytes in serum. Clin Chem 1988;34:2111-14.
47. Sherwin JE and Obernolte R. Bilirubin. In:LA Kaplan and AJ Pesce, eds. Clinical Chemistry: Theory, Analysis
and Correlation, 2nd
ed. St. Louis: The C.V. Mosby Company; 1989;1009-1015.
48. Henry RJ, Canon DC and Winkelman. Clinical Chemistry Principles and Technics, 2nd
ed. New York: Harper and
Row; 1974;417-21; 127-8.
49. Scott MG, Electrolytes and Blood Gases. In: Burtis CA, Ashwood ER, eds. Tietz Textbook of Clinical Chemistry.
3rd
ed. Philadelphia: WB Saunders Company, 1999:617-721.
50. Witte DL, Brown LF, and RL Williams. Effects of bilirubin on detection of hydrogen peroxide by use of
peroxidase. Clin Chem 1978;24:1778-82.
Page 29 of 73
13. Literaturverzeichnis (Fortsetzung)
51. Melnik J and Potter JL. Variance in capillary and venous glucose levels during glucose tolerance test. Am J Med
Tech 1982;48:543-5.
52. National Committee for Clinical Laboratory Standards (NCCLS). Evaluation of precision performance of clinical
chemistry devices; approved guideline NCCLS Document EP5-A. Wayne, PA: NCCLS, 1999.
53. National Committee for Clinical Laboratory Standards (NCCLS). Quality management for unit-use testing;
proposed guideline. NCCLS Document EP18-P. Wayne, PA: NCCLS, 1999.
Page 30 of 73
Profil de diagnostic complet VetScan®
Pour usage vétérinaire seulement
Service à la clientèle et technique: 1-800-822-2947
Janvier 2015 Réf: 500-7123 Rév: E
© 2002, Abaxis, Inc., Union City, CA 94587
1. Usage prévu
Le rotor de réactif Profil de diagnostic complet VetScan®
employé avec l'analyseur de réaction chimique VetScan utilise des réactifs secs et liquides pour fournir les déterminations quantitatives in vitro de l'aminotransférase alanine (ALT), de l'albumine
(ALB), de la phosphatase alcaline (ALP), de l'amylase (AMY), du calcium total (CA++
), de la créatinine (CRE), de la
globuline* (GLOB), du glucose (GLU), du phosphore (PHOS), du potassium (K+), du sodium (NA
+), de la bilirubine total
(TBIL), des protéines totales (TP), de l'azote uréique (BUN) dans le sang entier hépariné, le plasma hépariné ou le sérum.
* Valeur calculée
2. Résumé et explication des tests
Le rotor de réactif Profil de diagnostic complet VetScan et l'analyseur de réaction chimique VetScan sont dotés d'un système
de diagnostic in vitro qui aide le vétérinaire à diagnostiquer les troubles suivants
Alanine
aminotransférase :
Pathologies hépatiques, notamment hépatite virale et cirrhose ; maladies cardiaques.
Albumine : Pathologies hépatiques et néphropathie.
Phosphatase
alkaline :
Pathologies hépatiques, osseuses, parathyroïdiennes et intestinales.
Amylase : Néphropathie et pathologies du pancreas.
Calcium : Pathologies parathyroïdiennes, osseuses et rénales chroniques ; tétanie.
Créatinine ; Néphropathie.
Globuline : La concentration de globuline augmente avec la déshydratation et devrait également accuser
une hausse avec la stimulation antigénique.
Glucose : Diabète, hyperglycémie, hypoglycémie et maladies hépatiques.
Phosphore : Néphropathie, hypoparathyroïdie et troubles nutritionnels.
Potassium : Malnutrition et néphropathie. Cet électrolyte permet de diagnostiquer les causes
devomissements et de diarrhée ainsi que les symptômes de troubles cardiaques.
Sodium : Déshydratation et diabète. Cet électrolyte permet de diagnostiquer les causes de omissements, et de diarrhée ainsi que les symptômes de troubles cardiaques.
Bilirubine totale : Troubles hépatiques.
Protéine totale : Déshydratation, néphropathie, maladies hépatiques, troubles métaboliques et nutritionnels.
Azote uréique du
sang :
Pathologies hépatiques et néphropathie.
Comme c'est le cas pour toute procédure de test de diagnostic, toutes les autres procédures de test, y compris l'état
clinique du patient, doivent être prises en considération avant d'établir un diagnostic définitif.
3. Principes de la procédure
Alanine aminotransférase
La méthode développée pour l'analyseur de réaction chimique VetScan est une modification de la procédure de Wróblewski et
LaDue recommandée par la Fédération internationale de chimie clinique (FICC).1,2
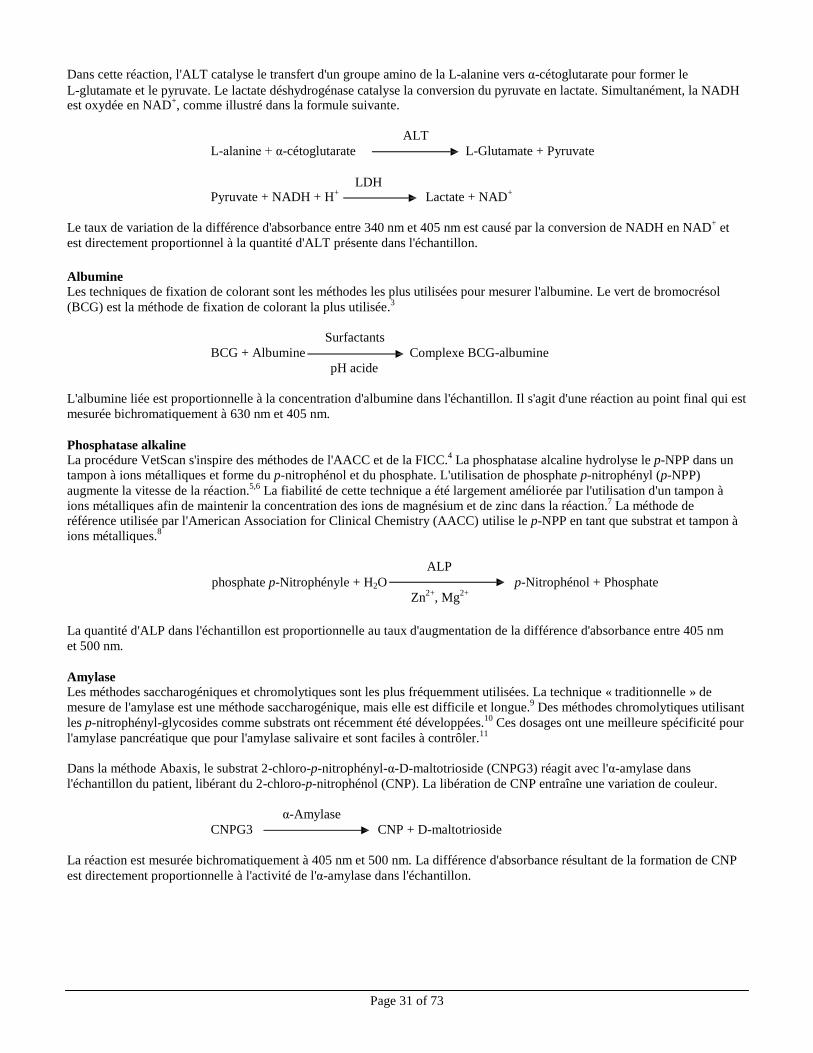
Page 31 of 73
Dans cette réaction, l'ALT catalyse le transfert d'un groupe amino de la L-alanine vers α-cétoglutarate pour former le
L-glutamate et le pyruvate. Le lactate déshydrogénase catalyse la conversion du pyruvate en lactate. Simultanément, la NADH
est oxydée en NAD+, comme illustré dans la formule suivante.
ALT
L-alanine + α-cétoglutarate L-Glutamate + Pyruvate
LDH
Pyruvate + NADH + H+
Lactate + NAD+
Le taux de variation de la différence d'absorbance entre 340 nm et 405 nm est causé par la conversion de NADH en NAD
+ et
est directement proportionnel à la quantité d'ALT présente dans l'échantillon.
Albumine Les techniques de fixation de colorant sont les méthodes les plus utilisées pour mesurer l'albumine. Le vert de bromocrésol
(BCG) est la méthode de fixation de colorant la plus utilisée.3
Surfactants
BCG + Albumine Complexe BCG-albumine
pH acide
L'albumine liée est proportionnelle à la concentration d'albumine dans l'échantillon. Il s'agit d'une réaction au point final qui est
mesurée bichromatiquement à 630 nm et 405 nm.
Phosphatase alkaline
La procédure VetScan s'inspire des méthodes de l'AACC et de la FICC.4
La phosphatase alcaline hydrolyse le p-NPP dans un
tampon à ions métalliques et forme du p-nitrophénol et du phosphate. L'utilisation de phosphate p-nitrophényl (p-NPP)
augmente la vitesse de la réaction.5,6
La fiabilité de cette technique a été largement améliorée par l'utilisation d'un tampon à
ions métalliques afin de maintenir la concentration des ions de magnésium et de zinc dans la réaction.7
La méthode de référence utilisée par l'American Association for Clinical Chemistry (AACC) utilise le p-NPP en tant que substrat et tampon à
ions métalliques.8
ALP
phosphate p-Nitrophényle + H2O p-Nitrophénol + Phosphate
Zn2+
, Mg2+
La quantité d'ALP dans l'échantillon est proportionnelle au taux d'augmentation de la différence d'absorbance entre 405 nm
et 500 nm.
Amylase Les méthodes saccharogéniques et chromolytiques sont les plus fréquemment utilisées. La technique « traditionnelle » de
mesure de l'amylase est une méthode saccharogénique, mais elle est difficile et longue.9
Des méthodes chromolytiques utilisant
les p-nitrophényl-glycosides comme substrats ont récemment été développées.10
Ces dosages ont une meilleure spécificité pour
l'amylase pancréatique que pour l'amylase salivaire et sont faciles à contrôler.11
Dans la méthode Abaxis, le substrat 2-chloro-p-nitrophényl-α-D-maltotrioside (CNPG3) réagit avec l'α-amylase dans
l'échantillon du patient, libérant du 2-chloro-p-nitrophénol (CNP). La libération de CNP entraîne une variation de couleur.
α-Amylase
CNPG3 CNP + D-maltotrioside
La réaction est mesurée bichromatiquement à 405 nm et 500 nm. La différence d'absorbance résultant de la formation de CNP
est directement proportionnelle à l'activité de l'α-amylase dans l'échantillon.
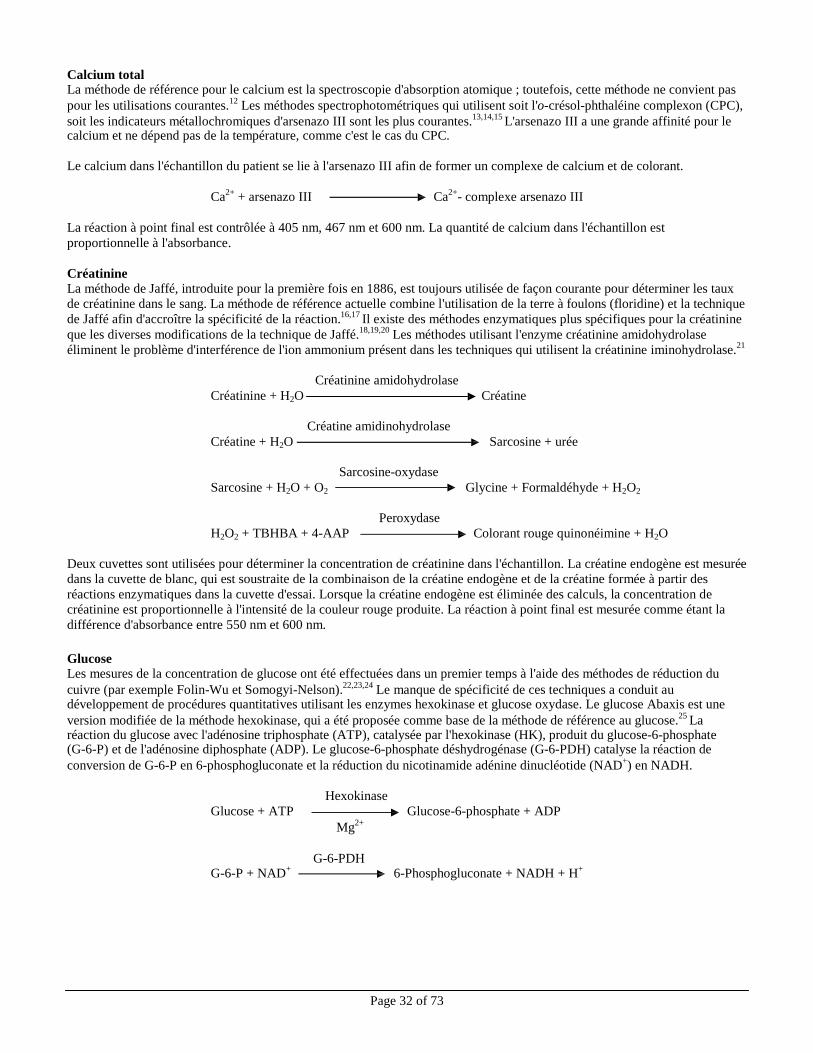
Page 32 of 73
Calcium total La méthode de référence pour le calcium est la spectroscopie d'absorption atomique ; toutefois, cette méthode ne convient pas
pour les utilisations courantes.12
Les méthodes spectrophotométriques qui utilisent soit l'o-crésol-phthaléine complexon (CPC),
soit les indicateurs métallochromiques d'arsenazo III sont les plus courantes.13,14,15
L'arsenazo III a une grande affinité pour le calcium et ne dépend pas de la température, comme c'est le cas du CPC.
Le calcium dans l'échantillon du patient se lie à l'arsenazo III afin de former un complexe de calcium et de colorant.
Ca
2+ + arsenazo III Ca
2+- complexe arsenazo III
La réaction à point final est contrôlée à 405 nm, 467 nm et 600 nm. La quantité de calcium dans l'échantillon est
proportionnelle à l'absorbance.
Créatinine La méthode de Jaffé, introduite pour la première fois en 1886, est toujours utilisée de façon courante pour déterminer les taux
de créatinine dans le sang. La méthode de référence actuelle combine l'utilisation de la terre à foulons (floridine) et la technique
de Jaffé afin d'accroître la spécificité de la réaction.16,17
Il existe des méthodes enzymatiques plus spécifiques pour la créatinine
que les diverses modifications de la technique de Jaffé.18,19,20
Les méthodes utilisant l'enzyme créatinine amidohydrolase
éliminent le problème d'interférence de l'ion ammonium présent dans les techniques qui utilisent la créatinine iminohydrolase.21
Créatinine amidohydrolase
Créatinine + H2O Créatine
Créatine amidinohydrolase
Créatine + H2O Sarcosine + urée
Sarcosine-oxydase
Sarcosine + H2O + O2 Glycine + Formaldéhyde + H2O2
Peroxydase
H2O2 + TBHBA + 4-AAP Colorant rouge quinonéimine + H2O
Deux cuvettes sont utilisées pour déterminer la concentration de créatinine dans l'échantillon. La créatine endogène est mesurée
dans la cuvette de blanc, qui est soustraite de la combinaison de la créatine endogène et de la créatine formée à partir des
réactions enzymatiques dans la cuvette d'essai. Lorsque la créatine endogène est éliminée des calculs, la concentration de
créatinine est proportionnelle à l'intensité de la couleur rouge produite. La réaction à point final est mesurée comme étant la
différence d'absorbance entre 550 nm et 600 nm.
Glucose Les mesures de la concentration de glucose ont été effectuées dans un premier temps à l'aide des méthodes de réduction du
cuivre (par exemple Folin-Wu et Somogyi-Nelson).22,23,24
Le manque de spécificité de ces techniques a conduit au développement de procédures quantitatives utilisant les enzymes hexokinase et glucose oxydase. Le glucose Abaxis est une
version modifiée de la méthode hexokinase, qui a été proposée comme base de la méthode de référence au glucose.25
La réaction du glucose avec l'adénosine triphosphate (ATP), catalysée par l'hexokinase (HK), produit du glucose-6-phosphate (G-6-P) et de l'adénosine diphosphate (ADP). Le glucose-6-phosphate déshydrogénase (G-6-PDH) catalyse la réaction de
conversion de G-6-P en 6-phosphogluconate et la réduction du nicotinamide adénine dinucléotide (NAD+) en NADH.
Hexokinase
Glucose + ATP Glucose-6-phosphate + ADP
Mg2+
G-6-PDH
G-6-P + NAD+
6-Phosphogluconate + NADH + H+
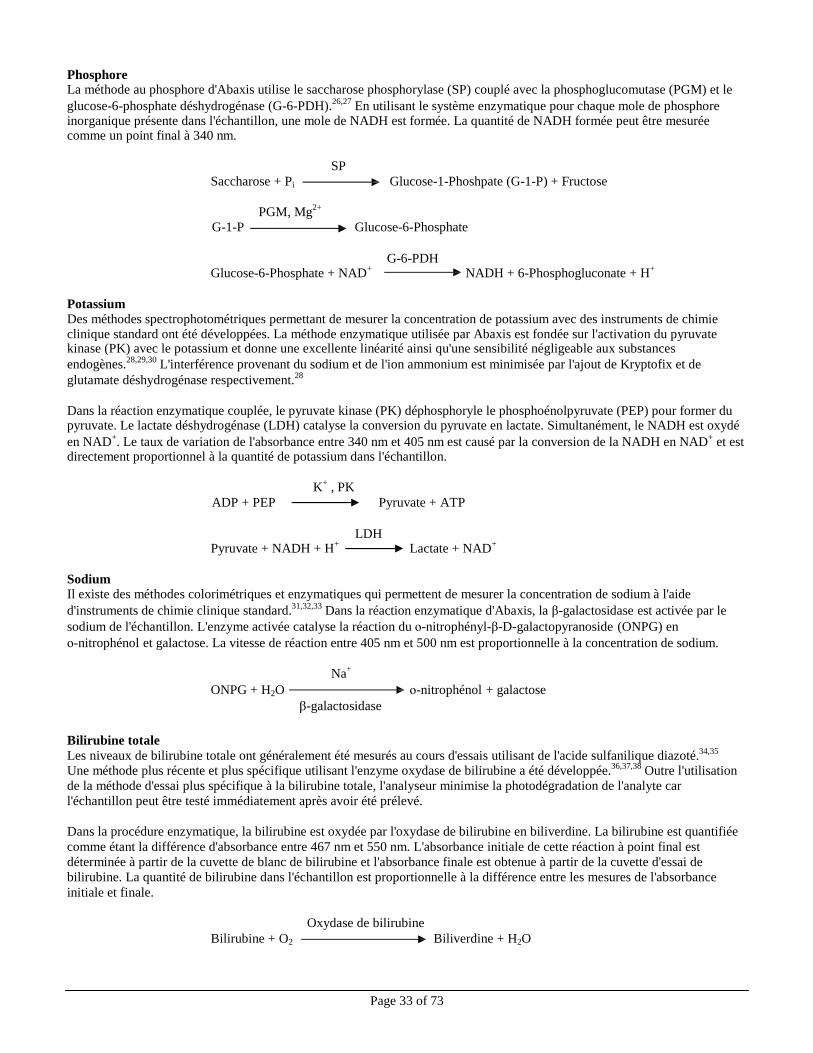
Page 33 of 73
Phosphore La méthode au phosphore d'Abaxis utilise le saccharose phosphorylase (SP) couplé avec la phosphoglucomutase (PGM) et le
glucose-6-phosphate déshydrogénase (G-6-PDH).26,27
En utilisant le système enzymatique pour chaque mole de phosphore inorganique présente dans l'échantillon, une mole de NADH est formée. La quantité de NADH formée peut être mesurée comme un point final à 340 nm.
SP
Saccharose + Pi Glucose-1-Phoshpate (G-1-P) + Fructose
PGM, Mg2+
G-1-P Glucose-6-Phosphate
G-6-PDH
Glucose-6-Phosphate + NAD+
NADH + 6-Phosphogluconate + H+
Potassium Des méthodes spectrophotométriques permettant de mesurer la concentration de potassium avec des instruments de chimie clinique standard ont été développées. La méthode enzymatique utilisée par Abaxis est fondée sur l'activation du pyruvate kinase (PK) avec le potassium et donne une excellente linéarité ainsi qu'une sensibilité négligeable aux substances
endogènes.28,29,30
L'interférence provenant du sodium et de l'ion ammonium est minimisée par l'ajout de Kryptofix et de
glutamate déshydrogénase respectivement.28
Dans la réaction enzymatique couplée, le pyruvate kinase (PK) déphosphoryle le phosphoénolpyruvate (PEP) pour former du pyruvate. Le lactate déshydrogénase (LDH) catalyse la conversion du pyruvate en lactate. Simultanément, le NADH est oxydé
en NAD+. Le taux de variation de l'absorbance entre 340 nm et 405 nm est causé par la conversion de la NADH en NAD
+ et est
directement proportionnel à la quantité de potassium dans l'échantillon.
K+
, PK
ADP + PEP Pyruvate + ATP
LDH
Pyruvate + NADH + H+
Lactate + NAD+
Sodium Il existe des méthodes colorimétriques et enzymatiques qui permettent de mesurer la concentration de sodium à l'aide
d'instruments de chimie clinique standard.31,32,33
Dans la réaction enzymatique d'Abaxis, la β-galactosidase est activée par le
sodium de l'échantillon. L'enzyme activée catalyse la réaction du ο-nitrophényl-β-D-galactopyranoside (ONPG) en
ο-nitrophénol et galactose. La vitesse de réaction entre 405 nm et 500 nm est proportionnelle à la concentration de sodium.
Na+
ONPG + H2O ο-nitrophénol + galactose
β-galactosidase
Bilirubine totale
Les niveaux de bilirubine totale ont généralement été mesurés au cours d'essais utilisant de l'acide sulfanilique diazoté.34,35
Une méthode plus récente et plus spécifique utilisant l'enzyme oxydase de bilirubine a été développée.36,37,38
Outre l'utilisation
de la méthode d'essai plus spécifique à la bilirubine totale, l'analyseur minimise la photodégradation de l'analyte car
l'échantillon peut être testé immédiatement après avoir été prélevé.
Dans la procédure enzymatique, la bilirubine est oxydée par l'oxydase de bilirubine en biliverdine. La bilirubine est quantifiée
comme étant la différence d'absorbance entre 467 nm et 550 nm. L'absorbance initiale de cette réaction à point final est
déterminée à partir de la cuvette de blanc de bilirubine et l'absorbance finale est obtenue à partir de la cuvette d'essai de
bilirubine. La quantité de bilirubine dans l'échantillon est proportionnelle à la différence entre les mesures de l'absorbance
initiale et finale.
Oxydase de bilirubine
Bilirubine + O2 Biliverdine + H2O
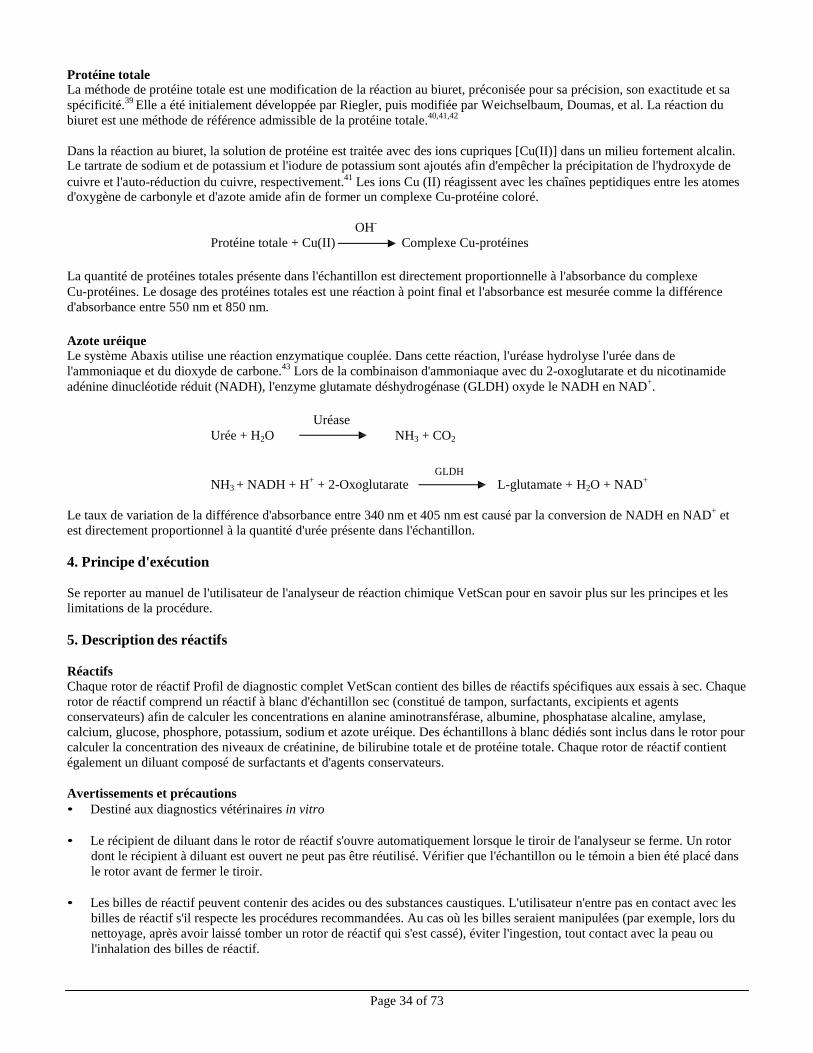
Page 34 of 73
Protéine totale La méthode de protéine totale est une modification de la réaction au biuret, préconisée pour sa précision, son exactitude et sa
spécificité.39
Elle a été initialement développée par Riegler, puis modifiée par Weichselbaum, Doumas, et al. La réaction du
biuret est une méthode de référence admissible de la protéine totale.40,41,42
Dans la réaction au biuret, la solution de protéine est traitée avec des ions cupriques [Cu(II)] dans un milieu fortement alcalin. Le tartrate de sodium et de potassium et l'iodure de potassium sont ajoutés afin d'empêcher la précipitation de l'hydroxyde de
cuivre et l'auto-réduction du cuivre, respectivement.41
Les ions Cu (II) réagissent avec les chaînes peptidiques entre les atomes d'oxygène de carbonyle et d'azote amide afin de former un complexe Cu-protéine coloré.
OH
-
Protéine totale + Cu(II) Complexe Cu-protéines
La quantité de protéines totales présente dans l'échantillon est directement proportionnelle à l'absorbance du complexe
Cu-protéines. Le dosage des protéines totales est une réaction à point final et l'absorbance est mesurée comme la différence
d'absorbance entre 550 nm et 850 nm.
Azote uréique Le système Abaxis utilise une réaction enzymatique couplée. Dans cette réaction, l'uréase hydrolyse l'urée dans de
l'ammoniaque et du dioxyde de carbone.43
Lors de la combinaison d'ammoniaque avec du 2-oxoglutarate et du nicotinamide
adénine dinucléotide réduit (NADH), l'enzyme glutamate déshydrogénase (GLDH) oxyde le NADH en NAD+.
Uréase
Urée + H2O NH3 + CO2
GLDH
NH3 + NADH + H+
+ 2-Oxoglutarate L-glutamate + H2O + NAD+
Le taux de variation de la différence d'absorbance entre 340 nm et 405 nm est causé par la conversion de NADH en NAD
+ et
est directement proportionnel à la quantité d'urée présente dans l'échantillon.
4. Principe d'exécution
Se reporter au manuel de l'utilisateur de l'analyseur de réaction chimique VetScan pour en savoir plus sur les principes et les
limitations de la procédure.
5. Description des réactifs
Réactifs Chaque rotor de réactif Profil de diagnostic complet VetScan contient des billes de réactifs spécifiques aux essais à sec. Chaque
rotor de réactif comprend un réactif à blanc d'échantillon sec (constitué de tampon, surfactants, excipients et agents
conservateurs) afin de calculer les concentrations en alanine aminotransférase, albumine, phosphatase alcaline, amylase,
calcium, glucose, phosphore, potassium, sodium et azote uréique. Des échantillons à blanc dédiés sont inclus dans le rotor pour
calculer la concentration des niveaux de créatinine, de bilirubine totale et de protéine totale. Chaque rotor de réactif contient
également un diluant composé de surfactants et d'agents conservateurs.
Avertissements et précautions
• Destiné aux diagnostics vétérinaires in vitro
• Le récipient de diluant dans le rotor de réactif s'ouvre automatiquement lorsque le tiroir de l'analyseur se ferme. Un rotor
dont le récipient à diluant est ouvert ne peut pas être réutilisé. Vérifier que l'échantillon ou le témoin a bien été placé dans
le rotor avant de fermer le tiroir.
• Les billes de réactif peuvent contenir des acides ou des substances caustiques. L'utilisateur n'entre pas en contact avec les
billes de réactif s'il respecte les procédures recommandées. Au cas où les billes seraient manipulées (par exemple, lors du
nettoyage, après avoir laissé tomber un rotor de réactif qui s'est cassé), éviter l'ingestion, tout contact avec la peau ou
l'inhalation des billes de réactif.
Page 35 of 73
• Certaines billes de réactif contiennent des azides de sodium, qui peuvent réagir avec les canalisations de plomb et de
cuivre pour former des azides de métal hautement explosifs. Les réactifs n'entrent pas en contact avec les canalisations de
plomb et de cuivre si l'utilisateur respecte les procédures recommandées. Toutefois, au cas où les réactifs entreraient en
contact avec les canalisations, rincer à grande eau afin d'éviter l'accumulation d'azides.
Manipulation des réactifs Les rotors de réactif peuvent être utilisés dès leur sortie du réfrigérateur sans devoir être réchauffés. Ouvrir le sachet en
aluminium scellé et en retirer le rotor en prenant soin de ne pas toucher l'anneau du code-barres qui se trouve sur le dessus du
rotor. Utiliser conformément aux instructions du manuel de l'utilisateur du système VetScan. Tout rotor qui n'a pas été utilisé
dans les 20 minutes suivant l'ouverture du sachet doit être jeté. En aucun cas les rotors dont le sachet est ouvert ne peuvent être
replacés dans le réfrigérateur en vue de leur utilisation ultérieurement.
Conservation Conserver les rotors de réactif dans leurs sachets scellés à une température comprise entre 2 °C et 8 °C (36 °F et 46 °F). Ne pas exposer des rotors ouverts ou fermés à la lumière directe du soleil ou à des températures supérieures à 32 °C (90 °F). Ne pas
laisser les rotors scellés dans leur sachet en aluminium à température ambiante pendant plus de 48 heures avant emploi. Ouvrir
le sachet et retirer le rotor juste avant son utilisation.
Indications d'instabilité ou de détérioration du rotor de réactif
• Tous les réactifs contenus dans le rotor, lorsqu'ils sont conservés comme décrit ci-dessus, sont stables jusqu'à la date de
péremption indiquée sur le sachet du rotor. Ne pas utiliser un rotor au-delà de la date de péremption. La date de
péremption est également encodée dans le code-barres imprimé sur l'anneau du code-barres. Un message d'erreur
s'affichera sur l'écran de l'analyseur de réaction chimique VetScan si les réactifs sont périmés.
• Un sachet déchiré ou détérioré risque de laisser pénétrer l'humidité, qui atteindra le rotor inutilisé et aura un effet
défavorable sur la performance du réactif. Ne pas utiliser un rotor provenant d'un sachet détérioré.
6. Instrument
Se reporter au manuel de l'utilisateur du système VetScan pour des informations complètes sur l'utilisation de l'analyseur.
7. Prélèvement et préparation des échantillons
La quantité minimale requise pour un échantillon est de ~100 µL de sang total hépariné, de plasma hépariné, de sérum ou
de témoin. La chambre à échantillon du rotor de réactif peut contenir jusqu'à 120 µL d'échantillon.
• Les échantillons prélevés dans une micropipette héparinée doivent être distribués dans le rotor de réactif immédiatement
après leur prélèvement.
• N'utiliser que des tubes de prélèvement sous vide à héparine de lithium (bouchon vert) pour les échantillons de sang entier
ou de plasma. Utiliser des tubes de prélèvement sous vide (bouchon rouge) sans adjuvants ou des tubes de séparation de
sérum (bouchon rouge ou rouge et noir) pour les échantillons de sérum.
• Les échantillons de sang entier obtenus par ponction veineuse doivent être homogènes avant de transférer un échantillon
au rotor de réactif. Retourner doucement le tube de prélèvement à plusieurs reprises juste avant de transférer les
échantillons. Ne pas agiter le tube de prélèvement. L'utilisateur évitera ainsi tout risque d'hémolyse.
• Le test doit être commencé dans les 10 minutes suivant le transfert de l'échantillon dans le rotor de réactif.
• Les échantillons de sang entier prélevés par ponction veineuse doivent être traités dans les 60 minutes suivant le
prélèvement. Si cela n'est pas possible, séparer l'échantillon et le transférer dans un tube à essai propre.44
Traiter l'échantillon de plasma ou de sérum séparé dans les 5 heures suivant la centrifugation. Si cela n'est pas possible, réfrigérer l'échantillon dans un tube à essai muni d'un bouchon à une température comprise entre 2 °C et 8 °C (36 °F et 46 °F), pendant 48 heures au maximum. Un échantillon de plasma ou de sérum peut être conservé à -10° C (14° F) pendant
5 semaines au maximum dans un congélateur non doté d'un cycle de dégivrage automatique.
• Les concentrations de glucose diminuent d'environ 5 à 12 mg/dL en 1 heure dans des échantillons non centrifugés
conservés à température ambiante.45
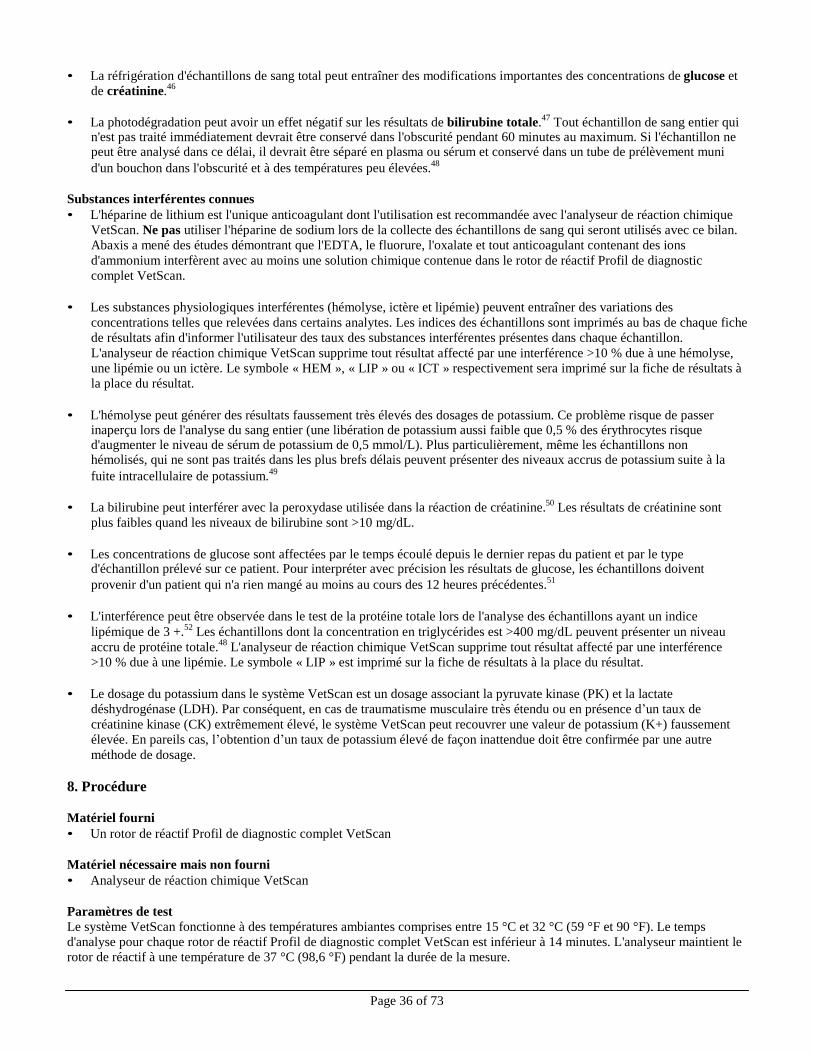
Page 36 of 73
• La réfrigération d'échantillons de sang total peut entraîner des modifications importantes des concentrations de glucose et
de créatinine.46
• La photodégradation peut avoir un effet négatif sur les résultats de bilirubine totale.
47 Tout échantillon de sang entier qui
n'est pas traité immédiatement devrait être conservé dans l'obscurité pendant 60 minutes au maximum. Si l'échantillon ne peut être analysé dans ce délai, il devrait être séparé en plasma ou sérum et conservé dans un tube de prélèvement muni
d'un bouchon dans l'obscurité et à des températures peu élevées.48
Substances interférentes connues
• L'héparine de lithium est l'unique anticoagulant dont l'utilisation est recommandée avec l'analyseur de réaction chimique
VetScan. Ne pas utiliser l'héparine de sodium lors de la collecte des échantillons de sang qui seront utilisés avec ce bilan.
Abaxis a mené des études démontrant que l'EDTA, le fluorure, l'oxalate et tout anticoagulant contenant des ions
d'ammonium interfèrent avec au moins une solution chimique contenue dans le rotor de réactif Profil de diagnostic
complet VetScan.
• Les substances physiologiques interférentes (hémolyse, ictère et lipémie) peuvent entraîner des variations des
concentrations telles que relevées dans certains analytes. Les indices des échantillons sont imprimés au bas de chaque fiche
de résultats afin d'informer l'utilisateur des taux des substances interférentes présentes dans chaque échantillon.
L'analyseur de réaction chimique VetScan supprime tout résultat affecté par une interférence >10 % due à une hémolyse,
une lipémie ou un ictère. Le symbole « HEM », « LIP » ou « ICT » respectivement sera imprimé sur la fiche de résultats à
la place du résultat.
• L'hémolyse peut générer des résultats faussement très élevés des dosages de potassium. Ce problème risque de passer
inaperçu lors de l'analyse du sang entier (une libération de potassium aussi faible que 0,5 % des érythrocytes risque d'augmenter le niveau de sérum de potassium de 0,5 mmol/L). Plus particulièrement, même les échantillons non hémolisés, qui ne sont pas traités dans les plus brefs délais peuvent présenter des niveaux accrus de potassium suite à la
fuite intracellulaire de potassium.49
• La bilirubine peut interférer avec la peroxydase utilisée dans la réaction de créatinine.
50 Les résultats de créatinine sont
plus faibles quand les niveaux de bilirubine sont >10 mg/dL.
• Les concentrations de glucose sont affectées par le temps écoulé depuis le dernier repas du patient et par le type
d'échantillon prélevé sur ce patient. Pour interpréter avec précision les résultats de glucose, les échantillons doivent
provenir d'un patient qui n'a rien mangé au moins au cours des 12 heures précédentes.51
• L'interférence peut être observée dans le test de la protéine totale lors de l'analyse des échantillons ayant un indice
lipémique de 3 +.52
Les échantillons dont la concentration en triglycérides est >400 mg/dL peuvent présenter un niveau
accru de protéine totale.48
L'analyseur de réaction chimique VetScan supprime tout résultat affecté par une interférence
>10 % due à une lipémie. Le symbole « LIP » est imprimé sur la fiche de résultats à la place du résultat.
• Le dosage du potassium dans le système VetScan est un dosage associant la pyruvate kinase (PK) et la lactate
déshydrogénase (LDH). Par conséquent, en cas de traumatisme musculaire très étendu ou en présence d’un taux de
créatinine kinase (CK) extrêmement élevé, le système VetScan peut recouvrer une valeur de potassium (K+) faussement
élevée. En pareils cas, l’obtention d’un taux de potassium élevé de façon inattendue doit être confirmée par une autre
méthode de dosage.
8. Procédure
Matériel fourni
• Un rotor de réactif Profil de diagnostic complet VetScan
Matériel nécessaire mais non fourni
• Analyseur de réaction chimique VetScan
Paramètres de test
Le système VetScan fonctionne à des températures ambiantes comprises entre 15 °C et 32 °C (59 °F et 90 °F). Le temps
d'analyse pour chaque rotor de réactif Profil de diagnostic complet VetScan est inférieur à 14 minutes. L'analyseur maintient le
rotor de réactif à une température de 37 °C (98,6 °F) pendant la durée de la mesure.
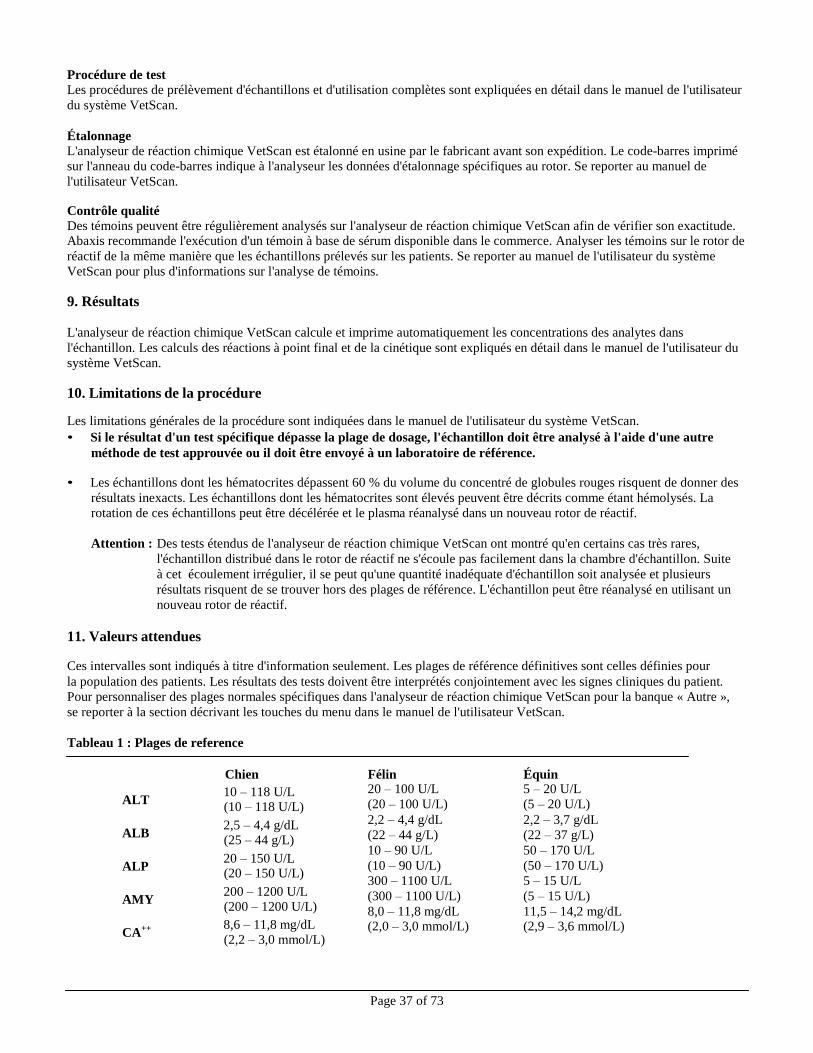
Page 37 of 73
Procédure de test Les procédures de prélèvement d'échantillons et d'utilisation complètes sont expliquées en détail dans le manuel de l'utilisateur
du système VetScan.
Étalonnage L'analyseur de réaction chimique VetScan est étalonné en usine par le fabricant avant son expédition. Le code-barres imprimé
sur l'anneau du code-barres indique à l'analyseur les données d'étalonnage spécifiques au rotor. Se reporter au manuel de
l'utilisateur VetScan.
Contrôle qualité Des témoins peuvent être régulièrement analysés sur l'analyseur de réaction chimique VetScan afin de vérifier son exactitude. Abaxis recommande l'exécution d'un témoin à base de sérum disponible dans le commerce. Analyser les témoins sur le rotor de
réactif de la même manière que les échantillons prélevés sur les patients. Se reporter au manuel de l'utilisateur du système
VetScan pour plus d'informations sur l'analyse de témoins.
9. Résultats
L'analyseur de réaction chimique VetScan calcule et imprime automatiquement les concentrations des analytes dans
l'échantillon. Les calculs des réactions à point final et de la cinétique sont expliqués en détail dans le manuel de l'utilisateur du
système VetScan.
10. Limitations de la procédure
Les limitations générales de la procédure sont indiquées dans le manuel de l'utilisateur du système VetScan.
• Si le résultat d'un test spécifique dépasse la plage de dosage, l'échantillon doit être analysé à l'aide d'une autre
méthode de test approuvée ou il doit être envoyé à un laboratoire de référence.
• Les échantillons dont les hématocrites dépassent 60 % du volume du concentré de globules rouges risquent de donner des
résultats inexacts. Les échantillons dont les hématocrites sont élevés peuvent être décrits comme étant hémolysés. La
rotation de ces échantillons peut être décélérée et le plasma réanalysé dans un nouveau rotor de réactif.
Attention : Des tests étendus de l'analyseur de réaction chimique VetScan ont montré qu'en certains cas très rares,
l'échantillon distribué dans le rotor de réactif ne s'écoule pas facilement dans la chambre d'échantillon. Suite
à cet écoulement irrégulier, il se peut qu'une quantité inadéquate d'échantillon soit analysée et plusieurs
résultats risquent de se trouver hors des plages de référence. L'échantillon peut être réanalysé en utilisant un
nouveau rotor de réactif.
11. Valeurs attendues
Ces intervalles sont indiqués à titre d'information seulement. Les plages de référence définitives sont celles définies pour
la population des patients. Les résultats des tests doivent être interprétés conjointement avec les signes cliniques du patient.
Pour personnaliser des plages normales spécifiques dans l'analyseur de réaction chimique VetScan pour la banque « Autre »,
se reporter à la section décrivant les touches du menu dans le manuel de l'utilisateur VetScan.
Tableau 1 : Plages de reference
Chien Félin Équin
ALT 10 – 118 U/L (10 – 118 U/L)
ALB 2,5 – 4,4 g/dL (25 – 44 g/L)
ALP 20 – 150 U/L (20 – 150 U/L)
AMY 200 – 1200 U/L (200 – 1200 U/L)
CA++ 8,6 – 11,8 mg/dL (2,2 – 3,0 mmol/L)
20 – 100 U/L
(20 – 100 U/L)
2,2 – 4,4 g/dL
(22 – 44 g/L)
10 – 90 U/L
(10 – 90 U/L)
300 – 1100 U/L
(300 – 1100 U/L)
8,0 – 11,8 mg/dL (2,0 – 3,0 mmol/L)
5 – 20 U/L
(5 – 20 U/L)
2,2 – 3,7 g/dL
(22 – 37 g/L)
50 – 170 U/L
(50 – 170 U/L)
5 – 15 U/L
(5 – 15 U/L)
11,5 – 14,2 mg/dL (2,9 – 3,6 mmol/L)
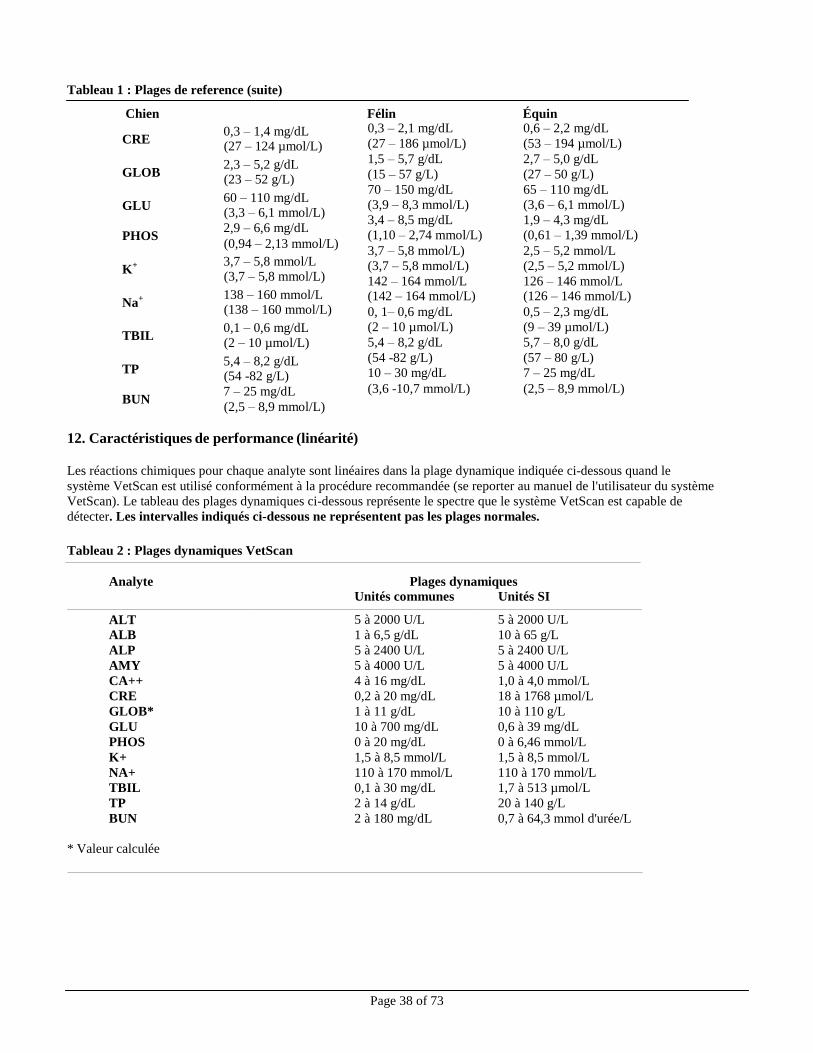
Page 38 of 73
Tableau 1 : Plages de reference (suite)
Chien Félin Équin
CRE 0,3 – 1,4 mg/dL (27 – 124 µmol/L)
GLOB 2,3 – 5,2 g/dL (23 – 52 g/L)
GLU 60 – 110 mg/dL (3,3 – 6,1 mmol/L)
PHOS 2,9 – 6,6 mg/dL (0,94 – 2,13 mmol/L)
K+ 3,7 – 5,8 mmol/L (3,7 – 5,8 mmol/L)
Na+ 138 – 160 mmol/L (138 – 160 mmol/L)
TBIL 0,1 – 0,6 mg/dL (2 – 10 µmol/L)
TP 5,4 – 8,2 g/dL (54 -82 g/L)
BUN 7 – 25 mg/dL (2,5 – 8,9 mmol/L)
0,3 – 2,1 mg/dL
(27 – 186 µmol/L)
1,5 – 5,7 g/dL
(15 – 57 g/L)
70 – 150 mg/dL
(3,9 – 8,3 mmol/L)
3,4 – 8,5 mg/dL
(1,10 – 2,74 mmol/L)
3,7 – 5,8 mmol/L)
(3,7 – 5,8 mmol/L)
142 – 164 mmol/L (142 – 164 mmol/L)
0, 1– 0,6 mg/dL
(2 – 10 µmol/L)
5,4 – 8,2 g/dL
(54 -82 g/L)
10 – 30 mg/dL
(3,6 -10,7 mmol/L)
0,6 – 2,2 mg/dL
(53 – 194 µmol/L)
2,7 – 5,0 g/dL
(27 – 50 g/L)
65 – 110 mg/dL
(3,6 – 6,1 mmol/L)
1,9 – 4,3 mg/dL
(0,61 – 1,39 mmol/L)
2,5 – 5,2 mmol/L
(2,5 – 5,2 mmol/L)
126 – 146 mmol/L (126 – 146 mmol/L)
0,5 – 2,3 mg/dL
(9 – 39 µmol/L)
5,7 – 8,0 g/dL
(57 – 80 g/L)
7 – 25 mg/dL
(2,5 – 8,9 mmol/L)
12. Caractéristiques de performance (linéarité)
Les réactions chimiques pour chaque analyte sont linéaires dans la plage dynamique indiquée ci-dessous quand le
système VetScan est utilisé conformément à la procédure recommandée (se reporter au manuel de l'utilisateur du système
VetScan). Le tableau des plages dynamiques ci-dessous représente le spectre que le système VetScan est capable de
détecter. Les intervalles indiqués ci-dessous ne représentent pas les plages normales.
Tableau 2 : Plages dynamiques VetScan
Analyte Plages dynamiques
Unités communes Unités SI
ALT 5 à 2000 U/L 5 à 2000 U/L
ALB 1 à 6,5 g/dL 10 à 65 g/L
ALP 5 à 2400 U/L 5 à 2400 U/L
AMY 5 à 4000 U/L 5 à 4000 U/L
CA++ 4 à 16 mg/dL 1,0 à 4,0 mmol/L
CRE 0,2 à 20 mg/dL 18 à 1768 µmol/L
GLOB* 1 à 11 g/dL 10 à 110 g/L
GLU 10 à 700 mg/dL 0,6 à 39 mg/dL
PHOS 0 à 20 mg/dL 0 à 6,46 mmol/L
K+ 1,5 à 8,5 mmol/L 1,5 à 8,5 mmol/L
NA+ 110 à 170 mmol/L 110 à 170 mmol/L
TBIL 0,1 à 30 mg/dL 1,7 à 513 µmol/L
TP 2 à 14 g/dL 20 à 140 g/L
BUN 2 à 180 mg/dL 0,7 à 64,3 mmol d'urée/L
* Valeur calculée
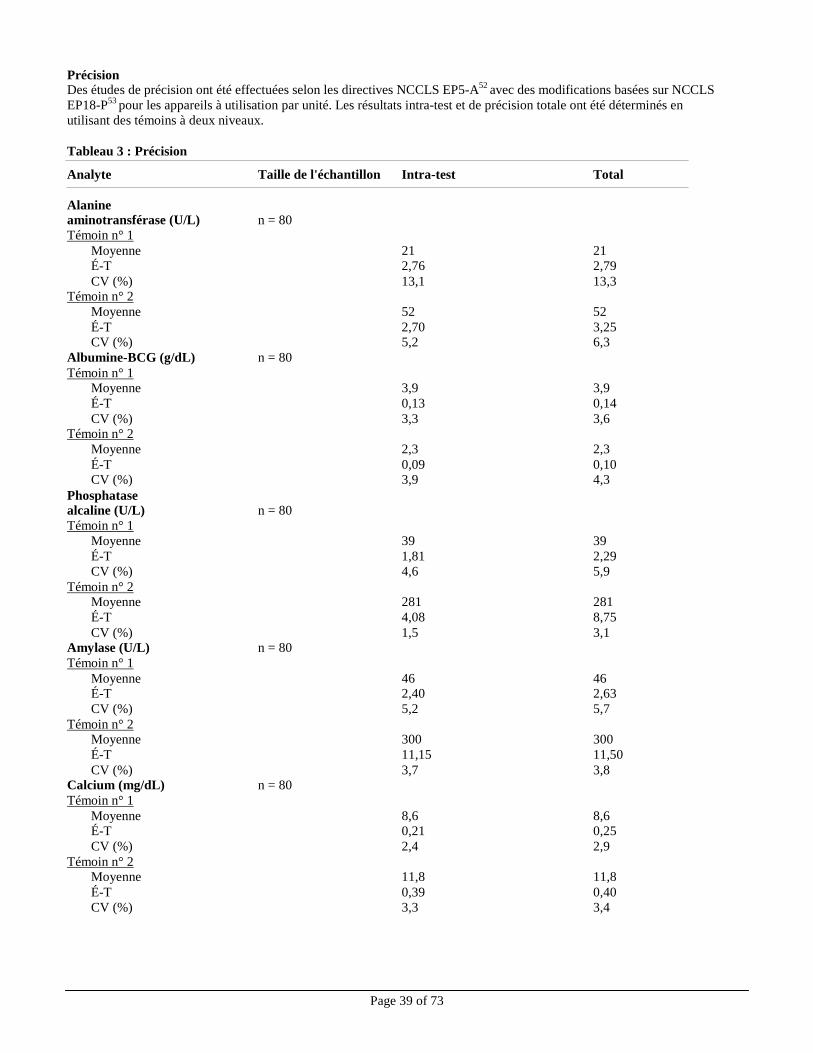
Page 39 of 73
Précision
Des études de précision ont été effectuées selon les directives NCCLS EP5-A52
avec des modifications basées sur NCCLS
EP18-P53
pour les appareils à utilisation par unité. Les résultats intra-test et de précision totale ont été déterminés en
utilisant des témoins à deux niveaux.
Tableau 3 : Précision
Analyte Taille de l'échantillon Intra-test Total
Alanine aminotransférase (U/L) n = 80
Témoin n° 1
Moyenne 21 21
É-T 2,76 2,79
CV (%) 13,1 13,3 Témoin n° 2
Moyenne 52 52
É-T 2,70 3,25 CV (%) 5,2 6,3
Albumine-BCG (g/dL) n = 80
Témoin n° 1 Moyenne 3,9 3,9
É-T 0,13 0,14
CV (%) 3,3 3,6 Témoin n° 2
Moyenne 2,3 2,3
É-T 0,09 0,10 CV (%) 3,9 4,3
Phosphatase alcaline (U/L) n = 80
Témoin n° 1
Moyenne 39 39
É-T 1,81 2,29
CV (%) 4,6 5,9
Témoin n° 2 Moyenne 281 281
É-T 4,08 8,75
CV (%) 1,5 3,1 Amylase (U/L) n = 80
Témoin n° 1
Moyenne 46 46 É-T 2,40 2,63
CV (%) 5,2 5,7
Témoin n° 2 Moyenne 300 300
É-T 11,15 11,50
CV (%) 3,7 3,8 Calcium (mg/dL) n = 80
Témoin n° 1
Moyenne 8,6 8,6 É-T 0,21 0,25
CV (%) 2,4 2,9
Témoin n° 2 Moyenne 11,8 11,8
É-T 0,39 0,40
CV (%) 3,3 3,4
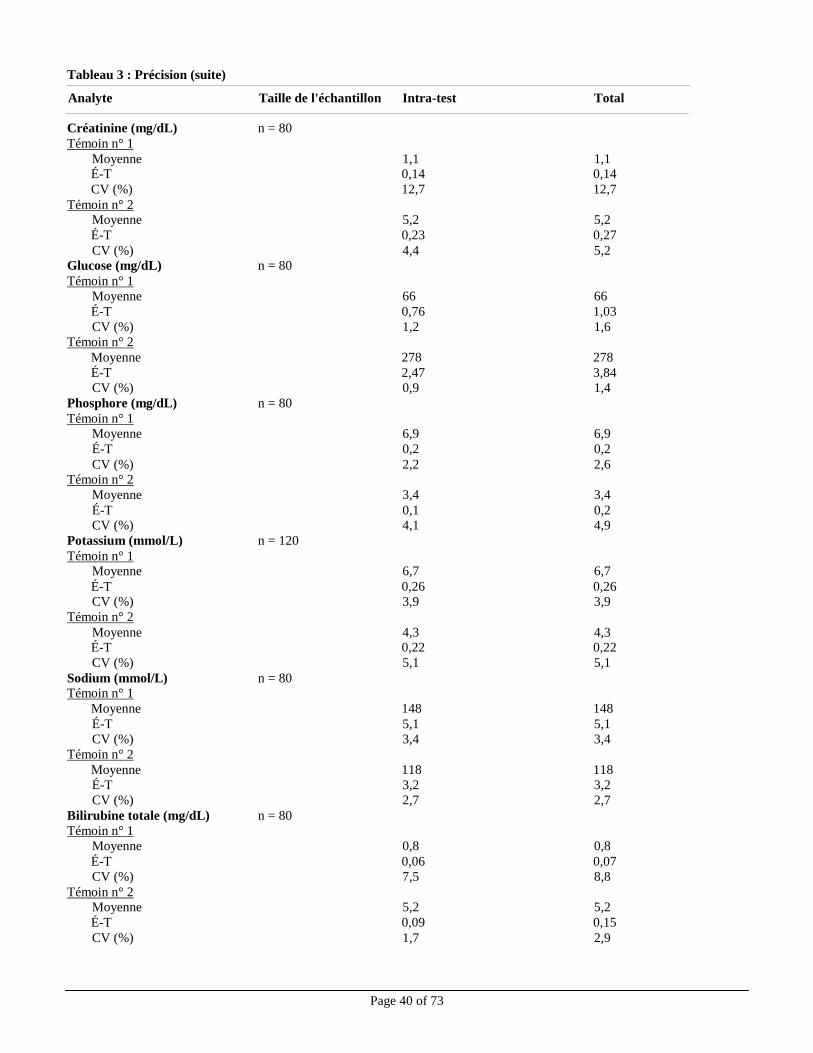
Tableau 3 : Précision (suite)
Page 40 of 73
Analyte Taille de l'échantillon Intra-test Total
Créatinine (mg/dL) n = 80
Témoin n° 1
Moyenne 1,1 1,1 É-T 0,14 0,14
CV (%) 12,7 12,7
Témoin n° 2 Moyenne 5,2 5,2
É-T 0,23 0,27
CV (%) 4,4 5,2 Glucose (mg/dL) n = 80
Témoin n° 1
Moyenne 66 66
É-T 0,76 1,03
CV (%) 1,2 1,6
Témoin n° 2
Moyenne 278 278
É-T 2,47 3,84
CV (%) 0,9 1,4
Phosphore (mg/dL) n = 80
Témoin n° 1
Moyenne 6,9 6,9
É-T 0,2 0,2
CV (%) 2,2 2,6 Témoin n° 2
Moyenne 3,4 3,4
É-T 0,1 0,2 CV (%) 4,1 4,9
Potassium (mmol/L) n = 120
Témoin n° 1 Moyenne 6,7 6,7
É-T 0,26 0,26 CV (%) 3,9 3,9
Témoin n° 2
Moyenne 4,3 4,3 É-T 0,22 0,22
CV (%) 5,1 5,1
Sodium (mmol/L) n = 80 Témoin n° 1
Moyenne 148 148
É-T 5,1 5,1
CV (%) 3,4 3,4
Témoin n° 2
Moyenne 118 118
É-T 3,2 3,2
CV (%) 2,7 2,7
Bilirubine totale (mg/dL) n = 80
Témoin n° 1
Moyenne 0,8 0,8
É-T 0,06 0,07
CV (%) 7,5 8,8
Témoin n° 2 Moyenne 5,2 5,2
É-T 0,09 0,15
CV (%) 1,7 2,9
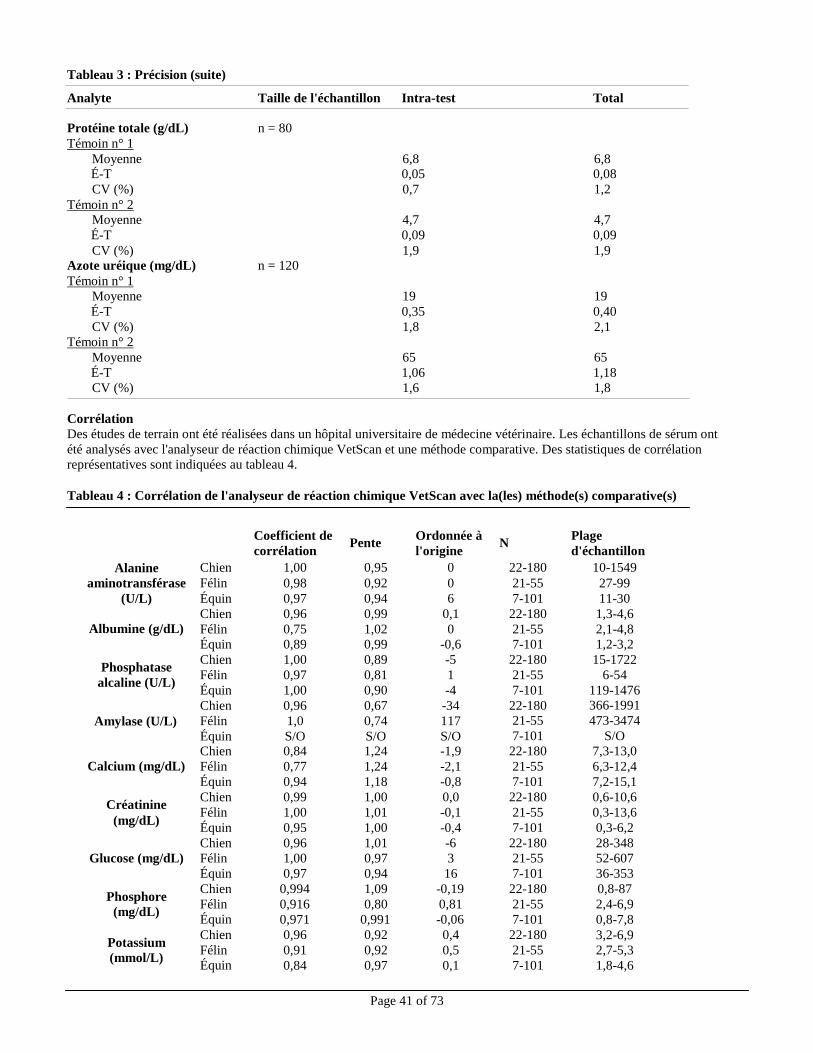
Tableau 3 : Précision (suite)
Page 41 of 73
Chien 1,00 0,95 0 22-180 10-1549
Félin 0,98 0,92 0 21-55 27-99
Équin 0,97 0,94 6 7-101 11-30
Chien 0,96 0,99 0,1 22-180 1,3-4,6
Félin 0,75 1,02 0 21-55 2,1-4,8
Équin 0,89 0,99 -0,6 7-101 1,2-3,2
Chien 1,00 0,89 -5 22-180 15-1722
Félin 0,97 0,81 1 21-55 6-54
Équin 1,00 0,90 -4 7-101 119-1476
Chien 0,96 0,67 -34 22-180 366-1991
Félin 1,0 0,74 117 21-55 473-3474
Équin S/O S/O S/O 7-101 S/O
Chien 0,84 1,24 -1,9 22-180 7,3-13,0
Félin 0,77 1,24 -2,1 21-55 6,3-12,4
Équin 0,94 1,18 -0,8 7-101 7,2-15,1
Chien 0,99 1,00 0,0 22-180 0,6-10,6
Félin 1,00 1,01 -0,1 21-55 0,3-13,6
Équin 0,95 1,00 -0,4 7-101 0,3-6,2
Chien 0,96 1,01 -6 22-180 28-348
Félin 1,00 0,97 3 21-55 52-607
Équin 0,97 0,94 16 7-101 36-353
Chien 0,994 1,09 -0,19 22-180 0,8-87
Félin 0,916 0,80 0,81 21-55 2,4-6,9
Équin 0,971 0,991 -0,06 7-101 0,8-7,8
Chien 0,96 0,92 0,4 22-180 3,2-6,9
Félin 0,91 0,92 0,5 21-55 2,7-5,3
Équin 0,84 0,97 0,1 7-101 1,8-4,6
Analyte Taille de l'échantillon Intra-test Total
Protéine totale (g/dL) n = 80
Témoin n° 1
Moyenne 6,8 6,8 É-T 0,05 0,08
CV (%) 0,7 1,2
Témoin n° 2 Moyenne 4,7 4,7
É-T 0,09 0,09
CV (%) 1,9 1,9 Azote uréique (mg/dL) n = 120
Témoin n° 1
Moyenne 19 19
É-T 0,35 0,40
CV (%) 1,8 2,1
Témoin n° 2
Moyenne 65 65
É-T 1,06 1,18
CV (%) 1,6 1,8
Corrélation
Des études de terrain ont été réalisées dans un hôpital universitaire de médecine vétérinaire. Les échantillons de sérum ont
été analysés avec l'analyseur de réaction chimique VetScan et une méthode comparative. Des statistiques de corrélation
représentatives sont indiquées au tableau 4.
Tableau 4 : Corrélation de l'analyseur de réaction chimique VetScan avec la(les) méthode(s) comparative(s)
Alanine
aminotransférase
(U/L)
Coefficient de
corrélation Pente
Ordonnée à
l'origine N
Plage
d'échantillon
Albumine (g/dL)
Phosphatase
alcaline (U/L)
Amylase (U/L)
Calcium (mg/dL)
Créatinine
(mg/dL)
Glucose (mg/dL)
Phosphore
(mg/dL)
Potassium
(mmol/L)
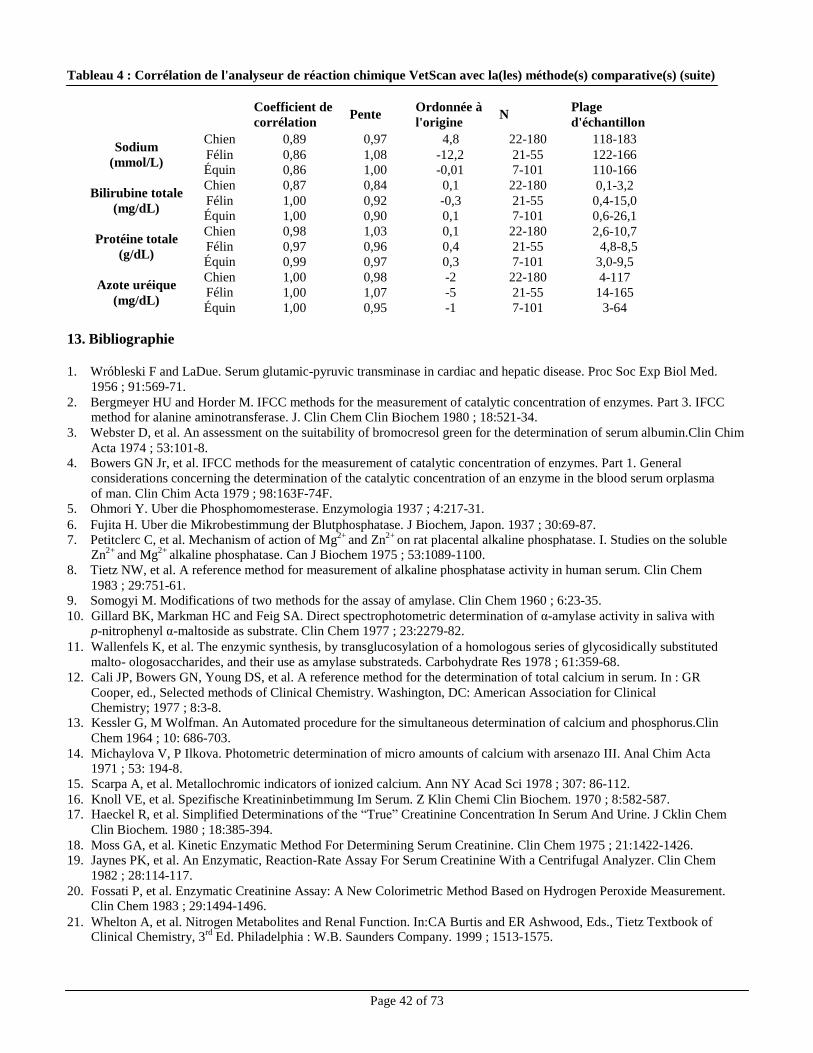
Page 42 of 73
Chien 0,89 0,97 4,8 22-180 118-183
Félin 0,86 1,08 -12,2 21-55 122-166 Équin 0,86 1,00 -0,01 7-101 110-166
Chien 0,87 0,84 0,1 22-180 0,1-3,2
Félin 1,00 0,92 -0,3 21-55 0,4-15,0 Équin 1,00 0,90 0,1 7-101 0,6-26,1
Chien 0,98 1,03 0,1 22-180 2,6-10,7
Félin 0,97 0,96 0,4 21-55 4,8-8,5
Équin 0,99 0,97 0,3 7-101 3,0-9,5
Chien 1,00 0,98 -2 22-180 4-117 Félin 1,00 1,07 -5 21-55 14-165
Équin 1,00 0,95 -1 7-101 3-64
Tableau 4 : Corrélation de l'analyseur de réaction chimique VetScan avec la(les) méthode(s) comparative(s) (suite)
Sodium
(mmol/L)
Bilirubine totale
(mg/dL)
Protéine totale
(g/dL)
Azote uréique
(mg/dL)
Coefficient de
corrélation Pente
Ordonnée à
l'origine N
Plage
d'échantillon
13. Bibliographie
1. Wróbleski F and LaDue. Serum glutamic-pyruvic transminase in cardiac and hepatic disease. Proc Soc Exp Biol Med.
1956 ; 91:569-71.
2. Bergmeyer HU and Horder M. IFCC methods for the measurement of catalytic concentration of enzymes. Part 3. IFCC method for alanine aminotransferase. J. Clin Chem Clin Biochem 1980 ; 18:521-34.
3. Webster D, et al. An assessment on the suitability of bromocresol green for the determination of serum albumin.Clin Chim
Acta 1974 ; 53:101-8. 4. Bowers GN Jr, et al. IFCC methods for the measurement of catalytic concentration of enzymes. Part 1. General
considerations concerning the determination of the catalytic concentration of an enzyme in the blood serum orplasma
of man. Clin Chim Acta 1979 ; 98:163F-74F.
5. Ohmori Y. Uber die Phosphomomesterase. Enzymologia 1937 ; 4:217-31.
6. Fujita H. Uber die Mikrobestimmung der Blutphosphatase. J Biochem, Japon. 1937 ; 30:69-87.
7. Petitclerc C, et al. Mechanism of action of Mg2+ and Zn2+ on rat placental alkaline phosphatase. I. Studies on the soluble
Zn2+
and Mg2+
alkaline phosphatase. Can J Biochem 1975 ; 53:1089-1100.
8. Tietz NW, et al. A reference method for measurement of alkaline phosphatase activity in human serum. Clin Chem
1983 ; 29:751-61. 9. Somogyi M. Modifications of two methods for the assay of amylase. Clin Chem 1960 ; 6:23-35.
10. Gillard BK, Markman HC and Feig SA. Direct spectrophotometric determination of α-amylase activity in saliva with p-nitrophenyl α-maltoside as substrate. Clin Chem 1977 ; 23:2279-82.
11. Wallenfels K, et al. The enzymic synthesis, by transglucosylation of a homologous series of glycosidically substituted
malto- ologosaccharides, and their use as amylase substrateds. Carbohydrate Res 1978 ; 61:359-68.
12. Cali JP, Bowers GN, Young DS, et al. A reference method for the determination of total calcium in serum. In : GR
Cooper, ed., Selected methods of Clinical Chemistry. Washington, DC: American Association for Clinical
Chemistry; 1977 ; 8:3-8. 13. Kessler G, M Wolfman. An Automated procedure for the simultaneous determination of calcium and phosphorus.Clin
Chem 1964 ; 10: 686-703.
14. Michaylova V, P Ilkova. Photometric determination of micro amounts of calcium with arsenazo III. Anal Chim Acta 1971 ; 53: 194-8.
15. Scarpa A, et al. Metallochromic indicators of ionized calcium. Ann NY Acad Sci 1978 ; 307: 86-112.
16. Knoll VE, et al. Spezifische Kreatininbetimmung Im Serum. Z Klin Chemi Clin Biochem. 1970 ; 8:582-587. 17. Haeckel R, et al. Simplified Determinations of the “True” Creatinine Concentration In Serum And Urine. J Cklin Chem
Clin Biochem. 1980 ; 18:385-394.
18. Moss GA, et al. Kinetic Enzymatic Method For Determining Serum Creatinine. Clin Chem 1975 ; 21:1422-1426. 19. Jaynes PK, et al. An Enzymatic, Reaction-Rate Assay For Serum Creatinine With a Centrifugal Analyzer. Clin Chem
1982 ; 28:114-117.
20. Fossati P, et al. Enzymatic Creatinine Assay: A New Colorimetric Method Based on Hydrogen Peroxide Measurement. Clin Chem 1983 ; 29:1494-1496.
21. Whelton A, et al. Nitrogen Metabolites and Renal Function. In:CA Burtis and ER Ashwood, Eds., Tietz Textbook of
Clinical Chemistry, 3rd
Ed. Philadelphia : W.B. Saunders Company. 1999 ; 1513-1575.
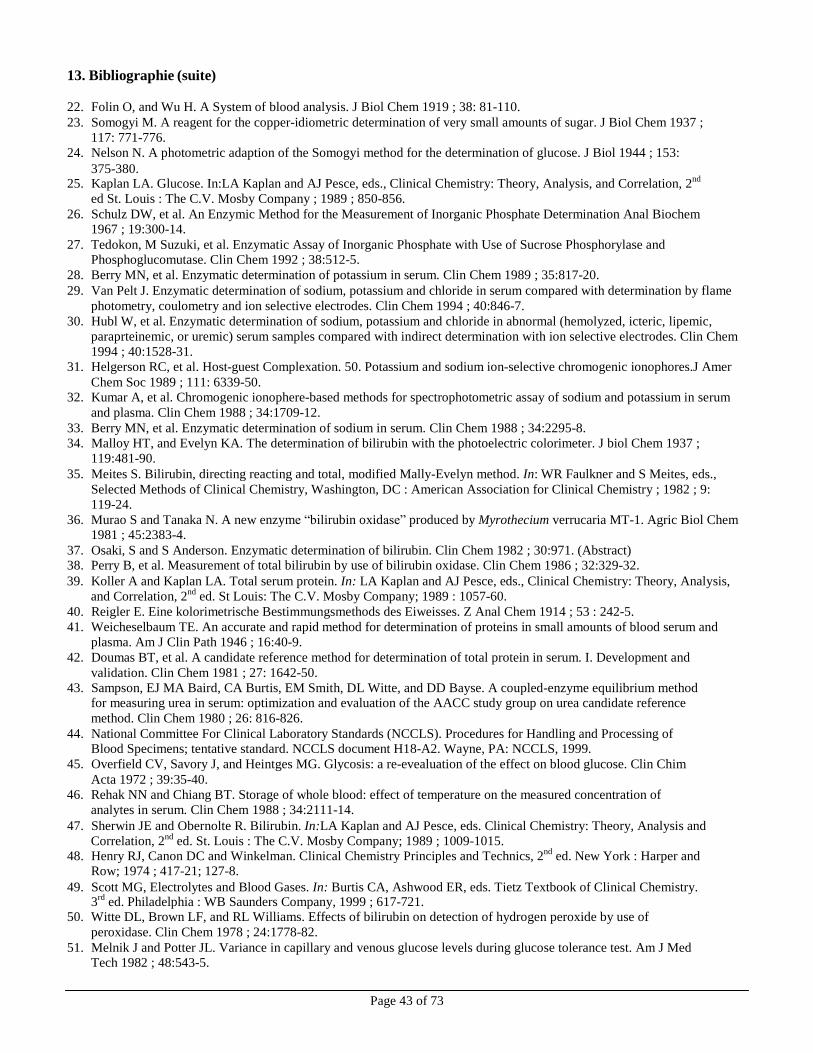
Page 43 of 73
13. Bibliographie (suite)
22. Folin O, and Wu H. A System of blood analysis. J Biol Chem 1919 ; 38: 81-110.
23. Somogyi M. A reagent for the copper-idiometric determination of very small amounts of sugar. J Biol Chem 1937 ;
117: 771-776.
24. Nelson N. A photometric adaption of the Somogyi method for the determination of glucose. J Biol 1944 ; 153:
375-380.
25. Kaplan LA. Glucose. In:LA Kaplan and AJ Pesce, eds., Clinical Chemistry: Theory, Analysis, and Correlation, 2nd
ed St. Louis : The C.V. Mosby Company ; 1989 ; 850-856.
26. Schulz DW, et al. An Enzymic Method for the Measurement of Inorganic Phosphate Determination Anal Biochem 1967 ; 19:300-14.
27. Tedokon, M Suzuki, et al. Enzymatic Assay of Inorganic Phosphate with Use of Sucrose Phosphorylase and Phosphoglucomutase. Clin Chem 1992 ; 38:512-5.
28. Berry MN, et al. Enzymatic determination of potassium in serum. Clin Chem 1989 ; 35:817-20.
29. Van Pelt J. Enzymatic determination of sodium, potassium and chloride in serum compared with determination by flame
photometry, coulometry and ion selective electrodes. Clin Chem 1994 ; 40:846-7.
30. Hubl W, et al. Enzymatic determination of sodium, potassium and chloride in abnormal (hemolyzed, icteric, lipemic,
paraprteinemic, or uremic) serum samples compared with indirect determination with ion selective electrodes. Clin Chem
1994 ; 40:1528-31.
31. Helgerson RC, et al. Host-guest Complexation. 50. Potassium and sodium ion-selective chromogenic ionophores.J Amer
Chem Soc 1989 ; 111: 6339-50. 32. Kumar A, et al. Chromogenic ionophere-based methods for spectrophotometric assay of sodium and potassium in serum
and plasma. Clin Chem 1988 ; 34:1709-12.
33. Berry MN, et al. Enzymatic determination of sodium in serum. Clin Chem 1988 ; 34:2295-8.
34. Malloy HT, and Evelyn KA. The determination of bilirubin with the photoelectric colorimeter. J biol Chem 1937 ;
119:481-90.
35. Meites S. Bilirubin, directing reacting and total, modified Mally-Evelyn method. In: WR Faulkner and S Meites, eds.,
Selected Methods of Clinical Chemistry, Washington, DC : American Association for Clinical Chemistry ; 1982 ; 9:
119-24.
36. Murao S and Tanaka N. A new enzyme “bilirubin oxidase” produced by Myrothecium verrucaria MT-1. Agric Biol Chem 1981 ; 45:2383-4.
37. Osaki, S and S Anderson. Enzymatic determination of bilirubin. Clin Chem 1982 ; 30:971. (Abstract) 38. Perry B, et al. Measurement of total bilirubin by use of bilirubin oxidase. Clin Chem 1986 ; 32:329-32.
39. Koller A and Kaplan LA. Total serum protein. In: LA Kaplan and AJ Pesce, eds., Clinical Chemistry: Theory, Analysis,
and Correlation, 2nd
ed. St Louis: The C.V. Mosby Company; 1989 : 1057-60.
40. Reigler E. Eine kolorimetrische Bestimmungsmethods des Eiweisses. Z Anal Chem 1914 ; 53 : 242-5.
41. Weicheselbaum TE. An accurate and rapid method for determination of proteins in small amounts of blood serum and
plasma. Am J Clin Path 1946 ; 16:40-9.
42. Doumas BT, et al. A candidate reference method for determination of total protein in serum. I. Development and
validation. Clin Chem 1981 ; 27: 1642-50.
43. Sampson, EJ MA Baird, CA Burtis, EM Smith, DL Witte, and DD Bayse. A coupled-enzyme equilibrium method for measuring urea in serum: optimization and evaluation of the AACC study group on urea candidate reference
method. Clin Chem 1980 ; 26: 816-826.
44. National Committee For Clinical Laboratory Standards (NCCLS). Procedures for Handling and Processing of Blood Specimens; tentative standard. NCCLS document H18-A2. Wayne, PA: NCCLS, 1999.
45. Overfield CV, Savory J, and Heintges MG. Glycosis: a re-evealuation of the effect on blood glucose. Clin Chim
Acta 1972 ; 39:35-40.
46. Rehak NN and Chiang BT. Storage of whole blood: effect of temperature on the measured concentration of
analytes in serum. Clin Chem 1988 ; 34:2111-14.
47. Sherwin JE and Obernolte R. Bilirubin. In:LA Kaplan and AJ Pesce, eds. Clinical Chemistry: Theory, Analysis and
Correlation, 2nd ed. St. Louis : The C.V. Mosby Company; 1989 ; 1009-1015.
48. Henry RJ, Canon DC and Winkelman. Clinical Chemistry Principles and Technics, 2nd
ed. New York : Harper and Row; 1974 ; 417-21; 127-8.
49. Scott MG, Electrolytes and Blood Gases. In: Burtis CA, Ashwood ER, eds. Tietz Textbook of Clinical Chemistry.
3rd
ed. Philadelphia : WB Saunders Company, 1999 ; 617-721. 50. Witte DL, Brown LF, and RL Williams. Effects of bilirubin on detection of hydrogen peroxide by use of
peroxidase. Clin Chem 1978 ; 24:1778-82.
51. Melnik J and Potter JL. Variance in capillary and venous glucose levels during glucose tolerance test. Am J Med Tech 1982 ; 48:543-5.
Page 44 of 73
13. Bibliographie (suite)
52. National Committee for Clinical Laboratory Standards (NCCLS). Evaluation of precision performance of clinical
chemistry devices; approved guideline NCCLS Document EP5-A. Wayne, PA : NCCLS, 1999.
53. National Committee for Clinical Laboratory Standards (NCCLS). Quality management for unit-use testing;
proposed guideline. NCCLS Document EP18-P. Wayne, PA : NCCLS, 1999.
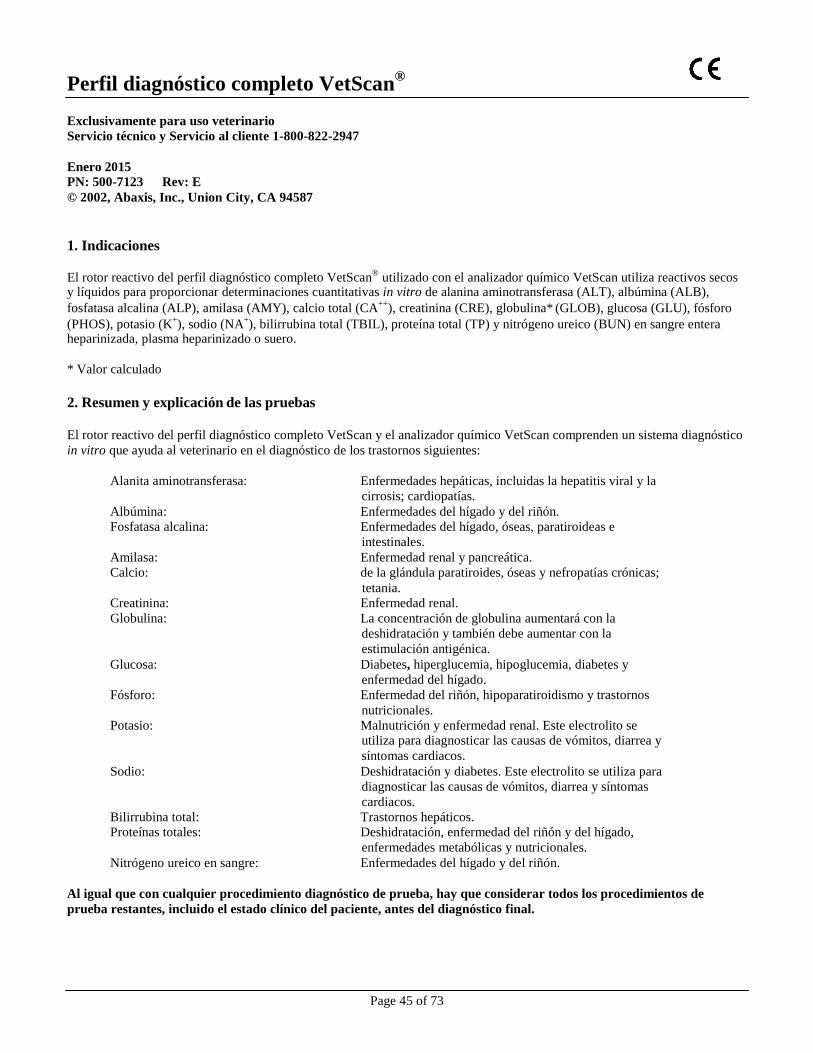
Page 45 of 73
Perfil diagnóstico completo VetScan®
Exclusivamente para uso veterinario
Servicio técnico y Servicio al cliente 1-800-822-2947
Enero 2015 PN: 500-7123 Rev: E
© 2002, Abaxis, Inc., Union City, CA 94587
1. Indicaciones
El rotor reactivo del perfil diagnóstico completo VetScan
® utilizado con el analizador químico VetScan utiliza reactivos secos
y líquidos para proporcionar determinaciones cuantitativas in vitro de alanina aminotransferasa (ALT), albúmina (ALB),
fosfatasa alcalina (ALP), amilasa (AMY), calcio total (CA++
), creatinina (CRE), globulina* (GLOB), glucosa (GLU), fósforo
(PHOS), potasio (K+), sodio (NA
+), bilirrubina total (TBIL), proteína total (TP) y nitrógeno ureico (BUN) en sangre entera
heparinizada, plasma heparinizado o suero.
* Valor calculado
2. Resumen y explicación de las pruebas
El rotor reactivo del perfil diagnóstico completo VetScan y el analizador químico VetScan comprenden un sistema diagnóstico
in vitro que ayuda al veterinario en el diagnóstico de los trastornos siguientes:
Alanita aminotransferasa: Enfermedades hepáticas, incluidas la hepatitis viral y la
cirrosis; cardiopatías.
Albúmina: Enfermedades del hígado y del riñón.
Fosfatasa alcalina: Enfermedades del hígado, óseas, paratiroideas e
intestinales.
Amilasa: Enfermedad renal y pancreática.
Calcio: de la glándula paratiroides, óseas y nefropatías crónicas;
tetania. Creatinina: Enfermedad renal.
Globulina: La concentración de globulina aumentará con la
deshidratación y también debe aumentar con la
estimulación antigénica.
Glucosa: Diabetes, hiperglucemia, hipoglucemia, diabetes y
enfermedad del hígado.
Fósforo: Enfermedad del riñón, hipoparatiroidismo y trastornos
nutricionales.
Potasio: Malnutrición y enfermedad renal. Este electrolito se utiliza para diagnosticar las causas de vómitos, diarrea y
síntomas cardiacos.
Sodio: Deshidratación y diabetes. Este electrolito se utiliza para
diagnosticar las causas de vómitos, diarrea y síntomas
cardiacos.
Bilirrubina total: Trastornos hepáticos. Proteínas totales: Deshidratación, enfermedad del riñón y del hígado,
enfermedades metabólicas y nutricionales.
Nitrógeno ureico en sangre: Enfermedades del hígado y del riñón.
Al igual que con cualquier procedimiento diagnóstico de prueba, hay que considerar todos los procedimientos de
prueba restantes, incluido el estado clínico del paciente, antes del diagnóstico final.
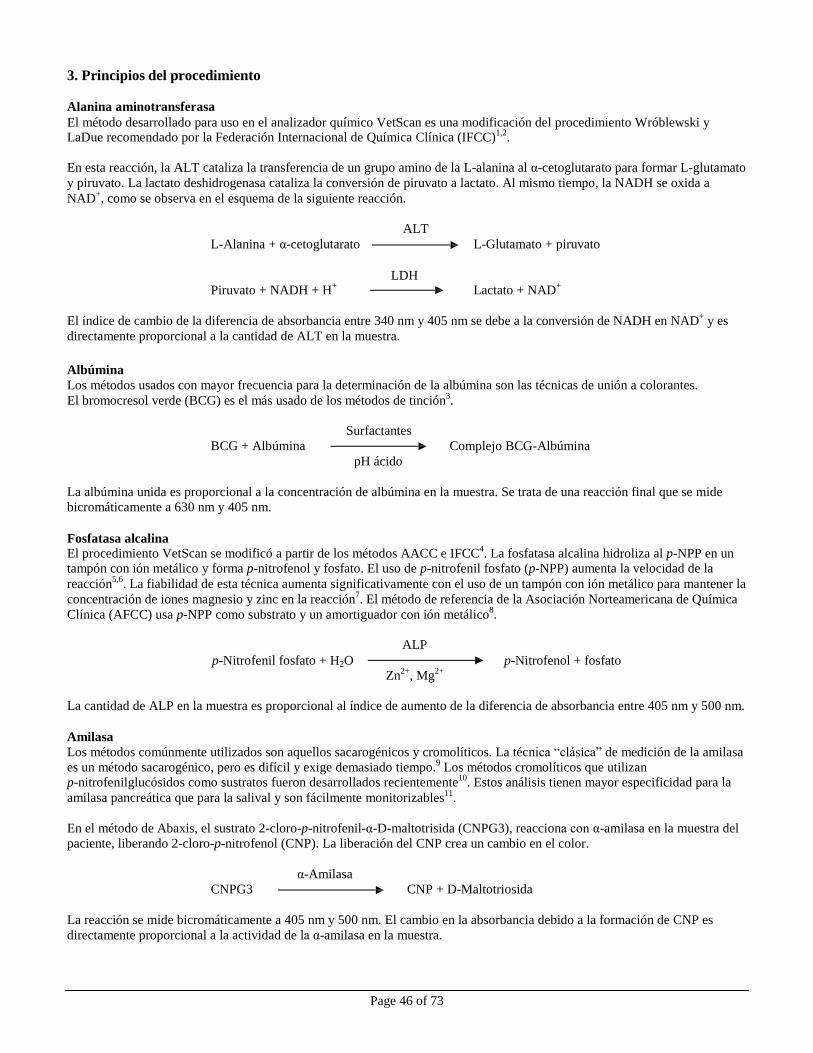
Page 46 of 73
3. Principios del procedimiento
Alanina aminotransferasa
El método desarrollado para uso en el analizador químico VetScan es una modificación del procedimiento Wróblewski y
LaDue recomendado por la Federación Internacional de Química Clínica (IFCC)1,2
.
En esta reacción, la ALT cataliza la transferencia de un grupo amino de la L-alanina al α-cetoglutarato para formar L-glutamato
y piruvato. La lactato deshidrogenasa cataliza la conversión de piruvato a lactato. Al mismo tiempo, la NADH se oxida a
NAD+, como se observa en el esquema de la siguiente reacción.
ALT
L-Alanina + α-cetoglutarato L-Glutamato + piruvato
LDH
Piruvato + NADH + H+
Lactato + NAD+
El índice de cambio de la diferencia de absorbancia entre 340 nm y 405 nm se debe a la conversión de NADH en NAD
+ y es
directamente proporcional a la cantidad de ALT en la muestra.
Albúmina
Los métodos usados con mayor frecuencia para la determinación de la albúmina son las técnicas de unión a colorantes.
El bromocresol verde (BCG) es el más usado de los métodos de tinción3.
Surfactantes
BCG + Albúmina Complejo BCG-Albúmina
pH ácido
La albúmina unida es proporcional a la concentración de albúmina en la muestra. Se trata de una reacción final que se mide
bicromáticamente a 630 nm y 405 nm.
Fosfatasa alcalina
El procedimiento VetScan se modificó a partir de los métodos AACC e IFCC4. La fosfatasa alcalina hidroliza al p-NPP en un
tampón con ión metálico y forma p-nitrofenol y fosfato. El uso de p-nitrofenil fosfato (p-NPP) aumenta la velocidad de la
reacción5,6
. La fiabilidad de esta técnica aumenta significativamente con el uso de un tampón con ión metálico para mantener la
concentración de iones magnesio y zinc en la reacción7. El método de referencia de la Asociación Norteamericana de Química
Clínica (AFCC) usa p-NPP como substrato y un amortiguador con ión metálico8.
ALP
p-Nitrofenil fosfato + H2O p-Nitrofenol + fosfato Zn
2+, Mg
2+
La cantidad de ALP en la muestra es proporcional al índice de aumento de la diferencia de absorbancia entre 405 nm y 500 nm.
Amilasa
Los métodos comúnmente utilizados son aquellos sacarogénicos y cromolíticos. La técnica “clásica” de medición de la amilasa
es un método sacarogénico, pero es difícil y exige demasiado tiempo.9
Los métodos cromolíticos que utilizan p-nitrofenilglucósidos como sustratos fueron desarrollados recientemente
10. Estos análisis tienen mayor especificidad para la
amilasa pancreática que para la salival y son fácilmente monitorizables11
.
En el método de Abaxis, el sustrato 2-cloro-p-nitrofenil-α-D-maltotrisida (CNPG3), reacciona con α-amilasa en la muestra del
paciente, liberando 2-cloro-p-nitrofenol (CNP). La liberación del CNP crea un cambio en el color.
α-Amilasa
CNPG3 CNP + D-Maltotriosida
La reacción se mide bicromáticamente a 405 nm y 500 nm. El cambio en la absorbancia debido a la formación de CNP es
directamente proporcional a la actividad de la α-amilasa en la muestra.

Page 47 of 73
Calcio total El método de referencia para el calcio es la espectroscopia por absorción atómica; sin embargo, este método no es apto para uso
rutinario.12
Los métodos espectrofotométricos que utilizan o-cresolftaleína complexona (CPC) o indicadores arsenazo III
metalocrómicos son los más utilizados en la práctica.13,14,15
El arsenazo III tiene una gran afinidad por el calcio y no depende de la temperatura como la CPC.
El calcio en la muestra del paciente se une al arsenazo III para formar un complejo de tintura de calcio.
Ca
2+ + Arsenazo III Complejo de Ca
2+ y arsenazo III
El criterio de valoración de la reacción final se controla a 405 nm, 467 nm y 600 nm. La cantidad de calcio en la muestra es
proporcional a la absorbancia.
Creatinina El método Jaffe, presentado en 1886, sigue siendo el método usado con mayor frecuencia para la determinación de los niveles de creatinina en la sangre. El método actual de referencia combina el uso de tierra de Fuller (floridina) con la técnica de Jaffe
para aumentar la especificidad de la reacción.16,17
Se desarrollaron métodos enzimáticos que son más específicos para la
creatinina que las distintas modificaciones de la técnica Jaffe.18,19,20
Los métodos que usan a la enzima creatinina amidohidrolasa eliminan el problema de la interferencia del ión amoníaco que se vio en las técnicas que usan creatinina
iminohidrolasa.21
Creatina amidinohidrolasa
Creatinina + H2O Creatina
Creatina amidinohidrolasa
Creatina + H2O Sarcosina + Urea
Sarcosina oxidasa
Sarcosina + H2O + O2 Glicina + formaldehído + H2O2
Peroxidasa
H2O2 + TBHBA + 4-AAP Colorante rojo de quinoneimina + H2O
Se utilizan dos cubetas para determinar la concentración de creatinina en la muestra. La creatina endógena se mide en la cubeta
de referencia, que es restada de la creatina endógena combinada y la creatina formada a partir de las reacciones enzimáticas en
la cubeta de prueba. Una vez eliminada la creatina endógena de los cálculos, la concentración de creatinina es proporcional a la
intensidad del color rojo producido. El criterio de valoración del fin de la reacción se mide como la diferencia en la absorbancia
entre 550 nm y 600 nm.
Glucosa Las mediciones de la concentración de glucosa fueron introducidas por primera vez mediante métodos de reducción del cobre
(como Folin-Wu y Somogyi-Nelson).22,23,24
La falta de especificidad en las técnicas de reducción del cobre llevó al desarrollo de procedimientos cuantitativos con las enzimas hexoquinasa y glucosa oxidasa. La prueba de la glucosa de Abaxis es una
versión modificada del método de la hexoquinasa, que se propuso como la base para el método de referencia de la glucosa.25
La
reacción de glucosa con adenosina trifosfato (ATP), catalizada por hexoquinasa (HK), resulta en glucosa-6-fosfato (G-6-P) y adenosina difosfato (ADP). La glucosa-6-fosfato deshidrogenasa (G-6-PDH) cataliza la reacción de G-6-P en 6-fosfogluconato
y la reducción de nicotinamida adenina dinucleótido (NAD+) a NADH.
Hexoquinasa
Glucosa + ATP Glucosa-6-fosfato + ADP
Mg2+
G-6-PDH
G-6-P + NAD+
6-fosfogluconato + NADH + H+
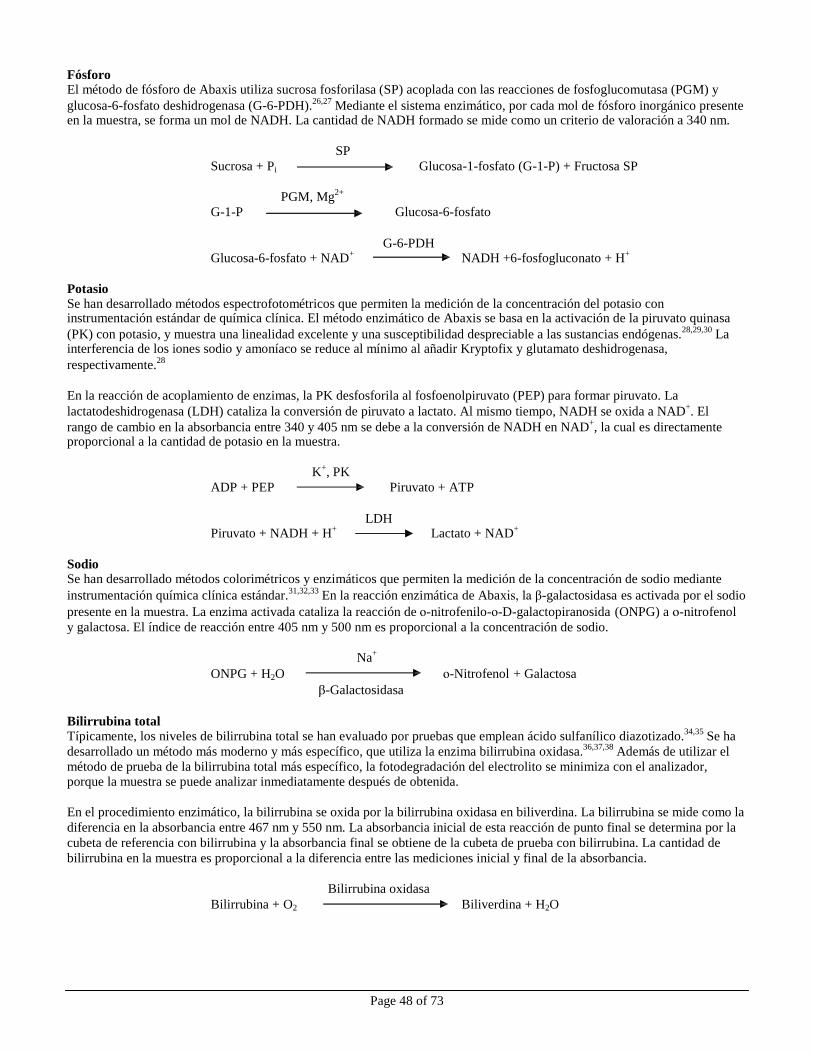
Page 48 of 73
Fósforo El método de fósforo de Abaxis utiliza sucrosa fosforilasa (SP) acoplada con las reacciones de fosfoglucomutasa (PGM) y
glucosa-6-fosfato deshidrogenasa (G-6-PDH).26,27
Mediante el sistema enzimático, por cada mol de fósforo inorgánico presente en la muestra, se forma un mol de NADH. La cantidad de NADH formado se mide como un criterio de valoración a 340 nm.
SP
Sucrosa + Pi Glucosa-1-fosfato (G-1-P) + Fructosa SP
PGM, Mg2+
G-1-P Glucosa-6-fosfato
G-6-PDH
Glucosa-6-fosfato + NAD+
NADH +6-fosfogluconato + H+
Potasio Se han desarrollado métodos espectrofotométricos que permiten la medición de la concentración del potasio con instrumentación estándar de química clínica. El método enzimático de Abaxis se basa en la activación de la piruvato quinasa
(PK) con potasio, y muestra una linealidad excelente y una susceptibilidad despreciable a las sustancias endógenas.28,29,30
La interferencia de los iones sodio y amoníaco se reduce al mínimo al añadir Kryptofix y glutamato deshidrogenasa,
respectivamente.28
En la reacción de acoplamiento de enzimas, la PK desfosforila al fosfoenolpiruvato (PEP) para formar piruvato. La
lactatodeshidrogenasa (LDH) cataliza la conversión de piruvato a lactato. Al mismo tiempo, NADH se oxida a NAD+. El
rango de cambio en la absorbancia entre 340 y 405 nm se debe a la conversión de NADH en NAD+, la cual es directamente
proporcional a la cantidad de potasio en la muestra.
K+, PK
ADP + PEP Piruvato + ATP
LDH
Piruvato + NADH + H+
Lactato + NAD+
Sodio Se han desarrollado métodos colorimétricos y enzimáticos que permiten la medición de la concentración de sodio mediante
instrumentación química clínica estándar.31,32,33
En la reacción enzimática de Abaxis, la β-galactosidasa es activada por el sodio
presente en la muestra. La enzima activada cataliza la reacción de ο-nitrofenilo-ο-D-galactopiranosida (ONPG) a ο-nitrofenol
y galactosa. El índice de reacción entre 405 nm y 500 nm es proporcional a la concentración de sodio.
Na+
ONPG + H2O ο-Nitrofenol + Galactosa
β-Galactosidasa
Bilirrubina total
Típicamente, los niveles de bilirrubina total se han evaluado por pruebas que emplean ácido sulfanílico diazotizado.34,35
Se ha
desarrollado un método más moderno y más específico, que utiliza la enzima bilirrubina oxidasa.36,37,38
Además de utilizar el
método de prueba de la bilirrubina total más específico, la fotodegradación del electrolito se minimiza con el analizador, porque la muestra se puede analizar inmediatamente después de obtenida.
En el procedimiento enzimático, la bilirrubina se oxida por la bilirrubina oxidasa en biliverdina. La bilirrubina se mide como la
diferencia en la absorbancia entre 467 nm y 550 nm. La absorbancia inicial de esta reacción de punto final se determina por la
cubeta de referencia con bilirrubina y la absorbancia final se obtiene de la cubeta de prueba con bilirrubina. La cantidad de
bilirrubina en la muestra es proporcional a la diferencia entre las mediciones inicial y final de la absorbancia.
Bilirrubina oxidasa
Bilirrubina + O2 Biliverdina + H2O
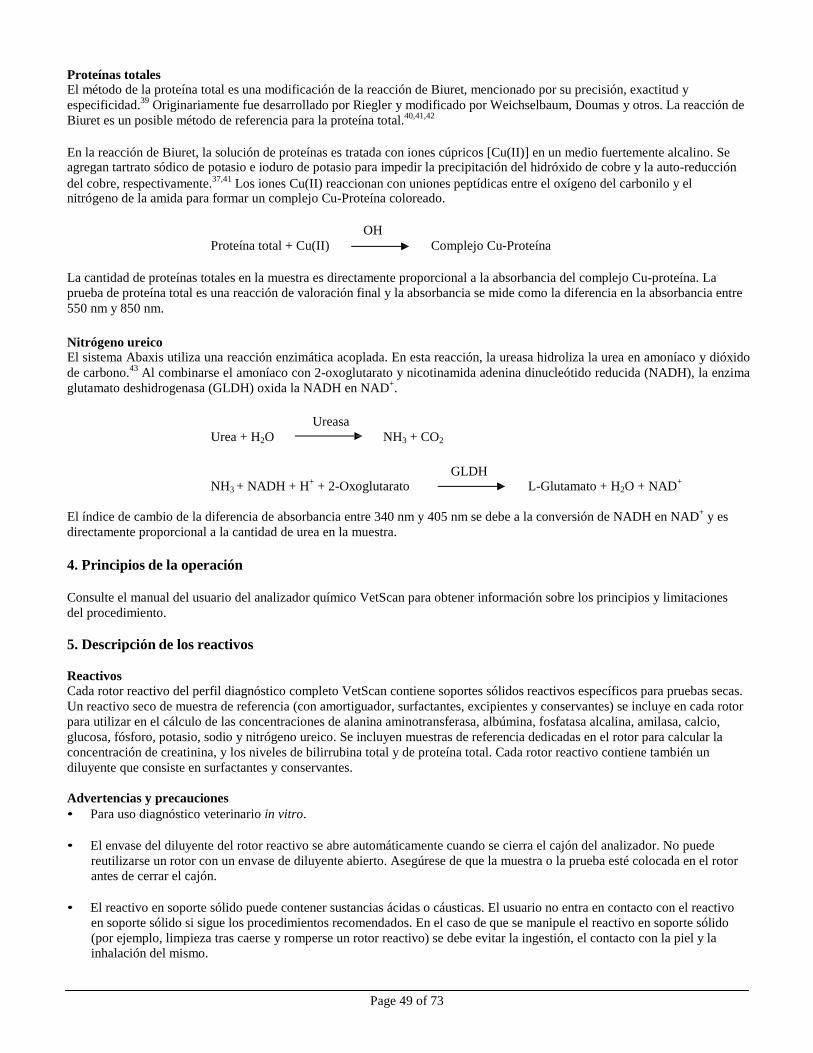
Page 49 of 73
Proteínas totales El método de la proteína total es una modificación de la reacción de Biuret, mencionado por su precisión, exactitud y
especificidad.39
Originariamente fue desarrollado por Riegler y modificado por Weichselbaum, Doumas y otros. La reacción de
Biuret es un posible método de referencia para la proteína total.40,41,42
En la reacción de Biuret, la solución de proteínas es tratada con iones cúpricos [Cu(II)] en un medio fuertemente alcalino. Se agregan tartrato sódico de potasio e ioduro de potasio para impedir la precipitación del hidróxido de cobre y la auto-reducción
del cobre, respectivamente.37,41
Los iones Cu(II) reaccionan con uniones peptídicas entre el oxígeno del carbonilo y el nitrógeno de la amida para formar un complejo Cu-Proteína coloreado.
OH
Proteína total + Cu(II) Complejo Cu-Proteína
La cantidad de proteínas totales en la muestra es directamente proporcional a la absorbancia del complejo Cu-proteína. La
prueba de proteína total es una reacción de valoración final y la absorbancia se mide como la diferencia en la absorbancia entre
550 nm y 850 nm.
Nitrógeno ureico El sistema Abaxis utiliza una reacción enzimática acoplada. En esta reacción, la ureasa hidroliza la urea en amoníaco y dióxido
de carbono.43
Al combinarse el amoníaco con 2-oxoglutarato y nicotinamida adenina dinucleótido reducida (NADH), la enzima
glutamato deshidrogenasa (GLDH) oxida la NADH en NAD+.
Ureasa
Urea + H2O NH3 + CO2
GLDH
NH3 + NADH + H+
+ 2-Oxoglutarato L-Glutamato + H2O + NAD+
El índice de cambio de la diferencia de absorbancia entre 340 nm y 405 nm se debe a la conversión de NADH en NAD
+ y es
directamente proporcional a la cantidad de urea en la muestra.
4. Principios de la operación
Consulte el manual del usuario del analizador químico VetScan para obtener información sobre los principios y limitaciones
del procedimiento.
5. Descripción de los reactivos
Reactivos Cada rotor reactivo del perfil diagnóstico completo VetScan contiene soportes sólidos reactivos específicos para pruebas secas.
Un reactivo seco de muestra de referencia (con amortiguador, surfactantes, excipientes y conservantes) se incluye en cada rotor
para utilizar en el cálculo de las concentraciones de alanina aminotransferasa, albúmina, fosfatasa alcalina, amilasa, calcio,
glucosa, fósforo, potasio, sodio y nitrógeno ureico. Se incluyen muestras de referencia dedicadas en el rotor para calcular la
concentración de creatinina, y los niveles de bilirrubina total y de proteína total. Cada rotor reactivo contiene también un
diluyente que consiste en surfactantes y conservantes.
Advertencias y precauciones
• Para uso diagnóstico veterinario in vitro.
• El envase del diluyente del rotor reactivo se abre automáticamente cuando se cierra el cajón del analizador. No puede
reutilizarse un rotor con un envase de diluyente abierto. Asegúrese de que la muestra o la prueba esté colocada en el rotor
antes de cerrar el cajón.
• El reactivo en soporte sólido puede contener sustancias ácidas o cáusticas. El usuario no entra en contacto con el reactivo
en soporte sólido si sigue los procedimientos recomendados. En el caso de que se manipule el reactivo en soporte sólido
(por ejemplo, limpieza tras caerse y romperse un rotor reactivo) se debe evitar la ingestión, el contacto con la piel y la
inhalación del mismo.
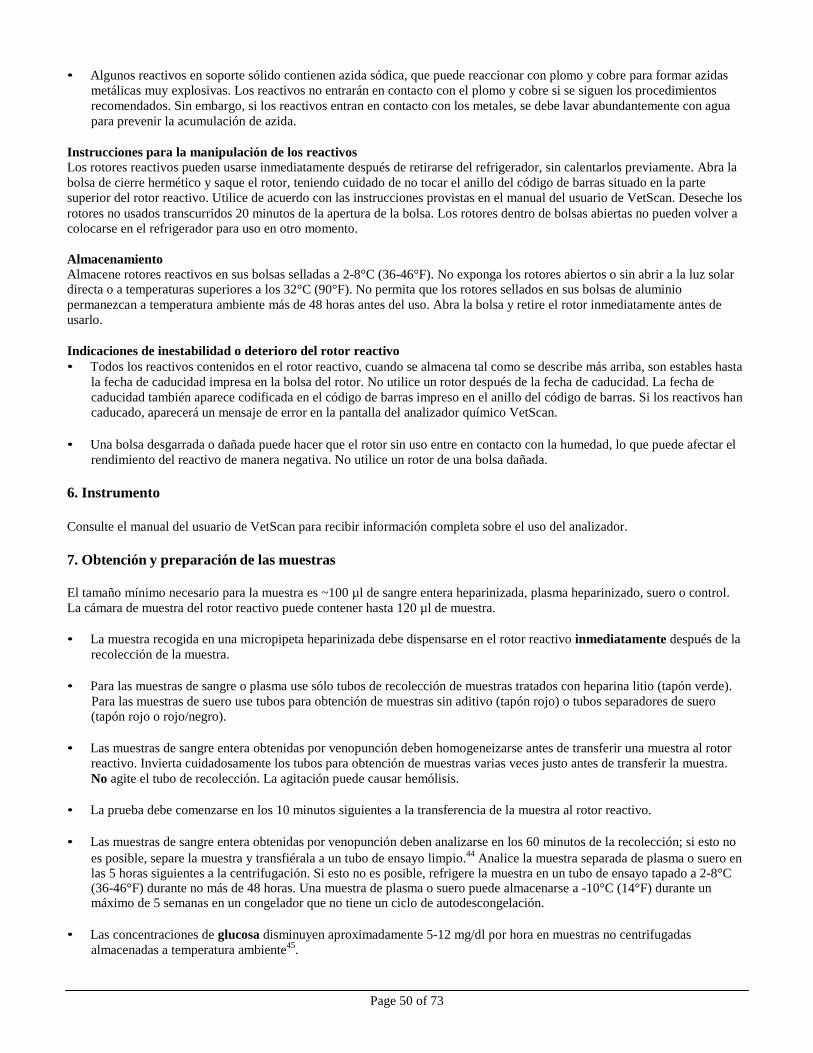
Page 50 of 73
• Algunos reactivos en soporte sólido contienen azida sódica, que puede reaccionar con plomo y cobre para formar azidas
metálicas muy explosivas. Los reactivos no entrarán en contacto con el plomo y cobre si se siguen los procedimientos
recomendados. Sin embargo, si los reactivos entran en contacto con los metales, se debe lavar abundantemente con agua
para prevenir la acumulación de azida.
Instrucciones para la manipulación de los reactivos Los rotores reactivos pueden usarse inmediatamente después de retirarse del refrigerador, sin calentarlos previamente. Abra la
bolsa de cierre hermético y saque el rotor, teniendo cuidado de no tocar el anillo del código de barras situado en la parte
superior del rotor reactivo. Utilice de acuerdo con las instrucciones provistas en el manual del usuario de VetScan. Deseche los
rotores no usados transcurridos 20 minutos de la apertura de la bolsa. Los rotores dentro de bolsas abiertas no pueden volver a
colocarse en el refrigerador para uso en otro momento.
Almacenamiento Almacene rotores reactivos en sus bolsas selladas a 2-8°C (36-46°F). No exponga los rotores abiertos o sin abrir a la luz solar directa o a temperaturas superiores a los 32°C (90°F). No permita que los rotores sellados en sus bolsas de aluminio
permanezcan a temperatura ambiente más de 48 horas antes del uso. Abra la bolsa y retire el rotor inmediatamente antes de
usarlo.
Indicaciones de inestabilidad o deterioro del rotor reactivo
• Todos los reactivos contenidos en el rotor reactivo, cuando se almacena tal como se describe más arriba, son estables hasta
la fecha de caducidad impresa en la bolsa del rotor. No utilice un rotor después de la fecha de caducidad. La fecha de
caducidad también aparece codificada en el código de barras impreso en el anillo del código de barras. Si los reactivos han
caducado, aparecerá un mensaje de error en la pantalla del analizador químico VetScan.
• Una bolsa desgarrada o dañada puede hacer que el rotor sin uso entre en contacto con la humedad, lo que puede afectar el
rendimiento del reactivo de manera negativa. No utilice un rotor de una bolsa dañada.
6. Instrumento
Consulte el manual del usuario de VetScan para recibir información completa sobre el uso del analizador.
7. Obtención y preparación de las muestras
El tamaño mínimo necesario para la muestra es ~100 µl de sangre entera heparinizada, plasma heparinizado, suero o control.
La cámara de muestra del rotor reactivo puede contener hasta 120 µl de muestra.
• La muestra recogida en una micropipeta heparinizada debe dispensarse en el rotor reactivo inmediatamente después de la
recolección de la muestra.
• Para las muestras de sangre o plasma use sólo tubos de recolección de muestras tratados con heparina litio (tapón verde).
Para las muestras de suero use tubos para obtención de muestras sin aditivo (tapón rojo) o tubos separadores de suero
(tapón rojo o rojo/negro).
• Las muestras de sangre entera obtenidas por venopunción deben homogeneizarse antes de transferir una muestra al rotor
reactivo. Invierta cuidadosamente los tubos para obtención de muestras varias veces justo antes de transferir la muestra.
No agite el tubo de recolección. La agitación puede causar hemólisis.
• La prueba debe comenzarse en los 10 minutos siguientes a la transferencia de la muestra al rotor reactivo.
• Las muestras de sangre entera obtenidas por venopunción deben analizarse en los 60 minutos de la recolección; si esto no
es posible, separe la muestra y transfiérala a un tubo de ensayo limpio.44
Analice la muestra separada de plasma o suero en las 5 horas siguientes a la centrifugación. Si esto no es posible, refrigere la muestra en un tubo de ensayo tapado a 2-8°C (36-46°F) durante no más de 48 horas. Una muestra de plasma o suero puede almacenarse a -10°C (14°F) durante un máximo de 5 semanas en un congelador que no tiene un ciclo de autodescongelación.
• Las concentraciones de glucosa disminuyen aproximadamente 5-12 mg/dl por hora en muestras no centrifugadas
almacenadas a temperatura ambiente45
.
Page 51 of 73
• Las muestras de sangre entera refrigerada pueden causar cambios significativos en las concentraciones de glucosa y
creatinina.46
• Los resultados de la bilirrubina total pueden verse afectados de manera negativa por la fotodegradación.
47 Las muestras
de sangre entera que no sean analizadas de inmediato deben ser almacenadas en la oscuridad por períodos que no excedan los 60 minutos. Si la muestra no puede ser analizada dentro de ese período, se la debe separar en plasma o suero, y
almacenar en un tubo de muestra con tapa en la oscuridad a bajas temperaturas.48
Sustancias conocidas como interferencias
• El único anticoagulante recomendado para uso con el analizador químico VetScan es heparina de litio. No debe usarse
heparina sódica durante la recolección de muestras de sangre para ser utilizadas con este panel. Abaxis realizó estudios que
demuestran que el EDTA, fluoruro, oxalato y cualquier anticoagulante con iones de amoníaco interferirán con por lo
menos un producto químico del rotor reactivo del perfil diagnóstico completo VetScan.
• Los interferentes físicos (hemólisis, ictericia y lipidemia) pueden causar cambios en las concentraciones informadas de
algunos analitos. Los índices de la muestra son impresos en la base de cada tarjeta de resultados para informar al usuario
sobre los niveles de factores de interferencia presentes en cada muestra. El analizador químico VetScan suprime cualquier
resultado que sea afectado por más del 10% de interferencia por hemólisis, lipidemia o ictericia. “HEM”, “LIP” o “ICT” se
imprime en la tarjeta de resultado en vez del resultado.
• La hemólisis puede provocar resultados erróneamente elevados en las pruebas de potasio. Este problema puede pasar
desapercibido cuando se analiza sangre entera (la liberación de potasio de apenas 0,5 % de los eritrocitos puede provocar aumentos en el nivel sérico del potasio de 0,5 mmol/l). En particular, incluso las muestras no hemolizadas que no se
procesan correctamente pueden tener mayores niveles de potasio debido a la filtración de potasio intracelular.49
• La bilirrubina puede interferir con la peroxosidasa utilizada en la reacción de la creatinina.
50 Los resultados de la creatinina
disminuyen cuando los niveles de bilirrubina son superiores a 10 mg/dl.
• Las concentraciones de glucosa se ven afectadas por el plazo transcurrido entre el momento en el que el paciente ingirió
alimentos y el tipo de muestra obtenida del paciente. Para interpretar con precisión los resultados de la glucosa, se deben
obtener las muestras de un paciente que haya estado en ayunas durante un mínimo de 12 horas.51
• Cuando se analizan muestras con un índice lipidémico 3+ se puede ver interferencia en la prueba de proteína total.
52 Las
muestras con una concentración de triglicéridos superior a 400 mg/dl pueden mostrar un nivel mayor de proteína total.48
El analizador químico VetScan elimina todos los resultados que sufren una interferencia por parte de la lipidemia superior al
10%. En lugar del resultado, en la tarjeta de resultados se imprime “LIP”.
• La prueba de potasio del sistema VetScan es un ensayo de piruvato quinasa (PK) / lactatodeshidrogenasa (LDH)
acoplados. Por tanto, en casos de trauma muscular extremo o niveles muy elevados de creatina quinasa (CK), el VetScan
puede recuperar un valor de potasio (K+) falsamente elevado. En casos como éste, los valores de recuperación de potasio
inesperadamente altos deben confirmarse con otra metodología.
8. Procedimiento
Materiales suministrados
• Un rotor reactivo del perfil diagnóstico completo VetScan
Materiales necesarios pero no suministrados
• Analizador químico VetScan
Parámetros de prueba
El sistema VetScan opera a temperaturas ambientes entre 15°C y 32°C (59-90°F). El tiempo de análisis para cada rotor reactivo
del perfil diagnóstico completo VetScan es de menos de 14 minutos. El analizador mantiene el rotor reactivo a una temperatura de 37°C (98,6°F) durante el intervalo de medición.
Procedimiento de prueba La recolección completa de la muestra y los procedimientos paso por paso se detallan en el manual del usuario de VetScan.
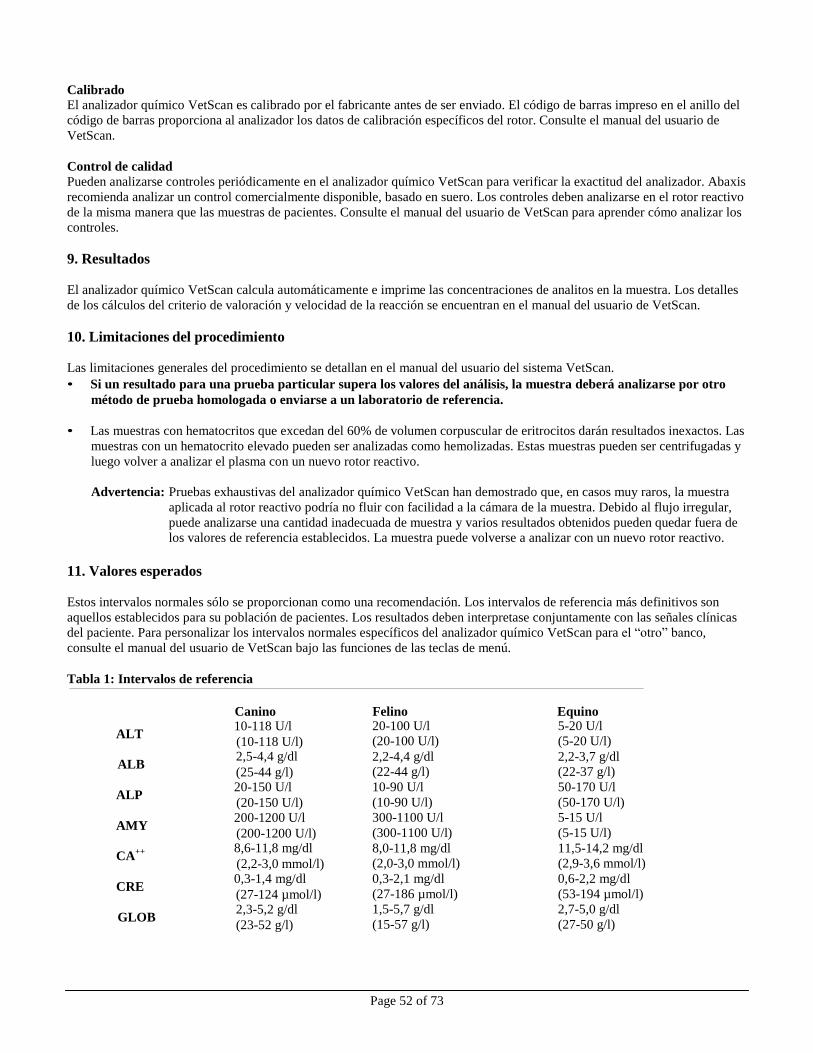
Page 52 of 73
Calibrado El analizador químico VetScan es calibrado por el fabricante antes de ser enviado. El código de barras impreso en el anillo del
código de barras proporciona al analizador los datos de calibración específicos del rotor. Consulte el manual del usuario de
VetScan.
Control de calidad
Pueden analizarse controles periódicamente en el analizador químico VetScan para verificar la exactitud del analizador. Abaxis
recomienda analizar un control comercialmente disponible, basado en suero. Los controles deben analizarse en el rotor reactivo
de la misma manera que las muestras de pacientes. Consulte el manual del usuario de VetScan para aprender cómo analizar los
controles.
9. Resultados
El analizador químico VetScan calcula automáticamente e imprime las concentraciones de analitos en la muestra. Los detalles
de los cálculos del criterio de valoración y velocidad de la reacción se encuentran en el manual del usuario de VetScan.
10. Limitaciones del procedimiento
Las limitaciones generales del procedimiento se detallan en el manual del usuario del sistema VetScan.
• Si un resultado para una prueba particular supera los valores del análisis, la muestra deberá analizarse por otro
método de prueba homologada o enviarse a un laboratorio de referencia.
• Las muestras con hematocritos que excedan del 60% de volumen corpuscular de eritrocitos darán resultados inexactos. Las
muestras con un hematocrito elevado pueden ser analizadas como hemolizadas. Estas muestras pueden ser centrifugadas y
luego volver a analizar el plasma con un nuevo rotor reactivo.
Advertencia: Pruebas exhaustivas del analizador químico VetScan han demostrado que, en casos muy raros, la muestra
aplicada al rotor reactivo podría no fluir con facilidad a la cámara de la muestra. Debido al flujo irregular,
puede analizarse una cantidad inadecuada de muestra y varios resultados obtenidos pueden quedar fuera de
los valores de referencia establecidos. La muestra puede volverse a analizar con un nuevo rotor reactivo.
11. Valores esperados
Estos intervalos normales sólo se proporcionan como una recomendación. Los intervalos de referencia más definitivos son
aquellos establecidos para su población de pacientes. Los resultados deben interpretase conjuntamente con las señales clínicas
del paciente. Para personalizar los intervalos normales específicos del analizador químico VetScan para el “otro” banco,
consulte el manual del usuario de VetScan bajo las funciones de las teclas de menú.
Tabla 1: Intervalos de referencia
Canino Felino Equino
ALT 10-118 U/l (10-118 U/l)
ALB 2,5-4,4 g/dl (25-44 g/l)
ALP 20-150 U/l (20-150 U/l)
AMY 200-1200 U/l (200-1200 U/l)
CA++ 8,6-11,8 mg/dl
(2,2-3,0 mmol/l)
CRE 0,3-1,4 mg/dl (27-124 µmol/l)
GLOB 2,3-5,2 g/dl (23-52 g/l)
20-100 U/l
(20-100 U/l)
2,2-4,4 g/dl
(22-44 g/l)
10-90 U/l
(10-90 U/l)
300-1100 U/l
(300-1100 U/l)
8,0-11,8 mg/dl
(2,0-3,0 mmol/l)
0,3-2,1 mg/dl
(27-186 µmol/l)
1,5-5,7 g/dl
(15-57 g/l)
5-20 U/l
(5-20 U/l)
2,2-3,7 g/dl
(22-37 g/l)
50-170 U/l
(50-170 U/l)
5-15 U/l
(5-15 U/l)
11,5-14,2 mg/dl
(2,9-3,6 mmol/l)
0,6-2,2 mg/dl
(53-194 µmol/l)
2,7-5,0 g/dl
(27-50 g/l)
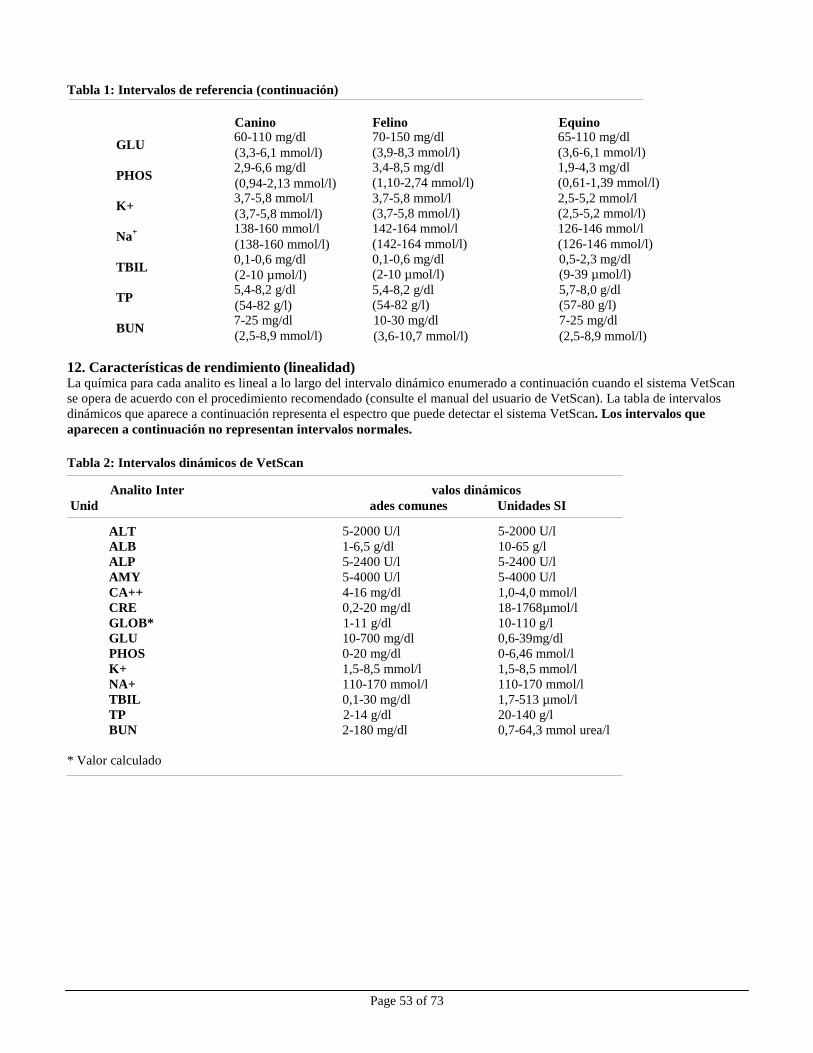
Page 53 of 73
Tabla 1: Intervalos de referencia (continuación)
Canino Felino Equino
GLU 60-110 mg/dl (3,3-6,1 mmol/l)
PHOS 2,9-6,6 mg/dl (0,94-2,13 mmol/l)
K+ 3,7-5,8 mmol/l (3,7-5,8 mmol/l)
Na+ 138-160 mmol/l
(138-160 mmol/l)
TBIL 0,1-0,6 mg/dl (2-10 µmol/l)
TP 5,4-8,2 g/dl (54-82 g/l)
BUN 7-25 mg/dl (2,5-8,9 mmol/l)
70-150 mg/dl
(3,9-8,3 mmol/l) 3,4-8,5 mg/dl
(1,10-2,74 mmol/l)
3,7-5,8 mmol/l
(3,7-5,8 mmol/l)
142-164 mmol/l
(142-164 mmol/l)
0,1-0,6 mg/dl
(2-10 µmol/l)
5,4-8,2 g/dl
(54-82 g/l)
10-30 mg/dl
(3,6-10,7 mmol/l)
65-110 mg/dl
(3,6-6,1 mmol/l) 1,9-4,3 mg/dl
(0,61-1,39 mmol/l)
2,5-5,2 mmol/l
(2,5-5,2 mmol/l)
126-146 mmol/l
(126-146 mmol/l)
0,5-2,3 mg/dl
(9-39 µmol/l)
5,7-8,0 g/dl
(57-80 g/l)
7-25 mg/dl
(2,5-8,9 mmol/l)
12. Características de rendimiento (linealidad) La química para cada analito es lineal a lo largo del intervalo dinámico enumerado a continuación cuando el sistema VetScan
se opera de acuerdo con el procedimiento recomendado (consulte el manual del usuario de VetScan). La tabla de intervalos
dinámicos que aparece a continuación representa el espectro que puede detectar el sistema VetScan. Los intervalos que
aparecen a continuación no representan intervalos normales.
Tabla 2: Intervalos dinámicos de VetScan
Analito Inter valos dinámicos
Unid ades comunes Unidades SI
ALT 5-2000 U/l 5-2000 U/l
ALB 1-6,5 g/dl 10-65 g/l
ALP 5-2400 U/l 5-2400 U/l
AMY 5-4000 U/l 5-4000 U/l
CA++ 4-16 mg/dl 1,0-4,0 mmol/l
CRE 0,2-20 mg/dl 18-1768µmol/l
GLOB* 1-11 g/dl 10-110 g/l
GLU 10-700 mg/dl 0,6-39mg/dl
PHOS 0-20 mg/dl 0-6,46 mmol/l
K+ 1,5-8,5 mmol/l 1,5-8,5 mmol/l
NA+ 110-170 mmol/l 110-170 mmol/l
TBIL 0,1-30 mg/dl 1,7-513 µmol/l
TP 2-14 g/dl 20-140 g/l
BUN 2-180 mg/dl 0,7-64,3 mmol urea/l
* Valor calculado
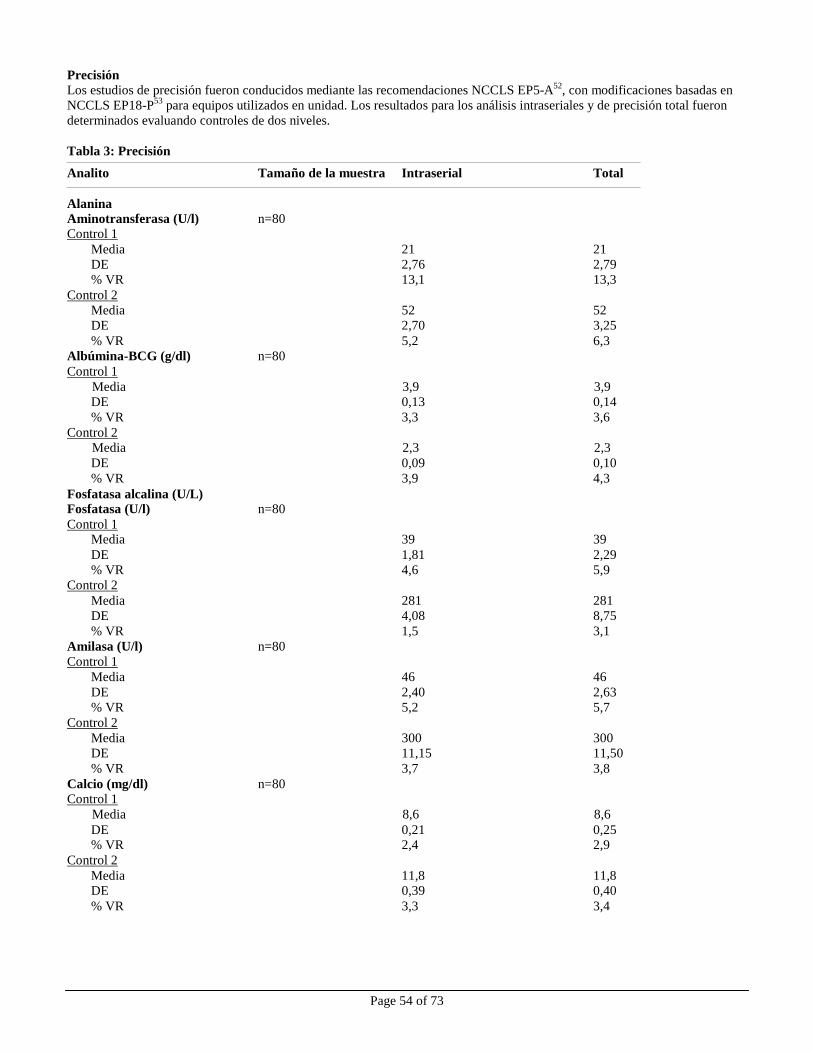
Page 54 of 73
Precisión
Los estudios de precisión fueron conducidos mediante las recomendaciones NCCLS EP5-A52, con modificaciones basadas en
NCCLS EP18-P53
para equipos utilizados en unidad. Los resultados para los análisis intraseriales y de precisión total fueron
determinados evaluando controles de dos niveles.
Tabla 3: Precisión
Analito Tamaño de la muestra Intraserial Total
Alanina Aminotransferasa (U/l) n=80 Control 1
Media 21 21
DE 2,76 2,79
% VR 13,1 13,3
Control 2
Media 52 52
DE 2,70 3,25
% VR 5,2 6,3
Albúmina-BCG (g/dl) n=80
Control 1
Media 3,9 3,9
DE 0,13 0,14
% VR 3,3 3,6
Control 2
Media 2,3 2,3
DE 0,09 0,10
% VR 3,9 4,3
Fosfatasa alcalina (U/L) Fosfatasa (U/l) n=80
Control 1 Media 39 39
DE 1,81 2,29
% VR 4,6 5,9
Control 2
Media 281 281
DE 4,08 8,75
% VR 1,5 3,1
Amilasa (U/l) n=80
Control 1
Media 46 46
DE 2,40 2,63
% VR 5,2 5,7
Control 2
Media 300 300
DE 11,15 11,50
% VR 3,7 3,8
Calcio (mg/dl) n=80 Control 1
Media 8,6 8,6
DE 0,21 0,25 % VR 2,4 2,9
Control 2
Media 11,8 11,8 DE 0,39 0,40
% VR 3,3 3,4
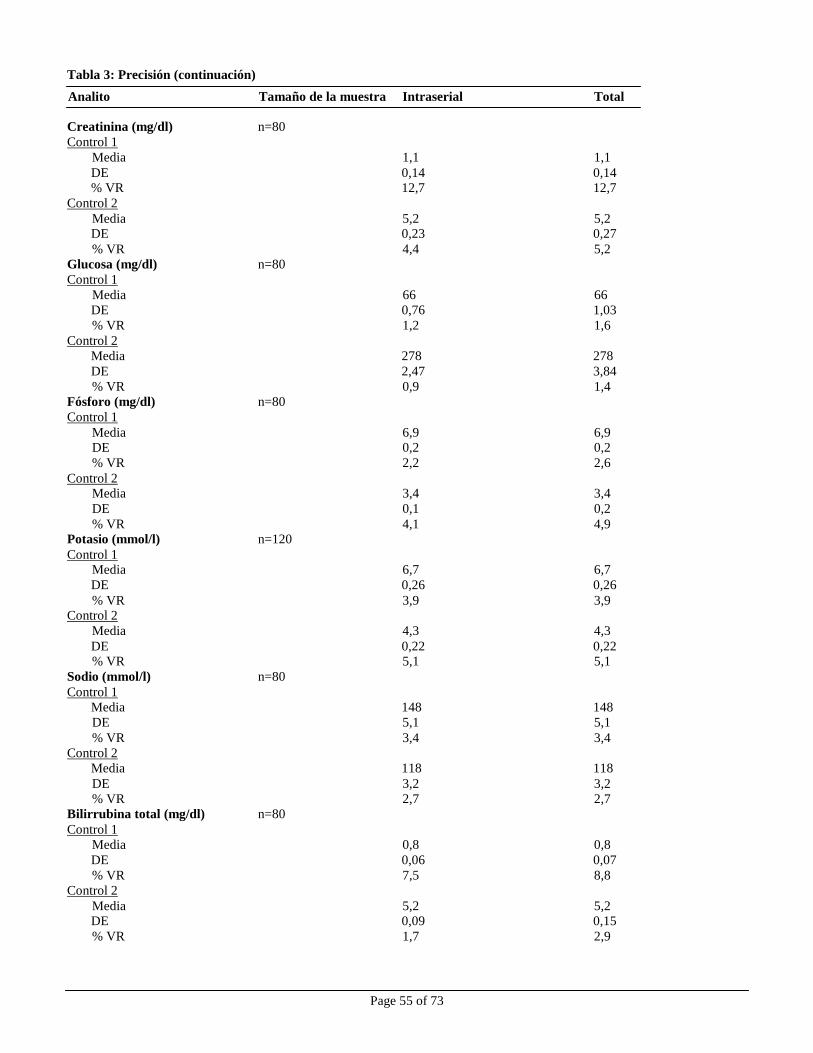
Page 55 of 73
Tabla 3: Precisión (continuación)
Analito Tamaño de la muestra Intraserial Total
Creatinina (mg/dl) n=80
Control 1
Media 1,1 1,1
DE 0,14 0,14 % VR 12,7 12,7
Control 2
Media 5,2 5,2 DE 0,23 0,27
% VR 4,4 5,2
Glucosa (mg/dl) n=80
Control 1
Media 66 66
DE 0,76 1,03
% VR 1,2 1,6
Control 2
Media 278 278
DE 2,47 3,84
% VR 0,9 1,4
Fósforo (mg/dl) n=80
Control 1
Media 6,9 6,9 DE 0,2 0,2
% VR 2,2 2,6
Control 2 Media 3,4 3,4
DE 0,1 0,2
% VR 4,1 4,9 Potasio (mmol/l) n=120
Control 1 Media 6,7 6,7
DE 0,26 0,26
% VR 3,9 3,9 Control 2
Media 4,3 4,3
DE 0,22 0,22 % VR 5,1 5,1
Sodio (mmol/l) n=80
Control 1
Media 148 148
DE 5,1 5,1
% VR 3,4 3,4
Control 2
Media 118 118
DE 3,2 3,2
% VR 2,7 2,7
Bilirrubina total (mg/dl) n=80
Control 1
Media 0,8 0,8
DE 0,06 0,07
% VR 7,5 8,8
Control 2
Media 5,2 5,2 DE 0,09 0,15
% VR 1,7 2,9
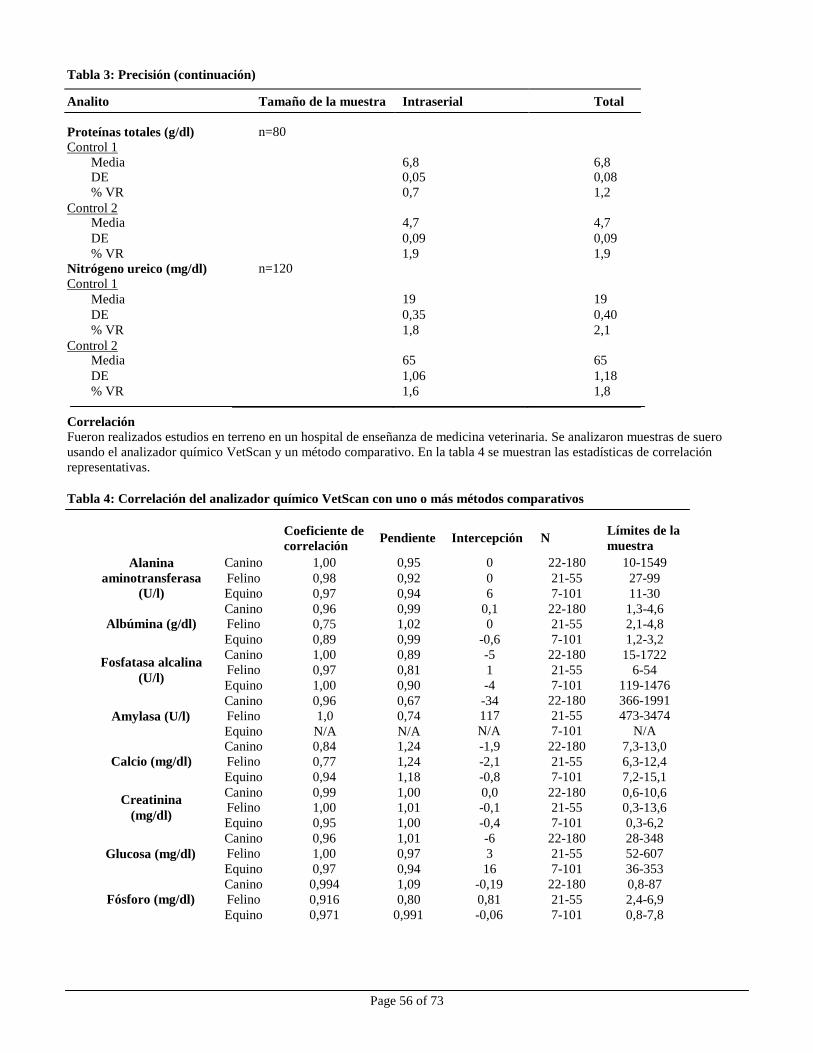
Page 56 of 73
Tabla 3: Precisión (continuación)
Analito Tamaño de la muestra Intraserial Total
Proteínas totales (g/dl) Control 1
Media
n=80
6,8
6,8 DE 0,05 0,08
% VR 0,7 1,2
Media
4,7
4,7
DE 0,09 0,09
% VR
Nitrógeno ureico (mg/dl) Control 1
Media
n=120
1,9
19
1,9
19
DE 0,35 0,40
% VR 1,8 2,1
Media
65
65
DE 1,06 1,18
% VR 1,6 1,8
Canino 1,00 0,95 0 22-180 10-1549
Felino 0,98 0,92 0 21-55 27-99
Equino 0,97 0,94 6 7-101 11-30
Canino 0,96 0,99 0,1 22-180 1,3-4,6 Felino 0,75 1,02 0 21-55 2,1-4,8
Equino 0,89 0,99 -0,6 7-101 1,2-3,2
Canino 1,00 0,89 -5 22-180 15-1722 Felino 0,97 0,81 1 21-55 6-54
Equino 1,00 0,90 -4 7-101 119-1476
Canino 0,96 0,67 -34 22-180 366-1991
Felino 1,0 0,74 117 21-55 473-3474
Equino N/A N/A N/A 7-101 N/A
Canino 0,84 1,24 -1,9 22-180 7,3-13,0
Felino 0,77 1,24 -2,1 21-55 6,3-12,4
Equino 0,94 1,18 -0,8 7-101 7,2-15,1
Canino 0,99 1,00 0,0 22-180 0,6-10,6 Felino 1,00 1,01 -0,1 21-55 0,3-13,6
Equino 0,95 1,00 -0,4 7-101 0,3-6,2
Canino 0,96 1,01 -6 22-180 28-348
Felino 1,00 0,97 3 21-55 52-607
Equino 0,97 0,94 16 7-101 36-353
Canino 0,994 1,09 -0,19 22-180 0,8-87
Felino 0,916 0,80 0,81 21-55 2,4-6,9
Equino 0,971 0,991 -0,06 7-101 0,8-7,8
Control 2
Control 2
Correlación Fueron realizados estudios en terreno en un hospital de enseñanza de medicina veterinaria. Se analizaron muestras de suero
usando el analizador químico VetScan y un método comparativo. En la tabla 4 se muestran las estadísticas de correlación
representativas.
Tabla 4: Correlación del analizador químico VetScan con uno o más métodos comparativos
Alanina
aminotransferasa
(U/l)
Coeficiente de
correlación Pendiente Intercepción N
Límites de la
muestra
Albúmina (g/dl)
Fosfatasa alcalina
(U/l)
Amylasa (U/l)
Calcio (mg/dl)
Creatinina
(mg/dl)
Glucosa (mg/dl)
Fósforo (mg/dl)
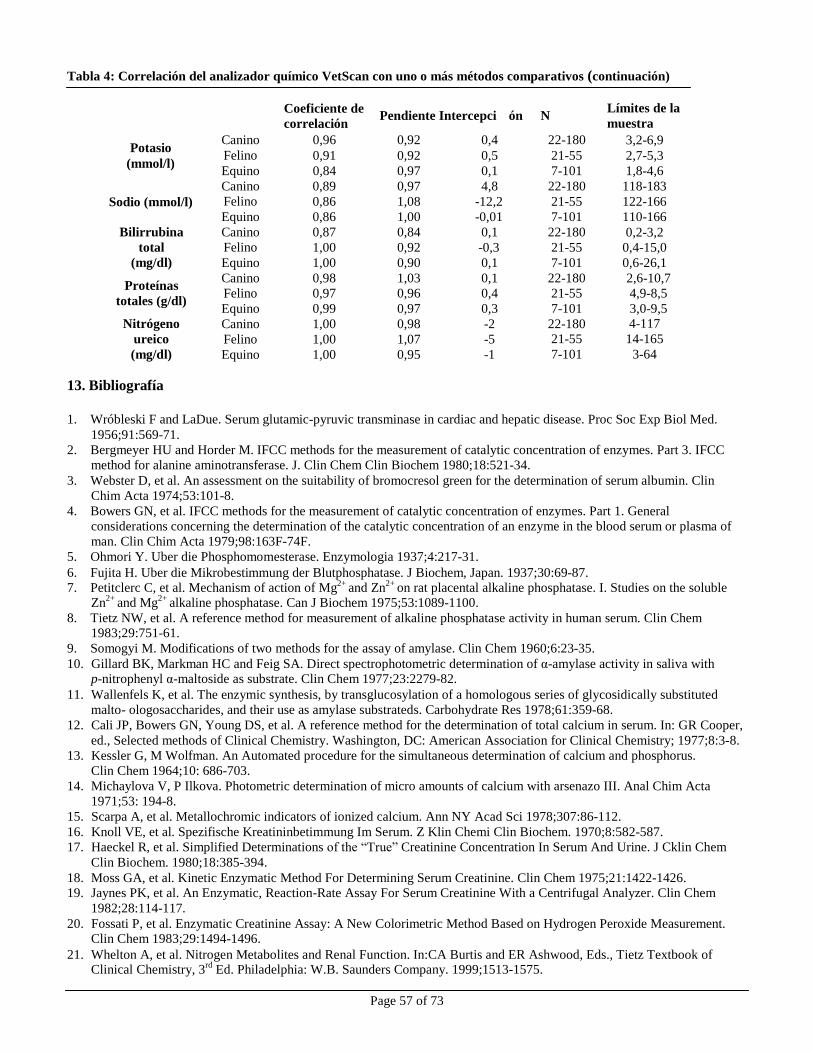
Page 57 of 73
Canino 0,96 0,92 0,4 22-180 3,2-6,9
Felino 0,91 0,92 0,5 21-55 2,7-5,3
Equino 0,84 0,97 0,1 7-101 1,8-4,6
Canino 0,89 0,97 4,8 22-180 118-183
Felino 0,86 1,08 -12,2 21-55 122-166
Equino 0,86 1,00 -0,01 7-101 110-166
Canino 0,87 0,84 0,1 22-180 0,2-3,2 Felino 1,00 0,92 -0,3 21-55 0,4-15,0
Equino 1,00 0,90 0,1 7-101 0,6-26,1
Canino 0,98 1,03 0,1 22-180 2,6-10,7
Felino 0,97 0,96 0,4 21-55 4,9-8,5
Equino 0,99 0,97 0,3 7-101 3,0-9,5
Canino 1,00 0,98 -2 22-180 4-117
Felino 1,00 1,07 -5 21-55 14-165
Equino 1,00 0,95 -1 7-101 3-64
Tabla 4: Correlación del analizador químico VetScan con uno o más métodos comparativos (continuación)
Potasio
(mmol/l)
Coeficiente de
correlación Pendiente Intercepci ón N
Límites de la
muestra
Sodio (mmol/l)
Bilirrubina
total
(mg/dl)
Proteínas
totales (g/dl)
Nitrógeno
ureico
(mg/dl)
13. Bibliografía
1. Wróbleski F and LaDue. Serum glutamic-pyruvic transminase in cardiac and hepatic disease. Proc Soc Exp Biol Med.
1956;91:569-71.
2. Bergmeyer HU and Horder M. IFCC methods for the measurement of catalytic concentration of enzymes. Part 3. IFCC
method for alanine aminotransferase. J. Clin Chem Clin Biochem 1980;18:521-34.
3. Webster D, et al. An assessment on the suitability of bromocresol green for the determination of serum albumin. Clin
Chim Acta 1974;53:101-8.
4. Bowers GN, et al. IFCC methods for the measurement of catalytic concentration of enzymes. Part 1. General
considerations concerning the determination of the catalytic concentration of an enzyme in the blood serum or plasma of
man. Clin Chim Acta 1979;98:163F-74F.
5. Ohmori Y. Uber die Phosphomomesterase. Enzymologia 1937;4:217-31.
6. Fujita H. Uber die Mikrobestimmung der Blutphosphatase. J Biochem, Japan. 1937;30:69-87.
7. Petitclerc C, et al. Mechanism of action of Mg2+ and Zn2+ on rat placental alkaline phosphatase. I. Studies on the soluble
Zn2+
and Mg2+
alkaline phosphatase. Can J Biochem 1975;53:1089-1100.
8. Tietz NW, et al. A reference method for measurement of alkaline phosphatase activity in human serum. Clin Chem 1983;29:751-61.
9. Somogyi M. Modifications of two methods for the assay of amylase. Clin Chem 1960;6:23-35.
10. Gillard BK, Markman HC and Feig SA. Direct spectrophotometric determination of α-amylase activity in saliva with p-nitrophenyl α-maltoside as substrate. Clin Chem 1977;23:2279-82.
11. Wallenfels K, et al. The enzymic synthesis, by transglucosylation of a homologous series of glycosidically substituted
malto- ologosaccharides, and their use as amylase substrateds. Carbohydrate Res 1978;61:359-68.
12. Cali JP, Bowers GN, Young DS, et al. A reference method for the determination of total calcium in serum. In: GR Cooper,
ed., Selected methods of Clinical Chemistry. Washington, DC: American Association for Clinical Chemistry; 1977;8:3-8.
13. Kessler G, M Wolfman. An Automated procedure for the simultaneous determination of calcium and phosphorus.
Clin Chem 1964;10: 686-703.
14. Michaylova V, P Ilkova. Photometric determination of micro amounts of calcium with arsenazo III. Anal Chim Acta
1971;53: 194-8.
15. Scarpa A, et al. Metallochromic indicators of ionized calcium. Ann NY Acad Sci 1978;307:86-112.
16. Knoll VE, et al. Spezifische Kreatininbetimmung Im Serum. Z Klin Chemi Clin Biochem. 1970;8:582-587.
17. Haeckel R, et al. Simplified Determinations of the “True” Creatinine Concentration In Serum And Urine. J Cklin Chem
Clin Biochem. 1980;18:385-394.
18. Moss GA, et al. Kinetic Enzymatic Method For Determining Serum Creatinine. Clin Chem 1975;21:1422-1426. 19. Jaynes PK, et al. An Enzymatic, Reaction-Rate Assay For Serum Creatinine With a Centrifugal Analyzer. Clin Chem
1982;28:114-117.
20. Fossati P, et al. Enzymatic Creatinine Assay: A New Colorimetric Method Based on Hydrogen Peroxide Measurement. Clin Chem 1983;29:1494-1496.
21. Whelton A, et al. Nitrogen Metabolites and Renal Function. In:CA Burtis and ER Ashwood, Eds., Tietz Textbook of
Clinical Chemistry, 3rd
Ed. Philadelphia: W.B. Saunders Company. 1999;1513-1575.
Page 58 of 73
13. Bibliografía (continuación)
22. Folin O, and Wu H. A System of blood analysis. J Biol Chem 1919;38: 81-110.
23. Somogyi M. A reagent for the copper-idiometric determination of very small amounts of sugar. J Biol Chem
1937;117: 771-776.
24. Nelson N. A photometric adaption of the Somogyi method for the determination of glucose. J Biol 1944; 153: 375-380.
25. Kaplan LA. Glucose. In:LA Kaplan and AJ Pesce, eds., Clinical Chemistry: Theory, Analysis, and Correlation,
2nd
ed St. Louis: The C.V. Mosby Company; 1989;850-856.
26. Schulz DW, et al. An Enzymic Method for the Measurement of Inorganic Phosphate Determination Anal Biochem
1967;19:300-14.
27. Tedokon, M Suzuki, et al. Enzymatic Assay of Inorganic Phosphate with Use of Sucrose Phosphorylase and
Phosphoglucomutase. Clin Chem 1992;38:512-5.
28. Berry MN, et al. Enzymatic determination of potassium in serum. Clin Chem 1989;35:817-20.
29. Van Pelt J. Enzymatic determination of sodium, potassium and chloride in serum compared with determination by flame
photometry, coulometry and ion selective electrodes. Clin Chem 1994;40:846-7.
30. Hubl W, et al. Enzymatic determination of sodium, potassium and chloride in abnormal (hemolyzed, icteric, lipemic,
paraprteinemic, or uremic) serum samples compared with indirect determination with ion selective electrodes. Clin Chem
1994;40:1528-31.
31. Helgerson RC, et al. Host-guest Complexation. 50. Potassium and sodium ion-selective chromogenic ionophores.
J Amer Chem Soc 1989;111:6339-50.
32. Kumar A, et al. Chromogenic ionophere-based methods for spectrophotometric assay of sodium and potassium in serum
and plasma. Clin Chem 1988;34:1709-12.
33. Berry MN, et al. Enzymatic determination of sodium in serum. Clin Chem 1988;34:2295-8.
34. Malloy HT, and Evelyn KA. The determination of bilirubin with the photoelectric colorimeter. J biol Chem 1937;
119:481-90. 35. Meites S. Bilirubin, directing reacting and total, modified Mally-Evelyn method. In: WR Faulkner and S Meites, eds.,
Selected Methods of Clinical Chemistry, Washington, DC: American Association for Clinical Chemistry; 1982;9:119-24.
36. Murao S and Tanaka N. A new enzyme “bilirubin oxidase” produced by Myrothecium verrucaria MT-1. Agric Biol Chem 1981;45:2383-4.
37. Osaki, S and S Anderson. Enzymatic determination of bilirubin. Clin Chem 1982;30:971. (Abstract)
38. Perry B, et al. Measurement of total bilirubin by use of bilirubin oxidase. Clin Chem 1986;32:329-32.
39. Koller A and Kaplan LA. Total serum protein. In: LA Kaplan and AJ Pesce, eds., Clinical Chemistry: Theory, Analysis,
and Correlation, 2nd
ed. St Louis: The C.V. Mosby Company; 1989:1057-60.
40. Reigler E. Eine kolorimetrische Bestimmungsmethods des Eiweisses. Z Anal Chem 1914;53:242-5. 41. Weicheselbaum TE. An accurate and rapid method for determination of proteins in small amounts of blood serum and
plasma. Am J Clin Path 1946;16:40-9.
42. Doumas BT, et al. A candidate reference method for determination of total protein in serum. I. Development and
validation. Clin Chem 1981;27:1642-50.
43. Sampson, EJ MA Baird, CA Burtis, EM Smith, DL Witte, and DD Bayse. A coupled-enzyme equilibrium method
for measuring urea in serum: optimization and evaluation of the AACC study group on urea candidate reference
method. Clin Chem 1980;26: 816-826.
44. National Committee for Clinical Laboratory Standards (NCCLS). Procedures for Handling and Processing of Blood
Specimens; tentative standard. NCCLS document H18-A2. Wayne, PA: NCCLS, 1999.
45. Overfield CV, Savory J, and Heintges MG. Glycosis: a re-evealuation of the effect on blood glucose.
Clin Chim Acta 1972;39:35-40.
46. Rehak NN and Chiang BT. Storage of whole blood: effect of temperature on the measured concentration of
analytes in serum. Clin Chem 1988;34:2111-14.
47. Sherwin JE and Obernolte R. Bilirubin. In:LA Kaplan and AJ Pesce, eds. Clinical Chemistry: Theory, Analysis and
Correlation, 2nd ed. St. Louis: The C.V. Mosby Company; 1989;1009-1015.
48. Henry RJ, Canon DC and Winkelman. Clinical Chemistry Principles and Technics, 2nd
ed. New York: Harper and
Row; 1974;417-21; 127-8.
49. Scott MG, Electrolytes and Blood Gases. In: Burtis CA, Ashwood ER, eds. Tietz Textbook of Clinical Chemistry.
3rd
ed. Philadelphia: WB Saunders Company, 1999:617-721.
50. Witte DL, Brown LF, and RL Williams. Effects of bilirubin on detection of hydrogen peroxide by use of
peroxidase. Clin Chem 1978;24:1778-82.
51. Melnik J and Potter JL. Variance in capillary and venous glucose levels during glucose tolerance test. Am J Med
Tech 1982;48:543-5. 52. National Committee for Clinical Laboratory Standards (NCCLS). Evaluation of precision performance of clinical
chemistry devices; approved guideline NCCLS Document EP5-A. Wayne, PA: NCCLS, 1999.
Page 59 of 73
13. Bibliografía (continuación)
53. National Committee for Clinical Laboratory Standards (NCCLS). Quality management for unit-use testing;
proposed guideline. NCCLS Document EP18-P. Wayne, PA: NCCLS, 1999.
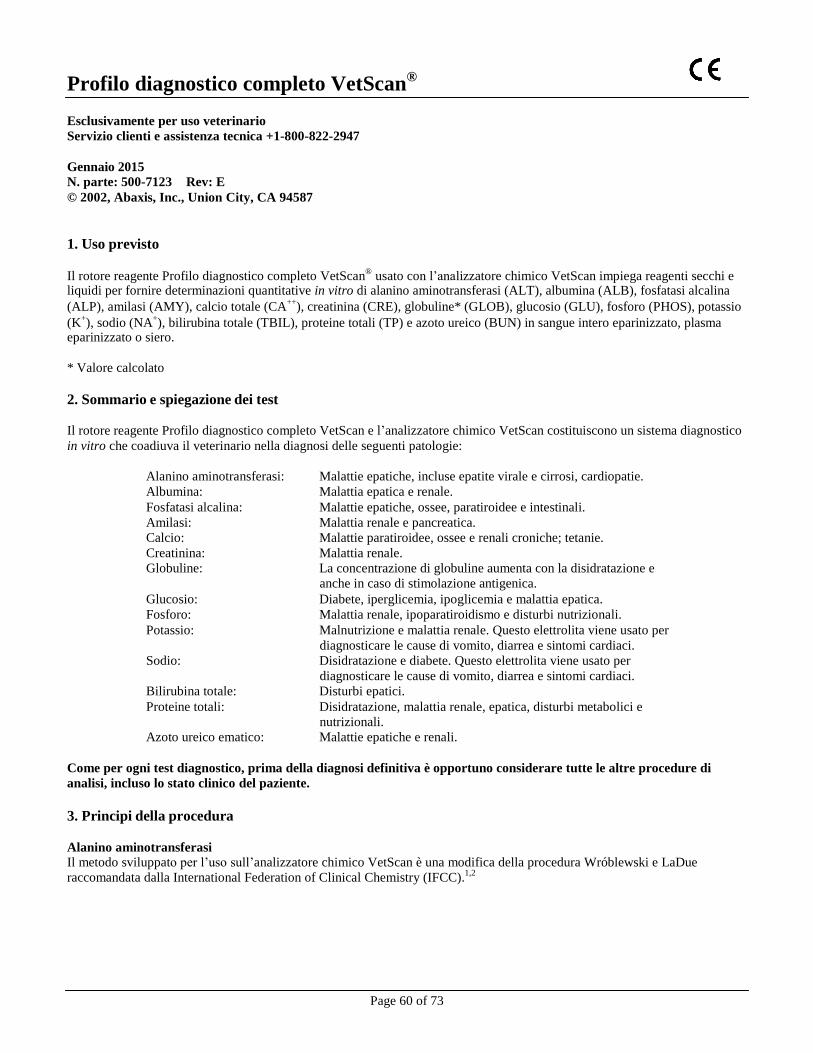
Page 60 of 73
Profilo diagnostico completo VetScan®
Esclusivamente per uso veterinario
Servizio clienti e assistenza tecnica +1-800-822-2947
Gennaio 2015 N. parte: 500-7123 Rev: E
© 2002, Abaxis, Inc., Union City, CA 94587
1. Uso previsto
Il rotore reagente Profilo diagnostico completo VetScan®
usato con l’analizzatore chimico VetScan impiega reagenti secchi e liquidi per fornire determinazioni quantitative in vitro di alanino aminotransferasi (ALT), albumina (ALB), fosfatasi alcalina
(ALP), amilasi (AMY), calcio totale (CA++
), creatinina (CRE), globuline* (GLOB), glucosio (GLU), fosforo (PHOS), potassio
(K+), sodio (NA
+), bilirubina totale (TBIL), proteine totali (TP) e azoto ureico (BUN) in sangue intero eparinizzato, plasma
eparinizzato o siero.
* Valore calcolato
2. Sommario e spiegazione dei test
Il rotore reagente Profilo diagnostico completo VetScan e l’analizzatore chimico VetScan costituiscono un sistema diagnostico
in vitro che coadiuva il veterinario nella diagnosi delle seguenti patologie:
Alanino aminotransferasi: Malattie epatiche, incluse epatite virale e cirrosi, cardiopatie.
Albumina: Malattia epatica e renale.
Fosfatasi alcalina: Malattie epatiche, ossee, paratiroidee e intestinali.
Amilasi: Malattia renale e pancreatica.
Calcio: Malattie paratiroidee, ossee e renali croniche; tetanie.
Creatinina: Malattia renale.
Globuline: La concentrazione di globuline aumenta con la disidratazione e
anche in caso di stimolazione antigenica.
Glucosio: Diabete, iperglicemia, ipoglicemia e malattia epatica.
Fosforo: Malattia renale, ipoparatiroidismo e disturbi nutrizionali.
Potassio: Malnutrizione e malattia renale. Questo elettrolita viene usato per
diagnosticare le cause di vomito, diarrea e sintomi cardiaci.
Sodio: Disidratazione e diabete. Questo elettrolita viene usato per
diagnosticare le cause di vomito, diarrea e sintomi cardiaci.
Bilirubina totale: Disturbi epatici.
Proteine totali: Disidratazione, malattia renale, epatica, disturbi metabolici e
nutrizionali.
Azoto ureico ematico: Malattie epatiche e renali.
Come per ogni test diagnostico, prima della diagnosi definitiva è opportuno considerare tutte le altre procedure di
analisi, incluso lo stato clinico del paziente.
3. Principi della procedura
Alanino aminotransferasi Il metodo sviluppato per l’uso sull’analizzatore chimico VetScan è una modifica della procedura Wróblewski e LaDue
raccomandata dalla International Federation of Clinical Chemistry (IFCC).1,2
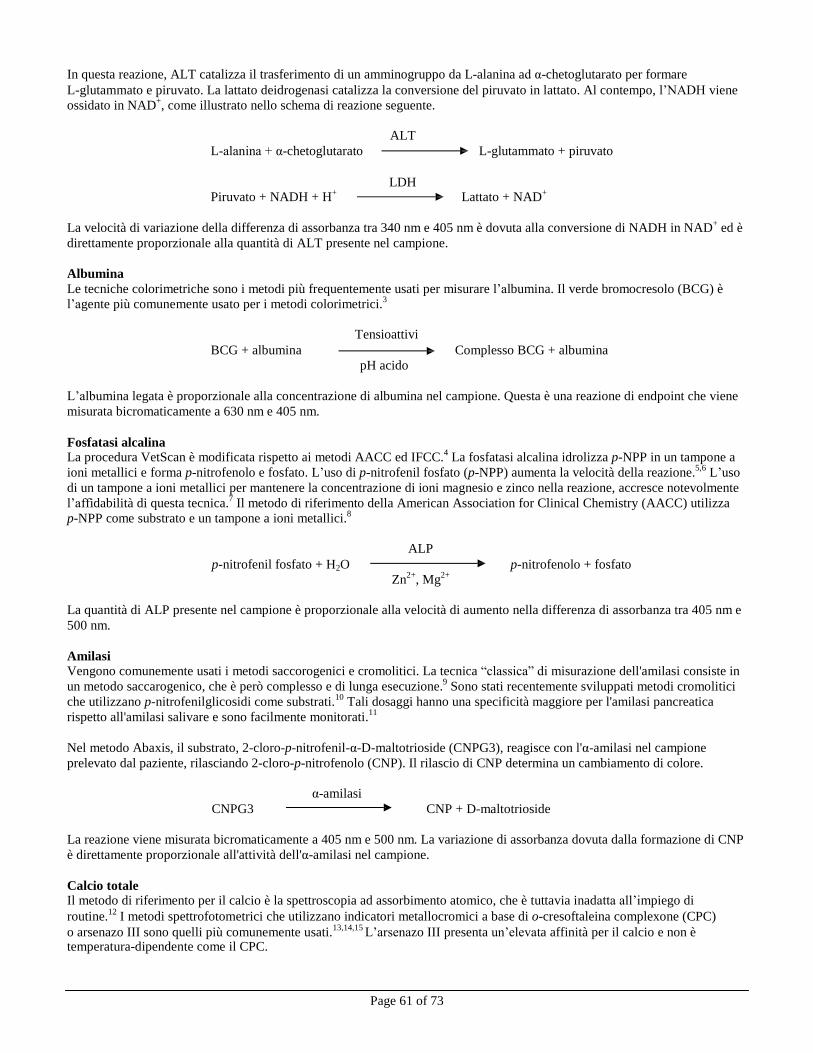
Page 61 of 73
In questa reazione, ALT catalizza il trasferimento di un amminogruppo da L-alanina ad α-chetoglutarato per formare
L-glutammato e piruvato. La lattato deidrogenasi catalizza la conversione del piruvato in lattato. Al contempo, l’NADH viene
ossidato in NAD+, come illustrato nello schema di reazione seguente.
ALT
L-alanina + α-chetoglutarato L-glutammato + piruvato
LDH
Piruvato + NADH + H+
Lattato + NAD+
La velocità di variazione della differenza di assorbanza tra 340 nm e 405 nm è dovuta alla conversione di NADH in NAD
+ ed è
direttamente proporzionale alla quantità di ALT presente nel campione.
Albumina
Le tecniche colorimetriche sono i metodi più frequentemente usati per misurare l’albumina. Il verde bromocresolo (BCG) è
l’agente più comunemente usato per i metodi colorimetrici.3
Tensioattivi
BCG + albumina Complesso BCG + albumina
pH acido
L’albumina legata è proporzionale alla concentrazione di albumina nel campione. Questa è una reazione di endpoint che viene
misurata bicromaticamente a 630 nm e 405 nm.
Fosfatasi alcalina
La procedura VetScan è modificata rispetto ai metodi AACC ed IFCC.4
La fosfatasi alcalina idrolizza p-NPP in un tampone a
ioni metallici e forma p-nitrofenolo e fosfato. L’uso di p-nitrofenil fosfato (p-NPP) aumenta la velocità della reazione.5,6
L’uso
di un tampone a ioni metallici per mantenere la concentrazione di ioni magnesio e zinco nella reazione, accresce notevolmente
l’affidabilità di questa tecnica.7
Il metodo di riferimento della American Association for Clinical Chemistry (AACC) utilizza
p-NPP come substrato e un tampone a ioni metallici.8
ALP
p-nitrofenil fosfato + H2O p-nitrofenolo + fosfato
Zn2+
, Mg2+
La quantità di ALP presente nel campione è proporzionale alla velocità di aumento nella differenza di assorbanza tra 405 nm e
500 nm.
Amilasi Vengono comunemente usati i metodi saccorogenici e cromolitici. La tecnica “classica” di misurazione dell'amilasi consiste in
un metodo saccarogenico, che è però complesso e di lunga esecuzione.9
Sono stati recentemente sviluppati metodi cromolitici
che utilizzano p-nitrofenilglicosidi come substrati.10
Tali dosaggi hanno una specificità maggiore per l'amilasi pancreatica
rispetto all'amilasi salivare e sono facilmente monitorati.11
Nel metodo Abaxis, il substrato, 2-cloro-p-nitrofenil-α-D-maltotrioside (CNPG3), reagisce con l'α-amilasi nel campione
prelevato dal paziente, rilasciando 2-cloro-p-nitrofenolo (CNP). Il rilascio di CNP determina un cambiamento di colore.
α-amilasi
CNPG3 CNP + D-maltotrioside
La reazione viene misurata bicromaticamente a 405 nm e 500 nm. La variazione di assorbanza dovuta dalla formazione di CNP
è direttamente proporzionale all'attività dell'α-amilasi nel campione.
Calcio totale Il metodo di riferimento per il calcio è la spettroscopia ad assorbimento atomico, che è tuttavia inadatta all’impiego di
routine.12
I metodi spettrofotometrici che utilizzano indicatori metallocromici a base di o-cresoftaleina complexone (CPC)
o arsenazo III sono quelli più comunemente usati.13,14,15
L’arsenazo III presenta un’elevata affinità per il calcio e non è temperatura-dipendente come il CPC.
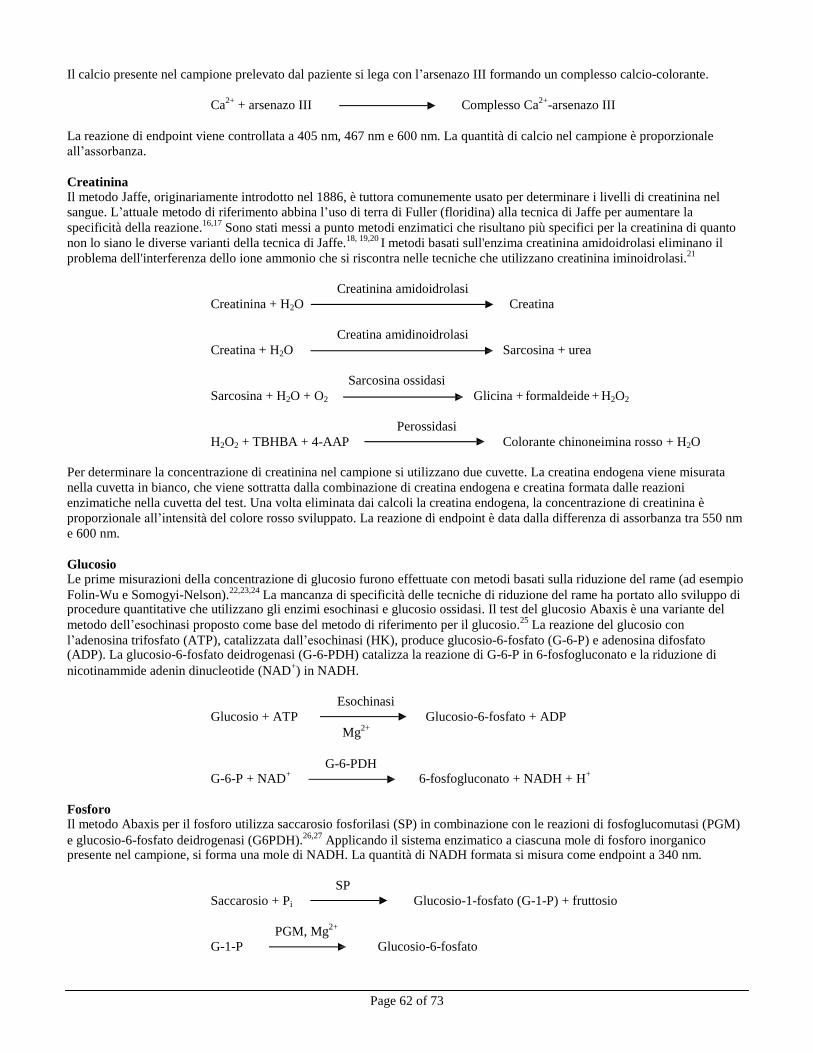
Page 62 of 73
Il calcio presente nel campione prelevato dal paziente si lega con l’arsenazo III formando un complesso calcio-colorante.
Ca2+
+ arsenazo III Complesso Ca2+
-arsenazo III
La reazione di endpoint viene controllata a 405 nm, 467 nm e 600 nm. La quantità di calcio nel campione è proporzionale
all’assorbanza.
Creatinina Il metodo Jaffe, originariamente introdotto nel 1886, è tuttora comunemente usato per determinare i livelli di creatinina nel
sangue. L’attuale metodo di riferimento abbina l’uso di terra di Fuller (floridina) alla tecnica di Jaffe per aumentare la
specificità della reazione.16,17
Sono stati messi a punto metodi enzimatici che risultano più specifici per la creatinina di quanto
non lo siano le diverse varianti della tecnica di Jaffe.18, 19,20
I metodi basati sull'enzima creatinina amidoidrolasi eliminano il
problema dell'interferenza dello ione ammonio che si riscontra nelle tecniche che utilizzano creatinina iminoidrolasi.21
Creatinina amidoidrolasi
Creatinina + H2O Creatina
Creatina amidinoidrolasi
Creatina + H2O Sarcosina + urea
Sarcosina ossidasi
Sarcosina + H2O + O2 Glicina + formaldeide + H2O2
Perossidasi
H2O2 + TBHBA + 4-AAP Colorante chinoneimina rosso + H2O
Per determinare la concentrazione di creatinina nel campione si utilizzano due cuvette. La creatina endogena viene misurata
nella cuvetta in bianco, che viene sottratta dalla combinazione di creatina endogena e creatina formata dalle reazioni
enzimatiche nella cuvetta del test. Una volta eliminata dai calcoli la creatina endogena, la concentrazione di creatinina è
proporzionale all’intensità del colore rosso sviluppato. La reazione di endpoint è data dalla differenza di assorbanza tra 550 nm
e 600 nm.
Glucosio Le prime misurazioni della concentrazione di glucosio furono effettuate con metodi basati sulla riduzione del rame (ad esempio
Folin-Wu e Somogyi-Nelson).22,23,24
La mancanza di specificità delle tecniche di riduzione del rame ha portato allo sviluppo di procedure quantitative che utilizzano gli enzimi esochinasi e glucosio ossidasi. Il test del glucosio Abaxis è una variante del
metodo dell’esochinasi proposto come base del metodo di riferimento per il glucosio.25
La reazione del glucosio con
l’adenosina trifosfato (ATP), catalizzata dall’esochinasi (HK), produce glucosio-6-fosfato (G-6-P) e adenosina difosfato (ADP). La glucosio-6-fosfato deidrogenasi (G-6-PDH) catalizza la reazione di G-6-P in 6-fosfogluconato e la riduzione di
nicotinammide adenin dinucleotide (NAD+) in NADH.
Esochinasi
Glucosio + ATP Glucosio-6-fosfato + ADP
Mg2+
G-6-PDH
G-6-P + NAD+
6-fosfogluconato + NADH + H+
Fosforo Il metodo Abaxis per il fosforo utilizza saccarosio fosforilasi (SP) in combinazione con le reazioni di fosfoglucomutasi (PGM)
e glucosio-6-fosfato deidrogenasi (G6PDH).26,27
Applicando il sistema enzimatico a ciascuna mole di fosforo inorganico presente nel campione, si forma una mole di NADH. La quantità di NADH formata si misura come endpoint a 340 nm.
SP
Saccarosio + Pi Glucosio-1-fosfato (G-1-P) + fruttosio
PGM, Mg2+
G-1-P Glucosio-6-fosfato

Page 63 of 73
G-6-PDH
Glucosio-6-fosfato + NAD+
NADH + 6-fosfogluconato + H+
Potassio Sono stati sviluppati metodi spettrofotometrici che consentono di misurare la concentrazione di potassio con i normali strumenti di chimica clinica. Il metodo enzimatico Abaxis si basa sull’attivazione della piruvato chinasi (PK) con il potassio e
presenta linearità eccellente e sensibilità trascurabile alle sostanze endogene.28,29,30
L’interferenza degli ioni sodio e ammonio è
rispettivamente minimizzata mediante aggiunta di Kryptofix e glutammato deidrogenasi.28
Nella reazione enzimatica accoppiata, PK defosforila il fosfoenolpiruvato (PEP) formando piruvato. La lattato deidrogenasi
(LDH) catalizza la trasformazione del piruvato in lattato. Al contempo, l’NADH viene ossidato in NAD+. La velocità di
variazione nell’assorbanza tra 340 nm e 405 nm è dovuta alla conversione di NADH in NAD+
ed è direttamente proporzionale alla quantità di potassio presente nel campione.
K
+, PK
ADP + PEP Piruvato + ATP
LDH
Piruvato + NADH + H+
Lattato + NAD+
Sodio Sono stati sviluppati metodi colorimetrici ed enzimatici che consentono di misurare la concentrazione di sodio con i normali
strumenti di chimica clinica.31,32,33
Nella reazione enzimatica Abaxis, la β-galattosidasi è attivata dal sodio nel campione.
L’enzima attivato catalizza la reazione dell’ο-nitrofenil-β-D-galattopiranoside (ONPG) in ο-nitrofenolo e galattosio. La
velocità della reazione tra 405 nm e 500 nm è proporzionale alla concentrazione di sodio.
Na+
ONPG + H2O ο-Nitrofenolo + Galattosio
β-Galattosidasi
Bilirubina totale
I livelli di bilirubina totale sono stati generalmente misurati con test che impiegano l’acido solfanilico diazotato.34,35
È stato
sviluppato un nuovo metodo più specifico che utilizza l’enzima bilirubina ossidasi.36,37,38
Oltre a impiegare il metodo di test più
specifico della bilirubina totale, l’analizzatore riduce al minimo la fotodegradazione dell’analita perché il campione può essere
testato subito dopo la raccolta.
Nella procedura enzimatica, la bilirubina viene ossidata dalla bilirubina ossidasi in biliverdina. La bilirubina viene quantificata
come la differenza di assorbanza tra 467 nm e 550 nm. L’assorbanza iniziale di questa reazione di endpoint viene determinata
dalla cuvetta in bianco della bilirubina e l’assorbanza finale è data dalla cuvetta del test della bilirubina. La quantità di
bilirubina presente nel campione è proporzionale alla differenza tra le misurazioni di assorbanza iniziale e finale.
Bilirubina ossidasi
Bilirubina + O2 Biliverdina + H2O
Proteine totali
Il metodo delle proteine totali è una modifica della reazione del biureto, nota per la sua precisione, accuratezza e specificità,39
che è stata originariamente sviluppata da Riegler e successivamente modificata da Weichselbaum, Doumas, et al. La reazione
del biureto è un potenziale metodo di riferimento delle proteine totale.40,41,42
Nella reazione del biureto, la soluzione proteica è trattata con ioni rame [Cu(II)] in un terreno fortemente alcalino. Vengono
aggiunti tartrato di sodio e potassio e ioduro di potassio per impedire rispettivamente la precipitazione di idrossido di rame (II)
e l’autoriduzione del rame.41
Gli ioni Cu(II) reagiscono con i legami peptidici tra gli atomi di ossigeno del gruppo carbonilico e
di azoto del gruppo ammidico formando un complesso colorato Cu-proteine.
OH-
Proteine totali + Cu(II) Complesso Cu-proteine
La quantità di proteine totali presenti nel campione è direttamente proporzionale all’assorbanza del complesso Cu-proteine. Il
test delle proteine totali è una reazione di endpoint e l’assorbanza è data dalla differenza in assorbanza tra 550 nm e 850 nm.
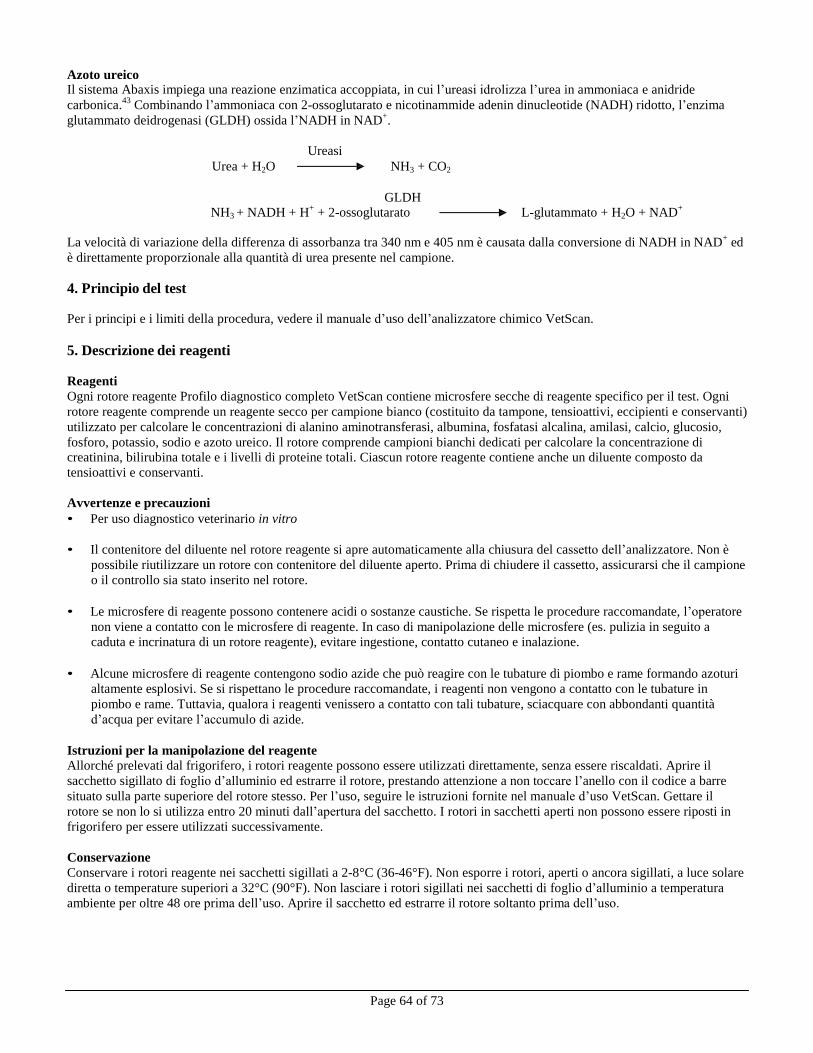
Page 64 of 73
Azoto ureico Il sistema Abaxis impiega una reazione enzimatica accoppiata, in cui l’ureasi idrolizza l’urea in ammoniaca e anidride
carbonica.43
Combinando l’ammoniaca con 2-ossoglutarato e nicotinammide adenin dinucleotide (NADH) ridotto, l’enzima
glutammato deidrogenasi (GLDH) ossida l’NADH in NAD+.
Ureasi
Urea + H2O NH3 + CO2
GLDH
NH3 + NADH + H+
+ 2-ossoglutarato L-glutammato + H2O + NAD+
La velocità di variazione della differenza di assorbanza tra 340 nm e 405 nm è causata dalla conversione di NADH in NAD
+ ed
è direttamente proporzionale alla quantità di urea presente nel campione.
4. Principio del test
Per i principi e i limiti della procedura, vedere il manuale d’uso dell’analizzatore chimico VetScan.
5. Descrizione dei reagenti
Reagenti
Ogni rotore reagente Profilo diagnostico completo VetScan contiene microsfere secche di reagente specifico per il test. Ogni
rotore reagente comprende un reagente secco per campione bianco (costituito da tampone, tensioattivi, eccipienti e conservanti)
utilizzato per calcolare le concentrazioni di alanino aminotransferasi, albumina, fosfatasi alcalina, amilasi, calcio, glucosio,
fosforo, potassio, sodio e azoto ureico. Il rotore comprende campioni bianchi dedicati per calcolare la concentrazione di creatinina, bilirubina totale e i livelli di proteine totali. Ciascun rotore reagente contiene anche un diluente composto da
tensioattivi e conservanti.
Avvertenze e precauzioni
• Per uso diagnostico veterinario in vitro
• Il contenitore del diluente nel rotore reagente si apre automaticamente alla chiusura del cassetto dell’analizzatore. Non è
possibile riutilizzare un rotore con contenitore del diluente aperto. Prima di chiudere il cassetto, assicurarsi che il campione
o il controllo sia stato inserito nel rotore.
• Le microsfere di reagente possono contenere acidi o sostanze caustiche. Se rispetta le procedure raccomandate, l’operatore
non viene a contatto con le microsfere di reagente. In caso di manipolazione delle microsfere (es. pulizia in seguito a
caduta e incrinatura di un rotore reagente), evitare ingestione, contatto cutaneo e inalazione.
• Alcune microsfere di reagente contengono sodio azide che può reagire con le tubature di piombo e rame formando azoturi
altamente esplosivi. Se si rispettano le procedure raccomandate, i reagenti non vengono a contatto con le tubature in
piombo e rame. Tuttavia, qualora i reagenti venissero a contatto con tali tubature, sciacquare con abbondanti quantità
d’acqua per evitare l’accumulo di azide.
Istruzioni per la manipolazione del reagente Allorché prelevati dal frigorifero, i rotori reagente possono essere utilizzati direttamente, senza essere riscaldati. Aprire il
sacchetto sigillato di foglio d’alluminio ed estrarre il rotore, prestando attenzione a non toccare l’anello con il codice a barre
situato sulla parte superiore del rotore stesso. Per l’uso, seguire le istruzioni fornite nel manuale d’uso VetScan. Gettare il
rotore se non lo si utilizza entro 20 minuti dall’apertura del sacchetto. I rotori in sacchetti aperti non possono essere riposti in
frigorifero per essere utilizzati successivamente.
Conservazione
Conservare i rotori reagente nei sacchetti sigillati a 2-8°C (36-46°F). Non esporre i rotori, aperti o ancora sigillati, a luce solare
diretta o temperature superiori a 32°C (90°F). Non lasciare i rotori sigillati nei sacchetti di foglio d’alluminio a temperatura
ambiente per oltre 48 ore prima dell’uso. Aprire il sacchetto ed estrarre il rotore soltanto prima dell’uso.
Page 65 of 73
Indicazioni di instabilità o deterioramento del rotore reagente
• Tutti i reagenti contenuti nell’apposito rotore, se conservati nel modo sopra descritto, sono stabili sino alla data di scadenza
stampata sul sacchetto del rotore. Non utilizzare un rotore dopo la data di scadenza. La data di scadenza è codificata anche
nel codice a barre stampato sull’apposito anello. Se i reagenti sono scaduti, sul display dell’analizzatore chimico VetScan
viene visualizzato un messaggio di errore.
• In caso di sacchetto strappato o altrimenti danneggiato, l’umidità può penetrare nel disco non utilizzato e alterare il
comportamento del reagente. Non utilizzare rotori prelevati da sacchetti danneggiati.
6. Strumento
Per informazioni complete sull’uso dell’analizzatore, vedere il manuale d’uso VetScan.
7. Raccolta e preparazione dei campioni
La quantità minima di campione è di ~100 µL di sangue intero eparinizzato, plasma eparinizzato, siero o controllo. La camera
del campione su rotore reagente può contenere fino a 120 µL di campione.
• Il campione raccolto in una micropipetta eparinizzata deve essere dispensato nel rotore reagente subito dopo la raccolta.
• Per campioni di sangue intero o di plasma, utilizzare solo provette per prelievo sottovuoto con litio eparina (tappo verde).
Per campioni di siero, utilizzare provette per prelievo sottovuoto senza additivi (tappo rosso) o provette per separazione del
siero (tappo rosso o rosso/nero).
• I campioni di sangue intero prelevati mediante venipuntura devono essere omogenei prima di essere trasferiti nel rotore
reagente. Capovolgere delicatamente le provette di prelievo alcune volte prima di trasferire il campione. Non agitare la
provetta di prelievo in quanto ciò potrebbe provocare emolisi.
• Iniziare il test entro 10 minuti dal trasferimento del campione nel rotore reagente.
• Analizzare i campioni di sangue intero prelevati mediante venipuntura entro 60 minuti dal prelievo; qualora ciò non fosse
possibile, separare il campione e trasferirlo in una provetta pulita.44
Analizzare il campione di siero o plasma separato
entro 5 ore dalla centrifugazione. Qualora ciò non fosse possibile, refrigerare il campione in una provetta tappata a 2-8°C
(36-46°F) per non più di 48 ore. Un campione di plasma o siero può essere conservato a -10°C (14°F) per un massimo di 5
settimane in un congelatore privo di ciclo di autoscongelamento.
• Le concentrazioni di glucosio diminuiscono di circa 5-12 mg/dL in 1 ora in campioni non centrifugati conservati a
temperatura ambiente.45
• La refrigerazione di campioni di sangue intero può causare variazioni significative nelle concentrazioni di glucosio e
creatinina.46
• I risultati della bilirubina totale possono essere negativamente influenzati dalla fotodegradazione.
47 Conservare i
campioni di sangue intero non analizzati immediatamente, al buio per non più di 60 minuti. Se il campione non può essere analizzato entro tale periodo, separarlo in plasma o siero e conservarlo in una provetta tappata, al buio, a basse
temperature.48
Sostanze interferenti conosciute
• L’unico anticoagulante raccomandato per l’uso con l’analizzatore chimico VetScan è la litio eparina. Non usare eparina
sodica quando si raccolgono campioni di sangue da usare con questo pannello. Abaxis ha condotto studi che dimostrano
come EDTA, fluoruro, ossalato e qualsiasi anticoagulante contenente ioni ammonio interferiscano con almeno una delle
sostanze chimiche contenute nel rotore reagente Profilo diagnostico completo VetScan.
• Gli interferenti fisici (emolisi, ittero e lipemia) possono causare variazioni nelle concentrazioni refertate di alcuni analiti.
Gli indici del campione sono stampati nella parte inferiore di ogni scheda dei risultati per informare l’operatore dei livelli
di agenti interferenti presenti in ciascun campione. L’analizzatore chimico VetScan elimina gli eventuali risultati falsati da
un’interferenza > 10% dovuta a emolisi, lipemia e ittero. In tal caso, sulla scheda dei risultati anziché i risultati verrà rispettivamente stampata la dicitura “HEM” (emolisi), “LIP” (lipemia) o “ICT” (ittero).
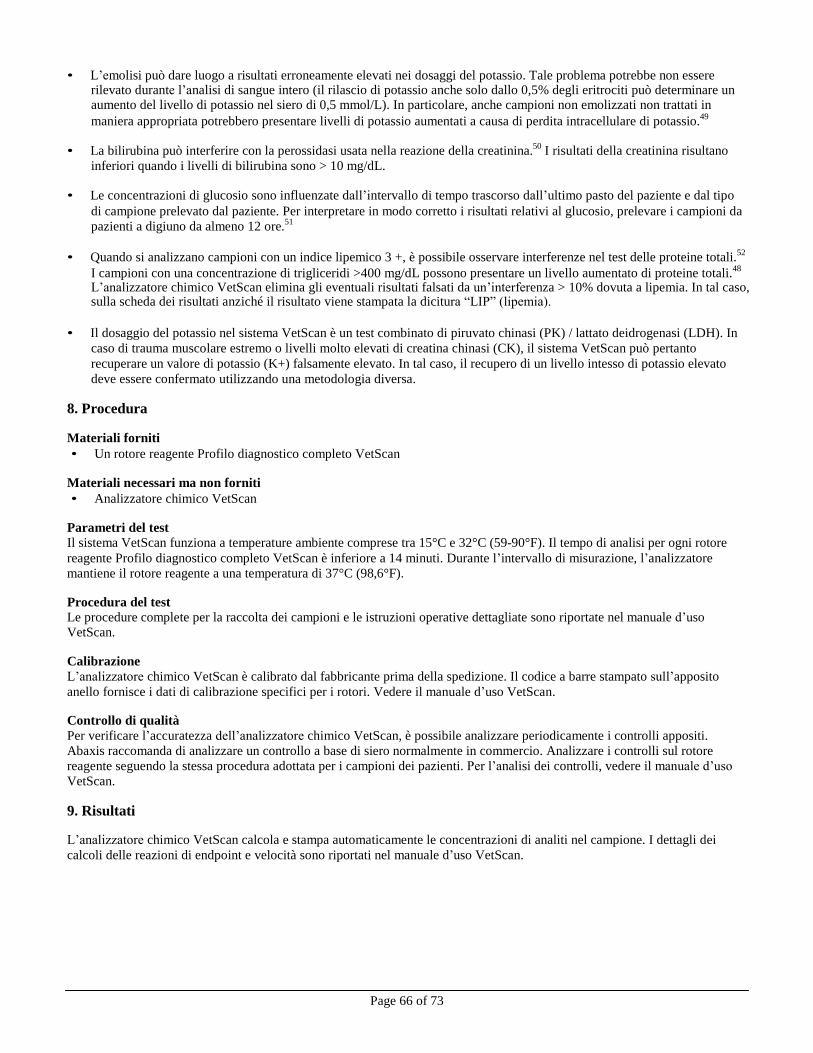
Page 66 of 73
• L’emolisi può dare luogo a risultati erroneamente elevati nei dosaggi del potassio. Tale problema potrebbe non essere rilevato durante l’analisi di sangue intero (il rilascio di potassio anche solo dallo 0,5% degli eritrociti può determinare un aumento del livello di potassio nel siero di 0,5 mmol/L). In particolare, anche campioni non emolizzati non trattati in
maniera appropriata potrebbero presentare livelli di potassio aumentati a causa di perdita intracellulare di potassio.49
• La bilirubina può interferire con la perossidasi usata nella reazione della creatinina.50
I risultati della creatinina risultano
inferiori quando i livelli di bilirubina sono > 10 mg/dL.
• Le concentrazioni di glucosio sono influenzate dall’intervallo di tempo trascorso dall’ultimo pasto del paziente e dal tipo
di campione prelevato dal paziente. Per interpretare in modo corretto i risultati relativi al glucosio, prelevare i campioni da
pazienti a digiuno da almeno 12 ore.51
• Quando si analizzano campioni con un indice lipemico 3 +, è possibile osservare interferenze nel test delle proteine totali.
52
I campioni con una concentrazione di trigliceridi >400 mg/dL possono presentare un livello aumentato di proteine totali.48
L’analizzatore chimico VetScan elimina gli eventuali risultati falsati da un’interferenza > 10% dovuta a lipemia. In tal caso, sulla scheda dei risultati anziché il risultato viene stampata la dicitura “LIP” (lipemia).
• Il dosaggio del potassio nel sistema VetScan è un test combinato di piruvato chinasi (PK) / lattato deidrogenasi (LDH). In
caso di trauma muscolare estremo o livelli molto elevati di creatina chinasi (CK), il sistema VetScan può pertanto
recuperare un valore di potassio (K+) falsamente elevato. In tal caso, il recupero di un livello intesso di potassio elevato
deve essere confermato utilizzando una metodologia diversa.
8. Procedura
Materiali forniti
• Un rotore reagente Profilo diagnostico completo VetScan
Materiali necessari ma non forniti
• Analizzatore chimico VetScan
Parametri del test Il sistema VetScan funziona a temperature ambiente comprese tra 15°C e 32°C (59-90°F). Il tempo di analisi per ogni rotore
reagente Profilo diagnostico completo VetScan è inferiore a 14 minuti. Durante l’intervallo di misurazione, l’analizzatore
mantiene il rotore reagente a una temperatura di 37°C (98,6°F).
Procedura del test Le procedure complete per la raccolta dei campioni e le istruzioni operative dettagliate sono riportate nel manuale d’uso VetScan.
Calibrazione
L’analizzatore chimico VetScan è calibrato dal fabbricante prima della spedizione. Il codice a barre stampato sull’apposito
anello fornisce i dati di calibrazione specifici per i rotori. Vedere il manuale d’uso VetScan.
Controllo di qualità
Per verificare l’accuratezza dell’analizzatore chimico VetScan, è possibile analizzare periodicamente i controlli appositi.
Abaxis raccomanda di analizzare un controllo a base di siero normalmente in commercio. Analizzare i controlli sul rotore
reagente seguendo la stessa procedura adottata per i campioni dei pazienti. Per l’analisi dei controlli, vedere il manuale d’uso
VetScan.
9. Risultati
L’analizzatore chimico VetScan calcola e stampa automaticamente le concentrazioni di analiti nel campione. I dettagli dei
calcoli delle reazioni di endpoint e velocità sono riportati nel manuale d’uso VetScan.
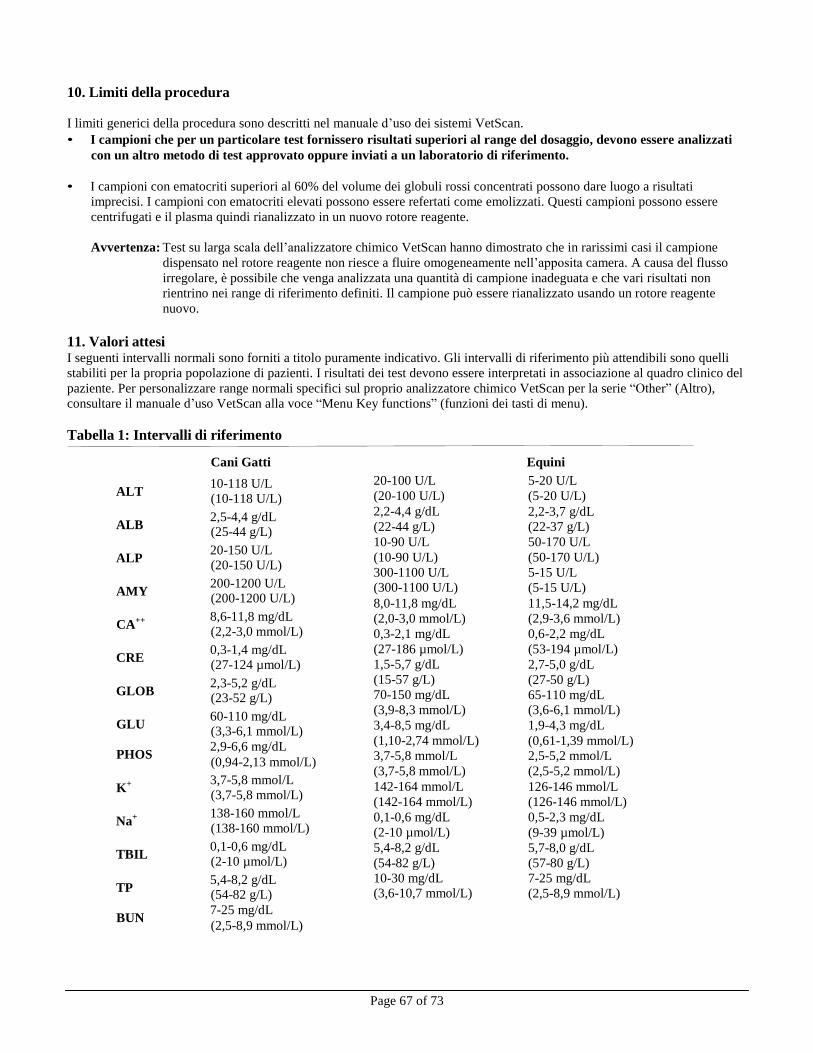
Page 67 of 73
10. Limiti della procedura
I limiti generici della procedura sono descritti nel manuale d’uso dei sistemi VetScan.
• I campioni che per un particolare test fornissero risultati superiori al range del dosaggio, devono essere analizzati
con un altro metodo di test approvato oppure inviati a un laboratorio di riferimento.
• I campioni con ematocriti superiori al 60% del volume dei globuli rossi concentrati possono dare luogo a risultati
imprecisi. I campioni con ematocriti elevati possono essere refertati come emolizzati. Questi campioni possono essere
centrifugati e il plasma quindi rianalizzato in un nuovo rotore reagente.
Avvertenza: Test su larga scala dell’analizzatore chimico VetScan hanno dimostrato che in rarissimi casi il campione
dispensato nel rotore reagente non riesce a fluire omogeneamente nell’apposita camera. A causa del flusso
irregolare, è possibile che venga analizzata una quantità di campione inadeguata e che vari risultati non
rientrino nei range di riferimento definiti. Il campione può essere rianalizzato usando un rotore reagente
nuovo.
11. Valori attesi I seguenti intervalli normali sono forniti a titolo puramente indicativo. Gli intervalli di riferimento più attendibili sono quelli
stabiliti per la propria popolazione di pazienti. I risultati dei test devono essere interpretati in associazione al quadro clinico del
paziente. Per personalizzare range normali specifici sul proprio analizzatore chimico VetScan per la serie “Other” (Altro),
consultare il manuale d’uso VetScan alla voce “Menu Key functions” (funzioni dei tasti di menu).
Tabella 1: Intervalli di riferimento
Cani Gatti Equini
ALT 10-118 U/L (10-118 U/L)
ALB 2,5-4,4 g/dL (25-44 g/L)
ALP 20-150 U/L (20-150 U/L)
AMY 200-1200 U/L (200-1200 U/L)
CA++ 8,6-11,8 mg/dL (2,2-3,0 mmol/L)
CRE 0,3-1,4 mg/dL (27-124 µmol/L)
GLOB 2,3-5,2 g/dL (23-52 g/L)
GLU 60-110 mg/dL (3,3-6,1 mmol/L)
PHOS 2,9-6,6 mg/dL (0,94-2,13 mmol/L)
K+ 3,7-5,8 mmol/L (3,7-5,8 mmol/L)
Na+ 138-160 mmol/L (138-160 mmol/L)
TBIL 0,1-0,6 mg/dL (2-10 µmol/L)
TP 5,4-8,2 g/dL (54-82 g/L)
BUN 7-25 mg/dL (2,5-8,9 mmol/L)
20-100 U/L
(20-100 U/L)
2,2-4,4 g/dL
(22-44 g/L)
10-90 U/L
(10-90 U/L)
300-1100 U/L (300-1100 U/L)
8,0-11,8 mg/dL
(2,0-3,0 mmol/L)
0,3-2,1 mg/dL
(27-186 µmol/L)
1,5-5,7 g/dL
(15-57 g/L)
70-150 mg/dL
(3,9-8,3 mmol/L)
3,4-8,5 mg/dL
(1,10-2,74 mmol/L)
3,7-5,8 mmol/L
(3,7-5,8 mmol/L)
142-164 mmol/L
(142-164 mmol/L)
0,1-0,6 mg/dL
(2-10 µmol/L)
5,4-8,2 g/dL
(54-82 g/L)
10-30 mg/dL (3,6-10,7 mmol/L)
5-20 U/L
(5-20 U/L)
2,2-3,7 g/dL
(22-37 g/L)
50-170 U/L
(50-170 U/L)
5-15 U/L
(5-15 U/L)
11,5-14,2 mg/dL
(2,9-3,6 mmol/L)
0,6-2,2 mg/dL
(53-194 µmol/L)
2,7-5,0 g/dL
(27-50 g/L)
65-110 mg/dL (3,6-6,1 mmol/L)
1,9-4,3 mg/dL
(0,61-1,39 mmol/L) 2,5-5,2 mmol/L
(2,5-5,2 mmol/L)
126-146 mmol/L
(126-146 mmol/L)
0,5-2,3 mg/dL
(9-39 µmol/L)
5,7-8,0 g/dL
(57-80 g/L)
7-25 mg/dL
(2,5-8,9 mmol/L)
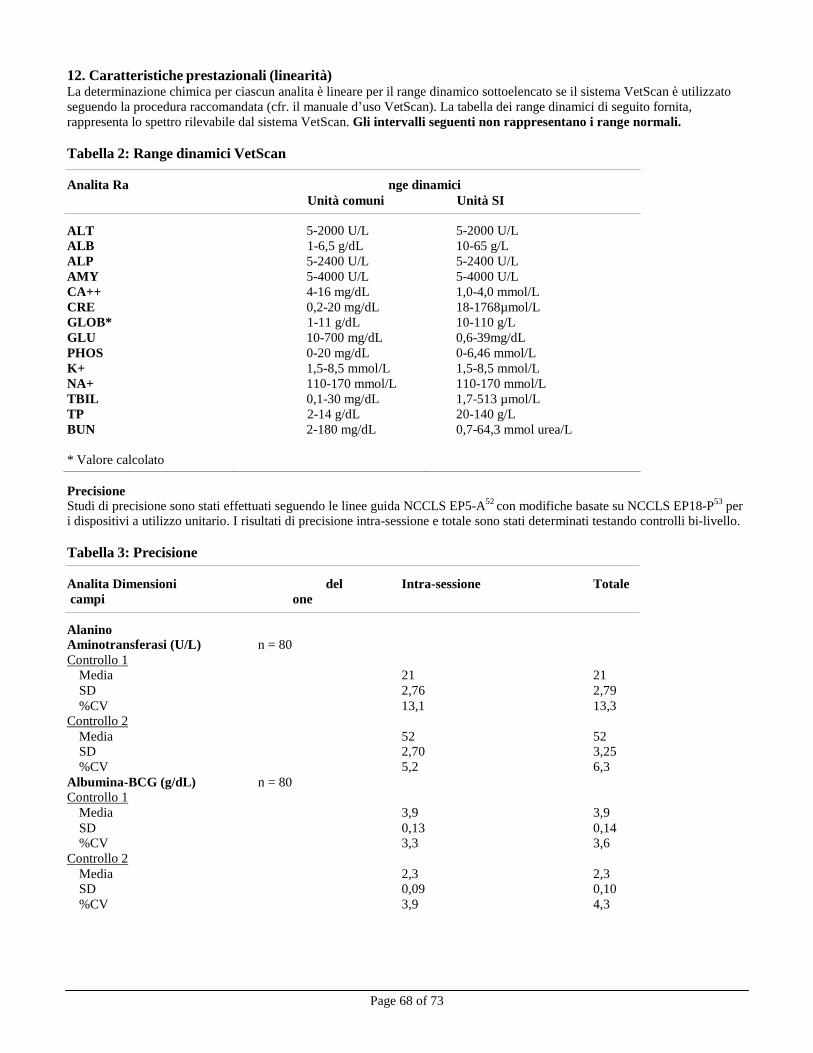
Page 68 of 73
12. Caratteristiche prestazionali (linearità) La determinazione chimica per ciascun analita è lineare per il range dinamico sottoelencato se il sistema VetScan è utilizzato
seguendo la procedura raccomandata (cfr. il manuale d’uso VetScan). La tabella dei range dinamici di seguito fornita,
rappresenta lo spettro rilevabile dal sistema VetScan. Gli intervalli seguenti non rappresentano i range normali.
Tabella 2: Range dinamici VetScan
Analita Ra nge dinamici
Unità comuni Unità SI
ALT
5-2000 U/L
5-2000 U/L
ALB 1-6,5 g/dL 10-65 g/L
ALP 5-2400 U/L 5-2400 U/L
AMY 5-4000 U/L 5-4000 U/L
CA++ 4-16 mg/dL 1,0-4,0 mmol/L
CRE 0,2-20 mg/dL 18-1768µmol/L
GLOB* 1-11 g/dL 10-110 g/L
GLU 10-700 mg/dL 0,6-39mg/dL
PHOS 0-20 mg/dL 0-6,46 mmol/L
K+ 1,5-8,5 mmol/L 1,5-8,5 mmol/L
NA+ 110-170 mmol/L 110-170 mmol/L
TBIL 0,1-30 mg/dL 1,7-513 µmol/L
TP 2-14 g/dL 20-140 g/L
BUN
* Valore calcolato
2-180 mg/dL 0,7-64,3 mmol urea/L
Precisione
Studi di precisione sono stati effettuati seguendo le linee guida NCCLS EP5-A52
con modifiche basate su NCCLS EP18-P53
per i dispositivi a utilizzo unitario. I risultati di precisione intra-sessione e totale sono stati determinati testando controlli bi-livello.
Tabella 3: Precisione
Analita Dimensioni del Intra-sessione Totale
campi one
Alanino Aminotransferasi (U/L) n = 80
Controllo 1
Media 21 21
SD 2,76 2,79
%CV 13,1 13,3 Controllo 2
Media 52 52 SD 2,70 3,25
%CV 5,2 6,3
Albumina-BCG (g/dL) n = 80 Controllo 1
Media 3,9 3,9
SD 0,13 0,14 %CV 3,3 3,6
Controllo 2
Media 2,3 2,3 SD 0,09 0,10
%CV 3,9 4,3
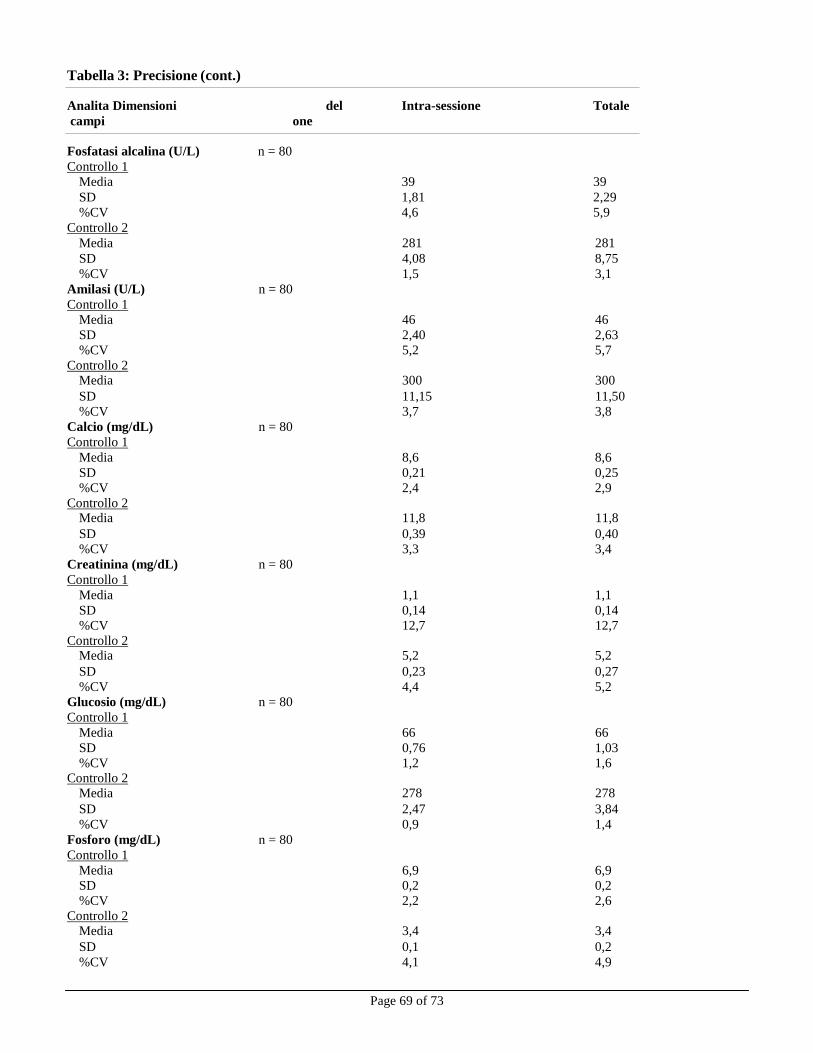
Page 69 of 73
Tabella 3: Precisione (cont.)
Analita Dimensioni del Intra-sessione Totale
campi one
Fosfatasi alcalina (U/L) n = 80
Controllo 1
Media 39 39
SD 1,81 2,29
%CV 4,6 5,9
Controllo 2
Media 281 281
SD 4,08 8,75
%CV 1,5 3,1
Amilasi (U/L) n = 80 Controllo 1
Media 46 46
SD 2,40 2,63
%CV 5,2 5,7
Controllo 2 Media 300 300
SD 11,15 11,50
%CV 3,7 3,8
Calcio (mg/dL) n = 80 Controllo 1
Media 8,6 8,6
SD 0,21 0,25
%CV 2,4 2,9
Controllo 2 Media 11,8 11,8
SD 0,39 0,40
%CV 3,3 3,4
Creatinina (mg/dL) n = 80 Controllo 1
Media 1,1 1,1
SD 0,14 0,14
%CV 12,7 12,7
Controllo 2 Media 5,2 5,2
SD 0,23 0,27
%CV 4,4 5,2
Glucosio (mg/dL) n = 80 Controllo 1
Media 66 66
SD 0,76 1,03
%CV 1,2 1,6 Controllo 2
Media 278 278
SD 2,47 3,84
%CV 0,9 1,4
Fosforo (mg/dL) n = 80 Controllo 1
Media 6,9 6,9
SD 0,2 0,2
%CV 2,2 2,6
Controllo 2 Media 3,4 3,4
SD 0,1 0,2
%CV 4,1 4,9
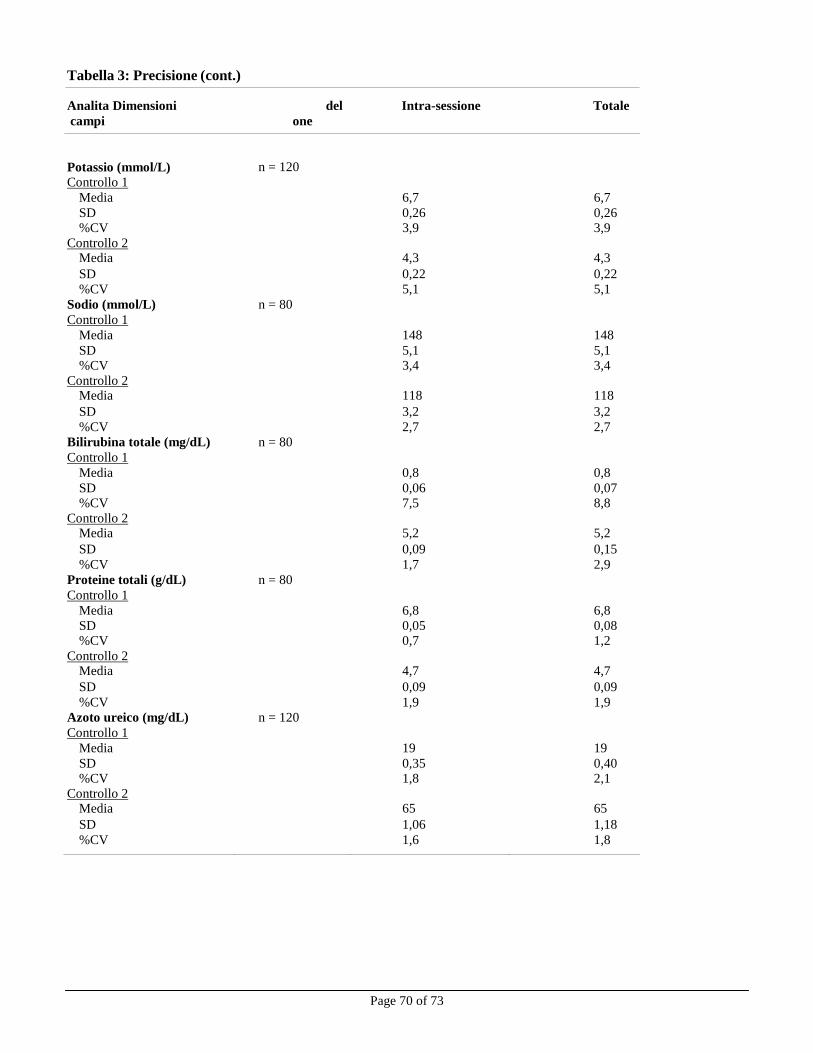
Tabella 3: Precisione (cont.)
Page 70 of 73
Analita Dimensioni del Intra-sessione Totale
campi one
Potassio (mmol/L)
n = 120
Controllo 1 Media 6,7 6,7
SD 0,26 0,26 %CV 3,9 3,9
Controllo 2 Media 4,3 4,3
SD 0,22 0,22
%CV 5,1 5,1
Sodio (mmol/L) n = 80 Controllo 1
Media 148 148
SD 5,1 5,1 %CV 3,4 3,4
Controllo 2 Media 118 118
SD 3,2 3,2
%CV 2,7 2,7
Bilirubina totale (mg/dL) n = 80 Controllo 1
Media 0,8 0,8
SD 0,06 0,07 %CV 7,5 8,8
Controllo 2 Media 5,2 5,2
SD 0,09 0,15
%CV 1,7 2,9
Proteine totali (g/dL) n = 80 Controllo 1
Media 6,8 6,8
SD 0,05 0,08 %CV 0,7 1,2
Controllo 2 Media 4,7 4,7
SD 0,09 0,09
%CV 1,9 1,9
Azoto ureico (mg/dL) n = 120 Controllo 1
Media 19 19
SD 0,35 0,40 %CV 1,8 2,1
Controllo 2 Media 65 65
SD 1,06 1,18
%CV 1,6 1,8
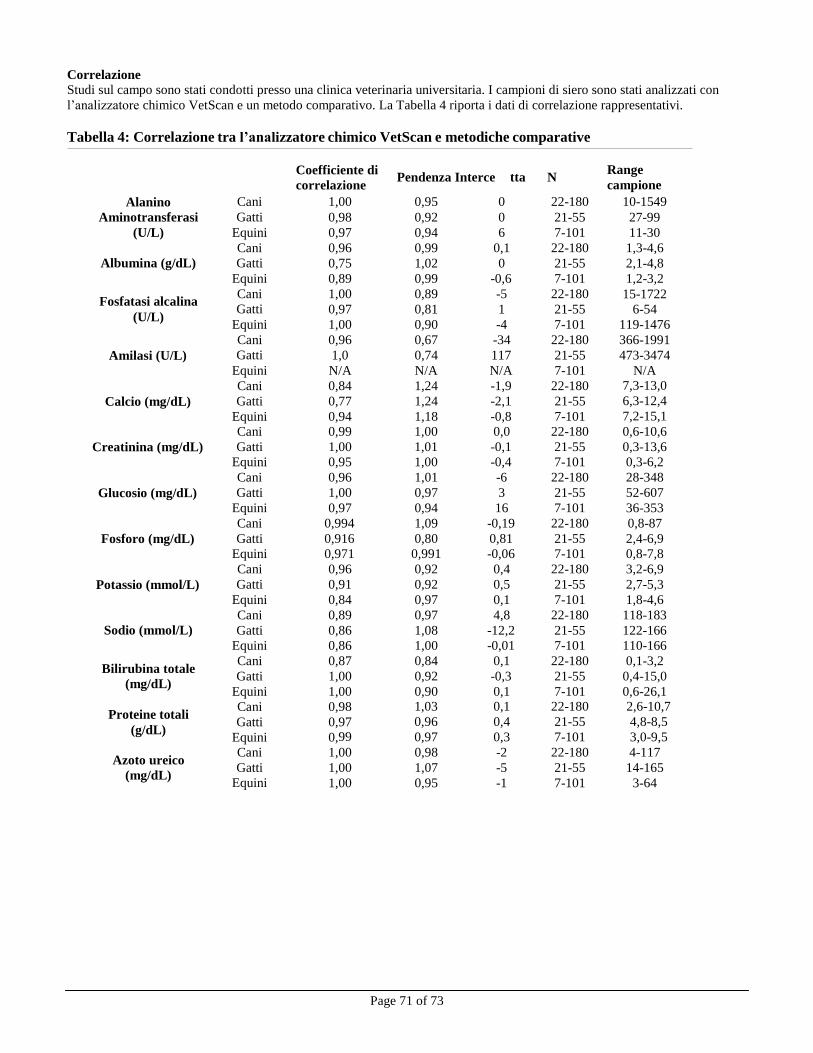
Page 71 of 73
Cani 1,00 0,95 0 22-180 10-1549
Gatti 0,98 0,92 0 21-55 27-99
Equini 0,97 0,94 6 7-101 11-30
Cani 0,96 0,99 0,1 22-180 1,3-4,6
Gatti 0,75 1,02 0 21-55 2,1-4,8
Equini 0,89 0,99 -0,6 7-101 1,2-3,2
Cani 1,00 0,89 -5 22-180 15-1722 Gatti 0,97 0,81 1 21-55 6-54
Equini 1,00 0,90 -4 7-101 119-1476
Cani 0,96 0,67 -34 22-180 366-1991
Gatti 1,0 0,74 117 21-55 473-3474
Equini N/A N/A N/A 7-101 N/A
Cani 0,84 1,24 -1,9 22-180 7,3-13,0
Gatti 0,77 1,24 -2,1 21-55 6,3-12,4
Equini 0,94 1,18 -0,8 7-101 7,2-15,1
Cani 0,99 1,00 0,0 22-180 0,6-10,6
Gatti 1,00 1,01 -0,1 21-55 0,3-13,6
Equini 0,95 1,00 -0,4 7-101 0,3-6,2
Cani 0,96 1,01 -6 22-180 28-348
Gatti 1,00 0,97 3 21-55 52-607
Equini 0,97 0,94 16 7-101 36-353
Cani 0,994 1,09 -0,19 22-180 0,8-87
Gatti 0,916 0,80 0,81 21-55 2,4-6,9
Equini 0,971 0,991 -0,06 7-101 0,8-7,8
Cani 0,96 0,92 0,4 22-180 3,2-6,9
Gatti 0,91 0,92 0,5 21-55 2,7-5,3
Equini 0,84 0,97 0,1 7-101 1,8-4,6
Cani 0,89 0,97 4,8 22-180 118-183
Gatti 0,86 1,08 -12,2 21-55 122-166
Equini 0,86 1,00 -0,01 7-101 110-166
Cani 0,87 0,84 0,1 22-180 0,1-3,2
Gatti 1,00 0,92 -0,3 21-55 0,4-15,0
Equini 1,00 0,90 0,1 7-101 0,6-26,1
Cani 0,98 1,03 0,1 22-180 2,6-10,7
Gatti 0,97 0,96 0,4 21-55 4,8-8,5
Equini 0,99 0,97 0,3 7-101 3,0-9,5
Cani 1,00 0,98 -2 22-180 4-117
Gatti 1,00 1,07 -5 21-55 14-165
Equini 1,00 0,95 -1 7-101 3-64
Correlazione Studi sul campo sono stati condotti presso una clinica veterinaria universitaria. I campioni di siero sono stati analizzati con
l’analizzatore chimico VetScan e un metodo comparativo. La Tabella 4 riporta i dati di correlazione rappresentativi.
Tabella 4: Correlazione tra l’analizzatore chimico VetScan e metodiche comparative
Alanino
Aminotransferasi
(U/L)
Coefficiente di
correlazione Pendenza Interce tta N
Range
campione
Albumina (g/dL)
Fosfatasi alcalina
(U/L)
Amilasi (U/L)
Calcio (mg/dL)
Creatinina (mg/dL)
Glucosio (mg/dL)
Fosforo (mg/dL)
Potassio (mmol/L)
Sodio (mmol/L)
Bilirubina totale
(mg/dL)
Proteine totali
(g/dL)
Azoto ureico
(mg/dL)
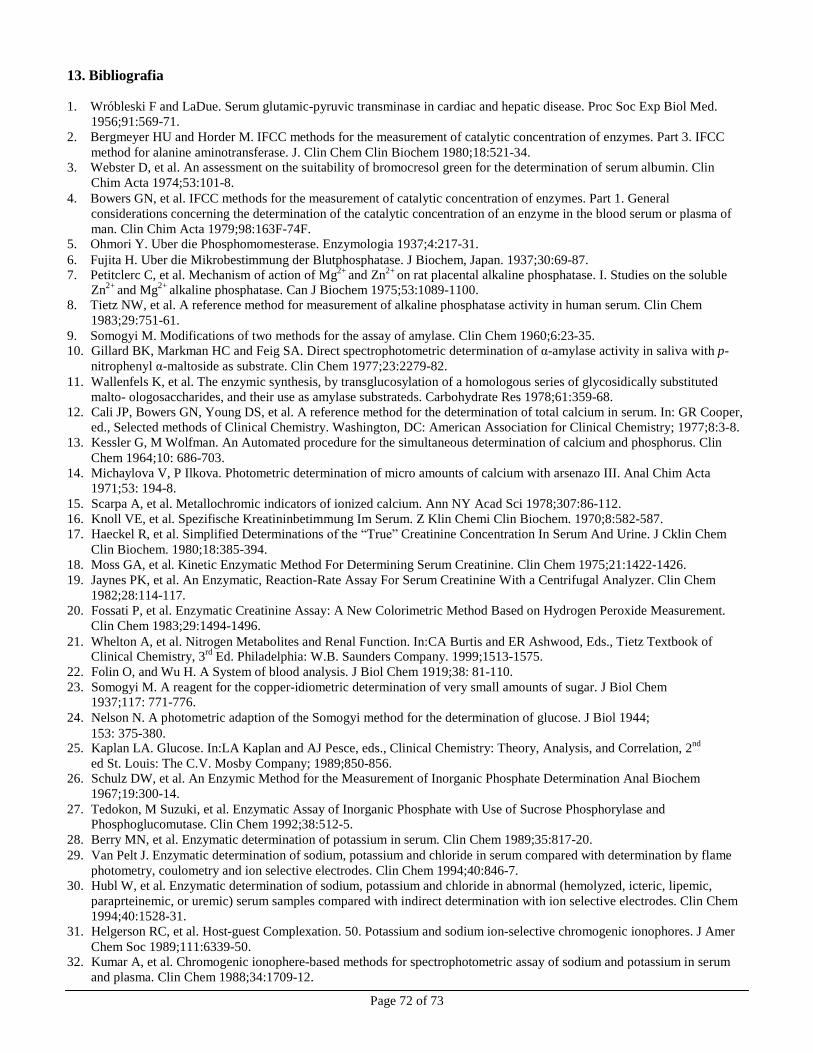
Page 72 of 73
13. Bibliografia
1. Wróbleski F and LaDue. Serum glutamic-pyruvic transminase in cardiac and hepatic disease. Proc Soc Exp Biol Med.
1956;91:569-71.
2. Bergmeyer HU and Horder M. IFCC methods for the measurement of catalytic concentration of enzymes. Part 3. IFCC
method for alanine aminotransferase. J. Clin Chem Clin Biochem 1980;18:521-34. 3. Webster D, et al. An assessment on the suitability of bromocresol green for the determination of serum albumin. Clin
Chim Acta 1974;53:101-8.
4. Bowers GN, et al. IFCC methods for the measurement of catalytic concentration of enzymes. Part 1. General
considerations concerning the determination of the catalytic concentration of an enzyme in the blood serum or plasma of
man. Clin Chim Acta 1979;98:163F-74F. 5. Ohmori Y. Uber die Phosphomomesterase. Enzymologia 1937;4:217-31.
6. Fujita H. Uber die Mikrobestimmung der Blutphosphatase. J Biochem, Japan. 1937;30:69-87.
7. Petitclerc C, et al. Mechanism of action of Mg2+ and Zn2+ on rat placental alkaline phosphatase. I. Studies on the soluble
Zn2+
and Mg2+
alkaline phosphatase. Can J Biochem 1975;53:1089-1100. 8. Tietz NW, et al. A reference method for measurement of alkaline phosphatase activity in human serum. Clin Chem
1983;29:751-61.
9. Somogyi M. Modifications of two methods for the assay of amylase. Clin Chem 1960;6:23-35. 10. Gillard BK, Markman HC and Feig SA. Direct spectrophotometric determination of α-amylase activity in saliva with p-
nitrophenyl α-maltoside as substrate. Clin Chem 1977;23:2279-82.
11. Wallenfels K, et al. The enzymic synthesis, by transglucosylation of a homologous series of glycosidically substituted
malto- ologosaccharides, and their use as amylase substrateds. Carbohydrate Res 1978;61:359-68.
12. Cali JP, Bowers GN, Young DS, et al. A reference method for the determination of total calcium in serum. In: GR Cooper,
ed., Selected methods of Clinical Chemistry. Washington, DC: American Association for Clinical Chemistry; 1977;8:3-8.
13. Kessler G, M Wolfman. An Automated procedure for the simultaneous determination of calcium and phosphorus. Clin
Chem 1964;10: 686-703.
14. Michaylova V, P Ilkova. Photometric determination of micro amounts of calcium with arsenazo III. Anal Chim Acta
1971;53: 194-8.
15. Scarpa A, et al. Metallochromic indicators of ionized calcium. Ann NY Acad Sci 1978;307:86-112.
16. Knoll VE, et al. Spezifische Kreatininbetimmung Im Serum. Z Klin Chemi Clin Biochem. 1970;8:582-587.
17. Haeckel R, et al. Simplified Determinations of the “True” Creatinine Concentration In Serum And Urine. J Cklin Chem
Clin Biochem. 1980;18:385-394.
18. Moss GA, et al. Kinetic Enzymatic Method For Determining Serum Creatinine. Clin Chem 1975;21:1422-1426.
19. Jaynes PK, et al. An Enzymatic, Reaction-Rate Assay For Serum Creatinine With a Centrifugal Analyzer. Clin Chem
1982;28:114-117.
20. Fossati P, et al. Enzymatic Creatinine Assay: A New Colorimetric Method Based on Hydrogen Peroxide Measurement.
Clin Chem 1983;29:1494-1496.
21. Whelton A, et al. Nitrogen Metabolites and Renal Function. In:CA Burtis and ER Ashwood, Eds., Tietz Textbook of
Clinical Chemistry, 3rd
Ed. Philadelphia: W.B. Saunders Company. 1999;1513-1575.
22. Folin O, and Wu H. A System of blood analysis. J Biol Chem 1919;38: 81-110.
23. Somogyi M. A reagent for the copper-idiometric determination of very small amounts of sugar. J Biol Chem 1937;117: 771-776.
24. Nelson N. A photometric adaption of the Somogyi method for the determination of glucose. J Biol 1944;
153: 375-380.
25. Kaplan LA. Glucose. In:LA Kaplan and AJ Pesce, eds., Clinical Chemistry: Theory, Analysis, and Correlation, 2nd
ed St. Louis: The C.V. Mosby Company; 1989;850-856. 26. Schulz DW, et al. An Enzymic Method for the Measurement of Inorganic Phosphate Determination Anal Biochem
1967;19:300-14.
27. Tedokon, M Suzuki, et al. Enzymatic Assay of Inorganic Phosphate with Use of Sucrose Phosphorylase and Phosphoglucomutase. Clin Chem 1992;38:512-5.
28. Berry MN, et al. Enzymatic determination of potassium in serum. Clin Chem 1989;35:817-20.
29. Van Pelt J. Enzymatic determination of sodium, potassium and chloride in serum compared with determination by flame
photometry, coulometry and ion selective electrodes. Clin Chem 1994;40:846-7.
30. Hubl W, et al. Enzymatic determination of sodium, potassium and chloride in abnormal (hemolyzed, icteric, lipemic,
paraprteinemic, or uremic) serum samples compared with indirect determination with ion selective electrodes. Clin Chem
1994;40:1528-31.
31. Helgerson RC, et al. Host-guest Complexation. 50. Potassium and sodium ion-selective chromogenic ionophores. J Amer
Chem Soc 1989;111:6339-50. 32. Kumar A, et al. Chromogenic ionophere-based methods for spectrophotometric assay of sodium and potassium in serum
and plasma. Clin Chem 1988;34:1709-12.
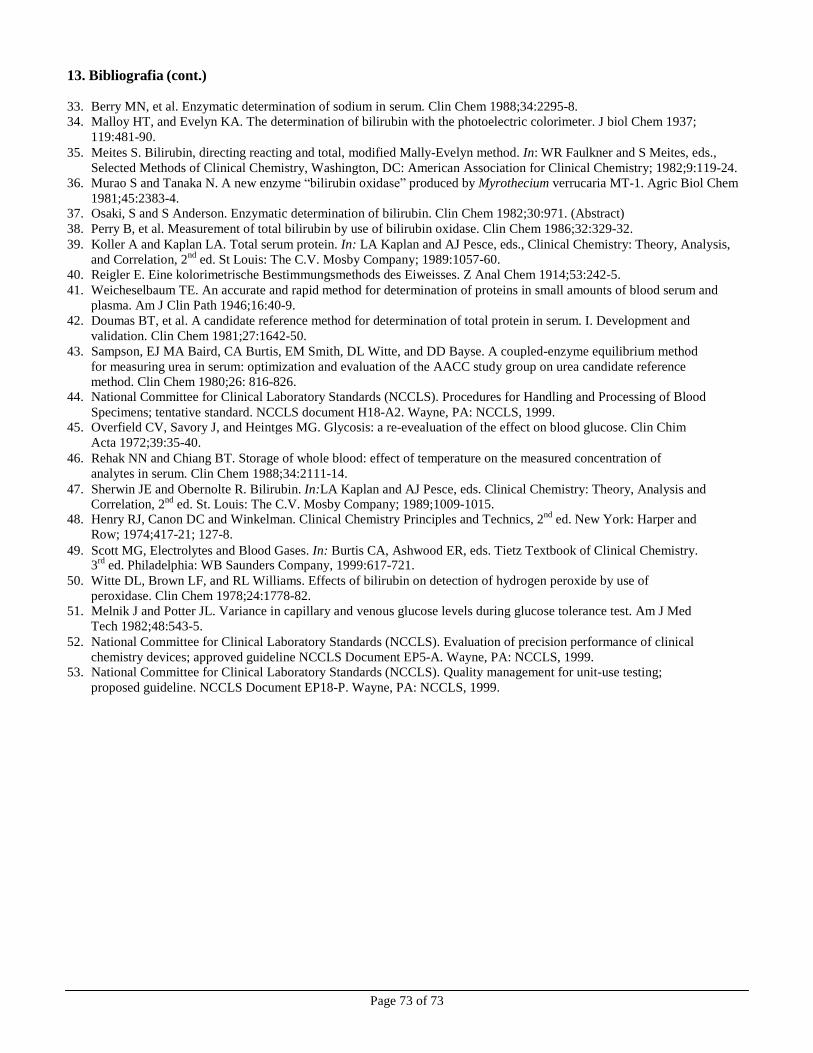
Page 73 of 73
13. Bibliografia (cont.)
33. Berry MN, et al. Enzymatic determination of sodium in serum. Clin Chem 1988;34:2295-8.
34. Malloy HT, and Evelyn KA. The determination of bilirubin with the photoelectric colorimeter. J biol Chem 1937;
119:481-90.
35. Meites S. Bilirubin, directing reacting and total, modified Mally-Evelyn method. In: WR Faulkner and S Meites, eds.,
Selected Methods of Clinical Chemistry, Washington, DC: American Association for Clinical Chemistry; 1982;9:119-24.
36. Murao S and Tanaka N. A new enzyme “bilirubin oxidase” produced by Myrothecium verrucaria MT-1. Agric Biol Chem
1981;45:2383-4. 37. Osaki, S and S Anderson. Enzymatic determination of bilirubin. Clin Chem 1982;30:971. (Abstract)
38. Perry B, et al. Measurement of total bilirubin by use of bilirubin oxidase. Clin Chem 1986;32:329-32.
39. Koller A and Kaplan LA. Total serum protein. In: LA Kaplan and AJ Pesce, eds., Clinical Chemistry: Theory, Analysis,
and Correlation, 2nd
ed. St Louis: The C.V. Mosby Company; 1989:1057-60.
40. Reigler E. Eine kolorimetrische Bestimmungsmethods des Eiweisses. Z Anal Chem 1914;53:242-5.
41. Weicheselbaum TE. An accurate and rapid method for determination of proteins in small amounts of blood serum and
plasma. Am J Clin Path 1946;16:40-9.
42. Doumas BT, et al. A candidate reference method for determination of total protein in serum. I. Development and
validation. Clin Chem 1981;27:1642-50.
43. Sampson, EJ MA Baird, CA Burtis, EM Smith, DL Witte, and DD Bayse. A coupled-enzyme equilibrium method
for measuring urea in serum: optimization and evaluation of the AACC study group on urea candidate reference
method. Clin Chem 1980;26: 816-826. 44. National Committee for Clinical Laboratory Standards (NCCLS). Procedures for Handling and Processing of Blood
Specimens; tentative standard. NCCLS document H18-A2. Wayne, PA: NCCLS, 1999. 45. Overfield CV, Savory J, and Heintges MG. Glycosis: a re-evealuation of the effect on blood glucose. Clin Chim
Acta 1972;39:35-40.
46. Rehak NN and Chiang BT. Storage of whole blood: effect of temperature on the measured concentration of
analytes in serum. Clin Chem 1988;34:2111-14.
47. Sherwin JE and Obernolte R. Bilirubin. In:LA Kaplan and AJ Pesce, eds. Clinical Chemistry: Theory, Analysis and
Correlation, 2nd ed. St. Louis: The C.V. Mosby Company; 1989;1009-1015.
48. Henry RJ, Canon DC and Winkelman. Clinical Chemistry Principles and Technics, 2nd
ed. New York: Harper and
Row; 1974;417-21; 127-8.
49. Scott MG, Electrolytes and Blood Gases. In: Burtis CA, Ashwood ER, eds. Tietz Textbook of Clinical Chemistry.
3rd
ed. Philadelphia: WB Saunders Company, 1999:617-721.
50. Witte DL, Brown LF, and RL Williams. Effects of bilirubin on detection of hydrogen peroxide by use of
peroxidase. Clin Chem 1978;24:1778-82.
51. Melnik J and Potter JL. Variance in capillary and venous glucose levels during glucose tolerance test. Am J Med
Tech 1982;48:543-5.
52. National Committee for Clinical Laboratory Standards (NCCLS). Evaluation of precision performance of clinical
chemistry devices; approved guideline NCCLS Document EP5-A. Wayne, PA: NCCLS, 1999. 53. National Committee for Clinical Laboratory Standards (NCCLS). Quality management for unit-use testing;
proposed guideline. NCCLS Document EP18-P. Wayne, PA: NCCLS, 1999.