Embed Size (px)
Citation preview
Veteran Homelessness:Risk FactorsVeteran Homelessness:Risk Factors and Effective Services1
Robert Rosenheck MDYale Medical School
VA New England MIRECCVA New England MIRECCMay 21, 2013
1. Based in part on “Rosenheck RA. Service Models for Assisting Homeless People with Mental Health Problems: Cost-Effectiveness and Policy Relevance in Ellen IG and O’Flaherty B (Eds.) How to House the Homeless. New York: Russell Sage Foundation, 2010.”
Risk factors for Homelessness Among Veterans: Highlights Alcohol and Drug Abuse increase risk 2-5 times
stronger risk risk factor than mental illness alone (NCS NESARCH Edens et al 2011)(NCS, NESARCH, Edens et al. 2011)
VA service connection is strongest measurable protective factor, reducing homelessness risk by 62% (greater than 50% SC) or 47% (lessby 62% (greater than 50% SC) or 47% (less than 50% SC)
OEF/OIF veterans were 65% less likely to have b h l th th tbeen homeless than other veterans
Female veterans 3-4 times greater risk than female non-veterans
Edens E, Kasprow W, Tsai, Rosenheck RA (2011). Association of Substance use and VA service-connected disability benefits with risk of homelessness among veterans. The American Journal on Addictions;20 (5): 412-419.
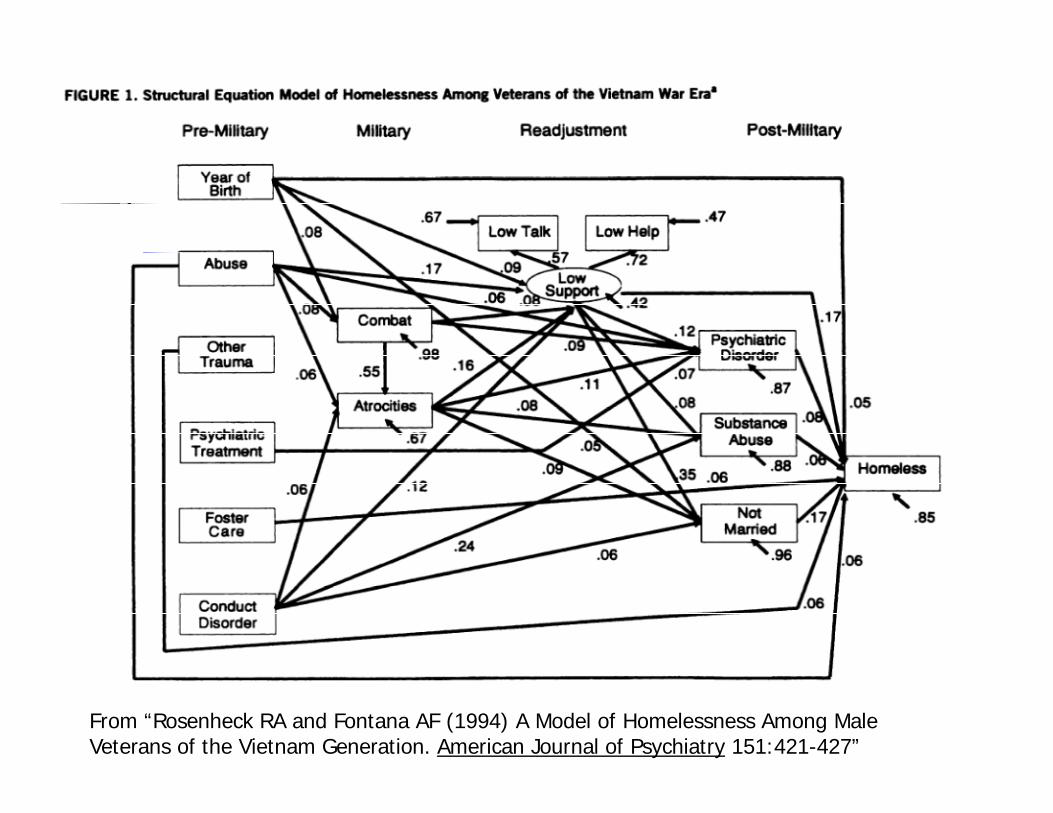
From “Rosenheck RA and Fontana AF (1994) A Model of Homelessness Among Male Veterans of the Vietnam Generation. American Journal of Psychiatry 151:421-427”
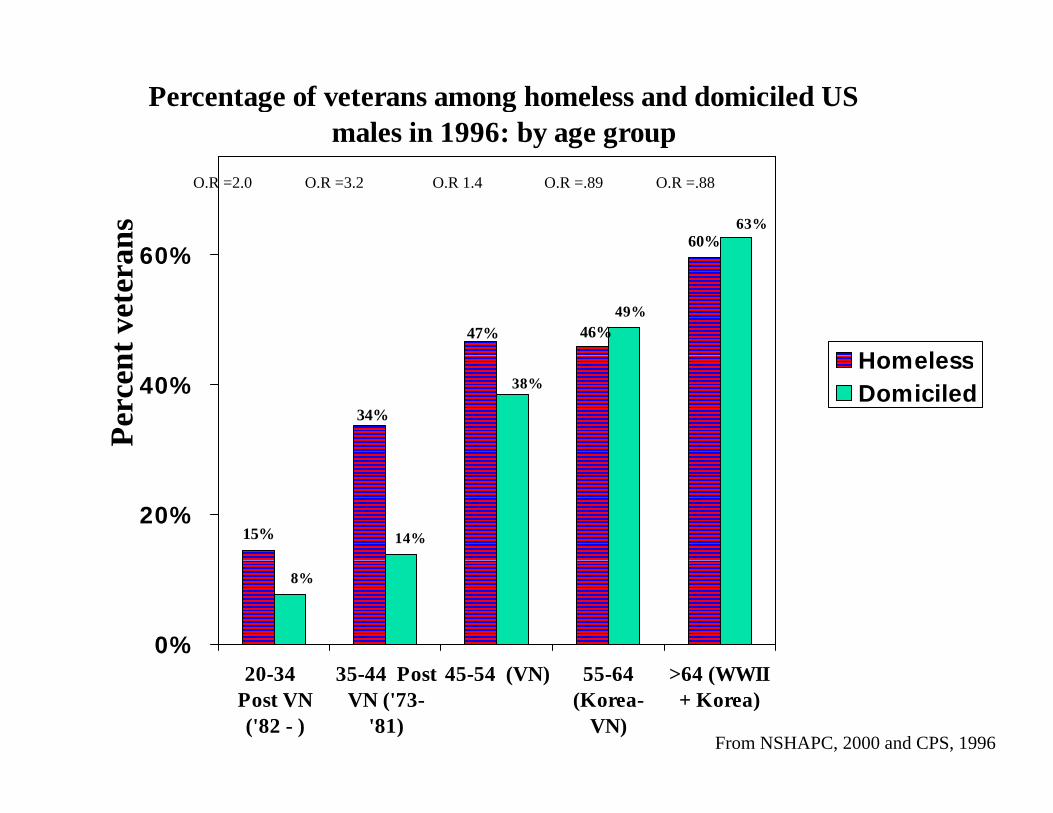
Percentage of veterans among homeless and domiciled US males in 1996: by age group
60%63%
60%ans
O.R =2.0 O.R =3.2 O.R 1.4 O.R =.89 O.R =.88
47% 46%49%
60%
nt v
eter
a
Homeless
34%
38%40%
Perc
en HomelessDomiciled
15% 14%20%
8%
0%20-34
Post VN('82 - )
35-44 PostVN ('73-
'81)
45-54 (VN) 55-64(Korea-
VN)
>64 (WWII+ Korea)
From NSHAPC, 2000 and CPS, 1996
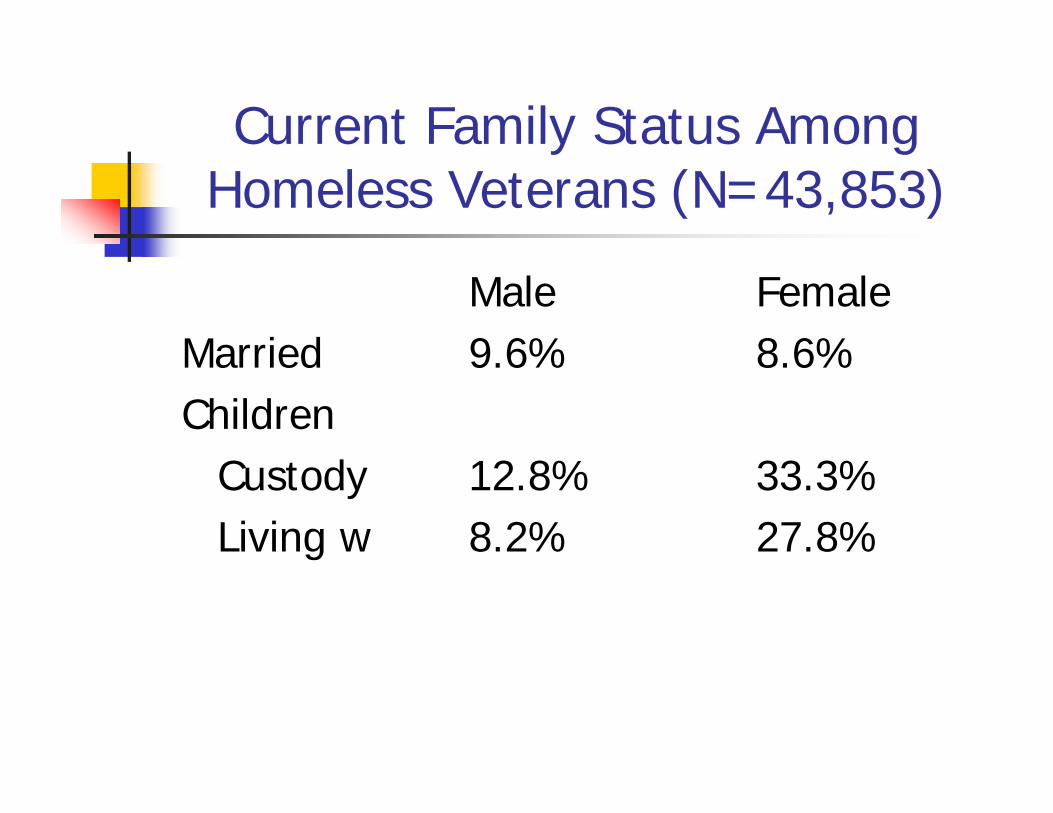
Current Family Status Among y gHomeless Veterans (N=43,853)
Male FemaleMarried 9 6% 8 6%Married 9.6% 8.6%Children
dCustody 12.8% 33.3%Living w 8.2% 27.8%
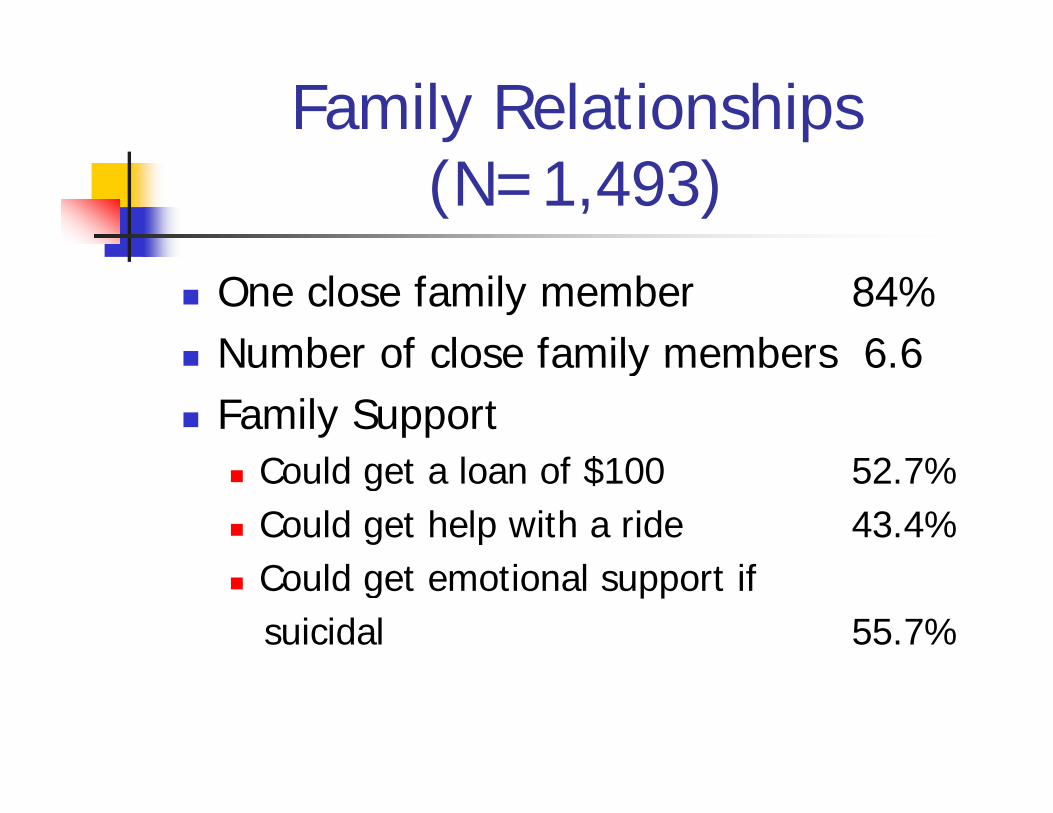
Family Relationships (N=1,493)
One close family member 84% Number of close family members 6 6 Number of close family members 6.6 Family Support
C ld t l f $100 52 7% Could get a loan of $100 52.7% Could get help with a ride 43.4% Could get emotional support if
suicidal 55.7%
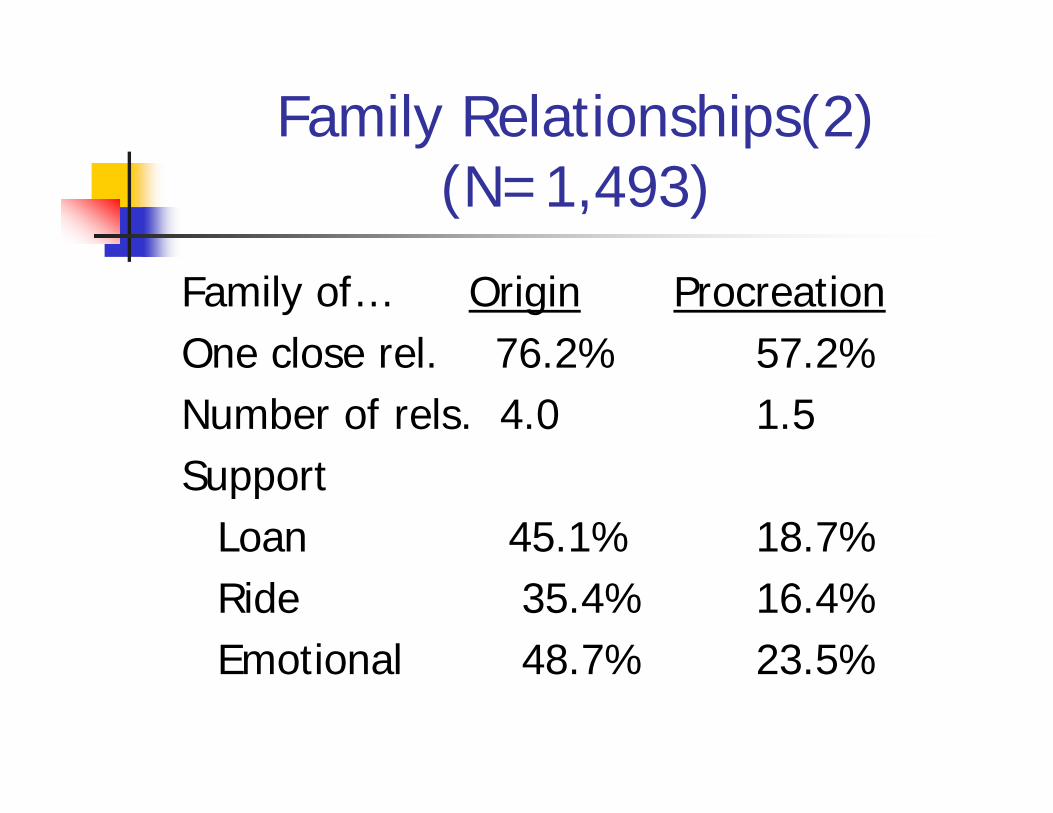
Family Relationships(2) (N=1,493)
Family of… Origin ProcreationOne close rel 76 2% 57 2%One close rel. 76.2% 57.2%Number of rels. 4.0 1.5Support
Loan 45.1% 18.7%Ride 35.4% 16.4%Emotional 48 7% 23 5%Emotional 48.7% 23.5%
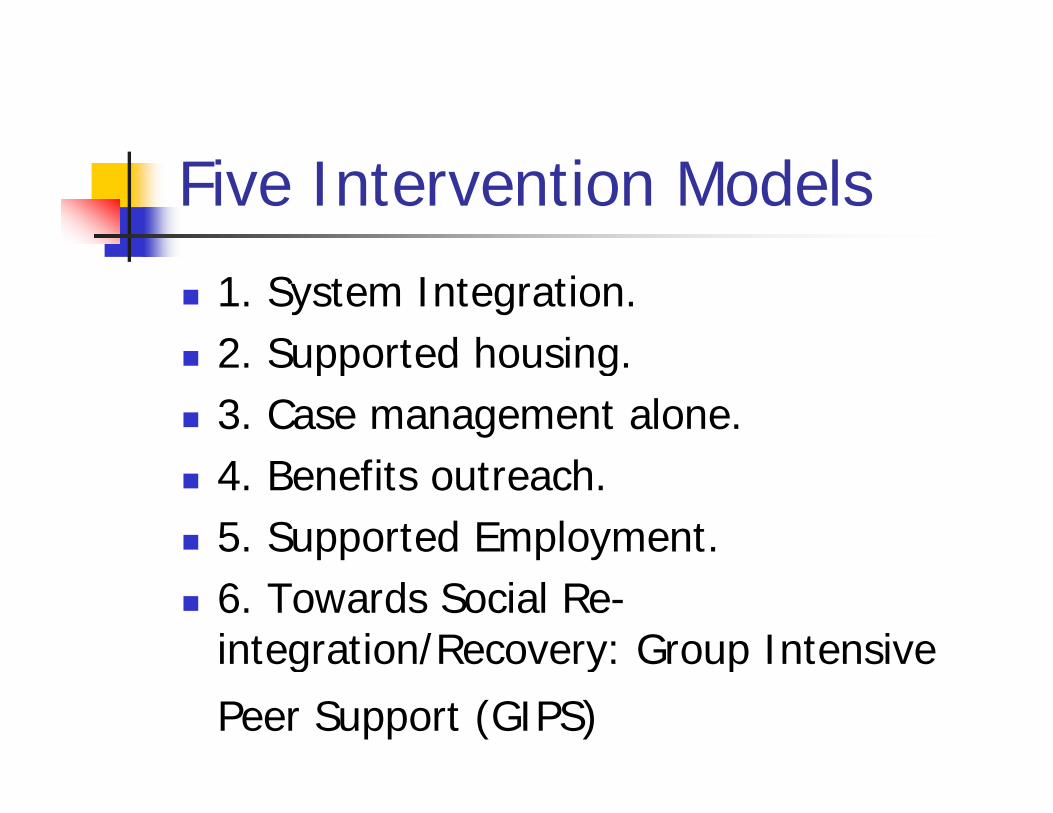
Five Intervention Models
1. System Integration. 2 Supported housing 2. Supported housing. 3. Case management alone.
f h 4. Benefits outreach. 5. Supported Employment. 6. Towards Social Re-
integration/Recovery: Group Intensiveintegration/Recovery: Group Intensive
Peer Support (GIPS)
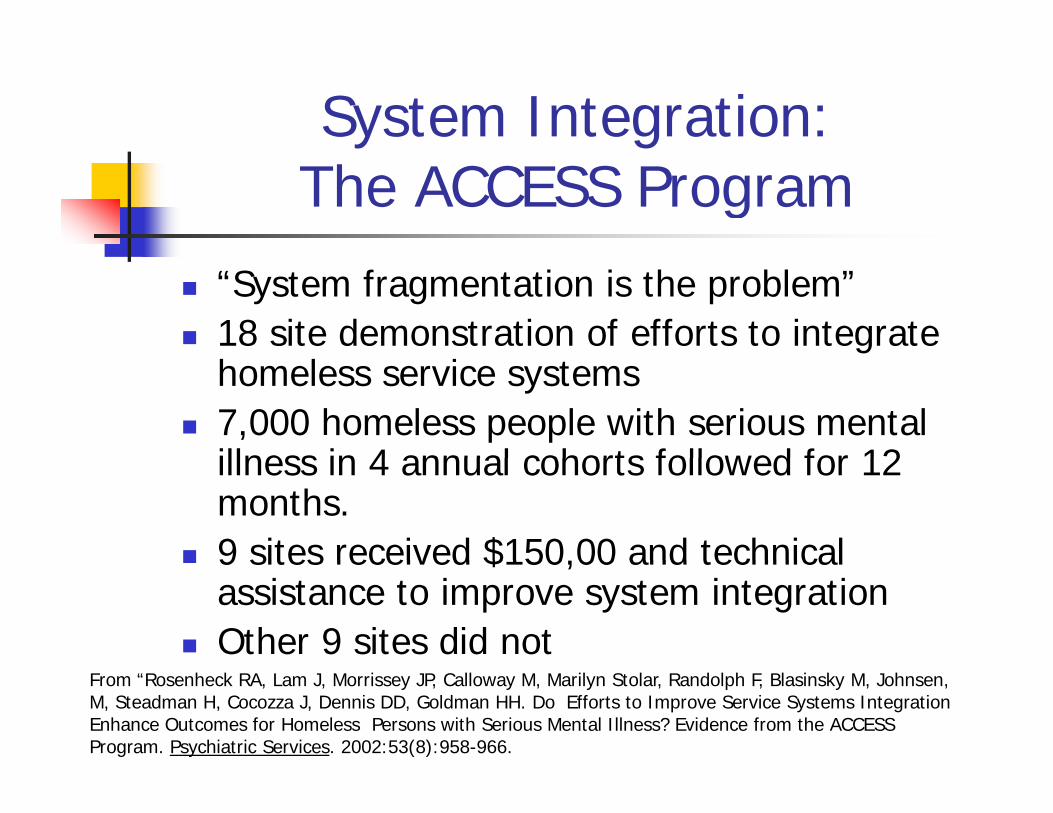
System Integration: The ACCESS Program
“System fragmentation is the problem” 18 site demonstration of efforts to integrate
homeless service systems 7,000 homeless people with serious mental
illness in 4 annual cohorts followed for 12illness in 4 annual cohorts followed for 12 months.
9 sites received $150,00 and technical 9 sites received $150,00 and technical assistance to improve system integration
Other 9 sites did notFrom “Rosenheck RA, Lam J, Morrissey JP, Calloway M, Marilyn Stolar, Randolph F, Blasinsky M, Johnsen, M, Steadman H, Cocozza J, Dennis DD, Goldman HH. Do Efforts to Improve Service Systems Integration Enhance Outcomes for Homeless Persons with Serious Mental Illness? Evidence from the ACCESS Program. Psychiatric Services. 2002:53(8):958-966.
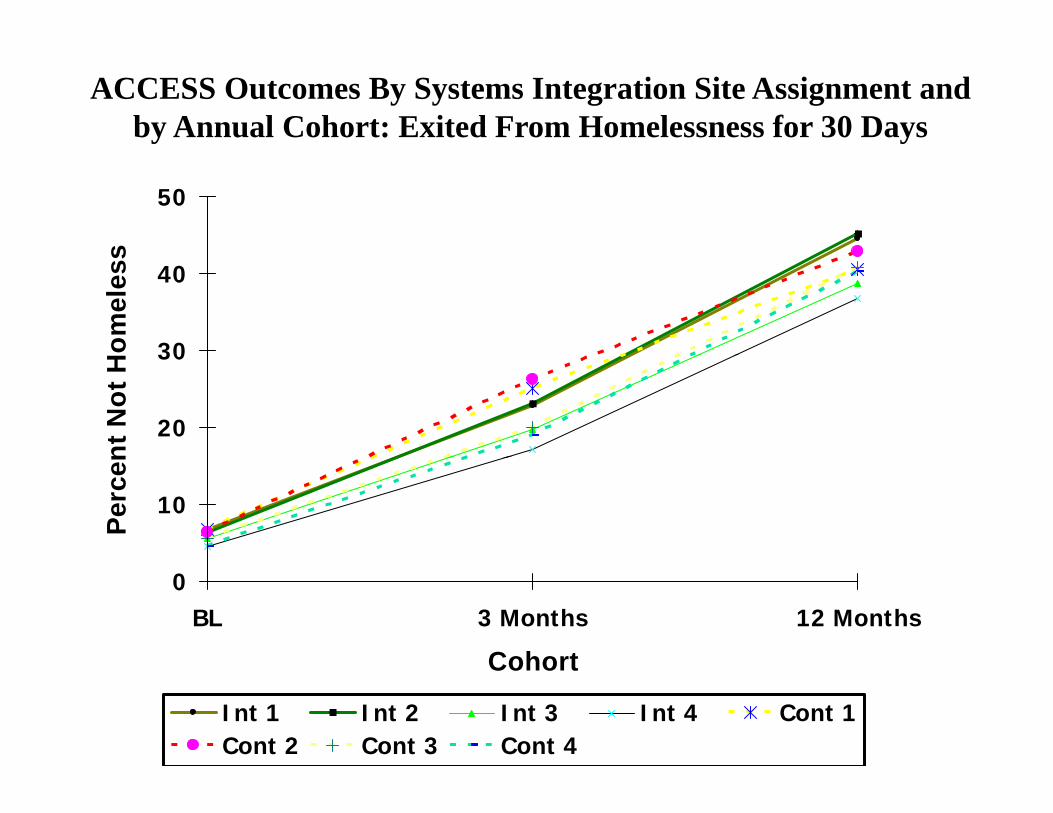
ACCESS Outcomes By Systems Integration Site Assignment and by Annual Cohort: Exited From Homelessness for 30 Days
50
s
30
40
omel
ess
20
30
nt N
ot H
10
Perc
en
0BL 3 Months 12 Months
CohortCohort
Int 1 Int 2 Int 3 Int 4 Cont 1Cont 2 Cont 3 Cont 4
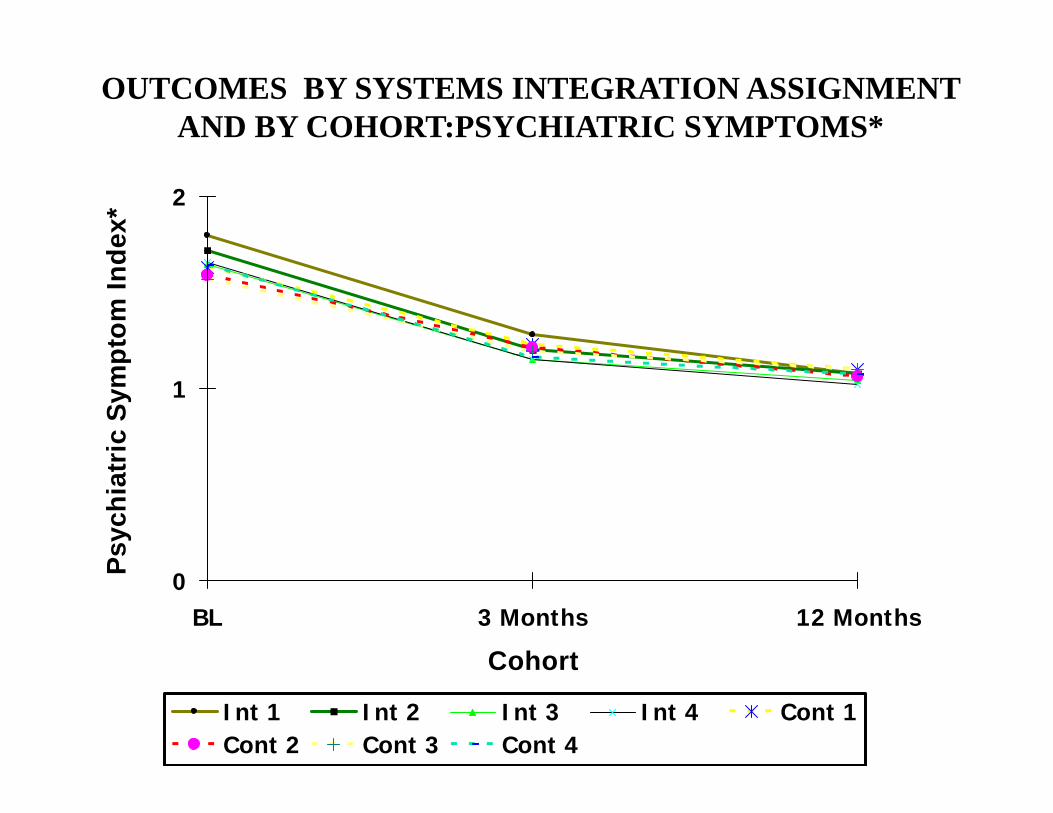
OUTCOMES BY SYSTEMS INTEGRATION ASSIGNMENT AND BY COHORT:PSYCHIATRIC SYMPTOMS*
2
dex*
ptom
Ind
1
ric
Sym
pPs
ychi
atr
0BL 3 Months 12 Months
Cohort
P
Cohort
Int 1 Int 2 Int 3 Int 4 Cont 1Cont 2 Cont 3 Cont 4
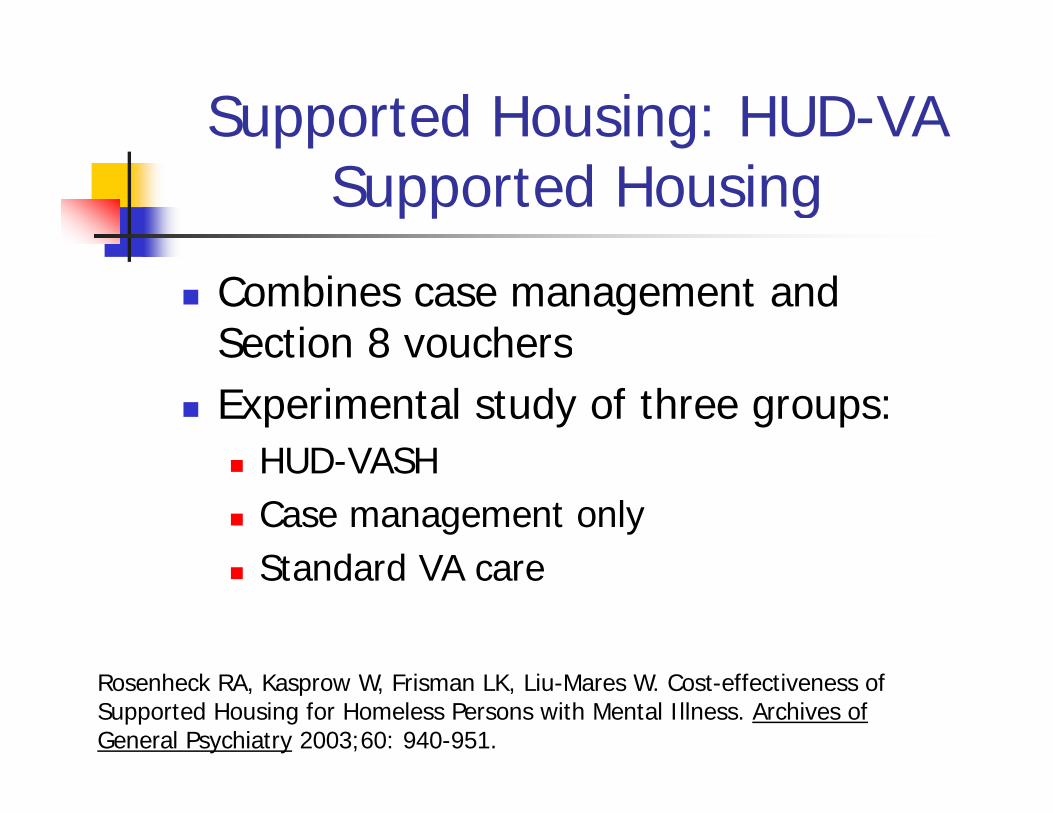
Supported Housing: HUD-VA Supported Housing
Combines case management and Section 8 vouchersSection 8 vouchers
Experimental study of three groups:HUD VASH HUD-VASH
Case management onlyStandard VA care Standard VA care
Rosenheck RA, Kasprow W, Frisman LK, Liu-Mares W. Cost-effectiveness of Supported Housing for Homeless Persons with Mental Illness. Archives of General Psychiatry 2003;60: 940-951.
Days housed in past 90: HUD VASH Experimental Evaluation
90
65% days housed
60
ast 9
0
57% days housed
hts i
n pa
HUD-VASH exp. :N=182
53% days housed
30Nig
h N 182Case mgt. N=90
Std. care: N=188
Key:0
Baseline 6 mos.*# 1 year *# 18 mos. *# 2 years*# 3 years
Key:
*Group 1>2, p<.05
#Group 1>3, p<.05
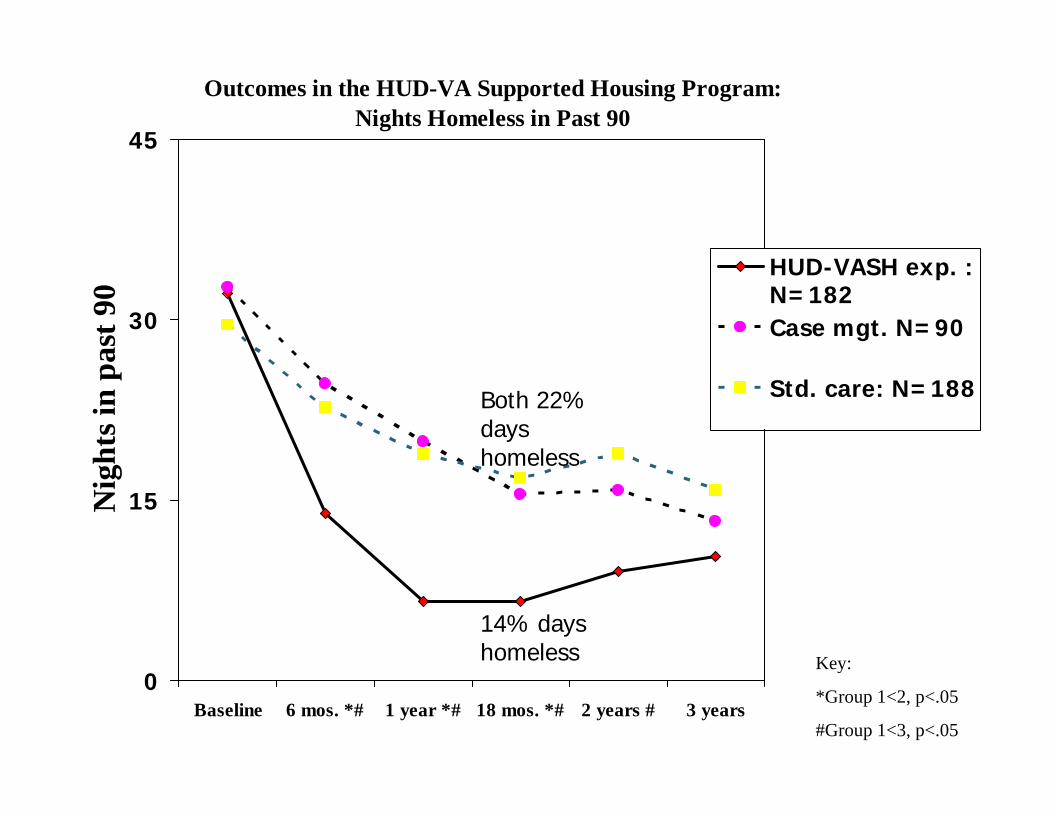
Outcomes in the HUD-VA Supported Housing Program:Nights Homeless in Past 90
45
30
ast 9
0
HUD-VASH exp. :N=182Case mgt. N=90
hts i
n pa
Std. care: N=188Both 22% days homeless
15Nig
h homeless
Key:
14% days homeless
0Baseline 6 mos. *# 1 year *# 18 mos. *# 2 years # 3 years
Key:
*Group 1<2, p<.05
#Group 1<3, p<.05
Other HUD-VASH Benefits
Superior therapeutic allianceM i l More social support
Reduced alcohol and drug use Reduced alcohol and drug use
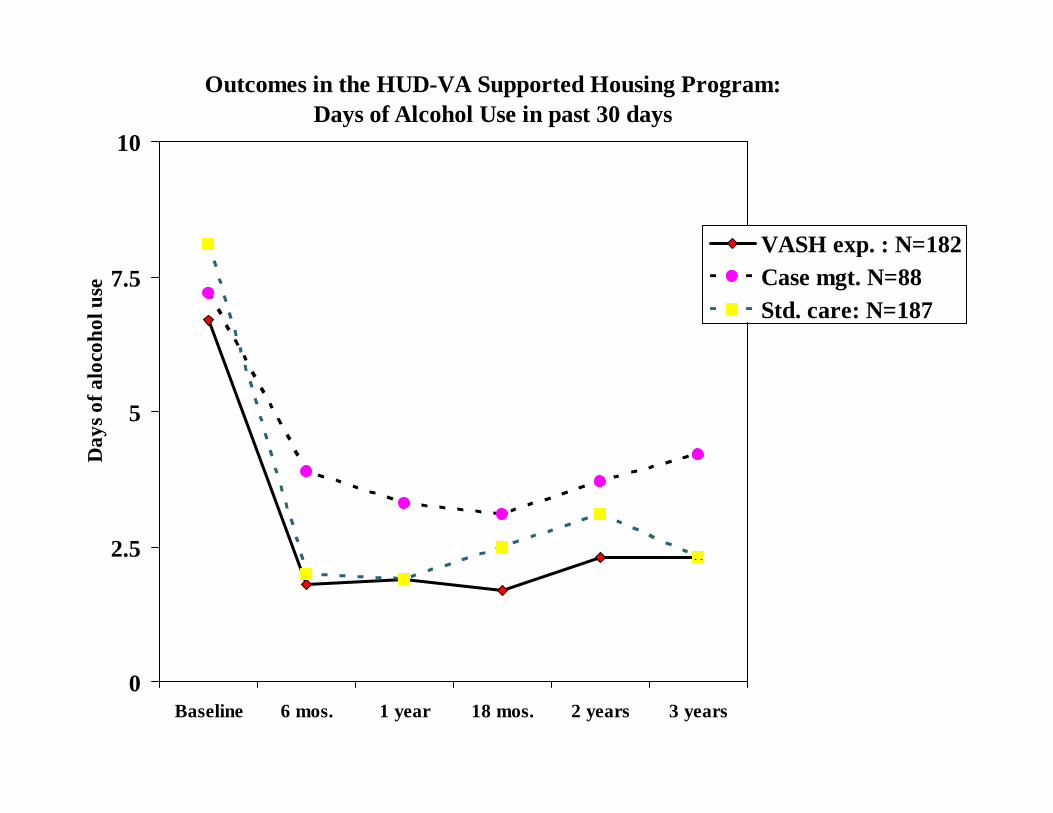
Outcomes in the HUD-VA Supported Housing Program:Days of Alcohol Use in past 30 days
1010
VASH exp. : N=1827.5
coho
l use
pCase mgt. N=88Std. care: N=187
5
Day
s of a
loc
2.5
D
0Baseline 6 mos. 1 year 18 mos. 2 years 3 years
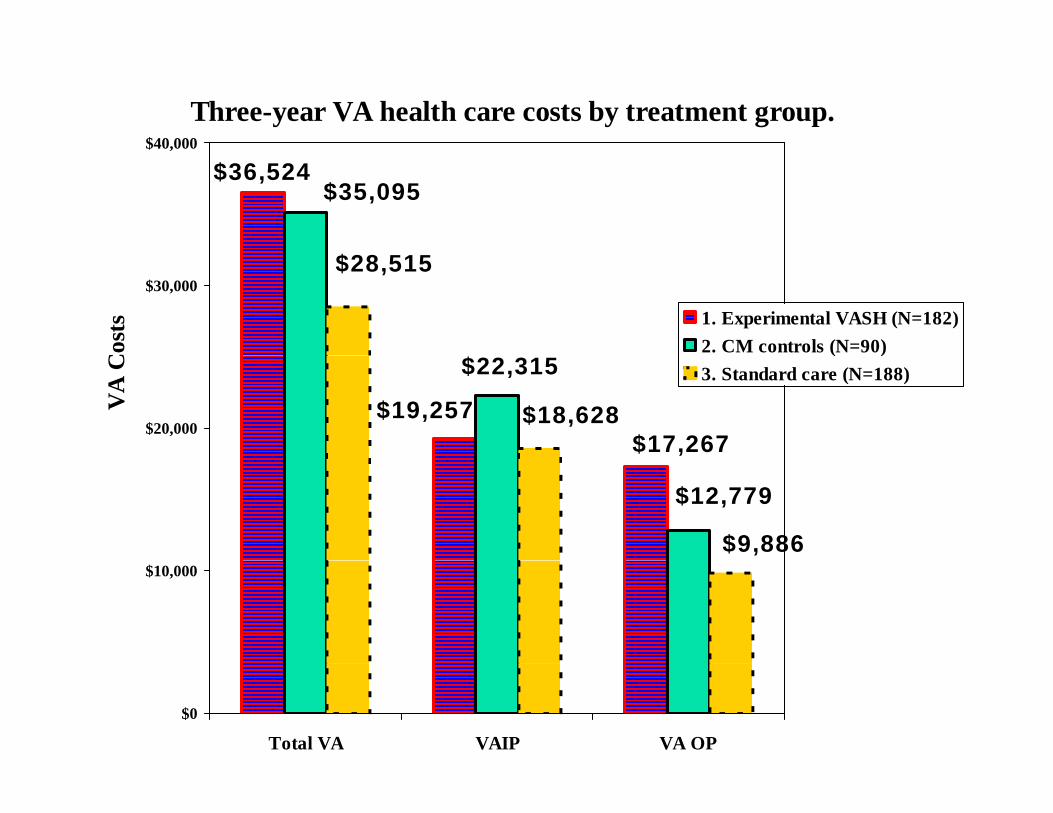
Three-year VA health care costs by treatment group.$40,000
$36,524$35,095
,
$28,515$30,000
Cos
ts 1. Experimental VASH (N=182)2. CM controls (N=90)
$17,267$19,257
$22,315
$18,628$20,000
VA
C
( )3. Standard care (N=188)
$12,779
$9,886$10,000
$0
Total VA VAIP VA OP
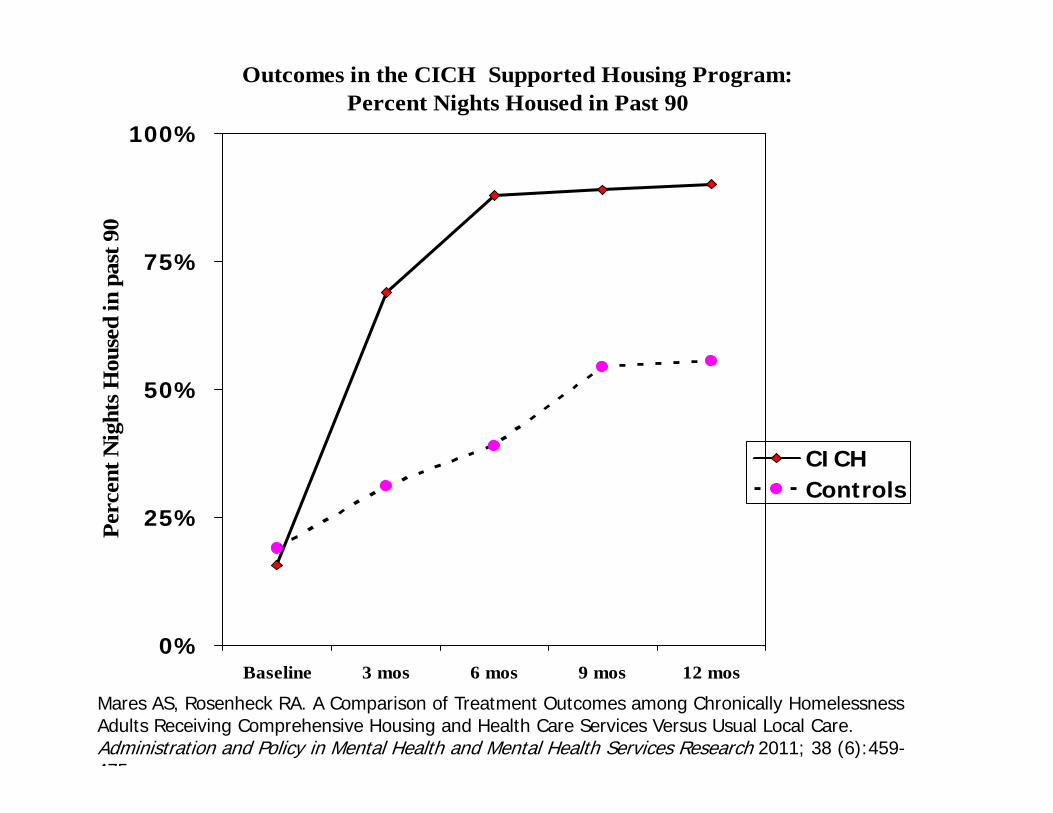
Outcomes in the CICH Supported Housing Program:Percent Nights Housed in Past 90
100%t 9
0
75%
used
in p
ast
50%
Nig
hts H
ou
CICH
25%Perc
ent CICH
Controls
0%Baseline 3 mos 6 mos 9 mos 12 mos
Mares AS, Rosenheck RA. A Comparison of Treatment Outcomes among Chronically Homelessness Adults Receiving Comprehensive Housing and Health Care Services Versus Usual Local Care. Administration and Policy in Mental Health and Mental Health Services Research 2011; 38 (6):459-475
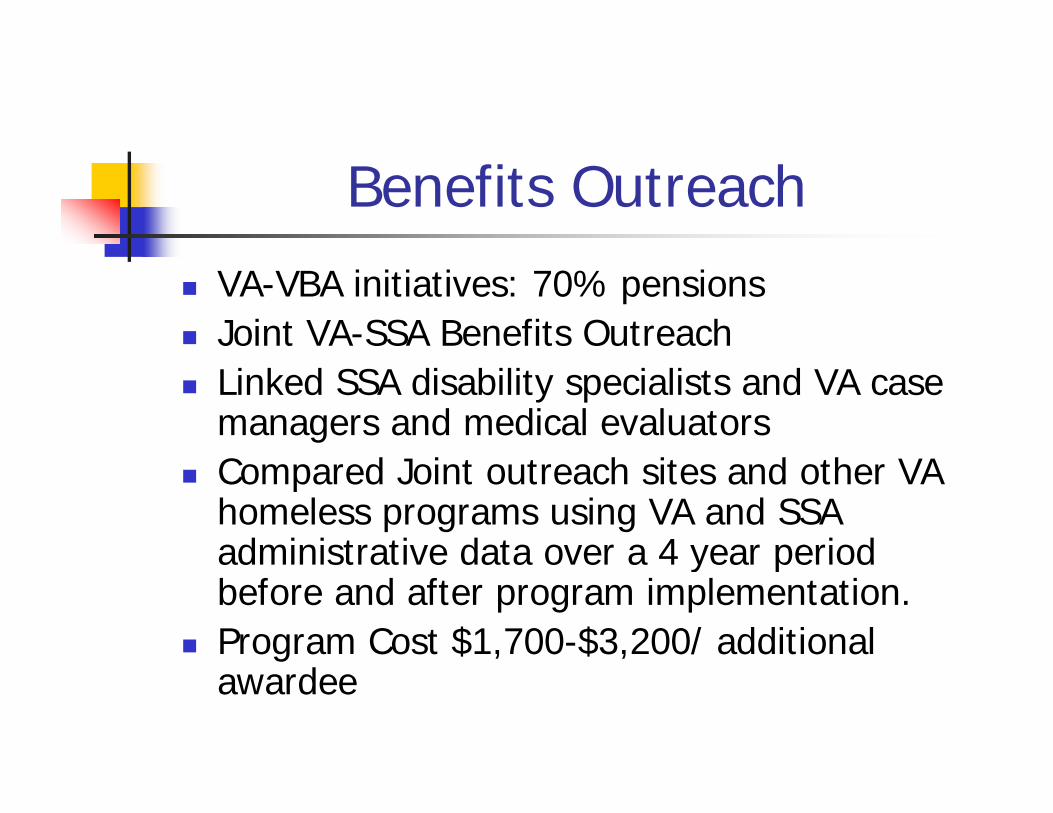
Benefits Outreach VA-VBA initiatives: 70% pensions Joint VA-SSA Benefits Outreach Linked SSA disability specialists and VA case
managers and medical evaluatorsC d J i h i d h VA Compared Joint outreach sites and other VA homeless programs using VA and SSA administrative data over a 4 year periodadministrative data over a 4 year period before and after program implementation.
Program Cost $1,700-$3,200/ additional awardee
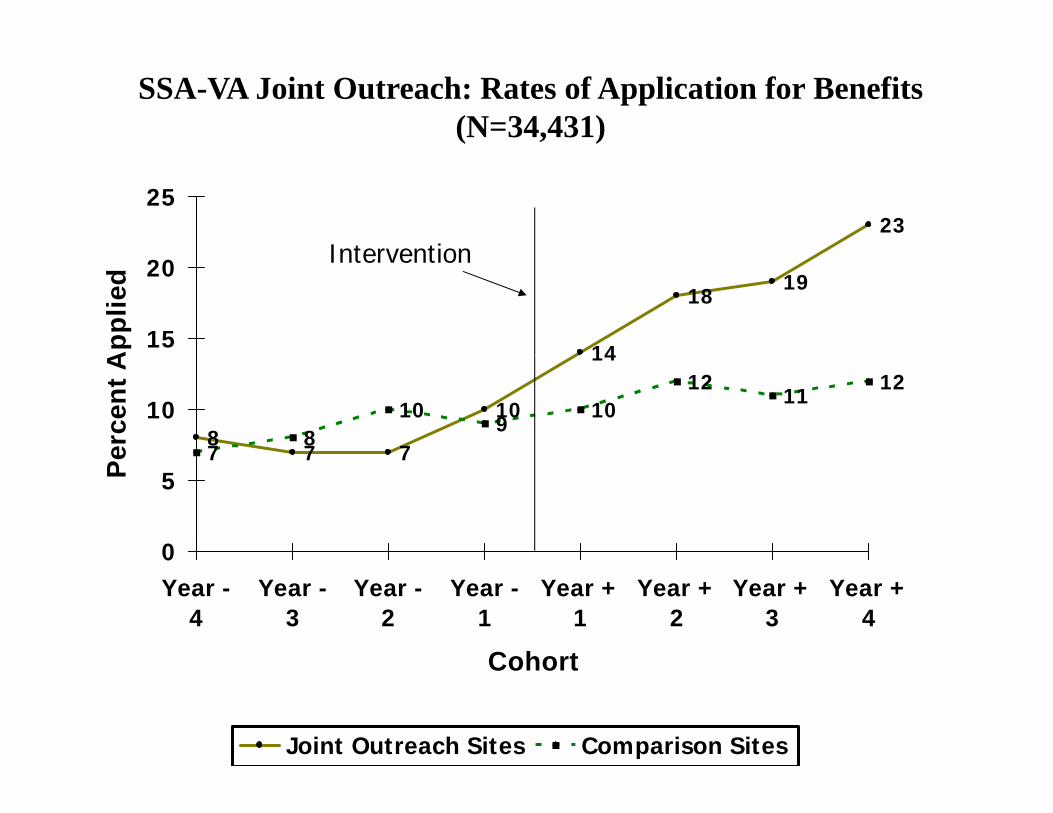
SSA-VA Joint Outreach: Rates of Application for Benefits (N=34,431)
2325
Intervention
14
1819
15
20
App
lied
Intervention
87 7
10
14
78
109
1012
1112
10
erce
nt A
7 77
0
5Pe
0Year -
4Year -
3Year -
2Year -
1Year +
1Year +
2Year +
3Year +
4
CohortCohort
Joint Outreach Sites Comparison Sites
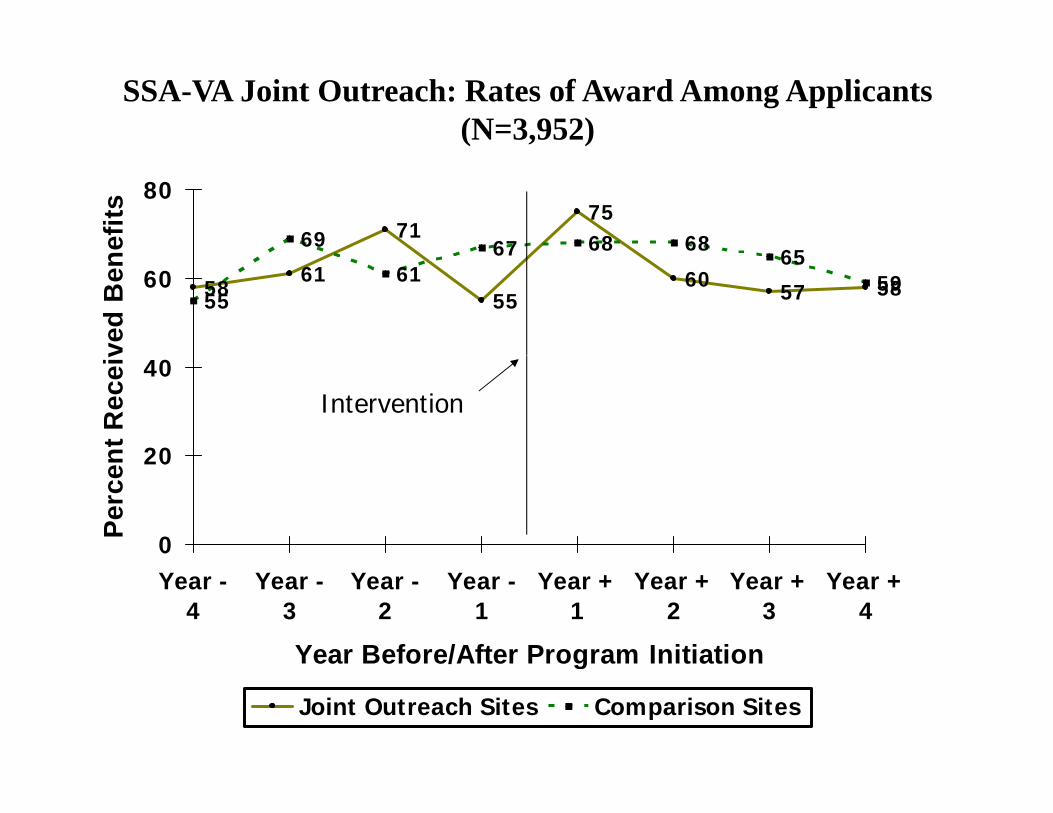
SSA-VA Joint Outreach: Rates of Award Among Applicants (N=3,952)
7175
69 67 68 6865
80
efits
5861
5560 57 5855
6167 65
5960
ved
Ben
20
40
nt R
ecei
v
Intervention
0
20
Perc
en
Year -4
Year -3
Year -2
Year -1
Year +1
Year +2
Year +3
Year +4
Year Before/After Program InitiationYear Before/After Program Initiation
Joint Outreach Sites Comparison Sites
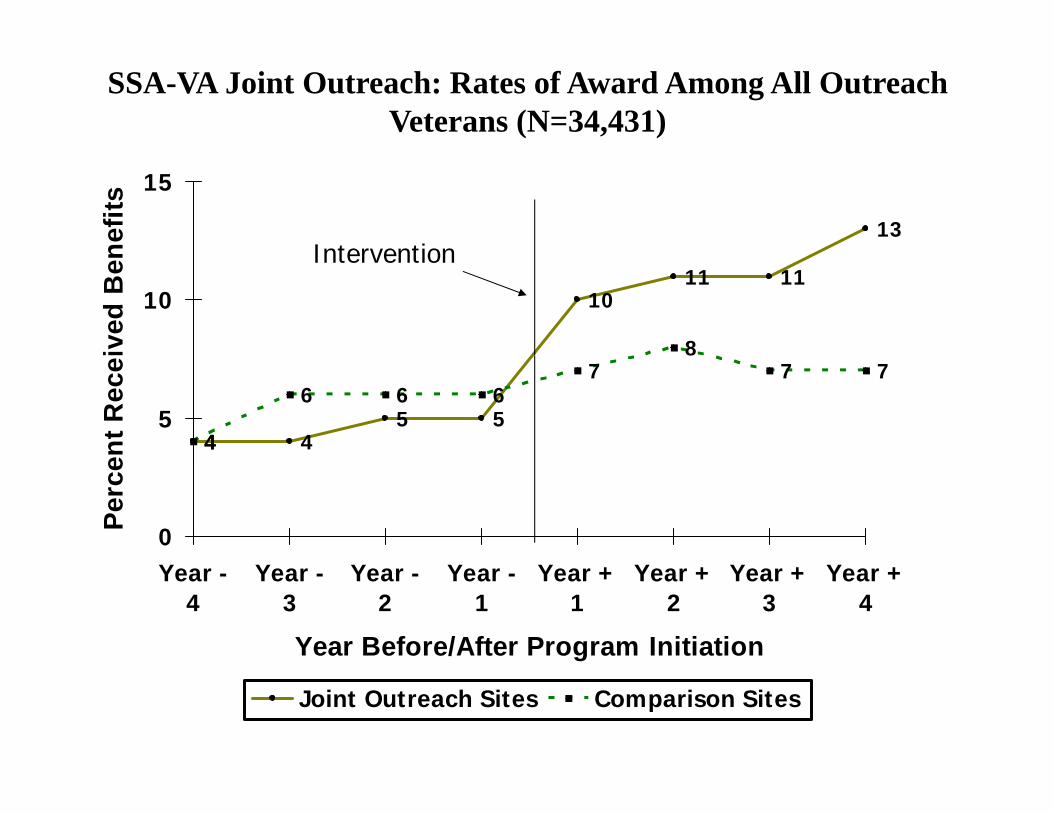
SSA-VA Joint Outreach: Rates of Award Among All Outreach Veterans (N=34,431)
13
15
nefit
s
Intervention
1011 11
8
10
ived
Ben Intervention
4 45 5
4
6 6 67
87 7
5
ent R
ece
0Perc
e
Year -4
Year -3
Year -2
Year -1
Year +1
Year +2
Year +3
Year +4
Year Before/After Program Initiation
Joint Outreach Sites Comparison Sites
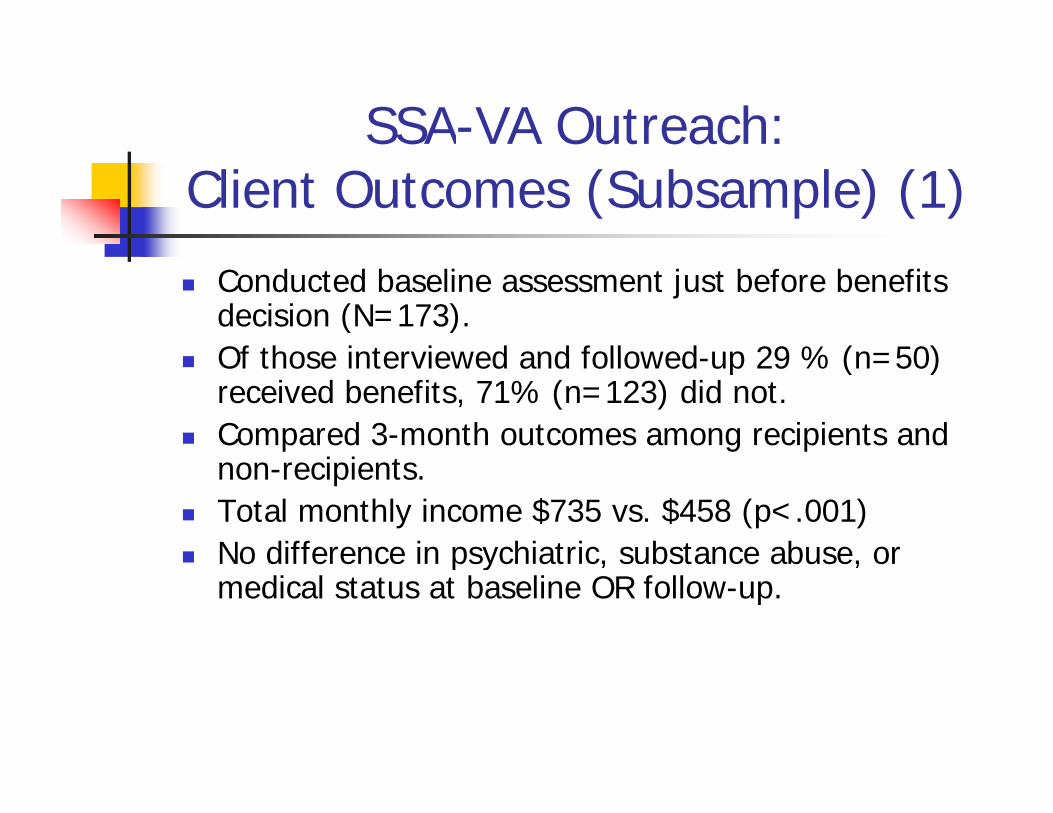
SSA-VA Outreach:Client Outcomes (Subsample) (1)
Conducted baseline assessment just before benefits decision (N=173).Of those interviewed and followed up 29 % (n=50) Of those interviewed and followed-up 29 % (n=50) received benefits, 71% (n=123) did not.
Compared 3-month outcomes among recipients and i i tnon-recipients.
Total monthly income $735 vs. $458 (p<.001) No difference in psychiatric, substance abuse, or No difference in psychiatric, substance abuse, or
medical status at baseline OR follow-up.
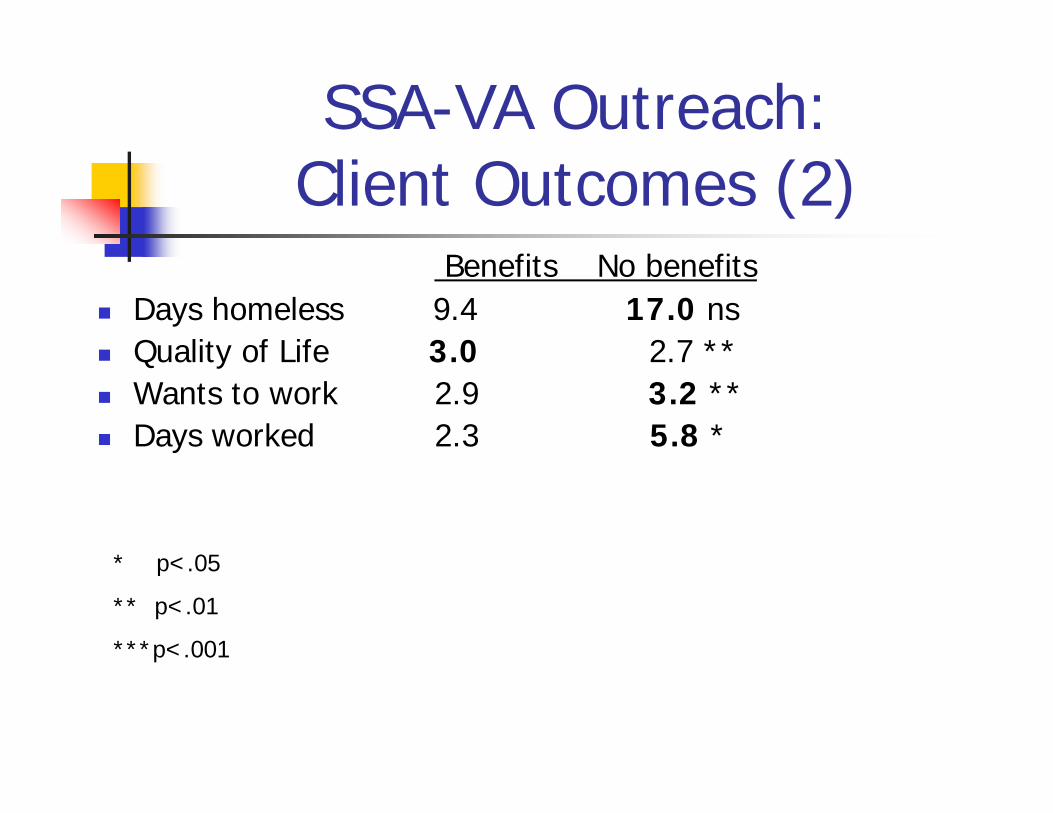
SSA-VA Outreach:Client Outcomes (2)
f b fBenefits No benefits Days homeless 9.4 17.0 ns Quality of Life 3 0 2 7 ** Quality of Life 3.0 2.7 Wants to work 2.9 3.2 ** Days worked 2.3 5.8 *
* p< 05* p<.05
** p<.01
***p<.001
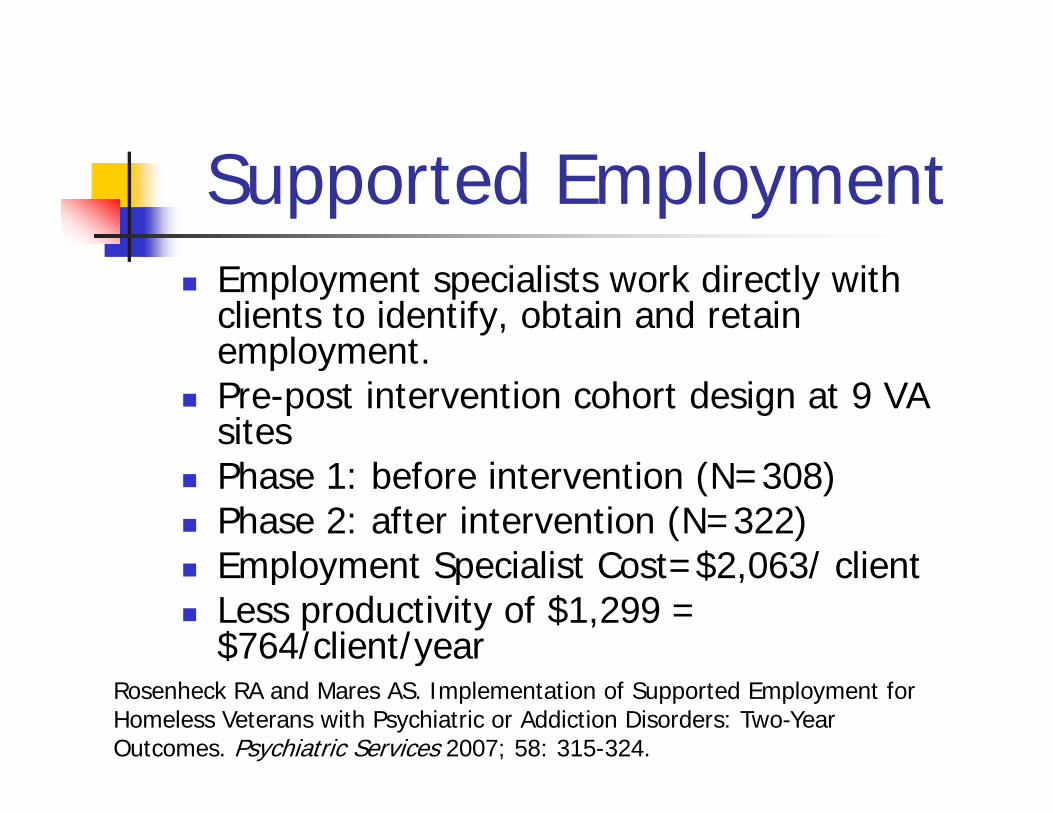
d lSupported Employment Employment specialists work directly with
clients to identify, obtain and retain employmentemployment.
Pre-post intervention cohort design at 9 VA sites
Phase 1: before intervention (N=308) Phase 2: after intervention (N=322)
Employment Specialist Cost $2 063/ client Employment Specialist Cost=$2,063/ client Less productivity of $1,299 =
$764/client/year$ / /yRosenheck RA and Mares AS. Implementation of Supported Employment for Homeless Veterans with Psychiatric or Addiction Disorders: Two-Year Outcomes. Psychiatric Services 2007; 58: 315-324.
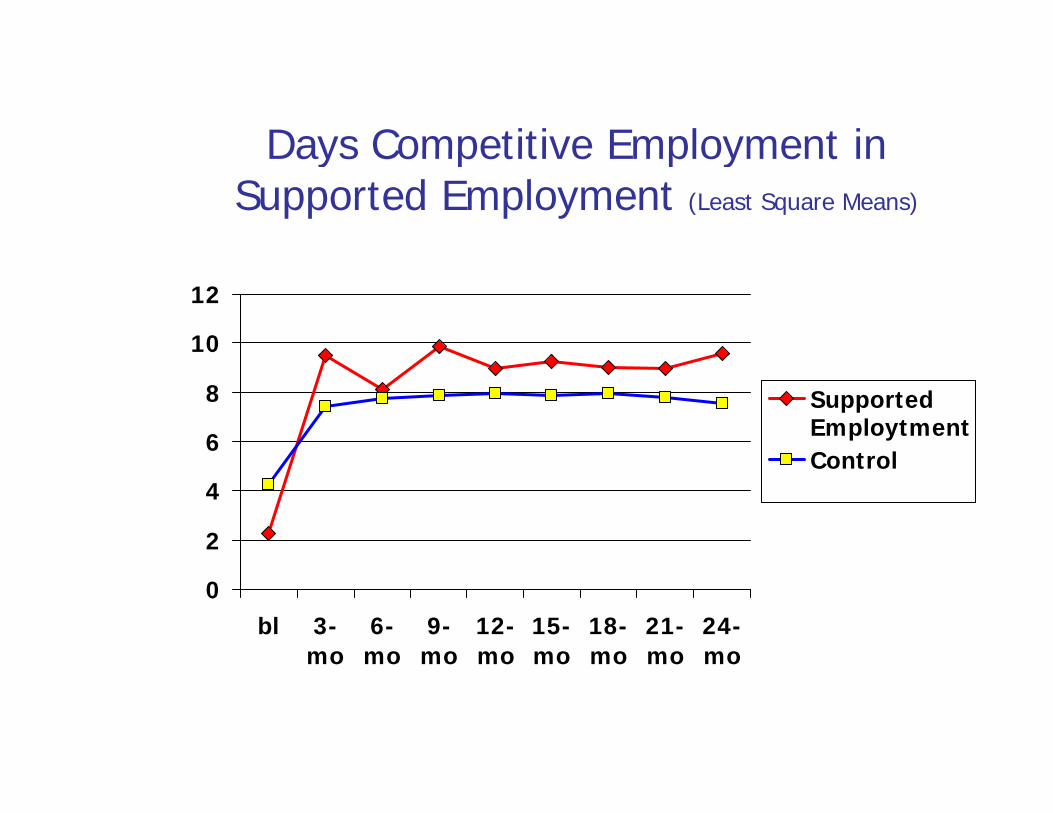
Days Competitive Employment inDays Competitive Employment in Supported Employment (Least Square Means)
10
12
6
8 SupportedEmploytmentControl
2
4Control
0bl 3-
mo6-mo
9-mo
12-mo
15-mo
18-mo
21-mo
24-momo mo mo mo mo mo mo mo
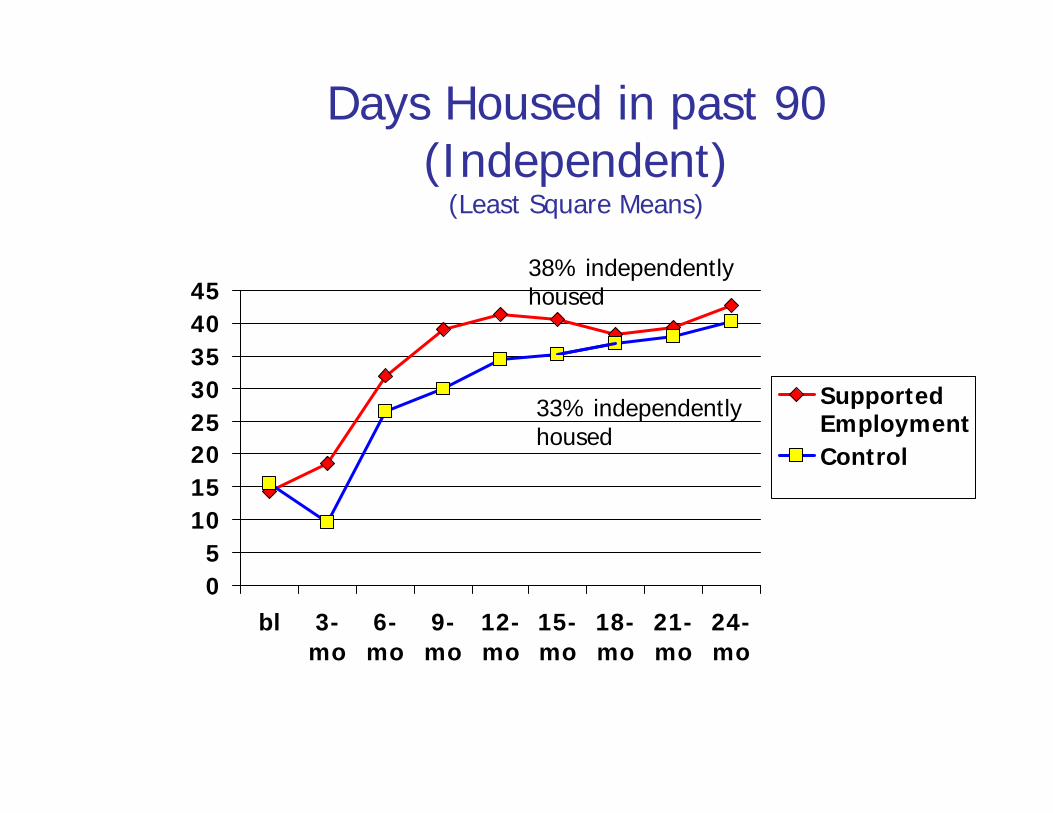
Days Housed in past 90 (Independent)(Independent)
(Least Square Means)
354045
38% independently housed
20253035
SupportedEmploymentControl
33% independently housed
5101520 Control
05
bl 3-mo
6-mo
9-mo
12-mo
15-mo
18-mo
21-mo
24-mo
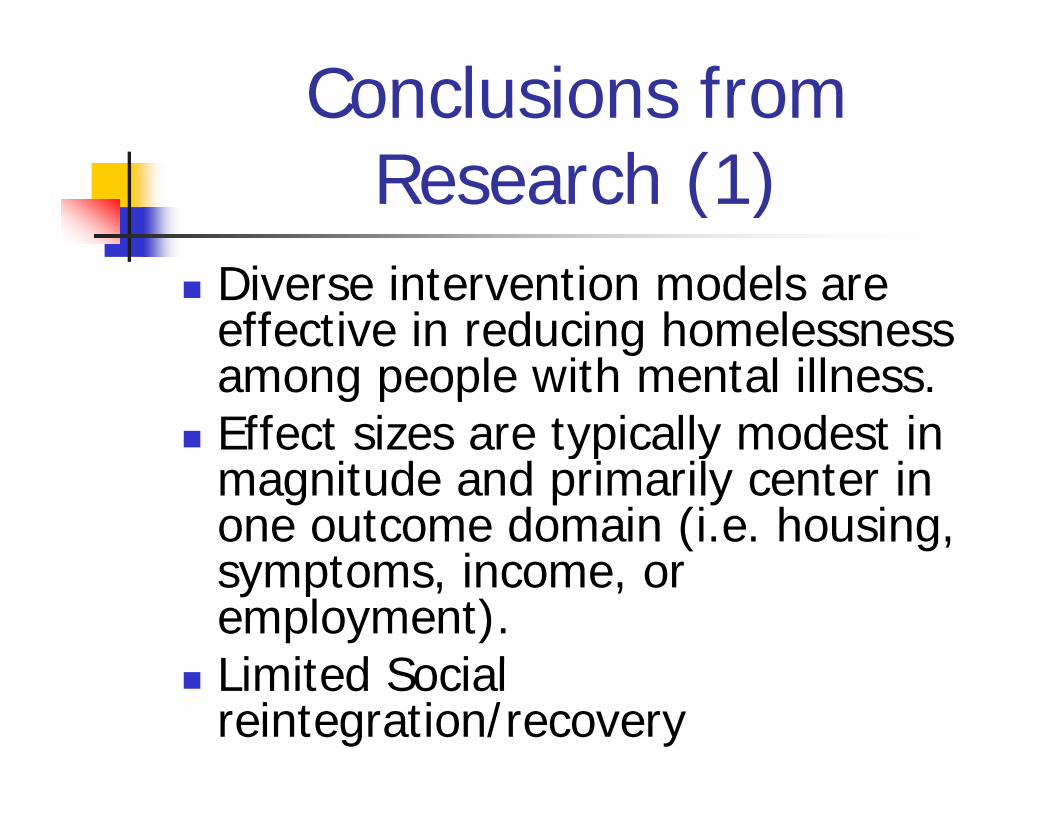
Conclusions from h ( )Research (1)
Diverse intervention models are effective in reducing homelessness gamong people with mental illness.
Effect sizes are typically modest in yp ymagnitude and primarily center in one outcome domain (i.e. housing,
mptom in ome osymptoms, income, or employment). Li it d S i l Limited Social reintegration/recovery
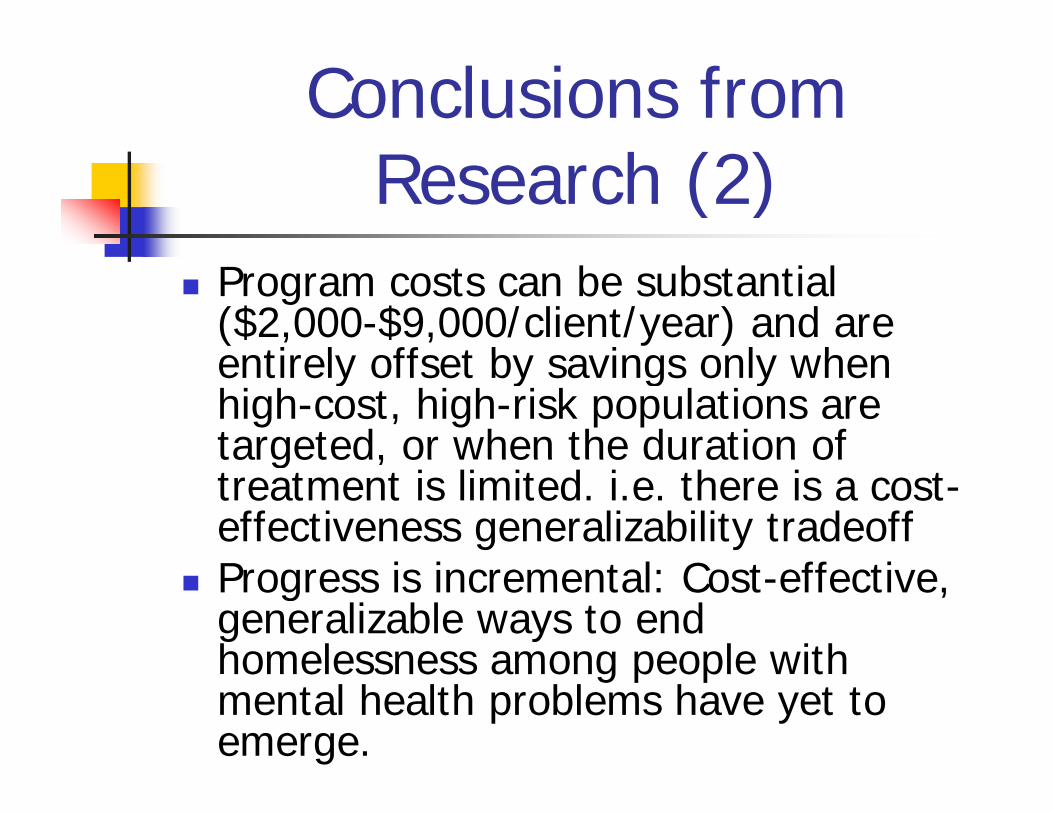
Conclusions from h ( )Research (2)
Program costs can be substantial ($2,000-$9,000/client/year) and are entirely offset by savings only whenentirely offset by savings only when high-cost, high-risk populations are targeted, or when the duration oftargeted, or when the duration of treatment is limited. i.e. there is a cost-effectiveness generalizability tradeoff
l ff Progress is incremental: Cost-effective, generalizable ways to end homelessness among people withhomelessness among people with mental health problems have yet to emerge.


![B2 mh programs and services1 [autosaved]01](https://img.pdfslide.us/doc/110x75/559ca60d1a28abaf0d8b4793/b2-mh-programs-and-services1-autosaved01.jpg)