Embed Size (px)
Citation preview

Wright State University Wright State University
CORE Scholar CORE Scholar
Browse all Theses and Dissertations Theses and Dissertations
2016
Vespucci: A free, cross-platform software tool for spectroscopic Vespucci: A free, cross-platform software tool for spectroscopic
data analysis and imaging data analysis and imaging
Daniel Patrick Foose Wright State University
Follow this and additional works at: https://corescholar.libraries.wright.edu/etd_all
Part of the Chemistry Commons
Repository Citation Repository Citation Foose, Daniel Patrick, "Vespucci: A free, cross-platform software tool for spectroscopic data analysis and imaging" (2016). Browse all Theses and Dissertations. 1697. https://corescholar.libraries.wright.edu/etd_all/1697
This Thesis is brought to you for free and open access by the Theses and Dissertations at CORE Scholar. It has been accepted for inclusion in Browse all Theses and Dissertations by an authorized administrator of CORE Scholar. For more information, please contact [email protected].
brought to you by COREView metadata, citation and similar papers at core.ac.uk
provided by CORE

VESPUCCI: A FREE, CROSS-PLATFORM SOFTWARE TOOL FOR SPECTROSCOPIC DATA ANALYSIS AND IMAGING
A thesis submitted in partial fulfillment of the requirements for the degree of
Master of Science
By
DANIEL PATRICK FOOSE B.S., Wright State University 2013
Wright State University 2016

Chapters 1 and 2 are adapted from:
Daniel. P. Foose and Ioana E. Sizemore
Vespucci: A Free, Cross-Platform Tool for Spectroscopic Data Analysis and Imaging.
Journal of Open Research Software
2016, Volume 4, Issue 1
ã2016 Daniel. P. Foose and Ioana E. Sizemore. Reproduced under the terms of the Creative Commons Attribution 4.0 International License (CC-BY 4.0), which permits unrestricted use, distribution, and reproduction in any medium, provided the original author and source are credited.
Section 4.1 is adapted from:
Kevin A. O’Neil, Seth W. Brittle, Jasmine K. Johnson, Daniel P. Foose, Janis Sikon Steven R. Higgins, Ioana E. Sizemore: Adsorption of Creighton Silver Nanoparticles to Corundum – pH Dependent Effects. In Preparation.
Section 4.2 is adapted from: Sesha L. A. Paluri, Daniel P. Foose, Kelley J. Williams, Catherine B. Anders, Kevin M. Dorney, Ioana E. Sizemore and Nancy K. Bigely: SERS-based Analysis for the Antiviral Activity of AgNPs in Dengue Virus. In Preparation.

WRIGHT STATE UNIVERSITY GRADUATE SCHOOL
May 16, 2016
I HEREBY RECOMMEND THAT THE THESIS PREPARED UNDER MY SUPERVISION BY Daniel Patrick Foose ENTITLED Vespucci: A free, cross-platform software tool for spectroscopic data analysis and imaging BE ACCEPTED IN PARTIAL FULFULLMENT OF THE REQUIREMENTS FOR THE DEGREE OF Master of Science
__________________________ Ioana E. Sizemore, Ph.D.
Thesis Director
__________________________ David A. Grossie, Ph.D.
Chair, Department of Chemistry Committee on Final Examination ____________________________ Ioana E. Sizemore, Ph.D. ____________________________ David A. Dolson, Ph.D. ____________________________ Michael Raymer, Ph.D. ____________________________ Robert E. W. Fyffe, Ph.D. Vice President for Research and Dean of the Graduate School
iii
ABSTRACT
Foose, Daniel Patrick, M.S., Department of Chemistry, Wright State University, 2016. Vespucci: a free, cross-platform software tool for spectroscopic data analysis and imaging.
Vespucci is a software application developed for imaging and analysis of
hyperspectral datasets. Vespucci offers several advantages over other software packages,
including a simple user interface, no cost, and less restrictive licensing. Vespucci
incorporates several analysis techniques including univariate imaging, principal
components analysis, partial-least-squares regression, vertex components analysis and k-
means clustering. Additionally, Vespucci can perform a number of useful data-processing
operations, including filtering, normalization, baseline correction, and background
subtraction. Datasets that consist of spatial or temporal data with a corresponding digital
signal, including spectroscopic images, mass spectrometric images, and X-ray diffraction
data can be processed in this software. The use of Vespucci in Raman and surface-
enhanced Raman spectroscopies has been successfully demonstrated to examine the
interaction of silver nanoparticles with corundum and Dengue virus virions. A manuscript
detailing Vespucci has been published in the Journal of Open Research Software
(http://openresearchsoftware.metajnl.com/articles/10.5334/jors.91/). More information
about Vespucci will be available at http://vespucciproject.org.
iv
TABLE OF CONTENTS
1 INTRODUCTION .................................................................................................. 1
2 VESPUCCI: IMPLEMENTATION, ARCHITECTURE AND FEATURES ........ 3
2.1 Supported Methods .............................................................................................. 3
2.1.1 Data Processing ................................................................................................. 3
2.1.2 Analysis and Imaging ....................................................................................... 4
2.2 User Interface ....................................................................................................... 5
2.3 Applications ......................................................................................................... 5
2.3.1 Surface-Enhanced Raman Spectroscopy .......................................................... 6
2.3.2 Raman Spectroscopy ....................................................................................... 15
2.3.3 Use of C++ API .............................................................................................. 18
2.4 Implementation and Architecture ...................................................................... 19
3 VESPUCCI 1.0.0 INITIAL RELEASE ................................................................ 19
3.1 User Interface Improvements ............................................................................. 20
3.2 Automation and External Code .......................................................................... 20

v
3.3 Code Quality ...................................................................................................... 21
3.4 Improving Contributions .................................................................................... 21
4 OTHER PROJECTS ............................................................................................. 23
4.1 Adsorption of Creighton Silver Nanoparticles to Corundum ............................ 23
4.1.1 Main Goal ....................................................................................................... 23
4.1.2 Relevance ........................................................................................................ 24
4.1.3 Interaction Mechanisms .................................................................................. 24
4.1.4 Contribution .................................................................................................... 25
4.1.5 Main Results and Conclusions ........................................................................ 26
4.2 Interaction of Creighton Silver Nanoparticles and Dengue virus ...................... 35
4.2.1 Main Goal ....................................................................................................... 35
4.2.2 Relevance ........................................................................................................ 36
4.2.3 Background ..................................................................................................... 37
4.2.4 Contribution .................................................................................................... 39
4.2.5 Main Results and Conclusions ........................................................................ 39
5 CONCLUSIONS .................................................................................................. 46
vi
6 ADDENDA ........................................................................................................... 48
6.1 Vespucci Guide for Contributors (CONTRIBUTING.md) ............................... 48
6.1.1 Guidelines for Potential Contributors ............................................................. 48
6.1.2 Libraries .......................................................................................................... 49
6.1.3 Code Style ....................................................................................................... 50
6.1.4 Adding Processing Methods to Vespucci ....................................................... 52
6.1.5 Processing GUI Classes .................................................................................. 53
6.1.6 Adding Analysis Methods to Vespucci ........................................................... 53
6.1.7 Analysis GUI Classes ..................................................................................... 54
6.1.8 VespucciDataset member functions ....................................................... 55
6.1.9 Classes to Handle Analysis Data .................................................................... 55
6.1.10 Analysis Functions in the Vespucci::Math Namespace ...................... 56
6.1.11 Writing Tests ................................................................................................. 59
6.2 Vespucci Onboarding Exercises ........................................................................ 59
6.2.1 Exercise 1: Text Parser ................................................................................... 60
6.2.2 Exercise 2: Spectra Processing ....................................................................... 61
6.2.3 Exercise 3: Dataset Class ................................................................................ 64

vii
6.2.4 Exercise 4: File Import Dialog ........................................................................ 64
6.2.5 Exercise 5: Peak Intensity Analysis ................................................................ 65
6.2.6 Exercise 6: Color Map Viewer with QCustomPlot ......................................... 66
6.2.7 Project ............................................................................................................. 66
6.3 Vespucci C++ API Example—BatchVCA ........................................................ 67
6.4 Corundum Project Code ..................................................................................... 71
7 REFERENCES ..................................................................................................... 76
8 CURRICULUM VITAE ....................................................................................... 83

viii
FIGURES
Figure 1: The Vespucci main window and file import dialog. Vespucci uses the user's
native file dialog to select the file for import. Metadata can be specified by the user. 8
Figure 2: The Vespucci dialog used to perform smoothing. ............................................... 9
Figure 3: The Vespucci dialog used to perform normalization by peak intensity. ........... 10
Figure 4: The Vespucci dialog for performing CWT peak detection. Vespucci includes
the first implementation of the CWT peak detection algorithm with a graphical user
interface. .................................................................................................................... 11
Figure 5: The "chemical barcode" produced by applying the peak finding method to all
spectra in the dataset. ................................................................................................. 12
Figure 6: Using Vespucci to examine the spatial distribution of SERS hotspots. The color
scale corresponds to the Riemann sum of the xanthine breathing-mode peak. Spots
higher on the color scale (e.g., white or red) indicate better surface-enhancement
capability. .................................................................................................................. 14
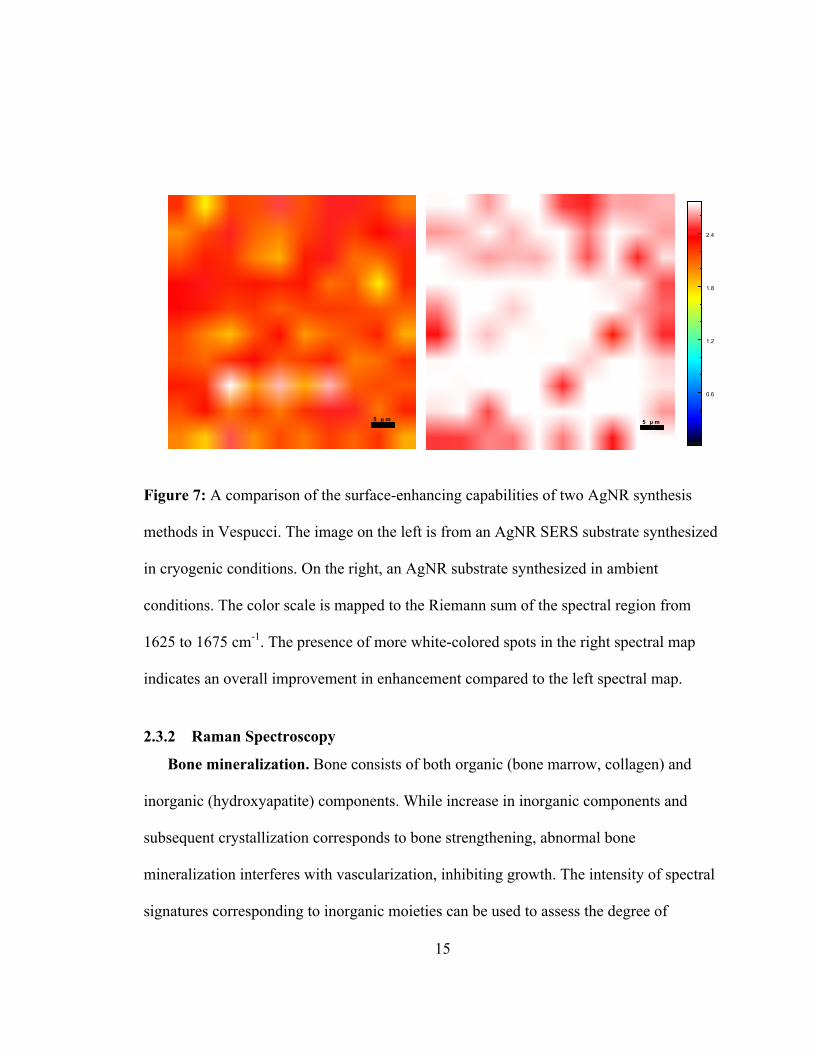
Figure 7: A comparison of the surface-enhancing capabilities of two AgNR synthesis
methods in Vespucci. The image on the left is from an AgNR SERS substrate
synthesized in cryogenic conditions. On the right, an AgNR substrate synthesized in
ix
ambient conditions. The color scale is mapped to the Riemann sum of the spectral
region from 1625 to 1675 cm-1. The presence of more white-colored spots in the
right spectral map indicates an overall improvement in enhancement compared to the
left spectral map. ........................................................................................................ 15
Figure 8: Average Raman spectra (n=1089) of corundum exposed to AgNPs at each pH
value studied .............................................................................................................. 27
Figure 9: Image constructed from a 11µm × 11 µm Raman map of a slide containing
corundum with adsorbed AgNPs at pH 9. Colors are mapped to the baseline-adjusted
area of the signal from 220 to 250 cm-1. Lightly colored regions have larger values.
................................................................................................................................... 29
Figure 10: A comparison of two 11µm × 11 µm Raman images from samples of
corundum incubated with AgNPs at different pH values. The figure at right depicts a
sample at pH 11. The figure at left depicts a sample at pH 6. The two images share a
common color scale. Greater values are indicated by greater colors. ....................... 30
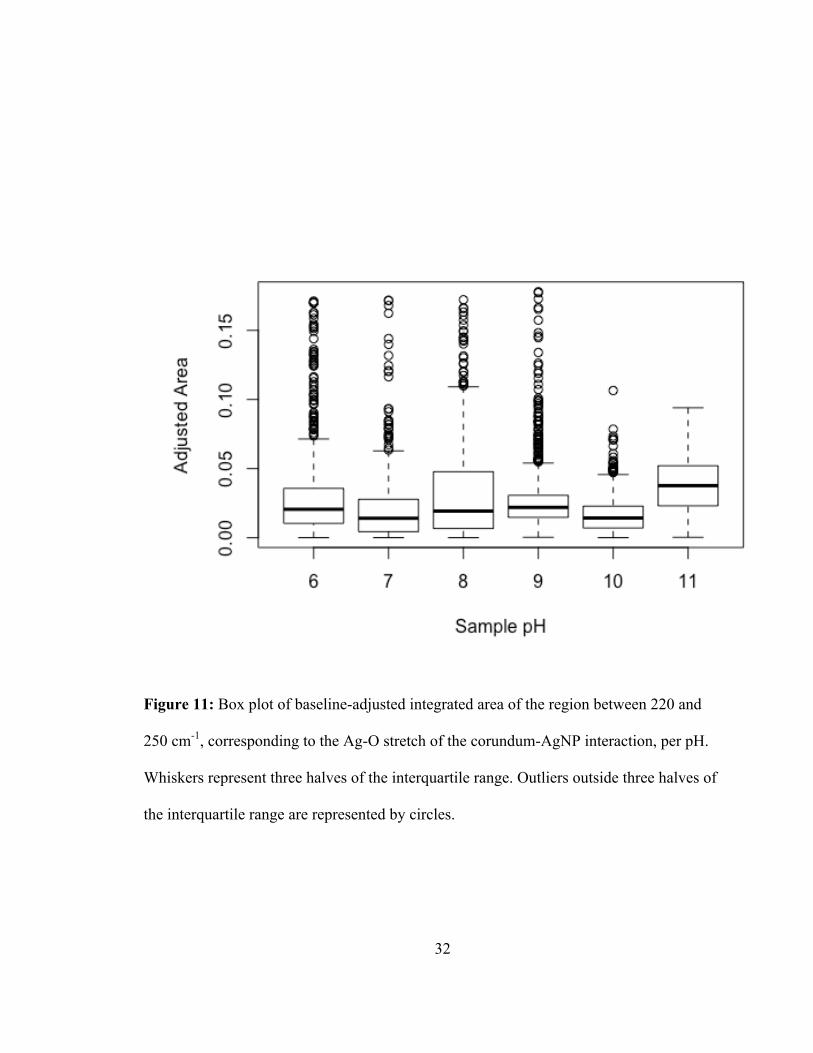
Figure 11: Box plot of baseline-adjusted integrated area of the region between 220 and
250 cm-1, corresponding to the Ag-O stretch of the corundum-AgNP interaction, per
pH. Whiskers represent three halves of the interquartile range. Outliers outside three
halves of the interquartile range are represented by circles. ...................................... 32
x
Figure 12: Box plot of baseline-adjusted integrated area of the region between 220 and
250 cm-1, corresponding to the Ag-O stretch of the corundum-AgNP interaction, per
pH category (less than 9, equal to 9 and greater than 9). Whiskers represent three
halves of the interquartile range. Outliers outside three halves of the interquartile
range are represented by circles. ................................................................................ 33
Figure 13: Average spectra of all AgNP-DENV samples, glass spectrum subtracted. .... 41
Figure 14: The average of all AgNP-DENV spectra between 100 and 1000 cm-1 with
Raman peaks labeled. ................................................................................................ 42
Figure 15: Average of all DENV spectra between 1000 and 2000 cm-1. Relevant peaks
labeled. ....................................................................................................................... 43
xi
TABLES
Table 1: Tentative assignments of the Raman vibrational modes observed for α-Al2O3. 28
Table 2: Significantly different populations by pH. ......................................................... 34
Table 3: Raman signals associated with the AgNP-DENV interaction, from peak finding
algorithm, with tentative assignments. ...................................................................... 44
Table 4: Raman signals found by analyzing the average DENV spectrum. ..................... 45

xii
ACKNOWLEDGMENTS
I would like to acknowledge my advisor, Dr. Ioana Sizemore for her unwavering
support in my pursuit of a less-than-traditional chemistry thesis. I am grateful to be
granted the independence necessary to make this contribution. I would also like to
acknowledge current and former members of the Sizemore research group, whose support
has been instrumental to my success. Special thanks are due to Ph.D. students Seth Brittle
and Arathi Paluri, whose advice and guidance have made much of this work possible, and
to my peer in the Master’s program, Kevin O’Neil. Stimulating conversation with these
individuals has greatly furthered my understanding of science and enabled my personal
and professional growth in the past few years.
I would further like to extend my gratitude to the employees of the Department of
Chemistry office, especially Kelly Burcham, who is instrumental to the department’s
continued success. I also thank Dr. David Dolson, for recognizing my potential,
encouraging me to pursue further education, and helping me to navigate the future of my
career.
I also extend thanks to my family and friends who have always supported and
encouraged me to do my best work, especially to my parents Tina and Patrick Foose.

1
1 INTRODUCTION
The main goal of this research was to develop a free, cross-platform tool for
spectroscopic mapping and analysis, entitled Vespucci after the Renaissance cartographer
Amerigo Vespucci. Vespucci offers several main advantages in comparison with other
available instrument software and chemometrics packages such as Solo from Eigenvector
Research, the scikit-spectra Python library, and the hyperSpec and chemoSpec R
packages.
Licensing of commercial products. The restrictive licensing of numerous
proprietary instrument software and chemometrics packages precludes the use of the
software on devices owned by individual researchers without the purchase of an
additional license. The expense and availability may make the implementation of
advanced analysis techniques inaccessible to researchers. By releasing this software on
the Internet at no cost, with no proprietary dependencies, barriers to use due to software
licensing are removed.
Ease-of-use. Existing software packages for spectroscopic data analysis are generally
written with advanced users in mind. These packages come as a library of functions,
which must be called from a command-line interface. This interface affords a great deal
of customization at the expense of ease-of-use for less advanced users. Vespucci is driven
by a graphical user interface (GUI) that is intuitive to use even by beginners. No

2
programming knowledge is necessary to use the software, but extensions written in
Octave, which is mostly code-compatible with MATLAB©, and R may be used by more
advanced users.

3
2 VESPUCCI: IMPLEMENTATION, ARCHITECTURE AND FEATURES
2.1 Supported Methods
2.1.1 Data Processing
Vespucci is capable of several of the most common data pre-processing techniques in
chemometrics, as described below.
Smoothing. Vespucci supports a number of smoothing methods including moving
average filters, median filters, Savitzky-Golay smoothing and Whittaker smoothing.
Data selection. Individual spectra are easily viewed and manipulated. Spectra may be
removed by threshold to reject clipped or poorly-focused spectra. Spectral data beyond a
certain spatial range in a spectroscopic image may also be removed.
Normalization. Vespucci supports min/max normalization (subtraction of the
minimum of each spectrum followed by division by the maximum), unit area
normalization (dividing each spectrum by its sum), standard normal variate
normalization, Z-score normalization, normalization by the maximum intensity at a
particular spectral abscissa range, scaling by a particular number, vector normalization of
each spectrum vector, and mean-centering.
4
2.1.2 Analysis and Imaging
Vespucci supports a variety of powerful and commonly-used methods for spectral
data analysis, as illustrated below.
Univariate. Vespucci is capable of univariate analysis and imaging by peak intensity,
peak area, and peak width (estimated full-width-at-half maximum), area ratio between
two peaks, and intensity ratio between two peaks.
Multivariate. Vespucci is capable of classical principal component analysis (PCA), a
widely-used method for dimension reduction, both using the singular value
decomposition, and partial-least-squares (PLS) regression (Vespucci, like MATLAB,
uses the SIMPLS algorithm for PLS regression).1 Vespucci is capable of Vertex
Component Analysis (VCA), an algorithm for dimension reduction and endmember
extraction.2 This algorithm finds the spectra in the dataset that are responsible for the
most variance. Images can be created from the component scores generated by both
methods.
Peak detection. Vespucci uses a peak-finding method based on convolution with a
Mexican hat kernel, mathematically identical to the continuous wavelet transform
(CWT). This method was first developed by Du for analyzing proteomic mass
spectrometry data,3 and was then applied to Raman spectroscopy by Zhang.4 It uses a
signal smoothed by Mexican hat kernels of varying width to determine the peak centers
5
of the unsmoothed data. This facilitates the determination of the local extrema with
smooth signals. A “chemical barcode” can then be constructed from these results,
allowing the researcher to identify spectral signatures within the data and to determine
which spectra contain which peaks of interest.
2.2 User Interface
Vespucci is designed so that a user with an understanding of basic GUI paradigms
can easily utilize the software. The main window of the program consists of two panes.
The left pane consists of a list of datasets on which operations can be performed. The
right pane is a list of images created through the various available imaging techniques.
Vespucci supports the two most common ASCII (*.txt) formats: the “wide text”
format in which each row of the file represents a spectrum, and the “long text” format in
which spectra are concatenated sequentially. Data import is handled by a simple dialog.
Because text files do not contain metadata about the abscissa or ordinate labels, the user
can specify labels in the import dialog.
2.3 Applications
Vespucci is capable of handling a wide variety of spectroscopic data, including
infrared spectroscopy, ultraviolet-visible spectroscopy and frequency-domain terahertz
spectroscopy, with spatial or temporal metadata. The use of Vespucci for several tasks in
6
the analysis of Raman and surface-enhanced Raman spectroscopic data has been
demonstrated below.
2.3.1 Surface-Enhanced Raman Spectroscopy
The utility of Vespucci for several SERS studies has been shown in unpublished
works and several replications of previous works. SERS is a Raman spectroscopic
technique that utilises plasmonic nanomaterials, such as silver and gold nanoparticles, to
enhance the intensity of Raman signals for the qualitative and quantitative determination
of analytes at trace concentrations.5
Probing nanoparticle-virion interactions. Spectroscopic data analysis is primarily
concerned with the extraction of chemical information based on the presence and profile
of “peaks” in spectra. When a dataset is very large, manual peak finding and
determination become time consuming and are prone to human error. Automatic
evaluation of peaks in vibrational spectroscopy, with nonlinear baselines and
substantially broadened peaks, can be difficult. A rigorous, baseline-independent method
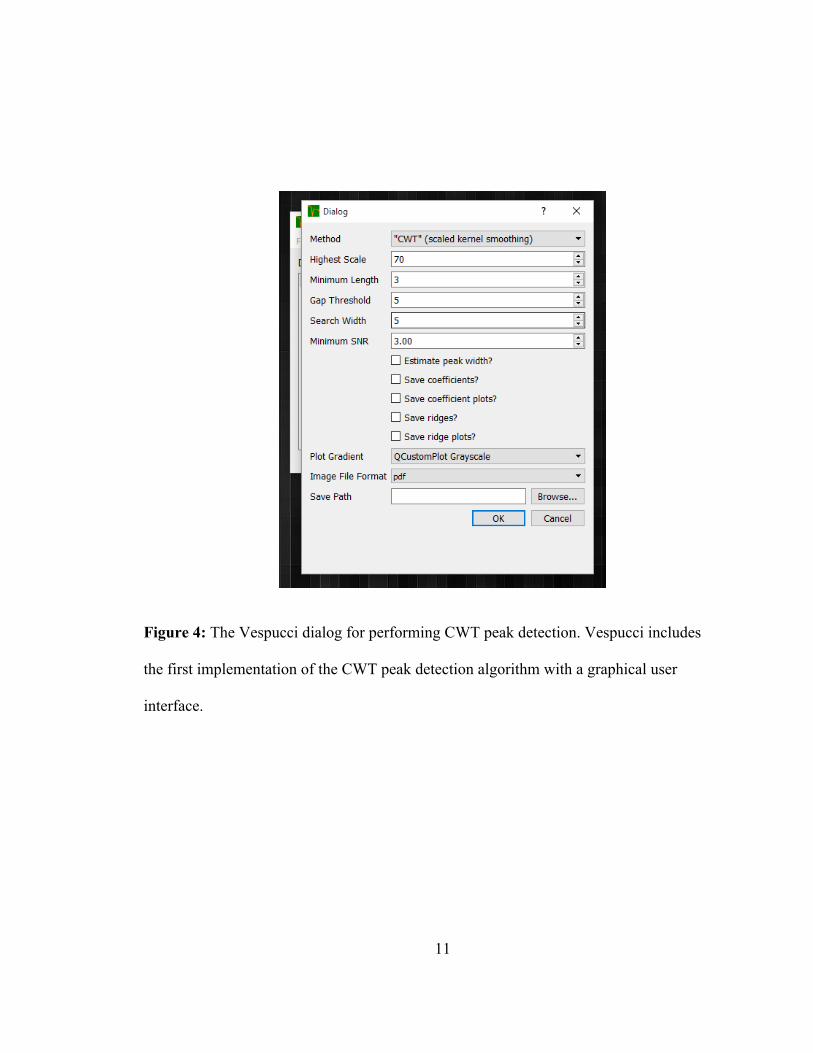
to determine peaks of varying widths is needed in these cases. The “CWT” method fits
these criteria,4 but was previously only available as a command-line R package. Vespucci
provides the first implementation of this algorithm with a graphical user interface.
Vespucci’s peak detection methods have been used to determine spectral regions of
interest for subsequent analysis. The goal of this work is to use the chemical information
7
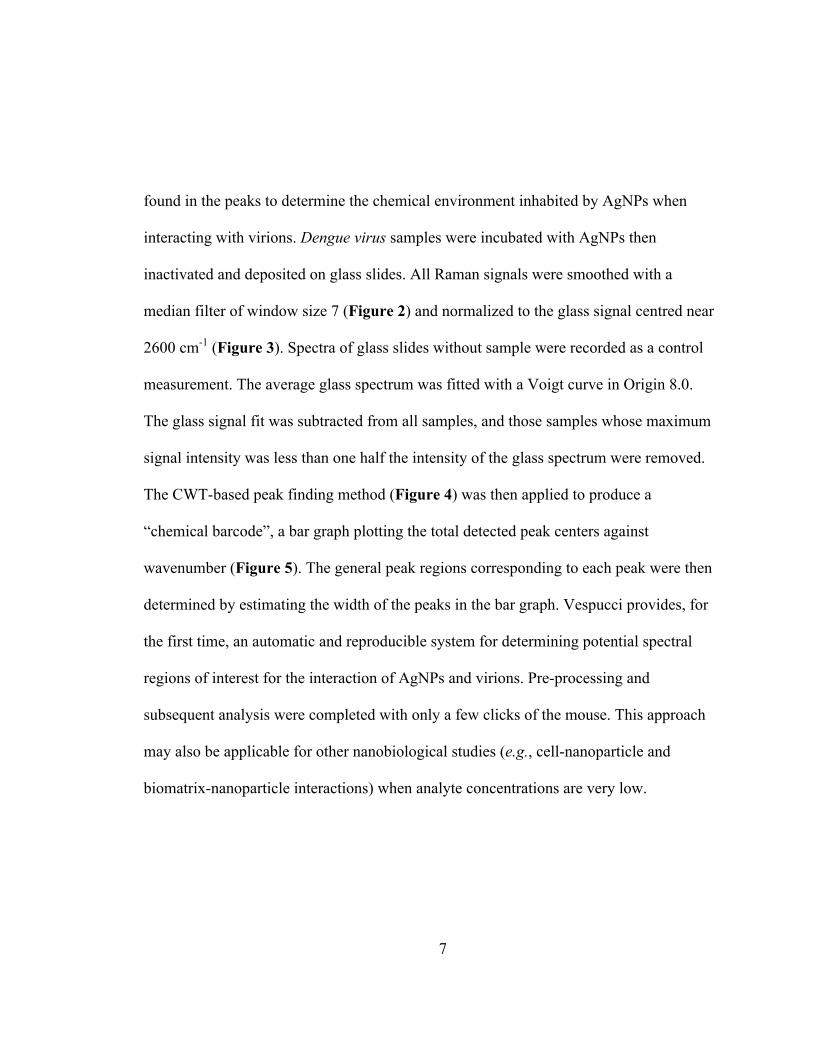
found in the peaks to determine the chemical environment inhabited by AgNPs when
interacting with virions. Dengue virus samples were incubated with AgNPs then
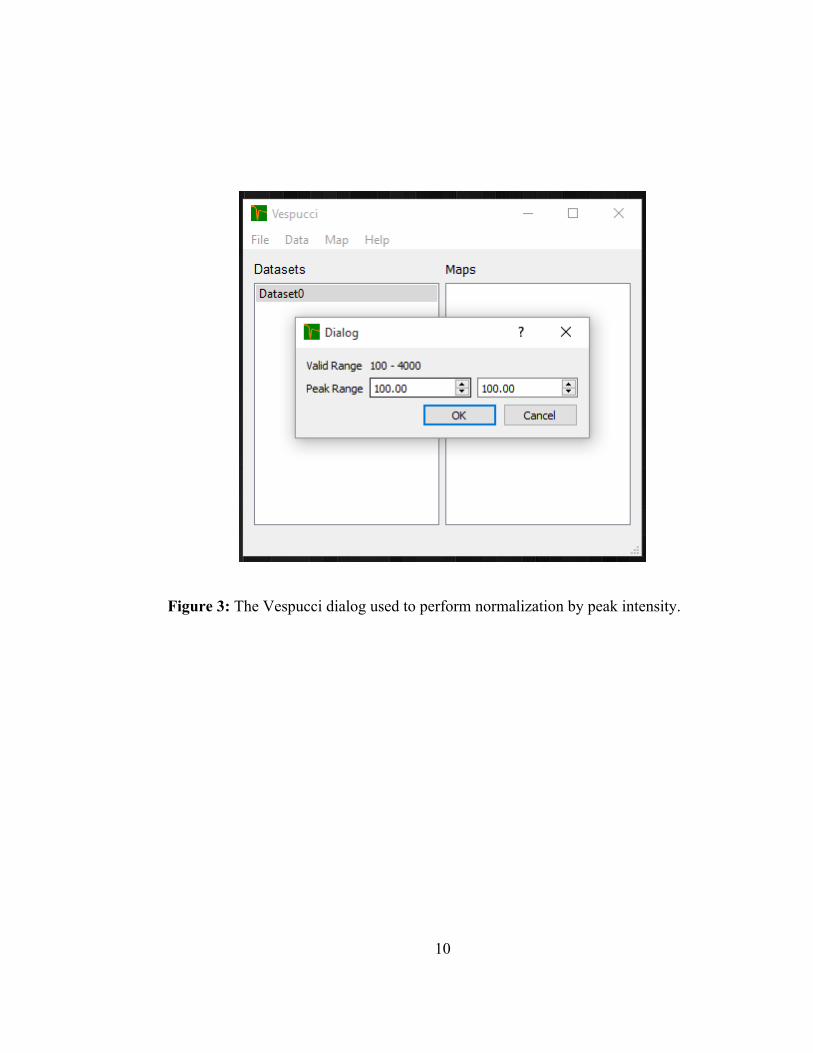
inactivated and deposited on glass slides. All Raman signals were smoothed with a
median filter of window size 7 (Figure 2) and normalized to the glass signal centred near
2600 cm-1 (Figure 3). Spectra of glass slides without sample were recorded as a control
measurement. The average glass spectrum was fitted with a Voigt curve in Origin 8.0.
The glass signal fit was subtracted from all samples, and those samples whose maximum
signal intensity was less than one half the intensity of the glass spectrum were removed.
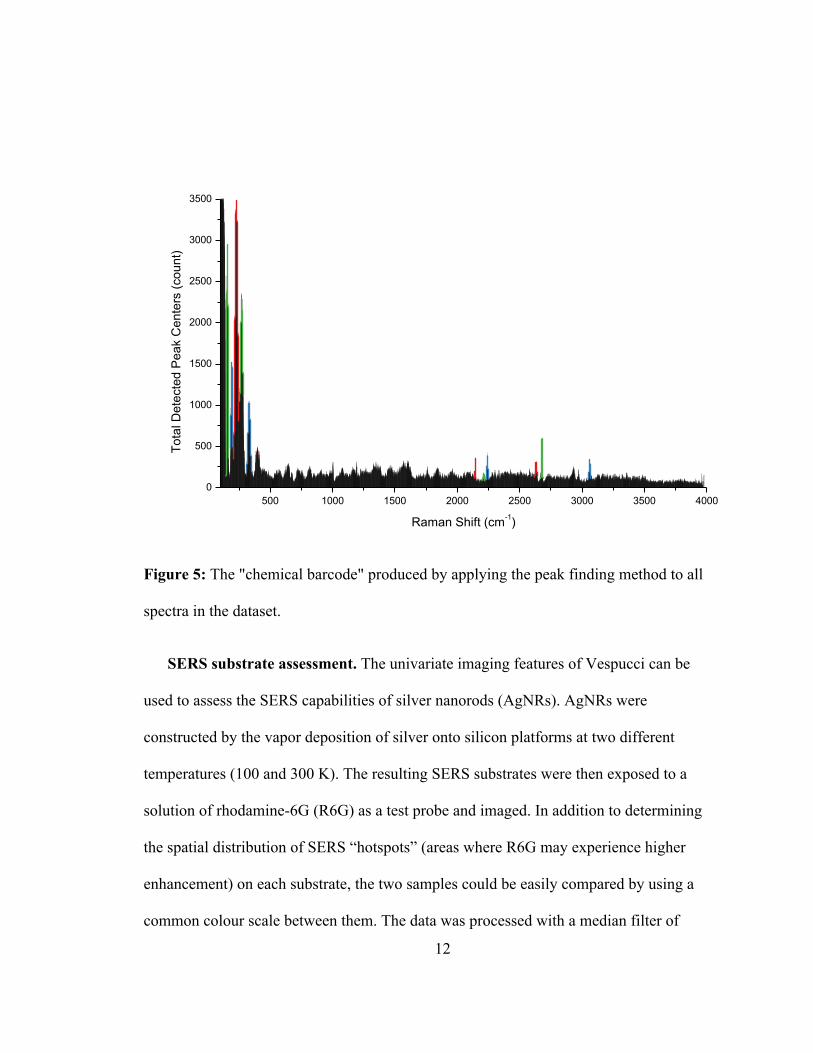
The CWT-based peak finding method (Figure 4) was then applied to produce a
“chemical barcode”, a bar graph plotting the total detected peak centers against
wavenumber (Figure 5). The general peak regions corresponding to each peak were then
determined by estimating the width of the peaks in the bar graph. Vespucci provides, for
the first time, an automatic and reproducible system for determining potential spectral
regions of interest for the interaction of AgNPs and virions. Pre-processing and
subsequent analysis were completed with only a few clicks of the mouse. This approach
may also be applicable for other nanobiological studies (e.g., cell-nanoparticle and
biomatrix-nanoparticle interactions) when analyte concentrations are very low.

8
Figure 1: The Vespucci main window and file import dialog. Vespucci uses the user's
native file dialog to select the file for import. Metadata can be specified by the user.

9
Figure 2: The Vespucci dialog used to perform smoothing.
10
Figure 3: The Vespucci dialog used to perform normalization by peak intensity.
11
Figure 4: The Vespucci dialog for performing CWT peak detection. Vespucci includes
the first implementation of the CWT peak detection algorithm with a graphical user
interface.
12
Figure 5: The "chemical barcode" produced by applying the peak finding method to all
spectra in the dataset.
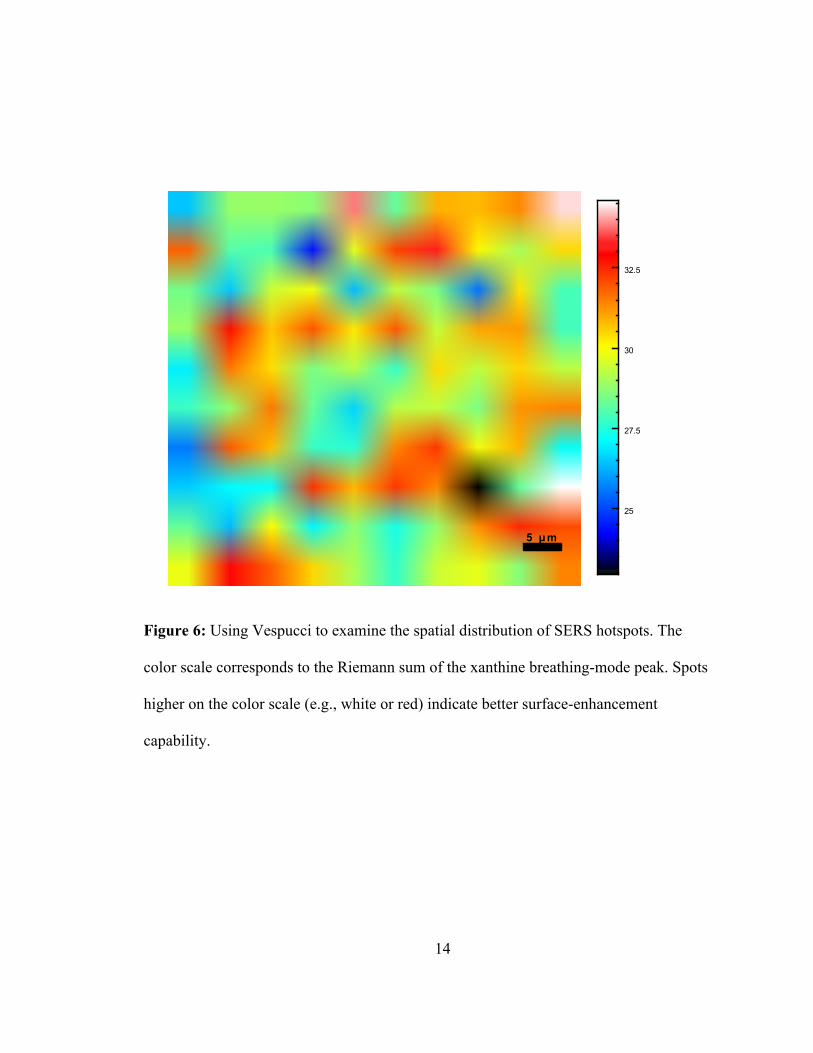
SERS substrate assessment. The univariate imaging features of Vespucci can be
used to assess the SERS capabilities of silver nanorods (AgNRs). AgNRs were
constructed by the vapor deposition of silver onto silicon platforms at two different
temperatures (100 and 300 K). The resulting SERS substrates were then exposed to a
solution of rhodamine-6G (R6G) as a test probe and imaged. In addition to determining
the spatial distribution of SERS “hotspots” (areas where R6G may experience higher
enhancement) on each substrate, the two samples could be easily compared by using a
common colour scale between them. The data was processed with a median filter of
500 1000 1500 2000 2500 3000 3500 40000
500
1000
1500
2000
2500
3000
3500
Tota
l Det
ecte
d Pe
ak C
ente
rs (c
ount
)
Raman Shift (cm-1)

13
window size 7, followed by standard normal variate normalization. Univariate images of
the Riemann sum of the spectral region from 1625 to 1675 cm-1, corresponding to a
xanthine breathing marker mode (Figure 6), were compared to determine differences in
overall enhancement. The values were larger for the substrates synthesized at 100 K than
for the substrates synthesized at 300 K (Figure 7), because the colder temperature
provided favorable kinetics to produce denser and better-aligned AgNR surfaces (Shah,
2012).6,7
14
Figure 6: Using Vespucci to examine the spatial distribution of SERS hotspots. The
color scale corresponds to the Riemann sum of the xanthine breathing-mode peak. Spots
higher on the color scale (e.g., white or red) indicate better surface-enhancement
capability.
25
27.5
30
32.5
5 μm
15
Figure 7: A comparison of the surface-enhancing capabilities of two AgNR synthesis
methods in Vespucci. The image on the left is from an AgNR SERS substrate synthesized
in cryogenic conditions. On the right, an AgNR substrate synthesized in ambient
conditions. The color scale is mapped to the Riemann sum of the spectral region from
1625 to 1675 cm-1. The presence of more white-colored spots in the right spectral map
indicates an overall improvement in enhancement compared to the left spectral map.
2.3.2 Raman Spectroscopy
Bone mineralization. Bone consists of both organic (bone marrow, collagen) and
inorganic (hydroxyapatite) components. While increase in inorganic components and
subsequent crystallization corresponds to bone strengthening, abnormal bone
mineralization interferes with vascularization, inhibiting growth. The intensity of spectral
signatures corresponding to inorganic moieties can be used to assess the degree of
5 μ m
0.6
1.2
1.8
2.4
5 μ m
16
mineralization of biomaterials. A toxicological study was devised to examine the
interaction between platinum group metal (PGM) salts and developing chick embryos.8
This work utilizes the data processing and univariate analysis features of Vespucci to
demonstrate how PGM salts interfere with the mineralization process.
Raman spectral scans were performed on slices of chick embryo tibiotarsi. Embryos
were exposed to PGM solutions in ova on the 7th and 11th day of incubation in order to
study potential bone structural changes due to exposure to PGMs. Crystallisation was
assessed and spatially determined by observing intensity near the ν1 band of phosphate
(search range 946-976 cm-1). The crystalline structure can be observed (Figure 9) in
multiple color scales.

17
Figure 8: The univariate imaging dialog.

18
Figure 9: A crystal found in a chick embryo tibiotarsus. A and C depict the color and
greyscale representations of a divergent “rainbow” color scheme. B and D depict the
color and greyscale representations of a color scheme that increases linearly in perceived
brightness.
2.3.3 Use of C++ API
The Vespucci C++ API allows for the creation of specialty programs to perform the
same task on multiple datasets. Here, a simple program to pre-process and perform VCA
of all datasets in a particular folder is demonstrated in the Examples folder in the source
tree (and Section 7.4). The procedural math library, combined with a few Qt classes, was
used to automate the data analysis and pre-processing workflow.
0
0.0015
0.003
0.0045
0.006
0.0075
5 μm5 μm
A
0
0.0015
0.003
0.0045
0.006
0.0075
5 μm5 μm
A
0
0.0015
0.003
0.0045
0.006
0.0075
5 μm5 μm
0
0.0015
0.003
0.0045
0.006
0.0075
5 μm5 μm
BA
C D
19
2.4 Implementation and Architecture
In Vespucci, datasets are stored as VespucciDataset objects, which contain an
Armadillo matrix containing the spectra as columns, metadata (including spatial or
temporal coordinates and the spectral abscissa) and associated processing and analysis
methods. Math functions are handled by the VespucciMath namespace, which
contains basic algorithms for the analysis and processing methods (some simple
processing methods are handled in the VespucciDataset class). Data import is
handled by the TextImport and BinaryInput namespaces. VespucciMath can
thus also be used as a procedural API for dealing with spectroscopic data files. The
output of analysis methods are stored in AnalysisResults objects (or in
MLPACKPCAData, PLSData, PrincipalComponentsData, UnivariateData
or VCAData objects), which are heap allocated using smart pointers and accessed
through the VespucciDataset parent object. The GUI form classes interact with
datasets entirely through smart pointers to VespucciDataset objects, which are
managed through a VespucciWorkspace object that contains information about the
operating environment and the currently open datasets.
3 VESPUCCI 1.0.0 INITIAL RELEASE
The article introducing Vespucci has been viewed over 300 times and downloaded
over 30 times.9 Since the publication of the article, a number of major changes have been
20
made to the interface and internal organization of Vespucci, with the goal of improving
user experience and code maintainability. The upcoming 1.0.0 release of Vespucci has a
variety of new features and an improved GUI interface to make the software easier to use.
It is hoped that these improvements help further adoption of Vespucci as a useful tool for
scientists in many fields.
3.1 User Interface Improvements
The new GUI is considerably less cluttered than the old one by making some
windows, such as the data viewer, the plot viewer and the statistics viewer, persistent.
This reduces the total number of windows open and limits potential user confusion. The
ability to view multiple spectra on the same axis allows for easier comparison of spectra.
The list view used for displaying datasets has been replaced by a tree view that exposes
all objects to the user. Data objects can be viewed using the double click action. A
number of other options are available to the user by using the secondary click action on
the tree view.
3.2 Automation and External Code
A new macro system allows users to automate analysis and processing methods and
to apply these methods to multiple datasets. A new Python interface for version 1.1.0 will
allow users to run external code on Vespucci data objects. This opens the extensive
Python ecosystem to intermediate to advanced users and allows the extension of
Vespucci to new data formats and analysis techniques. Mature interfaces between Python

21
and MATLAB/Octave and R allow existing research code to be run from Vespucci with
simple wrapper code, and allows the opening of advanced interfaces to less advanced
users. The external code interface is made easier through the use of a new key-value
interface to Vespucci objects that allows objects to be accessed by their user-visible
names.
3.3 Code Quality
Vespucci is now built and deployed automatically, using Appveyor for Windows
platforms and Travis-CI for OS X and Linux platforms. Unit tests for math functions will
be automatically implemented in the build system and checked for regressions. This will
prevent bugs that break math functions from being implemented in the code. Some
classes and methods outside of the math library will also be regularly tested, especially
the classes related to the internal data model.
3.4 Improving Contributions
A new set of basic programming exercises have been written to assess the
programming abilities of incoming student researchers and instruct them in basic
principles of programming using C++, Qt and Armadillo. This will make future
collaborators within the Sizemore group more capable of contributing to the Vespucci
project in the future. Additionally, as the usage of Vespucci grows, it is possible that
collaborators from outside of Wright State University may wish to contribute. To assist in
bringing in outside contributions, the coding style and software design principles of

22
Vespucci have been clearly and publicly articulated. A contributor who knows how to
implement a new analysis or processing method in any language should be easily able to
write conformant code to integrate into Vespucci.

23
4 OTHER PROJECTS
4.1 Adsorption of Creighton Silver Nanoparticles to Corundum
Adsorption of Creighton Silver Nanoparticles to Corundum – pH Dependent Effects
Kevin A. O’Neil, Seth W. Brittle, Jasmine K. Johnson, Daniel P. Foose, Janis Sikon,
Steven R. Higgins, Ioana E. Sizemore
Department of Chemistry, Wright State University, 3640 Colonel Glenn Highway,
Dayton, OH 45435
Manuscript in preparation
Data presented below reproduced with permission of manuscript authors.
4.1.1 Main Goal
The main goal of this project was to examine the adsorption of Creighton AgNPs to
the surface of corundum, a common, naturally-occurring mineral composed primarily of
α-Al2O3, at environmentally-relevant pH values (6–11). This was achieved using
inductively coupled plasma optical emission spectroscopy (ICP-OES) to quantify total
adsorption of AgNPs to the low-ppb level and Raman spectroscopic imaging to examine
the potential interaction mechanism(s) at the molecular level over larger surface areas
than available using other microscopic techniques. The use of Raman imaging and

24
chemometric techniques allowed for the spatial distribution of AgNP adsorption to be
observed and the chemical nature of the complexation determined.
4.1.2 Relevance
AgNPs are the most commonly used nanomaterials in commercial products,10 making
the study of their fate and transport in the environment relevant to society. The
prevalence of AgNPs gives rise to environmental concerns due to their proven toxicity to
various organisms.11–13 Current research suggests that AgNPs are most likely to be
immobilized in soils due to adsorption to and complexation with natural organic matter
and minerals.14–16 Most studies to date have focused on the interactions between AgNPs
and natural organic matter, which only accounts for about 5% of the total mass of soils.
Studies that have examined AgNP-mineral interactions have hitherto focused primarily
on silica-based minerals. After silicon and oxygen (the primary components of silica-
based minerals), aluminum is the third most abundant element in the Earth’s crust.17 This
work is the first such study to be conducted on an aluminum-based mineral and aims to
further the understanding of the environmental impact of nanotechnology.
4.1.3 Interaction Mechanisms
The Creighton synthesis used in this work is the most common bottom-up fabrication
method for AgNPs.18 This synthetic method results in negatively-charged (Zeta potential
of -44.7 mV at pH 8.2),19 spherical AgNPs of moderate size distribution (1–100 nm
diameter) and average diameter of 11.0 nm ± 4.6 nm.20 The charge of the corundum
25
surface is known to vary with pH, with a pristine point of zero charge at pH 9.1.21 It is
hypothesized that electrostatic forces may be involved in the AgNP-corundum
interaction.
4.1.4 Contribution
My contribution to this project consisted of Raman data analysis and subsequent
post-processing. A bespoke program, written in C++ using the Vespucci API was created
and used to process and analyze all generated Raman spectra (n = 6534). Spectra were
median filtered (window size 7) and min/max normalized by subtracting the minimum
value of the spectrum from each value of the spectrum, then subsequently dividing by the
maximum value of the spectrum, so that the smallest value of each spectrum was 0, and
the largest value of each spectrum was 1. Spectra were then analyzed for the baseline-
adjusted area (the sum off all values in the range with a linear baseline between local
minima near the range (search window 5) subtracted) of the region between 220 cm-1 and
250 cm-1, a region associated with Ag-O bonds which may be formed between the
corundum surface and the surfaces of AgNPs. Images were created for each sample
observed using this program. These results were subsequently processed using R to
determine differences between pH. The Shapiro-Wilk test indicated that within each pH
value and across all pH values, the distribution of adjusted peak area is not normally
distributed. As the data did not meet the typical criteria for parametric tests such as
ANOVA and the t-test, the use of nonparametric tests was warranted. The Kruskal-Wallis

26
test (one-way ANOVA on ranks) was performed, with Dunn’s test performed post hoc to
determine which populations differ from each other. Additionally, the Mann-Whitney-
Wilcoxon test was performed between every combination of pH values.
4.1.5 Main Results and Conclusions
The two analytical methods led to the following main conclusions:
(1) According to the ICP-OES data, pH does not appear to have a significant effect on
total adsorption of AgNPs to corundum (data not shown here, see:O’Neil). The
physisorption mechanism that arises from change in surface charge of corundum at
varying pH values (6–11) does not play the most significant role in total adsorption. (2)
According to the Raman results, there is some pH-dependent effect on the AgNP-
corundum molecular interaction, but its contribution to the total adsorption is either
insignificant or counteracted by some other mechanism. This is indicated by the
significance of the difference between pH values in the peak areas of the Raman regions
associated with Ag-O bonds formed during the direct chemical interaction between the
corundum surface and AgNPs.
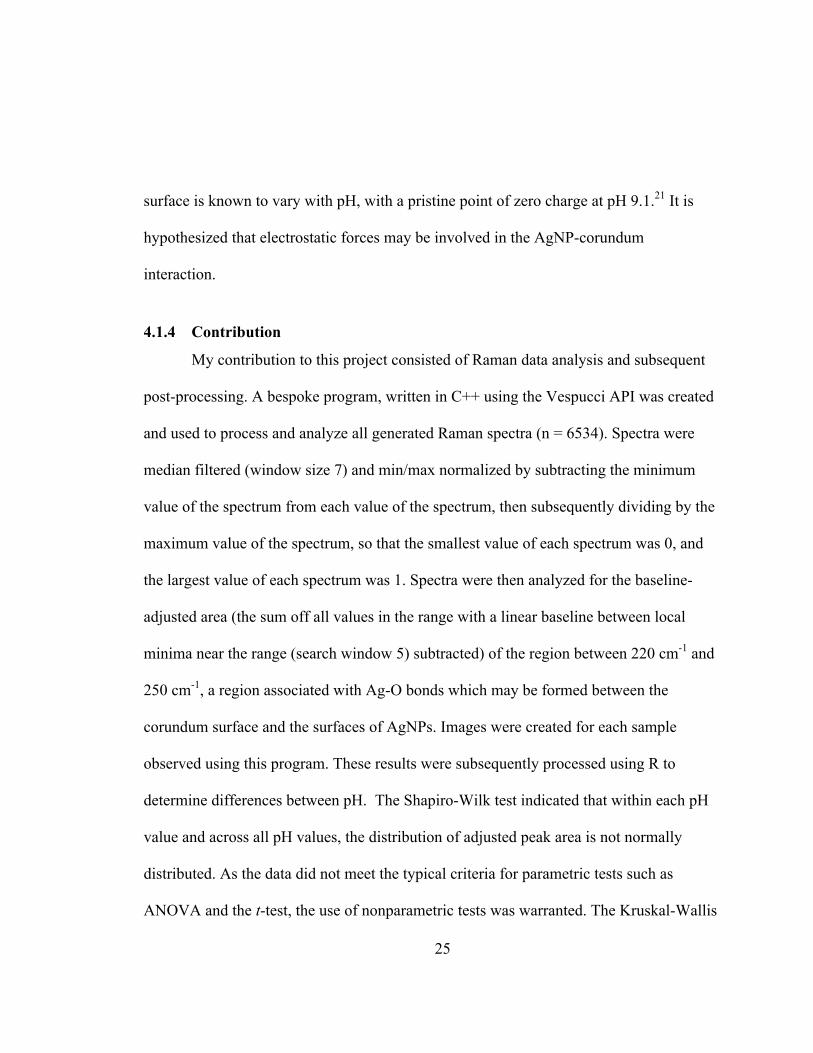
Figure 8 depicts average processed Raman spectra of corundum exposed to
AgNPs at each pH value studied. The region from 220–250 cm-1 (A) is associated with
Ag-O stretching and appears to vary with pH. Assignment of the highlighted regions
27
associated with corundum (B–H) are given in Table 1 (adapted from O’Neil). Relative
intensities of corundum-related bands appear not to vary with pH.
Figure 8: Average Raman spectra (n=1089) of corundum exposed to AgNPs at each pH
value studied
200 400 600 800 1000
0.0
0.2
0.4
0.6
0.8
1.0
Nor
mal
ized
Inte
nsity
(a.u
.)
Raman Shift (cm-1) pH 6 pH 7 pH 8 pH 9 pH 10 pH 11
A
B
C
DE
F G H

28
Table 1: Tentative assignments of the Raman vibrational modes observed for α-Al2O3.
Figure Label Raman Shift (cm-1) Assignment B 37822–26 Eg external C 41622–26 A1g D 42922–26 Eg external E 45122–25 Eg internal F 57622–26 Eg internal G 64422–26 A1g H 75022–26 Eg internal
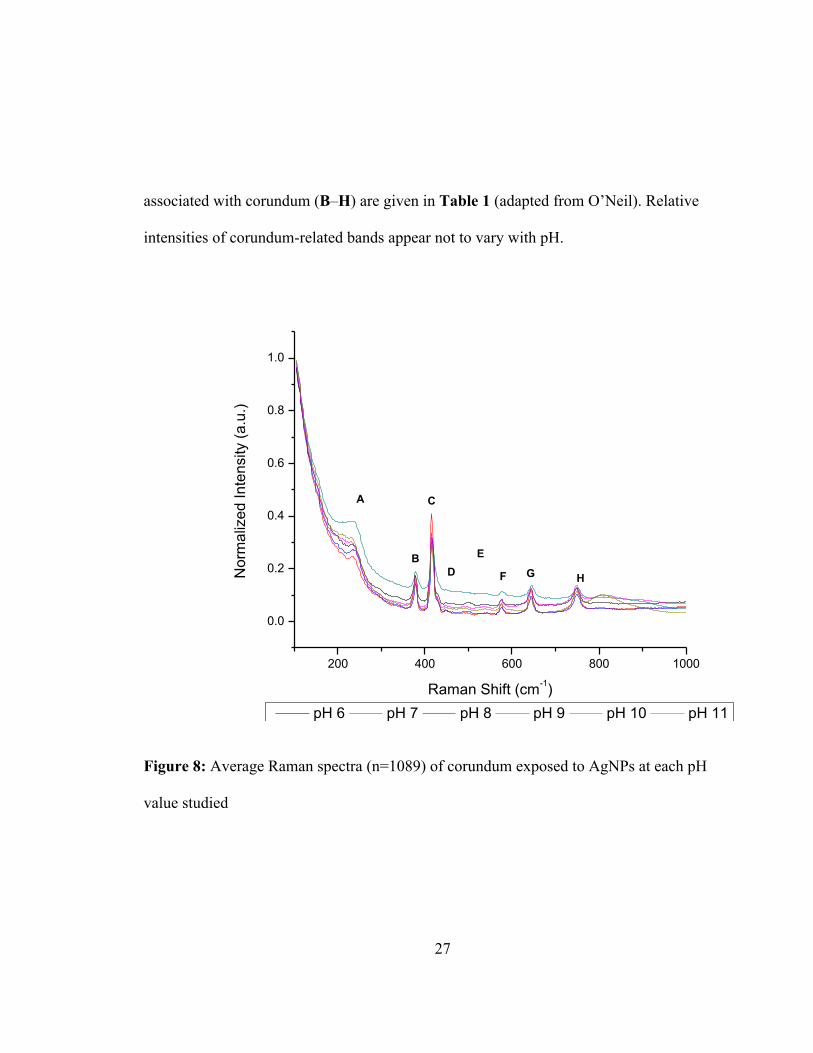
The imaging feature of the Raman spectrometer not only allows for a higher
sample size, but also allows for spatial variability to be qualitatively determined. Raman
maps were collected for each sample prepared for a total of 54 maps consisting of 121
spectra each. Figure 9 depicts a Raman image of a 122 µm2 region of a slide containing
corundum with adsorbed AgNPs at pH 9. The color of each point is determined from the
average area of the region from 220 to 250 cm-1. The image is colored using a green color
gradient adapted from ColorBrewer,27 which scales linearly in perceived brightness from
lower to higher values. Areas which display the darkest color represent regions where the
adjusted integrated area was less than or equal to zero. Some spatial variability is
displayed.
29
Figure 9: Image constructed from a 11µm × 11 µm Raman map of a slide containing
corundum with adsorbed AgNPs at pH 9. Colors are mapped to the baseline-adjusted area
of the signal from 220 to 250 cm-1. Lightly colored regions have larger values.
30
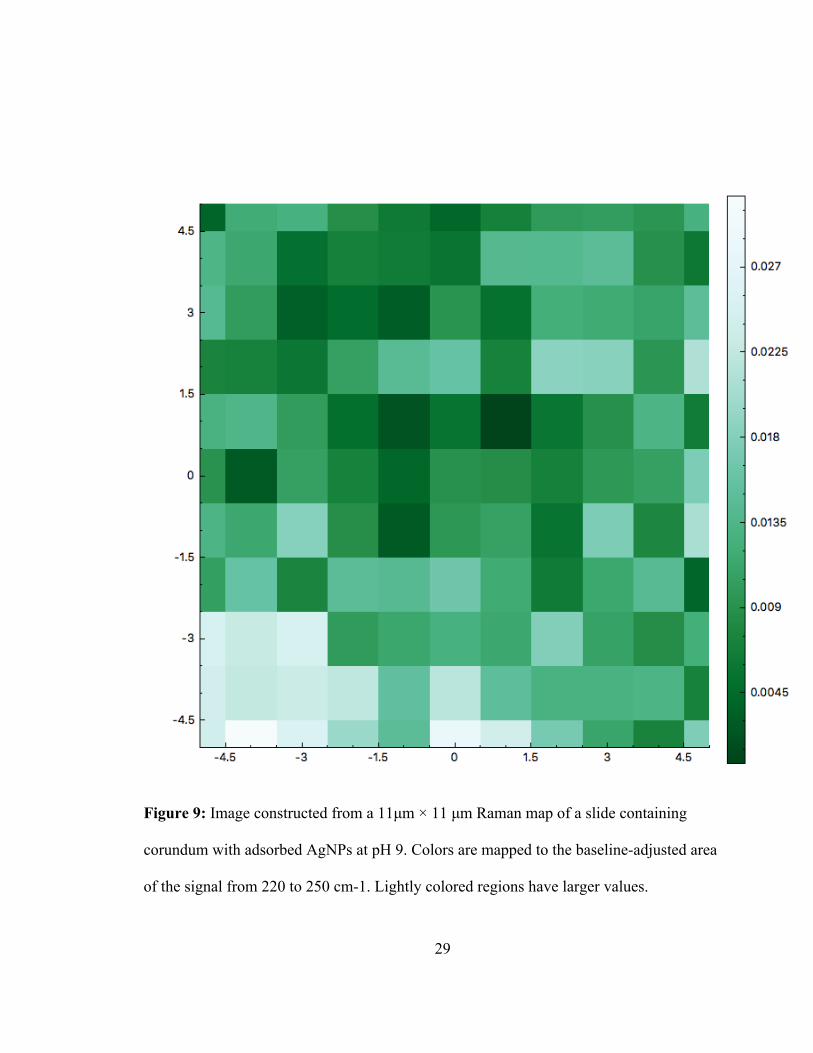
The use of Raman imaging also allows for visual comparisons between different
samples. Figure 10 depicts a comparison of two Raman images of 122 µm2 regions. The
left image is of a slide containing corundum with adsorbed AgNPs at pH 6. The right
image is of a slide containing corundum with adsorbed AgNPs at pH 11. The two images
share a common color scale similar to the scale in Figure 9, but scaled from the smallest
to largest value for adjusted integrated area for all samples. This allows for direct
comparisons between images. It is clear that the values of the pH 11 map are higher than
those of the pH 6 map. This is confirmed by the population statistics displayed in and
Figure 11 and the results of the Kruskal-Wallis test displayed in Table 2. These
differences will be described in more detail later in this text.
Figure 10: A comparison of two 11µm × 11 µm Raman images from samples of
corundum incubated with AgNPs at different pH values. The figure at right depicts a

31
sample at pH 11. The figure at left depicts a sample at pH 6. The two images share a
common color scale. Greater values are indicated by greater colors.
Figure 11 depicts the distributions of baseline-adjusted integrated areas of the
Ag-O stretching band at 220–250 cm-1 at all 6 pH values. Distributions overlap
considerably between pH values and do not appear to be normal, as the Shapiro-Wilk test
confirms. There does not appear to be a clear trend in adjusted peak area versus pH,
however, adjusted peak areas are greater for pH values greater than 9 than they are for pH
values lower than 9, according to the Mann-Whitney-Wilcoxon test (p < 0.01), as
illustrated in Figure 12.
32
Figure 11: Box plot of baseline-adjusted integrated area of the region between 220 and
250 cm-1, corresponding to the Ag-O stretch of the corundum-AgNP interaction, per pH.
Whiskers represent three halves of the interquartile range. Outliers outside three halves of
the interquartile range are represented by circles.

33
Figure 12: Box plot of baseline-adjusted integrated area of the region between 220
and 250 cm-1, corresponding to the Ag-O stretch of the corundum-AgNP interaction, per
pH category (less than 9, equal to 9 and greater than 9). Whiskers represent three halves
of the interquartile range. Outliers outside three halves of the interquartile range are
represented by circles.
The results of the analysis of adjusted peak area by pH confirmed that there was a
significant (p < 0.05 after Bonferroni adjustment for multiple comparisons) pH-

34
dependent effect on the Raman signal associated with Ag-O interactions. According to
both Dunn’s test and pairwise Mann-Whitney-Wilcoxon tests, the adjusted peak areas
found from samples with the pH values listed in Table 2 are likely (p<0.05 after
Bonferroni adjustment) to come from different distributions.
Table 2: Significantly different populations by pH.
pH 1 pH 2 6 7 6 10 6 11 7 8 7 9 7 11 8 10 8 11 9 10 9 11 10 11

35
4.2 Interaction of Creighton Silver Nanoparticles and Dengue virus
SERS-based Analysis for the Antiviral Activity of AgNPs in Dengue Virus
Sesha L. A. Paluri1, Daniel P. Foose1, Kelley J. Williams2, Catherine B. Anders1, Kevin
M. Dorney1, Nancy K. Bigely2, Ioana E. Sizemore1
1Department of Chemistry, Wright State University, 3640 Colonel Glenn Highway,
Dayton, OH 45435
2Department of Neuroscience, Cell Biology & Physiology, Wright State University, 3640
Colonel Glenn Highway, Dayton, OH 45435
Manuscript in preparation
Data presented below with permission of the authors.
4.2.1 Main Goal
The main goal of this work is to examine the antiviral mechanism of AgNPs at the
molecular level by probing the interaction between AgNPs and Dengue serotype 2
(DENV2) interaction using SERS. The natural surface-enhancement effects of AgNPs
were used to examine the chemical environment near aggregated AgNPs interacting with
the virion surface. Subsequent chemometric analysis was used to determine the most
common peak regions and their assignments. This represents the first use of SERS with
chemometrics to study the interaction of AgNPs with a flavivirus. Additionally, the

36
chemometric approach allowed for the discrimination of relevant spectral signatures from
a large volume of data with poor signal-to-noise characteristics. This work was carried
out without any modification of the AgNPs or virion, avoiding the use of fluorophore
labeling commonly used in other studies of this kind.
4.2.2 Relevance
Dengue virus, which causes Dengue and Dengue hemorrhagic fevers, poses a threat
to nearly 2.5 billion people throughout tropical regions around the world.28 This problem
increases as global climate change expands the range of Aedes aegypti, the mosquito that
serves as the primary vector for the virus and recently entered U.S territory.29 Currently,
no treatment or vaccine exists to reduce the impact of this virus. Recent attempts at
developing treatments for Dengue virus infection focus on viral entry process, targeting
the viral envelope glycoprotein E or the several host cell receptors to which it binds.
Silver nanoparticles (AgNPs) were shown to exert antiviral activity at concentrations (<
100 mg L-1) that pose little harm to cells and organisms.30,31 This is believed to be due to
the interaction between AgNPs and proteins on the virion surface, receptors on the host
cell, or some combination of both, but has not been examined at the molecular level until
this work and that of our collaborator.32 This work is designed to examine the AgNP-
virion molecular interaction by harnessing the plasmonic enhancement effect of AgNPs
using surface-enhanced Raman spectroscopy (SERS).
37
4.2.3 Background
Viruses that are the causes of emerging and re-emerging infectious diseases pose a
global threat to human health.33 Most current antiviral drugs target only a small subset of
viruses and cannot be prescribed until there is a detectable malfunction in the host
organism. Historically, antiviral agents have been much more difficult to develop than
antibiotic agents. Because of the difficulty in antiviral drug development, prophylaxis,
primarily in the form of vaccines, has become the primary means of controlling viral
disease. While vaccination has been effective for the control and even eradication of viral
disease, the development of effective vaccines, like the development of antiviral drugs, is
encumbered by the requirement of specificity. AgNPs exhibit antiviral properties against
a wide variety of viruses (including herpes simplex viruses 134 and 235, human
immunodeficiency virus 136 and H1N1 influenza A37) at sub-cytotoxic concentrations,
leading to AgNP-derived treatments for treatment and prophylaxis of viral diseases.
Dengue fever and Dengue hemorrhagic fever are re-emerging infections caused by
Dengue virus (DENV), a mosquito-borne flavivirus. It is estimated that over 40% of the
world population is at risk of infection by one of four DENV serotypes, which infect
between 50 and 100 million individuals annually.28 DENV, like other flaviviruses,
consists of a positive sense, single strand RNA genome encapsulated by capsid, further
encapsulated by a host-derived envelope embedded with envelope proteins. The entry and
fusion process is mediated by glycoproteins in the envelope (particularly the envelope

38
glycoprotein E) through receptor-mediated endocytosis in acidic environments and direct
fusion in neutral environments.38,39
AgNPs have been shown to inhibit multiple viral infections through their interaction
with cysteine residues of the envelope proteins and glycosaminoglycans on the surface of
host cells.30 Most existing studies of the antiviral action of AgNP have modified the
AgNP surface to suit the desired application and have focused on biological methods to
quantify the inhibition of viral entry and generalize thiol groups as the target for
AgNPs.30 While the antiviral properties of AgNPs are known, there is little knowledge of
the exact binding sites of AgNPs. Therefore, a more sensitive detection method is
required to pinpoint the molecular interactions of AgNPs with target proteins.
Due to the localized surface plasmon resonance effect of AgNPs (the so-called
“electromagnetic enhancement” mechanism), otherwise weak Raman signals are greatly
enhanced. Because of the magnitude of this enhancement, SERS can be used as an
ultrasensitive vibrational fingerprinting technique, allowing detection to the single
molecule level under biocompatible conditions.40–42 SERS requires only minimal sample
preparation, enabling its employment in small molecule detection, DNA sequencing,40
viral genotyping,43 and cancer diagnosis.44 When combined with the imaging features of
modern Raman spectrometers, SERS allows for the collection of large datasets consisting
of signals corresponding to analytes at low concentrations. The size of these datasets

39
obviates the use of software tools to automate data processing and analysis, as performing
these tasks by hand for all spectra becomes inconvenient.
Conventional (non-enhanced) Raman spectroscopy in conjunction with chemometrics
has previously been employed in DENV diagnosis, showing that DENV virions give rise
to Raman signals distinct from those of other biomaterials.45,46 Previous SERS studies
involving DENV have focused on virus detection and relied on labeling with SERS-
active dyes.47 Raman spectroscopy has hitherto not been used to examine the AgNP-
DENV interaction mechanism.
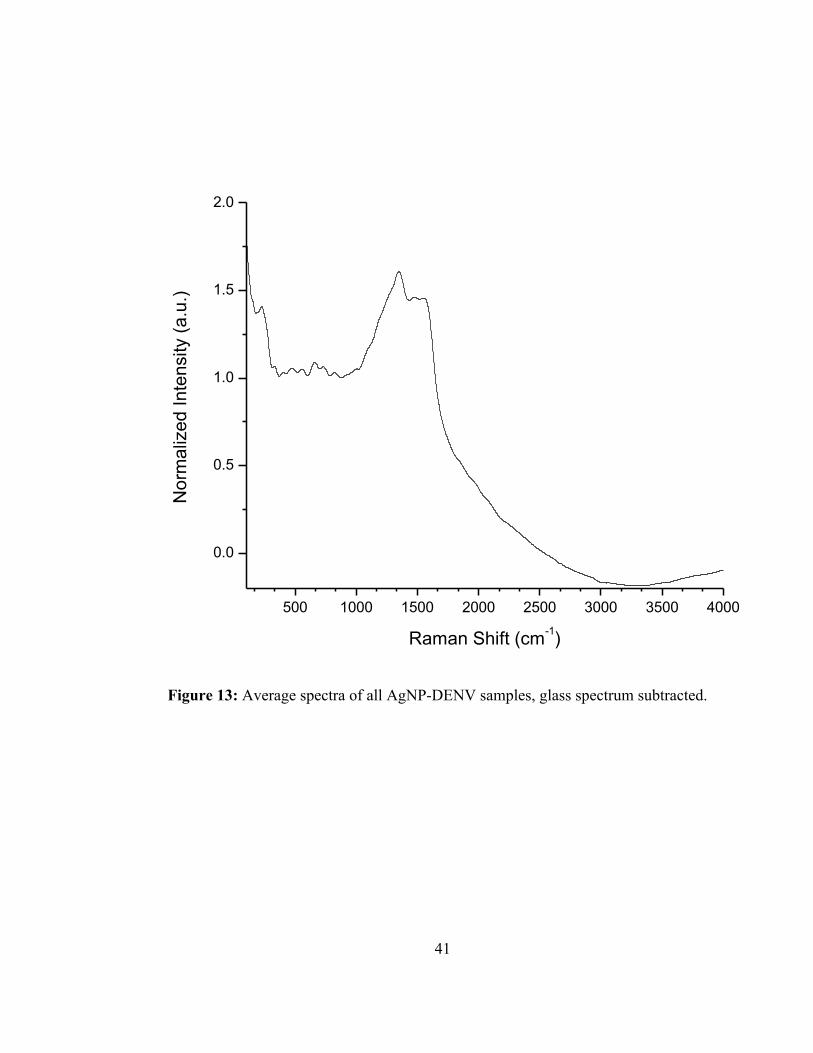
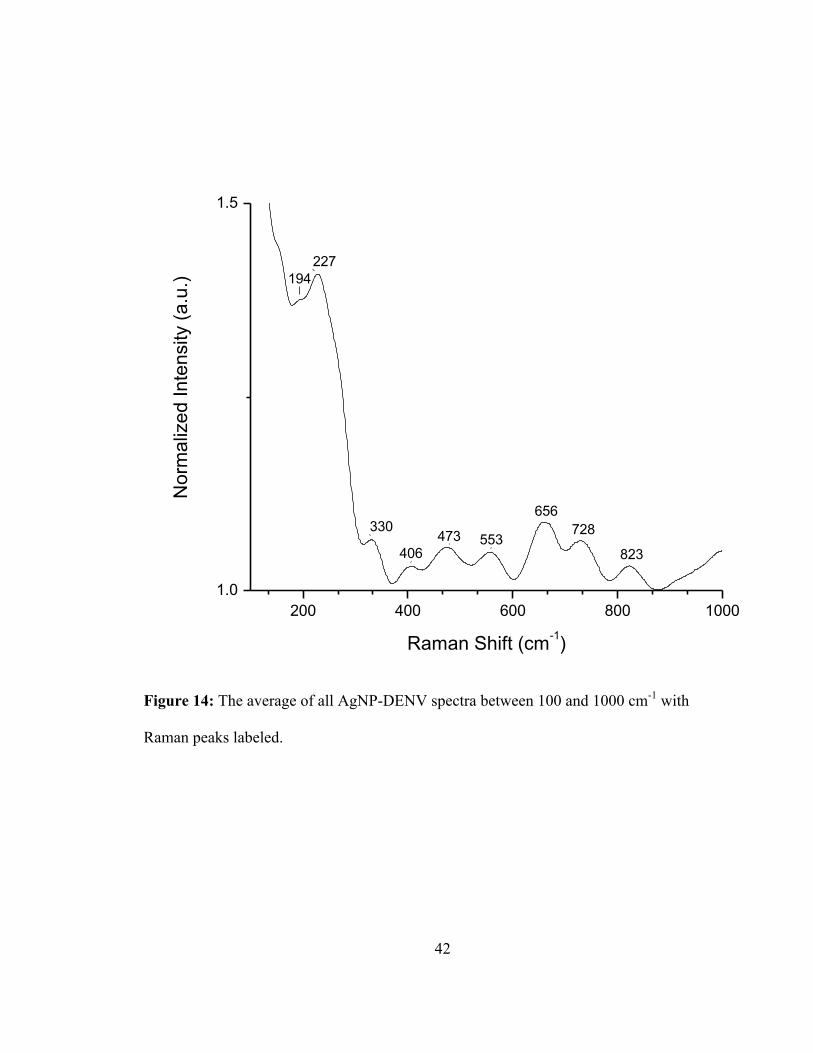
4.2.4 Contribution
My contribution to this work consisted of Raman data analysis, utilizing Vespucci. A
description of the data processing and analysis steps is given in Section 2.3.1 on Page 6.
The average spectrum of DENV samples is given in Figure 13, with detailed views in
Figure 14 and Figure 15.
4.2.5 Main Results and Conclusions
The CWT-based peak detection algorithm revealed the peaks displayed in Table 3.
Analysis of the average of all spectra resulted in the peaks displayed in Table 4. The
differences between the two methods are a potential cause for concern, but also reflect
the fact that peaks of higher intensity are more strongly weighted in the average
spectrum. The peaks found show that AgNPs do bind to the E glycoprotein in regions that

40
contain serine, histidine and sugars, indicating that the antiviral mechanism of AgNPs
involves the arresting of the entry-fusion process by the physical separation of host cell
surface receptors and the DENV E glycoprotein. It is possible that the E glycoprotein has
a higher affinity for AgNPs than for the receptors on the host cell. As many viruses
contain similar glycoproteins in their envelopes or capsids, this mechanism possible
contributes to the activity of AgNPs against a variety of viral agents.
41
Figure 13: Average spectra of all AgNP-DENV samples, glass spectrum subtracted.
500 1000 1500 2000 2500 3000 3500 4000
0.0
0.5
1.0
1.5
2.0N
orm
aliz
ed In
tens
ity (a
.u.)
Raman Shift (cm-1)
42
Figure 14: The average of all AgNP-DENV spectra between 100 and 1000 cm-1 with
Raman peaks labeled.
200 400 600 800 10001.0
1.5N
orm
aliz
ed In
tens
ity (a
.u.)
Raman Shift (cm-1)
330
406473 553
194227
656728
823

43
Figure 15: Average of all DENV spectra between 1000 and 2000 cm-1. Relevant peaks
labeled.
1000 1200 1400 1600 1800 20000.5
1.0
1.5
2.0N
orm
aliz
ed In
tens
ity (a
.u.)
Raman Shift (cm-1)
1348
14761551

44
Table 3: Raman signals associated with the AgNP-DENV interaction, from peak finding
algorithm, with tentative assignments.
Raman Shift (cm-1)
Literature Raman Shift
(cm-1) Tentative Assignment
523 524 phosphatidylserine48,49 612 611 L-serine50 731 733 phosphatidylserine48,49 786 787 phosphatidylserine48,49 919 922 L-serine50 1043 1048 D-mannose45 1056 1055 N-acetylglucosamine51 1341 1343 D-mannose 1371 1368 L-serine50 1462 1458 guanine50

45
Table 4: Raman signals found by analyzing the average DENV spectrum.
Raman Shift (cm-1)
Literature Raman Shift
(cm-1) Tentative Assignment
194 190 AgCl52 227 217 AgO53 330 342 Ag2O52 406 406 D-arabinose50 or DENV serum45 473 473 D-mannose50 553 548 NS1 antigen54
656 656 L-histidine50 728 733 phosphatidylserine48,49 823 824 L-valine50 1348 1348 D-mannose45 1476 1481 D-mannose50 1551 1550 guanine50
46
5 CONCLUSIONS
Vespucci, an advanced, easy-to-use software package for spectroscopic data analysis,
has been successfully developed and deployed on all three major desktop computing
platforms (Windows, Mac and Linux). To date, the manuscript describing Vespucci has
been read over 300 times and downloaded over 30 times.9 A plan has been put in place to
sustain the development and maintenance of this package into the future. It is hoped that
work on Vespucci will further chemometrics research at this institution and others and
will continue the expansion of software development skills in chemistry researchers. By
removing cost and technical barriers to the use of chemometrics, Vespucci will further
the ability of researchers without programming skills to implement advanced data
analysis methods in order to further understand spectroscopic information.
With future improvements in features, user interface and code quality, Vespucci will
come closer to its goal of being competitive with expensive, restrictively-licensed
commercial software. The advent of a full-featured, graphically driven, free software
chemometrics package will provide researchers with a wider variety of tools. By giving
researchers this choice, it is hoped that the applications of chemometrics to spectroscopy
will continue to grow. By encouraging outside contributions, the overall quality and
utility of this package will be enhanced.
While still in beta, Vespucci has already been utilized to solve a number of different
problems in Raman spectroscopy and SERS. Its applications to environmental science

47
have been demonstrated by its use to examine the interaction of AgNPs and corundum at
the molecular level. In the life sciences, the use of Vespucci to examine AgNP-DENV
interaction has been successfully demonstrated. The simple GUI allows for the easy
implementation of advanced techniques heretofore never available in a graphically-driven
software package. The C++ API allows for quick, automated analysis of an arbitrary
number of datasets. These two features make Vespucci useful to a wide variety of teams.
It is hoped that use of Vespucci will continue to grow and enhance the research of others
in all fields where spectroscopy is used. More information about Vespucci will be
available at http://vespucciproject.org.

48
6 ADDENDA
6.1 Vespucci Guide for Contributors (CONTRIBUTING.md)
6.1.1 Guidelines for Potential Contributors
Thank you for your interest in contributing to the Vespucci Project. These guidelines
should help you make a valuable contribution to the project. They cover the process of
contributing to Vespucci, the process of adding a spectral pre-processing method and the
process of adding a spectral analysis method. By following these guidelines, we hope
Vespucci can attain a higher degree of quality than other research code.
6.1.1.1 Contributing to Vespucci
The issues page on GitHub includes features we would like to see added to Vespucci
that we are currently not working on. If you have a contribution to make, comment on
one of these issues (or start your own) and we may assign the issue to you.
If you have code to contribute to Vespucci, simply make a pull request with your
changes to the VespucciProject GitHub page. The contribution should include unit tests
for at least the functions added to the Vespucci::Math namespace. The pull request
will be automatically built by our build service providers, which will execute unit tests
(provided you have added them to the Test.pro project). The code will be examined for
style and quality by the maintainer, and if all tests pass and the contribution is deemed
within the mission of the project, your contribution will be integrated into the code base
49
and your name added to our list of contributors. Any code contributed must compile, test,
and run successfully on all three of Vespucci’s target platforms.
If you have already implemented a method not found in Vespucci in MATLAB or
Octave, take a look at the syntax conversion table. Re-writing MATLAB code in C++
using Armadillo is fairly easy.
If you are uncomfortable with Qt, but have a meaningful math function to contribute
to the library, feel free to make a contribution. The user interface can be created later.
Bug fixes and code that improves performance or clarity of existing functions are also
welcome.
6.1.2 Libraries
Generally, code contributed to the Vespucci project can rely only on the following
libraries:
• Qt
• Boost
• Armadillo
• mlpack
If there is a compelling reason to use a different library than the ones listed above,
please discuss it with us using the issues tab before you start writing code. Any library
50
that is to be used in Vespucci must be regularly built and tested on Windows 7 (using
MSVC and GCC), Mac OS 10.7 (Using clang), and Ubuntu 14.04 LTS (or a similar
GNU/Linux distro, using GCC). If the library is not regularly tested on one of these
platforms, and there is compelling reason to do so, we will set-up regular testing using
Travis-CI and or Appveyor. As Vespucci is distributed under the terms of the GPL, any
additional library used must use a license acceptable for GPL software.
6.1.3 Code Style
6.1.3.1 Style Guides
Vespucci tries to adhere to the Google C++ Style Guide. However, none of the
libraries Vespucci links to follow this guide. Armadillo uses underscore_case for all
names and mlpack and Qt use camelCase for all names. The following exceptions (and
perhaps others) apply:
• Source files take the extension .cpp.
• Member functions that call their member’s member functions take the same
style as their member’s member function (e.g. if we write a function in a
QDialog class that calls the addGraph member of
a QCustomPlot object, we name the member of

51
the QDialog "addGraph()", rather than the stylistically preferred
"AddGraph()").
6.1.3.2 Names
• Both member functions and functions that do not belong to a class are named
in PascalCase, unless they are getters.
• Member variables are denoted in underscore_case, with a trailing underscore
(e.g. name_, spectra_, etc).
• Variables that are not members are denoted in underscore_case.
• Setters are named in PascalCase like other functions, but are named after the
variables they set (e.g. SetName() for the setter of the name_ member).
• Getters are named after the member they return (e.g. the getter for
abscissa_ is named abscissa()). Getters that return pointers to
members have _ptr appended to the end of their names. Where getters that
return copies and getters that return references both exist, the getter that
returns the reference is named with _ref appended.
• Every function belongs to a namespace, either the namespace of its parent
class or a namespace like Vespucci::Math or BinaryImport.
52
• Widgets in Qt forms are named using Qt style inside .ui files, but use our style
inside C++ classes (e.g. nameLineEdit becomes name_line_edit_).
The type of the widget should be included in the name.
• As mentioned above, an exception exists for a function whose sole purpose is
to call the member of one of the class’s members.
6.1.3.3 Types
Variables in Vespucci should use the following types:
• Numeric data should use armadillo types whenever possible.
• Data to be displayed to the user should use Qt types whenever possible,
converting them to standard library types only when necessary.
• If a variable is expected to be unsigned, it should use an unsigned type.
6.1.4 Adding Processing Methods to Vespucci
To add a processing method to Vespucci, the following must be done:
• A member function must be added to VespucciDataset to execute the
analysis.
• If the method requires more than 5 lines of code, a function performing the
method must be included in the Vespucci::Math namespace in the
Vespucci library.
53
• A form class subclassed from QDialog must be created, or an existing
dialog expanded to handle the new method.
6.1.5 Processing GUI Classes
If a class already exists for performing a processing step substantially similar to the
method to be added, the existing class should be expanded by the addition of widgets to
handle user input. Widgets may also simply be reused with their QLabels changed. If a
new form class must be created, follow the same procedure as you would for a new
analysis form class, documented in the subsection “Analysis GUI Classes” of the section
“Adding Analysis Methods to Vespucci”.
6.1.6 Adding Analysis Methods to Vespucci
To add an analysis method to Vespucci, the following must be done:
• A member function must be added to VespucciDataset to execute the
analysis. This member must take QString name as its first parameter.
• If a method has not yet been implemented in mlpack, a function to execute the
analysis must be created in the Vespucci::Math namespace of the
VespucciLibrary.
• A class must be created to handle data generated by the analysis, unless
mlpack has already done this. This class must inherit AnalysisResults

54
• A form class subclassed from QDialog to allow the user to enter parameters.
6.1.7 Analysis GUI Classes
GUI classes to handle the input of parameters from the user must have the following:
• A constructor which takes the current QModelIndex from dataset tree view
and obtains a QSharedPointer<VespucciDataset> to the dataset the
analysis is to be performed on, and calls findChild on the required
QWidget members.
• A member called data_ or dataset_ which contains a
QSharedPointer<VespucciDataset> corresponding to the active
dataset.
• Pointers to the appropriate QWidgets that interact with the user.
• Correct names for the widgets. A QWidget that is called “thingWidget” in
the .ui file should have a pointer named thing_widget_ in the class.
Widgets are named in the conventional Qt style within forms, but in Google-
esque style within the C++ classes. The base type of the widget must be
included in the name (e.g. name_line_edit_ for the QLineEdit object
that takes string representing a name from a user).

55
6.1.8 VespucciDataset member functions
Member functions to perform an analysis must do the following:
• Take the name of the object to display to the user and use as a key in
analysis_results_.
• Perform the analysis through a class designed to handle the analysis (either
bespoke or included from mlpack)
• Add a QSharedPointeR<AnalysisResults> object
to analysis_results_ map containing the matrices generated by the
analysis, from the class designed to handle the analysis.
6.1.9 Classes to Handle Analysis Data
A VespucciDataset contains all analysis methods that may be called on it. Each
analysis has a helper object which takes the data as a reference from the dataset. Helper
objects must inherit AnalysisResults and implement the following members:
• A constructor which takes the name of the result and relevant metadata.
• Private members of arma::mat type which store the results of the analysis.
It is customary to use the member results_ when a matrix is returned from
an analysis function, and to name these members the same as the parameters

56
of the analysis function (remembering to add the trailing underscore used for
members in Vespucci).
• A method called Apply() to which is passed spectra_ and perhaps
abscissa_, along with the parameters of the analysis that are taken in the
VespucciDataset analysis member function. This function calls the
functions from the Vespucci library that are required for the analysis.
• Overloads of methods inherited from AnalysisResults: GetMatrix,
which takes a const QString key and returns a generated
matrix, KeyList, which returns a list of valid arguments
for GetMatrix, GetMetadata, which returns information related to the
analysis in key-value pairs, and GetColumnHeading which returns the
column heading for a particular column of a matrix.
6.1.10 Analysis Functions in the Vespucci::Math Namespace
Analysis methods must be implemented in either mlpack or armadillo, or in the
Vespucci::Math namespace. A few style rules apply to this namespace that do not
apply to Vespucci in general:
• All matrices on which operations are to be performed are to be taken as
constant references (const arma::mat&). If the matrix itself is to be
57
modified, the function should return a copy or include a copy as a non-const
reference parameter.
• The using directive should not to be used so as to avoid confusion between
functions in the std and arma namespaces.
• To ease wrapping with other languages, Qt classes are to be avoided. The
equivalent C++ standard library class should be used instead (e.g.
std::string instead of QString). This is in contrast to the Vespucci
GUI program, where Qt types are preferred.
• Armadillo, Boost, and the standard library are the only libraries that may be
used. This is intended to make the code readable by users who are only
familiar with languages like MATLAB.
• Unit tests must be written using the Boost unit test framework.
• Functions that check for success must have return values of type bool.
• Each analysis that operates on single spectra must include a function that takes
a single spectrum and a function that takes a column-major matrix of spectra.
The function that takes a matrix will have the same name as the function that
takes a vector, but with Mat appended to the end of the function name
(e.g. QuantifyPeak and QuantifyPeakMat, where
QuantifyPeak returns

58
a arma::rowvec and QuantifyPeakMat returns an arma::mat). This
allows the matrix functions to be easily parallelized.
• If a matrix is expected to contain only one column, the arma::vec type
should be used. If a matrix is expected to contain only one row,
arma::rowvec type should be used.
• If a value is expected to be unsigned, use arma::uword for integers and
unsigned double for floating-point numbers.
• Any function that can throw an exception should be inside of a try/catch
block. The catch block must write the function call that threw the exception
to stdout and throw the same exception again.
• A function returning a matrix with more than one column for each spectrum
should include these matrices in an arma::field<arma::mat> type.
• Each function should be defined in a file with the same name as the header it
is declared in and each type of analysis should include its own header and
source file.
• The use of C++11 features is highly recommended when they reduce the
complexity of the code.
59
6.1.11 Writing Tests
All methods in the Vespucci library are unit tested to ensure code quality and
reproducibility of results. The project located in the Test folder is used to run all unit tests
on math functions. Example datasets are provided, including real-world and generated
spectra. Unit tests written for functions in the Vespucci library should use the Boost unit
test framework. Tests written for Qt classes should use QtTest. Some methods, such as
Vertex Components Analysis are untestable as they produce different results each time
they are run on the same data. These functions should only be tested for the validity of
their output, not for the values.
6.2 Vespucci Onboarding Exercises
The below exercises are designed to evaluate your competence in the kind of code
used by Vespucci. These exercises replicate a subset of Vespucci’s functionality. Code
should follow either the Vespucci style guide or the conventional style of Qt. If you do
not understand how to do something, use Google, Wikipedia or StackOverflow to figure
out a solution. I will not provide guidance on how to complete these exercises, because
no one provided any guidance to me, and the ability for self-guided learning is essential
for working on software. You may ask a question on a help forum, but expect the mods to
be assholes, as they normally are. Each exercise should be accompanied by a small
program to test the written functions. You may also write a single program to test all the
exercises. Use of a debugger may be helpful. These exercises simulate what I had to

60
teach myself in order to work with Vespucci, coming from only having limited
programming ability. You may need to consult the analytical chemistry literature to
understand the methods mentioned. The armadillo API docs at arma.sourceforge.net will
come in handy.
The exercises culminate in a program that allows the user to import a dataset, process
the spectra, and display a univariate map. This is about as much as Vespucci could do
after I had worked on it for a few days. In doing these exercises, you will gain enough
experience to make a meaningful contribution to Vespucci going forward.
I have working versions of each exercise and the final program. IT IS OK FOR
YOUR VERSION TO BE SIGNIFICANTLY DIFFERENT! As long as it passes tests
and follows the overall design guidelines, your way of solving the problem is as good as
mine. We will review everyone’s versions of the exercises at our meeting and discuss
how they work and how they might be improved. After completing these exercises, you
will be able to make constructive comments on the existing Vespucci codebase.
6.2.1 Exercise 1: Text Parser
Write a function that parses the provided Witec text files into an armadillo matrix
(arma∷mat) with spectra as columns, and armadillo column vectors including the spectral
abscissa (wavenumber), the x spatial coordinate and the y spatial coordinate. You
function should only use methods found in armadillo or the C++ standard library. The

61
output matrices should be passed by reference and the function should return a bool
corresponding to the success of the operation.
This function is not allowed to throw exceptions, but should return false if any fatal
errors occur. Any function call which may throw exceptions should be enclosed in a
try/catch block.
The catch block should write something to stdout and make the function return false.
The Witec file format consists of three files. One file contains the abscissa and all
spectra (the first column is the abscissa, and all subsequent columns are spectra. The
other files contain x spatial data and y spatial data separately. The file including the x
data contains the unique x values. The file including the y data includes a repeating
pattern of y values for each unique x value. Each y sequence repeats once for each unique
x value. Hint: it is possible to perform this file input entirely using armadillo functions
because there are no characters other than numbers and separators in the input files.
6.2.2 Exercise 2: Spectra Processing
The following functions process a spectrum or spectra. You may write a function that
processes a single spectrum and iterates through an input matrix, or you may write a
62
function that performs the operation on all columns of a matrix (which would be able to
handle a matrix of arbitrary size, from a single column to millions of columns).
6.2.2.1 Median Filter
You should write a function to perform median filtering. You will have to look up
what that means. At the edges of the spectra (the first n/2 points), the point should be
replaced by the value of the median of the window of size n which includes the point,
with the point as close to the center as possible. The spectrum should be passed as a
constant reference and the return value should be the processed spectrum. Only odd
window sizes should be allowed.
6.2.2.2 Finite Impulse Response Filters
Write a function that applies an arbitrary finite impulse response filter to a spectrum.
You should also use a Fast Fourier Transform algorithm to perform the necessary
convolution. You should also write functions to generate moving average and Savitzky-
Golay filters for use in the FIR function. These functions should be able to generate
filters of arbitrary window size. The Savitzky-Golay filter method should be able to
create filters of arbitrary window size, polynomial order, and derivative order, and should
verify that the derivative order is valid for the given polynomial order (i.e. you can’t take
the fourth derivative of a quadratic function) before creating the filter. You may choose
to either throw an exception (like std∷invalid_argument) or pass a Boolean value as a
reference as one of the parameters.

63
6.2.2.3 Min/Max Normalization
You should write a function to perform min/max normalization. With min/max
normalization, the minimum value of the spectrum is set to 0 by subtracting the original
minimum from all points. Then, the maximum value is set to 1 by dividing the value of
each point by the maximum of the shifted spectrum. The spectrum should be passed as a
constant reference and the return value should be the processed spectrum.
6.2.2.4 Standard Normal Variate Normalization
Write a function that performs standard normal variate normalization. You will have
to look up what that is and how to implement it. The spectrum or spectra should be
passed as a constant reference and the return value should be the processed spectrum.
6.2.2.5 Spectrum Unit Conversion
Write a function that takes a spectrum or spectra and an abscissa and converts the
values of percent transmittance into values of arbitrary intensity. Write another function
that converts a spectrum or spectra with wavenumber units into wavelength units. This
function should take arbitrary scaling (i.e. it should convert cm-1 into Å, m, nm, etc.
depending on how it’s called). The transformed abscissa should be returned.
6.2.2.6 Oversampling/Undersampling
Given a spectrum or spectra and abscissa, this function should transform the spectrum
to a new abscissa with the same minimum and maximum. The new abscissa can have
more points (oversampling) or fewer points (undersampling). The function should use

64
spline interpolation over an arbitrary number of points, or simple linear interpolation
between two points, depending on the parameters given to the function.
6.2.3 Exercise 3: Dataset Class
Create a plain-old C++ class with the following members:
• A name, stored as QString
• spectra_, abscissa_, x_, and y_ as members of type arma∷mat and arma∷vec,
respectively.
• A constructor that takes only a QString and sets it as the name.
• A public member function to set the other members.
6.2.4 Exercise 4: File Import Dialog
Create a Qt GUI form class containing the following:
• A constructor which accepts QWidget* and a reference or pointer to the dataset
C++ class you created above.
• A member containing a reference or pointer to the dataset C++ class you created
above.
• A QListWidget to display input filenames.
• A QPushButton which, when clicked, opens the users native file dialog for
selecting the input files.
65
• A QButtonBox with the options “Ok” and “Cancel” (will be automatically created
if you select “dialog with buttons bottom”.
When the user clicks the browse button and accepts the file dialog, the list widget
should populate with the names of the selected files. When the user accepts the button
box, you should call your file parser on the input files and if the import failed, present a
QMessageBox with a warning. If successful, call the member of the dataset class to set
the matrices.
6.2.5 Exercise 5: Peak Intensity Analysis
6.2.5.1 The Math Function
Write a function, that, given a spectrum or spectra and a spectral abscissa, finds the
highest value of the spectrum whose index corresponds to a value between the index of a
specified search window minimum and the index of a specified search window
maximum. The function should determine both the value of the maximum and the
position of the maximum in spectral abscissa units.
6.2.5.2 GUI Wrapper
You should create a Qt form class as a wrapper for this function, that contains
QLineEdit objects to take the range the user specifies. The range should be validated by
the class. The wrapper Qt class should contain a member containing a pointer or
reference to the dataset class you created above.

66
6.2.6 Exercise 6: Color Map Viewer with QCustomPlot
Create a Qt Form Class for a window without buttons. This should contain a single
widget, elevated to QCustomPlot. The function should take three vectors of equal size, x,
y, and values. It should create a color map using QCustomPlot for display in the
QCustomPlot widget.
6.2.7 Project
Combine the code you wrote for the above exercises into a standalone GUI
application that allows the user to:
• Import a dataset file (you don’t need to be able to handle multiple datasets)
• Process that file using the methods you implemented.
• Perform a univariate analysis on the dataset.
• Display a color map depicting the univariate analysis.
67
6.3 Vespucci C++ API Example—BatchVCA /******************************************************************************* Copyright (C) 2014-2016 Wright State University - All Rights Reserved Daniel P. Foose - Maintainer/Lead Developer This file is part of Vespucci. Vespucci is free software: you can redistribute it and/or modify it under the terms of the GNU General Public License as published by the Free Software Foundation, either version 3 of the License, or (at your option) any later version. Vespucci is distributed in the hope that it will be useful, but WITHOUT ANY WARRANTY; without even the implied warranty of MERCHANTABILITY or FITNESS FOR A PARTICULAR PURPOSE. See the GNU General Public License for more details. You should have received a copy of the GNU General Public License along with Vespucci. If not, see <http://www.gnu.org/licenses/>. *******************************************************************************/ #include <Global/libvespucci.h> #include <QCoreApplication> #include <QCommandLineParser> #include <QDir> #include <Math/VespucciMath.h> #include <Data/Import/textimport.h> #include <QString> /// /// \brief main /// \param argc /// \param argv /// \return /// Options: /// batchvca components /// -i indir : perform VCA on datasets in this directory, rather than working /// directory /// -o outdir /// -f window_size : perform median filtering with specified window size /// -b poly_order max_it threshold : perform IModPoly baseline correction /// -n type : perform normalization (minmax, area, z, snv) /// --filter, --directory, --baseline int main(int argc, char *argv[]) { using namespace std; using namespace arma; QCoreApplication app(argc, argv); QCoreApplication::setApplicationName("batchvca"); QCoreApplication::setApplicationVersion("1.0.0"); QCommandLineParser parser; parser.setApplicationDescription("Batch VCA"); parser.addHelpOption(); parser.addVersionOption(); parser.addPositionalArgument("components", QCoreApplication::translate("main", "VCA components to " "calculate."));
68
QCommandLineOption indir_option(QStringList() << "-i" << "--indir", QCoreApplication::translate("main", "Parse files from " "<directory>"), QCoreApplication::translate("main", "directory")); QCommandLineOption outdir_option(QStringList() << "-o" << "--outdir", QCoreApplication::translate("main", "Save output files " "to <directory>."), QCoreApplication::translate("main", "directory")); QCommandLineOption filter_option(QStringList() << "-f" << "--filter", QCoreApplication::translate("main", "Perform median " "filtering with " "<window_size>"), QCoreApplication::translate("main", "window_size")); QCommandLineOption normalize_option(QStringList() << "-n" << "--normalize", QCoreApplication::translate("main", "Perform " "normalization " "using <method>."), QCoreApplication::translate("main", "method")); QCommandLineOption baseline_option(QStringList() << "-b" << "--baseline", QCoreApplication::translate("main", "Perform IModPoly " "baselinbe " "correction with " "<opts>"), QCoreApplication::translate("main", "opts")); parser.addOption(indir_option); parser.addOption(outdir_option); parser.addOption(filter_option); parser.addOption(normalize_option); parser.addOption(baseline_option); parser.process(app); const QStringList args = parser.positionalArguments(); int components = args.first().toInt(); bool normalize = parser.isSet(normalize_option); bool correct_bl = parser.isSet(baseline_option); bool filter = parser.isSet(filter_option); int window_size = (filter ? parser.value(filter_option).toInt() : 0); QString baseline_opts = (correct_bl ? parser.value(baseline_option) : ""); QStringList baseline_opts_list; int max_it = 0; int poly_order = 0;
69
double threshold = 0; if (correct_bl){ baseline_opts.remove("("); baseline_opts.remove(")"); baseline_opts_list = baseline_opts.split(","); poly_order = baseline_opts_list.at(0).toInt(); max_it = baseline_opts_list.at(1).toInt(); threshold = baseline_opts_list.at(2).toDouble(); } QString normalize_method = (normalize ? parser.value(normalize_option) : ""); QString in_dir_path = (parser.isSet(indir_option) ? parser.value(indir_option) : QDir::currentPath()); QString out_dir_path = (parser.isSet(outdir_option) ? parser.value(outdir_option) : QDir::currentPath()); QDir in_dir(in_dir_path); QStringList in_filenames = in_dir.entryList(QDir::Files); mat spectra; vec abscissa, x, y; foreach(QString filename, in_filenames){ try{ cout << "Loading " << filename.toStdString() << "." << endl; TextImport::ImportWideText(filename.toStdString(), spectra, abscissa, x, y, true); uvec em_indices; if (filter){ spectra = Vespucci::Math::Smoothing::MedianFilterMat(spectra, window_size); } if (correct_bl){ for (uword i = 0; i < spectra.n_cols; ++i){ vec spectrum = spectra.col(i); double err; vec baseline, corrected; Vespucci::Math::LinLeastSq::IModPoly(spectrum, abscissa, baseline, corrected, err, poly_order, max_it, threshold); spectra.col(i) = corrected; } } if (normalize){ if (normalize_method == "minmax"){ for (uword i = 0; i < spectra.n_cols; ++i){ vec spectrum = spectra.col(i); double min = spectrum.min(); spectrum = spectrum - min*ones(spectrum.n_rows); double max = spectrum.max(); spectrum = spectrum / max; spectra.col(i) = spectrum; } }
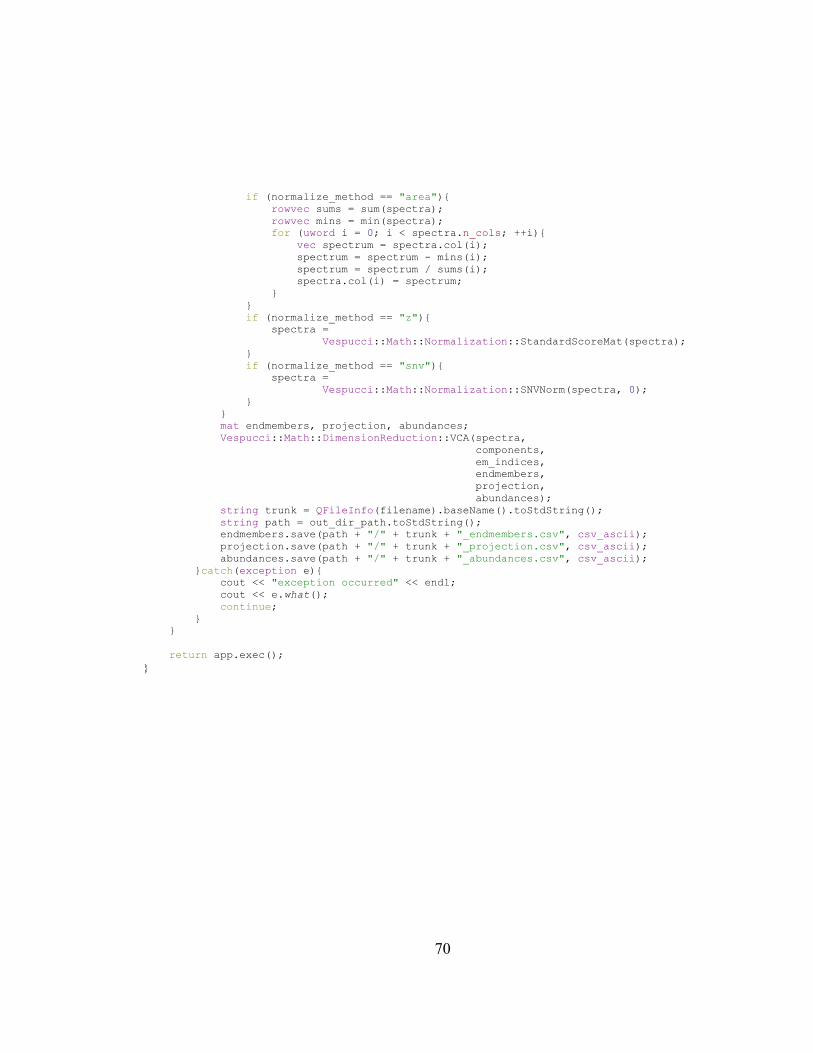
70
if (normalize_method == "area"){ rowvec sums = sum(spectra); rowvec mins = min(spectra); for (uword i = 0; i < spectra.n_cols; ++i){ vec spectrum = spectra.col(i); spectrum = spectrum - mins(i); spectrum = spectrum / sums(i); spectra.col(i) = spectrum; } } if (normalize_method == "z"){ spectra = Vespucci::Math::Normalization::StandardScoreMat(spectra); } if (normalize_method == "snv"){ spectra = Vespucci::Math::Normalization::SNVNorm(spectra, 0); } } mat endmembers, projection, abundances; Vespucci::Math::DimensionReduction::VCA(spectra, components, em_indices, endmembers, projection, abundances); string trunk = QFileInfo(filename).baseName().toStdString(); string path = out_dir_path.toStdString(); endmembers.save(path + "/" + trunk + "_endmembers.csv", csv_ascii); projection.save(path + "/" + trunk + "_projection.csv", csv_ascii); abundances.save(path + "/" + trunk + "_abundances.csv", csv_ascii); }catch(exception e){ cout << "exception occurred" << endl; cout << e.what(); continue; } } return app.exec(); }
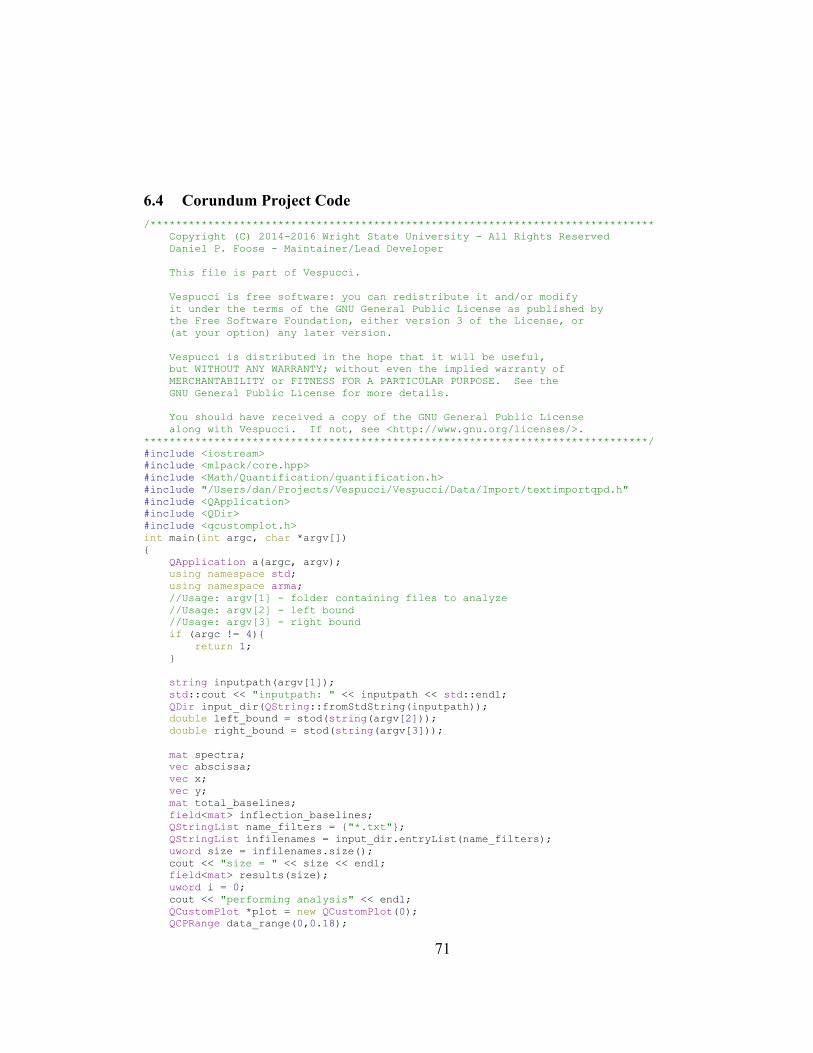
71
6.4 Corundum Project Code /******************************************************************************* Copyright (C) 2014-2016 Wright State University - All Rights Reserved Daniel P. Foose - Maintainer/Lead Developer This file is part of Vespucci. Vespucci is free software: you can redistribute it and/or modify it under the terms of the GNU General Public License as published by the Free Software Foundation, either version 3 of the License, or (at your option) any later version. Vespucci is distributed in the hope that it will be useful, but WITHOUT ANY WARRANTY; without even the implied warranty of MERCHANTABILITY or FITNESS FOR A PARTICULAR PURPOSE. See the GNU General Public License for more details. You should have received a copy of the GNU General Public License along with Vespucci. If not, see <http://www.gnu.org/licenses/>. *******************************************************************************/ #include <iostream> #include <mlpack/core.hpp> #include <Math/Quantification/quantification.h> #include "/Users/dan/Projects/Vespucci/Vespucci/Data/Import/textimportqpd.h" #include <QApplication> #include <QDir> #include <qcustomplot.h> int main(int argc, char *argv[]) { QApplication a(argc, argv); using namespace std; using namespace arma; //Usage: argv[1] - folder containing files to analyze //Usage: argv[2] - left bound //Usage: argv[3] - right bound if (argc != 4){ return 1; } string inputpath(argv[1]); std::cout << "inputpath: " << inputpath << std::endl; QDir input_dir(QString::fromStdString(inputpath)); double left_bound = stod(string(argv[2])); double right_bound = stod(string(argv[3])); mat spectra; vec abscissa; vec x; vec y; mat total_baselines; field<mat> inflection_baselines; QStringList name_filters = {"*.txt"}; QStringList infilenames = input_dir.entryList(name_filters); uword size = infilenames.size(); cout << "size = " << size << endl; field<mat> results(size); uword i = 0; cout << "performing analysis" << endl; QCustomPlot *plot = new QCustomPlot(0); QCPRange data_range(0,0.18);

72
mat all_data; mat averages; ofstream namelist(input_dir.absolutePath().toStdString() + "/names.txt", ofstream::out); while (i < results.n_elem){ QString infilename = input_dir.absolutePath() + "/" + infilenames[i]; namelist << infilename.toStdString() << endl; cout << infilename.toStdString() << endl; QString root_name = infilenames[i]; QStringList filename_trunk = root_name.split("."); root_name = filename_trunk[0]; QStringList filename_parts = root_name.split(" "); int pH = filename_parts[2].toInt(); int trial = filename_parts[4].toInt(); int spot = filename_parts[6].toInt(); try{ TextImport::ImportWideText(infilename, spectra, abscissa, x, y, true, new QProgressDialog(), "\t"); }catch(exception e){ cout << "Exception parsing input file" << endl; return 1; } Vespucci::Math::Smoothing::MedianFilterMat(spectra, 7); for (uword it = 0; it < spectra.n_cols; ++it){ vec current_spectrum; current_spectrum = spectra.col(it); double min = current_spectrum.min(); current_spectrum.transform([min](double val) {return val - min;}); double max = current_spectrum.max(); current_spectrum /= max; spectra.col(it) = current_spectrum; } if (!i){ averages = mean(spectra, 1); all_data = spectra; } else{ averages = join_horiz(averages, mean(spectra, 1)); all_data = join_horiz(all_data, spectra); } mat current_results = Vespucci::Math::Quantification::QuantifyPeakMat(spectra, abscissa, left_bound, right_bound, 5, total_baselines, inflection_baselines); vec adj_peak_area = current_results.col(4); mat categorical = join_horiz(pH*ones(current_results.n_rows), trial*ones(current_results.n_rows)); categorical = join_horiz(categorical, spot*ones(categorical.n_rows)); current_results = join_horiz(categorical, current_results); cout << "peak finding step" << endl;
73
vec peak_found(current_results.n_rows); vec deriv_center(current_results.n_rows); vec deriv_max(current_results.n_rows); for (uword j = 0; j < spectra.n_cols; ++j){ vec filtered = Vespucci::Math::Smoothing::sgolayfilt(spectra.col(j), 5, 19, 2, 1); filtered.transform([](double val){return (-1.0*val);}); vec window=filtered.rows(64, 81); vec abs_window = abscissa.rows(64, 81); deriv_max(j) = window.max(); uvec center_pos = find(window == window.max()); deriv_center(j) = abs_window(center_pos(0)); peak_found(j) = (deriv_max(j) > 0.00568 ? 1 : 0); } mat peak_data = join_horiz(peak_found, deriv_center); peak_data = join_horiz(peak_data, deriv_max); current_results = join_horiz(current_results, peak_data); results(i) = current_results; ++i; QCustomPlot *plot = new QCustomPlot(0); QCPColorMap *map = new QCPColorMap(plot->xAxis, plot->yAxis); map->setTightBoundary(false); map->setGradient(QCPColorGradient::cbBuGn); QCPRange x_range(x.min(), x.max()); QCPRange y_range(y.min(), y.max()); uvec negatives = find(adj_peak_area < 0); adj_peak_area(negatives).zeros(); vec unique_x = unique(x); vec unique_y = unique(y); QCPColorMapData *map_data = new QCPColorMapData(unique_x.n_rows, unique_y.n_rows, x_range, y_range); for (uword k = 0; k <x.n_rows; ++k){ map_data->setData(x(k), y(k), adj_peak_area(k)); } map->setData(map_data); map->rescaleDataRange(true); map->setDataRange(data_range); map->rescaleAxes(true); plot->addPlottable(map); map->setInterpolate(false); plot->replot(); plot->repaint(); cout << "saving image" << endl; QString image_data_file_name = root_name + "_mapdata.csv"; QString image_file_name = root_name + ".tif"; mat spatial = join_horiz(x,y); mat mapmat = join_horiz(spatial, adj_peak_area); mapmat.save(image_data_file_name.toStdString(), csv_ascii); plot->saveRastered(image_file_name, 700, 650, 1, "TIF"); } mat results_matrix; for (uword i = 0; i < results.n_elem; ++i){ mat current_matrix = results(i); if (results_matrix.n_rows == 0) results_matrix = current_matrix; else
74
results_matrix = join_vert(results_matrix, current_matrix); } vec integrated_areas = results_matrix.col(7); QCustomPlot *plot2 = new QCustomPlot(0); QCPColorScale *scale = new QCPColorScale(plot); scale->setGradient(QCPColorGradient::cbBuGn); scale->setDataRange(data_range); plot2->plotLayout()->addElement(0, 1, scale); plot2->saveRastered("color_scale.tif", plot2->width(), plot2->height(), 1, "TIF"); uvec bad_indices = find(integrated_areas < 0); uvec good_indices = find(integrated_areas > 0); QStringList paths = input_dir.absolutePath().split("/"); QString folder_name = paths.last(); QString outfilename = input_dir.absolutePath() + "/" + folder_name + "_results.csv"; results_matrix.save(outfilename.toStdString(), csv_ascii); outfilename = input_dir.absolutePath() + "/" + folder_name + "_zeroed_results.csv"; mat zeroed_results_matrix = results_matrix; for (uword i = 0; i < bad_indices.n_rows; ++i) zeroed_results_matrix.submat(bad_indices(i), 3, bad_indices(i), results_matrix.n_cols-1).zeros(); zeroed_results_matrix.save(outfilename.toStdString(), csv_ascii); outfilename = input_dir.absolutePath() + "/" + folder_name + "_filtered_results.csv"; mat filtered_results_matrix = results_matrix.rows(good_indices); filtered_results_matrix.save(outfilename.toStdString(), csv_ascii); vec peak_found = results_matrix.col(11); good_indices = find(peak_found); outfilename = input_dir.absolutePath() + "/" + folder_name + "_detection_results.csv"; results_matrix.save(outfilename.toStdString(), csv_ascii); vec pH_values = unique(results_matrix.col(0)); mat report(pH_values.n_rows, 4); for (uword it = 0; it < pH_values.n_rows; ++it){ uvec ind = find(results_matrix.col(0) == pH_values(it)); QString pH_filename = input_dir.absolutePath() + "/" + folder_name + " pH " + QString::number(pH_values(it)) + ".csv"; mat pH_data = results_matrix.rows(ind); uvec valid = find(pH_data.col(11)); pH_data = pH_data.rows(valid); pH_data.save(pH_filename.toStdString(), csv_ascii); uword n_total = ind.n_rows; uvec found_ind = find(peak_found(ind)); uword n_found = found_ind.n_rows; report(it, 0) = pH_values(it); report(it, 1) = double(n_found); report(it, 2) = double(n_total); report(it, 3) = double(n_found) / double(n_total);

75
} outfilename = input_dir.absolutePath() + "/" + folder_name + "_detection_report.csv"; report.save(outfilename.toStdString(), csv_ascii); outfilename = input_dir.absolutePath() + "/" + folder_name + "_all_spectra.csv"; all_data.save(outfilename.toStdString(), csv_ascii); outfilename = input_dir.absolutePath() + "/" + folder_name + "_averages.csv"; averages.save(outfilename.toStdString(), csv_ascii); return 0; }
76
7 REFERENCES
(1) de Jong, S. Chemom. Intell. Lab. Syst. 1993, 14, 251–263.
(2) Nascimento, J. M. P.; Bioucas Dias, J. M. IEEE Trans. Geosci. Remote Sens. 2005,
43, 898–910.
(3) Du, P.; Kibbe, W. M.; Lin, S. M. Bioinformatics 2006, 22, 2059.
(4) Zhang, Z.-M.; Chen, S.; Liang, Y.-Z.; Liu, Z.-X.; Zhang, Q.-M.; Ding, L.-X.; Ye,
F.; Zhou, H. J. Raman Spectrosc. 2010, 41 (6), 659–669.
(5) Moskovits, M. In Surface-Enhanced Raman Scattering: Physics and Applications;
Kneipp, K., Kneipp, H., Moskovits, M., Eds.; Springer-Verlag: Berlin, 2006; pp 1–
17.
(6) Shah, P.; Ju, D.; Niu, X.; Sarangan M., A. J. Sensors 2013, 2013, 823041.
(7) Shah, P. J. Nanostructured columnar Thin Films Using Oblique Angle Deposition:
Growth, SERS Characterization and Lithographic Processing, University of
Dayton, 2012.
(8) Stahler, A. C.; Monahan, J. L.; Dagher, J. M.; Baker, J. D.; Markopoulous, M. M.;
Iragena, D. B.; NeJame, B. M.; Slaughter, R.; Felker, D.; Burggraf, L. W.; Isaac,
L. A. C.; Grossie, D.; Gagnon, Z. E.; Sizemore, I. E. P. Bone 2013, 53 (2), 421–
429.

77
(9) Foose, D. P.; Sizemore, I. E. P. J. Open Res. Softw. 2016, 4 (1).
(10) Wilson Center Nanotechnology Consumer Products Inventory
https://www.wilsoncenter.org/article/new-nanotechnology-consumer-products-
inventory (accessed Apr 1, 2016).
(11) Fabrega, J.; Fawcett, S. R.; Renshaw, J. C.; Lead, J. R. Environ. Sci. Technol.
2009, 43 (19), 7285–7290.
(12) Stevenson, L. M.; Dickson, H.; Klanjscek, T.; Keller, A. A.; McCauley, E.; Nisbet,
R. M. PLoS One 2013, 8 (9), e74456.
(13) Batley, G. E.; Kirby, J. K.; McLaughlin, M. J. Acc Chem Res 2013, 46 (3), 854–
862.
(14) Rick VandeVoort, A.; Tappero, R.; Arai, Y. Environ. Sci. Pollut. Res. 2014, 21
(13), 7828–7837.
(15) Gottschalk, F.; Nowack, B. J. Environ. Monit. 2011, 13 (5), 1145.
(16) Mueller, N.; Nowack, B. Environ. Sci. Technol. 2008, 42 (12), 44447–44453.
(17) Manahan, S. E. Environmental Chemistry, ninth.; Taylor and Francis Group: Boca
Raton, 2010.
78
(18) Tolaymat, T. M.; Badawy, A. M.; Genaidy, A.; Scheckel, K. G.; Luxton, T. P.;
Suidan, M. Sci. Total Environ. 2010, 408, 999–1006.
(19) El Badawy, A. M.; Luxton, T. P.; Silva, R. G.; Scheckel, K. G.; Suidan, M. T.;
Tolaymat, T. M. Environ. Sci. Technol. 2010, 44 (4), 1260–1266.
(20) Dorney, K. A CHEMICAL FREE APPROACH FOR INCREASING THE
BIOCHEMICAL SURFACE-ENHANCED RAMAN SPECTROSCOPY (SERS)-
BASED SENSING CAPABILITIES OF COLLOIDAL SILVER
NANOPARTICLES, 2013, Vol. 53.
(21) Sverjensky, D. A. Geochim. Cosmochim. Acta, 1994, 58 (14), 3123–3129.
(22) Xu, J.-A.; Huang, E.; Lin, J.-F.; Xu, Y. L. Am. Miner. 1995, 80 (11–12), 1157–
1165.
(23) Porto, S. P. S. J. Chem. Phys 1967, 47 (3), 1009.
(24) Zhu, W.; Pezzotti, G. J. Raman Spectrosc. 2011, 42 (11), 2015–2025.
(25) Zabinski, J. S.; McDevitt, N. T. No Title; Dayton, 1996.
(26) Pezzotti, G.; Zhu, W. Phys. Chem. Chem. Phys. 2015, 17, 2608–2627.
(27) Brewer, C. A. ColorBrewer http://colorbrewer2.org.
79
(28) World Health Organization. Dengue and severe dengue
http://www.who.int/mediacentre/factsheets/fs117/en/ (accessed Nov 1, 2014).
(29) Khormi, H. M.; Kumar, L. Geospat. Health 2014, 8 (2), 405–415.
(30) Galdiero, S.; Falanga, A.; Vitiello, M.; Cantisani, M.; Marra, V.; Galdiero, M.
Molecules 2011, 16, 8894–8918.
(31) Khandelwal, N.; Kaur, G.; Kumar, N.; Tiwari, A. Dig. J. Nanomater. Biostructures
2014, 9 (1), 175–186.
(32) Williams, K. J. Silver Nanoparticles Inhibit the Binding and Replication of Dengue
Virus, Wright State University, 2015.
(33) Morens, D. M.; Fauci, A. S. PLoS Pathog. 2013, 9 (7), 7–9.
(34) Baram-Pinto, D.; Shukla, S.; Gedanken, A.; Sarid, R. Small 2010, 6 (9), 1044–
1050.
(35) Orlowski, P.; Tomaszewska, E.; Gniadek, M.; Baska, P.; Nowakowska, J.;
Sokolowska, J.; Nowak, Z.; Donten, M.; Celichowski, G.; Grobelny, J.;
Krzyzowska, M. PLoS One 2014, 9 (8), 1–15.
(36) Lara, H. H.; Ayala-Nuñez, N. V; Ixtepan-Turrent, L.; Rodriguez-Padilla, C. J.
Nanobiotechnology 2010, 8 (1), 1.
80
(37) Mori, Y.; Ono, T.; Miyahira, Y.; Nguyen, V. Q.; Matsui, T.; Ishihara, M.
Nanoscale Res. Lett. 2013, 8 (1), 93.
(38) Modis, Y.; Ogata, S.; Clements, D.; Harrison, S. C. Nature 2004, 427 (6972), 313–
319.
(39) Van Der Schaar, H. M.; Rust, M. J.; Chen; Van Der Ende-Metselaar, H.; Wilschut,
J.; Zhuang, X.; Smit, J. M. PLoS Pathog. 2008, 4 (12).
(40) Kneipp, K.; Kneipp, H.; Kartha, V. B.; Manoharan, R.; Deinum, G.; Itzkan, I.;
Dasari, R. R.; Feld, M. S. Phys. Rev. E 1998, 57 (6), R6281.
(41) Nie, S. Science (80-. ). 1997, 275 (February), 1102–1106.
(42) Kneipp, K.; Wang, Y.; Kneipp, H.; Perelman T., L.; Itzkan, I.; Dasari R., R.; Feld
S., M. Phys. Rev. Lett. 1997, 78, 1667 EP – 1670.
(43) Hibbitts, S.; White, P. L.; Green, J.; McNay, G.; Graham, D.; Stevenson, R. Anal.
Methods 2014, 6 (5), 1288–1290.
(44) Abramczyk, H.; Brozek-pluska, B. 2012.
(45) Rehman, A.; Anwar, S.; Firdous, S.; Ahmed, M.; Rasheed, R.; Nawaz, M.; Rashid,
R.; Mahmood, A. Laser Phys. 2012, 22 (6), 1085–1089.
81
(46) Saleem, M.; Bilal, M.; Anwar, S.; Rehman, a.; Ahmed, M. Laser Phys. Lett. 2013,
10 (3), 35602.
(47) Huh, Y. S.; Chung, A. J.; Cordovez, B.; Erickson, D. Lab Chip 2009, 9 (3), 433–
439.
(48) Krafft, C.; Neudert, L.; Simat, T.; Salzer, R. Spectrochim. Acta - Part A Mol.
Biomol. Spectrosc. 2005, 61 (7), 1529–1535.
(49) Movasaghi, Z.; Rehman, S.; Rehman, I. ur. Appl. Spectrosc. Rev. 2007, 42 (1),
493–541.
(50) De Gelder, J.; De Gussem, K.; Vandenabeele, P.; Moens, L. J. Raman Spectrosc.
2007, 38, 1138–1147.
(51) Bansil, R.; Yannas, I. V.; Stanley, H. E. BBA - Gen. Subj. 1978, 541 (4), 535–542.
(52) Martina, I.; Wiesinger, R.; Schreiner, M. e-Preservation Sci. 2012, 9, 1–8.
(53) Waterhouse, G. I. N.; Bowmaker, G. a.; Metson, J. B. Phys. Chem. Chem. Phys.
2001, 3 (17), 3838–3845.
(54) Radzol, A. R. M.; Lee, K. Y.; Mansor, W. 2014 36th Annu. Int. Conf. IEEE Eng.
Med. Biol. Soc. EMBC 2014 2014, 1835–1838.

82

83
8 CURRICULUM VITAE
Daniel P. Foose
Address: 556 Corona Ave Apt C, Dayton, OH 45419, United States of America
Phone (accepts SMS): +1.937.422.7509
Email: [email protected] [email protected]
Web: https://github.com/dpfoose
http://about.me/dpfoose
https://www.linkedin.com/in/dpfoose
Education
Bachelor of Science, Chemistry, Wright State University Dec 2013
Minor, Mathematics
Master of Science, Chemistry, Wright State University Aug 2016
Publications
Daniel. P. Foose and Ioana. E. Sizemore. Vespucci: A Free, Cross-Platform Tool for Spectroscopic Data Analysis and Imaging. Journal of Open Research Software 2016 4(1). DOI: http://doi.org/10.5334/jors.91.
Seth W. Brittle, Sesha L. A. Paluri, Daniel P. Foose, Matthew T. Ruis, Matthew T. Amato, Nhi H. Lam, Bryan Buttigieg, Zofia E. Gagnon and Ioana E. Sizemore. Freshwater crayfish: a potential benthic-zone indicator of nanosilver and ionic silver pollution. Environmental Science and Technology. Under review. Manuscript ID: es-2016-00511m.
Open Source Software Contributions
Vespucci (https://github.com/VespucciProject/Vespucci)
84
Windows builds of mlpack (https://github.com/VespucciProject/MLPACK_for_MSVC)
Presentations
19 September 2014. “Structure and Analysis of Viral Envelope Proteins”, Seminar, Department of Chemistry, Wright State University. Dayton, OH.
15 November 2014, “Vespucci: A novel software tool for hyperspectral data analysis and imaging”, Poster Presentation, Cleveland State University Interdisciplinary Research Conference, Cleveland State University. Cleveland, OH.
24 March 2015, “Vespucci: A novel softeare tool for hyperspectral data analysis and imaging”, Poster Presentation, 249th American Chemical Society National Meeting. Denver, CO.
10 April 2015, “Vespucci: A software tool for the analysis of spectroscopic datasets”, Oral Presentation, 2015 Wright State University Celebration of Research. Dayton, OH.
20 May 2016, “Surface-enhanced Raman spectroscopy study of the interaction between colloidal silver nanoparticles and Dengue virus virions: Unsupervized automated peak detection and quantification using a newly released spectroscopic imaging software”, Oral Presentation, 47th American Chemical Society Central Regional Meeting. Covington, KY.
Skills—Chemical
Bottom-up nanomaterial synthesis, preparation of samples for elemental analysis (atomic absorption spectroscopy and inductively-coupled plasma optical emission spectroscopy), atomic absorption spectroscopy, inductively-coupled plasma optical emission spectroscopy, ultraviolet-visible spectroscopy, chemometric data analysis.
Skills—Computational
Object-oriented design in C++. C/C++, Python, R and MATLAB programming. GCC, Clang and MSVC compilers. Unix terminal scripting (bash), GUI design in Qt. Microsoft Office, Adobe Creative Cloud, LaTeX.
Relevant Coursework
Life Sciences
85
Introduction to Biology (2 sem.)
Biochemistry I (1 sem.)
Physical Sciences
Physics for Scientists and Engineers (2 sem.)
General Chemistry (2 sem.)
Organic Chemistry (2 sem.)
Physical Chemistry (2 sem.)
Undergraduate Inorganic Chemistry (1 sem.)
Instrumental Analysis (1 sem.)
Quantitative Analysis (1 sem.)
Nanoscience and Nanotechnology (2 sem.)
Chemical Literature (1 sem.)
Applied Chemical Spectroscopy (1 sem.)
Quantum Chemistry (1 sem.)
Advanced Inorganic Chemistry (1 sem.)
Physical Polymer Chemistry (1 sem.)
Electroanalytical Chemistry (1 sem.)
Computer Science
Discrete Mathematics (1 sem.)
C Programming for Scientists and Engineers (1 sem.)
Mathematics and Statistics
Calculus (2 sem.)
86
Differential Equations with Matrix Algebra (1 sem.)
Discrete Mathematics (1 sem.)
Linear Algebra (1 sem.)
Applied Statistics (2 sem.)