Embed Size (px)
Citation preview

1
Policy and Institutional Reforms to Improve Horticulture Markets in Pakistan (ADP/2014/043)
WORKING PAPER 07/18
Vertical Integration and Cross-Country Price Transmission in Pakistan’s Agriculture Market.
Hayat Khan*
Assistant Professor College of Business, Alfaisal University, Riyadh, Saudi Arabia
Sisira JayasuriyaDirector
Centre of Development Economics and Sustainability, Monash [email protected]
Abstract This paper reports on a component of studies on marketing efficiency and commodity market modelling of the horticulture sector in Pakistan. It presents preliminary results of an analysis of price transmission across spatially dispersed markets between monthly wholesale and retail prices of a variety of food crops in Pakistan, including tomato, onions, other fruits and vegetables, as well as rice, wheat, pulses and milk. It uses a novel methodology that takes into account the complex interactions between agricultural consumer goods. The approach mainly relies on variance-covariance structure of prices and use latent factors. The analysis (i) separates vertical price movements from fluctuations caused by country-wide shocks which affects all commodities with variable impact on individual commodities; (ii) quantifies the impact of price fluctuations in selected commodities in India on retail prices in Pakistan, and (iii) investigates if there are asymmetric responses to increases and decreases of prices. We also use data from India to assess the degree to which price shocks are transmitted across the two countries – a politically sensitive issue in both countries, particularly in the case of crops such as onions and potatoes. While these initial results must be treated primarily as illustrative, given the preliminary nature of the analysis, it is interesting to note that vertical transmission of shocks is important only in some markets but not in others, price transmission is asymmetric to positive versus negative shocks in many instances, and that there appears to be significant spatial price transmission in potato prices between India and Pakistan, though not in onions or tomatoes.
Keywords Horticulture, Price Transmission, Vertical Integration, Pakistan
© 2018 Hayat Khan and Sisira Jayasuriya This paper is intended for the early dissemination of research outputs in order to elicit comments and discussion only. No part of this paper may be reproduced in any form, or stored in a retrieval system, without the prior written permission of the authors. *Corresponding author

2
1. Introduction
According to the 2016-17 Economic Survey of Pakistan, agriculture accounts for around a fifth
of the country’s GDP and employs over 40% of the country’s labour force. Among agricultural
products, the demand for high-value perishable horticulture and dairy products such as fruits,
vegetables, dairy and meat is expected to increase particularly rapidly in response to population
growth, rising incomes and ongoing urbanisation. Horticulture industries face both huge
opportunities and new competitive threats from the development of the China Pakistan
Economic Corridor (CPEC). On the one hand, CPEC is expected to open a huge demand
window, which will provide the local industry profitable opportunities as China has one of
world’s fastest growing market for horticulture commodities. On the other hand, it poses a
challenge in terms of opening a competition window with relatively more productive and cost-
efficient competitors (China in particular).1 This presents a multi-dimensional policy challenge
to the government to identify and address weaknesses of the sector and create opportunities for
the local sector to grow and compete without any market intervention. Whereas the immediate
focus of the government seems to be on improving productivity, quality and building supply
chain infrastructure marketing chain and efficiency of price transmission is critical to the
successful transition of the horticulture sector to achieve its full potential.
The country’s agriculture sector is currently operating below potential due to low productivity,
inferior quality, high wastage, and low exports. The marketing system is widely considered to
be one of the main factors constraining the industry’s modernisation and development.
According to Serra and Goodwin (2003) and Acosta and Valdes (2014), price is the instrument
by which different levels of markets are integrated. In a perfect world with no market
imperfections, market transfers information to the farm-gate level through the transmission of
changes in prices. This facilitates efficient production and consumption decisions, as well as,
rewards improvements in quality when markets are integrated and quality-premia are
transferred down the marketing chain to the producer.
According to a USAID (2012) report, Pakistan’s agriculture sector has a number of
weaknesses, which creates market, as well as, marketing system inefficiencies. These include
(i) exclusive public sector control of wholesale markets’ operation and management, (ii) lack
of accountability of the market committee, which is created through a political process to
oversee the market, (iii) monopoly of the market committee over marketing of agriculture
produce through a licensing system, and (vi) lack of provision for alternative marketing
1 See Huang and Cui (2018) and Ali, Huang and Xie (2018)
3
channels such as farmers markets, consumer markets, direct marketing which limits scope for
the development of value chain systems. These inefficiencies are agued to limit the range of
opportunities available to market participants with (v) absence of appropriate standards
(hygiene, grading, optimal space utilization, food safety and labelling), (vi) ability of the
limited number of dealers to distort price related information, and (vii) giving the dealers the
power to manipulate the system to make farmers reliant on them for their financing needs which
expose them to permanent exploitation. Moreover, the system allows the marketing committee
to receive a fee without providing commensurate services. The USAID report also adds that
these inefficiencies result in unjustified levels of profit margins expropriated from the growers
as well as paid by consumers. The median wholesale mark-up, including commissions, is
estimated to be more than 18 per cent of the value of the produce. The inefficiencies in the
marketing system are further passed on to consumers resulting in prices being inflated from 30
per cent to 50 per cent (USAID (2012). Pakistan’s agriculture sector, horticulture in particular,
is dominated by smallholders with strong participation of women who remain trapped in
inefficient marketing systems. The marketing system does not incentivise producers to produce
what is in demand in the market or to transmit quality-price premia to upstream producers
(USAID 2012).
This paper is part of a project, funded by the Australian Centre for International Agricultural
Research (ACIAR), which is in the process of assessing existing marketing arrangements to
identify main problems in the marketing chain to formulate appropriate marketing policy
reforms. Whereas the marketing system has a number of nodes with multiple players, there is
a paucity of data that can be used to quantify how efficient the overall price system is. Some
recent research by USAID projects, such as the one referred to above, indicates that the price
system is inefficient and market players in the middle of the marketing chain either distort the
price information or use their monopoly power to create information asymmetry and, or use
their status to stop trickling down of favourable price movements to the farm-gate level. This
paper focuses on the down stream components of the market. The main objective of this paper
is to quantify the degree of vertical price transmission between the retail and wholesale markets
across the marketing chain for high-value perishable horticulture and dairy products. We do so
by modelling interaction between different commodities in the agriculture market. We also
quantify spatial price transmission between India and Pakistan in the retail market for selected
commodities.

4
It is important to understand whether changes in prices are driven by demand or supply from a
policy perspective. 2 In integrated markets prices converge over time; the value of price
differentials and the rate at which prices converge are both important issues. Such integration
takes place via arbitrage and related trade. Once these mechanisms operate to produce price
convergence, prices of homogenous goods across markets will differ only by transport cost.
There is a large literature on market integration of agricultural commodities, including those in
developing countries, particularly following Ravalllion’s (1986) paper on market integration.3
Most previous studies of market integration use co-integration analysis and Granger-causality.
This type of analysis requires a long and reliable time series data, which is a scarce resource in
developing and under developed countries. Moreover, most previous studies either focus on
aggregate outcomes or study individual markets in isolation.4 Previous analyses of spatial
market integration of rice, onions and mango in Pakistan have found that markets are integrated
in the long run.
Building on Dungey’s (2000) work on exchange rate fluctuations, this paper uses a novel
approach to study interactions between WPI and CPI of selected agriculture commodities
taking into account complex interactions between a variety of agriculture commodities. The
approach mainly relies on variance-covariance structure of prices and use latent factors to (i)
separate vertical price movements from fluctuations caused by country-wide shocks which
affects all commodities with variable impact on individual commodities; and (ii) quantify the
impact of price fluctuations in selected commodities in India on retail prices in Pakistan.
Moreover, (iii) the paper also look for asymmetry in the transmission of shocks to assess if
there are any differences in the degree of vertical and spatial price transmission when prices
increase or decrease. Our approach differs significantly from previous studies in that the
methodology permits a richer set of interactions between both spatially and vertically linked
markets for the same commodity as well as interactions between different agricultural
2 Note that if consumer prices are determined by supply coming into the wholesale markets with little or no feed back from consumer prices to upstream supply, then wholesale prices (WPI) will Granger cause consumer prices (CPI), in contrast to the conclusion of Shabaz et. al. (2012) that CPI Granger causes WPI, implying that the prices changes are demand driven. 3 See, for example, Abdulai (2000), Baquedano and Liefert (2014), Barrett and Li (2002), Goodwin and Pigott (2001), Sekhar 92012), Silvapulle and Jayasuriya (1994). There is also some literature on Pakistan (e,g. Ahmed and Gjølberg (2015); Lohano and Mari, 2006; Mukhtar and Javed, 2008; Ghaffor, et. al. ,2009), which found that domestic markets are spatially integrated in the long run, though there are issues about the pattern and speed of price adjustments.
. 4 We will elaborate further in future versions of the paper on the reasons for choosing this approach,while recognizing that our approach can be treated as complementary to some others.

5
commodity markets, while empirically taking into consideration interactions with the Indian
market.
We model the country-wide shocks so as to permit either have a fixed impact or a variable
impact on individual markets. In the time-series analysis jargon, this is equivalent to having a
non-stationary series to have a constant and a trend respectively. The “trend” in our model is
richer in the sense that we assume the trend to be a latent shock rather than a time-variable
which admits a complex set of movements which may cause changes in vertical and spatial
prices. More importantly, time series analysis looks for the constant and trend in data
generating process of a series which requires a reasonably long time series whereas we identify
these aspects using movements in prices with reference to the market as a whole, which does
not necessarily need a longer time series. The estimation technique extracts this information
from the interaction of commodities in the market.
The rest of the paper is organized as follows. Section 2 provides an overview of the latent factor
model. Section 3 explains how the model is used to quantify the degree of vertical and spatial
market integration. Section 4 outlines the estimation technique, followed by section 5, which
provides a stylized simple example to simplify the exposition of the somewhat complex model.
Section 6 provides details of the actual model estimated and presents some detailed results.
2. The Model
Let 𝑤𝑤𝑤𝑤𝑤𝑤𝑖𝑖,𝑡𝑡 be the period to period change in wholesale producer prices of a commodity (or a
group of commodities) i at time t and 𝑐𝑐𝑤𝑤𝑤𝑤𝑗𝑗𝑖𝑖,𝑡𝑡 be the corresponding changes in consumer prices
of commodity j in the group with n commodities. Similarly, 𝑐𝑐𝑤𝑤𝑤𝑤𝑖𝑖𝑗𝑗,𝑡𝑡,𝐼𝐼𝐼𝐼𝐼𝐼 is the change in CPI of
commodity j, belonging to WPI in group i, in India. We model prices as follows.
, 0, , , , , , , ,
n
i t tWOR P t P i P t P w ij j t i W i tj
wpi F F T Vθ α α β ω ε= + + + +∑ (1)
, 0, , , , , , , , ,ij t tWOR P t P ij P t P ij j t ij P ij t ij C ij tcpi F F T V Sθ α α β γ ω ε= + + + + + (2)
, , 0, , , , , , , , ,ij t IND tWOR IND t IND ij IND t IND ij IND ij t ij IND C j tcpi F F T Sθ α α γ ω ε= + + + + (3)
Equations (1) to (3) postulates that fluctuations in prices are caused by time varying
i. Ft,WOR : world common shocks which has a fixed impact on world’s prices (Pakistan
and India in this case) as evident from the fixed loading θ.

6
ii. Ft,p/Ft,IND: domestic shocks (Pakistan and India respectively) which has a fixed
impact on domestic prices. This impact may differ across the two countries as the
corresponding loadings differ across the two countries.
iii. Tt,P/Tt,IND: shocks in Pakistan/India, independent of each other, which has a variable
effect on different commodities. The corresponding loadings change across
commodities within each country.
iv. Vj,t: shocks in CPI which are transmitted to CPI and vice versa referred to as vertical shocks,
v. Sj,t: shocks in the Indian CPI which are transmitted to Pakistani CPI and vice versa referred
to as spatial shocks, and
vi. ε : shocks caused by idiosyncratic factors, factors specific to a market for a specific
commodity.
Ft,WOR, Ft,p, Ft,IND, T,t,P, Vj, Sj,IND and ε s are independent latent factors distributed with constant
means and finite variance and αs and βs, γs and ωs are the corresponding loading parameters.
Given the loading parameters, we can normalize these distributions to have 0 mean and unit
variance, without loss of generality.
It is important to note that common variation does not mean one variable is causing the other.
It may also mean that a common variable causes (drives) both variables to change in the same
manner. The common factors with fixed and variable loadings are meant to identify such
factors. In time-series analysis, this is equivalent to checking for stationarity with a constant
and a trend respectively. The first two terms on the right hand side of equations 1, 2 and 3
represent the constants and the third term represents the trend. As should be obvious, the
“trend” in our model is richer in the sense that we assume the trend to be a latent shock rather
than a time-variable which admits a complex set of movements which may cause co-
movements in the vertical prices. This could be the result of monetary policy, a simple time
trend or changing macroeconomic conditions.
The loadings on Vj,t give us our measure of vertical price integration. We later show that it is
not possible to estimate βi,j and βw,i,j at the same time. When βi,j =1, a product of the two
coefficients measures the response of WPI to a vertical shock in CPI and vice versa when βw,i,j
=1. The product is therefore our measure of the degree of vertical integration. Similarly, the
loading on Sj,t are used to quantify cross-country spatial integration in the retail market in the
same way βs give us vertical price integration at the domestic level.
Finally, the last set of terms. capturing the effect of idiosyncratic shocks, are essentially the
residual fluctuations in prices which are not explained by other factors explicitly modelled here

7
(Common factors with fixed and variable impact, vertical shocks and cross-country spatial
shocks in our case).
3. Measuring Market Integration
The factors on the right hand side of equations 1 to 3 are latent factors which are not observable.
We therefore cannot estimate the model using standard regression analysis. We can however
estimate the loadings with the help of moment conditions. Our objective is to calculate the
contribution of each factor to price volatility. Given that the latent factors are independent of
each other with zero mean and unit variance, it is straight forward to show that the variance,
var(.), of each equation is equal to
( ) 2 2 2 2 2, 0, , ,var
n
i t P i p w ij ij
wpi θ α α β ω= + + + +∑ (4)
( ) 2 2 2 2 2 2, 0, , , , ,var ij t P ij P ij ij j P i jcpi θ α α β γ ω= + + + + + (5)
( ) 2 2 2 2 2, , 0, , , ,var ij t IND IND ij IND ij IND ij INDcpi θ α α γ ω= + + + + (6)
We can rewrite the above as follows,
( ) ( ) ( ) ( ) ( )2 22 22, ,0,
, , , , ,
1var var var var var
ni p w ijP i
ji t i t i t i t i twpi wpi wpi wpi wpiα βα ωθ
= + + + +∑ (7)
The first term on the right side of equation 7 quantifies uniform or fixed contribution of the
world shock to total price volatility whereas the second term quantifies the contribution of
common domestic factor with fixed effect. The third term quantifies the contribution of
domestic common factors with variable impact on WPI of a commodity. The last factor
quantifies the contribution of residual idiosyncratic factors to price volatility. The second last
term quantifies volatility in WPI of group i to due to changes in CPI of commodity j in the
same group, which measures the intensity of vertical price integration. i.e.
Contribution of CPI shocks to WPI volatility = ( )
2,
,
100var
w ij
i twpiβ
(8)
Similarly, using equations 5 and 6, we can show that
( ) ( ) ( ) ( ) ( ) ( )2 2 2 222, , , ,0,
, , , , , ,
1var var var var var var
ij P ij ij j P i jP
ij t ij t ij t ij t ij t ij tcpi cpi cpi cpi cpi cpiα β γ ωαθ
= + + + + + (9)
8
( ) ( ) ( ) ( ) ( )2 2 222, , ,0,
, , , , , , , , , ,
1var var var var var
ij IND ij IND ij INDIND
ij t IND ij t IND ij t IND ij t IND ij t INDcpi cpi cpi cpi cpiα γ ωαθ
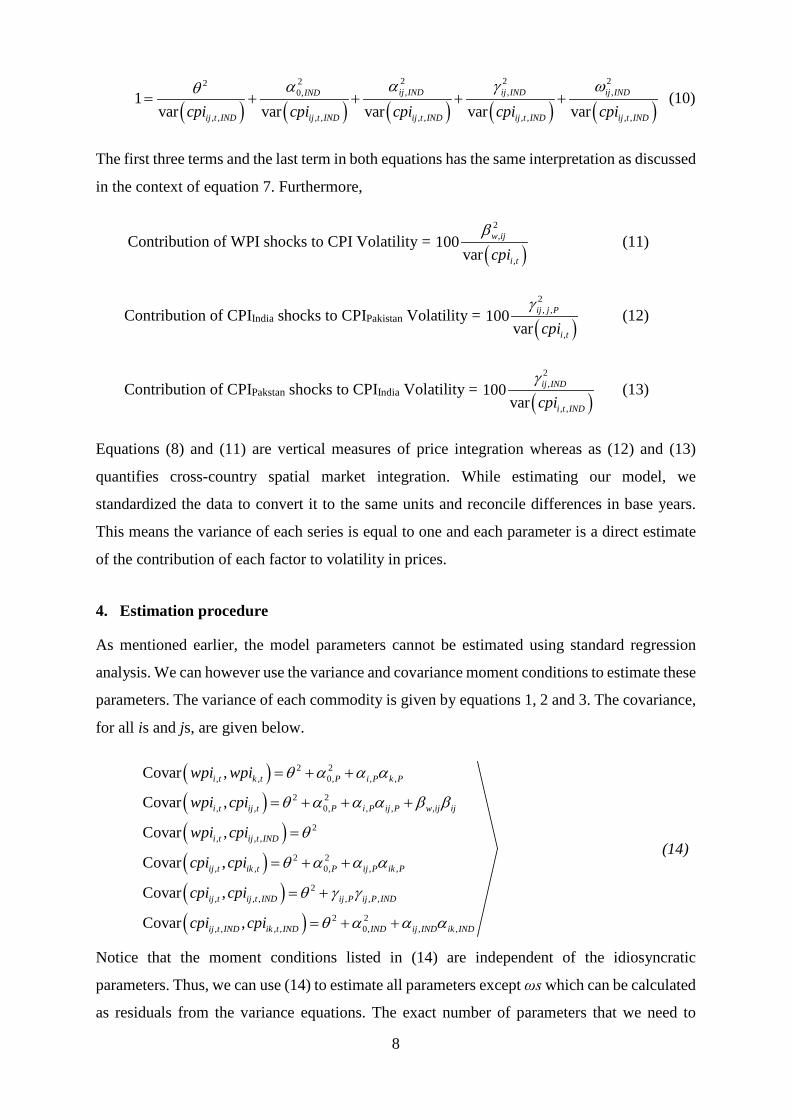
= + + + + (10)
The first three terms and the last term in both equations has the same interpretation as discussed
in the context of equation 7. Furthermore,
Contribution of WPI shocks to CPI Volatility = ( )
2,
,
100var
w ij
i tcpiβ
(11)
Contribution of CPIIndia shocks to CPIPakistan Volatility = ( )2, ,
,
100var
ij j P
i tcpiγ
(12)
Contribution of CPIPakstan shocks to CPIIndia Volatility = ( )
2,
, ,
100var
ij IND
i t INDcpiγ
(13)
Equations (8) and (11) are vertical measures of price integration whereas as (12) and (13)
quantifies cross-country spatial market integration. While estimating our model, we
standardized the data to convert it to the same units and reconcile differences in base years.
This means the variance of each series is equal to one and each parameter is a direct estimate
of the contribution of each factor to volatility in prices.
4. Estimation procedure
As mentioned earlier, the model parameters cannot be estimated using standard regression
analysis. We can however use the variance and covariance moment conditions to estimate these
parameters. The variance of each commodity is given by equations 1, 2 and 3. The covariance,
for all is and js, are given below.
( )( )( )( )( )
2 2, , 0, , ,
2 2, , 0, , , ,
2, , ,
2 2, , 0, , ,
2, , , , , ,
Covar ,
Covar ,
Covar ,
Covar ,
Covar ,
Covar
i t k t P i P k P
i t ij t P i P ij P w ij ij
i t ij t IND
ij t ik t P ij P ik P
ij t ij t IND ij P ij P IND
i
wpi wpi
wpi cpi
wpi cpi
cpi cpi
cpi cpi
cpi
θ α α α
θ α α α β β
θ
θ α α α
θ γ γ
= + +
= + + +
=
= + +
= +
( ) 2 2, , , , 0, , ,,j t IND ik t IND IND ij IND ik INDcpi θ α α α= + +
(14)
Notice that the moment conditions listed in (14) are independent of the idiosyncratic
parameters. Thus, we can use (14) to estimate all parameters except ωs which can be calculated
as residuals from the variance equations. The exact number of parameters that we need to
9
estimate depends upon the number of commodities in the wholesale market, the number of
commodities that underlie the WPI and the number of CPI goods from India included the
model. The estimation requires that the number of moment conditions must be greater than or
equal to the number of parameters that we need to estimate5. It is however not possible to
estimate βi,j and βw,i,j separately at the same time. The is because these parameters appear only
in one moment condition for each combination. The system of equations is therefore locally
under-identified. We can however get an estimate of the product of the two parameters which
appears in Covar (wpii,t, cpiij,t) for all i and j. The product can however be interpreted as the
degree of vertical market integration which is more than enough for our purpose.
As 1|wii wi iββ β β= = the product can be interpreted as the response CPI to a 100% shock in WPI.
This is equivalent to regressing CPI on WPI as a 100% shock means that all fluctuations in the
commodity prices are due to change in the wholesale market. This however does not mean that
the common and idiosyncratic factors do not exist and the market is operating in isolation. This
simply means that the common and idiosyncratic shocks cancel each other out for this
commodity. The market however still interacts with the rest of the commodities. Similarly,
1|ii wi wiββ β β= = means that the product can also be interpreted as the response of the wholesale
prices to a full-fledged shock in the retail market. The product, in general therefore give us an
estimate of the degree of market integration.
Similarly, we can only get estimates of γij,P and γij,IND and the individual γs cannot be recovered
from the estimation for the same reasons as above. Again, the product however gives us the
degree of spatial market integration in the retail market across Pakistan and India which serves
our purpose.
5. Estimation of the Model
In the model that is estimated here, we consider fluctuations in prices of the following retail
and wholesale commodities comprising of 9 WPI and 14 CPI goods from the Pakistan
agriculture market and 4 CPI goods from India. These commodities and groups are summarized
in Table 1.
5 In general, with n commodities in the model, we have n(n-1)/2 covariance based moment conditions and we can estimate a maximum of n(n-1)/2 parameters. However, the number of moment conditions increases faster than the number of parameters as we add more commodities.

10
We use the variance-covariance moments of our selected variables to estimate the model. The
parameters reported in Table 1 can be estimated either using GMM, Indirect Least Squares or
Non-linear Least Squares estimation techniques. We use Stata’s nonlinear least squared
function evaluator program. The program solves a system of nonlinear equations by
minimizing nonlinear least squares. It is important to note that we add CPIMilk in our estimation
twice, which means that we have a total of 28 commodities which give us a total of 28*(28-
1)/2=378 covariance moments to estimate a total of 50 parameters. This includes two αVM,IND
and two gMM,P. An advantage of Stata’s function evaluator procedure is that that perfect multi-
collinearity does not create a problem. Proper convergence of the Stata iterations must return
exactly the same value for the repeated parameters which is true in our case. This is an
important accuracy check in our case as there are many moment conditions and parameters and
it is hard to keep track of redundant relationships or detect cases of local under identification
as pointed out earlier. In our case, for example, if instead of asking the moment evaluator
program to estimate product of the market integration parameters, we ask Stata to give us
individual values of the parameters; Stata will have convergence issues and the repeater
parameters will never be the same, at least when we change the starting values.

11
Table 1: List of commodities and factor loadings in the estimated model. Type of shocks and associated
parameters Variables Common Vertical Spatial World Common shocks with fixed effect θ
Pakistan
Domestic common shocks with fixed effect
α0,P
Vegetables (V)
WPIV αV,P * ** CPITomato αVT,P βV,VT γVT,P CPIPotato αVP,P βV,VP γVP,P CPIOnion αVO,P βV,VO γVO,P CPIFresh Vegetable αV,FV,P βV,VFV
Fresh Fruits (F) WPIF αF,P * CPIF αFF,P βF,FF
Dry Fruits (D) WPID αD,P * CPID αDD,P βD,DD
Chicken (C) WPIC αC,P * CPIC αCC,P βC,CC
Milk (M) WPIM αM,P * ** CPIM αMM,P βM,MM γMM,P
Eggs (E) WPIE αE,P * CPIE αEE,P βE,EE
Wheat (W) WPIW αW,P * CPIW αWW,P βW,WW
Rice (C) WPIRice αR,P * CPIRice αRR,P βF,FF
Pulses (P)
WPIP αP,P * CPIMasoor αP,MA,P βP,PM CPIMoong αP,MO,P βP,P,MO CPIGram αPG,P βP,PG
India
Domestic common shocks with fixed effect
α0,IND
Indian retail market
CPITomato αVT,IND CPIPotato αVP,IND CPIOnion αVO,IND CPIMilk αVM,IND
* In our estimation we report the vertical integration against CPI commodities only for convenience as if WPI is causing changes in CPI. The opposite is however true as well as discussed in the text. ** Similarly, we report spatial integration parameters against Pakistani CPIs as if shocks in Indian CPI causes shocks in Pakistani CPIs. The opposite is also true.

12
6. Data, Results and Discussion
6.1. Data
The data for used in this research is compiled from the Pakistan Bureau of Statistics (PBS) monthly reports from December 2013 to October 2018. Both CPI and WPI data are collected on monthly basis. The CPI data used in this paper is collected by PBS on the 11-14th of each month and the WPI data is collected from the 12th to 15th of each month. The data on India’s CPI is extracted from the Indian Department of Consumers Affairs.
6.2.Vertical integration
Table 2 reports results of our base case model reported in table 1. Table 3 translates estimated
values of the coefficients in Table 2 to the contribution of each factor to total fluctuations in
the price of each commodity. For example, θ=0.181 (significant at 1% level of significance),
which captures the fixed effect of world common shocks on prices in Pakistan and India.
Common world shocks are therefore responsible for 3.3% (=0.1812) of fluctuations in all prices
in Pakistan and India. Similarly, α0,IND=0.453, significant at 1%, implies that around 21% of
the variations in all prices in India are caused by common factors with a uniform impact on all
prices. Such factors however play no role in Pakistan. In a sense, these parameter captures
arbitrage opportunities signifying easy access to alternative markets. It is not surprising to see
that this is playing an important role in India and no role in Pakistan as our sample picks a
somewhat homogeneous markets (vegetable retail market in particular) which might be served
by players who may have the privilege of having trade opportunities in alternative
commodities. The selected sample for Pakistan, on the other hand, includes a variety of
commodities from both the wholesale and retail markets which reduces the probability of
having common shocks as arbitrage opportunities are limited.
Results of the “trend” factors, common factors with variable impacts on each commodity,
suggest that these factors tend to play an important role in the wholesale and retail market for
wheat; somewhat important role in the market for fresh fruits; and a reasonable role in the
market for eggs. There is evidence of some heterogeneity in the market for Milk as the
wholesale market is unaffected by these factors whereas around 1/4rth of the fluctuations in
the retail market prices of milk are caused by factors common to the agriculture sector of
Pakistan. These factors seem to be important in India as well, however it is hard to tell if there
is any heterogeneity in terms of the contribution of these factors to the prices of Milk in the
retail market relative to the wholesale market as we do not include wholesale prices for India.

13
Table 2: Estimation results for the base case model. Variables
Type of shocks Common Vertical Spatial
World World common shocks with fixed effect 0.181***
Pakistan
Domestic common shocks with fixed effect
0.000
Vegetables (V)
WPIV -0.086 CPITomato -0.270*** 0.543*** 0.037 CPIPotato 0.024 0.326* 0.746*** CPIOnion -0.321*** 0.527*** 0.205 CPIFresh Vegetable -0.039 0.848***
Fresh Fruits (F) WPIF 0.533*** CPIF 0.619*** 0.467**
Dry Fruits (D) WPID 0.225** CPID 0.170* 0.178
Chicken (C) WPIC 0.178* CPIC 0.312*** 0.779***
Milk (M) WPIM 0.109 CPIM 0.487*** 0.397** 0.323
Eggs (E) WPIE -0.402*** CPIE -0.476*** 0.760***
Wheat (W) WPIW -0.762*** CPIW -0.782*** 0.316
Rice Rice 0.076 Rice -0.088 0.810***
Pulses (P)
WPIP 0.261** CPIMasoor 0.229** 0.661*** CPIMoong 0.494*** 0.265 CPIGram -0.024 0.359***
India
Domestic common shocks with fixed effect 0.453***
Indian retail market
CPITomato -0.019 CPIPotato -0.168*** CPIOnion -0.147 CPIMilk 0.874
Adjusted R-squared 47.1% RMSE 0.177
Notes: (a) ‘***’, ‘**’ and ‘*’ represent significance at 1%, 5% and 10% respectively (b) In our estimation we report the vertical integration against CPI commodities only
for convenience as if WPI is causing changes in CPI. The opposite is true as well. (c) ** Similarly, we report spatial integration parameters against Pakistani CPIs as if
shocks in Indian CPI causes shocks in Pakistani CPIs. The opposite is also true.

14
Table 3: Contribution of each type of shock to volatility and market integration. Type of shocks Variables Common Vertical (b) Spatial (c)
World World common shocks with fixed effect 3.3%***
Pakistan
Domestic common shocks with fixed effect 0.0%
Vegetables (V)
WPIV 0.7% CPITomato 7.3%*** 29.5%*** 0.1% CPIPotato 0.1% 10.7%* 55.7%*** CPIOnion 10.3%*** 27.7%*** 4.2% CPIFresh Vegetable 0.2% 71.9%***
Fresh Fruits (F) WPIF 28.4%*** CPIF 38.3%*** 21.8%**
Dry Fruits (D) WPID 5.0%** CPID 2.9%* 3.2%
Chicken (C) WPIC 3.2%* CPIC 9.7%*** 60.7%***
Milk (M) WPIM 1.2% CPIM 23.8%*** 15.8%** 5.4%
Eggs (E) WPIE 16.2%*** CPIE 22.7%*** 57.8%***
Wheat (W) WPIW 58.1%*** CPIW 61.1%*** 10.0%
Rice Rice 0.6% Rice 0.8% 65.6%***
Pulses (P)
WPIP 6.8%** CPIMasoor 5.2%** 43.7%*** CPIMoong 24.4%*** 7.0% CPIGram 0.1% 12.9%**
India
Domestic common shocks with fixed effect 20.5%***
Indian retail market
CPITomato 0.0% CPIPotato 2.8%*** CPIOnion 2.2% CPIMilk 76.5%
Notes: (a) ‘***’, ‘**’ and ‘*’ represent significance at 1%, 5% and 10% respectively (b) In our estimation we report the vertical integration against CPI commodities only
for convenience as if WPI is causing changes in CPI. The opposite is true as well. (c) ** Similarly, we report spatial integration parameters against Pakistani CPIs as if
shocks in Indian CPI causes shocks in Pakistani CPIs. The opposite is also true.

15
Values reported under the vertical integration columns in Tables 2 and 3 suggest that the degree
of vertical integration changes from commodity to commodity. The market for fresh vegetables
has the highest degree of vertical integration. Nearly 72% of the fluctuations in the retail
market prices are transmitted to the wholesale market and vice versa. This is followed by the
market for Rice, Chicken, Eggs, Masoor dal (pulses), Tomato and Onion where around 66%,
61%, 58%, 44%, 30% and 28% of the variations is vertically transmitted from the wholesale
(retail) market to the retail (wholesale) market respectively. The degree of vertical integration
in other markets is either statistically or economically insignificant. Most of the fluctuations in
these markets are therefore idiosyncratic in nature. Moreover, there is heterogeneity in the
degree of market integration in the same category of goods, such as pulses where there is
evidence of some degree of vertical integration in the market for Masoor, the market for Mong
and Gram is not integrated. A similar trend can be observed in the vegetables market.
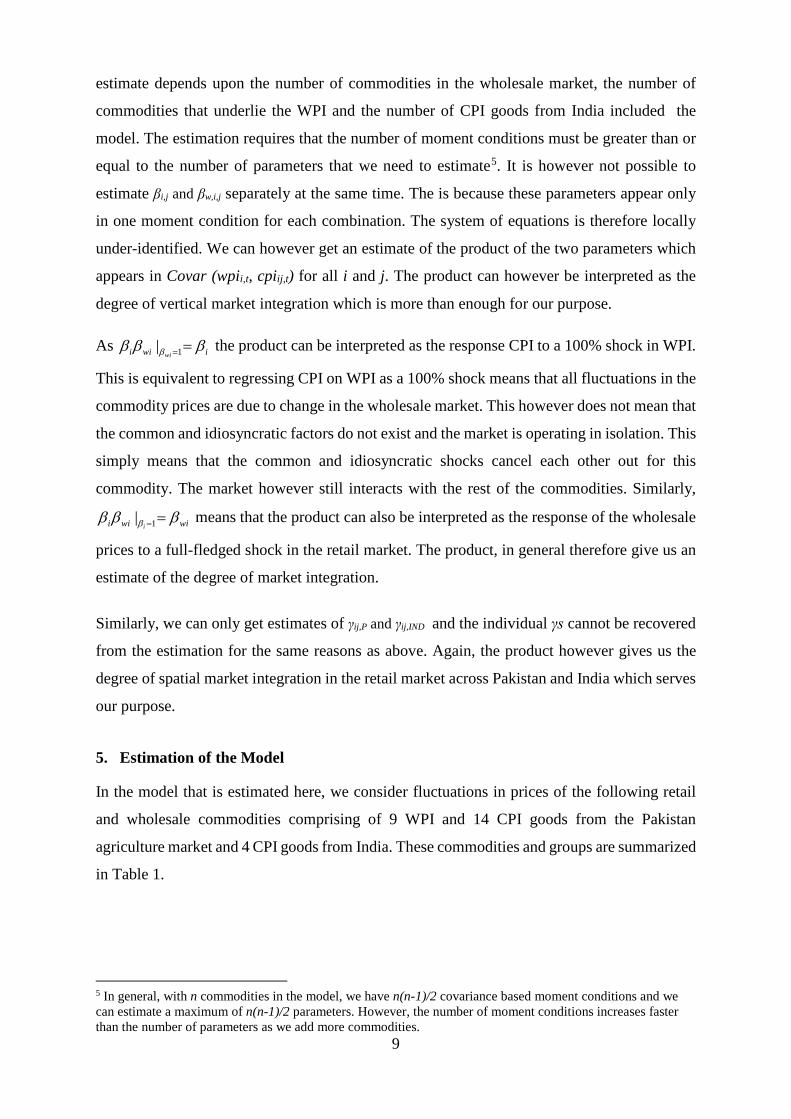
6.3.Temporal price transmission between the wholesale and retail markets
Time series analysis typically uses an error correction mechanism to quantify the speed of
adjustments in prices over time towards its long run equilibrium. This in a sense looks at market
integration across time. In essence the analysis measures the response of prices to temporal
price changes in the past. We refer to this as temporal price transmission or temporal market
integration. We can use our model to quantify the response of current price in the retail
(wholesale) market to changes in the wholesale (retail) prices of the commodities in the
previous period. We can do so by replacing changes in the current year’s CPI with its lag values
to see how WPI in the current period responds to change in the CPI in the previous period
(month). Similarly, we replace current year’s changes in WPI with its lag values to see how the
relevant retail market responds to changes in the wholesale market prices in the previous
period. These results are reported in Table 4 together with the base case results reported in
Table 3 for comparison.
With the exception of the market for rice and Masoor, retail or wholesale prices in all other
commodities do not respond to lagged price shocks. In the rice and pulses markets, the response
of CPI to changes in past month’s prices in the wholesale market tend to be relatively stronger
than the response of WPI to changes in the lagged prices of CPI. Overall, the degree of temporal
price integration in the rice market is at least twice as much as the pulses market.
16
Table 4: Degree of Vertical Market Integration over time. WPI Variable
CPI Variable Base case result
Temporal Market Integration: The response of
wpit to cpit-1 cpit to wpit-1
Vegetables (V)
Tomato 29.5%*** 0.9% 0.9% Potato 10.7%* 3.1% 5.0% Onion 27.7%*** 4.3% 2.0% Fresh vegetables 71.9%*** 0.3% 2.1%
Fresh Fruits (F) Fresh Fruit 21.8%** 1.7% 0.4% Dry Fruits (D) CPID 3.2% 2.5% 9.8%* Chicken (C) CPIC 60.7%*** 0.0% 0.1% Milk (M) CPIM 15.8%** 3.9% 0.3% Eggs (E) CPIE 57.8%*** 0.0% 0.1% Wheat (W) CPIW 10.0% 1.9% 0.0% Rice Rice 65.6%*** 26.0%*** 47.4%***
Pulses CPIMasoor 43.7%*** 13.0%*** 19.1%** CPIMoong 7.0% 0.5% 1.0% CPIGram 12.9%** 3.2% 15.8%**
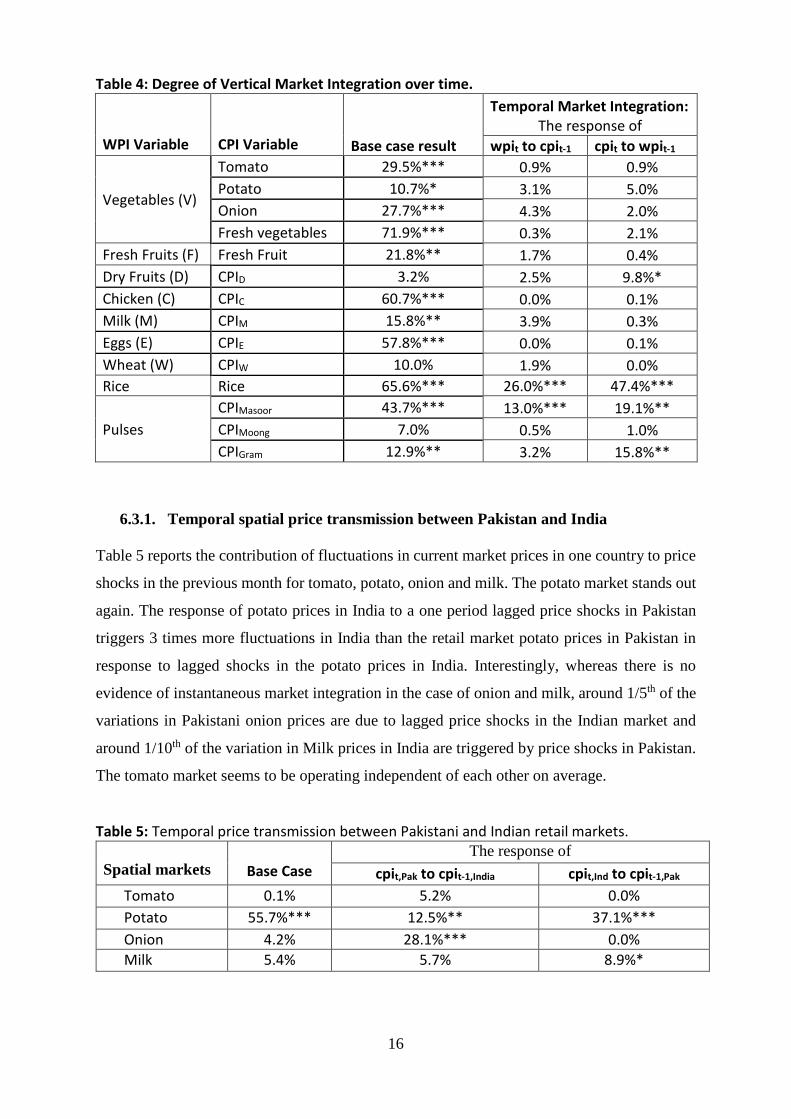
6.3.1. Temporal spatial price transmission between Pakistan and India
Table 5 reports the contribution of fluctuations in current market prices in one country to price
shocks in the previous month for tomato, potato, onion and milk. The potato market stands out
again. The response of potato prices in India to a one period lagged price shocks in Pakistan
triggers 3 times more fluctuations in India than the retail market potato prices in Pakistan in
response to lagged shocks in the potato prices in India. Interestingly, whereas there is no
evidence of instantaneous market integration in the case of onion and milk, around 1/5th of the
variations in Pakistani onion prices are due to lagged price shocks in the Indian market and
around 1/10th of the variation in Milk prices in India are triggered by price shocks in Pakistan.
The tomato market seems to be operating independent of each other on average.
Table 5: Temporal price transmission between Pakistani and Indian retail markets. Spatial markets
Base Case
The response of cpit,Pak to cpit-1,India cpit,Ind to cpit-1,Pak
Tomato 0.1% 5.2% 0.0% Potato 55.7%*** 12.5%** 37.1%*** Onion 4.2% 28.1%*** 0.0% Milk 5.4% 5.7% 8.9%*

17
6.3.2. Asymmetry in vertical price transmission
Another aspect of price transmission that is of interest to researchers and practitioners is to
assess if the response of positive changes is prices in a market is any different from negative
changes in prices. We refer to this as positive and negative shocks. Table 6 reports the
response of vertical horticulture markets to positive and negative shocks in prices. Our results
indicate evidence of asymmetry in price transmission between the wholesale and retail
markets of onion and Fresh fruits. The transmission of positive changes in prices in the fresh
fruits markets is much stronger than negative shocks. Around two third of the positive price
shocks in the market for fresh fruits in one market are vertically transmitted to the other as
opposed to around a fifth of the negative shocks. There is also some evidence of asymmetry
in vertical transmission of price shocks in the onion market where only positive shocks are
transmitted.
Table 6. Asymmetry in vertical price transmission
Base case Positive shocks Negative shocks
Tomato 29.5%*** 16%* 15%* Potato 10.7%* 02% 6.4% Onion 22.7%*** 15.2%* 11.4% Fresh Fruits 71.9%*** 67.8%*** 19.4%**
Table 7. Asymmetry in spatial price transmission between Pakistan and India.
Base case Positive shocks Negative shocks Tomato 0.1% 14.8%* 1.3% Potato 55.7%*** 10.7% 53%*** Onion 4.2% 9.3% 27.1%**
6.4.Spatial market integration and asymmetry in price transmission between India
and Pakistan
The last column of Tables 3 provides estimates of the degree of spatial integration between the
Pakistani and Indian retail markets for tomato, potato, onions and milk. These results are also
reported in Table 7. Table 7 also reports the response of one country’s retail prices for tomato,
potato and onion to positive and negative shocks of another country. The only retail market
that seems to be spatially integrated across Pakistan and India is the potato market. Around
56% of the fluctuations in the retail prices of potato in one country are transmitted to the other

18
country. The asymmetry analysis however suggests that only negative shocks are transmitted
as almost all the transmitted shocks are triggered by negative price shocks. Moreover, the base
case results also show that the tomato and onion markets are not integrated. However, around
15% of the positive shocks in tomato and 27% negative shocks in onion are transmitted from
India to Pakistan and vice versa. These results reveal that there is asymmetry is the transmission
of shocks as well as the type of asymmetry (whether positive or negative shocks are
transmitted). Thus, the periodic opening of trade between the two countries in some
commodities does create some price linkages between the two countries’ markets in the case
of tomatoes and onions, though markets are not well integrated. These linkages should be
explored further as they have bearings on debates about the factors causing volatility in prices
and management of trade between the two countries.
Table 8: Summary of the results.
Market
Dominant Source of volatility
Vertical price transmission
Temporal transmission of shocks
Asymmetry in vertical integration
Spatial price transmission
Asymmetry in spatial price transmission
Tomato Idiosyncratic Reasonable No No No Yes (Low)
Potato Spatial Low No No Dominant Yes (High)
Onion Idiosyncratic Reasonable No Yes (low) No Yes (high)
Fresh Fruits
Vertical Dominant No Yes (High) No
Dry Fruits Idiosyncratic No No
Chicken Vertical Dominant No
Milk Idiosyncratic Low No
Eggs Vertical Dominant No
Wheat Common No No
Rice Vertical Dominant Yes (High)
Masoor Idiosyncratic and vertical
Medium Yes (Low)
Moong Idiosyncratic No No
Gram Idiosyncratic Low Yes (low, partial)
7. Summary and conclusions
This paper uses a novel approach to model interaction between vertical and spatial prices of
agriculture commodities in Pakistan as an alternative to the standard time series analysis. We
model price transmission a contagious shock which spreads from one market to another while
controlling for factors which may cause co-movement in prices using latent factors. We control
for common factors which might have a uniform impact on all prices as well as for common
factors which might have a variable impact on different prices. In time-series analysis jargon,

19
this is equivalent to having a non-stationary series with a constant a constant and a trend. The
“trend” in our model is richer in the sense that we assume the trend to be a latent shock rather
than a time-variable which admits a complex set of movements which may cause changes in
the vertical and spatial prices. Moreover, unlike time-series analysis, our model relies on
interaction of agriculture commodities in the entire market space. We exploit the variance and
covariance of a variety of products in the retail and wholesale market to assess if (i) there are
any common world or domestic shocks which might affect all prices at the same time; (ii) price
shocks in one market are vertically transmitted to another (retail to wholesale and wholesale
to retail); and (iii) price shocks in one country are transmitted to another (Pakistan to India and
India to Pakistan).
Our base case analysis quantifies the degree of vertical and spatial market integration for a
variety of agriculture commodities in Pakistan. We further analyse the response of retail and
wholesale markets to vertical shocks and the response of spatial shocks in the retail market.
Moreover, we also separate the degree of market integration during positive shocks from the
degree of market integration during negative shocks, both vertically and spatially.
There is a great deal of heterogeneity in the degree of vertical and spatial market integration
and the dominant source of price volatility. The following summarises some of the main results.
Please see table 8 for a detailed summary of the results.
i. Vertical shocks play a dominant role in the market for fresh fruits, chicken, eggs
and rice. At least 58% of the price shocks are transmitted from the retail market
to the wholesale market and vice versa.
ii. Spatial price transmissions play a dominant role in the retail market for potato
between India and Pakistan. Around 56% of the variation in one country’s retail
prices in the market are transmitted to the other country.
iii. Common factors, factors which cause fluctuation in the overall market, play a
dominant role in the market for wheat explaining around 60% of the fluctuations
in the wholesale and retail prices.
iv. Idiosyncratic factors, factors specific to the retail or wholesale market of
individual commodities, are important in the market for tomato, onion, dry
fruits, milk and pulses.
v. With the exception of rice and pulses, vertical shocks in previous periods do not
trigger any vertical variations in prices.
vi. There is a high (low) degree of asymmetry in the transmission of positive vis-
à-vis negative vertical shock in the market for potato (onion). There is no

20
different in the degree of vertical price transmission in response to a positive
vis-à-vis negative shock in case of tomato and potato as fluctuations in the price
of these crops are caused by idiosyncratic or spatial changes respectively.
vii. There retail markets in India and Pakistan respond to a negative spatial shock
differently than a positive spatial shocks for the three commodities we
investigated (tomato, potato and onion).
A message from these preliminary results is that there is a great deal of heterogeneity in terms
of what triggers the fluctuations in prices of a commodity, indicating that no single ‘broad
brush’ policy can improve price transmission. Efforts should be directed to a better
understanding of each market, at the wholesale and retail level, to identify sources of
inefficiency.
We emphasise that results reported here are preliminary results only and must be treated with
caution. We investigate these issues in more depth and detail in ongoing research to cover not
only the potato markets, but also more disaggregated analysis to explore individual markets of
chillies and mangoes.

21
References:
Abdulai, A. (2000), ‘Spatial price transmission and asymmetry in the Ghanaian maize market’,
Journal of Development Economics, 63(2), 327–349.
Acosta, A and Valdes, A 2014, ‘Vertical Price Transmission of Milk Prices: Are Small Dairy
Producers Efficiently Integrated Into Markets?’ Agribusiness, vol. 30, no.1, pp 56-63.
Ahmed, Burhan and Ole Gjølberg (2015), ‘Are Pakistan’s Rice Markets Integrated
Domestically andWith the International Markets? SAGE Open:
http://journals.sagepub.com/doi/pdf/10.1177/215824401559679
Ali, Tariq, Jikun Huang and Wei Xie (2018), ‘Effect of China-Pakistan Economic Corridor on
Bilateral Trade with Focus on Horticulture Commodities’, ACIAR Project Working
Paper 02/18, CDES, Monash University:
https://www.monash.edu/__data/assets/pdf_file/0011/1458848/Working-Paper-02.pdf
Baquedano, F. G., & Liefert, W. M. (2014), ‘Market integration and price transmission in
consumer markets of developing countries’, Food Policy, 44, 103–114.
Barrett, C. B., & Li, J. R. (2002), ‘Distinguishing between Equilibrium and Integration in
Spatial Price Analysis’, American Journal of Agricultural Economics, 84(2), 292–307.
Dungey, M. H. (2000). Decomposing exchange rate volatility around the Pacific Rim. Journal
of Asian Economics, 10 (4), 525-535.
Ghafoor, Abdul, Kalid Mustafa, Khalid Mushtaq, and Abedullah (2009), “Cointegration and
Causality: An Application to Major Mango Markets in Pakistan’, Lahore Journal of
Economics, 14(1): 85-113
Goodwin, B. K., & Piggott, N. E. (2001), ‘Spatial Market Integration in the Presence of
Threshold Effects’, American Journal of Agricultural Economics, 83(2), 302–317.
Huang, Jikun and Qi Cui (2018), ‘Food consumption Pattern Change and Horticulture
Consumption in China.’ ACIAR Project working Paper 03/18, CDES, Monash
University, Melbourne:
https://www.monash.edu/__data/assets/pdf_file/0012/1458849/Working-Paper-03
Lohano, D. H and F. M. Mari (2006), “Testing Market Integration in Regional Onion Markets
of Pakistan: Application of Error Correction Model in the Presence of Stationarity”,
International Research Journal of Finance and Economics, 1:89-97
Mukhtar, T. and M.Tariq, (2008), ‘Market Integration in Wholesale Maize Markets in
Pakistan’, Regional and Sectoral Economic studies, 8 92): 85-98

22
Ravallion, M. (1986), ‘Testing Market Integration’, American Journal of Agricultural
Economics, 68, 102-109
Silvapulle, P., and Jayasuriya, S. (1994) ‘Testing for Philippines Rice Market Integration: A
Multiple Co-Integration Approach’, Journal of Agricultural Economics, 45(3), 369-380
Sekhar, C.S.C (2012), ‘Agricultural Market Integration in India: an Analysis of Select
Commodities’, Food policy, 37(3): 309-322
Serra, T and Barry Goodwin, 2003. ‘Price transmission and asymmetric adjustment in the
Spanish dairy sector’, Applied Economics, 35(18), pages 1889-1899.
USAID, 2011. Agricultural Marketing Policy Reforms - Balochistan. USAID:
http://pdf.usaid.gov/pdf_docs/PA00K7T9.pdf.
USAID, 2012. USAID FIRM Project- Agricultural Marketing Legal Framework.
http://pdf.usaid.gov/pdf_docs/PA00K3GF.pdf