Embed Size (px)
Citation preview

AQUATIC MICROBIAL ECOLOGYAquat Microb Ecol
Vol. 38: 3–14, 2005 Published January 21
INTRODUCTION
Ocean biogeochemistry is largely controlled by themetabolic activities of planktonic microorganisms. Inmany marine ecosystems, the bioavailability of nitrogen(N) regulates plankton production and carbon export(Dugdale & Goering 1967, Eppley & Peterson 1979). Inthe open ocean, plankton productivity is supported byboth new and recycled forms of N (Eppley & Peterson1979). New N inputs to the upper ocean include nitrate(NO3
–) introduced across the thermocline, atmosphericdeposition, and biological fixation of dinitrogen (N2).
Direct measurements and biogeochemical proxiessuggest that rates of N2-fixation may account for a sig-nificant fraction of the total N flux into open-oceanecosystems (Michaels et al. 1996, Gruber & Sarmiento1997, Deutsch et al. 2001, Lee et al. 2002, Montoya etal. 2004).
Biological N2-fixation is catalyzed by nitrogenase, ametal-cofactor enzyme that consists of 2 highly con-served proteins: an iron (Fe)-containing dinitrogenasereductase (or Fe protein), encoded by the nifH gene;and the molybdenum iron (MoFe) dinitrogenase (orMoFe protein), encoded by the nifDK genes. Nitroge-
© Inter-Research 2005 · www.int-res.com*Email: [email protected]
Vertical distributions of nitrogen-fixing phylotypes atStn ALOHA in the oligotrophic North Pacific Ocean
Matthew J. Church1, 3,*, Bethany D. Jenkins1, David M. Karl2, Jonathan P. Zehr1
1Ocean Sciences Department, University of California at Santa Cruz, Earth and Marine Sciences Building, Santa Cruz,California 95064, USA
2Department of Oceanography, University of Hawaii, Honolulu, Hawaii 96822, USA
3Present address: Department of Oceanography, University of Hawaii, Honolulu, Hawaii 96822, USA
ABSTRACT: In large areas of the world’s oceans, biological dinitrogen (N2) fixation supports asignificant fraction of ecosystem productivity; to date, however, there is little information on theabundances of specific diazotrophs in the ocean. In this study, the vertical distributions of severaldifferent groups of N2-fixing bacteria were examined using quantitative polymerase chain reaction(QPCR) amplification of group-specific dinitrogenase reductase (nifH) genes from Stn ALOHA in thesubtropical North Pacific Ocean. Depth distributions (<200 m) of 3 cyanobacterial nifH phylotypesand 1 previously uncharacterized Cluster III nifH phylotype were evaluated. The nifH-containingcyanobacteria included sequence-types similar to Trichodesmium spp. and 2 nifH sequences closelyrelated to unicellular cyanobacteria (termed Groups A and B). The Group A cyanobacteria (mostclosely related to Cyanothece sp.) were the most abundant of all phylotypes examined, comprising2 × 105 nifH gene copies l–1 in the high-irradiance (>700 µmol quanta m–2 s–1), nitrate-depleted(<10 nmol l–1) upper-ocean waters. Group B cyanobacterial phylotypes (most closely related to Croco-sphaera watsonii) demonstrated a depth distribution similar to Group A, but Group B nifH abundancewas considerably lower, averaging 2 × 10³ nifH gene copies l–1 in the upper photic zone. The abun-dance of Trichodesmium spp. ranged from 1 × 10³ to 7 × 10³ nifH gene copies l–1 in the upper ocean,declining to <100 nifH gene copies l–1 below the mixed layer (~82 m). The Cluster III nifH phylotypewas the most abundant nifH phylotype in the dimly lit (<12 µmol quanta m–2 s–1) lower photic zone(>100 m). These results revealed differences in the depth distributions of N2-fixing plankton at StnALOHA, and suggest that unicellular diazotrophs comprise a significant component of planktonbiomass in this oligotrophic marine ecosystem.
KEY WORDS: Nitrogen fixation · Bacterial diversity · Quantitative PCR · Hawaii Ocean · Time-series
Resale or republication not permitted without written consent of the publisher

Aquat Microb Ecol 38: 3–14, 2005
nase is widely distributed among diverse Bacteria andArchaea, and evolved relatively early in prokaryoteevolution (Zehr & Capone 1996, Falkowski 1997); asa result, the nif genes appear useful for evaluatingphylogenetic relationships among prokaryotes (Zehr &Capone 1996, Falkowski 1997, Zehr et al. 2003).
Among the most conspicuous and well-studied of theoceanic N2-fixers are the filamentous, nonheterocys-tous cyanobacteria of the genus Trichodesmium, whichplay a globally significant role in ocean biogeochem-istry (Carpenter 1983, Capone et al. 1997, Karl et al.1997). In addition, endosymbiont N2-fixing cyanobac-teria such as Richelia intracellularis, which live in asso-ciation with marine diatoms, also appear to providefixed nitrogen to the upper-ocean plankton assem-blages (Venrick 1974, Weare et al. 1974, Villareal1991, Carpenter et al. 1999). Until recently, unicellularcyanobacteria were not considered important contrib-utors to oceanic N2-fixation; however, recent molecu-lar-based techniques have identified 2 open-oceannifH sequence-types (termed Groups A and B) thatphylogenetically cluster with unicellular cyanobacteria(Zehr et al. 2001, Falcón et al. 2002, 2004), and bothof these phylotypes have been found to express nifH,suggesting an active role for these groups in N2-fixation (Zehr et al. 2001, Falcón et al. 2004).
The nifH DNA sequences of Group A cyanobacteriaare loosely related (82% similar) to Cyanothece sp.ATCC51142, while the Group B nifH DNA sequencesare 93 to 99% similar to marine Crocosphaera watsoniiWH8501 (AF300829). Both Cyanothece sp. and marineC. watsonii are 2 to 10 µm diameter, unicellular cyano-bacteria that contain the accessory photosynthetic pig-ment phycoerythrin PE (Rippka et al. 2001). Unicellu-lar cyanobacteria of morphology similar to Cyanothecesp. and C. watsonii have been observed in the openocean (Campbell et al. 1997, Neveux et al. 1999,Falcón et al. 2004), and recent studies suggest thatthey may be important in open-ocean N2-fixation(Falcón et al. 2004, Montoya et al. 2004).
The subtropical North Pacific Ocean is one of themost expansive ecosystems on Earth (Karl 1999). AtStn ALOHA in the central North Pacific Ocean, surfacewater concentrations of nitrate and nitrite [NO3
–+NO2–]
are typically <10 nM. Nitrate input to the upper oceanis largely restricted to diffusion across the nitraclineand advective fluxes via Rossby waves and mesoscaleeddies (Karl 1999, Letelier et al. 2000, Sakamoto etal. 2004). Despite the paucity of inorganic nutrientsto support plankton growth, nitrogen export at StnALOHA averages 103 mmol N m–2 yr–1, with up toone-half of this export supported by N2-fixation (Doreet al. 2002).
The TaqMan® 5’-fluorogenic exonuclease quantita-tive polymerase chain reaction (QPCR) assay has been
used to assess the abundance and distribution of eco-logically relevant marine prokaryotes (Suzuki et al.2000, 2001, Short et al. 2004). In this study, we devel-oped QPCR primers and probes to determine theabundances and vertical distributions of several nifHphylotypes observed at Stn ALOHA. QPCR primersand probes were developed to target Trichodesmiumspp., and Group A and B cyanobacterial phylotypes, aswell as a novel nifH Cluster III phylotype. Our resultsindicate that nifH genes are abundant in the upperocean of the oligotrophic North Pacific Ocean.
MATERIALS AND METHODS
Sample collection, DNA extraction, and degeneratenifH PCR. Sampling for this study was conductedaboard the RV ‘Kilo Moana’ (KM 0210) during a re-search cruise to Stn ALOHA (22° 45’ N, 158° 00’ W)from December 12 to 16, 2002. Water samples werecollected from 9 depths (5, 25, 45, 75, 100, 125, 150,175, 200 m) in the upper ocean using polyvinyl chlo-ride bottles attached to a conductivity-temperature-depth rosette sampler. Whole seawater was subsam-pled into 2 l polycarbonate bottles and processed atsea. We sequentially filtered 1 l seawater samples fromeach depth onto in-line 25 mm diameter, 10 µm pore-size Nylon filters, and onto 0.2 µm pore-size Supor®
filters (Pall Gelman). Seawater was pumped throughthe filters using a peristaltic pump and acid-washedsilicon tubing. Upon completion of filtration, both the0.2 and 10 µm filters were removed from the Swinnex®
filter holders (Millipore) and placed in 2 ml centrifugetubes containing 500 µl of Tris-EDTA (TE) (10 mM Tris-HCl at pH 7.4; 1 mM EDTA at pH 8.0). Centrifugetubes were immediately frozen in liquid nitrogen andtransported back to the shore-based laboratory foranalyses.
Nucleic acids were extracted from the 0.2 and 10 µmfilters using the protocol described by Tillett & Neilan(2000). Briefly, 500 µl of potassium xanthogenatebuffer (2% w/v potassium ethyl xanthogenate; 200 mMTris-HCl, pH 7.4; 2 mM EDTA, pH 8.0; 2% sodiumdodecylsulfate; 1.6 M ammonium acetate) was addedto centrifuge tubes containing filters and 500 µl TEbuffer. Filters were incubated at 70°C for 120 min.After extraction, the buffer containing extracted sam-ple was removed from the tubes and transferred tonew 2 ml centrifuge tubes. Samples were vortexedbriefly, placed on ice for 30 min, and then centrifugedat room temperature at 10 000 × g for 10 min. Thesupernatants were transferred into clean 2 ml cen-trifuge tubes containing 750 µl of isopropanol. Sampleswere incubated at room temperature for 10 min andthe precipitated DNA was pelleted by centrifugation at
4

Church et al.: Quantification of N-fixing phylotypes at Stn ALOHA
10 000 × g for 10 min. The DNA pellets were washedonce with 70% ethanol, air-dried, and then resus-pended in 100 µl of TE buffer (Tillett & Neilan 2000).Samples were stored at –20°C until analysis. DNA con-centrations were quantified by PicoGreen® DNA quan-tification (Molecular Probes) using a spectral fluoro-meter following the manufacturer’s specifications.
To assess the diversity of nifH-containing planktonat Stn ALOHA, samples from 9 depths in the upper200 m were PCR-amplified using degenerate nifHprimers (Zehr & Turner 2001, Steward et al. 2004). Theresulting PCR products were cloned and sequencedfollowing the protocol described in Zehr & Turner(2001). Briefly, a 2-step, nested PCR strategy was uti-lized to amplify a 359 bp region of the nifH gene (Zehr& McReynolds 1989). For the first round of the PCR,2 ng of environmental DNA were added to 50 µl PCRreactions. After 30 cycles of PCR amplification, 2 µl ofthe first-round PCR products were added to 50 µlsecond-round PCR reactions and amplified for anadditional 30 cycles. The resulting PCR productswere visualized on an ethidium bromide-stained 1.2%agarose gel, excised, and purified using a QIAEX IIkit (Qiagen). PCR-amplified DNA was cloned intoP-GEM T vector (Promega), transformed in Escherichiacoli JM109 competent cells, and identified by blue-white screening. Recombinant plasmids were purifiedusing a 96-well Montage miniprep kit (Millipore), andsequenced using Applied Biosystems Big Dye™ chem-istry on an ABI 3100 (Applied Biosystems). Representa-tive nifH groups were sequenced on both strands.
QPCR amplification and primer specificity. For de-velopment of QPCR probes and primers, we selected4 representative nifH sequences that were retrievedfrom the PCR clone libraries. QPCR amplificationrequires an oligonucleotide probe that contains both afluorescent (reporter) and a quenching dye; when theprobe is in close proximity to the quenching dye, fluo-rescence is effectively quenched. For this study, probeswere 5’-labeled with the fluorescent reporter FAM(6-carboxyfluorescein) and 3’-labeled with TAMRA(6-carboxytetramethylrhodamine) as a quenching dye.During amplification, the probe is cleaved by the5’-exonuclease activity of the Taq DNA polymerase,separating the reporter from the quencher and result-ing in fluorescence emission. Fluorescence yield in theQPCR reaction is directly proportional to PCR productaccumulation, which depends on the amount of theinitial product in each reaction.
Primers and probes (Table 1) were designed for 4 dif-ferent nifH phylotypes, comprising the Group A andGroup B unicellular cyanobacteria, Trichodesmiumspp., and the Cluster III nifH phylotype using PrimerExpress software (Applied Biosystems). The Trichodes-mium spp. QPCR primers and probes were designed to
target T. thiebautti; however, the nifH sequences of Tri-chodesmium spp. and Katagnymene spp. are closelyrelated (Lundgren et al. 2001), and the Trichodesmiumspp. QPCR primers and probes used for this studyalso amplified nifH genes from T. erythraeum and T.thiebautti with equal efficiency (data not shown).
Triplicate 25 µl QPCR reactions were conducted foreach environmental DNA sample and for each stan-dard. Reaction mixes contained 1 × TaqMan® PCRbuffer (Applied Biosystems), 2.0 mM MgCl2, 200 µMeach of dATP, dGTP, dCTP and 400 µM dUTP,400 nM each of forward and reverse primer, 200 nMof fluorogenic probe, 0.25 U of AmpErase uracyl N-glycosylase (UNG), 0.625 U AmpliTaq gold DNA poly-merase (Applied Biosystems). To each reaction, 2 µl ofenvironmental DNA or plasmid standards were addedequivalent to 2–6 ng additions of environmental DNA.A GeneAmp® 5700 (Applied Biosystems) was used forquantitative detection of amplified PCR products.Thermal cycling conditions were 50°C for 2 min, 95°Cfor 10 min, and 45 cycles (95°C for 15 s followed by60°C for 1 min).
The specificities of each QPCR primer/probe setwere evaluated using non-target controls (plasmidscontaining non-target nifH inserts) in QPCR reactionsand comparing the amplification cycle threshold (Ct) toplasmids containing the target nifH insert. The non-target controls used for the Group A primers andprobes were non-target nifH PCR products clonedfrom Group B cyanobacteria (AF299418; 80% identicalnifH DNA), and Trichodesmium spp. (AY528677; 75%identical nifH DNA); Group B non-target controls werecloned Group A (AF059642; 80% identical nifH DNA),and Trichodesmium spp. (77% identical nifH DNA)nifH fragments. Similarly, non-target controls for theTrichodesmium spp. probes and primers were clonednifH PCR products from the Group A and B cyano-bacteria. The non-target control for the Cluster IIIsequence was a cloned nifH PCR product (84% similarnifH DNA) from an uncultivated Cluster III phylotyperecovered from a microbial mat in Baja, Mexico(AY232376), as well as the nifH PCR products clonedfrom the Group A, B, and Trichodesmium spp. phylo-types (Table 1).
Standard curves and PCR inhibition. Standards foreach TaqMan® primer/probe set consisted of serialdilutions of the positive controls (plasmids with thetarget nifH inserts). To create standard curves of Ctversus amount of nifH target added to each reaction,2 µl of each plasmid dilution were added to duplicateQPCR reactions. Additions of nifH genes for standardcurves ranged from <10 to >106 nifH copies per reac-tion. Least-squares linear regression analyses of Ctversus log10 nifH gene copies were used to quantifythe target genes in the environmental DNA samples.
5

Aquat Microb Ecol 38: 3–14, 20056
Pro
bes
an
dF
orw
ard
pri
mer
Pro
be
Rev
erse
pri
mer
Gen
e ab
un
dan
ces
targ
ets
(104
nif
H c
opie
s)A
dd
edD
etec
ted
Gro
up
A p
rob
eF
5’-
AG
CT
AT
AA
CA
AC
GT
TT
TA
P 5
’-R
5’-
AC
CA
CG
AC
CA
GC
AT
GC
GT
TG
A-3
’T
CT
GG
TG
GT
CC
TG
AG
CC
TG
GA
-3’
CA
TC
CA
-3’
Tar
get
-bas
e re
gio
n10
6–1
3113
3–1
5315
6–1
74
Tar
get
sG
rou
p A
GG
CT
AT
AA
CA
AC
GT
TT
TA
TG
CG
TT
GA
TC
CG
GT
GG
TC
CT
GA
GC
CT
GG
AA
CC
AC
GA
CC
AG
CA
CA
TC
CA
1.1
0.98
(AF
0596
42)
(1/2
6)(1
/21)
(0/1
9)G
rou
p B
GG
AT
TT
GA
AA
AC
AT
CA
AG
TG
TG
TA
GA
TC
TG
GT
GG
TC
CT
GA
GC
CT
GG
AA
CC
AC
GA
CC
AG
CA
CA
TC
CA
3.3
ns
(AF
2994
18)
(11/
26)
(0/2
1)(0
/19)
Tri
chod
esm
ium
GG
TT
TC
GG
TG
GC
AT
TA
AG
TG
TG
TT
GA
TC
TG
GT
GG
TC
CT
GA
GC
CT
GG
TA
CC
AC
GG
CC
AG
CG
CA
AC
CT
Acl
one
(AY
5286
77)
(14/
26)
(1/2
1)(5
/19)
1.5
ns
Gro
up
B p
rob
eF
5’-
TG
GT
CC
TG
AG
CC
TG
GA
GT
TG
-3’
P 5
’-T
GT
GC
TG
GT
CG
TG
GT
AT
-3’
R 5
’-T
CT
TC
TA
GG
AA
GT
TG
AT
GG
AG
GT
GA
T-3
’T
arg
et-b
ase
reg
ion
138
–157
160
–176
178
–203
Tar
get
sG
rou
p B
TG
GT
CC
TG
AG
CC
TG
GA
GT
TG
TG
TG
CT
GG
TC
GT
GG
TA
TT
CT
TC
TA
GG
AA
GT
TG
A(A
F29
9418
)(0
/20)
(0/2
0)T
GG
AG
GT
GA
T (
0/26
)3.
33.
6G
rou
p A
TG
GT
CC
TG
AG
CC
TG
GA
GT
TG
TG
TG
CT
GG
TC
GT
GG
TA
TT
CT
TC
AA
GG
AA
GT
TG
AT
AG
CA
GT
AA
T1.
1n
s(A
F05
9642
)(0
/20)
(0/1
7)(5
/26)
Tri
chod
esm
ium
TG
GT
CC
TG
AG
CC
TG
GT
GT
AG
TG
CG
CT
GG
CC
GT
GG
TA
TT
CT
TC
TA
GA
AA
GT
1.5
ns
clon
e (A
Y52
8677
)(2
/20)
(2/2
0)T
GA
TA
GC
AG
TA
AT
(5/
26)
Tri
cho
des
miu
mp
rob
eF
5’-
GA
CG
AA
GT
AT
TG
AA
GC
CP
5’-
CA
TT
AA
GT
GT
GT
TG
AA
TC
TR
5’-
CG
GC
CA
GC
GC
AA
CC
TA
-3’
AG
GT
TT
C-3
’G
GT
GG
TC
CT
GA
GC
-3’
Tar
get
-bas
e re
gio
n21
7–2
4124
6–2
7828
4–3
00
Tar
get
sT
rich
odes
miu
mG
AC
GA
AG
TA
TT
GA
AG
CC
AG
GT
TT
CC
AT
TA
AG
TG
TG
TT
GA
AT
CT
GG
TG
CG
GC
CA
GC
GC
AA
CC
TA
1.5
0.78
clon
e (A
Y52
8677
)(0
/24)
GT
CC
TG
AG
C (
0/32
)(0
/16)
Gro
up
AG
AT
GA
AG
TA
GT
AA
TT
CC
TG
GC
TA
TC
GT
TT
TA
TG
CG
TT
GA
GT
CC
CG
AC
CA
GC
AC
AT
CC
AA
1.1
ns
(AF
0596
42)
(9/2
4)G
GT
GG
TC
TG
AG
C (
7/32
)(4
/16)
Gro
up
BG
AA
GA
TG
TA
TT
GC
TC
GA
AG
GA
TT
TC
AT
CA
AG
TG
TG
TA
GA
AT
CT
GG
TG
CG
AC
CA
GC
AC
AA
CC
AA
3.3
ns
(AF
2994
18)
(9/2
4)G
TC
CT
GA
GC
(2/
32)
(3/1
6)
Clu
ster
III
pro
be
F 5
’-G
GA
GC
CT
AC
GA
GG
AC
GA
TC
AG
-3’
P 5
’-T
GG
AC
TA
CG
CG
TT
CT
AC
GA
-3’
R 5
’-G
CA
GA
CC
AC
GT
CA
CC
CA
GT
AC
-3’
Tar
get
-bas
e re
gio
n20
2–2
2322
7–2
4524
7–2
67
Tar
get
sC
lust
er I
IIG
GA
GC
CT
AC
GA
GG
AC
GA
TC
AG
TG
GA
CT
AC
GC
GT
TC
TA
CG
AG
CA
GA
CC
AC
GT
CA
CC
CA
GT
AC
4.6
5.7
(AY
5286
78)
(0/2
1)(0
/19)
(0/2
1)G
uer
ro N
egro
clo
ne
GG
CG
CC
TA
CG
AG
GA
GG
AG
CA
TT
CG
AC
TA
CG
CC
TT
CT
AC
GA
GC
AG
AC
GA
CG
TC
GC
CC
AG
CA
C2.
2n
s(A
Y23
2376
)(4
/21)
(2/2
1)(3
/21)
Gro
up
AG
AA
GA
AG
GT
GC
TT
AC
GA
AA
AC
AT
TT
CG
TA
TC
TT
AT
GA
TG
TA
CA
AA
CA
AC
GT
CT
CC
TA
AT
AC
1.1
ns
(AF
0596
42)
(12/
21)
(9/2
1)(6
/21)
Gro
up
BG
AA
GA
AG
GA
GC
TT
AC
GA
AG
AC
TA
GA
TT
TC
GT
AT
CC
TA
TG
AA
CA
AA
CA
AC
GT
CT
CC
TA
AT
AC
3.3
ns
(AF
2994
18)
(12/
22)
(7/2
1)(6
/21)
Tri
chod
esm
ium
GA
AG
AA
GG
AG
CT
TA
TA
CA
GA
TT
AG
AT
TT
CG
TA
AG
CT
AT
GA
GC
AA
AC
AA
CG
TC
AC
CT
AG
TA
C1.
5n
scl
one
(AY
5286
77)
(14/
21)
(8/2
1)(3
/21)
Tab
le 1
. S
pec
ific
ity
of o
lig
onu
cleo
tid
e q
uan
tita
tive
pol
ymer
ase
chai
n-r
eact
ion
(Q
PC
R)
pri
mer
s an
d p
rob
es,
show
ing
pro
be
seq
uen
ces
foll
owed
by
targ
et a
nd
non
-tar
get
seq
uen
ces.
Mis
mat
ched
bas
es a
re u
nd
erli
ned
; nu
mb
er o
f m
ism
atch
es r
elat
ive
to t
arg
et s
equ
ence
sh
own
in
par
enth
eses
. Gen
e ab
un
dan
ces:
nif
Hg
ene
abu
nd
ance
s ad
ded
to
each
rea
ctio
n a
nd
gen
e ab
un
dan
ces
det
ecte
d b
y Q
PC
R; T
arg
et-b
ase
reg
ion
: reg
ion
of s
equ
ence
targ
eted
by
pri
mer
s an
d p
rob
e; n
s: n
o si
gn
ific
ant a
mp
lifi
cati
on a
fter
45
cycl
es o
f QP
CR
(i.e
. cyc
le t
hre
shol
d v
alu
e =
45)
Church et al.: Quantification of N-fixing phylotypes at Stn ALOHA
Model I linear regression analyses were performedusing Sigma Plot Version 8.0 (SPSS).
To assess potential influences of PCR inhibition onamplification of environmental samples, duplicateQPCR reactions from each environmental sample werespiked with 0.5 pg positive-control DNA (plasmidscontaining the target nifH PCR product). An increasein the Ct of the positive control due to inhibition byenvironmental samples was detected by comparisonwith the Ct of the positive control alone. Several exper-iments were also conducted to determine if the mea-sured QPCR signal was proportional to the amount ofenvironmental DNA added to the reaction. In theseexperiments, varying additions of environmental DNA(0.1 to 24 ng DNA) were added to triplicate 25 µl QPCRreactions and the resulting Ct values were evaluated todetermine if the signal was proportional to the sampleadded.
Biogeochemical parameters. Chlorophyll a concen-trations were determined by filtering 125 ml seawatersamples onto Whatman 25 mm GF/F filters (Whatman)and extracting samples in 90% acetone; concentra-tions were determined fluorometrically using a TurnerAU-10 fluorometer (Turner). PE concentrations weremeasured from size-fractionated plankton samplesfollowing a protocol described by Wyman (1992), asmodified by Dore et al. (2002). Briefly, whole seawaterwas size-fractionated onto 10.0, 5.0, and 0.4 µm filters;PE was extracted from the filters, and concentra-tions were determined fluorometrically. To capturesuspended particles, 10 l of seawater were sequentiallypressure filtered onto 25 mm diameter 10.0 µm pore-size Nitex screening and 5.0 µm polycarbonate filters(Millipore). Next, 1 l from each of the <5.0 µm filtrateswas vacuum-filtered onto 25 mm-diameter, 0.4 µmpore-size polycarbonate filters (Millipore). Filters wereplaced in 20 ml scintillation vials containing 5 ml ofa saline-glycerol solution (35 g l–1 NaCl), and storedfrozen until processed in the laboratory. In the labora-tory, scintillation vials were placed on an orbital shakertable to resuspend particulate material from the filters,and the in vivo fluorescence of the resuspended parti-cles was determined on the same Turner AU-10 fluoro-meter (544 nm excitation and 577 nm emission) usedfor chlorophyll determinations.
The abundances of Prochlorococcus spp., Synecho-coccus spp. and non-pigmented prokaryotes wereenumerated by flow cytometry using the methodsdescribed in Monger & Landry (1993) and Campbell &Vaulot (1993). Briefly, 1 ml seawater samples wereadded to cryovials (Corning) containing 0.02 ml of10% paraformaldehyde, and samples were quick-frozen in liquid nitrogen. For analyses, samples werethawed and stained for 2 h with the fluorochromeHoechst 33342 (Molecular Probes). Cell concentrations
were then enumerated on a Coulter EPICS dual laser(1 W 488 nm and 225 mW UV) flow-cytometer (Beck-man Coulter). The flux of photosynthetically availableradiation (PAR, 400 to 700 nm) was determined frommeasurements of downwelling irradiance; profileswere collected using a Biospherical Instruments Profil-ing Reflectance Refractometer (PRR 600) (BiosphericalInstruments). Upper-ocean [NO3
– + NO2–] was deter-
mined using the chemiluminescent detection systemdescribed by Garside (1982) and Dore & Karl (1996).
RESULTS
Upper-ocean biogeochemical characteristics anddegenerate nifH PCR
Based on data collected on a Hawaii Ocean time-series(HOT) program cruise to Stn ALOHA on December 17 to21, 2002 (approximately coincident with this study), theaverage surface mixed layer based on the 0.125 potentialdensity criterion (Monterey & Levitus 1997) was 82 m,and the base of the photic zone (1% surface isopleth forPAR) was 108 m (Fig. 1A). Mixed-layer temperaturesaveraged 24.7°C and decreased to 23.1°C at the base ofthe photic zone. Mixed-layer [NO3
– + NO2–] averaged
2.5 nmol N l–1, increasing to >300 nmol N l–1 at 100 m(Fig. 1A). Concentrations of DNA extracted from the<10 µm plankton size classes ranged between 0.18 and1.5 µg DNA l–1 (Fig. 1A).
The abundance of non-pigmented picoplankton wasnearly constant throughout the mixed layer, averaging6.7 × 108 cells l–1, declining more than 2-fold beneaththe photic zone (Fig. 2A). Similarly, the depth distribu-tions of Prochlorococcus spp. and Synechococcus spp.were also approximately constant in the mixed layer,averaging 1.3 × 10⁸ and 2.4 × 10⁶ cells l–1, and declining76 and 90%, respectively, toward the base of thephotic zone. Depth-integrated (0 to 100 m) abundancesof non-pigmented picoplankton, Prochlorococcus spp.,and Synechococcus spp. were 3.9 × 10¹³, 1.7 × 10¹³, and1.9 × 1011 cells m–2, respectively. Vertical profiles ofsize-fractionated PE revealed the greatest concentra-tions to be associated with the <10 to 0. 4 µm size frac-tion (Fig. 2B); concentrations in this size fraction weremore than 1 order of magnitude greater than concen-trations in the >10 µm size fraction. Concentrationsof PE in the <10 µm size fraction averaged 5.8 ng l–1 inthe top 60 m of the water column, decreasing roughly5-fold toward the base of the photic zone (Fig. 2B). Incontrast, concentrations of >10 µm PE were lower,varying from 0.2 and 2.1 ng l–1 throughout the mixedlayer, and decreased to ≤0. 1 ng l–1 by 100 m.
nifH gene fragments were amplified from samplescollected in the upper 175 m of the water (Fig. 1B).
7

Aquat Microb Ecol 38: 3–14, 2005
Phylotypes retrieved from the nifH PCR amplificationand sequencing of the <10 µm plankton size classincluded several sequences ≥98% identical to theGroup A (AF059642) and Group B cyanobacteria(AF299418) (Zehr et al. 2001). In addition, several
8
Fig. 1. (A) Depth profile of concentrations of extracted DNA,chlorophyll a (Chl a), and [NO3
– + NO2–] at Stn ALOHA in
December 2002; dashed line: base of surface mixed-layer depth(MLD; 0.125 U potential density); dotted line: 1% surface PARisopleth. (B) Gel image of PCR-amplified nifH genes from depthprofile at Stn ALOHA in December 2002; each PCR reactioncontained 2 ng of environmental DNA; NTC: no template control
Fig. 2. (A) Vertical distributions of picoplankton abundances(based on flow-cytometry) and (B) concentrations of phyco-erythrin (PE) extracted from various size fractions of sus-pended particles at Stn ALOHA in December 2002. Dashedline: base of MLD (0.125 U potential density); dotted line:1% surface PAR isopleth; (?) questionable phycoerythrin data
A
BB
A
Church et al.: Quantification of N-fixing phylotypes at Stn ALOHA
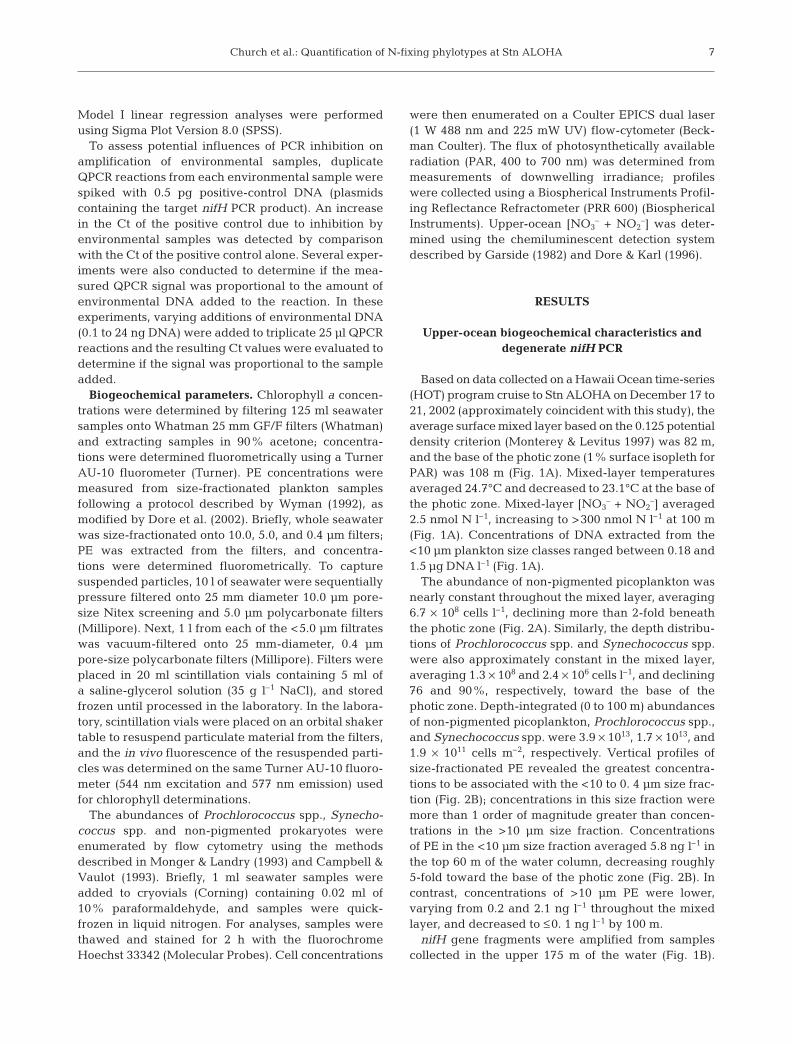
sequences similar (98 to 99% identical) to Tricho-desmium thiebautii (U23507) and Katagnymene spiralis(AF395130) were obtained (Fig. 3A). Also retrievedfrom the <10 mm plankton size class was a Cluster IIInifH DNA sequence (Fig. 3B); this Cluster III nifHsequence had not previously been reported from theopen ocean. Sequences grouping with the Cluster IIInifH phylotypes include strict anaerobes such asDesulfovibrio spp., archaeal methanogens, and greensulfur bacteria (Young 1992, Zehr et al. 2003).
PCR amplification and sequencing of the >10 µmplankton size class revealed several phylotypes identicalto sequences found in the <10 µm size class, includingnifH DNA sequences ~98% identical to Trichodesmiumthiebautii, and several sequences identical to the GroupA and the novel Cluster III nifH phylotype. No nifHsequences closely related to the Group B cyanobacteriawere found in the >10 µm plankton clone library.
QPCR amplification of upper-ocean diazotrophs
Amplification of standards was log10-linear across arange of target gene concentrations from ~1 to 107 genecopies per reaction (Fig.4A). The relationship betweenCt and target nifH genes in the standards was alsogenerally consistent among the 4 primer and probesets (Fig. 4A). The least-squares linear regression ofthe standard curve for all phylotypes was Ct = –3.27(log10 nifH gene copies) + 39.9 (R2 = 0.95, p < 0.0001),with the coefficient of variation of the log10-trans-formed standards averaging 5%.
The specificities of the QPCR primers and probesused in this study were tested by the addition of plas-mids containing non-target, cloned nifH PCR productsto QPCR reactions and evaluating whether any ofthe non-target nifH PCR products demonstrated cross-reactivity with the QPCR probes and primers (Table 1).
9
Fig. 3. Neighbor-joining phyloge-netic relationships of (A) nifH-con-taining cyanobacteria and (B) Clus-ter III nifH genes at Stn ALOHA.Nucleotide sequences aligned usinghidden Markov model built itera-tively with HMMER 2.2. Sequencesin boldface were used for develop-ment of QPCR probes and primers inthis study. Genbank accession num-bers are shown. Phylogenetic rela-tionships were bootstrapped 1000times, and bootstrap values greater
than 50% are shown
A
B

Aquat Microb Ecol 38: 3–14, 2005
When <105 non-target nifH gene copies were added toeach reaction, no significant amplification was detectedafter 45 PCR cycles (Table 1). This procedure has adetection limit of ~1 nifH gene copy per reaction.
Overall, the presence of environmental DNA did notsignificantly alter the amplification of the plasmidpositive controls, indicating that PCR inhibition did notinfluence the amplification of nifH DNA in the envi-ronmental samples. QPCR reactions containing DNAadditions between 0.2 and 12 ng DNA demonstratedthe predicted logarithmic relationship between targetgene abundance and Ct (Fig. 4B), implying that withinthis range of DNA, the measured Ct values wereproportional to the amount of DNA added to eachreaction.
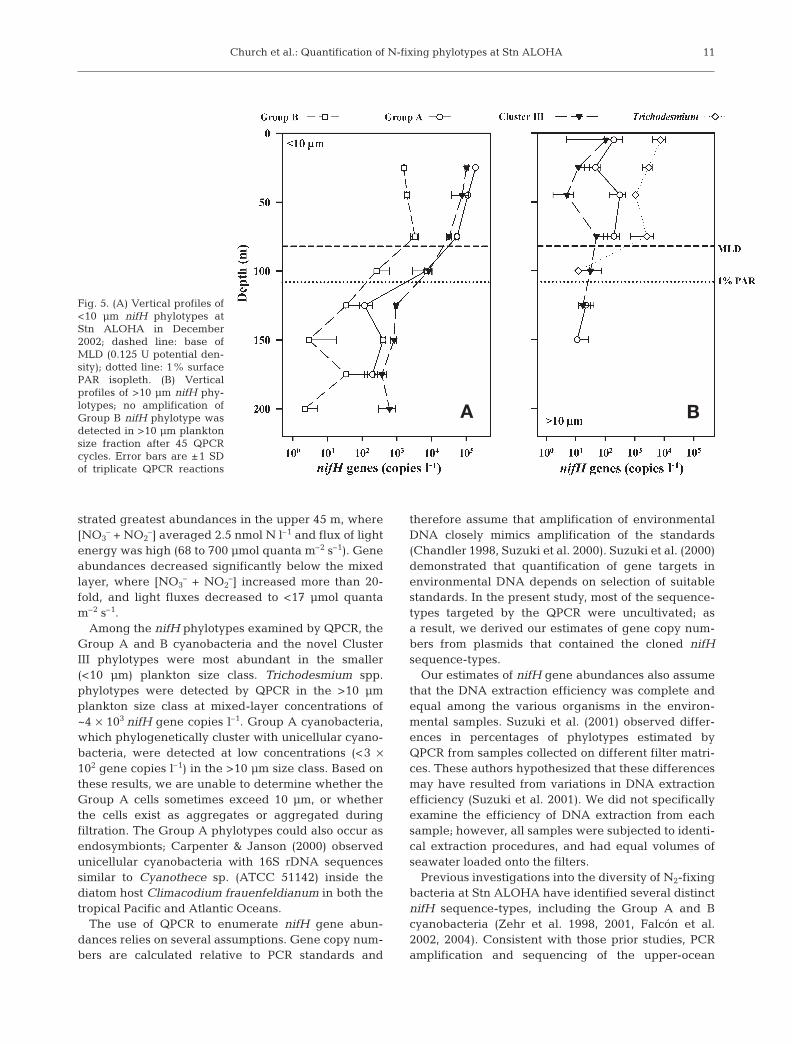
The relative abundances of all 4 nifH phylotypesdemonstrated large variations with depth, with greaternifH gene abundances in the upper 50 m of the photiczone, declining substantially with depth (Fig. 5). Theaverage mixed-layer abundance of the nifH gene fromGroup A cyanobacteria in the <10 µm plankton sizeclass was 1 × 10⁵ copies l–1, decreasing to 2 × 10² copiesl–1 beneath the photic zone (Fig. 5A). Mixed-layer con-centrations of Group A nifH genes in the >10 µm plank-ton size fraction averaged 1 × 10² nifH copies l–1 (Fig. 5B).
The abundance of Group B cyanobacteria in the<10 µm plankton size class was approximately 2 ordersof magnitude less than Group A, averaging 2 × 10³
nifH copies l–1 in the mixed layer, declining to <3 ×
102 copies l–1 below the photic zone (Fig. 5A). Tricho-desmium spp. phylotypes were only detected by QPCRin the mixed layer from the >10 µm plankton size frac-tion (Fig. 5B). Mixed-layer abundance of Trichodes-mium spp. averaged 4 × 10³ copies l–1, becoming unde-tectable (<1 gene copy per reaction) below the photiczone (Fig. 5B). The Cluster III nifH phylotype in the<10 µm size class averaged 7 × 10⁴ copies l–1 in themixed layer, but beneath the photic zone the Cluster IIInifH phylotype was the most abundant of the phylo-types examined in this study (5 × 10² copies l–1) (Fig. 5A).The Cluster III nifH phylotype was also detectable inthe >10 µm plankton size class, but at low abundance(ranging from 5 × 10² to 1 × 10² copies l–1) (Fig. 5B). Thesum of the depth-integrated gene abundances for all4 nifH phylotypes was ~1. 5 × 10¹⁰ nifH copies m–2.
DISCUSSION
While diverse species of oceanic microorganismsappear capable of N2-fixation (Zehr et al. 1998, 2001),to date there is little information on the abundance ofspecific diazotrophs in the open ocean. In this study,we utilized TaqMan® assays to quantify the abundanceand vertical distributions of nifH genes correspondingto 4 upper-ocean nifH phylotypes. As employed in thisstudy, detection of nifH genes indicates the geneticpotential for N2 fixation. All 4 nifH phylotypes demon-
10
Fig. 4. (A) Standard curves of nifH QPCR probes and primers used in this study; continuous line: least-squares linear regression ofamplification cycle threshold (Ct) versus logarithm of nifH gene copies; dashed lines: 95% confidence intervals of the regression;error bars are ±1 SD of mean of triplicate reactions. (B) Relationships between environmental DNA and amplification cyclethreshold (Ct) at Stn ALOHA; lines: least-squares linear regressions of log10 environmental DNA versus amplification Ct; least-squares regression of Group B nifH phylotype is Ct = –2.84 (log10 environmental DNA) + 38.7 (R2 = 0.99, p < 0.0001); least-squaresregression of Cluster III nifH phylotype is Ct = –3.19 (log10 environmental DNA) + 37.1 (R2 = 0.99, p < 0.0001); least-squares
regression of Group A nifH phylotype is Ct = –3.75 (log10 environmental DNA) + 33.0 (R2 = 0. 95, p < 0.0001)
BA
Church et al.: Quantification of N-fixing phylotypes at Stn ALOHA
strated greatest abundances in the upper 45 m, where[NO3
– + NO2–] averaged 2.5 nmol N l–1 and flux of light
energy was high (68 to 700 µmol quanta m–2 s–1). Geneabundances decreased significantly below the mixedlayer, where [NO3
– + NO2–] increased more than 20-
fold, and light fluxes decreased to <17 µmol quantam–2 s–1.
Among the nifH phylotypes examined by QPCR, theGroup A and B cyanobacteria and the novel ClusterIII phylotypes were most abundant in the smaller(<10 µm) plankton size class. Trichodesmium spp.phylotypes were detected by QPCR in the >10 µmplankton size class at mixed-layer concentrations of~4 × 10³ nifH gene copies l–1. Group A cyanobacteria,which phylogenetically cluster with unicellular cyano-bacteria, were detected at low concentrations (<3 ×10² gene copies l–1) in the >10 µm size class. Based onthese results, we are unable to determine whether theGroup A cells sometimes exceed 10 µm, or whetherthe cells exist as aggregates or aggregated duringfiltration. The Group A phylotypes could also occur asendosymbionts; Carpenter & Janson (2000) observedunicellular cyanobacteria with 16S rDNA sequencessimilar to Cyanothece sp. (ATCC 51142) inside thediatom host Climacodium frauenfeldianum in both thetropical Pacific and Atlantic Oceans.
The use of QPCR to enumerate nifH gene abun-dances relies on several assumptions. Gene copy num-bers are calculated relative to PCR standards and
therefore assume that amplification of environmentalDNA closely mimics amplification of the standards(Chandler 1998, Suzuki et al. 2000). Suzuki et al. (2000)demonstrated that quantification of gene targets inenvironmental DNA depends on selection of suitablestandards. In the present study, most of the sequence-types targeted by the QPCR were uncultivated; asa result, we derived our estimates of gene copy num-bers from plasmids that contained the cloned nifHsequence-types.
Our estimates of nifH gene abundances also assumethat the DNA extraction efficiency was complete andequal among the various organisms in the environ-mental samples. Suzuki et al. (2001) observed differ-ences in percentages of phylotypes estimated byQPCR from samples collected on different filter matri-ces. These authors hypothesized that these differencesmay have resulted from variations in DNA extractionefficiency (Suzuki et al. 2001). We did not specificallyexamine the efficiency of DNA extraction from eachsample; however, all samples were subjected to identi-cal extraction procedures, and had equal volumes ofseawater loaded onto the filters.
Previous investigations into the diversity of N2-fixingbacteria at Stn ALOHA have identified several distinctnifH sequence-types, including the Group A and Bcyanobacteria (Zehr et al. 1998, 2001, Falcón et al.2002, 2004). Consistent with those prior studies, PCRamplification and sequencing of the upper-ocean
11
Fig. 5. (A) Vertical profiles of<10 µm nifH phylotypes atStn ALOHA in December2002; dashed line: base ofMLD (0.125 U potential den-sity); dotted line: 1% surfacePAR isopleth. (B) Verticalprofiles of >10 µm nifH phy-lotypes; no amplification ofGroup B nifH phylotype wasdetected in >10 µm planktonsize fraction after 45 QPCRcycles. Error bars are ±1 SDof triplicate QPCR reactions
BA
Aquat Microb Ecol 38: 3–14, 2005
plankton assemblage in the present study revealedseveral nifH phylotypes, including sequences closelyrelated to Trichodesmium spp., the previously identi-fied Group A and B unicellular cyanobacteria, and anovel Cluster III nifH phylotype.
Both the Group A and B cyanobacteria have beenshown to express nifH at Stn ALOHA, suggesting thatthese groups may be actively involved in N2-fixation(Zehr et al. 2001, Falcón et al. 2004). The Group B nifHDNA sequences are most similar (93 to 99%) to thenifH DNA sequence of marine Crocosphaera watsonii,while Group A nifH DNA sequences are most closelyaligned (~82%) with Cyanothece sp. (ATCC 51142).Both C. watsonii and Cyanothece sp. typically rangefrom 2 to 10 µm in diameter (Reddy et al. 1993, Rippkaet al. 2001), and both appear to temporally decoupleN2-fixation from photosynthesis (Sherman et al. 1998).
The recently sequenced genomes of Crocosphaerawatsonii and Trichodesmium erythraeum indicate thateach of these microorganisms contains a single nifHgene copy per genome (see www.jgi.doe.gov). Basedon QPCR amplification, we estimate that the mixed-layer cellular abundances of Group B phylotype aver-aged ~103 cells l–1. Assuming that the Group A phylo-type also contains a single copy of nifH, mixed-layerGroup A abundances would have averaged ~105 cellsl–1. These abundance estimates are consistent withprevious enumerations of 2 to 10 µm unicellular, PE-containing cyanobacteria in the oligotrophic PacificOcean. Ishizaka et al. (1994) observed a population of2 to 4 µm sized PE-containing coccoid cyanobacteria atconcentrations ranging from ~105 to 106 cells l–1 alonga meridional survey between 14 and 26° N in the cen-tral North Pacific Ocean. Similarly, Campbell et al.(1997) found 3 to 5 µm diameter Synechocystis sp.-likecells at Stn ALOHA at concentrations varying from 103
to 106 cells l–1. In the South Pacific, Neveux et al. (1999)observed 2 to 3 µm diameter cyanobacteria at concen-trations of ~105 cells l–1 in the upper 60 m of the water,and Falcón et al. (2004) estimated that the abundanceof 3 to 7 µm unicellular cyanobacteria at Stn ALOHAaveraged ~104 cells l–1.
Prior to the discovery of unicellular N2-fixing cyano-bacteria, Trichodesmium spp. was believed to be thedominant marine diazotroph in the open ocean. Basedon 3 yr of microscopic enumerations, Letelier & Karl(1996) estimated that Trichodesmium spp. abundancein the upper 45 m at Stn ALOHA ranged from ~1 × 10³
to 9 × 10³ cells l–1, consistent with previous reports(Carpenter 1983). Based on QPCR amplification ofTrichodesmium spp. phylotypes, we estimate that themixed-layer gene abundances of Trichodesmium spp.averaged 3 × 10³ nifH copies l–1 during this cruise.These results suggest that, at times, the nifH geneabundances of the unicellular cyanobacterial Groups
A and B can be similar to or exceed that of Tricho-desmium spp. Supporting these results, concentrationsof the <10 µm PE-containing plankton were approxi-mately 1 order of magnitude greater than the >10 µmsize classes, suggesting that unicellular cyanobacteriawere substantially more abundant than the largerfilamentous, colony-forming cyanobacterium Tricho-desmium spp. during this cruise.
In addition to evaluating the distributions of nifH-containing cyanobacteria, we also quantified the abun-dance of a Cluster III nifH phylotype. Previous studieshave retrieved Cluster III nifH sequences from PCRclone libraries for the open ocean. For example, Zehr etal. (1998) and Braun et al. (1999) found Cluster III nifHsequences in PCR-amplified DNA extracted from zoo-plankton biomass in the Gulf of Mexico and easternCaribbean, leading these authors to hypothesize thatoceanic invertebrates might host diazotrophs. To ourknowledge, the present study is the first to haveretrieved Cluster III nifH sequences from <10 µmplankton in the surface waters of the open ocean.Conceivably, the Cluster III nifH prokaryotes couldexist in O2-reduced microenvironments in the upperocean, e.g. attached to large particles or within thefood vacuoles of microzooplankton. However, QPCRamplification of the Cluster III nifH gene in the >10 µmsize fraction revealed low gene abundances (<102 nifHcopies l–1).
Diazotrophic prokaryotes that phylogenetically groupwith the Cluster III nifH sequences include strictanaerobes such as Desulfovibrio spp., spirochetes,archaeal methanogens Methanosarcina spp., andphototrophic green-sulfur bacteria Chlorobium tepidum(Young 1992, Zehr et al. 2003). The depth distributionof the Cluster III phylotype resembles the depth distri-bution of the Crenarchaeota sp. at Stn ALOHA (Karneret al. 2001); however, the Cluster III nifH sequence-type clusters more closely with green-sulfur bacteriaand the spirochetes than with archaeal nifH se-quences. Moreover, a recent study characterizing thediversity of nifH phylotypes in the deep (2200 m)waters of the North Pacific found only Cluster II nifHphylotypes (Mehta et al. 2003). The Cluster III nifHsequences retrieved in this study could also havederived from green-sulfur bacteria; 16S rRNA se-quences similar to those of Chlorobium spp. (SAR406)have been retrieved from the oligotrophic SargassoSea (Gordon & Giovannoni 1996). Based solely on nifHsequence information and the phylotype depth distrib-ution it is difficult to judge the ecological and biogeo-chemical significance of this Cluster III phylotype.
Unicellular N2-fixing bacteria may serve an impor-tant role in the introduction of new N to open-oceanmicrobial food webs. Unicellular plankton populationsappear tightly regulated by top-down control (Caron et
12
Church et al.: Quantification of N-fixing phylotypes at Stn ALOHA
al. 1991, Landry & Kirchman 2002); such trophody-namic pressures could support a significant fraction ofnutrient regeneration in the upper ocean. Trophictransfer of N fixed by diazotrophic bacteria may pro-vide a source of N that partly supports microbial foodwebs. Moreover, the low surface-area-to-volume ratioof unicellular cyanobacteria probably facilitates theirability to compete for nutrients in the oligotrophicocean. While episodic blooms by large colonialcyanobacteria such as Trichodesmium spp. and dia-toms with endosymbiotic N2-fixing cyanobacteria un-doubtedly support a significant fraction of export pro-ductivity at Stn ALOHA (Letelier & Karl 1996, Karl etal. 1997), the occurrence of these blooms appearslinked to aeolian iron deposition (Karl 2002, Karl et al.2003); the relatively small size of unicellular dia-zotrophs may enable sustained N2-fixation in theabsence of infrequent dust-deposition events, and pro-vide a regular source of N to upper-ocean microbialfood webs.
Acknowledgements. We are grateful to the captain and crewof the RV ‘Kilo Moana’ for assistance at sea. We thank R. R.Bidigare (University of Hawaii) for organizing the researchcruise and extending the opportunity for us to participate inthis special-focus HOT cruise. S. M. Short, C. M. Short, andE. O. Omoregie provided insights into the nifH QPCR assays.This project was supported by NSF grants to J.P.Z. (OCE9977460 and OCE 0132638) and D.M.K. (OCE 0326616).
LITERATURE CITED
Braun ST, Proctor LM, Zani S, Mellon MT, Zehr JP (1999)Molecular evidence for zooplankton-associated nitrogen-fixing anaerobes based on amplification of the nifH gene.FEMS Microbiol Lett 28:273–279
Campbell L, Vaulot D (1993) Photosynthetic picoplankton com-munity structure in the subtropical North Pacific-Oceannear Hawaii (Stn ALOHA). Deep-Sea Res I 40:2043–2060
Campbell L, Liu H, Nolla HA, Vaulot D (1997) Annualvariability of phytoplankton and bacteria in the subtropi-cal North Pacific Ocean at Station ALOHA during the1991–1994 ENSO event. Deep-Sea Res I 44:167–192
Capone DG, Zehr JP, Paerl HW, Bergman B, Carpenter EJ(1997) Trichodesmium, a globally significant marine cyano-bacterium. Science 276:1221–1229
Caron DA, Lim EL, Miceli G, Waterbury JB, Valois FW (1991)Grazing and utilization of chroococcoid cyanobacteria andheterotrophic bacteria by protozoa in laboratory culturesand a coastal plankton community. Mar Ecol Prog Ser 76:205–217
Carpenter EJ (1983) Nitrogen fixation by marine Oscillatoria(Trichodesmium) in the world’s oceans. In: Carpenter EJ,Capone DG (eds) Nitrogen in the marine environment.Academic Press, New York, p 65–103
Carpenter EJ, Janson S (2000) Intracellular cyanobacterialsymbionts in the marine diatom Climacodium frauenfel-dianum (Bacillariophyceae). J Phycol 36:540–544
Carpenter EJ, Montoya JP, Burns J, Mulholland MR, Subra-maniam A, Capone DG (1999) Extensive bloom of a N2-fixing diatom/cyanobacterial association in the tropical
Atlantic Ocean. Mar Ecol Prog Ser 185:273–283Chandler DP (1998) Redefining relativity: quantitative PCR
at low template concentrations for industrial and envi-ronmental microbiology. J Ind Microbiol Biotechnol 21:128–140
Deutsch C, Gruber N, Key RM, Sarmiento JL, Ganachaud A(2001) Denitrification and N2 fixation in the Pacific Ocean.Global Biogeochem Cycles 15:483–506
Dore JE, Karl DM (1996) Nitrification in the euphotic zoneas a source for nitrite, nitrate, and nitrous oxide at StationALOHA. Limnol Oceanogr 41:1619–1628
Dore JE, Brum JR, Tupas LM, Karl DM (2002) Seasonal andinterannual variability in sources of nitrogen supportingexport in the oligotrophic subtropical North Pacific Ocean.Limnol Oceanogr 47:1595–1607
Dugdale RC, Goering JJ (1967) Uptake of new and regener-ated forms of nitrogen in primary productivity. LimnolOceangr 12:196–206
Eppley RW, Peterson BJ (1979) Particulate organic-matter fluxand planktonic new production in the deep ocean. Nature282:677–680
Falcón LI, Cipriano F, Chistoserdov AY, Carpenter EJ (2002)Diversity of diazotrophic unicellular cyanobacteria in thetropical North Atlantic Ocean. Appl Environ Microbiol 68:5760–5764
Falcón LI, Carpenter EJ, Cipriano F, Bergman B, Capone DG(2004) N2 fixation by unicellular bacterioplankton from theAtlantic and Pacific oceans: phylogeny and in situ rates.Appl Environ Microbiol 70:765–770
Falkowski PG (1997) Evolution of the nitrogen cycle and itsinfluence on the biological sequestration of CO2 in theocean. Nature 387:272–275
Garside C (1982) A chemiluminescent technique for the de-termination of nanomolar concentrations of nitrate andnitrite in sea-water. Mar Chem 11:159–167
Gordon DA, Giovannoni SJ (1996) Detection of stratifiedmicrobial populations related to Chlorobium and Fibro-bacter species in the Atlantic and Pacific Oceans. ApplEnviron Microbiol 62:1171–1177
Gruber N, Sarmiento JL (1997) Global patterns of marinenitrogen fixation and denitrification. Global BiogeochemCycles 11:235–266
Ishizaka J, Kiyosawa H, Ishida K, Ishikawa K, Takahashi M(1994) Meridional distribution and carbon biomass ofautotrophic picoplankton in the Central North PacificOcean during late northern summer 1990. Deep-Sea Res I41:1745–1766
Karl DM (1999) A sea of change: biogeochemical variability inthe North Pacific Subtropical Gyre. Ecosystems 2:181–214
Karl DM (2002) Nutrient dynamics in the deep blue sea.Trends Microbiol 10:410–418
Karl DM, Letelier R, Tupas L, Dore J, Christian J, Hebel D(1997) The role of nitrogen fixation in biogeochemicalcycling in the subtropical North Pacific Ocean. Nature388:533–538
Karl DM, Bates NR, Emerson S, Harrison PJ and 9 others(2003) Temporal studies of biogeochemical processesdetermined from ocean time-series observations duringthe JGOFS era. In: Fasham MJ (ed) Ocean biogeochem-istry: the role of the ocean carbon cycle in global change.Springer-Verlag, Berlin, p 239–267
Karner MB, DeLong EF, Karl DM (2001) Archaeal dominancein the mesopelagic zone of the Pacific Ocean. Nature 409:507–510
Landry MR, Kirchman DL (2002) Microbial community struc-ture and variability in the tropical Pacific. Deep-Sea Res II49:2669–2693
13
Aquat Microb Ecol 38: 3–14, 2005
Lee K, Karl DM, Wanninkhof R, Zhang JZ (2002) Global esti-mates of net carbon production in the nitrate-depletedtropical and subtropical oceans. Geophys Res Lett 29:doi:10.1029/2001GLO14198
Letelier RM, Karl DM (1996) Role of Trichodesmium spp. inthe productivity of the subtropical North Pacific Ocean.Mar Ecol Prog Ser 133:263–273
Letelier RM, Karl DM, Abbott MR, Flament P, Freilich M,Lukas R, Strub T (2000) Role of late winter mesoscaleevents in the biogeochemical variability of the upperwater column of the North Pacific Subtropical Gyre.J Geophys Res C 105:28723–28739
Lundgren P, Soderback E, Singer A, Carpenter EJ, BergmanB (2001) Katagnymene: characterization of a novel marinediazotroph. J Phycol 37:1052–1062
Mehta MP, Butterfield DA, Baross JA (2003) Phylogeneticdiversity of nitrogenase (nifH) genes in the deep-sea andhydrothermal vent environments of the Juan de Fucaridge. Appl Environ Microbiol 69:960–970
Michaels AF, Olson D, Sarmiento JL, Ammerman JW and 5others (1996) Inputs, losses and transformations of nitro-gen and phosphorus in the pelagic North Atlantic Ocean.Biogeochemistry 35:181–226
Monger BC, Landry MR (1993) Flow cytometric analysisof marine-bacteria with Hoechst 33342. Appl EnvironMicrobiol 59:905–911
Monterey G, Levitus S (1997) Seasonal variability of mixedlayer depth for the world ocean. NOAA Atlas NESDIS 14,US Government Printing Office, Washington, DC
Montoya JP, Holl CM, Zehr JP, Hansen A, Villareal TA,Capone DG (2004) High rates of N2-fixation by unicellulardiazotrophs in the oligotrophic Pacific. Nature 430:1027–1032
Neveux J, Lantoine F, Vaulot D, Marie D, Blanchot J (1999)Phycoerythrins in the southern tropical and equatorialPacific Ocean: evidence for new cyanobacterial types.J Geophys Res C 104:3311–3321
Reddy KJ, Haskell JB, Sherman DM, Sherman LA (1993)Unicellular, aerobic nitrogen-fixing cyanobacteria of thegenus Cyanothece. J Bacteriol 175:1284–1292
Rippka R, Castenholz RW, Waterbury JB, Herdman M (2001)Form-genus V. Cyanothece. In: Garrity GM (ed) Bergey’smanual of systematic bacteriology, Vol 2. Springer-Verlag,New York, p 501
Sakamoto CM, Karl DM, Jannasch HW, Bidigare RR and 5others (2004) Influence of Rossby waves on nutrientdynamics and the plankton community structure in theNorth Pacific subtropical gyre. J Geophys Res Oceans 109;C05032, doi: 10:1029/2003JCOO1976
Sherman LA, Meunier P, Colon-Lopez MS (1998) Diurnalrhythms in metabolism: a day in the life of a unicellular,diazotrophic cyanobacterium. Photosynth Res 58:25–42
Short SM, Jenkins BD, Zehr JP (2004) The spatial and tem-poral distribution of two diazotrophic bacteria in the
Chesapeake Bay. Appl Environ Microbiol 70:2186–2192Steward GF, Zehr JP, Jellison R, Montoya JP, Hollibaugh JT
(2004) Vertical distribution of nitrogen-fixing phylotypesin a meromictic, hypersaline lake. Microb Ecol 46:30–40
Suzuki MT, Taylor LT, DeLong EF (2000) Quantitative ana-lysis of small-subunit rRNA genes in mixed microbial pop-ulations via 5’-nuclease assays. Appl Environ Microbiol66:4605–4614
Suzuki MT, Preston CM, Chavez FP, DeLong EF (2001) Quan-titative mapping of bacterioplankton populations in sea-water: field tests across an upwelling plume in MontereyBay. Aquat Microb Ecol 24:117–127
Tillett D, Neilan BA (2000) Xanthogenate nucleic acid iso-lation from cultured and environmental cyanobacteria.J Phycol 36:251–258
Venrick EL (1974) The distribution and significance of Riche-lia intracellularis Schmidt in the North Pacific CentralGyre. Limnol Oceangr 19:437–445
Villareal TA (1991) Nitrogen-fixation by the cyanobacterialsymbiont of the diatom genus Hemiaulus. Mar Ecol ProgSer 76:201–204
Weare NM, Azam F, Mague TH, Holm-Hansen O (1974)Microautoradiographic studies of the marine phycobiontsRhizosolenia and Richelia. J Phycol 10:369–371
Wyman M (1992) An in vivo method for the estimation ofphycoerythrin concentrations in marine cyanobacteria(Synechococcus spp.). Limnol Oceangr 37:1300–1306
Young JPW (1992) Phylogenetic classification of nitrogen-fixing organisms. In: Stacey G, Burris RH, Evans HJ (eds)Biological nitrogen fixation. Chapman & Hall, New York,p 43–86
Zehr JP, Capone DG (1996) Problems and promises of assay-ing the genetic potential for nitrogen fixation in themarine environment. Microb Ecol 32:263–281
Zehr JP, McReynolds LA (1989) Use of degenerate oligo-nucleotides for amplification of the nifH gene from themarine cyanobacterium Trichodesmium thiebautii. ApplEnviron Microbiol 55:2522–2526
Zehr JP, Turner PJ (2001) Nitrogen fixation: nitrogenasegenes and gene expression. In: Paul JH (ed) Methods inmicrobiology, Vol 30. Academic Press, San Diego, CA,p 271–286
Zehr JP, Mellon MT, Zani S (1998) New nitrogen-fixingmicroorganisms detected in oligotrophic oceans by ampli-fication of nitrogenase (nifH) genes. Appl Environ Micro-biol 64:3444–3450
Zehr JP, Waterbury JB, Turner PJ, Montoya JP, Omoregie E,Steward GF, Hansen A, Karl DM (2001) Unicellular cyano-bacteria fix N2 in the subtropical North Pacific Ocean.Nature 412:635–638
Zehr JP, Jenkins BD, Short SM, Steward GF (2003) Nitro-genase gene diversity and microbial community struc-ture: a cross-system comparison. Environ Microbiol 5:539–554
14
Editorial responsibility: David Caron, Los Angeles, California, USA
Submitted: March 8, 2004; Accepted: August 15, 2004Proofs received from author(s): December 27, 2004


![[Pearl Bridge] 淡路IC/SA Awaji IC/SAAkashi Stn. Akashi Port Nishi-Akashi Stn. Kakogawa Stn. Himeji Stn. Iwaya Port Maiko Stn. Nushima Port Ohnaruto Bridge Kansai International Airport](https://img.pdfslide.us/doc/110x75/5e5c05eec7044819c25233b8/pearl-bridge-eicsa-awaji-icsa-akashi-stn-akashi-port-nishi-akashi-stn.jpg)