Embed Size (px)
Citation preview
Healthy Aging Research | www.har-journal.com Bagepally et al. 2016 | 5:6 1
Vertex-wise shape analysis of subcortical structures in Alzheimer’s disease Bhavani S. Bagepally 1*, John P. John 1, Palanimuthu T. Sivakumar 1, Srikala Bharath 1, Sanjeev Jain 1, Mathew Varghese 2 1 Department of Psychiatry, National Institute of Mental Health and Neurosciences (NIMHANS), Bangalore, India 2 Regional Occupational Health Centre (Southern), NIOH-ICMR, Nirmal Bhawan Complex, Bangalore, India
Abstract
Background: Most MRI studies in Alzheimer’s disease (AD) have focused on cortical and hippocampal atrophy. This study, however, examines regional volumetric and shape abnormalities of subcortical and limbic structures in AD.
Methods: Thirty-six patients with AD and 36 matched controls were included in the study. All subjects were right-handed, evaluated using standard clinical assessment scales and genotyped at ApoE locus. Structural T1-weighted images were acquired using 3 Tesla MRI. Vertex-wise shape analysis was performed, with age, gender and total brain volume used as covariates of no interest. Data on the volumes of the hippocampus, amygdala, caudate, putamen and thalamus were statistically analyzed.
Results: The bilateral hippocampus, amygdala, caudate, putamen and thalamus of AD patients were significantly lower in volume than controls. With respect to ApoE4 carrier status, there were no within-group volumetric differences in either AD or controls. Vertex-wise shape analysis of AD patients revealed significant surface reductions at the bilateral hippocampus, amygdala, caudate and putamen. No shape-wise difference was observed between ApoE4 carrier and non-carrier subjects in either group. Correlation analysis revealed a significant negative correlation between the Hindi mental status examination score, and shape analysis of atrophy of the hippocampus, caudate and putamen.
Conclusions: Significant volume reductions and shape differences were observed in subcortical and limbic structures in AD patients. The observed atrophy of neocortical and deep grey matter structures in AD patients indicates ongoing degenerative processes in the amygdala, caudate and putamen – similar to the hippocampus – which may contribute to cognitive and/or other clinical features in AD. Citation: Bagepally BS, John JP, Sivakumar PT, Bharath S, Jain S, Varghese M (2016) Vertex-wise shape analysis of subcortical structures in Alzheimer’s disease. Healthy Aging Research 5:6.
Received: November 6, 2015; Accepted: April 11, 2016; Published: June 15, 2016
Copyright: © 2016 Bagepally et al. This is an open access article distributed under the terms of the Creative Commons Attribution License, which permits unrestricted use, distribution, and reproduction in any medium, provided the original work is properly cited.
Competing interests: The authors have declared that no competing interests exist.
Sources of funding: This study was partially supported by grants received from ICMR and the Department of Biotechnology, India. * Email: [email protected]
Introduction The majority of MRI studies in Alzheimer’s disease (AD) have focused on the roles of cortical and hippocampal atrophy in higher cognitive functions and memory processes, respectively. The basal nuclei
and thalamus have received less attention. However, even in early stages of AD, histopathological studies have observed the involvement of subcortical deep gray matter (GM) structures such as amyloid depositions in the striatum [1] among presenilin-1 (PS1) mutation carriers [2]. These studies indicate that
Healthy Aging Research | www.har-journal.com Bagepally et al. 2016 | 5:6 2
the striatum is prone to AD pathology. Studies have also reported changes in ventricular shape in the areas adjacent to the amygdala, thalamus, and caudate nucleus in subjects with AD, indicating the atrophy of these subcortical structures [3]. Besides alterations in the hippocampus and amygdala, these degenerative changes in deep GM structures, , may also occur during the disease process and may thus contribute to cognitive as well non-cognitive clinical presentation in AD.
Earlier imaging studies have identified several AD biomarkers such as hippocampal atrophy [4], amygdalar atrophy [5], medial temporal lobe atrophy [6, 7], precuneus atrophy [8], and global GM atrophy [9]. Direct measurement of the caudate nucleus in subjects with AD revealed diminished volumes, although proportionate to whole brain atrophy [10]. Atrophy of the thalamus has also been associated with cognitive decline in other neurodegenerative disorders such as multiple sclerosis, Huntington’s disease and Lewy-Body dementia [11–13]. Although little is known about the specific role of subcortical and thalamic structures in cognitive processes, it is well recognized that the thalamus is essential for generating attention [14] and its anterior and medial nuclei are involved in declarative memory functioning [15]. Studies using magnetic resonance imaging (MRI) to comprehensively compare both volumes and shapes of subcortical structures in AD are limited [16]. The current study aims to assess whether the volumes of atrophic subcortical structures in subjects with AD are different, and to localize the surface morphometric changes of these subcortical structures. Differences in shape and volume of subcortical regions were evaluated using a validated and automated segmentation toolbox: the Integrated Registration and Segmentation Tool (FIRST) developed by the Oxford Centre for Functional MRI of the Brain (FMRIB) [17].
Methods Participants and ethics
Thirty-six subjects with probable AD, diagnosed according to criteria set by the National Institute of Neurological and Clinical Disorders/Stroke and Alzheimer’s Disease and Related Disorders
Association (NINCDS/ADRDA) [18] and attending the National Institute of Mental Health and Neurosciences (NIMHANS), were selected for this study, along with 36 healthy, age and gender-matched controls. Brain MRI data was obtained for each participant. All AD subjects had been on anti-cholinesterase inhibitor treatment for less than 2 months at the time of MRI. Exclusion criteria were: dementias other than AD, current or past history of coexisting neurological or psychiatric disorders, head injury, and alcohol abuse. Control subjects were matched for all exclusion criteria, and had no first-degree relatives with a history suggestive of dementia. All subjects were right-handed. Subjects were initially evaluated in detail by the clinician (BSB), and findings confirmed by senior consultants (MV, SB, PTS). Written informed consent to participate in the study was provided by subjects or (or their caregivers, in the case of some AD patients). The study was approved by the institutional ethics committee.
Clinical assessments and ApoE4 genotyping
All subjects were cognitively evaluated using the Hindi Mental Status Examination (HMSE) [19]; the Everyday Abilities Scale for India (EASI) [20] was used to assess daily living activities. Used as part of a larger, ongoing research program at NIMHANS, the Clinical Dementia Rating (CDR) Scale [21] was used to assess the severity of AD to inform patient recruitment [22], and a venous blood sample was taken to determine ApoE genotype [22]. No DNA was extracted from the blood sample of one AD subject, thus ApoE status was present for 35 AD subjects.
Image acquisition
MRI data was acquired using the Phillips Achieva 3 Tesla MRI system at NIMHANS. Routine conventional T1-weighted (T1W), T2-weighted (T2W) and fluid attenuation inversion recovery (FLAIR) images were acquired, as well as the T1W magnetization prepared rapid gradient echo (MPRAGE) sequence covering the whole brain (Orientation: sagittal; field of view [FOV]: 256 x 256 x 155 mm; voxel size: 1 x 1 x 1 mm; slice thickness: 1 mm; acquisition matrix: 256 x 256; repetition time
Healthy Aging Research | www.har-journal.com Bagepally et al. 2016 | 5:6 3
[TR]: 8.1 ms; echo time [TE]: 3.7 ms; flip angle: 8º; sense factor: 3.5; total scan time: 7 min 41 sec).
Image analysis of regions of interest in subcortical structures
Individual measures of hippocampus, amygdala, thalamus, caudate and putamen volumes were obtained using FIRST, an automatic subcortical segmentation program [17]. Boundary correction was used to classify boundary voxels. Regions of interest were visually inspected in the coronal plane to ensure accuracy. Brain tissue volumes such as GM, white matter (WM) and total brain volume (TBV) normalized for each subject’s head size were estimated using Structural Image Evaluation, using Normalization, of Atrophy (SIENA) software (FMRIB Software Library, http://fsl.fmrib.ox.ac.uk/fsl/fslwiki/SIENA [23]).
Vertex-wise shape analysis was performed using FIRST with age, gender and TBV as covariates of no interest in the statistical design at p ≤ 0.05 (FDR corrected). Volumes of the hippocampus, amygdala, thalamus, caudate and putamen were calculated.
Statistical analysis
Statistical comparison of subcortical structure volume data was performed using R software (http://www.r-project.org/). The Chi-square test was used to compare discrete variables, and the independent sample t-test was used to compare continuous variables. The Bonferroni correction was used to compare the volumetric data of subcortical structures across multiple tests. For all ApoE-related analysis, 35 AD subjects were compared with the controls.
Results Clinical scores and volumetric data are shown in Table 1. ApoE genotyping data were available for 35 subjects with AD and all 36 control subjects. The distribution of ApoE genotypes among patients with AD is tabulated in Table 2. Subjects with AD had significantly lower volumes of their bilateral hippocampus, amygdala, caudate and putamen (all p ≤
0.01, Bonferroni corrected). Taken together (including AD subjects and controls), ApoE4 carriers had a reduction in volume of their bilateral hippocampus (p ≤ 0.05) and right amygdala (p ≤ 0.05) compared with non-carriers. However, after correcting for multiple testing, these differences did not emerge as statistically significant. These volumes did not differ between ApoE4 carriers and non-carriers within individual groups of AD subjects or controls. Volumetric comparison revealed that greater volumes were lost on the left side compared with the right side in all structures except for the amygdala, which showed the opposite pattern (R volume < L volume). However these trends were not statistically significant.
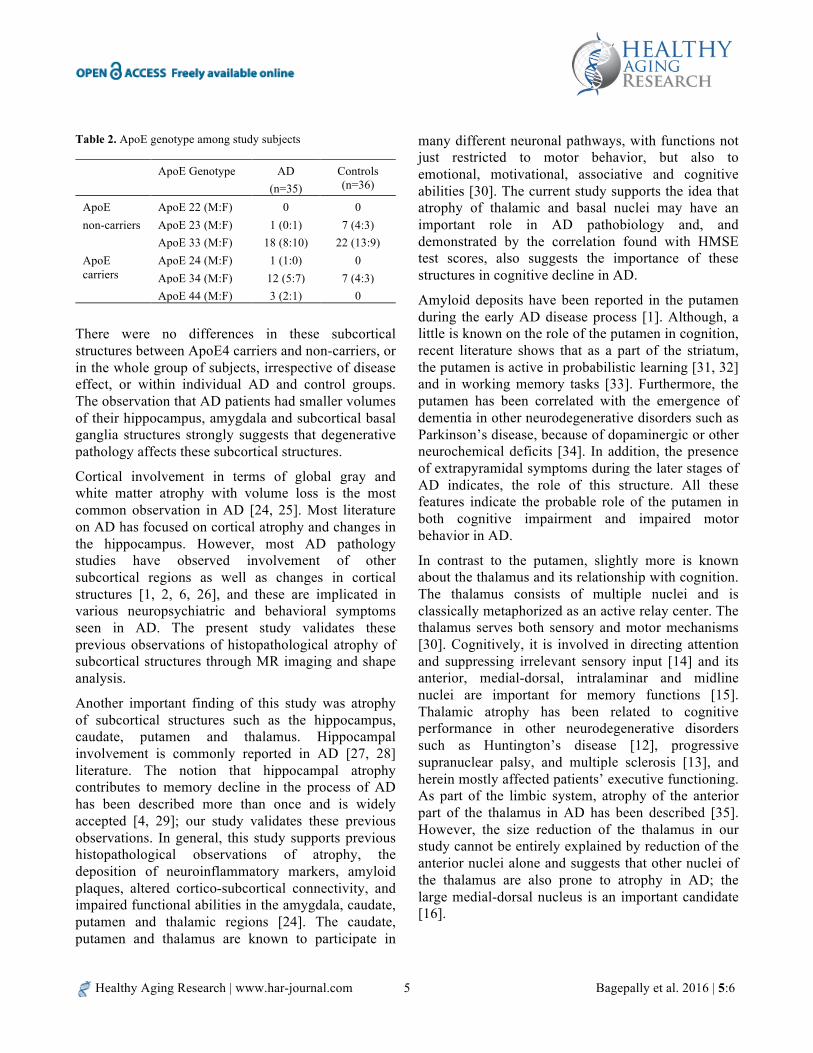
In vertex-wise shape analysis, subjects with AD had significant surface reduction of their bilateral hippocampus, amygdala, caudate and putamen (Figure 1). However, upon introducing ApoE4 carrier status as a covariate of no interest in the statistical design, surface reduction was found in some regions of the right hippocampal head and certain regions in the bilateral putamen and right caudate. No shape-wise difference was observed in any of the subcortical structures between ApoE4 carrier and non-carriers.
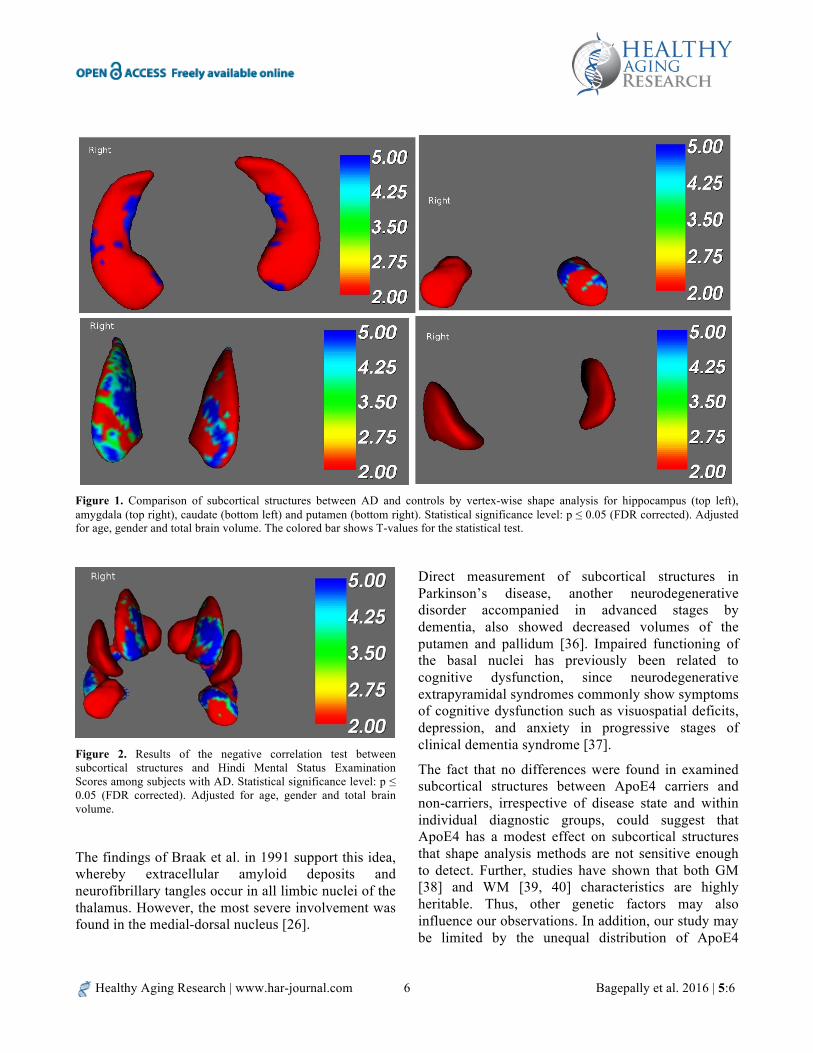
For subjects with AD, no statistically significant correlation was found between the clinical HMSE score and vertex-wise surface analysis of any subcortical structures (p ≤ 0.05, FDR corrected and adjusted for age, gender and TBV). Similar correlation analysis of the combined sample (AD + controls) showed a significant negative correlation for the hippocampus, caudate and putamen regions, as shown in Figure 2. This indicates that the more severe the cognitive decline, the greater the surface atrophy of these subcortical structures.
Discussion In patients with AD, this study revealed lowered global GM volumes and reduced subcortical volumes of the hippocampus, caudate, putamen, and thalamus. Through shape analysis, this study was also able to localize the surface reductions in these structures, independently of age, gender and TBV.
Healthy Aging Research | www.har-journal.com Bagepally et al. 2016 | 5:6 4
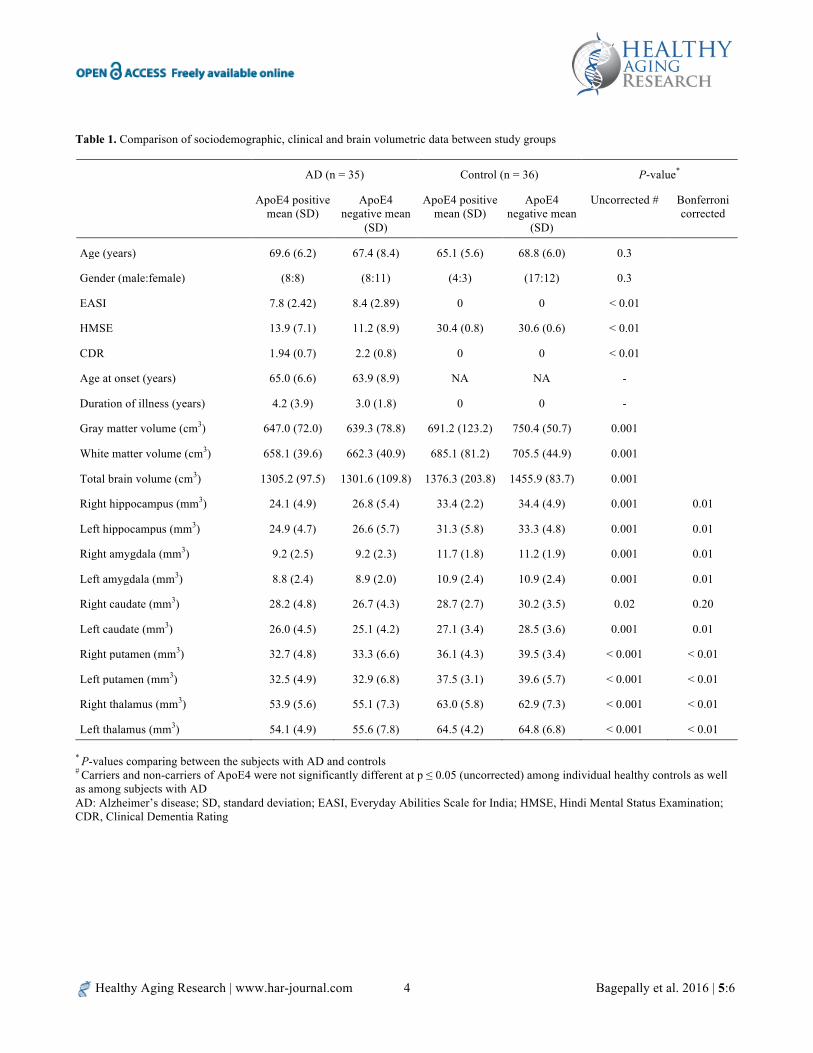
Table 1. Comparison of sociodemographic, clinical and brain volumetric data between study groups
AD (n = 35) Control (n = 36) P-value*
ApoE4 positive mean (SD)
ApoE4 negative mean
(SD)
ApoE4 positive mean (SD)
ApoE4 negative mean
(SD)
Uncorrected # Bonferroni corrected
Age (years) 69.6 (6.2) 67.4 (8.4) 65.1 (5.6) 68.8 (6.0) 0.3
Gender (male:female) (8:8) (8:11) (4:3) (17:12) 0.3
EASI 7.8 (2.42) 8.4 (2.89) 0 0 < 0.01
HMSE 13.9 (7.1) 11.2 (8.9) 30.4 (0.8) 30.6 (0.6) < 0.01
CDR 1.94 (0.7) 2.2 (0.8) 0 0 < 0.01
Age at onset (years) 65.0 (6.6) 63.9 (8.9) NA NA -
Duration of illness (years) 4.2 (3.9) 3.0 (1.8) 0 0 -
Gray matter volume (cm3) 647.0 (72.0) 639.3 (78.8) 691.2 (123.2) 750.4 (50.7) 0.001
White matter volume (cm3) 658.1 (39.6) 662.3 (40.9) 685.1 (81.2) 705.5 (44.9) 0.001
Total brain volume (cm3) 1305.2 (97.5) 1301.6 (109.8) 1376.3 (203.8) 1455.9 (83.7) 0.001
Right hippocampus (mm3) 24.1 (4.9) 26.8 (5.4) 33.4 (2.2) 34.4 (4.9) 0.001 0.01
Left hippocampus (mm3) 24.9 (4.7) 26.6 (5.7) 31.3 (5.8) 33.3 (4.8) 0.001 0.01
Right amygdala (mm3) 9.2 (2.5) 9.2 (2.3) 11.7 (1.8) 11.2 (1.9) 0.001 0.01
Left amygdala (mm3) 8.8 (2.4) 8.9 (2.0) 10.9 (2.4) 10.9 (2.4) 0.001 0.01
Right caudate (mm3) 28.2 (4.8) 26.7 (4.3) 28.7 (2.7) 30.2 (3.5) 0.02 0.20
Left caudate (mm3) 26.0 (4.5) 25.1 (4.2) 27.1 (3.4) 28.5 (3.6) 0.001 0.01
Right putamen (mm3) 32.7 (4.8) 33.3 (6.6) 36.1 (4.3) 39.5 (3.4) < 0.001 < 0.01
Left putamen (mm3) 32.5 (4.9) 32.9 (6.8) 37.5 (3.1) 39.6 (5.7) < 0.001 < 0.01
Right thalamus (mm3) 53.9 (5.6) 55.1 (7.3) 63.0 (5.8) 62.9 (7.3) < 0.001 < 0.01
Left thalamus (mm3) 54.1 (4.9) 55.6 (7.8) 64.5 (4.2) 64.8 (6.8) < 0.001 < 0.01 * P-values comparing between the subjects with AD and controls # Carriers and non-carriers of ApoE4 were not significantly different at p ≤ 0.05 (uncorrected) among individual healthy controls as well as among subjects with AD AD: Alzheimer’s disease; SD, standard deviation; EASI, Everyday Abilities Scale for India; HMSE, Hindi Mental Status Examination; CDR, Clinical Dementia Rating
Healthy Aging Research | www.har-journal.com Bagepally et al. 2016 | 5:6 5
Table 2. ApoE genotype among study subjects
ApoE Genotype AD (n=35)
Controls (n=36)
ApoE non-carriers
ApoE 22 (M:F) 0 0 ApoE 23 (M:F) 1 (0:1) 7 (4:3) ApoE 33 (M:F) 18 (8:10) 22 (13:9)
ApoE carriers
ApoE 24 (M:F) 1 (1:0) 0 ApoE 34 (M:F) 12 (5:7) 7 (4:3) ApoE 44 (M:F) 3 (2:1) 0
There were no differences in these subcortical structures between ApoE4 carriers and non-carriers, or in the whole group of subjects, irrespective of disease effect, or within individual AD and control groups. The observation that AD patients had smaller volumes of their hippocampus, amygdala and subcortical basal ganglia structures strongly suggests that degenerative pathology affects these subcortical structures.
Cortical involvement in terms of global gray and white matter atrophy with volume loss is the most common observation in AD [24, 25]. Most literature on AD has focused on cortical atrophy and changes in the hippocampus. However, most AD pathology studies have observed involvement of other subcortical regions as well as changes in cortical structures [1, 2, 6, 26], and these are implicated in various neuropsychiatric and behavioral symptoms seen in AD. The present study validates these previous observations of histopathological atrophy of subcortical structures through MR imaging and shape analysis.
Another important finding of this study was atrophy of subcortical structures such as the hippocampus, caudate, putamen and thalamus. Hippocampal involvement is commonly reported in AD [27, 28] literature. The notion that hippocampal atrophy contributes to memory decline in the process of AD has been described more than once and is widely accepted [4, 29]; our study validates these previous observations. In general, this study supports previous histopathological observations of atrophy, the deposition of neuroinflammatory markers, amyloid plaques, altered cortico-subcortical connectivity, and impaired functional abilities in the amygdala, caudate, putamen and thalamic regions [24]. The caudate, putamen and thalamus are known to participate in
many different neuronal pathways, with functions not just restricted to motor behavior, but also to emotional, motivational, associative and cognitive abilities [30]. The current study supports the idea that atrophy of thalamic and basal nuclei may have an important role in AD pathobiology and, and demonstrated by the correlation found with HMSE test scores, also suggests the importance of these structures in cognitive decline in AD.
Amyloid deposits have been reported in the putamen during the early AD disease process [1]. Although, a little is known on the role of the putamen in cognition, recent literature shows that as a part of the striatum, the putamen is active in probabilistic learning [31, 32] and in working memory tasks [33]. Furthermore, the putamen has been correlated with the emergence of dementia in other neurodegenerative disorders such as Parkinson’s disease, because of dopaminergic or other neurochemical deficits [34]. In addition, the presence of extrapyramidal symptoms during the later stages of AD indicates, the role of this structure. All these features indicate the probable role of the putamen in both cognitive impairment and impaired motor behavior in AD.
In contrast to the putamen, slightly more is known about the thalamus and its relationship with cognition. The thalamus consists of multiple nuclei and is classically metaphorized as an active relay center. The thalamus serves both sensory and motor mechanisms [30]. Cognitively, it is involved in directing attention and suppressing irrelevant sensory input [14] and its anterior, medial-dorsal, intralaminar and midline nuclei are important for memory functions [15]. Thalamic atrophy has been related to cognitive performance in other neurodegenerative disorders such as Huntington’s disease [12], progressive supranuclear palsy, and multiple sclerosis [13], and herein mostly affected patients’ executive functioning. As part of the limbic system, atrophy of the anterior part of the thalamus in AD has been described [35]. However, the size reduction of the thalamus in our study cannot be entirely explained by reduction of the anterior nuclei alone and suggests that other nuclei of the thalamus are also prone to atrophy in AD; the large medial-dorsal nucleus is an important candidate [16].
Healthy Aging Research | www.har-journal.com Bagepally et al. 2016 | 5:6 6
Figure 1. Comparison of subcortical structures between AD and controls by vertex-wise shape analysis for hippocampus (top left), amygdala (top right), caudate (bottom left) and putamen (bottom right). Statistical significance level: p ≤ 0.05 (FDR corrected). Adjusted for age, gender and total brain volume. The colored bar shows T-values for the statistical test.
Figure 2. Results of the negative correlation test between subcortical structures and Hindi Mental Status Examination Scores among subjects with AD. Statistical significance level: p ≤ 0.05 (FDR corrected). Adjusted for age, gender and total brain volume.
The findings of Braak et al. in 1991 support this idea, whereby extracellular amyloid deposits and neurofibrillary tangles occur in all limbic nuclei of the thalamus. However, the most severe involvement was found in the medial-dorsal nucleus [26].
Direct measurement of subcortical structures in Parkinson’s disease, another neurodegenerative disorder accompanied in advanced stages by dementia, also showed decreased volumes of the putamen and pallidum [36]. Impaired functioning of the basal nuclei has previously been related to cognitive dysfunction, since neurodegenerative extrapyramidal syndromes commonly show symptoms of cognitive dysfunction such as visuospatial deficits, depression, and anxiety in progressive stages of clinical dementia syndrome [37].
The fact that no differences were found in examined subcortical structures between ApoE4 carriers and non-carriers, irrespective of disease state and within individual diagnostic groups, could suggest that ApoE4 has a modest effect on subcortical structures that shape analysis methods are not sensitive enough to detect. Further, studies have shown that both GM [38] and WM [39, 40] characteristics are highly heritable. Thus, other genetic factors may also influence our observations. In addition, our study may be limited by the unequal distribution of ApoE4
Healthy Aging Research | www.har-journal.com Bagepally et al. 2016 | 5:6 7
carriers and non-carriers in our sample population, thus making interpretation of ApoE4-related findings more complex.
Strengths of our study included our use of a high intensity 3T MRI scanner, which increases the sensitivity of data, and our comprehensive evaluation of the subjects in terms of clinical and genetic features, MRI, and automated volumetry and shape analysis. We also used stringent statistical significance levels.
Conclusions Adding to current knowledge, our study shows that basal ganglia and limbic structures can be atrophied in AD, as well as subcortical structures. Furthermore, we show that these changes can be detected using advanced neuroimaging and shape-wise analysis. We also revealed that the clear reduction in size of all subcortical structures, except the amygdala, was more pronounced on the left side compared with the right side. De Jong et al. obtained similar results, along with cognitive decline [16]. A possible explanation for this may be that all subjects in our study were right-handed. It remains unclear as to whether shrinkage of the putamen and thalamus is a primary or a secondary phenomenon in the pathology of AD [16]. Further evaluation of the involvement of specific areas of the hippocampus and basal ganglion structures in AD is needed for validation and assessment of functional importance.
Acknowledgments The authors would like to thank the Indian Council for Medical Research (ICMR) for funding his PhD research.
References
1. Braak H, Braak E. Alzheimer’s disease: striatal amyloid
deposits and neurofibrillary changes. J Neuropathol Exp Neurol. 1990;49:215–24.
2. Klunk WE, Price JC, Mathis CA, Tsopelas ND, Lopresti BJ, Ziolko SK, et al. Amyloid deposition begins in the
striatum of presenilin-1 mutation carriers from two unrelated pedigrees. J Neurosci. 2007;27:6174–84.
3. Ferrarini L, Palm WM, Olofsen H, van Buchem MA, Reiber JH, Admiraal-Behloul F. Shape differences of the brain ventricles in Alzheimer’s disease. NeuroImage. 2006;32:1060–9.
4. de Leon MJ, Convit A, DeSanti S, Golomb J, Tarshish C, Rusinek H, et al. The hippocampus in aging and Alzheimer’s disease. Neuroimaging Clin N Am. 1995;5:1–17.
5. Horinek D, Varjassyova A, Hort J. Magnetic resonance analysis of amygdalar volume in Alzheimer’s disease. Curr Opin Psychiatry. 2007;20:273–7.
6. Scheltens P, Leys D, Barkhof F, Huglo D, Weinstein HC, Vermersch P, et al. Atrophy of medial temporal lobes on MRI in ‘probable’ Alzheimer’s disease and normal ageing: diagnostic value and neuropsychological correlates. J Neurol Neurosurg Psychiatr. 1992;55:967–72.
7. de Leon MJ, Golomb J, Convit A, DeSanti S, McRae TD, George AE. Measurement of medial temporal lobe atrophy in diagnosis of Alzheimer’s disease. Lancet. 1993;341:125–6.
8. Karas G, Scheltens P, Rombouts S, van Schijndel R, Klein M, Jones B, et al. Precuneus atrophy in early-onset Alzheimer’s disease: a morphometric structural MRI study. Neuroradiology. 2007;49:967–76.
9. Karas GB, Scheltens P, Rombouts SA, Visser PJ, van Schijndel RA, Fox NC, et al. Global and local gray matter loss in mild cognitive impairment and Alzheimer’s disease. Neuroimage. 2004;23:708–16.
10. Almeida OP, Burton EJ, McKeith I, Gholkar A, Burn D, O’Brien JT. MRI study of caudate nucleus volume in Parkinson’s disease with and without dementia with Lewy bodies and Alzheimer’s disease. Dementia Geriatr Cogn Disord. 2003;16:57–63.
11. Barber R, McKeith I, Ballard C, O’Brien J. Volumetric MRI study of the caudate nucleus in patients with dementia with Lewy bodies, Alzheimer’s disease, and vascular dementia. J Neurol Neurosurg Psychiatr. 2002;72:406–7.
12. Kassubek J, Juengling FD, Ecker D, Landwehrmeyer GB. Thalamic atrophy in Huntington’s disease co-varies with cognitive performance: a morphometric MRI analysis. Cereb Cortex. 2005;15:846–53.
13. Houtchens MK, Benedict RH, Killiany R, Sharma J, Jaisani Z, Singh B, et al. Thalamic atrophy and cognition in multiple sclerosis. Neurology. 2007;69:1213–23.
14. Newman J. Thalamic contributions to attention and consciousness. Conscious Cogn. 1995;4:172–93.
15. Van der Werf YD, Witter MP, Uylings HB, Jolles J. Neuropsychology of infarctions in the thalamus: a review. Neuropsychologia. 2000;38:613–27.
16. de Jong LW, van der Hiele K, Veer IM, Houwing JJ, Westendorp RGJ, Bollen ELEM, et al. Strongly reduced
Healthy Aging Research | www.har-journal.com Bagepally et al. 2016 | 5:6 8
volumes of putamen and thalamus in Alzheimer’s disease: an MRI study Brain. 2008;131:3277–85.
17. Patenaude B, Smith SM, Kennedy DN, Jenkinson M. A Bayesian model of shape and appearance for subcortical brain segmentation. Neuroimage. 201 1;56(3):907–22.
18. McKhann G, Drachman D, Folstein M, Katzman R, Price D, Stadlan EM. Clinical diagnosis of Alzheimer’s disease: report of the NINCDS-ADRDA Work Group under the auspices of Department of Health and Human Services Task Force on Alzheimer’s Disease. Neurology. 1984 Jul;34(7):939–44.
19. Ganguli M, Ratcliff G, Chandra V, Sharma S, Gilby J, Pandav R, et al. A hindi version of the MMSE: The development of a cognitive screening instrument for a largely illiterate rural elderly population in india. Int J Geriat Psychiatry. 1995;10(5):367–77.
20. Fillenbaum GG, Chandra V, Ganguli M, Pandav R, Gilby JE, Seaberg EC, et al. Development of an activities of daily living scale to screen for dementia in an illiterate rural older population in India. Age Ageing. 1999;28(2):161–8.
21. Morris JC. The Clinical Dementia Rating (CDR): current version and scoring rules. Neurology. 1993;43(11):2412–4.
22. Bharath S, Purushottam M, Mukherjee O, Bagepally BS, Prakash O, Kota L, et al. Apolipoprotein E polymorphism and dementia: a hospital-based study from southern India. Dement Geriatr Cogn Disord. 2010;30(6):455–60.
23. Smith SM, Zhang Y, Jenkinson M, Chen J, Matthews PM, Federico A, et al. Accurate, robust and automated longitudinal and cross-sectional brain change analysis. Neuroimage. 2002;17(1):479–89.
24. Weiner MW, Veitch DP, Aisen PS, Beckett LA, Cairns NJ, Green RC, et al. (2011). The Alzheimer’s Disease Neuroimaging Initiative: a review of papers published since its inception. Alzheimers Dement. 2012;8:S1–68.
25. Wolf H, Julin P, Gertz H-J, Winblad B, Wahlund L-O. Intracranial volume in mild cognitive impairment, Alzheimer’s disease and vascular dementia: evidence for brain reserve? Int J Geriatr Psychiatry. 2004;19(10):995–1007.
26. Braak H, Braak E. Alzheimer’s disease affects limbic nuclei of the thalamus. Acta Neuropathol. 1991;81:261–8.
27. Scher AI, Xu Y, Korf ESC, White LR, Scheltens P, Toga AW, et al. Hippocampal shape analysis in Alzheimer’s disease: a population-based study. Neuroimage. 2007;36(1):8–18.
28. Qiu A, Fennema-Notestined C, Dalee AM, Millerg MI, Alzheimer’s Disease Neuroimaging Initiative. Regional shape abnormalities in mild cognitive impairment and Alzheimer's disease. Neuroimage. 2009;45(3):656–61.
29. Laakso MP, Soininen H, Partanen K, Helkala EL, Hartikainen P, Vainio P, et al. Volumes of hippocampus, amygdala and frontal lobes in the MRI-based diagnosis
of early Alzheimer’s disease: correlation with memory functions. J Neural Transm Park Dis Dement Sect. 1995;9(1):73–86.
30. Herrero M-T, Barcia C, Navarro JM. Functional anatomy of thalamus and basal ganglia. Childs Nerv Syst. 2002;18(8):386–404.
31. Graybiel AM. The basal ganglia: learning new tricks and loving it. Curr Opin Neurobiol. 2005;15(6):638–44.
32. Bellebaum C, Koch B, Schwarz M, Daum I. Focal basal ganglia lesions are associated with impairments in reward-based reversal learning. Brain. 2008;131(Pt 3):829–41.
33. Dahlin E, Neely AS, Larsson A, Bäckman L, Nyberg L. Transfer of learning after updating training mediated by the striatum. Science. 2008;320(5882):1510–2.
34. Emre M. What causes mental dysfunction in Parkinson’s disease? Mov Disord. 2003 Sep;18 Suppl 6:S63-71.
35. Callen DJ, Black SE, Gao F, Caldwell CB, Szalai JP. Beyond the hippocampus: MRI volumetry confirms widespread limbic atrophy in AD. Neurology. 2001;57(9):1669–74.
36. Geng DY, Li YX, Zee CS. Magnetic resonance imaging-based volumetric analysis of basal ganglia nuclei and substantia nigra in patients with Parkinson’s disease. Neurosurgery. 2006;58:256–62.
37. Borroni B, Turla M, Bertasi V, Agosti C, Gilberti N, Padovani A. Cognitive and behavioral assessment in the early stages of neurodegenerative extrapyramidal syndromes. Arch Gerontol Geriatr. 2007;47:53–61.
38. Toga AW, Thompson PM. Genetics of brain structure and intelligence. Annu Rev Neurosci. 2005;28:1–23.
39. Pfefferbaum A, Sullivan EV, Carmelli D. Genetic regulation of regional microstructure of the corpus callosum in late life. Neuroreport. 2001;12(8):1677–81.
40. Chiang MC, Barysheva M, Shattuck DW, Lee AD, Madsen SK, Avedissian C, et al. Genetics of brain fiber architecture and intellectual performance. J Neuroscience. 2009;29(7):2212–24.