Embed Size (px)
Citation preview

Country profile – Philippines
Version 2011

Recommended citation: FAO. 2011. AQUASTAT Country Profile – Philippines.
Food and Agriculture Organization of the United Nations (FAO). Rome, Italy
The designations employed and the presentation of material in this information product do not imply the expression of any opinion whatsoever on the part of the Food and Agriculture Organization of the United Nations (FAO) concerning the legal or development status of any country, territory, city or area or of its authorities, or concerning the delimitation of its frontiers or boundaries. The mention of specific companies or products of manufacturers, whether or not these have been patented, does not imply that these have been endorsed or recommended by FAO in preference to others of a similar nature that are not mentioned. The views expressed in this information product are those of the author(s) and do not necessarily reflect the views or policies of FAO. FAO encourages the use, reproduction and dissemination of material in this information product. Except where otherwise indicated, material may be copied, downloaded and printed for private study, research and teaching purposes, or for use in non-commercial products or services, provided that appropriate acknowledgement of FAO as the source and copyright holder is given and that FAO’s endorsement of users’ views, products or services is not implied in any way. All requests for translation and adaptation rights, and for resale and other commercial use rights should be made via www.fao.org/contact-us/licencerequest or addressed to [email protected]. FAO information products are available on the FAO website (www.fao.org/ publications) and can be purchased through [email protected]. © FAO 2011

1
Philippines
GEOGRAPHY, CLIMATE AND POPULATION
Geography
The Philippines is an island nation located in Southeast Asia. It is composed of 7 107 islands called the
Philippine Archipelago, with an area of approximately 300 000 km2 (Table 1). The archipelago is
bounded by the Bashi Channel in the north, the Philippine Sea (Pacific Ocean) in the east, the Sulu and
Celebes Seas in the south and the South China Sea in the west. Its northernmost islands are
approximately 240 km south of the island of Taiwan, and the southernmost islands lie 24 km off the
coast of Borneo (Malaysia).
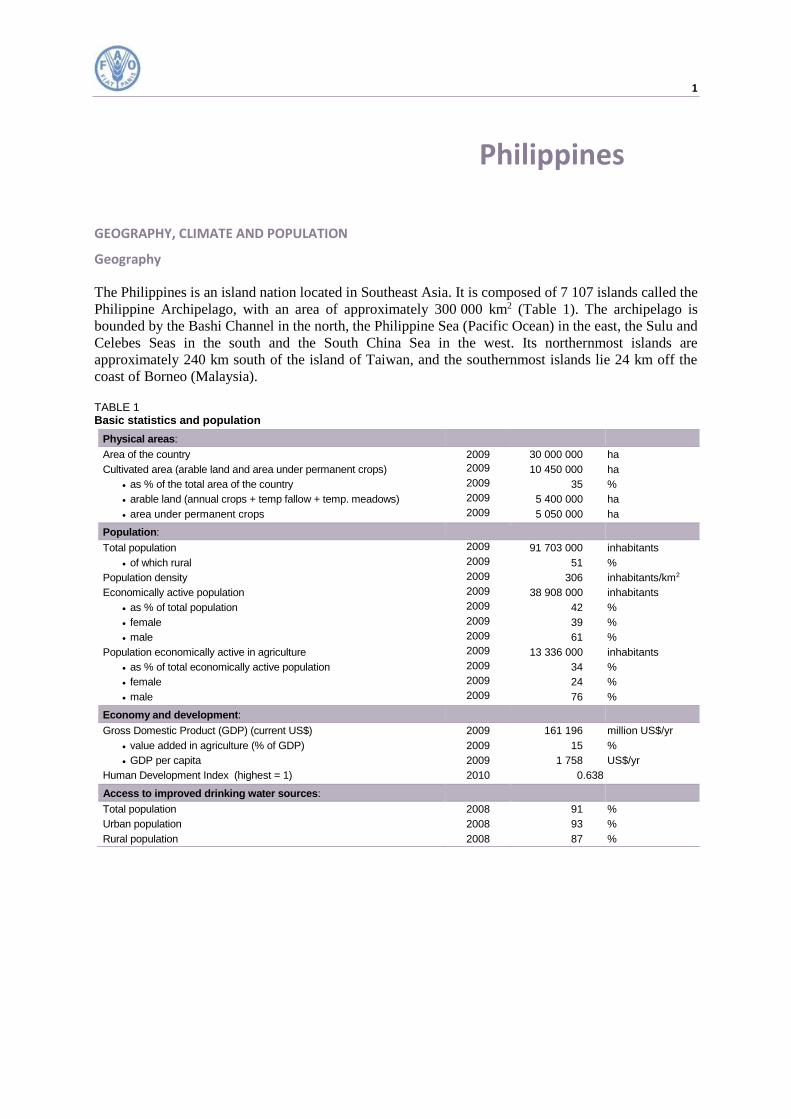
TABLE 1 Basic statistics and population
Physical areas:
Area of the country 2009 30 000 000 ha
Cultivated area (arable land and area under permanent crops) 2009 10 450 000 ha
as % of the total area of the country 2009 35 %
arable land (annual crops + temp fallow + temp. meadows) 2009 5 400 000 ha
area under permanent crops 2009 5 050 000 ha
Population:
Total population 2009 91 703 000 inhabitants
of which rural 2009 51 %
Population density 2009 306 inhabitants/km2
Economically active population 2009 38 908 000 inhabitants
as % of total population 2009 42 %
female 2009 39 %
male 2009 61 %
Population economically active in agriculture 2009 13 336 000 inhabitants
as % of total economically active population 2009 34 %
female 2009 24 %
male 2009 76 %
Economy and development:
Gross Domestic Product (GDP) (current US$) 2009 161 196 million US$/yr
value added in agriculture (% of GDP) 2009 15 %
GDP per capita 2009 1 758 US$/yr
Human Development Index (highest = 1) 2010 0.638
Access to improved drinking water sources:
Total population 2008 91 %
Urban population 2008 93 %
Rural population 2008 87 %

2 Irrigation in Southern and Eastern Asia in figures - AQUASTAT Survey - 2011
FIGURE 1 Map of Philippines

Philippines 3
The islands are commonly divided into three island groups, which are further divided into regions,
provinces, cities and municipalities and barangays. The islands and their respective administrative
regions are:
Luzon, 142 000 km2, composed of eight administrative regions: Ilocos (Region I), Cagayan
Valley (Region II), Central Luzon (Region III), Calabarzon (Region IV-A), Mimaropa (Region
IV-B), Bicol Region (Region V), National Capital Region and Cordillera Administrative
Region);
Visayas, 56 000 km2, composed of three administrative regions: Western Visayas (Region VI),
Central Visayas (Region VII) and Eastern Visayas (Region VIII));
Mindanao, 102 000 km2, composed of six administrative regions: Zamboanga Peninsula
(Region IX), Northern Mindanao (Region X), Davao Region (Region XI), Soccsksargen
(Region XII), Caraga (Region XIII) and Autonomous Region in Muslim Mindanao).
The Philippines has a varied topography with highlands and numerous valleys. Its four major lowland
plains are the central plain and the Cagayan valley in Luzon, and the Agusan and Cotabato valleys in
Mindanao. These lowlands contrast sharply with the adjacent high mountain areas of the central and
east Cordilleras and the Zambales mountains. The highest peaks are almost 3 000 m above sea level at
less than 30 km from the sea. There are many active volcanos such as Mayon, Mount Pinatubo, and
Taal. Lying on the northwestern fringes of the Pacific Ring of Fire, the Philippines experience frequent
seismic and volcanic activities.
In 2009, the total cultivated area was approximately 10.5 million ha, of which 52 percent (5.4 million
ha) were for annual crops and 48 percent (5.1 million ha) for permanent crops (Table 1). In 1995, the
total cultivated area was around 9.9 million ha, of which 56 percent was for annual crops.
Climate
The climate is tropical and monsoonal with uniform temperature, on average 27°C throughout the year.
Humidity is relatively high, above 70 percent everywhere all year except in southern Tagalog, where it
falls to 65 percent in March/April. There is low solar radiation, diversity of rainfall and high frequency
of tropical cyclones. The main air streams affecting the Philippines are the northeast monsoon, known
locally as the amihan, from late October to March, the southwest monsoon, known locally as the habagat,
from May to October and the North Pacific trade winds, are dominant during April and early May. Many
of the larger islands of the Philippines have high mountain ranges, most of which lie along a generally
north-south axis across the paths of movement of the important air streams. Thus, apart from variations
in temperature caused by elevation, the orographic effects of mountains significantly influences regional
rainfall patterns by causing increased precipitation on windward slopes and rain shadows in their lee
during the monsoon periods.
The average annual rainfall is about 2 348 mm/year, but it varies from around 960 mm in General Santos
City in southeast Mindanao to more than 4 050 mm in Infanta in central Luzon. The most extreme annual
rainfall events ever recorded are 94 mm at Vigan in Ilocos Sur (northern Luzon) in 1948 and 9 006 mm
in Baguio City (northern Luzon) in 1910.
The rainfall pattern and annual amount are influenced mainly by altitude and wind. The northwest of
the country has a dry season from November to April and a wet season during the rest of the year, called
the southwest monsoon. The southeast receives rainfall all year round, but with a pronounced maximum
from November to January during the northeast monsoon. In the areas not directly exposed to the winds,
rainfall is evenly distributed throughout the year, or there are two seasons but not very pronounced.
From November to April the weather is relatively dry while it is relatively wet the rest of the year. The
lowest rainfall occurs in the provinces of Cebu, Bohol and Cotabato in the centre of the country.
4 Irrigation in Southern and Eastern Asia in figures - AQUASTAT Survey - 2011
The archipelago lies in the typhoon belt, and many islands are liable to extensive flooding and damage
during the typhoon season from June to December. The frequency of typhoons is greater in the northern
portion of the archipelago than in the south. Usually, two or three typhoons reach the country each year.
Population
In 2009, the total population was about 91.7 million, of which around 51 percent lived in rural areas
(Table 1). The average annual demographic growth is an estimated 1.9 percent for 1999-2009. In 2009,
the population density was 306 inhabitants/km2 against 236 inhabitants/km2, in 1996, ranging from
47 inhabitants/km2 in Agusan del Sur in Region X in Mindanao to 348 inhabitants/km2 in southern
Tagalog in Region IV in Luzon, and more than 13 000 inhabitants/km2 in the Capital Manila.
In 2008, 93 percent of the urban and 87 percent of the rural population had access to improved drinking
water respectively.
ECONOMY, AGRICULTURE AND FOOD SECURITY
In 2009, gross domestic product (GDP) was US$ 161 196 million and agriculture accounted for 15
percent of GDP. In 2009, the total population economically active in agriculture was about 13.3 million
inhabitants or almost 34 percent of the economically active population, of which 24 percent were
women.
Agriculture is the prime mover of the country’s economy, being the least import-dependent activity. In
2006, all subsectors posted output gains except poultry, which contracted by 0.4 percent. The crops,
livestock and fisheries subsectors performed well and expanded their outputs by 4.4, 2.6 and 6.3 percent
respectively. The government’s rice programme is moving the country towards self-sufficiency giving
a 5 percent increase in production. Even maize, which had negative growth the year before, posted a
remarkable increase of 15.8 percent in production in 2006.
The total food supply available for consumption in 2001 was more than adequate to meet the
recommended nutrient allowance for the population. Despite a slight decrease of 0.2 percent compared
to 2000, the country’s per capita food supply exceeded the recommended dietary allowance. The food
from animal origin increased by 5.6 percent, whereas food obtained from vegetables grew by 2.4
percent.
Since the early 1980s the Philippines has been a net importer of food and feed grains. Records available
at the National Food Authority show that during practically all years from 1980 to 2006 rice was
imported to augment the country’s rice supply. This trend shows an increase from 0.19 million tonnes
in 1980 to 2.14 million tonnes in 1998. In that year the country suffered through one of the worse
droughts caused by El Niño. On the other hand, maize imports have generally declined from 1980 to
2006. They were highest in 1990 with 273 650 tonnes and lowest in 2004 with 9 144 tonnes. No maize
was imported in 1991-1994, 1999, 2003 and 2006. The drop in net imports did not affect the food supply
in terms of nutrient content because of sustained domestic food production.
WATER RESOURCES
There are 421 rivers, not counting small mountain streams that sometimes swell to three times their size
during rainy months. The rivers are an important means of transportation and a valuable source of
irrigation water for fields and farms through which they pass. There are also 59 natural lakes and more
than 100 000 ha of freshwater swamps.

Philippines 5
The five principal river basins, cover more than 5 000 km2, are:
Cagayan river basin in north Luzon (25 469 km2);
Mindanao river basin on Mindanao island (23 169 km2);
Agusan river basin on Mindanao island (10 921 km2);
Pampanga river basin near Manila on Luzon island (9 759 km2);
Agno river basin on Luzon island (5 952 km2).
Only 18 river basins have an area greater than 1 000 km2: eight are on the island of Mindanao, seven on
Luzon, two on Panay and one on Negros Island. The smallest river basins are frequently under 50 km2.
In order to have manageable units for comprehensive planning of water resources, the National Water
Resources Board divided the country into 12 water resources regions. Major considerations taken into
account in this regionalization were the hydrological boundaries defined by physiographic features and
homogeneity in climate of the different parts of the country. In fact, these water resources regions
generally correspond to the existing political regions. Minor deviations dictated by hydrography affected
only northern Luzon and northern Mindanao.
The average annual precipitation is about 2 348 mm (Table 2). The long-term average annual renewable
surface water resources are an estimated 444 km3. In nine years out of ten, the annual runoff exceeds
257 km3. Groundwater resources are distributed in four major areas covering around 33 500 km2:
10 000 km2 in Cagayan, 9 000 km2 in Central Luzon, 8 500 km2 in Agusan, and 6 000 km2 in Cotobato.
Combined with smaller reservoirs already identified, this aggregates to about 50 000 km2. The
groundwater resources are an estimated 180 km3/year, of which 80 percent (145 km3/year) constitute
the base flow of the river systems. Total internal water resources are therefore 444+180-145=479
km3/year.
TABLE 2 Water resources
Renewable freshwater resources:
Precipitation (long-term average) - 2 348 mm/yr
- 704 340 million m3/yr
Internal renewable water resources (long-term average) - 479 000 million m3/yr
Total actual renewable water resources - 479 000 million m3/yr
Dependency ratio - 0 %
Total actual renewable water resources per inhabitant 2009 5 223 m3/yr
Total dam capacity 2006 6 274.5 million m3
Total exploitable water resources are about 146 km3, of which 126 km3 is exploitable renewable surface
water and 20 km3 is exploitable renewable groundwater.
There are 59 natural lakes and more than 100 000 ha freshwater swamps. The National Wetland Action
Plan, in response to the country’s commitments to the Ramsar Convention, nominated and designated
the four major wetlands, with a total surface area of 68 404 ha, as sites for Wetlands of International
Importance. These include the Olango Island (Cebu), Naujan Lake National Park (Oriental Mindoro),
Agusan Marsh Wildlife Sanctuary (Agusan del Sur), and the Tubbataha Reefs National Marine Park in
the middle of Central Sulu Sea. The Agusan Marsh Wildlife Sanctuary, 14 836 ha, is of particular
importance because it includes a vast complex of freshwater marshes and watercourses with numerous
shallow lakes and ponds in the upper basin of the Agusan river and its tributaries rising in the hills of
eastern Mindanao.
A survey of surface water storage potential has identified sites for 438 major dams and 423 smaller dams
(NWRB, 1978). Total dam capacity in 2006 was 6 274.5 million m3. The National Irrigation
Administration (NIA) has constructed seven large dams and small reservoirs for irrigation projects with
a total capacity of 6 180 million m3. In the Philippines, a dam is considered large when the storage

6 Irrigation in Southern and Eastern Asia in figures - AQUASTAT Survey - 2011
capacity exceeds 50 million m3 and the structural height is more than 30 m. The last large dam,
constructed in 2002, is the San Roque dam with a total capacity of 850 million m3. Two of the large
dams, with a total capacity of 3 560 million m3, are managed by the NIA: Magat for the Magat River
Integrated Irrigation System (MRIIS) and Pantabangan for the Upper Pampanga River Integrated
Irrigation System (UPRIIS). Three of the large dams, with a total capacity of 1 679 million m3, are
managed by the National Power Corporation (NPC): Angat, Ambuklao and Palangui IV. The NPC
operates and manages three other dams in Mindanao, with a capacity of approximately 27.7 million m3:
Agus II, IV and V.
The Metropolitan Waterworks and Sewerage System (MWSS) manages two dams for municipal water
supply and sanitation in the Metro-Manila areas: the La Mesa dam and Ipo dam with storage capacity
of 51 and 36 million m3 respectively. All other small dams have been created with various objectives
within the framework of the small water impounding management (SWIM) projects and are jointly
managed by the Bureau of Soils and Water Management (BSWM), the NIA and lately the Department
of Agrarian Reform, which receive assistance through various international funding agencies. SWIM
projects are represented by 350 units of 270 000 m3 on average, accounting for 94.5 million m3.
WATER USE
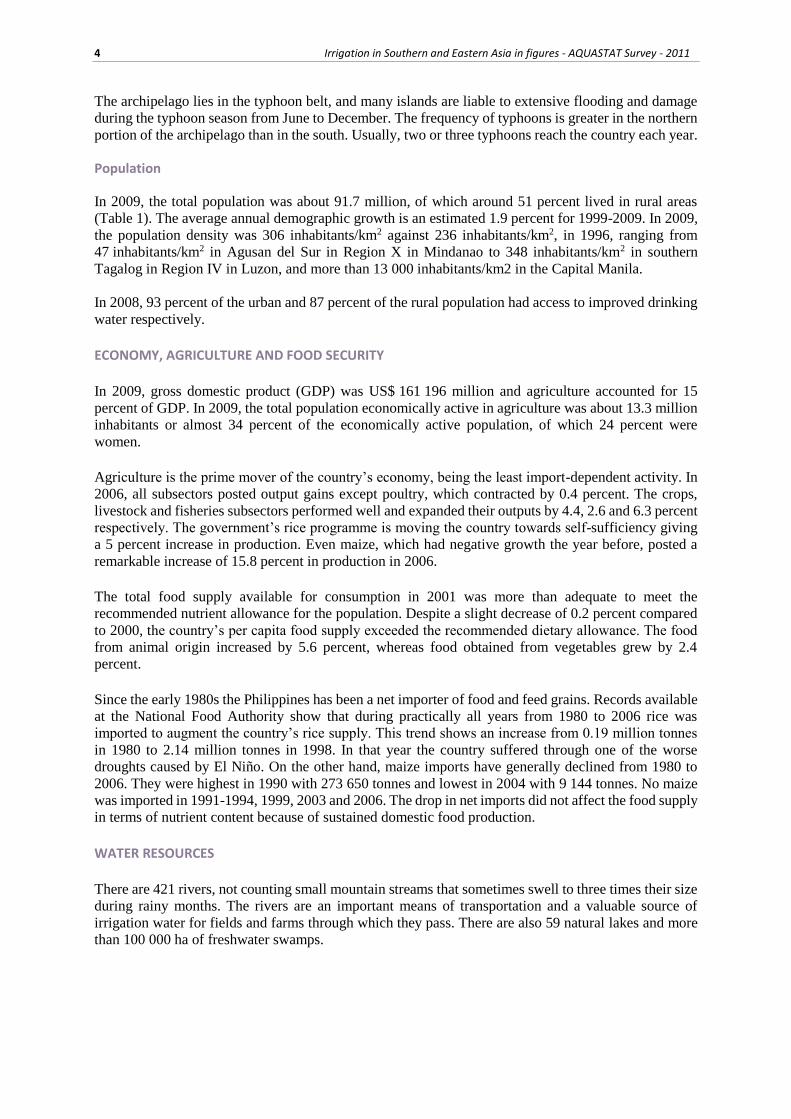
In 2009 total water withdrawal was an estimated 81 555 million m3, of which 82 percent was for
agricultural purposes (including 754 million m3 of aquaculture), 8 percent for municipalities and
10 percent for industry (Table 3 and Figure 2). Other non-consumptive use of water includes
hydropower (110 079 million m3) and recreation (244 million m3). In 1995, total water withdrawal was
an estimated 55 422 million m3, of which 88 percent for agriculture, 8 percent for municipal purposes
and 4 percent for industry. In 2009, freshwater was the only source of water withdrawal, with 96 percent
being surface water and 4 percent groundwater (Figure 3). TABLE 3 Water use
Water withdrawal:
Total water withdrawal 2009 81 554.93 million m3/yr
- irrigation + livestock 2009 67 065.65 million m3/yr
- municipalities 2009 6 234.94 million m3/yr
- industry 2009 8 254.34 million m3/yr
per inhabitant 2009 889 m3/yr
Surface water and groundwater withdrawal 2009 81 554.93 million m3/yr
as % of total actual renewable water resources 2009 17.0 %
Non-conventional sources of water:
Produced wastewater 1993 74 million m3/yr
Treated wastewater 1993 10 million m3/yr
Reused treated wastewater - million m3/yr
Desalinated water produced - million m3/yr
Reused agricultural drainage water - million m3/yr
Philippines 7
FIGURE 2 Water withdrawal by sector Total 81.555 km3 in 2009
FIGURE 3 Water withdrawal by source Total 81.555 km3 in 2009
Private wells are extensively used in rural areas for domestic purposes. Municipal waterworks wells are
drilled by the Local Water Utilities Administration for domestic purposes and deep wells have been
drilled by the NIA for irrigation.
IRRIGATION AND DRAINAGE
Evolution of irrigation development
Irrigation development has been undertaken by rural communities (Banawe terraces, cooperative
irrigation societies (zanjera) and lowland schemes near Manila). Earlier, the major irrigation investment
periods have been during the 1920s, the post-war period and the 1970s and early 1980s when public
involvement in the irrigation subsector was at its maximum. In this respect, the creation of the National
Irrigation Administration (NIA) in 1964 has been decisive.

8 Irrigation in Southern and Eastern Asia in figures - AQUASTAT Survey - 2011
Irrigation development is highest in Luzon, containing approximately 51.1 percent of the total irrigated
land, followed by Mindanao with 38.7 percent and Visayas with 10.2 percent. Luzon, the major
investment area for irrigation development, is considered a ‘hot spot’ for global warming and climate
change, because the irrigation systems are located in high temperature areas and are annually subjected
to destructive typhoons and flooding.
The irrigation potential in 2005 was an estimated 3.1 million ha, defined by the NIA local irrigation
office as the land on slopes of less than 3 percent, which are considered to be the areas with minimum
cost of development (Table 4). Aside from this simplified criteria, the Asian Development Bank (ADB)
proposed considering additional criteria that allow the use of terraced rainfed lands covering a
contiguous area of at least 100 ha, where water could easily be delivered. On the other hand, the World
Bank proposed reassessing the irrigation potential to consider new settlements on agricultural land,
water resources availability, development cost, need for flood control and drainage facilities.
In 2006, the area equipped for full control irrigation was an estimated 1 879 084 ha of which NIA’s
national irrigation systems (NIS) represent 38 percent, NIA’s communal irrigation systems (CIS)
account for 29 percent, small-scale irrigation systems (SSIP) represent 9 percent, private irrigation
systems account for 9 percent and private irrigation systems irrigating crops other than rice account for
15 percent. In 1991, non-equipped cultivated wetlands and inland valley bottoms accounted for
39 478 ha, and in 2004 the non-equipped flood recession cropping area accounted for 63 814 ha, thus
total water managed in 2006 was around1 982 376 ha. In 1992, the area equipped for full control
irrigation was an estimated 1 532 751 ha, of which 42 percent were NIS, 48 percent CIS and 10 percent
private schemes.
NIS schemes have been constructed, operated and maintained by the NIA. The construction cost is borne
entirely by the NIA, while farmers pay for operation and maintenance (O&M). In 1992, there were about
150 NIS schemes throughout the country. There are three main subtypes depending on water origin:
Three large schemes: Magat with 80 977 ha; Upper Pampanga with 94 300 ha; and Angat
Maasim with 31 485 ha are backed by multipurpose reservoirs. Although classified as single
entities, they are actually conglomerates served by multiple diversion structures, which also
utilize supplies from uncontrolled rivers crossing the irrigated area. Parts of the service area
may be too high to be commanded by the reservoir and are commanded by pump schemes. In
1989, the cropping intensity on these schemes was about 89 percent during the wet season and
78 percent during the dry season.
Run-of-the-river diversion schemes: Most are relatively small. These diversion schemes can
be fairly complicated, with several intakes and reuse systems that are often developed over
time in response to observed drainage flows. The largest schemes are located in the alluvial
plains. In 1989, the cropping intensity on these schemes was about 72 percent during the wet
season and 54 percent during the dry season.
Pump schemes: In 1992, there were around seven schemes irrigated only by pumps, and five
large NIS schemes served mainly by gravity flow but which use pumps for a part of their
equipped area.
CIS schemes have been created either by the farmers themselves over the centuries, or more recently by
the NIA and then turned over to the irrigation associations for O&M. Almost half of the communal
schemes are in the province of Ilocos (northwest Luzon), which reflects a long history of irrigation based
on private initiative in this area. These schemes are predominantly diversion schemes; although a few
are served by small reservoirs built within the framework of the SWIM projects. The average size of the
communal schemes is about 115 ha, but range from 40 to 4 000 ha. The smallest schemes are found in
north Luzon, while in Mindanao Island these schemes are generally large, many of them being
implemented by the government settlement programmes and then transferred to farmer groups. The
association bears 10 percent of the direct cost of construction, and pays back the balance within 50 years
at no interest.

Philippines 9
Private schemes are generally supplied by pumps. They originated in publicly assisted river lift and
groundwater development projects. TABLE 4 Irrigation and drainage
Irrigation potential - 3 126 000 ha
Irrigation:
1. Full control irrigation: equipped area 2006 1 879 084 ha
- surface irrigation 2006 1 863 664 ha
- sprinkler irrigation 2006 4 500 ha
- localized irrigation 2006 10 920 ha
% of area irrigated from surface water 2006 78.6 %
% of area irrigated from groundwater 2006 5.7 %
% of area irrigated from mixed surface water and groundwater 2006 15.7 %
% of area irrigated from non-conventional sources of water - %
area equipped for full control irrigation actually irrigated - ha
- as % of full control area equipped - %
2. Equipped lowlands (wetland, ivb, flood plains, mangroves) - ha
3. Spate irrigation - ha
Total area equipped for irrigation (1+2+3) 2006 1 879 084 ha
as % of cultivated area 2006 19 %
% of total area equipped for irrigation actually irrigated - %
average increase per year over the last 13 years 1993 - 2006 1.49 %
power irrigated area as % of total area equipped 2006 14.1 %
4. Non-equipped cultivated wetlands and inland valley bottoms 1991 39 478 ha
5. Non-equipped flood recession cropping area 2004 63 814 ha
Total water-managed area (1+2+3+4+5) 2006 1 982 376 ha
as % of cultivated area 2006 20 %
Full control irrigation schemes: Criteria:
Small-scale schemes < 100 ha 2006 625 360 ha
Medium-scale schemes >100 ha and < 1 000 ha 2006 548 978 ha
large-scale schemes > 1 000 ha 2006 704 746 ha
Total number of households in irrigation -
Irrigated crops in full control irrigation schemes:
Total irrigated grain production (wheat and barley) - metric tons
as % of total grain production - %
Harvested crops:
Total harvested irrigated cropped area 2006 2 695 825 ha
Annual crops: total 2006 2 657 645 ha
- Rice (first season) 2006 1 117 800 ha
- Rice (second season) 2006 1 304 100 ha
- Maize 2006 96 600 ha
- Sugarcane 2006 65 000 ha
- Vegetables 2006 37 861 ha
- Tobacco 2006 23 884 ha
- Groundnuts 2006 12 400 ha
Permanent crops: total 2006 38 180 ha
- Bananas 2006 14 210 ha
- Citrus 2006 1 970 ha
- Other permanent crops 2006 22 000 ha
Irrigated cropping intensity (on full control area equipped) 2006 143.5 %
Drainage - Environment:
Total drained area 1993 1 470 691 ha
- part of the area equipped for irrigation drained 1993 1 470 691 ha
- other drained area (non-irrigated) - ha
drained area as % of cultivated area 1993 15 %
Flood-protected areas - ha
Area salinized by irrigation 1999 300 000 ha
Population affected by water-related diseases 2000 866 411 inhabitants

10 Irrigation in Southern and Eastern Asia in figures - AQUASTAT Survey - 2011
Table 5 reflects the rice-based areas with existing irrigation facilities. The Bureau of Agricultural
Statistics (BAS) estimate was larger than the NIA estimate because BAS took into account privately-
owned small-scale irrigation system such as shallow tubewells.
TABLE 5 Irrigation development by different system of the rice-based areas, in hectares, estimated by two institutions (2006)
System: National Irrigation Administration (NIA)
Bureau of Agricultural Statistics (BAS)
National Irrigation Systems (NIS) 706 237 704 746
Communal Irrigation Systems (CIS) 481 669 548 978
Private Irrigation System 217 832 174 200
TOTAL 1 405 738 1 427 924
In 2008, of a total 748 593 ha of NIS schemes equipped, the actually irrigated area was around
61.5 percent during the wet season and 71.2 percent during the dry season. In 2005, the NIA developed
10 539 ha of new areas and rehabilitated 110 865 ha of existing systems. In 2007, the agency targeted
development of 17 585 ha of new area and rehabilitation of 112 534 ha of existing areas. From 1974-
2007, the BSWM completed and made operational a total of 177 190 ha and rehabilitated 3 538 ha of
irrigated areas.
Surface water development for irrigation is in the form of dams or reservoirs while groundwater
development is through pumping from deep and shallow aquifers. Groundwater irrigation development,
particularly from deep aquifers, is relatively expensive including O&M. This is one of the reasons why
less groundwater is used for irrigation, aside from the fact that groundwater withdrawal is being reserved
for municipal/drinking purposes owing to its inherent good quality. In 2007, surface water was used to
irrigate 78.6 percent of the area equipped for irrigation, 5.7 percent by groundwater and 15.7 percent by
mixed surface water and groundwater (Figure 4).
FIGURE 4 Source of irrigation water on area equipped for full control irrigation Total 1 879 084 ha in 2006
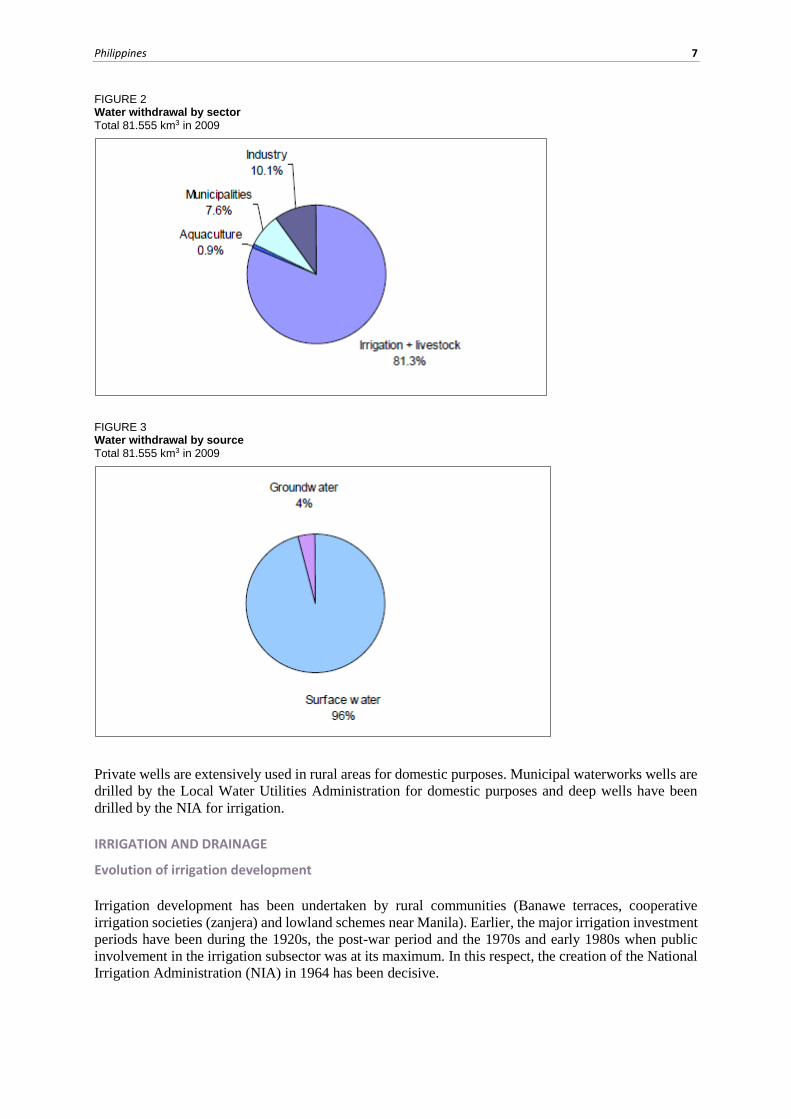
Surface irrigation is the major technique practiced in the Philippines owing to rice, which accounts for
1 863 664 ha or over 99 percent (Figure 5). Lowland paddy fields are flooded to prevent weeds and
ensure yields. Sprinkler and localized irrigation systems, 4 500 ha and 10 920 ha respectively, are used
on privately-owned large plantation areas such as for banana, pineapple and sugarcane. Their use is
constrained by their relatively high investment cost and the skills required to operate and maintain them.
Philippines 11
Currently, the use of sprinkler and drip is being promoted, even for small-scale production systems,
particularly in water-scarce areas. These include greenhouses producing high-value commercial crops,
such as vegetables, where investment costs could be recovered over a shorter period.
FIGURE 5 Irrigation techniques on area equipped for full control irrigation Total 1 879 084 ha in 2006
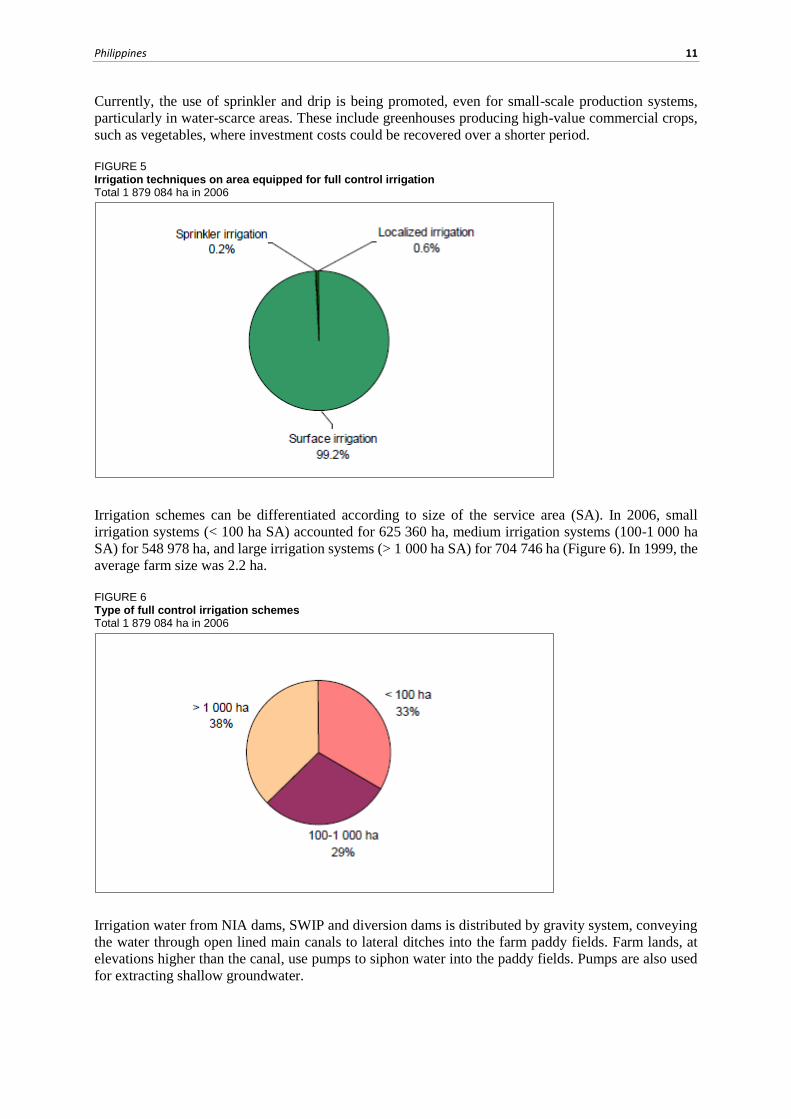
Irrigation schemes can be differentiated according to size of the service area (SA). In 2006, small
irrigation systems (< 100 ha SA) accounted for 625 360 ha, medium irrigation systems (100-1 000 ha
SA) for 548 978 ha, and large irrigation systems (> 1 000 ha SA) for 704 746 ha (Figure 6). In 1999, the
average farm size was 2.2 ha.
FIGURE 6 Type of full control irrigation schemes Total 1 879 084 ha in 2006
Irrigation water from NIA dams, SWIP and diversion dams is distributed by gravity system, conveying
the water through open lined main canals to lateral ditches into the farm paddy fields. Farm lands, at
elevations higher than the canal, use pumps to siphon water into the paddy fields. Pumps are also used
for extracting shallow groundwater.

12 Irrigation in Southern and Eastern Asia in figures - AQUASTAT Survey - 2011
Role of irrigation in agricultural production, the economy and society
There are two cropping seasons in the Philippines. All schemes, equipped area and canal capacity, have
been designed to provide supplementary irrigation to the entire irrigable area during the wet season. The
area actually irrigated during the season should be 100 percent. In practice, this level is never reached
owing to many reasons, such as over-optimistic design of service areas, flooding and waterlogging in
the wet season, complexity of the irrigation system, pump performance, and conflicts between water
supply, power and irrigation. The actually irrigated area varies significantly from one season to another,
but it is always much lower than the area equipped for full control irrigation.
In 2006, the harvested irrigated crop area covered around 2 695 825 ha, of which 89.8 percent was for
rice, 3.6 percent for maize, 2.4 for sugarcane and 1.4 percent for vegetables (Table 4 and Figure 7).
FIGURE 7 Irrigated crops on area equipped for full control irrigation Total harvested area 2 695 825 ha in 2006 (cropping intensity on equipped area 143.5 %)
Paddy is cultivated throughout the country during the wet season and in some areas during the dry season
when other crops with higher added value are also grown. The yields are much lower (30-40 percent) in
the communal schemes than in the national schemes, because the water supplies are uncertain in the
small catchment areas where communal schemes are located. On average, the 1992 yield for irrigated
paddy was an estimated 3.34 tonnes/ha per season, which was 2.9 times the average yield of irrigated
paddy in 1961. For rainfed paddy, the 1992 average yield was an estimated 2.07 tonnes/ha, which is
twice the 1961 average yield. Irrigated rice paddy has a 65 percent higher gross return compared to non-
irrigated. The sustained increase of water supply for rice production helps significantly satisfy the ever
increasing food demand as well as improve food security.
Meanwhile, because of lack of finances to develop new land for irrigation, to help close the food gap,
the focus has been on the development and improvement of technology and support services to improve
rice production on rainfed land. The actual harvested rice area covered by irrigation facilities increased
by almost twice from 1.43 million in 1970 to 2.42 million ha in 2006. The package of production
technology, besides water provision, has made the country close to self-sufficient for rice, which is now
placed at 97 percent, based on the average annual rice requirement of 118 kg per capita.

Philippines 13
Under the BSWM and the NIS schemes, the average cost of irrigation development is about
US$ 3 277/ha for new schemes, while the cost of rehabilitating existing schemes is US$ 1 608/ha, and
the annual cost of O&M is US$ 98/ha. The average cost of irrigation development in private schemes is
around US$ 556/ha; and the cost for rehabilitation of existing schemes is US$ 156/ha. The average cost
of sprinkler irrigation and localized irrigation for on-farm installation is US$ 1 556/ha and US$ 2 222/ha
respectively.
Status and evolution of drainage systems
In most schemes, drainage water from one field goes into another field downstream either through the
irrigation canal or directly. It is, therefore, it is difficult to estimate the drained areas. In 1993, total
drained area was an estimated 1 470 691 ha (Table 4).
WATER MANAGEMENT, POLICIES AND LEGISLATION RELATED TO WATER USE IN AGRICULTURE
Institutions
The National Water Resources Board (NWRB) is the overall government agency responsible for all the
water resources in the Philippines. It coordinates, integrates and regulates all water-related activities that
impact on the physical environment and the economy. The Board regulates water use with a water permit
system and resolution of water use conflicts. It is also the lead agency for the adoption and localization
of Integrated Water Resources Management (IWRM). The National Economic and Development
Authority (NEDA) also plays important roles in the overall coordination in the planning and regulation
of water resources.
The Department of Environment and Natural Resources (DENR) through the Environmental
Management Bureau (EMB), is responsible for maintaining desirable water quality and implementing
water quality management programmes such as classification of water bodies, water quality guidelines
and effluent standards, discharge fee system and ambient effluent/monitoring, etc. The DENR has a new
office, the River Basin Control Office, which will primarily oversee issues and concerns related to the
implementation of integrated water resources management and development.
In 2005, the President created the Water and Sanitation Coordination Office (WASCO) at the Anti-
Poverty Commission with the purpose of implementing the Presidents Priority Programme on Water for
waterless municipalities. The Department of Health (DOH) monitors the quality of drinking water and
regulates premises with sanitation installations.
The Department of Interior and Local Government (DILG) provides technical assistance and capability
building to Local Government Units (LGUs) to help them manage water supply, sewerage and sanitation
services.
The Department of Public Works and Highways (DPWH) is responsible for flood control and drainage
infrastructures. The National Power Corporation (NPC) is responsible for the development of power
sources including hydropower.
The Department of Agriculture, through the National Irrigation Administration (NIA) is responsible for
irrigation development. In addition, through the Bureau of Soils and Water Management (BSWM),
research and technologies for soil and water conservation and harnessing rainwater for agricultural use
are developed for use of field extension staff of the local government units. The Agricultural Training
Institute (ATI), on the other hand, assists in translating the packages of technologies into information
and knowledge materials for the proper conservation and management of irrigation and water for
improve agricultural production.

14 Irrigation in Southern and Eastern Asia in figures - AQUASTAT Survey - 2011
The Metropolitan Waterworks and Sewerage System (MWSS) is a Government owned and Controlled
corporation established in 1971 and responsible for the provision of water, sewerage and sanitation
services in Metro Manila and parts of the provinces of Cavite and the entire province of Rizal. In 1997,
MWSS entered into a concession agreement on operation and maintenance with two concessionaires:
the East Zone was awarded to Ayala corporation, which was named the Manila Water Company Inc.
and the West Zone to Benpres Holding corporation named Maynilad Water Services Inc. The concession
agreement will last for 25 years unless terminated sooner or extended.
The Local Water Utilities Administration (LWUA) governs local water districts in municipalities and
cities, and review rates or charges established by local water utilities.
The Laguna Lake Development Authority was established in 1966 as a quasi-government agency that
leads, promotes, and accelerates sustainable development in the Laguna de Bay Region. Regulatory and
law-enforcement functions are carried out with provisions on environmental management, particularly
on water quality monitoring, conservation of natural resources, and community-based natural resource
management. This body is supposed to catalyse integrated water resources management (IWRM) in the
Laguna de Bay Region, showcasing the symbiosis of humans and nature for sustainability, with a focus
on preserving ecological integrity and promoting economic growth with equitable access to resources.
From the viewpoint of governance this is a unique case. It is a self-sufficient IWRM authority with a
high degree of autonomy for management and financing, and has been delegated the responsibilities of
regulating water allocation and tax revenues.
Water management
Water quantity is becoming a limiting constraint for livelihoods and production. Water is not perceived
yet as a critical and sensitive issue neither a real priority. There is no real concern about how water
resources are used. However, there is a growing awareness and concern about the negative impacts of
climate change and problems with pollution, poor water quality and hygiene issues, accompanying
rapidly increasing population density.
With high population growth rates, water demand is increasing fast, yet there has been no adequate
response. The discharge of domestic and industrial wastewater and agricultural runoff causes extensive
pollution of the receiving water-bodies. This effluent is in the form of raw sewage, detergents, fertilizer,
heavy metals, chemical products, oils and solid waste. As a consequence, conflicts between different
water users have increased.
Institutional arrangements, policy implementation and conflict resolution for water supply and water
resources are multi-level and the implementation mechanisms are relatively complex and fragmented.
A number of private organizations and coalitions are playing advocacy roles.
The NIA organized a total of 140 Irrigators’ Associations (IA) in both NIS and CIS nationwide with
15 951 farmer-members tilling 18 924 ha. Currently the total organized IA organized cover 1 109 684
ha, benefiting 735 879 member farmers. The NIA continues to provide assistance to the IAs in various
aspects of their farming activities and community livelihood programmes.
In 1997, the Department of Agriculture (DA) launched, a comprehensive, nationwide irrigation research
and development programme to support implementation of the Agriculture and Fisheries Modernization
Act (AFMA). AFMA recognizes that sustained agricultural growth provides an enduring solution to the
twin problems of poverty and food security. To ensure sustained agricultural growth and global
competitiveness, crop agriculture must focus on irrigated areas and 30 percent of the AFMA budget is
earmarked for irrigation. Further, AFMA was expanded by strengthening support services and
infrastructure for fisheries and livestock.

Philippines 15
Finances
In general, the national government sets aside funds annually for the rehabilitation and improvement of
irrigation for almost 3 percent, or about 27 000 ha that are lost to poor maintenance and the inability of
local communities to maintain irrigation canals and meet rehabilitation requirements as a result of the
almost yearly damage caused by typhoons.
Policies and legislation
The Philippine Constitution (1987) provides for the national enabling environment and overarching
policy on sustainable water use and water resources management. Right and access to water is well
enshrined in the constitution.
The Water Code of the Philippines (1976) consolidated the laws governing the ownership, appropriation,
utilization, exploitation, development, conservation and protection of water resources. It reiterates that
the water belongs to the State and cannot be the subject of acquisitive prescription. The State may allow
the use or the development of water resources by administrative concession, while the preference in the
use and development of water shall consider current usage and be responsive to the changing needs of
the country. It also reiterates that the measure and limit of appropriation of water shall be beneficial use,
which is defined as the utilization of water in the right amount during the period that the water is needed
for producing the benefits for which the water is appropriated. The administration and enforcement of
the provisions of the Water Code is vested in the National Water Resources Council now National Water
Resources Board. The Water Code is now being reviewed to tailor it to changing times and to meet
current and future challenges in the water sector.
Presidential Decree No. 424 (1974) created the National Water Resources Council (NWRC), which was
renamed the National Water Resources Board (NWRB) in 1987 by Executive Order 124-A. It has the
power to coordinate and integrate water resources development and management activities.
The Environmental Code (1997) prescribes, among other things, the management guidelines aimed to
protect and improve the quality of water resources through: classification of surface water and
establishment of water quality.
The Local Government Code (1991) provides for the empowerment of local executives in the delivery
of basic services, which includes water supply and sanitation services.
Republic Act No. 9275 (2004), otherwise known as the Clean Water Act, applies to water quality
management in all water bodies in the abatement and control of pollution from land-based sources. The
water quality standards and regulations shall be enforced irrespective of sources of pollution. The act
also provides that the DENR, in coordination with the NWRB, shall designate certain areas as water
quality management areas using appropriate physiographic units such as watersheds, river basins or
water resources regions.
The Philippine Water Supply Sector Roadmap is a joint effort of the National Economic Development
Agency (NEDA) and NWRB, together with various sector stakeholders, such as national government
agencies, water service providers and non-governmental organizations. It seeks to address the gaps and
challenges previously identified by various sector studies conducted by international development
agencies and research institutions, statistical data from the National Statistics Office (NSO) as well as
monitoring data from various government agencies such as the Department of Interior and Local
Government (DILG), Local Water Utilities Administration (LWUA) and the National Water Resources
Board (NWRB). It is designed to help the country meet the sector’s challenges and intended objectives
by 2010 in line with the targets defined by the 2004-2010 MTPDP. In the longer term, it also aims to
help the country meet the sector’s challenge in achieving the MDG goals.

16 Irrigation in Southern and Eastern Asia in figures - AQUASTAT Survey - 2011
ENVIRONMENT AND HEALTH
The government, through the National Poverty Commission, has placed high premium on the issue of
water and sanitation issues. The President’s Priority Programme for water for waterless municipalities
is classified into three main types of facilities: Level I, or point source system without distribution
facilities, Level II, or communal faucet system, and Level III, or individual household connection
system. Individual piped supplies (Level III) are provided by water districts, private operators, LGUs,
and community-based organizations (CBOs). Shared water supplies are provided by LGUs and CBOs
through barangay waterworks and sanitation associations (BWSAs) for point sources (Level I), and rural
waterworks and sanitation associations (RWSAs) for communal faucet systems (Level II).
Non-poor urban households mostly rely on septic tanks, which have been found to be poorly constructed
and maintained without provisions for dislodging, hence affecting their efficiency for primary treatment
of water. Sewerage coverage is very low. Less than 8 percent of the households in Metro Manila have
access to sewerage systems, while the over-all urban sewerage coverage is a measly 4 percent. Currently,
the few sewerage systems that exist cater to commercial establishments and affluent communities. To
ensure increasing and sustainable access to water supply and sanitation services, investment in the sector
has to increase rapidly. Current investment is inadequate to achieve the targets consistent with achieving
the MDGs. National government and donor financing must be matched by funds from local governments
and appropriate participation of the private sector encouraged.
In 1995, water demand in Metro Manila alone exceeded the available groundwater resources. In the
2025 projection, all the major cities will face water problems if water supply depends on groundwater
alone. The need to develop other water sources will be critical for sustaining the development of these
areas.
The population affected by water-related diseases in 2000 was 866 411.
About 73.3 percent of the cultivated area is limited to only three low-value and low-yielding crops: rice,
maize and coconut. Collectively, 42 percent of these croplands are degraded and are considered
vulnerable to the impacts of extreme climate events and global warming and climate change phenomena.
The BSWM reported about 23 million ha are suffering from various soil problems which is dominated
by soil infertility and steep slopes, accounting for more than 70 percent of the total area of the country.
In addition, a total of approximately 13.7 million ha are suffering from moderate to severe soil erosion,
which is one major driver of the loss of soil fertility in sloping lands.
The main flood-affected areas are in the central region of Luzon, namely the Pampanga, Zambales and
Tarlac provinces. About one million ha have been identified as flood-prone areas.
The Philippines has experienced temperature spikes, which could be the result of climate change. Since
1980, high temperatures have become more frequent along with extreme weather events. These include
deadly and damaging typhoons, floods, landslides, severe El Niño and La Niña events, drought, and
forest fires. Adversely affected sectors include agriculture, freshwater, coastal and marine resources and
health.
PROSPECTS FOR AGRICULTURAL WATER MANAGEMENT
Agricultural water is currently under threat by both climatic and non-climatic drivers. Changes in rainfall
pattern will significantly disrupt cropping systems, particularly in rainfed areas. It will become more
difficult and risky for farmers, in the face of climate change, to rely on rainfall for their planting calendar.
Extreme climate events will likely impinge the hydrological system in most of the river basins and will
mean water becoming either ‘too much’ or ‘too little’. When water becomes too much, the potential
effects include flooding from overflowing rivers and excessive runoff from sloping lands, which damage
water infrastructure, such as dams, and irrigation and drainage systems. At the other end, higher

Philippines 17
temperatures and decreased precipitation mean too little water, resulting in a decreased water supply
and an increased water demand, which might cause deterioration in the quality of freshwater bodies.
There will be possible alterations in the distribution of surface water and groundwater owing to changes
in recharging (gaining) and discharging (losing) patterns. Stream flows will be significantly reduced and
groundwater levels will decline, particularly shallow aquifers may dry up if water extraction is not
properly regulated. Non-climatic drivers owing to human activities will continuously provide more
pressure on water resources resulting in growing competition among water users.
In view of the above scenario, agricultural water management should incorporate the judicious use of
water resources and engineering measures. To be able to deal with ‘too little water’, focus needs to be
placed on both the demand and supply side of water management through water sources rehabilitation,
water conservation, and augmentation of water supply, such as the optimum utilization of wastewater
as an alternative to water sources for irrigation. To be able to deal with ‘ too much water’, drainage
facilities that are used to immediately remove excess flood waters will need to be improved. The design
of irrigation systems needs to be reviewed to include the effect of climate change and to incorporate
properly designed drainage facilities to protect standing crops. The construction of rainwater harvesting
structures (e.g. small water impounding project) to collect and store rainwater in the uplands could
contribute to the mitigation of floods downstream and ensure available water during the dry season.
MAIN SOURCES OF INFORMATION
DOH (Department of Health). 2003. Technical report of the National HIV/AIDS Sentinel Surveillance System
(NHSS)
Department of Public Works and Highways. 2004. Water and floods: A look at Philippine rivers and flood
mitigation efforts. Japan International Cooperation Agency (JICA)
FAO. 1999. Irrigation in Asia in figures. FAO Water Report No. 18. Rome.
FAO/UN WATER. 2009. GCP/GLO/182/MUL. BTOR Philippines
National Irrigation Administration. 2005. Annual Report.
NSCB (National Statistical Coordination Board). 2007. Press Release. Filipino families of five living in NCR
needed PhP 8,254 monthly income in 2006 to stay out of poverty (PR-200706-SS1-03, Posted 21 June 2007).
NWRB (National Water Resources Board). 1978. Survey/Inventory on Water Impounding Reservoir
NWRB (National Water Resources Board). 1998. Master study on water resources management in the Republic
of the Philippines. Japan International Cooperation Agency (JICA)
NWRB (National Water Resources Board). 2006. Estimation of local poverty in the Philippines.
Society for the Conservation of Philippine Wetlands, Inc. No Date. A National Wetland Action Plan for the
Philippines. Pasig City, Philippines. [email protected] and www.psdn.org.ph/wetlands
UNCCD (United Nations Convention to Combat Desertification). Bureau of Soils and Water Management. 2004. National Action Plan.
University of the Philippines Los Banos Foundation Inc. 2007. Comprehensive irrigation research and
development umbrella program (CIRDUP). Terminal Report.