Embed Size (px)
Citation preview

VERNON HILLS
PARK DISTRICT VERNON HILLS, ILLINOIS
COMPREHENSIVE ANNUAL FINANCIAL STATEMENTS
FOR THE YEAR ENDED MAY 31, 2019

VERNON HILLS PARK DISTRICT VERNON HILLS, ILLINOIS
COMPREHENSIVE ANNUAL
FINANCIAL REPORT
For the Fiscal Year Ended May 31, 2019
Prepared by:
Business Staff

VERNON HILLS PARK DISTRICT VERNON HILLS, ILLINOIS TABLE OF CONTENTS
Page(s)
INTRODUCTORY SECTION Organizational Chart ..................................................................................................... i Certificate of Achievement for Excellence in Financial Reporting .............................. ii Principal Officials ......................................................................................................... iii Transmittal Letter.......................................................................................................... iv-vi
FINANCIAL SECTION INDEPENDENT AUDITOR’S REPORT .................................................................... 1-3 GENERAL PURPOSE EXTERNAL FINANCIAL STATEMENTS Management’s Discussion and Analysis .................................................................. MD&A 1-10 Basic Financial Statements Government-Wide Financial Statements Statement of Net Position ............................................................................... 4 Statement of Activities ................................................................................... 5-6 Fund Financial Statements Governmental Funds Balance Sheet ............................................................................................. 7-8 Reconciliation of Fund Balances of Governmental Funds to the Governmental Activities in the Statement of Net Position ................ 9 Statement of Revenues, Expenditures and Changes in Fund Balances ..... 10-11 Reconciliation of the Governmental Funds Statement of Revenues, Expenditures and Changes in Fund Balances to the Governmental Activities in the Statement of Activities .................................................. 12

VERNON HILLS PARK DISTRICT VERNON HILLS, ILLINOIS TABLE OF CONTENTS (Continued)
Page(s)
FINANCIAL SECTION (Continued) GENERAL PURPOSE EXTERNAL FINANCIAL STATEMENTS (Continued) Fund Financial Statements (Continued) Proprietary Funds Statement of Net Position ............................................................................. 13 Statement of Revenues, Expenses and Changes in Fund Net Position ........ 14 Statement of Cash Flows .............................................................................. 15 Notes to Financial Statements ............................................................................. 16-39 Required Supplementary Information Schedule of Revenues, Expenditures and Changes in Fund Balance - Budget and Actual General Fund .................................................................................................. 40 Recreation Fund .............................................................................................. 41 Lakeview Fitness Center Fund ....................................................................... 42 Illinois Municipal Retirement Fund Schedule of Employer Contributions ............................................................. 43 Schedule of Changes in the Employer’s Net Pension Liability and Related Ratios ........................................................................................ 44 Notes to Required Supplementary Information .................................................. 45 COMBINING AND INDIVIDUAL FUND FINANCIAL STATEMENTS AND SCHEDULES MAJOR GOVERNMENTAL FUNDS Schedule of Detailed Expenditures - Budget and Actual General Fund .................................................................................................. 46 Recreation Fund .............................................................................................. 47-49 Lakeview Fitness Center Fund ....................................................................... 50-52 Schedule of Revenues, Expenditures and Changes in Fund Balances - Budget and Actual Bond Fund ...................................................................................................... 53 Capital Fund ................................................................................................... 54

VERNON HILLS PARK DISTRICT VERNON HILLS, ILLINOIS TABLE OF CONTENTS (Continued)
Page(s) COMBINING AND INDIVIDUAL FUND FINANCIAL STATEMENTS AND SCHEDULES (Continued) NONMAJOR GOVERNMENTAL FUNDS Combining Balance Sheet ................................................................................... 55 Combining Statement of Revenues, Expenditures and Changes in Fund Balances .......................................................................... 56 Schedule of Revenues, Expenditures and Changes in Fund Balance - Budget and Actual Special Recreation Fund ................................................................................. 57 Family Aquatic Center Fund .......................................................................... 58 Schedule of Detailed Expenditures - Budget and Actual Family Aquatic Center Fund .......................................................................... 59
STATISTICAL SECTION Financial Trends Net Position ............................................................................................................... 60-61 Change in Net Position ............................................................................................. 62-65 Fund Balances of Governmental Funds .................................................................... 66-67 Changes in Fund Balances of Governmental Funds ................................................. 68-69 Revenue Capacity Assessed Value and Estimated Actual Value of Taxable Property ........................... 70 Principal Property Taxpayers .................................................................................... 71 Property Tax Rates - Direct and Overlapping Governments .................................... 72 Property Assessment and Tax Information ............................................................... 73-74 Property Tax Levies and Collections ........................................................................ 75 Debt Capacity Ratios of Outstanding Debt by Type ......................................................................... 76 Ratios of General Bonded Debt Outstanding ............................................................ 77 Detailed Overlapping Bonded Debt .......................................................................... 78 Legal Debt Margin Information ................................................................................ 79-80 Demographic and Economic Information Demographic and Economic Information ................................................................. 81 Principal Employers .................................................................................................. 82 Full-time Employees ................................................................................................. 83 Operating Information Operating Indicators .................................................................................................. 84 Capital Asset Statistics .............................................................................................. 85

INTRODUCTORY SECTION

Vernon Hills Residents
Park Commissioner David Doerhoefer
Rec Supervisor IIGail Herrmann
Accounting Supervisor Debi Minske
Marketing Specialist Cassidy Reinhard
Park Commissioner Mike Meline
Park CommissionerBruce Robbins
Park Commissioner Cindy Kessler
Superintendent of RecTom Ritter
Rec Supervisor II Jason Bullman
Rec Supervisor IRobert WoodRec Supervisor I
Jack Scherer
Bus Operations Mgr Cathy Marcangelo
Customer Service RepPatty Monatelli
Customer Service RepMary VanderMey
Facility Maint Tech I Stefan Dobre
Facility Maint Tech I Tanner Williams
Building MaintenanceSean Ryan
Park Maintenance IIJerry Hughes
Building MaintenanceTom Bodkin
Park Maintenance IGeorge Olivares
Park Maintenance IAndrew Pristas
Supt of Finance/HR Marla DeCicco
Mktg & Comm MgrCheryl Buhmann
Administrative AsstAmy Darling
Superintendent of Parks James Kim
Facility ManagerJoe Zimmermann
Park Commissioner Jim Ballowe
Executive DirectorJeff Fougerousse
Vernon Hills Park District Organizational Chart
Updated June 2019
Addressing the lifelong leisure needs of
all Vernon Hills residents.
Athl Field Maint SpecialistJohn Christensen
Park Maintenance IJames Schubert
Park Maintenance ICarey Pilman
Park Maintenance IIGaby Rodriguez
IT ManagerRandy Clark
Childcare ManagerRuth Reichenbach
Facilities ForemanDavid Cwiak
Registration CoordinatorJenny Sundell
Parks ForemanRick Krocza
Park Maintenance I David Hutchinson
Childcare Supervisor Melinda Agosto
Childcare Teacher Ashley Eckhart
Childcare Teacher Amy Goetz
Childcare Teacher Charlene Hedrick
Childcare Teacher Amy Johnson
Childcare Teacher Laura Rydberg
Childcare TeacherKaren Klinger
Childcare Teacher Angela Tossman
Childcare Teacher Jennifer Echeverria
Childcare Teacher Susan Kadletc
Childcare Teacher Lorena Vazquez
Rec Supervisor IIAnna Swain
Rec Leader-SouthSean Chatterjee
HAP Supervisor-NorthDonna Brosmith
HAP Supervisor-SouthMaureen Hilliard
Facility SupervisorLacy Velasquez
HR/Risk ManagerJessica Mitchell
- i -

- ii -
- iii -
VERNON HILLS PARK DISTRICT VERNON HILLS, ILLINOIS
PRINCIPAL OFFICIALS
MAY 31, 2019
BOARD OF PARK COMMISSIONERS
David Doerhoefer, President
Jim Ballowe, Vice President
Mike Meline, Commissioner
Cindy Kessler, Commissioner
Bruce Robbins, Commissioner
ADMINISTRATIVE STAFF
Jeff Fougerousse, Executive Director/Board Secretary
Marla DeCicco, Superintendent of Finance & HR/Treasurer
Tom Ritter, Superintendent of Recreation
James Kim, Superintendent of Parks


- v -
The District operates under a commissioner-director form of government. The Board consists of five individuals who are elected from the District at large to serve six-year staggered terms. The Board is vested with all policymaking and legislative responsibilities. The Board employs an Executive Director to administer the policies, programs, and direct staff. Some of the Board responsibilities include approval of the budget, tax levy, ordinances, long-term financial and capital planning; as well as establishment of committees and appointment of the District's attorney, treasurer and Board secretary. LONG-TERM FINANCIAL PLANNING The District has established cash reserve policies to ensure funds are available for future operating, emergency and cash flow needs. In addition, the Board, Executive Director and Division Heads meet annually to review the district’s five-year Capital Improvement Plan. The Capital Improvement Plan (CIP) is a planning tool that addresses the operational impact of projects and enables staff to incorporate these costs into the operating budget. The CIP flows directly from the District’s five-year Parks and Recreation Master Plan, which currently covers the period 2019 to 2023. The District’s overall direction and priorities are provided in a five-year strategic plan. The District’s Strategic Plan is based on community feedback and defines priorities to guide the Board in setting policy and approving budgets based on community desires and needs and clarifies organizational direction. The Strategic Plan is reviewed annually and the results are shared with the community in an online report card.
MAJOR INITIATIVES For the Year. Each year when preparing the budget, the District reviews its annual capital improvement plan. The five-year plan identifies facilities, equipment or programs that need to be either acquired, developed or expanded to better meet the needs of the citizens and to enhance the quality of recreation within the community. The plan is revised annually to reflect changes in the population being served, the financial capacity, and condition of the District, and the impact that these two factors have on the programming needs of the citizens. The majority of the District's capital improvements focus on park improvements, vehicle and equipment replacement, technology upgrades, repair, and/or replacement of existing facilities and equipment, as well as compliance with safety standards and legal requirements. Projects for the year included the renovation of Century Park South including replacing approximately 65 percent of the parking lot with grass, creating a new branch of the park’s trail and building a bathroom structure. New playgrounds were installed at the Little Learners Childcare Center, Kelli Garvanian Park and Ranney Park. Pickle ball courts were constructed in Century Park. New vehicles and equipment were purchased for the park maintenance staff including a new plow, Kubota tractor and a Flail mower.
For the Future. In fiscal 2020, the District will install new playground equipment at the District 73 Kindergarten Building adjacent to the Sullivan Community Center. Flooring and bathrooms will be upgraded at the Little Learners Childcare facility. The current inline skating structure in Hartmann Park will be replaced with a Futsol Court. Evergreen Lake will be dredged and light poles will be replaced throughout the District. The District will also continue to expand their environmental initiatives and provide new wellness initiatives for staff and residents.

- vi -
Debt Administration. As of May 31, 2019, the District had outstanding debt of $9,736,691. $8,896,385 in General Obligation Bonds and $840,306 owed to the Village of Vernon Hills for the purchase of the YMCA. On January 1, 2013, the park district entered into an installment agreement with the Village of Vernon Hills to repay a loan made by the village to purchase the YMCA. The loan is for $2,025,000 for 0% interest with a maturity date of December 31, 2027. Under State Statutes, the District's aggregate indebtedness cannot exceed the legal debt limit of 2.875% of the value of the taxable property within the District. As of May 31, 2019, the District's aggregate outstanding debt is well below the $35,301,452 limit set by law. OTHER INFORMATION Independent Audit. Illinois Compiled Statutes require an annual audit by independent certified public accountants. The District’s Board of Park Commissioners selected the accounting firm of Knutte and Associates P.C., Certified Public Accountants. The auditor's report on the general-purpose financial statements and combining and individual fund statements and schedules is included in the financial section of this report. Certificate of Achievement – The Government Finance Officers Association (GFOA) awarded a Certificate of Achievement for Excellence in Financial Reporting to the government for its comprehensive annual financial report for the fiscal year ended May 31, 2018. This was the 24th consecutive year that the government has received this prestigious award. In order to be awarded a Certificate of Achievement, the District published an easily readable and efficiently organized comprehensive annual financial report. This report satisfied both generally accepted accounting principles and applicable legal requirements. A Certificate of Achievement is valid for a period of one year only. We believe that our current comprehensive annual financial report continues to meet the Certificate of Achievement Program’s requirements and we are submitting it to the GFOA to determine its eligibility for another certificate. Acknowledgements – This report is the result of the combined efforts of the Executive Director, the Superintendent of Finance & HR and the Finance Assistant of the Park District working with an independent auditor and accounting firm. This report is prepared at one time during the year, but would not be possible without the consistent attention to procedures and to monitoring of accounts by the Superintendent of Finance & Human Resources/Treasurer and Finance Assistant of the District. The support of the Board of Park Commissioners throughout the year is also essential to ensure a sound financial environment in which to conduct the operations of the Vernon Hills Park District. Respectfully submitted,
Jeffrey Fougerousse, CPRP Marla DeCicco, CPRP Executive Director/Board Secretary Superintendent of Finance & HR/Treasurer

FINANCIAL SECTION

1415 West Diehl Road, Suite 400
Naperville, IL 60563
630.566.8400
INDEPENDENT AUDITOR’S REPORT Board of Commissioners Vernon Hills Park District Vernon Hills, Illinois We have audited the accompanying financial statements of the governmental activities, business-type activities, each major fund and the aggregate remaining fund information of the Vernon Hills Park District (the District) as of and for the year ended May 31, 2019 and the related notes to financial statements, which collectively comprise the District’s basic financial statements as listed in the table of contents. Management’s Responsibility for the Financial Statements Management is responsible for the preparation and fair presentation of these financial statements in accordance with accounting principles generally accepted in the United States of America; this includes the design, implementation and maintenance of internal control relevant to the preparation and fair presentation of financial statements that are free from material misstatement, whether due to fraud or error. Auditor’s Responsibility Our responsibility is to express opinions on these financial statements based on our audit. We conducted our audit in accordance with auditing standards generally accepted in the United States of America. Those standards require that we plan and perform the audit to obtain reasonable assurance about whether the financial statements are free from material misstatement. An audit involves performing procedures to obtain audit evidence about the amounts and disclosures in the financial statements. The procedures selected depend on the auditor’s judgment, including the assessment of the risks of material misstatement of the financial statements, whether due to fraud or error. In making those risk assessments, the auditor considers internal control relevant to the District’s preparation and fair presentation of the financial statements in order to design audit procedures that are appropriate in the circumstances, but not for the purpose of expressing an opinion on the effectiveness of the District’s internal control. Accordingly, we express no such opinion. An audit also includes evaluating the appropriateness of accounting policies used and the reasonableness of significant accounting estimates made by management, as well as evaluating the overall presentation of the financial statements.
- 1 -

- 2 -
We believe that the audit evidence we have obtained is sufficient and appropriate to provide a basis for our audit opinions. Opinions In our opinion, the financial statements referred to above present fairly, in all material respects, the respective financial position of the governmental activities, business-type activities, each major fund and the aggregate remaining fund information of the Vernon Hills Park District, Vernon Hills, Illinois as of May 31, 2019, and the respective changes in financial position and, where applicable, cash flows thereof for the year then ended in accordance with accounting principles generally accepted in the United States of America.
Other Matters As part of our audit of the 2019 financial statements we also audited adjustments described in Note 11 that were applied to restate the 2018 financial statements. In our opinion, such adjustments are appropriate and have been properly applied. We were not engaged to audit, review, or apply any procedures to the 2018 financial statements of the District other than with respect to the adjustments and, accordingly, we do not express an opinion or any other form of assurance on the 2018 financial statements as a whole. Required Supplementary Information
Accounting principles generally accepted in the United States of America require that the management’s discussion and analysis and required supplementary information listed in the table of contents be presented to supplement the basic financial statements. Such information, although not a part of the basic financial statements, is required by the Governmental Accounting Standards Board, who considers it to be an essential part of financial reporting for placing the basic financial statements in an appropriate operational, economic or historical context. We have applied certain limited procedures to the required supplementary information in accordance with auditing standards generally accepted in the United States of America, which consisted of inquiries of management about the methods of preparing the information and comparing the information for consistency with management’s responses to our inquiries, the basic financial statements and other knowledge we obtained during our audit of the basic financial statements. We do not express an opinion or provide any assurance on the information because the limited procedures do not provide us with sufficient evidence to express an opinion or provide any assurance. Other Information
Our audit was conducted for the purpose of forming opinions on the financial statements that collectively comprise the District’s basic financial statements. The introductory section, combining and individual fund financial statements and schedules and statistical section are presented for purposes of additional analysis and are not a required part of the basic financial statements.
- 2 -

- 3 -
The combining and individual fund financial statements and schedules are the responsibility of management and were derived from and relate directly to the underlying accounting and other records used to prepare the basic financial statements. The information has been subjected to the auditing procedures applied in the audit of the basic financial statements and certain additional procedures, including comparing and reconciling such information directly to the underlying accounting and other records used to prepare the basic financial statements or to the basic financial statements themselves, and other additional procedures in accordance with auditing standards generally accepted in the United States of America. In our opinion, the information is fairly stated in all material respects in relation to the basic financial statements as a whole. The introductory and statistical sections have not been subjected to the auditing procedures applied in the audit of the basic financial statements and, accordingly, we do not express an opinion or provide any assurance on them. Naperville, Illinois December 10, 2019
- 3 -

GENERAL PURPOSE EXTERNAL FINANCIAL STATEMENTS

VERNON HILLS PARK DISTRICT, ILLINOIS Management’s Discussion and Analysis May 31, 2019
MD&A 1
Our discussion and analysis of the Vernon Hills Park District’s financial performance provides an overview of the Park District’s financial activities for the fiscal year ended May 31, 2019. Please read it in conjunction with the transmittal letter, which begins on page iv and the Park District’s financial statements, which begin on page 4. FINANCIAL HIGHLIGHTS
• The Park District’s net position from governmental and business type activities decreased as a result of this year’s operations by $13,409 or .1 percent. By recommendation of our auditors, the District is presenting the Vernon Hills new kindergarten building construction as a proprietary fund.
• During the year, Governmental Activity revenues totaled $10,316,506 while expenses totaled $10,866,043. With Business type activities totaling $536,128 resulted in a decrease of net position ($13,409).
• The Vernon Hills Park District government-wide net position totaled $25,418,658 on
May 31, 2019, which includes $26,014,912 net investment in capital assets, $387,678 subject to external restrictions and ($983,932) unrestricted net position.
• The General Fund reported an operating surplus this year of $128,433. After a transfer of
$500,000 to the Capital Fund the General Fund’s ending fund balance of $761,040 is a decrease of 32.8 percent.
• The Recreation Fund reported an operating surplus this year of $249,515. The Recreation
Fund’s ending fund balance of $2,495,670 is an increase of 10.8 percent.
• The net position of the District’s proprietary fund increased to $1,280,036. USING THIS ANNUAL REPORT This annual report consists of a series of financial statements. The Statement of Net Position and the Statement of Activities (on pages 4-6) provide information about the activities of the Park District as a whole and present a longer-term view of the Park District’s finances. Fund financial statements begin on page 7. For governmental activities, these statements tell how these services were financed in the short term as well as what remains for future spending. Fund financial statements also report the Park District’s operations in more detail than the government-wide statements by providing information about the Park District’s most significant funds. The government-wide financial statements provide readers with a broad overview of the Park District’s finances, in a matter similar to a private-sector business.

VERNON HILLS PARK DISTRICT, ILLINOIS Management’s Discussion and Analysis May 31, 2019
MD&A 2
USING THIS ANNUAL REPORT – Continued Government-Wide Financial Statements – Continued The Statement of Net Position reports information on all of the Park District’s assets and liabilities/deferred inflows, with the difference between the two reported as net position. Over time, increases or decreases in net position may serve as a useful indicator of whether the financial position of the Park District is improving or deteriorating. Consideration of other nonfinancial factors, such as changes in the Park District’s property tax base and the condition of the Park District’s parks, is needed to assess the overall health of the Park District. The Statement of Activities presents information showing how the government’s net position changed during the most recent fiscal year. All changes in net position are reported as soon as the underlying event giving rise to the change occurs, regardless of the timing of related cash flows. Thus, revenues and expenses are reported in this statement for some items that will only result in cash flows in future fiscal periods (e.g., unused vacation leave). The Park District’s activities are all recorded as governmental activities, which include recreation and interest on long-term debt. Fund Financial Statements A fund is a grouping of related accounts that is used to maintain control over resources that have been segregated for specific activities or objectives. The Park District, like other local governments, uses fund accounting to ensure and demonstrate compliance with finance-related legal requirements. All of the funds of the Park District are reported as governmental funds. Governmental Funds Governmental funds are used to account for essentially the same functions reported as governmental activities in the government-wide financial statements. However, governmental fund financial statements focus on near-term inflows and outflows of spendable resources, as well as on balances of spendable resources available at the end of the fiscal year. Such information may be useful in evaluating the Park District’s near-term financing requirements. Because the focus of governmental funds is narrower than that of the government-wide financial statements, it is useful to compare the information presented for governmental funds with similar information presented for governmental activities in the government-wide financial statements. By doing so, readers may better understand the long-term impact of the government’s near-term financing decisions. Both the governmental fund balance sheet and the governmental fund statement of revenues, expenditures, and changes in fund balances provide a reconciliation to facilitate the comparison between governmental funds and governmental activities.

VERNON HILLS PARK DISTRICT, ILLINOIS Management’s Discussion and Analysis May 31, 2019
MD&A 3
USING THIS ANNUAL REPORT – Continued
Governmental Funds – Continued The Park District maintains eight individual governmental funds. Information is presented separately in the governmental fund balance sheet and in the governmental fund statement of revenues, expenditures, and changes in fund balances for the General Fund, Recreation Fund, Bond Fund, Capital Fund, and Lakeview Fitness Center Fund, all of which are reported as major funds. Data from the other two governmental funds, Family Aquatic Center, Special Recreation and Kindergarten Building are combined into a single, aggregated presentation. Individual fund data for each of these non-major governmental funds is provided in the form of combining statements elsewhere in this report. The Park District adopts an annual appropriated budget for all of the governmental funds. A budgetary comparison schedule for these funds has been provided to demonstrate compliance with this budget. The basic governmental fund financial statements can be found on pages 7-12 of this report. Proprietary Funds Based on the recommendation of the District’s audit firm, the District is presenting the construction of the Vernon Hills Kindergarten building as a Proprietary Fund (Business –Type) from last years’ presentation as proceeds from an intergovernmental agreement. Notes to the Financial Statements The notes provide additional information that is essential to a full understanding of the data provided in the government-wide and fund financial statements. The notes to the financial statements can be found on pages 16-39 of this report. Other Information In addition to the basic financial statements and accompanying notes, this report also presents certain required supplementary information concerning the Park District’s Illinois Municipal Retirement Fund employee pension obligation as well as budgetary comparison schedules for the General Fund and the Park District’s major special revenue funds, the Recreation Fund and the Lakeview Fitness Center Fund. Required supplementary information can be found on pages 40-45 of this report. The combining statements referred to earlier in connection with non-major governmental funds are presented immediately following the required supplementary information on pensions. Combining and individual fund statements and supplemental schedules can be found on pages 46-59 of this report. Long-term statistical comparisons are presented beginning on page 60.

VERNON HILLS PARK DISTRICT, ILLINOIS Management’s Discussion and Analysis May 31, 2019
MD&A 4
GOVERNMENT-WIDE FINANCIAL ANALYSIS Statement of Net Position - Net position may serve over time as a useful indicator of a government’s financial position. The following tables show that in the case of the Park District, assets/deferred outflows exceeded liabilities/deferred inflows by $25,418,658. A summary of statement of net position is presented in the chart below. Governmental Business-Type Total
2019 2018 2019 2018 2019 2018
ASSETS
Current and Other Assets 9,899,222$ 10,373,355$ 4,355,934$ 33,203$ 14,255,156$ 10,406,558$
Capital Assets 31,450,034$ 31,948,020$ 1,779,285$ 710,705$ 33,229,319$ 32,658,725$
Total Assets 41,349,256$ 42,321,375$ 6,135,219$ 743,908$ 47,484,475$ 43,065,283$
Deferred Outflows 892,261$ 379,139$ -$ -$ 892,261$ 379,139$
Total Assets & Outflows 42,241,517$ 42,700,514$ 6,135,219$ 1,487,816$ 48,376,736$ 43,444,422$
LIABILITIES
Current Liabilities 1,183,051$ 2,697,573$ 366,433$ -$ 1,549,484$ 2,697,573$
Long-Term Liabilities 11,595,256$ 9,472,633$ 4,488,750$ -$ 16,084,006$ 9,472,633$
Total Liabilities 12,778,307$ 12,170,206$ 4,855,183$ -$ 17,633,490$ 12,170,206$
Deferred Inflows 5,324,588$ 5,838,290$ -$ -$ 5,324,588$ 5,838,290$
Total Liabilities & Inflows 18,102,895$ 18,008,496$ 4,855,183$ -$ 22,958,078$ 18,008,496$
NET POSITION
Net Investment in Capital Assets 24,235,627$ 23,818,815$ 1,779,285$ -$ 26,014,912$ 23,818,815$
Restricted 387,678$ 408,730$ -$ -$ 387,678$ 408,730$
Unrestricted (484,683)$ 1,175,178$ (499,249)$ 33,203$ (983,932)$ 1,208,381$ Total Net Position 24,138,622$ 25,402,723$ 1,280,036$ 33,203$ 25,418,658$ 25,435,926$
A large portion of Park District’s net position, $26,014,912 reflects its investment in capital assets (for example, land, buildings, machinery, and equipment), less any related debt used to acquire those assets that is still outstanding. The Park District uses these capital assets to provide services to residents; consequently, these assets are not available for future spending. Although the Park District’s investment in its capital assets is reported net of related debt, it should be noted that the resources needed to repay this debt must be provided from other sources, since the capital assets themselves cannot be used to liquidate these liabilities. The District’s Business-Type (Kindergarten Building) increased in 2019 to $1,280,036 An additional portion, $387,678 or 1.7 percent, of the Park District’s net position represents resources that are subject to external restrictions on how they may be used.

VERNON HILLS PARK DISTRICT, ILLINOIS Management’s Discussion and Analysis May 31, 2019
MD&A 5
GOVERNMENT-WIDE FINANCIAL ANALYSIS – Continued Statement of Changes in Net Position- A summary of changes in net position is presented in the chart below. Governmental Business-Type Total
2019 2018 2019 2018 2019 2018
Revenues
Program Revenues
Charges fro Services 4,680,777$ 4,864,241$ -$ -$ 4,680,777$ 4,864,241$
Capital Grants /Contributions 473,605$ 1,131,353$ -$ -$ 473,605$ 1,131,353$
General Revenues
Taxes 5,008,603$ 4,863,808$ -$ -$ 5,008,603$ 4,863,808$
Investment 104,351$ 51,900$ 104,351$ 51,900$
Business-Type Activities 536,128$ 780,000$ 536,128$ 780,000$
Miscellaneous 49,170$ 107,964$ 49,170$ 107,964$
Total Revenues 10,316,506$ 11,019,266$ 536,128$ 780,000$ 10,852,634$ 11,799,266$
Expenses
General Government 2,348,818$ 2,156,528$ -$ -$ 2,348,818$ 2,156,528$
Parks & Recreation 8,252,731$ 7,691,114$ -$ -$ 8,252,731$ 7,691,114$
Interest 264,494$ 257,924$ -$ -$ 264,494$ 257,924$
Total Expenses 10,866,043$ 10,105,566$ -$ -$ 10,866,043$ 10,105,566$
Change in Net Position (549,537)$ 913,700$ 536,128$ 780,000$ (13,409)$ 1,693,700$
Net Position- Beginning 25,402,723$ 24,489,023$ 33,203$ (746,797)$ 25,435,926$ 23,742,226$
Period Adlustment (714,564)$ -$ 710,705$ -$ (3,859)$ -$
Net Position- Ending 24,138,622$ 25,402,723$ 1,280,036$ 33,203$ 25,418,658$ 25,435,926$
The net position of the Park District’s government wide activities decreased by .1 percent ($25,432,067) in 2018, compared to ($25,418,658) in 2019 Governmental and Business-Type Activities Revenues for governmental and business type activities totaled $10,852,634 while the cost of all functions totaled $10,866,043. This resulted in a decrease of $13,409. In 2018, revenues of $11,799,326 exceeded expenses of $10,105,566 resulting in a surplus of $1,693,760. A surplus in 2019 was budgeted due to anticipated revenues and expenses in the Corporate and Recreational Funds and the additional impact fees received in the Capital Fund. Additionally, the District was able to invest in capital assets such as the park and playground improvements at Century Park, Ranney Park and the Lakeview Fitness center, purchase of several new park maintenance vehicles and new fitness equipment at the Lakeview Fitness Center.
VERNON HILLS PARK DISTRICT, ILLINOIS Management’s Discussion and Analysis May 31, 2019
MD&A 6
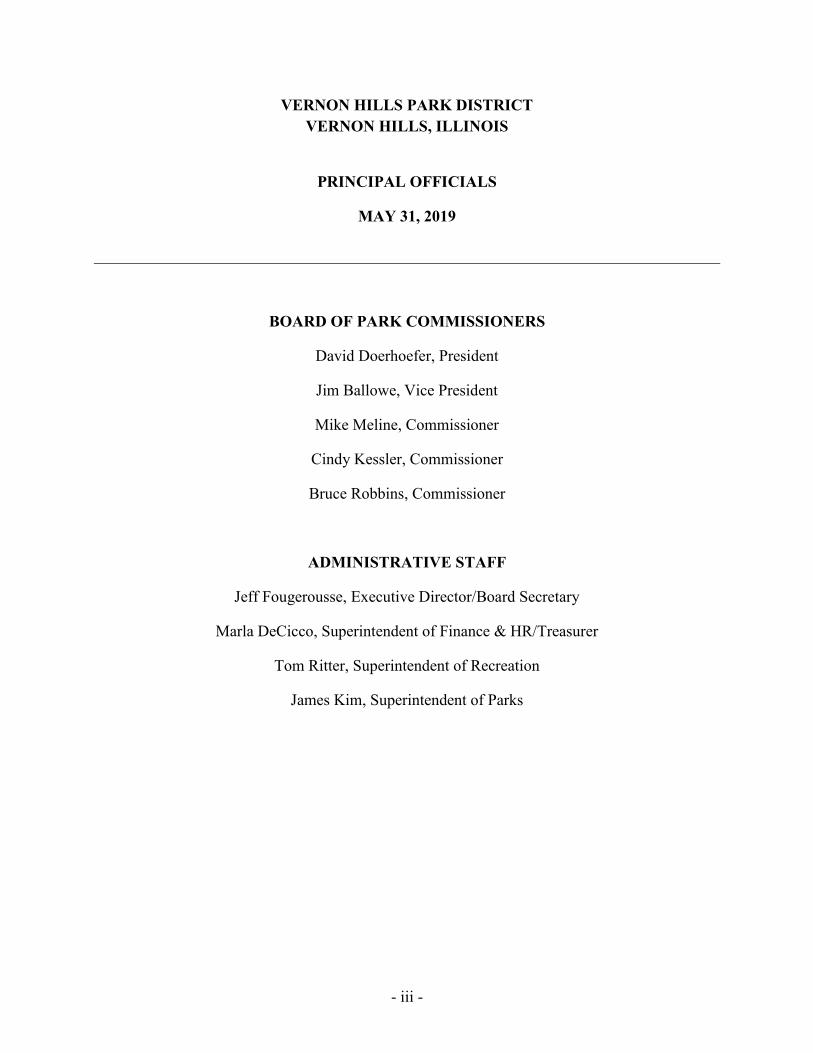
GOVERNMENT-WIDE FINANCIAL ANALYSIS – Continued Governmental Activities The following table graphically depicts the major revenue sources for governmental activities of the Park District. It depicts very clearly the reliance on property taxes and charges for services to fund governmental activities. It also clearly identifies the less significant percentage the District receives from replacement taxes and interest income.
Charges for Services43.13%
Capital Grants/Contrib.
4.4%
Property Taxes44%
Replacement Taxes0.23%
Interest Income0.96% Miscellaneous
7.28%
Governmental Activities Revenue - May 31, 2019
The ‘Governmental Activities Expenses and Program Revenues’ Table identifies those governmental functions where program expenses greatly exceed revenues. For the Recreation Function, the Park District charges direct user fees (charges for services) that don’t entirely offset the cost of Recreation Function expenses; therefore, the Park District levies property taxes to support the remaining expenses of the Recreation Function.

VERNON HILLS PARK DISTRICT, ILLINOIS Management’s Discussion and Analysis May 31, 2019
MD&A 7
$- $2,000,000 $4,000,000 $6,000,000 $8,000,000
$10,000,000 $12,000,000
Recreation Interest on Long-Term Debt
Governmental Activities Expenses and Program Revenues - May 31, 2019
Revenues
Expenses
FINANCIAL ANALYSIS OF THE GOVERNMENT’S FUNDS As noted earlier, the Park District uses fund accounting to ensure and demonstrate compliance with finance-related legal requirements. Governmental Funds The focus of the Park District’s governmental funds is to provide information on near-term inflows, outflows, and balances of spendable resources. In particular, unrestricted fund balance may serve as a useful measure of a government’s net resources available for spending at the end of the fiscal year. The Park District’s governmental funds reported total ending fund balances of $3,789,128, which is $566,050 or 13.0 percent, lower than last year’s total of $4,355,178. Of the $3,789,128 total, $3,390,266 or approximately 90 percent, of the fund balance constitutes unrestricted fund balance. The General Fund reported an ending fund balance of $761,040 or a reduction in fund balance from the previous year of $371,567. A major factor for the reduction was a transfer of $500,000 to the Capital Fund. The General Fund’s operating surplus revenues and expenses are further outlined on the General Fund Schedule of Revenues, Expenditures and Changes in Fund Balance on page 40. The Recreation Fund reported an ending fund balance of $2,495,670 or a positive change in fund balance for the year of $243,953, an increase of 11 percent. The Recreation Fund surplus was in large part due to a successful before and afterschool program. Variances are further outlined on the Recreation Fund Schedule of Revenues, Expenditures and Changes in Fund Balance on page 41. The Lakeview Fitness Center Fund (LFC) reported a negative ending fund balance of ($870,262). Due to tough area competition, LFC reported an operating deficit of ($190,465) (budgeted deficit was ($163,083) for the fiscal year. LFC revenues of $1,918,527 were 3 percent higher than the previous year and expenses for staff and building improvements were 2 percent over last year. LFC showed consistent revenue results in fitness and child care operations. Fitness had revenues of $1,645,491 vs $1,692,019 in FY 2018. There is no property tax revenue currently assigned to this fund to make up any deficits.

VERNON HILLS PARK DISTRICT, ILLINOIS Management’s Discussion and Analysis May 31, 2019
MD&A 8
FINANCIAL ANALYSIS OF THE GOVERNMENT’S FUNDS – Continued Governmental Funds – Continued Due to management oversight of operations, expenses were exactly as budgeted. Variances are further outlined on the Lakeview Fitness Fund schedule of Revenues, Expenditures and Changes in Fund Balance on page 42. The Bond Fund reported an ending fund balance of $336,502, a decrease in fund balance for the year of $11,815. Series 2016A bonds of $6,000,000 were issued to pay for the District’s Sullivan Community Center renovation. Retirement of $455,000 of Series 2013A bond principal took place in FY 2019. New Series 2018 of $1,031,385 were issued. Installment contract annual payments of $84,030 are due through Dec.31, 2029. These changes are further outlined on the Debt Service Fund Schedule of Revenues, Expenditures and Changes in Fund Balance on page 53. The Capital Fund reported an ending fund balance of $1,297,793, a decrease in fund balance of ($136,065). The Capital Fund received a transfer of $500,000 from the General Fund and $335,000 from the Debt Service Fund to help with required long term capital project expenses. Variances are further outlined on the Capital Fund Schedule of Revenues, Expenditures and Changes in Fund Balance on page 54. The General Fund and Recreation Fund are the two chief operating funds of the Park District. At May 31, 2019 unrestricted fund balance in these two funds was $3,245,526, which represents 99 percent of the total fund balance in both funds. As a measure of the both funds liquidity, it may be useful to compare unrestricted fund balance to total fund expenditures. Unrestricted fund balance in the General and Recreation Fund represent approximately 55% the total funds’ expenditures. GENERAL FUND BUDGETARY HIGHLIGHTS The Park District Board did not amend the General Fund budget during the year. General Fund actual revenues for the year totaled $2,390,919 compared to budgeted revenues of $2,391,655. Property taxes of $2,296,949 were $14,022 over budget. Replacement taxes were under budget by $699 and investment income was $38,413 over budget. The General Fund actual expenditures for the year were $90,439 over budget ($2,262,486 actual compared to $2,172,047 budgeted). The majority of this negative variance is due to higher than expected expenditures for professional fees and credit card expenses. The Park District Board and District management continue to consciously work to tighten the budget on expenditures.

VERNON HILLS PARK DISTRICT, ILLINOIS Management’s Discussion and Analysis May 31, 2019
MD&A 9
CAPITAL ASSETS AND DEBT ADMINISTRATION Capital Assets The Park District’s investment in capital assets for its governmental activities as of May 31, 2019 was $31,450,034 (net of accumulated depreciation). This investment in capital assets includes land, buildings and improvements, vehicles and equipment, playground renovations and parking lot equipment and improvements. The District’s capital investments in the new kindergarten building increased to $1,779,285.
2019 2018
Governmental Activities $ 31,450,034 31,900,477Business-Type Activities 1,779,285 758,248
Total 33,229,319 32,658,725
Capital Assets - Net of DepreciationGovernment-Wide
Activities
This year’s major additions included:
Buildings and Improvements $ 181,263 Construction In Process 1,021,037 Machinery and Equipment 672,538
1,874,838
Major additions in governmental activities included playground replacements and upgrades at Ranney Park, Kelli Garvanian Park, Century Park, Donnelley Park and Little Learner’s Childcare. New Park Maintenance equipment purchases included a new Kubota tractor mower, a new field stripper and new Jacobson mowers. In addition, a new pickle ball court was constructed. The Lakeview Fitness Center added several new pieces of exercise equipment and replaced worn carpeting. The fiscal year 2020 Capital Fund has budgeted $1,150,000 in expenditures. Major additions planned are upgrades to Hartman Park, Sugar Creek Park and Warrington Park playgrounds, resurfacing of parking lots, shelter bathrooms, LFC exercise equipment and park maintenance vehicles. The construction in process ($1,021,087) relates to the additional kindergarten building progress. Additional information on the Park District’s capital assets can be found in note 4 on page 25-26 of this report.
VERNON HILLS PARK DISTRICT, ILLINOIS Management’s Discussion and Analysis May 31, 2019
MD&A 10
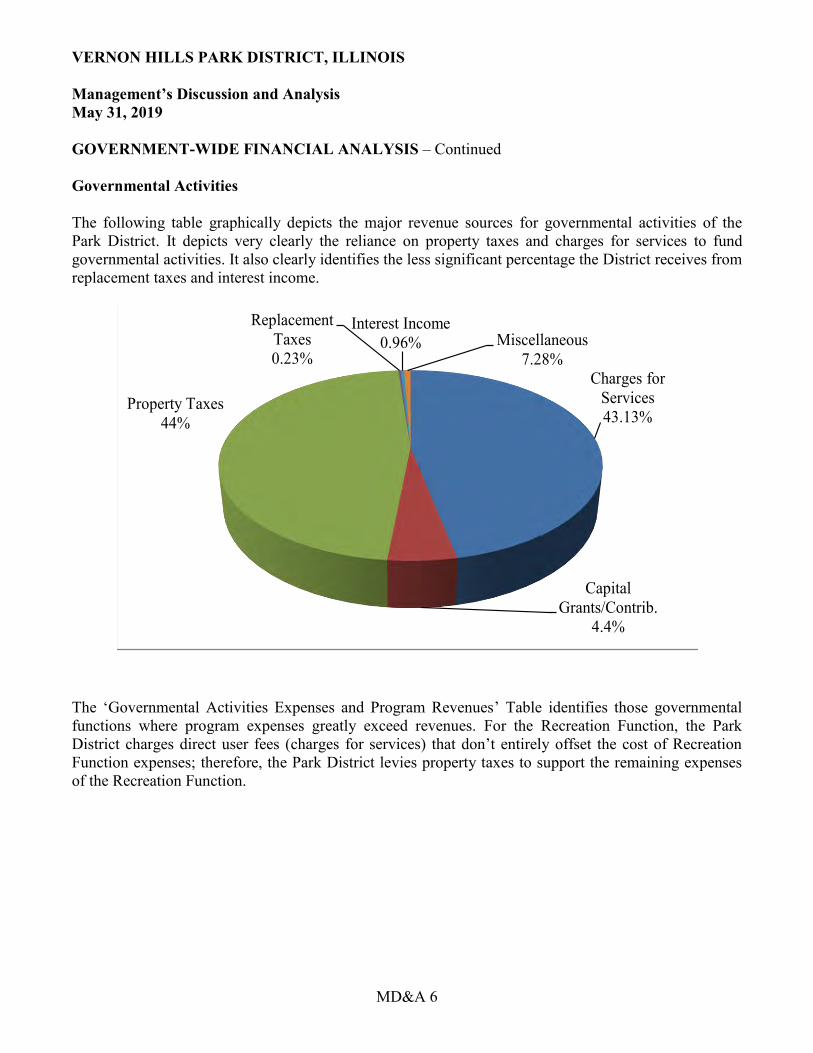
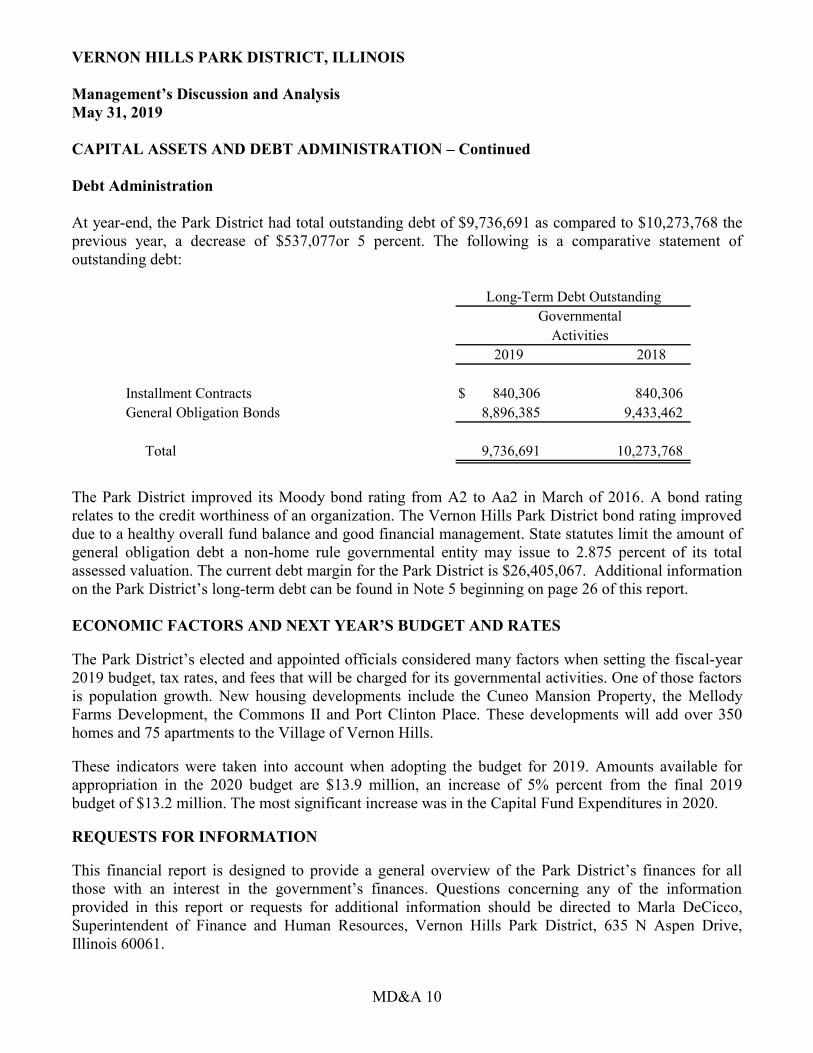
CAPITAL ASSETS AND DEBT ADMINISTRATION – Continued Debt Administration At year-end, the Park District had total outstanding debt of $9,736,691 as compared to $10,273,768 the previous year, a decrease of $537,077or 5 percent. The following is a comparative statement of outstanding debt:
2019 2018
Installment Contracts $ 840,306 840,306General Obligation Bonds 8,896,385 9,433,462
Total 9,736,691 10,273,768
Long-Term Debt OutstandingGovernmental
Activities
The Park District improved its Moody bond rating from A2 to Aa2 in March of 2016. A bond rating relates to the credit worthiness of an organization. The Vernon Hills Park District bond rating improved due to a healthy overall fund balance and good financial management. State statutes limit the amount of general obligation debt a non-home rule governmental entity may issue to 2.875 percent of its total assessed valuation. The current debt margin for the Park District is $26,405,067. Additional information on the Park District’s long-term debt can be found in Note 5 beginning on page 26 of this report. ECONOMIC FACTORS AND NEXT YEAR’S BUDGET AND RATES The Park District’s elected and appointed officials considered many factors when setting the fiscal-year 2019 budget, tax rates, and fees that will be charged for its governmental activities. One of those factors is population growth. New housing developments include the Cuneo Mansion Property, the Mellody Farms Development, the Commons II and Port Clinton Place. These developments will add over 350 homes and 75 apartments to the Village of Vernon Hills. These indicators were taken into account when adopting the budget for 2019. Amounts available for appropriation in the 2020 budget are $13.9 million, an increase of 5% percent from the final 2019 budget of $13.2 million. The most significant increase was in the Capital Fund Expenditures in 2020. REQUESTS FOR INFORMATION This financial report is designed to provide a general overview of the Park District’s finances for all those with an interest in the government’s finances. Questions concerning any of the information provided in this report or requests for additional information should be directed to Marla DeCicco, Superintendent of Finance and Human Resources, Vernon Hills Park District, 635 N Aspen Drive, Illinois 60061.

BASIC FINANCIAL STATEMENTS

Business-Governmental Type
Activities Activities Total
ASSETS Cash 1,607,162$ 4,355,934$ 5,963,096$ Investments 3,275,100 - 3,275,100 Property taxes receivable (net, where applicable, of allowances for uncollectibles) 4,999,740 - 4,999,740 Prepaid expenses 11,184 - 11,184 Other receivables 6,036 - 6,036 Capital assets not being depreciated 10,715,011 1,779,285 12,494,296 Capital assets being depreciated (net of accumulated depreciation) 20,735,023 - 20,735,023
Total assets 41,349,256 6,135,219 47,484,475
DEFERRED OUTFLOWS OF RESOURCESPension items - IMRF 892,261 - 892,261
Total deferred outflows of resources 892,261 - 892,261
Total assets and deferred outflows of resources 42,241,517 6,135,219 48,376,736
LIABILITIESAccounts payable 485,439 119,186 604,625 Retainage payable 37,361 10,997 48,358 Accrued interest payable 119,076 - 119,076 Accrued payroll 104,121 - 104,121 Unearned revenue 402,334 236,250 638,584 Claims payable 34,720 - 34,720 Noncurrent liabilities
Due within one year 1,592,671 - 1,592,671 Due in more than one year 10,002,585 - 10,002,585 Unearned revenue - 4,488,750 4,488,750
Total liabilities 12,778,307 4,855,183 17,633,490
DEFERRED INFLOWS OF RESOURCESDeferred property tax revenue 5,046,119 - 5,046,119 Pension items - IMRF 278,469 - 278,469
Total deferred inflows of resources 5,324,588 - 5,324,588
Total liabilities and deferred inflows of resources 18,102,895 4,855,183 22,958,078
NET POSITIONNet investment in capital assets 24,235,627 1,779,285 26,014,912 Restricted for
Special recreation 51,176 - 51,176 Debt service 336,502 - 336,502
Unrestricted (484,683) (499,249) (983,932)
TOTAL NET POSITION 24,138,622$ 1,280,036$ 25,418,658$
VERNON HILLS PARK DISTRICTVERNON HILLS, ILLINOIS
STATEMENT OF NET POSITION
May 31, 2019
See accompanying notes to financial statements.- 4 -

Operating CapitalCharges Grants and Grants and
FUNCTIONS/PROGRAMS Expenses for Services Contributions ContributionsPRIMARY GOVERNMENT
Governmental ActivitiesGeneral government 2,348,818$ -$ -$ -$ Parks and recreation 8,252,731 4,680,777 473,605 - Interest 264,494 - - -
Total governmental activities 10,866,043 4,680,777 473,605 -
Business-Type ActivitiesKindergarten building - - - 536,128
TOTAL PRIMARY GOVERNMENT 10,866,043$ 4,680,777$ 473,605$ 536,128$
VERNON HILLS PARK DISTRICTVERNON HILLS, ILLINOIS
STATEMENT OF ACTIVITIES
For the Year Ended May 31, 2019
Program Revenues
- 5 -

Net (Expense) Revenue and Change in Net Position
Governmental Business-TypeActivities Activities Total
(2,348,818)$ -$ (2,348,818)$ (3,098,349) - (3,098,349)
(264,494) - (264,494)
(5,711,661) - (5,711,661)
- 536,128 536,128
(5,711,661) 536,128 (5,175,533)
General RevenuesTaxes
Property 4,985,302 - 4,985,302 Replacement 23,301 - 23,301
Investment income 104,351 - 104,351 Miscellaneous 49,170 - 49,170
Total 5,162,124 - 5,162,124
CHANGE IN NET POSITION (549,537) 536,128 (13,409)
NET POSITION, JUNE 1 25,402,723 33,203 25,435,926
Prior period adjustment (714,564) 710,705 (3,859)
NET POSITION, JUNE 1, RESTATED 24,688,159 743,908 25,432,067
NET POSITION, MAY 31 24,138,622$ 1,280,036$ 25,418,658$
Primary Government
See accompanying notes to financial statements.- 6 -

LakeviewFitness
General Recreation Center
ASSETS
Cash -$ 411,774$ 550$ Investments 1,000,000 1,633,100 - Property taxes receivable (net, where applicable, of allowances for uncollectibles) 2,300,233 1,392,790 - Other receivables 168 5,868 - Prepaid items 2,470 8,714 - Due from other funds - 985,030 -
TOTAL ASSETS 3,302,871$ 4,437,276$ 550$
LIABILITIESAccounts payable 193,359$ 132,357$ 40,040$ Retainage payable - - Accrued payroll 21,465 42,607 27,685 Deposits - 34,720 - Unearned revenue - 326,212 250 Due to other funds 5,436 - 802,837
Total liabilities 220,260 535,896 870,812
DEFERRED INFLOWS OF RESOURCESDeferred revenue - property taxes 2,321,571 1,405,710 -
Total deferred inflows of resources 2,321,571 1,405,710 -
Total liabilities and deferred inflows of resources 2,541,831 1,941,606 870,812
FUND BALANCESNonspendable in form - prepaid items 2,470 8,714 - Restricted for park development - - - Restricted for special recreation - - - Restricted for debt service - - - Unrestricted
Assigned for capital projects - - - Assigned for recreation purposes - 2,486,956 - Unassigned (deficit) 758,570 - (870,262)
Total fund balances (deficit) 761,040 2,495,670 (870,262)
TOTAL LIABILITIES, DEFERRED INFLOWS OF RESOURCES AND FUND BALANCES 3,302,871$ 4,437,276$ 550$
LIABILITIES, DEFERRED INFLOWS OFRESOURCES AND FUND BALANCES
VERNON HILLS PARK DISTRICTVERNON HILLS, ILLINOIS
BALANCE SHEETGOVERNMENTAL FUNDS
May 31, 2019
- 7 -

Nonmajor TotalGovernmental Governmental
Bond Capital Funds Funds
346,325$ 793,185$ 55,328$ 1,607,162$ - 642,000 - 3,275,100
1,059,007 - 247,710 4,999,740 - - - 6,036 - - - 11,184 - - - 985,030
1,405,332$ 1,435,185$ 303,038$ 10,884,252$
-$ 100,031$ 19,652$ 485,439$ - 37,361 - 37,361 - - 12,364 104,121 - - - 34,720 - - 75,872 402,334 - - 176,757 985,030
- 137,392 284,645 2,049,005
1,068,830 - 250,008 5,046,119
1,068,830 - 250,008 5,046,119
1,068,830 137,392 534,653 7,095,124
- - - 11,184 - - - - - - 51,176 51,176
336,502 - - 336,502
- 1,297,793 - 1,297,793 - - - 2,486,956 - - (282,791) (394,483)
336,502 1,297,793 (231,615) 3,789,128
1,405,332$ 1,435,185$ 303,038$ 10,884,252$
See accompanying notes to financial statements.- 8 -

FUND BALANCES OF GOVERNMENTAL FUNDS 3,789,128$
Amounts reported for governmental activities in the statement of net position are different because:
Capital assets used in governmental activities are not financial resources and, therefore, are not reported in the governmental funds 31,450,034
Accrued interest on long-term liabilities is shown as a liability on the statement of net position (119,076)
Differences between expected and actual experiences, assumption changes and net differences between projected and actual earnings recognized as deferred outflows and inflows of resources on the statement of net position
Illinois Municipal Retirement Fund 613,792
Long-term liabilities are not due and payable in the current period and, therefore, are not reported in governmental funds
General obligation bonds (8,896,385) Unamortized premium on general obligation bonds (97,306) Intergovernmental agreements (840,306) Compensated absences (222,562) Net pension liability for the Illinois Municipal Retirement Fund (1,538,697)
NET POSITION OF GOVERNMENTAL ACTIVITIES 24,138,622$
May 31, 2019
VERNON HILLS PARK DISTRICT
RECONCILIATION OF FUND BALANCES OF GOVERNMENTAL FUNDS TO THEGOVERNMENTAL ACTIVITIES IN THE STATEMENT OF NET POSITION
VERNON HILLS, ILLINOIS
See accompanying notes to financial statements.- 9 -

LakeviewFitness
General Recreation Center
REVENUESTaxes 2,320,250$ 1,331,975$ -$ Investment income 48,355 44,453 - Rental income - 174,849 1,680 Charges for services - 2,306,168 1,906,579 Intergovernmental - - - Merchandise sales - 1,677 766 Impact fees - - - Contributions - 35,396 - Miscellaneous 22,314 14,654 9,502
Total revenues 2,390,919 3,909,172 1,918,527
EXPENDITURESCurrent
General government 775,194 - - Parks and recreation 1,487,292 3,659,657 2,108,992
Capital outlay - - - Debt service
Principal retirement - - - Interest and fiscal charges - - - Issuance costs - - -
Total expenditures 2,262,486 3,659,657 2,108,992
EXCESS (DEFICIENCY) OF REVENUES OVER EXPENDITURES 128,433 249,515 (190,465)
OTHER FINANCING SOURCES (USES)Transfers in - - - Transfers (out) (500,000) (18,595) - Issuance of bonds - - -
Total other financing sources (uses) (500,000) (18,595) -
NET CHANGE IN FUND BALANCES (371,567) 230,920 (190,465)
FUND BALANCES (DEFICIT), JUNE 1 1,132,607 2,251,717 (679,797)
Prior period adjustment - 13,033 -
FUND BALANCES (DEFICIT), JUNE 1 (RESTATED) 1,132,607 2,264,750 (679,797)
FUND BALANCES (DEFICIT), MAY 31 761,040$ 2,495,670$ (870,262)$
For the Year Ended May 31, 2019
VERNON HILLS PARK DISTRICTVERNON HILLS, ILLINOIS
STATEMENT OF REVENUES, EXPENDITURESAND CHANGES IN FUND BALANCES
GOVERNMENTAL FUNDS
- 10 -

Nonmajor TotalGovernmental Governmental
Bond Capital Funds Funds
1,046,484$ -$ 309,894$ 5,008,603$ 251 10,841 451 104,351 - - 6,244 182,773 - - 282,814 4,495,561 - - - - - - - 2,443 - 338,209 - 338,209 - 100,000 - 135,396 - - 2,700 49,170
1,046,735 449,050 602,103 10,316,506
- - - 775,194 - - 619,489 7,875,430 - 1,470,766 101,300 1,572,066
1,464,205 - - 1,464,205
256,672 - - 256,672 14,058 - - 14,058
1,734,935 1,470,766 720,789 11,957,625
(688,200) (1,021,716) (118,686) (1,641,119)
- 855,000 18,595 873,595 (355,000) - - (873,595)
1,031,385 - - 1,031,385
676,385 855,000 18,595 1,031,385
(11,815) (166,716) (100,091) (609,734)
348,317 1,433,858 (131,524) 4,355,178
- 30,651 - 43,684
348,317 1,464,509 (131,524) 4,398,862
336,502$ 1,297,793$ (231,615)$ 3,789,128$
See accompanying notes to financial statements.- 11 -

NET CHANGE IN FUND BALANCES - TOTAL GOVERNMENTAL FUNDS (609,734)$
Amounts reported for governmental activities in the statement of activities are different because:
Governmental funds report capital outlay as expenditures; however, the are capitalized and depreciated in the statement of activities 853,801
Depreciation on capital assets is reported as an expense in the statement of activities (1,304,244) The change in certain liabilities are reported as expenses on the statement of activities
IMRF net pension liability (982,844) Compensated absences (31,314) Accrued interest (715)
The change in deferred outflows and inflows of resources are reported only in the statement of activities
IMRF 1,085,742
Certain costs associated with the issuances of bonds are deferred and amortized over the life of the bonds on the statement of activities
Amortization net of current year premium on issuance 6,951
The issuance of long-term debt (capital leases) is reported as an other financing source in governmental funds but as an increase of principal outstanding in the statement of activities (1,031,385) The repayment of long-term debt is reported as an expenditure when due in governmental funds but as a reduction of principal outstanding in the statement of activities
General obligation bonds 1,464,205 Intergovernmental loan -
CHANGE IN NET POSITION OF GOVERNMENTAL ACTIVITIES (549,537)$
For the Year Ended May 31, 2019
VERNON HILLS PARK DISTRICT
RECONCILIATION OF THE GOVERNMENTAL FUNDS STATEMENT OF REVENUES,
GOVERNMENTAL ACTIVITIES IN THE STATEMENT OF ACTIVITIESEXPENDITURES AND CHANGES IN FUND BALANCES TO THE
VERNON HILLS, ILLINOIS
See accompanying notes to financial statements.- 12 -

KindergartenBuilding
CURRENT ASSETSCash and investments 4,355,934$
Total current assets 4,355,934
NONCURRENT ASSETSCapital assets not being depreciated 1,779,285
Total noncurrent assets 1,779,285
Total assets 6,135,219
DEFERRED OUTFLOWS OF RESOURCESNone -
Total assets and deferred outflows of resources 6,135,219
CURRENT LIABILITIESAccounts payable 119,186 Retainage payable 10,997 Unearned rent 236,250
Total current liabilities 366,433
NONCURRENT LIABILITIESUnearned rent 4,488,750
Total noncurrent liabilities 4,488,750
Total liabilities 4,855,183
DEFERRED INFLOWS OF RESOURCESNone -
Total liabilities and deferred inflows of resources 4,855,183
NET POSITIONInvested in capital assets 1,779,285 Unrestricted (499,249)
TOTAL NET POSITION 1,280,036$
PROPRIETARY FUND
May 31, 2019
VERNON HILLS PARK DISTRICTVERNON HILLS, ILLINOIS
STATEMENT OF NET POSITION
See accompanying notes to financial statements.- 13 -

KindergartenBuilding
OPERATING REVENUE None -$
Total operating revenue -
OPERATING EXPENSEOperating -
Total operating expense -
OPERATING INCOME BEFORE DEPRECIATION -
Depreciation -
OPERATING INCOME -
NON-OPERATING REVENUES (EXPENSES)None -
Total non-operating revenues (expenses) -
CHANGE IN NET POSITION BEFORE TRANSFERS -
CONTRIBUTIONSContributions from other funds 536,128
Total transfers 536,128
CHANGE IN NET POSITION 536,128
NET POSITION, JUNE 1 33,203
Change in accounting principle 710,705
NET POSITION, JUNE 1 (RESTATED) 743,908
NET POSITION, MAY 31 $ 1,280,036
CHANGES IN NET POSITIONPROPRIETARY FUND
For the Year Ended May 31, 2019
VERNON HILLS PARK DISTRICTVERNON HILLS, ILLINOIS
STATEMENT OF REVENUES, EXPENSES AND
See accompanying notes to financial statements.- 14 -

STATEMENT OF CASH FLOWSPROPRIETARY FUND
For the Year Ended May 31, 2019
KindergartenBuilding
CASH FLOWS FROM OPERATING ACTIVITIES
Receipts from customers and users -$ Payments to suppliers 82,640 Payments to employees -
Net cash from operating activities 82,640
CASH FLOWS FROM NONCAPITAL FINANCING ACTIVITIES
None -
CASH FLOWS FROM CAPITAL AND RELATED FINANCING ACTIVITIES
Unearned rent 4,488,750 Purchase of capital assets (484,909)
Net cash from capital and related financing activities 4,003,841
CASH FLOWS FROM INVESTING ACTIVITIESInterest on investments -
NET DECREASE IN CASH AND CASH EQUIVALENTS 4,086,481
CASH AND CASH EQUIVALENTS, JUNE 1 33,203
CASH AND CASH EQUIVALENTS, MAY 31 4,119,684$
RECONCILIATION OF OPERATING INCOME TO NET CASH FLOWS FROM OPERATING ACTIVITIES
Operating income -$ Adjustments to reconcile operating income to net cash from operating activities
Depreciation - Changes in assets and liabilities
Accounts payable 71,643 Retainage payable 10,997
NET CASH FROM OPERATING ACTIVITIES 82,640$
Noncash transactionsContributions from other funds 536,128$
VERNON HILLS PARK DISTRICTVERNON HILLS, ILLINOIS
See accompanying notes to financial statements.- 15 -

- 16 -
VERNON HILLS PARK DISTRICT VERNON HILLS, ILLINOIS
NOTES TO FINANCIAL STATEMENTS
May 31, 2019
1. SUMMARY OF SIGNIFICANT ACCOUNTING POLICIES The financial statements of the Vernon Hills Park District (the District) have been prepared
in conformity with accounting principles generally accepted in the United States of America, as applied to government units (hereinafter referred to as generally accepted accounting principles (GAAP)). The Governmental Accounting Standards Board (GASB) is the accepted standard-setting body for establishing governmental accounting and financial reporting principles. The more significant of the District’s accounting policies are described below.
a. Reporting Entity The District was incorporated in 1973. The District is a body corporate and politic
established under Illinois Compiled Statutes (ILCS). The District is considered to be a primary government as defined by GASB Statement Nos. 14 and 61, since it is legally separate and fiscally independent.
The District has concluded that no entities meet the criteria for inclusion as a
component unit. Likewise, the District is not required to be included as a component unit of any other entity.
b. Fund Accounting The District uses funds to report on its financial position and the changes in its
financial position. Fund accounting is designed to demonstrate legal compliance and to aid financial management by segregating transactions related to certain governmental functions or activities. A fund is a separate accounting entity with a self-balancing set of accounts.
Funds are classified as governmental funds. Governmental funds are used to account for all or most of a government’s general
activities including the collection and disbursement of restricted, committed or assigned monies (special revenue funds), the funds committed, restricted or assigned for the acquisition or construction of capital assets (capital projects funds) and the funds committed, restricted or assigned for the servicing of long-term debt (debt service funds). The General Fund is used to account for all activities of the general government not accounted for in some other fund.
- 16 -

VERNON HILLS PARK DISTRICT VERNON HILLS, ILLINOIS NOTES TO FINANCIAL STATEMENTS (Continued)
- 17 -
1. SUMMARY OF SIGNIFICANT ACCOUNTING POLICIES (Continued) c. Government-Wide and Fund Financial Statements The government-wide financial statements (i.e., the statement of net position and the
statement of activities) report information on all activities of the District. The effect of material interfund activity, other than interfund service transactions, has been eliminated from these statements. Governmental activities, which normally are supported by taxes and intergovernmental revenues, are reported separately from business-type activities, which rely to a significant extent on fees and charges for support.
The statement of activities demonstrates the degree to which the direct expenses of a
given function, segment or program are offset by program revenues. Direct expenses are those that are clearly identifiable with a specific function or segment. Program revenues include (1) charges to customers or applicants who purchase, use or directly benefit from goods, services or privileges provided by a given function or segment and (2) grants and contributions that are restricted to meeting the operational or capital requirements of a particular function or segment. Taxes and other items not properly included among program revenues are reported instead as general revenues.
Separate financial statements are provided for governmental funds and proprietary
funds. Major individual governmental funds and major individual enterprise funds are reported as separate columns in the fund financial statements.
The District reports the following major governmental funds: The General Fund is the general operating fund of the District. It is used to
account for and report all financial resources except those accounted for in another fund.
The Recreation Fund is used to account for revenue and expenditures restricted,
committed or assigned to recreation programs and is funded by a restricted tax levy and user fees.
The Lakeview Fitness Center Fund is used to account for the operations of the
Lakeview Fitness Center and Little Learners Childcare. The Bond Fund (Debt Service Fund) is used to account for the accumulation of
resources restricted, committed or assigned for and the payment of principal and interest on governmental activities long-term debt.
The Capital Fund is used to account for and report financial resources that are
restricted, committed or assigned for capital outlays including the acquisition and construction of capital facilities and other capital assets.
- 17 -

VERNON HILLS PARK DISTRICT VERNON HILLS, ILLINOIS NOTES TO FINANCIAL STATEMENTS (Continued)
- 18 -
1. SUMMARY OF SIGNIFICANT ACCOUNTING POLICIES (Continued) c. Government-Wide and Fund Financial Statements (Continued) The District reports the following major business-type activities/enterprise funds:
The Kindergarten Building Fund is used to account for and report financial resources that are restricted for capital outlays related to the construction of the Kindergarten Building.
The District reports the following nonmajor governmental funds: Special Recreation Fund Family Aquatic Center Fund d. Measurement Focus, Basis of Accounting and Financial Statement Presentation The government-wide financial statements are reported using the economic resources
measurement focus and the accrual basis of accounting. With this measurement focus, all assets, deferred outflows, liabilities and deferred inflows associated with the operation of these activities/funds are included on the statement of net position. Revenues are recorded when earned and expenses are recorded when a liability is incurred. Property taxes are recognized as revenues in the year for which they are levied (i.e., intended to finance).
Grants and similar items are recognized as revenue as soon as all eligibility
requirements imposed by the provider have been met. Governmental fund financial statements are reported using the current financial
resources measurement focus and the modified accrual basis of accounting. With this measurement focus, only current assets and current liabilities generally are included on the balance sheet. Operating statements of these funds present increases (i.e., revenues and other financing sources) and decreases (i.e., expenditures and other financing uses) in net current assets. Under the modified accrual basis of accounting, revenues are recognized when susceptible to accrual (i.e., when they become both measurable and available). “Measurable” means the amount of the transaction can be determined and “available” means collectible within the current period or soon enough thereafter to be used to pay liabilities of the current period (60 days). The District recognizes property taxes when they become both measurable and available in the year intended to finance. Expenditures are recorded when the related liability is incurred. Principal and interest on general long-term debt are recorded as expenditures become due.
Those revenues susceptible to accrual are property taxes, interest revenue and charges
for services.
- 18 -

VERNON HILLS PARK DISTRICT VERNON HILLS, ILLINOIS NOTES TO FINANCIAL STATEMENTS (Continued)
- 19 -
1. SUMMARY OF SIGNIFICANT ACCOUNTING POLICIES (Continued) d. Measurement Focus, Basis of Accounting and Financial Statement Presentation
(Continued) The District reports unearned/unavailable/deferred revenue on its financial statements.
Unearned/unavailable/deferred revenues arise when potential revenue does not meet both the measurable and available or earned criteria for recognition in the current period for governmental funds or available or earned at the entity-wide level. Unearned revenues also arise when resources are received by the government before it has legal claim to them as when grant monies are received prior to the incurrence of qualifying expenditures. In subsequent periods, when revenue recognition criteria are met, or when the government has a legal claim to the resources by meeting all eligibility requirements, the liability or deferred inflow is removed from the financial statements and revenue is recognized.
e. Cash and Cash Equivalents The District considers all highly liquid investments with a maturity of three months or
less when purchased to be cash equivalents. f. Investments Investments with a maturity of less than one year when purchased, non-negotiable
certificates of deposit and other nonparticipating investments are stated at cost or amortized cost. Investments with a maturity greater than one year, at time of purchase, if any, are stated at fair value. Fair value is the price that would be received to sell an asset or paid to transfer a liability in an orderly transaction between market participants at the measurement date.
g. Prepaid Items Certain payments to vendors reflect costs applicable to future accounting periods and
are recorded as prepaid items using the purchases method. Such amounts are offset by nonspendable fund balance in the fund financial statements.
h. Capital Assets Capital assets, which include property, plant, equipment and infrastructure assets (e.g.,
bike trails, paths and similar items), are reported in the applicable governmental activities or business-type activities columns in the government-wide financial statements. Capital assets are defined by the District as assets with an initial, individual cost of more than $5,000 and an estimated useful life in excess of one year. Such assets are reported at historical cost or estimated historical cost if purchased or constructed. Donated capital assets are recorded at the estimated acquisition value at the date of donation.
- 19 -

VERNON HILLS PARK DISTRICT VERNON HILLS, ILLINOIS NOTES TO FINANCIAL STATEMENTS (Continued)
- 20 -
1. SUMMARY OF SIGNIFICANT ACCOUNTING POLICIES (Continued) h. Capital Assets (Continued) The costs of normal maintenance and repairs that do not add to the value of the asset
or materially extend asset lives are not capitalized. Major outlays for capital assets and improvements are capitalized as projects are
constructed. Property, plant and equipment is depreciated using the straight-line method over the following estimated useful lives:
Assets Years
Buildings and improvements 5-50 Machinery and equipment 5-15 Vehicles 5-15
i. Long-Term Obligations In the government-wide financial statements, long-term debt and other long-term
obligations are reported as liabilities in the applicable governmental activities, business-type activities or proprietary fund financial statements. Bond premiums and discounts are deferred and amortized over the life of the bonds. Bonds payable are reported net of the applicable bond premium or discount. Bond issuance costs are expensed as incurred.
In the fund financial statements, governmental funds recognize bond premiums and
discounts, as well as bond issuance costs, during the current period. The face amount of debt issued is reported as other financing sources. Premiums received on debt issuances are reported as other financing sources while discounts on debt issuances are reported as other financing uses. Issuance costs, whether or not withheld from the actual debt proceeds received, are reported as expenditures.
j. Accrued Compensated Absences Accumulated unpaid vacation pay and vested sick leave is accrued when incurred by
the District in the governmental government-wide financial statements. The liability for accumulated unpaid vacation pay and unused sick leave is based upon accumulated days at fiscal year end, times the current pay rate (including certain benefits) for each employee in accordance with the District’s policy.
- 20 -

VERNON HILLS PARK DISTRICT VERNON HILLS, ILLINOIS NOTES TO FINANCIAL STATEMENTS (Continued)
- 21 -
1. SUMMARY OF SIGNIFICANT ACCOUNTING POLICIES (Continued) k. Property Taxes The District’s property taxes are required to be levied by ordinance. A certified copy
of the levy ordinance must be filed with the county clerk no later than the last Tuesday in December of each year. Taxes are due and collectible one-half in June and one-half in September of the following year. Property taxes attach as an enforceable lien on property as of January 1 of the levy year. Property taxes which have been levied but are not due before the end of the fiscal year are recorded as receivable. The receivable is offset by unavailable/deferred revenue as it is not due before the end of the District’s fiscal year and is intended to finance the subsequent fiscal year.
l. Net Position/Fund Balances In the fund financial statements, governmental funds report nonspendable fund
balance for amounts that are either not spendable in form or legally or contractually required to be maintained intact. Restrictions of fund balance are reported for amounts constrained by legal restrictions from outside parties for use for a specific purpose or externally imposed by outside entities. None of the restricted fund balances result from enabling legislation adopted by the District. Committed fund balance is constrained by formal actions of the District’s Board of Commissioners, which is considered the District’s highest level of decision-making authority. Formal actions include ordinances approved by the Board of Commissioners. Assigned fund balance represents amounts constrained by the District’s intent to use them for a specific purpose. Intent is expressed by the Board of Commissioners itself or by a body or official to which the Board of Commissioners has delegated the authority to assign amounts to be used for specific purposes. Any residual fund balance in the General Fund or any deficit fund balance in any other governmental funds is reported as unassigned. The District has established a policy that the General and Recreation. Funds should maintain a minimum fund balance equal to 25% of the average annual operating expenditures. Fund balances in excess of said levels may be transferred to the Capital Fund at the discretion of the Board. The Lakeview Fitness Center and Family Aquatic Center Funds should maintain a minimum fund balance no less than two months average operating expenditures.
The District’s flow of funds assumption prescribes that the funds with the highest level
of constraint are expended first. If restricted or unrestricted funds are available for spending, the restricted funds are spent first. Additionally, if different levels of unrestricted funds are available for spending the District considers committed funds to be expended first followed by assigned and then unassigned funds.
In the government-wide financial statements, restricted net position is legally
restricted by outside parties for a specific purpose. Net investment in capital assets is the book value of capital assets less outstanding principal balances of debt that was issued to construct the capital assets.
- 21 -

VERNON HILLS PARK DISTRICT VERNON HILLS, ILLINOIS NOTES TO FINANCIAL STATEMENTS (Continued)
- 22 -
1. SUMMARY OF SIGNIFICANT ACCOUNTING POLICIES (Continued) l. Net Position/Fund Balances (Continued) None of the restricted net position results from enabling legislation adopted by the
District. m. Interfund Transactions Reciprocal interfund service transactions are accounted for as revenues, expenditures
or expenses. Transactions that constitute reimbursements to a fund for expenditures/expenses initially made from it that are properly applicable to another fund, are recorded as expenditures/expenses in the reimbursing fund and as reductions of expenditures/expenses in the fund that is reimbursed. All other interfund transactions are reported as transfers.
n. Interfund Receivables/Payables Activity between funds that are representative of lending/borrowing arrangements
outstanding at the end of the fiscal year are referred to as either “due to/from other fund” (i.e., the current portion of interfund loans) or “advances to/from other funds” (i.e., the noncurrent portion of interfund loans).
o. Deferred Outflows/Inflows of Resources In addition to assets, the statement of financial position will sometimes report a
separate section for deferred outflows of resources. This separate financial statement element, deferred outflows of resources, represents a consumption of net assets that applies to a future period(s) and so will not be recognized as an outflow of resources (expense/expenditure) until then. In addition to liabilities, the statement of financial position will sometimes report a separate section for deferred inflows of resources. This separate financial statement element, deferred inflows of resources, represents an acquisition of net assets that applies to a future period(s) and so will not be recognized as an inflow of resources (revenue) until that time.
p. Use of Estimates The preparation of financial statements in conformity with GAAP requires
management to make estimates and assumptions that affect the reported amount of assets and liabilities and disclosure of contingent assets and liabilities at the date of the financial statements and the reported amounts of revenues and expenditures/expenses during the reporting period. Actual results could differ from those estimates.
- 22 -

VERNON HILLS PARK DISTRICT VERNON HILLS, ILLINOIS NOTES TO FINANCIAL STATEMENTS (Continued)
- 23 -
2. DEPOSITS AND INVESTMENTS
The District categorizes the fair value measurements within the fair value hierarchy established by GAAP. The hierarchy is based on the valuation inputs used to measure the fair value of the asset. Level 1 inputs are quoted prices in active markets for identical assets; Level 2 inputs are significant other observable inputs; and Level 3 inputs are significant unobservable inputs.
ILCS and the District’s investment policy authorize the District to make deposits/invest in insured commercial banks, savings and loan institutions, obligations of the U.S. Treasury and U.S. agencies, insured credit union shares, money market mutual funds with portfolios of securities issued or guaranteed by the United States Government or agreements to repurchase these same obligations, repurchase agreements, short-term commercial paper rated within the three highest classifications by at least two standard rating services, municipal bonds, investment-grade corporate bonds and The Illinois Funds.
It is the policy of the District to invest its funds in a manner which will provide the highest
investment return with the maximum security while meeting the daily cash flow demands of the District and conforming to all state and local statutes governing the investment of public funds, using the “prudent person” standard for managing the overall portfolio. The primary objective of the policy is safety (preservation of capital and protection of investment principal), liquidity and yield.
Deposits with Financial Institutions Custodial credit risk for deposits with financial institutions is the risk that in the event of a
bank’s failure, the District’s deposits may not be returned to it. The District’s investment policy requires pledging of collateral with a fair value of 110% of all bank balances in excess of federal depository insurance with the collateral held by a third party in the District’s name.
At May 31, 2019, the carrying amount of the District’s deposits was $5,963,096 including a
petty cash fund of $3,400, and the bank balance was $6,187,219. The following table presents the investments and maturities of the Fund’s debt securities as
of May 31, 2019:
Investment Maturities (in Years) Fair Less than Greater than
Investment Type Value 1 1-5 6-10 10 Certificate of deposit - negotiable $ 2,038,000 $ 1,639,000 $ 399,000 $ - $ - Municipal bonds 249,885 - 249,885 - - TOTAL $ 2,287,885 $ 1,639,000 $ 648,885 $ - $ -
- 23 -

VERNON HILLS PARK DISTRICT VERNON HILLS, ILLINOIS NOTES TO FINANCIAL STATEMENTS (Continued)
- 24 -
2. DEPOSITS AND INVESTMENTS (Continued) Deposits with Financial Institutions (Continued) The District has the following recurring fair value measurements as of May 31, 2019: The
negotiable certificates of deposit and state and municipal obligations are valued using quoted matrix pricing models (Level 2 inputs).
Interest rate risk is the risk that changes in interest rates will adversely affect the fair value
of an investment. The District’s objective is to mitigate both credit and interest rate risk. Therefore, in accordance with its investment policy, the District limits its exposure to interest rate risk by structuring the portfolio in a manner to maintain the best available market rate of return throughout budgetary and economic cycles while preserving and protecting capital in the overall portfolio.
Investments shall consist primarily of securities with shorter terms that have active
secondary or resale markets, money market mutual funds or local government investment pools, which offer same day liquidity for short-term funds. Investment maturities for operating funds shall be scheduled to coincide with projects cash flow needs, taking into account large routine expenditures as well as considering sizeable blocks of anticipated revenue.
The District limits its exposure to credit risk, the risk that the issuer of a debt security will not pay its par value upon maturity, by avoiding any investment transaction or practice which in appearance or fact might impair public confidence in the District’s stewardship of public funds. The District limits investments to instruments authorized under state statute. The District’s policy does not further limit investments of the District. The negotiable CD’s are not rated and the municipal bonds are rated AA+.
Custodial credit risk for investments is the risk that, in the event of the failure of the
counterparty to the investment, the District will not be able to recover the value of its investments that are in possession of an outside party. To limit its exposure, the District’s investment policy requires all security transactions that are exposed to custodial credit risk to be processed on a delivery versus payment (DVP) basis with the underlying investments held by a third party acting as the District’s agent separate from where the investment was purchased or by the trust department of the bank where purchased, in the District’s name.
Concentration of credit risk is the risk of loss attributed to the magnitude of the District’s
investment in a single issuer. The District’s investment policy requires diversification as follows:
Investments in any one particular bank or savings and loan shall not exceed 10% of
the investment portfolio or 10% of that financial institution’s capital unless fully insured.
- 24 -

VERNON HILLS PARK DISTRICT VERNON HILLS, ILLINOIS NOTES TO FINANCIAL STATEMENTS (Continued)
- 25 -
2. DEPOSITS AND INVESTMENTS (Continued) Deposits with Financial Institutions (Continued) No single commercial paper investment shall exceed 10% of the portfolio, may not
have a maturity longer than 180 days, may not exceed 5% of the corporation’s outstanding commercial paper debt and is limited to no more than one-third of the District’s portfolio.
Mortgage backed securities will not exceed 30% of the portfolio. The District’s investment policy specifically prohibits investments in derivative instruments. 3. PROPERTY TAX CALENDAR The following information gives significant dates on the property tax calendar of the District: • The property tax lien date is January 1. • The annual tax levy ordinance for 2018 was passed December 13, 2018. • Property taxes are due to the County Collector in two installments, June 1 and
September 1. • Property taxes for 2018 are normally received monthly beginning in May and
generally ending by November 2019. 4. CAPITAL ASSETS Capital asset activity for the year ended May 31, 2019 was as follows:
Beginning Balances
Restated
Increases
Decreases Ending
Balances GOVERNMENTAL ACTIVITIES Capital assets not being depreciated Land $ 10,715,011 $ - $ - $ 10,715,011 Total capital assets not being depreciated 10,715,011 - - 10,715,011 Capital assets being depreciated Buildings and improvements 30,627,643 181,263 119,475 30,689,431 Machinery and equipment 6,093,717 672,538 41,445 6,724,810 Vehicles 628,262 - - 628,262 Total capital assets being depreciated 37,349,622 853,801 160,920 38,042,503
- 25 -

VERNON HILLS PARK DISTRICT VERNON HILLS, ILLINOIS NOTES TO FINANCIAL STATEMENTS (Continued)
- 26 -
4. CAPITAL ASSETS (Continued)
Beginning Balances,
Restated
Increases
Decreases Ending
Balances GOVERNMENTAL ACTIVITIES (Continued) Less accumulated depreciation for Buildings and improvements $ 13,259,949 $ 876,376 $ 119,475 $ 14,016,850 Machinery and equipment 2,499,617 363,588 41,445 2,821,760 Vehicles 404,590 64,280 - 468,870 Total accumulated depreciation 16,164,156 1,304,244 160,920 17,307,480 Total capital assets being depreciated, net 21,185,466 (450,443) - 20,735,023 GOVERNMENTAL ACTIVITIES CAPITAL ASSETS, NET $ 31,900,477 $ (450,443) $ - $ 31,450,034 BUSINESS-TYPE ACTIVITIES Capital assets not being depreciated Construction in progress $ 758,248 $ 1,021,037 $ - $ 1,779,285 Total capital assets not being depreciated $ 758,248 $ 1,021,037 $ - $ 1,779,285
Depreciation expense was charged to functions/programs of the District’s governmental
activities as follows:
GOVERNMENTAL ACTIVITIES General government $ 69,804 Parks and recreation 1,234,440 TOTAL DEPRECIATION EXPENSE - GOVERNMENTAL ACTIVITIES $ 1,304,244
5. LONG-TERM DEBT
a. The following is a summary of changes in long-term debt for the fiscal year ended May 31, 2019:
Beginning
Balances, Restated
Additions
Reductions/ Refundings
Ending
Balances
Current Portion
GOVERNMENTAL ACTIVITIES General obligation bonds $ 9,329,205 $ 1,031,385 $ 1,464,205 $ 8,896,385 $ 1,486,385 Premium on bonds 104,257 - 6,951 97,306 - Long-term financing from other governmental units
840,306
-
-
840,306
84,030
Net pension liability* 555,853 982,844 - 1,538,697 - Compensated absences* 191,248 50,439 19,125 222,562 22,256 TOTAL GOVERNMENTAL ACTIVITIES
$ 11,020,869
$ 2,064,668
$ 1,490,281
$ 11,595,256
$ 1,592,671
*Compensated absences and the net pension liability have historically been paid from the General and Recreation Funds.
- 26 -

VERNON HILLS PARK DISTRICT VERNON HILLS, ILLINOIS NOTES TO FINANCIAL STATEMENTS (Continued)
- 27 -
5. LONG-TERM DEBT (Continued)
b. Long-term debt at May 31, 2019 is comprised of the following individual bond issues and intergovernmental agreements.
Bonds
Total Outstanding
Current Portion
2013A General Obligation Park Bonds
A $4,000,000 General Obligation Park Bond Series 2013A, dated May 23, 2013 due in installments of $410,000 to $480,000 beginning December 15, 2014 through December 15, 2022. Interest at 2% to 3% is payable semiannually on June 15 and December 15.
$ 1,865,000
$ 455,000
2016A General Obligation Park Bonds
A $6,000,000 General Obligation Park Bonds, Series 2016A, dated June 1, 2016 due in installments of $35,000 to $645,000 beginning December 15, 2022 through December 15, 2032. Interest at 2% to 3% is payable semiannually on June 15 and December 15.
6,000,000
-
2018 General Obligation Limited Tax Park Bonds
A $1,031,385 General Obligation Limited Tax Park Bonds, Series 2018, dated November 29, 2018 due on December 15, 2019. Interest at 2.59% is payable on December 15.
1,031,385
1,031,385
TOTAL BONDS $ 8,896,385 $ 1,486,385
Long-Term Financing from Other Governmental Units On March 3, 2013, the District entered into an agreement with the Village of Vernon
Hills (Village) for the purchase of the Vernon Hills YMCA building and property. The agreement specifies that the 50% of impact fees intended for the District will be applied to the District’s repayment of the loan.
Total Current Portion
TOTAL LONG-TERM FINANCING FROM OTHER GOVERNMENTAL UNITS $ 840,306 $ 84,030
Long-term financing from other governmental units have historically been paid from
the Debt Service Fund.
- 27 -

VERNON HILLS PARK DISTRICT VERNON HILLS, ILLINOIS NOTES TO FINANCIAL STATEMENTS (Continued)
- 28 -
5. LONG-TERM DEBT (Continued)
c. Debt Service to Maturity The annual requirements to amortize to maturity serial debt outstanding as of May 31,
2019 are as follows:
Fiscal Year Ending
General Obligation Serial Bonds
May 31, Principal Interest 2020 $ 1,486,385 $ 257,361 2021 465,000 216,850 2022 480,000 202,900 2023 500,000 188,500 2024 510,000 173,850 2025 530,000 163,650 2026 550,000 147,750 2027 570,000 131,250 2028 590,000 114,150 2029 610,000 96,450 2030 635,000 78,150 2031 645,000 59,100 2032 650,000 39,750 2033 675,000 20,250 TOTAL $ 8,896,385 $ 1,889,961
Fiscal Year
Ending Inter-
governmental May 31, Loan
2020 $ 84,030 2021 84,030 2022 84,030 2023 84,030 2024 84,030 2025 84,030 2026 84,030 2027 84,030 2028 84,030 2029 84,036 TOTAL $ 840,306
- 28 -

VERNON HILLS PARK DISTRICT VERNON HILLS, ILLINOIS NOTES TO FINANCIAL STATEMENTS (Continued)
- 29 -
5. LONG-TERM DEBT (Continued) d. Legal Debt Margin
2019 equalized assessed valuation (most recent available) $ 1,227,876,585 Debt limitation - 2.875% of assessed valuation $ 35,301,452 Amount of debt applicable to debt limit Park Bond Series 2013A 1,865,000 Park Bond Series 2016A 6,000,000 Park Bond Series 2018 1,031,385 Total debt 8,896,385 LEGAL DEBT MARGIN $ 26,405,067
Chapter 70, Section 1205/6-2 of the Illinois Compiled Statutes provides, “...for the
payment of land condemned or purchased for parks or boulevards, for the building, maintaining, improving and protecting of the same and for the payment of the expenses incident thereto, or for the acquisition of real estate and lands to be used as a site for an armory, any Government is authorized to issue the bonds or notes of such Government and pledge its property and credit therefore to an amount including existing indebtedness of such district so that the aggregate indebtedness of such district does not exceed 2.875% of the value of the taxable property therein, to be ascertained by the last assessment for state and county taxes previous to the issue from time-to-time of such bonds or notes or, until January 1, 1983, if greater, the sum that is produced by multiplying the District’s 1978 equalized assessed valuation by the debt limitation percentage in effect on January 1, 1979, if a petition, signed by voters in number equal to not less than 2% of the voters of the District, who voted at the last general election in the District, asking that the authorized aggregate indebtedness of the District be increased to not more than 5.75% of the value of the taxable property therein, is presented to the board and such increase is approved by the voters of the District at a referendum held on the question.”
- 29 -

VERNON HILLS PARK DISTRICT VERNON HILLS, ILLINOIS NOTES TO FINANCIAL STATEMENTS (Continued)
- 30 -
6. INDIVIDUAL FUND DISCLOSURES a. Interfund Receivables/Payables Due to/from other funds at May 31, 2019 is as follows:
Receivable Payable General Fund $ - $ 5,436 Recreation Fund 985,030 - Lakeview Fitness Center Fund - 802,837 Family Aquatic Center Fund (nonmajor) - 176,757 TOTAL $ 985 030 $ 985,030
The purpose of significant due to/from other funds is the result of: • $802,837 due from the Lakeview Fitness Center Fund to the Recreation Fund is
to cover the deficit cash position in the Lakeview Fitness Center Fund. Repayment is expected within one year.
• $176,757 due from the Family Aquatic Center Fund to the Recreation Fund is
to cover the deficit cash position in the Family Aquatic Center Fund. Repayment is expected within one year.
b. Interfund Transfers Individual fund interfund transfers are as follows:
Transfers In
Transfers Out
General Fund $ - $ 500,000 Recreation Fund - 18,595 Bond Fund - 355,000 Capital Fund 855,000 - Nonmajor Governmental Funds 18,595 - TOTAL $ 873,595 $ 873,595
The purpose of the significant transfers resulted from: • $500,000 transferred to the Capital Fund from the General Fund for future
equipment purchases and capital improvements. This transfer will not be repaid. • $355,000 transferred to the Capital Fund from the Bond Fund for future
equipment purchases and capital improvements. This transfer will not be repaid.
- 30 -

VERNON HILLS PARK DISTRICT VERNON HILLS, ILLINOIS NOTES TO FINANCIAL STATEMENTS (Continued)
- 31 -
6. INDIVIDUAL FUND DISCLOSURES (Continued) b. Interfund Transfers (Continued) At May 31, 2019, the following funds had deficit fund balances:
Lakeview Fitness Center Fund $ 870,262 Family Aquatic Center Fund 282,791
7. CONTINGENT LIABILITIES The District is a defendant in various lawsuits. Although the outcome of these lawsuits is
not presently determinable, in the opinion of the District’s attorney, the resolution of these matters will not have a material adverse effect on the financial condition of the District.
8. RISK MANAGEMENT The District is exposed to various risks of loss to torts; theft of, damage to and destruction
of assets; errors and omissions; injuries to employees; illnesses of employees; and natural disasters.
a. Park District Risk Management Agency Since 2010, the District has been a member of the Park District Risk Management
Agency (PDRMA) Property/Casualty Program. PDRMA is a public entity risk pool consisting of park districts, forest preserve districts, special recreation associations and certain nonprofit organizations serving the needs of public entities formed in accordance with the terms of an intergovernmental cooperative agreement among its members.
Losses exceeding the per occurrence self-insured and reinsurance limit would be the responsibility of the District.
As a member of PDRMA’s Property/Casualty Program, the District is represented on
the Property/Casualty Program Council and the Membership Assembly and is entitled to one vote on each. The relationship between the District and PDRMA is governed by a contract and by-laws that have been adopted by resolution of the District’s governing body. The District is contractually obligated to make all annual and supplementary contributions to PDRMA, to report claims on a timely basis, cooperate with PDRMA, its claims administrator and attorneys in claims investigation and settlement, and to follow risk management procedures as outlined by PDRMA.
The District does not exercise any control over the activities of PDRMA beyond its
representation on the Council and Membership Assembly.
- 31 -

VERNON HILLS PARK DISTRICT VERNON HILLS, ILLINOIS NOTES TO FINANCIAL STATEMENTS (Continued)
- 32 -
8. RISK MANAGEMENT (Continued) a. Park District Risk Management Agency (Continued) Members have a contractual obligation to fund any deficit of PDRMA attributable to
a membership year during which they were a member. The District is not aware of any supplemental assessments owed to PDRMA for the past claim year.
PDRMA is responsible for administering the self-insurance program and purchasing
excess insurance according to the direction of the Program Council. PDRMA also provides its members with risk management services, including the defense of and settlement of claims, and establishes reasonable and necessary loss reduction and prevention procedures to be followed by the members.
The District’s payments to the PDRMA Property/Casualty Program are displayed on
the financial statements as expenditures in the governmental funds. Complete financial statements for PDRMA can be obtained from PDRMA’s
administration offices at 2033 Burlington Avenue, Lisle, Illinois 60532. b. PDRMA Health Program Since June 1, 1997, the District has participated in the PDRMA Health Program, a
health benefits pool of park districts, special recreation associations and public service organizations through which medical, vision, dental, life and prescription drug coverages are provided in excess of specified limits for the members, acting as a single insurable unit. The pool purchases excess insurance covering single claims over $250,000. Until January 1, 2001, the PDRMA Health Program was a separate legal entity known as the Illinois Park Employees Health Network (IPEHN). The District’s payments to the PDRMA Health Program are displayed on the financial statements as expenditures in the governmental funds.
Members can choose to provide any combination of coverages available to their
employees and pay premiums accordingly. As a member of the PDRMA Health Program, the District is represented on the Health
Program Council as well as the Membership Assembly and is entitled to one vote on each. The relationship between the District and the PDRMA Health Program is governed by a contract and by-laws that have been adopted by resolution of each member’s governing body. Members are contractually obligated to make all monthly payments to the PDRMA Health Program and to fund any deficit of the PDRMA Health Program upon dissolution of the pool. They will share in any surplus of the pool based on a decision by the Health Program Council.
- 32 -

VERNON HILLS PARK DISTRICT VERNON HILLS, ILLINOIS NOTES TO FINANCIAL STATEMENTS (Continued)
- 33 -
8. RISK MANAGEMENT (Continued) b. PDRMA Health Program (Continued) The District does not have any control over the activities of the PDRMA Health
Program beyond its representation on the Health Program Council and Membership Assembly. The District is not aware of any supplemental contributions owed to the PDRMA Health Program at May 31, 2019.
9. DEFINED BENEFIT PENSION PLAN Illinois Municipal Retirement Fund The District’s defined benefit pension plan, Illinois Municipal Retirement Fund (IMRF),
provides retirement, disability, annual cost of living adjustments and death benefits to plan members and beneficiaries. IMRF is an agent multiple-employer pension plan that acts as a common investment and administrative agent for local governments and school districts in Illinois. The Illinois Pension Code establishes the benefit provisions of the plan that can only be amended by the Illinois General Assembly. IMRF issues a publicly available financial report that includes financial statements and supplementary information for the plan as a whole but not by individual employer. That report may be obtained online at www.imrf.org.
Plan Administration
All employees hired in positions that meet or exceed the prescribed annual hourly standard
must be enrolled in IMRF as participating members. The plan is accounted for on the economic resources measurement focus and the accrual
basis of accounting. Employer and employee contributions are recognized when earned in the year that the contributions are required, benefits and refunds are recognized as an expense and liability when due and payable.
Plan Membership
At December 31, 2018 (most recent data available), IMRF membership consisted of:
Inactive employees or their beneficiaries currently receiving benefits 21 Inactive employees entitled to but not yet receiving benefits 47 Active employees 60 TOTAL 128
- 33 -

VERNON HILLS PARK DISTRICT VERNON HILLS, ILLINOIS NOTES TO FINANCIAL STATEMENTS (Continued)
- 34 -
9. DEFINED BENEFIT PENSION PLAN (Continued) Illinois Municipal Retirement Fund (Continued) Benefits Provided All employees hired in positions that meet or exceed the prescribed annual hourly standard
must be enrolled in IMRF as participating members. IMRF provides two tiers of pension benefits. Employees hired prior to January 1, 2011, are eligible for Tier 1 benefits. For Tier 1 employees, pension benefits vest after eight years of service.
Participating members who retire at age 55 (reduced benefits) or after age 60 (full benefits)
with eight years of credited service are entitled to an annual retirement benefit, payable monthly for life, in an amount equal to 1 2/3% of their final rate of earnings, for each year of credited service up to 15 years, and 2% for each year thereafter.
Employees hired on or after January 1, 2011, are eligible for Tier 2 benefits. For Tier 2
employees, pension benefits vest after ten years of service. Participating members who retire at age 62 (reduced benefits) or after age 67 (full benefits) with ten years of credited service are entitled to an annual retirement benefit, payable monthly for life, in an amount equal to 1 2/3% of their final rate of earnings, for each year of credited service up to 15 years, and 2% for each year thereafter.
IMRF also provides death and disability benefits. These benefit provisions are established
by state statute. Contributions
Participating members are required to contribute 4.50% of their annual salary to IMRF. The District is required to contribute the remaining amounts necessary to fund IMRF as specified by statute. The employer contribution for the fiscal year ended May 31, 2019 was 8.64% of covered payroll.
- 34 -

VERNON HILLS PARK DISTRICT VERNON HILLS, ILLINOIS NOTES TO FINANCIAL STATEMENTS (Continued)
- 35 -
9. DEFINED BENEFIT PENSION PLAN (Continued) Illinois Municipal Retirement Fund (Continued) Actuarial Assumptions
The District’s net pension liability was measured as of December 31, 2018 (most recent data
available) and the total pension liability used to calculate the net pension liability was determined by an actuarial valuation performed as of the same date using the following actuarial methods and assumptions.
Actuarial valuation date December 31, 2018 Actuarial cost method Entry-age normal Assumptions Inflation 2.50% Salary increases 3.39% to 14.25% Interest rate 7.25% Cost of living adjustment 3.00% Asset valuation method Market value
Additional information on the actuarial assumptions, including a description of how the
long-term expected rate of return on pension plan investments was determined and the assumed asset allocation are available in the separately issued report referenced in the first paragraph of this footnote.
For nondisabled retirees, an IMRF specific mortality table was used with fully generational projection scale MP-2017 (base year 2015). IMRF specific rates were developed from the RP-2014 Blue Collar Health Annuitant Mortality Table with adjustments to match current IMRF experience. For disabled retirees, an IMRF specific mortality table was used with fully generational projection scale MP-2017 (base year 2015). IMRF specific rates were developed from the RP-2014 Disabled Retirees Mortality Table applying the same adjustment that were applied for nondisabled lives. For active members, an IMRF specific mortality table was used with fully generational projection scale MP-2017 (base year 2015). IMRF specific rates were developed from the RP-2014 Employee Mortality Table with adjustments to match current IMRF experience.
- 35 -

VERNON HILLS PARK DISTRICT VERNON HILLS, ILLINOIS NOTES TO FINANCIAL STATEMENTS (Continued)
- 36 -
9. DEFINED BENEFIT PENSION PLAN (Continued) Illinois Municipal Retirement Fund (Continued) Discount Rate
The discount rate used to measure the total pension liability at December 31, 2018 was
7.25%. The projection of cash flows used to determine the discount rate assumed that member contributions will be made at the current contribution rate and that the District contributions will be made at rates equal to the difference between actuarially determined contribution rates and the member rate. Based on those assumptions, the IMRF’s fiduciary net position was projected to be available to make all projected future benefit payments of current plan members.
Changes in the Net Pension Liability
(a)
Total Pension
(b) Plan
Fiduciary
(a) - (b) Net
Pension Liability Net Position Liability BALANCES AT JANUARY 1, 2018
$ 8,359,704
$ 7,803,851
$ 555,853
Changes for the period Service cost 278,931 - 278,931 Interest 621,926 - 621,926 Difference between expected and actual experience 19,066 - 19,066 Changes in assumptions 267,797 - 267,797 Employer contributions - 266,889 (266,889) Employee contributions - 127,360 (127,360) Net investment income - (355,049) 355,049 Benefit payments and refunds (413,648) (413,648) - Administrative expense - 165,676 (165,676) Net changes 774,072 (208,772) 982,844 BALANCES AT DECEMBER 31, 2018
$ 9,133,776
$ 7,595,079
$ 1,538,697
Changes in assumptions related to discount rate were made since the prior measurement date.
- 36 -

VERNON HILLS PARK DISTRICT VERNON HILLS, ILLINOIS NOTES TO FINANCIAL STATEMENTS (Continued)
- 37 -
9. DEFINED BENEFIT PENSION PLAN (Continued) Illinois Municipal Retirement Fund (Continued)
Pension Expense and Deferred Outflows of Resources and Deferred Inflows of
Resources
For the year ended May 31, 2019, the District recognized pension expense of $154,154. At May 31, 2019, the District reported deferred outflows of resources and deferred inflows
of resources related to IMRF from the following sources:
Deferred Outflows of
Deferred Inflows of
Resources Resources Difference between expected and actual experience $ 77,522 $ 96,948 Changes in assumption 222,545 181,521 Net difference between projected and actual earnings on pension plan investments 489,285 - Contributions subsequent to the measurement date 102,909 - TOTAL $ 892,261 $ 278,469
$102,909 reported as deferred outflows of resources related to pensions resulting from the District contributions subsequent to the measurement date will be recognized as a reduction of the net pension liability in the year ending May 31, 2020. Other amounts reported as deferred outflows of resources and deferred inflows of resources related to IMRF will be recognized in pension expense as follows:
Year Ending May 31,
2020 $ 146,101 2021 61,563 2022 61,145 2023 214,381 2024 27,693 Thereafter - TOTAL $ 510,883
- 37 -

VERNON HILLS PARK DISTRICT VERNON HILLS, ILLINOIS NOTES TO FINANCIAL STATEMENTS (Continued)
- 38 -
9. DEFINED BENEFIT PENSION PLAN (Continued) Illinois Municipal Retirement Fund (Continued) Discount Rate Sensitivity The following is a sensitivity analysis of the net pension liability to changes in the discount
rate. The table below presents the net pension liability of the District calculated using the discount rate of 7.25% as well as what the District’s net pension liability would be if it were calculated using a discount rate that is 1 percentage point lower (6.25%) or 1 percentage point higher (8.25%) than the current rate:
1% Decrease Current
Discount Rate
1% Increase (6.25%) (7.25%) (8.25%) Net pension liability $ 2,762,013 $ 1,538,697 $ 540,426
10. OTHER POSTEMPLOYMENT BENEFITS a. Plan Description
In addition to providing the pension benefits described, the District provides postemployment health care benefits (OPEB) for retired employees through a single-employer defined benefit plan (the Plan). The benefits, benefit levels, employee contributions and employer contributions are governed by the District and can be amended by the District through its personnel manual. The Plan is not accounted for as a trust fund, as an irrevocable trust has not been established to account for the Plan. The Plan does not issue a separate report. The District’s total OPEB liability as of May 31, 2019 is immaterial and, therefore, not recorded by the District. The following are the summary results from the District’s actuarial valuation performed as of September 30, 2018. Liabilities $ 114,206 Deferred inflows of resources - Deferred outflows of resources 4,478 Total OPEB expense 13,572
b. Benefits Provided The District provides postemployment health care and life insurance benefits to its
retirees. To be eligible for benefits, the employee must qualify for retirement under the District’s retirement plan. The retirees pay 100% of the average employer group cost.
- 38 -

VERNON HILLS PARK DISTRICT VERNON HILLS, ILLINOIS NOTES TO FINANCIAL STATEMENTS (Continued)
- 39 -
10. OTHER POSTEMPLOYMENT BENEFITS (Continued) c. Membership At September 30, 2018 (the measurement date), membership consisted of:
Inactive employees currently receiving benefits - Inactive employees entitled to benefits but not yet receiving them - Active employees 52 TOTAL 52 Participating employers 1
11. PRIOR PERIOD ADJUSTMENT The District has restated fund balances/net position as of June 1, 2018 to correct overstated
liability balances and expenses recorded in improper period as follows:
Recreation
Fund Capital Fund
Kindergarten Building
FUND BALANCE, JUNE 1, 2018 $ 2,251,717 $ 1,433,858 $ 33,203 Correct overstated liabilities 13,033 30,651 - Reclassify governmental capital assets to business-type capital assets - - 758,248 Record expenditures in correct period - - (47,543) FUND BALANCE (DEFICIT), JUNE 1, 2018 (RESTATED)
$ 2,264,750
$ 1,464,509
$ 743,908
Governmental
Activities Business-Type
Activities Governmental
Activities NET POSITION, JUNE 1, 2018 $ 25,402,723 $ 33,203 $ 25,435,926 Reclassify Kindergarten Building Fund from capital projects to enterprise (758,248) - (758,248) Correct overstated liabilities 43,684 758,248 801,932 Record expenditures in correct period - (47,543) (47,543) Total prior period adjustment (714,564) 710,705 (3,859) NET POSITION, JUNE 1, 2018 (RESTATED) $ 25,688,159 $ 743,908 $ 25,432,067
- 39 -

REQUIRED SUPPLEMENTARY INFORMATION

VERNON HILLS PARK DISTRICTVERNON HILLS, ILLINOIS
SCHEDULE OF REVENUES, EXPENDITURES ANDCHANGES IN FUND BALANCE - BUDGET AND ACTUAL
GENERAL FUND
For the Year Ended May 31, 2019
VarianceOriginal and Over (Under)Final Budget Actual Budget
REVENUES Property taxes 2,282,927$ 2,296,949$ 14,022$ Replacement taxes 24,000 23,301 (699) Investment income 9,942 48,355 38,413 Miscellaneous 74,786 22,314 (52,472)
Total revenues 2,391,655 2,390,919 (736)
EXPENDITURESCurrent
General government 777,717 775,194 (2,523) Parks and recreation 1,394,330 1,487,292 92,962
Total expenditures 2,172,047 2,262,486 90,439
EXCESS (DEFICIENCY) OF REVENUES OVER EXPENDITURES 219,608 128,433 (91,175)
OTHER FINANCING SOURCES (USES)Transfers (out) - (500,000) (500,000)
Total other financing sources (uses) - (500,000) (500,000)
NET CHANGE IN FUND BALANCE 219,608$ (371,567) (591,175)$
FUND BALANCE, JUNE 1 1,132,607
FUND BALANCE, MAY 31 761,040$
(See independent auditor's report.)- 40 -

VarianceOriginal and Over (Under)Final Budget Actual Budget
REVENUESProperty taxes 1,349,456$ 1,331,975$ (17,481)$ Program fees 2,628,774 2,306,168 (322,606) Rental income 144,172 174,849 30,677 Concessions 2,110 1,677 (433) Donations and fundraising 61,250 35,396 (25,854) Investment income 10,755 44,453 33,698 Miscellaneous 14,850 14,654 (196)
Total revenues 4,211,367 3,909,172 (302,195)
EXPENDITURES
Current Parks and recreation
Administration 147,635 160,857 13,222 Employee benefits 745,626 700,218 (45,408) Programs 2,181,919 2,038,303 (143,616) Parks and recreation 285,909 296,103 10,194 Facilities
Sullivan Center 386,273 315,031 (71,242) Lashen Community Center 3,800 3,305 (495) Hartmann Center 8,254 7,183 (1,071) Century Park Pavilion 13,411 14,509 1,098 SRACLC Building 1,345 1,228 (117)
Public relations 132,779 122,920 (9,859)
Total expenditures 3,906,951 3,659,657 (247,294)
EXCESS (DEFICIENCY) OF REVENUES OVER EXPENDITURES 304,416 249,515 (54,901) OTHER FINANCING SOURCES (USES)
Transfers (out) (62,404) (18,595) 43,809
Total other financing sources (uses) (62,404) (18,595) 43,809
NET CHANGE IN FUND BALANCE 242,012$ 230,920 (11,092)$
FUND BALANCE, JUNE 1 2,251,717
Prior period adjustment 13,033
FUND BALANCE, JUNE 1 (RESTATED) 2,264,750
FUND BALANCE, MAY 31 2,495,670$
For the Year Ended May 31, 2019
CHANGES IN FUND BALANCE - BUDGET AND ACTUALSCHEDULE OF REVENUES, EXPENDITURES AND
VERNON HILLS PARK DISTRICTVERNON HILLS, ILLINOIS
RECREATION FUND
(See independent auditor's report.)- 41 -

VERNON HILLS PARK DISTRICTVERNON HILLS, ILLINOIS
SCHEDULE OF REVENUES, EXPENDITURES ANDCHANGES IN FUND BALANCE - BUDGET AND ACTUAL
LAKEVIEW FITNESS CENTER FUND
VarianceOriginal and Over (Under)Final Budget Actual Budget
REVENUES
Fitness center 1,676,876$ 1,645,491$ (31,385)$ Child care 9,600 7,008 (2,592) Aquatics 300,141 254,080 (46,061) Concessions 1,750 766 (984) Rental 2,920 1,680 (1,240) Miscellaneous 7,850 9,502 1,652
Total revenues 1,999,137 1,918,527 (80,610)
EXPENDITURESCurrent
Parks and recreationFitness center 1,127,820 1,134,099 6,279 Child care 737,218 747,841 10,623 Aquatics 297,182 227,052 (70,130)
Total expenditures 2,162,220 2,108,992 (53,228)
NET CHANGE IN FUND BALANCE (163,083)$ (190,465) (27,382)$
FUND BALANCE (DEFICIT), JUNE 1 (679,797)
FUND BALANCE (DEFICIT), MAY 31 (870,262)$
For the Year Ended May 31, 2019
(See independent auditor's report.)- 42 -

FISCAL YEAR ENDING MAY 31, 2016 2017 2018 2019
Actuarially determined contribution 269,275$ 278,239$ 275,868$ 257,052$
Contributions in relation to the actuarially determined contribution 269,275 278,239 275,868 257,052
CONTRIBUTION DEFICIENCY (EXCESS) -$ -$ -$ -$
Covered payroll 2,607,131$ 2,752,924$ 2,849,553$ 2,973,661$
Contributions as a percentage of covered payroll 10.33% 10.11% 9.68% 8.64%
Notes to Required Supplementary Information
The information presented was determined as part of the actuarial valuations as of January 1 of the prior fiscalyear. Additional information as of the latest actuarial valuation presented is as follows: the actuarial costmethod was entry-age normal; the amortization method was level percent of pay, closed and the amortizationperiod was 25 years; the asset valuation method was five-year smoothed market; and the significant actuarialassumptions were an investment rate of return at 7.50% annually, projected salary increases assumption of3.75% to 14.50% compounded annually and postretirement benefit increases of 3.00% compounded annually.
Ultimately, this schedule should present information for the last ten years. However, until ten years ofinformation can be compiled, information will be presented for as many years as is available.
Last Four Fiscal Years
VERNON HILLS PARK DISTRICT
SCHEDULE OF EMPLOYER CONTRIBUTIONSILLINOIS MUNICIPAL RETIREMENT FUND
VERNON HILLS, ILLINOIS
(See independent auditor's report.)- 43 -

MEASUREMENT DATE DECEMBER 31, 2014 2015 2016 2017 2018
TOTAL PENSION LIABILITYService cost 256,653$ 246,791$ 283,775$ 282,497$ 278,931$ Interest 474,427 530,225 566,176 595,717 621,926 Changes of benefit terms - - - - - Differences between expected and actual experience 44,975 (40,030) (170,955) 93,143 19,066 Changes of assumptions 251,821 9,913 (20,431) (257,979) 267,797 Benefit payments, including refunds of member contributions (246,277) (292,792) (257,814) (310,642) (413,648)
Net change in total pension liability 781,599 454,107 400,751 402,736 774,072
Total pension liability - beginning 6,320,511 7,102,110 7,556,217 7,956,968 8,359,704
TOTAL PENSION LIABILITY - ENDING 7,102,110$ 7,556,217$ 7,956,968$ 8,359,704$ 9,133,776$
PLAN FIDUCIARY NET POSITIONContributions - employer 279,376$ 270,726$ 274,482$ 280,971$ 266,889$ Contributions - member 108,854 118,509 121,333 126,563 127,360 Net investment income 350,658 31,102 423,257 1,112,789 (355,049) Benefit payments, including refunds of member contributions (246,227) (292,792) (257,814) (310,642) (413,648) Administrative expense 2,065 (237,404) 20,706 (50,158) 165,676
Net change in plan fiduciary net position 494,726 (109,859) 581,964 1,159,523 (208,772)
Plan fiduciary net position - beginning 5,677,497 6,172,223 6,062,364 6,644,328 7,803,851
PLAN FIDUCIARY NET POSITION - ENDING 6,172,223$ 6,062,364$ 6,644,328$ 7,803,851$ 7,595,079$
EMPLOYER'S NET PENSION LIABILITY 929,887$ 1,493,853$ 1,312,640$ 555,853$ 1,538,697$
Plan fiduciary net position as a percentage of the total pension liability 86.91% 80.23% 83.50% 93.35% 83.15%
Covered payroll 2,419,193$ 2,633,520$ 2,696,277$ 2,812,517$ 2,830,219$
Employer's net pension liability as a percentage of the covered payroll 38.44% 56.72% 48.68% 19.76% 54.37%
Changes in assumptions
Change in assumptions related to retirement age and mortality were made since the prior measurement date at December 31, 2016.Change in assumptions related to discount rate, retirement age and mortality were made since the prior measurement date at December 31, 2017.Change in assumptions related to discount rate were made since the prior measurement date at December 31, 2018.
Ultimately, this schedule should present information for the last ten years. However, until ten years of information can be compiled, information will bepresented for as many years as is available.
VERNON HILLS PARK DISTRICTVERNON HILLS, ILLINOIS
SCHEDULE OF CHANGES IN THE EMPLOYER'S
ILLINOIS MUNICIPAL RETIREMENT FUND
Last Five Fiscal Years
NET PENSION LIABILITY AND RELATED RATIOS
Change in assumptions related to investment rate of return, retirement age and mortality were made since the prior measurement date at December 31,2015.
(See independent auditor's report.)- 44 -

VERNON HILLS PARK DISTRICT VERNON HILLS, ILLINOIS
NOTES TO REQUIRED SUPPLEMENTARY INFORMATION
May 31, 2019
BUDGETS AND BUDGETARY ACCOUNTING 1. The District follows these procedures in establishing the budgetary data. a. The Superintendent of Recreation, the Superintendent of Parks, the Facility Manager
and the Marketing and Communication Manager present detailed budget requests by general ledger line item to the Superintendent of Finance and Human Resources in January.
b. The Superintendent of Finance and Human Resources reviews the proposed budget
with the Executive Director in January. c. Two budget workshops are held with the Executive Director, Division Heads and Park
Board in February and March. The February workshop includes a review of the capital improvement projects to be included in the budget.
d. A Budget and Appropriations hearing is held at a special Board meeting in May. e. Budgets for the Funds are legally adopted on a basis consistent with GAAP. Annual
appropriated budgets are adopted for the General, Special Revenue, Capital Projects, and Debt Service Funds, with the exception of the Kindergarten Fund. Expenditures may not legally exceed appropriations at the fund level. Any expenditures in excess of the legally adopted appropriation must be approved by the Board through a supplemental appropriation.
f. Budgetary control is exercised by the Board at the fund level. No amendments to the
budget are allowed without Board approval. h. All budget authority lapses at the end of the year. No supplemental appropriations
were adopted during the current fiscal year. EXCESS OF EXPENDITURES OVER APPROPRIATION The expenditures in following funds exceeded the budget.
Expenditures
Budget
General Fund $ 2,262,486 $ 2,172,047 Bond Fund 1,734,935 1,729,677 Capital Fund 1,470,766 1,428,000
- 45 -

COMBINING AND INDIVIDUAL FUND FINANCIAL STATEMENTS AND SCHEDULES
MAJOR GOVERNMENTAL FUNDS
GENERAL FUND The General Fund is the general operating fund of the District. It is used to account for all financial resources except those accounted for in another fund. SPECIAL REVENUE FUNDS The Recreation Fund is used to account for revenue and expenditures related to recreation programs. Financing is provided primarily from an annual property tax levy, and fees charged for programs and activities. The Lakeview Fitness Center Fund is used to account for the operations of the Lakeview Fitness Center and Little Learners Childcare. DEBT SERVICE FUND The Bond Fund is used to account for the accumulation of resources for and the payment of principal and interest on the long-term debt of the District, financed primarily by a tax levy. CAPITAL PROJECTS FUNDS The Capital Fund is used to account for funding of future capital improvements, renovations and replacements of the District’s recreation and operations facilities and equipment.

VarianceOriginal and Over (Under)Final Budget Actual Budget
GENERAL GOVERNMENT
AdministrationServices
Legal fees and advertising 27,965$ 33,982$ 6,017$ Professional fees 38,435 40,000 1,565 Contractual services 81,926 86,689 4,763 Health and life insurance 156,479 160,356 3,877 Bank fees and credit card charges 87,360 77,079 (10,281)
Total services 392,165 398,106 5,941
Supplies and equipment 96,725 89,924 (6,801)
Total administration 488,890 488,030 (860)
Employee benefitsIMRF 55,650 57,983 2,333 Social Security 50,306 48,630 (1,676) Health and life insurance 182,871 180,551 (2,320)
Total employee benefits 288,827 287,164 (1,663)
Total general government 777,717 775,194 (2,523)
PARKS AND RECREATION Salaries and wages
Maintenance workers - full-time 590,547 605,820 15,273 Maintenance workers - part-time 67,050 68,698 1,648
Total salaries and wages 657,597 674,518 16,921
Services
Contract mowing 228,784 286,249 57,465 Clothing and uniforms 5,125 5,264 139 Training and travel 30,407 30,828 421
Total services 264,316 322,341 58,025
Supplies and equipmentGasoline/lubricants 50,990 55,288 4,298 Maintenance supplies 87,350 86,486 (864) Office supplies 900 871 (29) Equipment 56,650 30,369 (26,281) Utilities 65,707 63,039 (2,668)
Total supplies and equipment 261,597 236,053 (25,544)
Repairs/improvements 210,820 254,380 43,560
Total recreation 1,394,330 1,487,292 92,962
TOTAL EXPENDITURES 2,172,047$ 2,262,486$ 90,439$
VERNON HILLS PARK DISTRICTVERNON HILLS, ILLINOIS
SCHEDULE OF DETAILED EXPENDITURES - BUDGET AND ACTUALGENERAL FUND
For the Year Ended May 31, 2019
(See independent auditor's report.)- 46 -

VarianceOriginal and Over (Under)Final Budget Actual Budget
PARKS AND RECREATION
AdministrationSalaries and wages 90,637$ 86,637$ (4,000)$
ServicesTraining and travel 15,855 14,934 (921) Subscriptions and dues 1,775 1,660 (115) Utilities 38,568 53,748 15,180
Total services 56,198 70,342 14,144
Supplies and equipment 800 952 152
Miscellaneous - 2,926 2,926
Total administration 147,635 160,857 13,222
Employee benefitsIMRF 151,050 142,514 (8,536) Social security 168,788 157,472 (11,316) Health and life insurance 378,208 359,545 (18,663) Other 47,580 40,687 (6,893)
Total employee benefits 745,626 700,218 (45,408)
Programs Salaries and wages
Recreation - full-time 941,569 958,111 16,542 Recreation - part-time 529,616 450,814 (78,802)
Total salaries and wages 1,471,185 1,408,925 (62,260)
Services
Contractual 112,772 101,243 (11,529) Recreation contractors 334,143 298,245 (35,898) Officials 24,062 20,792 (3,270) Building rentals 2,600 2,726 126 Training and travel 45,250 30,878 (14,372) Utilities 6,784 4,134 (2,650) League/tourney fees 69,600 71,272 1,672
Total services 595,211 529,290 (65,921)
Supplies and equipmentRecreation supplies 99,326 91,675 (7,651) Clothing 12,347 6,897 (5,450) Recreation equipment 3,850 1,516 (2,334)
Total supplies and equipment 115,523 100,088 (15,435)
Total programs 2,181,919 2,038,303 (143,616)
VERNON HILLS PARK DISTRICTVERNON HILLS, ILLINOIS
SCHEDULE OF DETAILED EXPENDITURES - BUDGET AND ACTUALRECREATION FUND
For the Year Ended May 31, 2019
(This schedule is continued on the following pages.)- 47 -

VarianceOriginal and Over (Under)Final Budget Actual Budget
PARKS AND RECREATION (Continued)
Parks and recreationSalaries and wages
Supervision - full-time 233,409$ 243,970$ 10,561$ Customer service - part-time 52,500 52,133 (367)
Total salaries and wages 285,909 296,103 10,194
Total parks and recreation 285,909 296,103 10,194
FacilitiesSullivan Center
Salaries and wagesMaintenance workers - full-time 122,139 112,234 (9,905) Maintenance workers - part-time 20,280 14,065 (6,215) Recreation supervisor - full-time 21,268 16,794 (4,474)
Total salaries and wages 163,687 143,093 (20,594)
ServicesContractual 13,811 16,507 2,696 Utilities 70,762 72,448 1,686
Total services 84,573 88,955 4,382
Supplies and equipmentBuilding supplies 1,300 1,124 (176) Custodial supplies 8,263 9,380 1,117
Total supplies and equipment 9,563 10,504 941
Repairs and maintenanceEquipment 25,150 20,120 (5,030) Buildings 103,300 52,359 (50,941)
Total repairs and maintenance 128,450 72,479 (55,971)
Total Sullivan Center 386,273 315,031 (71,242)
Laschen Community CenterContractual 3,800 3,305 (495)
Total Laschen Community Center 3,800 3,305 (495)
Hartmann CenterUtilities 3,269 3,073 (196) Building supplies 185 155 (30) Buildings 4,800 3,955 (845)
Total Hartmann Center 8,254 7,183 (1,071)
VERNON HILLS PARK DISTRICTVERNON HILLS, ILLINOIS
SCHEDULE OF DETAILED EXPENDITURES - BUDGET AND ACTUAL (Continued)RECREATION FUND
For the Year Ended May 31, 2019
(This schedule is continued on the following page.)- 48 -

VarianceOriginal and Over (Under)Final Budget Actual Budget
VERNON HILLS PARK DISTRICTVERNON HILLS, ILLINOIS
SCHEDULE OF DETAILED EXPENDITURES - BUDGET AND ACTUAL (Continued)RECREATION FUND
For the Year Ended May 31, 2019
PARKS AND RECREATION (Continued)Facilities (Continued)
Century Park PavilionSalaries and wages
Recreation supervisor - part-time 650$ 1,000$ 350$
ServicesContractual 1,366 1,824 458 Utilities 2,255 5,269 3,014
Total services 3,621 7,093 3,472
Supplies and equipmentBuilding supplies 1,140 409 (731)
Repairs and maintenanceBuilding/equipment 8,000 6,007 (1,993)
Total Century Park Pavilion 13,411 14,509 1,098
SRACLC BuildingBuildings 1,345 1,228 (117)
Total SRACLC Building 1,345 1,228 (117)
Total facilities 413,083 341,256 (71,827)
Public relationsServices
Contractual 7,300 3,252 (4,048) Printing 38,100 40,768 2,668
Total services 45,400 44,020 (1,380)
Supplies and equipmentPostage 9,920 7,740 (2,180) Promotional 77,459 71,160 (6,299)
Total supplies and equipment 87,379 78,900 (8,479)
Total public relations 132,779 122,920 (9,859)
Total recreation 3,906,951 3,659,657 (247,294)
TOTAL EXPENDITURES 3,906,951$ 3,659,657$ (247,294)$
(See independent auditor's report.)- 49 -

VarianceOriginal and Over (Under)Final Budget Actual Budget
FITNESS CENTER
Salaries and WagesMaintenance workers 296,644$ 275,285$ (21,359)$ Personal trainers 35,535 55,383 19,848 Fitness instructors 211,066 221,044 9,978
Total salaries and wages 543,245 551,712 8,467
Employee benefitsIMRF 21,200 20,405 (795) Social Security 59,828 58,044 (1,784) Health and life insurance 80,338 75,514 (4,824) Other 667 168 (499)
Total employee benefits 162,033 154,131 (7,902)
ServicesContractual 104,597 100,993 (3,604) Professional 5,352 2,756 (2,596) Promotional fees 8,710 8,304 (406) Special events 1,000 1,956 956 Training and travel 3,350 3,224 (126) Utilities 160,673 166,838 6,165 Other services 25,140 30,393 5,253
Total services 308,822 314,464 5,642
Supplies and equipmentOffice supplies 2,600 4,276 1,676 Office equipment 750 126 (624) Other supplies/equipment 6,095 7,422 1,327 Fitness equipment 5,225 4,046 (1,179) Building supplies 2,850 2,956 106 Custodial supplies 40,100 42,209 2,109
Total supplies and equipment 57,620 61,035 3,415
Repairs and maintenanceEquipment 14,500 23,639 9,139 Buildings/grounds improvements 41,600 29,118 (12,482)
Total repairs and maintenance 56,100 52,757 (3,343)
Total fitness center 1,127,820 1,134,099 6,279
VERNON HILLS PARK DISTRICTVERNON HILLS, ILLINOIS
SCHEDULE OF DETAILED EXPENDITURES - BUDGET AND ACTUALLAKEVIEW FITNESS CENTER FUND
For the Year Ended May 31, 2019
(This schedule is continued on the following pages.)- 50 -

VarianceOriginal and Over (Under)Final Budget Actual Budget
CHILD CARE Salaries and wages
Supervision 378,967$ 390,592$ 11,625$ Staff 80,204 79,417 (787)
Total salaries and wages 459,171 470,009 10,838
Employee benefits IMRF 37,100 36,149 (951) Social Security 35,441 32,133 (3,308) Health and life insurance 146,511 144,901 (1,610) Other 668 168 (500)
Total employee benefits 219,720 213,351 (6,369)
Services Contractual 1,911 1,742 (169) Training and travel 340 285 (55) Other services 116 637 521
Total services 2,367 2,664 297
Supplies and equipmentField trips 5,250 4,544 (706) Daycare supplies 7,850 7,201 (649) Equipment 1,300 2,110 810 Lunch supplies 27,040 30,791 3,751 Food supplies 14,520 17,171 2,651
Total supplies and equipment 55,960 61,817 5,857
Total child care 737,218 747,841 10,623
AQUATICS Salaries and wages
Supervisors 47,859 7,229 (40,630) Swim instructors 66,100 48,188 (17,912) Lifeguards 124,768 117,259 (7,509)
Total salaries and wages 238,727 172,676 (66,051)
VERNON HILLS PARK DISTRICTVERNON HILLS, ILLINOIS
SCHEDULE OF DETAILED EXPENDITURES - BUDGET AND ACTUAL (Continued)LAKEVIEW FITNESS CENTER FUND
For the Year Ended May 31, 2019
(This schedule is continued on the following page.)- 51 -

VarianceOriginal and Over (Under)Final Budget Actual Budget
VERNON HILLS PARK DISTRICTVERNON HILLS, ILLINOIS
SCHEDULE OF DETAILED EXPENDITURES - BUDGET AND ACTUAL (Continued)LAKEVIEW FITNESS CENTER FUND
For the Year Ended May 31, 2019
AQUATICS (Continued) Services
Contractual 7,480$ 7,162$ (318)$ Lifeguard training 1,300 875 (425) Swim meet expenditures 11,320 12,138 818
Total services 20,100 20,175 75
Supplies and equipmentSwim meet supplies 1,500 1,595 95 Swim lesson supplies 700 244 (456) Pool supplies 18,180 13,722 (4,458) Clothing 4,325 2,933 (1,392)
Total supplies and equipment 24,705 18,494 (6,211)
Repairs and maintenance Equipment 250 502 252 Buildings 13,400 15,205 1,805
Total repairs and maintenance 13,650 15,707 2,057
Total aquatics 297,182 227,052 (70,130)
TOTAL EXPENDITURES 2,162,220$ 2,108,992$ (53,228)$
(See independent auditor's report.)- 52 -

VERNON HILLS PARK DISTRICTVERNON HILLS, ILLINOIS
SCHEDULE OF REVENUES, EXPENDITURES ANDCHANGES IN FUND BALANCE - BUDGET AND ACTUAL
BOND FUND
VarianceOriginal and Over (Under)Final Budget Actual Budget
REVENUESProperty taxes 1,050,800$ 1,046,484$ (4,316)$ Investment income 300 251 (49)
Total revenues 1,051,100 1,046,735 (4,365)
EXPENDITURESDebt service
Principal retirement 1,715,227 1,464,205 (251,022) Interest and fiscal charges - 256,672 256,672 Issuance costs 14,450 14,058 (392)
Total expenditures 1,729,677 1,734,935 5,258
EXCESS (DEFICIENCY) OF REVENUES OVER EXPENDITURES (678,577) (688,200) (9,623)
OTHER FINANCING SOURCES (USES)Transfers (out) (355,000) (355,000) - Issuance of bonds 1,035,000 1,031,385 (3,615)
Total other financing sources (uses) 680,000 676,385 (3,615)
NET CHANGE IN FUND BALANCE 1,423$ (11,815) (13,238)$
FUND BALANCE, JUNE 1 348,317
FUND BALANCE, MAY 31 336,502$
For the Year Ended May 31, 2019
(See independent auditor's report.)- 53 -

VERNON HILLS PARK DISTRICT
VarianceOriginal and Over (Under)Final Budget Actual Budget
REVENUES
Impact fees 1,399,000$ 338,209$ (1,060,791)$ Investment income 450 10,841 10,391 Contributions 100,000 100,000 -
Total revenues 1,499,450 449,050 (1,050,400)
EXPENDITURESCapital outlay 1,428,000 1,470,766 42,766
Total expenditures 1,428,000 1,470,766 42,766
EXCESS (DEFICIENCY) OF REVENUES OVER EXPENDITURES 71,450 (1,021,716) (1,093,166)
OTHER FINANCING SOURCES (USES)Transfers in 355,000 855,000 500,000
Total other financing sources (uses) 355,000 855,000 500,000
NET CHANGE IN FUND BALANCE 426,450$ (166,716) (593,166)$
FUND BALANCE, JUNE 1 1,433,858
Prior period adjustment 30,651
FUND BALANCE, JUNE 1 (RESTATED) 1,464,509
FUND BALANCE, MAY 31 1,297,793$
VERNON HILLS, ILLINOIS
SCHEDULE OF REVENUES, EXPENDITURES ANDCHANGES IN FUND BALANCE - BUDGET AND ACTUAL
CAPITAL FUND
For the Year Ended May 31, 2019
(See independent auditor's report.)- 54 -

NONMAJOR GOVERNMENTAL FUNDS
SPECIAL REVENUE FUNDS Special Revenue Funds - to account for the collection and disbursement of restricted, committed or assigned monies for a specific purpose. Special Recreation - to account for property taxes restricted for funding recreation activities for
disabled individuals. Family Aquatic Center - to account for the operations of the District’s water parks. Financing
is provided primarily from fees charged for programs and activities.

FamilySpecial Aquatic
Recreation Center Total
Cash 54,028$ 1,300$ 55,328$ Property taxes receivable (net, where applicable, of allowances for uncollectibles) 247,710 - 247,710
TOTAL ASSETS 301,738$ 1,300$ 303,038$
LIABILITIESAccounts payable -$ 19,652$ 19,652$ Accrued payroll 554 11,810 12,364 Unearned revenue - 75,872 75,872 Due to other funds - 176,757 176,757
Total liabilities 554 284,091 284,645
DEFERRED INFLOWS OF RESOURCESDeferred revenue - property taxes 250,008 - 250,008
Total deferred inflows of resources 250,008 - 250,008
Total liabilities and deferred inflows of resources 250,562 284,091 534,653
FUND BALANCESRestricted for special recreation 51,176 - 51,176 Unrestricted
Unassigned (deficit) - (282,791) (282,791)
Total fund balances (deficit) 51,176 (282,791) (231,615)
TOTAL LIABILITIES, DEFERRED INFLOWS OF RESOURCES AND FUND BALANCES 301,738$ 1,300$ 303,038$
Special Revenue
RESOURCES AND FUND BALANCESLIABILITIES, DEFERRED INFLOWS
ASSETS
VERNON HILLS PARK DISTRICTVERNON HILLS, ILLINOIS
COMBINING BALANCE SHEETNONMAJOR GOVERNMENTAL FUNDS
May 31, 2019
(See independent auditor's report.)- 55 -

FamilySpecial Aquatic
Recreation Center Total
REVENUESTaxes 309,894$ -$ 309,894$ Investment income 451 - 451 Rental income - 6,244 6,244 Charges for services - 282,814 282,814 Miscellaneous - 2,700 2,700
Total revenues 310,345 291,758 602,103
EXPENDITURES
CurrentParks and recreation 185,079 434,410 619,489
Capital outlay 101,300 - 101,300
Total expenditures 286,379 434,410 720,789
EXCESS (DEFICIENCY) OF REVENUES OVER EXPENDITURES 23,966 (142,652) (118,686) OTHER FINANCING SOURCES (USES)
Transfers in - 18,595 18,595
Total other financing sources (uses) - 18,595 18,595
NET CHANGE IN FUND BALANCES 23,966 (124,057) (100,091)
FUND BALANCES (DEFICIT), JUNE 1 27,210 (158,734) (131,524)
FUND BALANCES (DEFICIT), MAY 31 51,176$ (282,791)$ (231,615)$
For the Year Ended May 31, 2019
Special Revenue
COMBINING STATEMENT OF REVENUES, EXPENDITURES
VERNON HILLS, ILLINOISVERNON HILLS PARK DISTRICT
AND CHANGES IN FUND BALANCESNONMAJOR GOVERNMENTAL FUNDS
(See independent auditor's report.)- 56 -

VERNON HILLS PARK DISTRICTVERNON HILLS, ILLINOIS
SCHEDULE OF REVENUES, EXPENDITURES ANDCHANGES IN FUND BALANCE - BUDGET AND ACTUAL
SPECIAL RECREATION FUND
VarianceOriginal and Over (Under)Final Budget Actual Budget
REVENUES
Property taxes 308,450$ 309,894$ 1,444$ Investment income 250 451 201
Total revenues 308,700 310,345 1,645
EXPENDITURESCurrent
Parks and recreationSpecial recreation services 197,422 185,079 (12,343)
Capital outlay 101,540 101,300 (240)
Total expenditures 298,962 286,379 (12,583)
NET CHANGE IN FUND BALANCE 9,738$ 23,966 14,228$
FUND BALANCE, JUNE 1 27,210
FUND BALANCE, MAY 31 51,176$
For the Year Ended May 31, 2019
(See independent auditor's report.)- 57 -

VarianceOriginal and Over (Under)Final Budget Actual Budget
REVENUES
Aquatic center 288,119$ 275,222$ (12,897)$ Rental income 5,236 6,244 1,008 Concessions 10,300 7,592 (2,708) Miscellaneous 1,000 2,700 1,700
Total revenues 304,655 291,758 (12,897)
EXPENDITURESCurrent
Parks and recreationAdministration 6,675 4,941 (1,734) Programs 9,231 8,557 (674) Facilities 418,604 420,912 2,308
Total expenditures 434,510 434,410 (100)
EXCESS (DEFICIENCY) OF REVENUES OVER EXPENDITURES (129,855) (142,652) (12,797)
OTHER FINANCING SOURCES (USES)Transfers in 26,869 18,595 (8,274)
Total other financing sources (uses) 26,869 18,595 (8,274)
NET CHANGE IN FUND BALANCE (102,986)$ (124,057) (21,071)$
FUND BALANCE (DEFICIT), JUNE 1 (158,734)
FUND BALANCE (DEFICIT), MAY 31 (282,791)$
For the Year Ended May 31, 2019
VERNON HILLS PARK DISTRICTVERNON HILLS, ILLINOIS
SCHEDULE OF REVENUES, EXPENDITURES ANDCHANGES IN FUND BALANCE - BUDGET AND ACTUAL
FAMILY AQUATIC CENTER FUND
(See independent auditor's report.)- 58 -

VarianceOriginal and Over (Under)Final Budget Actual Budget
RECREATION
AdministrationSalaries and wages
Receptionists -$ (88)$ (88)$ Contractual services 6,675 5,029 (1,646)
Total administration 6,675 4,941 (1,734)
Programs Salaries and wages
Swim instructors 9,231 8,557 (674)
Total programs 9,231 8,557 (674)
FacilitiesSalaries and wages
Lifeguards 222,504 216,906 (5,598) Supervision 18,340 9,572 (8,768)
Utilities 81,600 111,307 29,707 Supplies and equipment
Pool supplies 8,850 9,105 255 Pool chemicals 23,425 34,161 10,736
Repairs and maintenance Equipment 18,260 9,346 (8,914) Buildings 45,625 30,515 (15,110)
Total facilities 418,604 420,912 2,308
Total recreation 434,510 434,410 (100)
TOTAL EXPENDITURES 434,510$ 434,410$ (100)$
For the Year Ended May 31, 2019
VERNON HILLS PARK DISTRICTVERNON HILLS, ILLINOIS
SCHEDULE OF DETAILED EXPENDITURES - BUDGET AND ACTUALFAMILY AQUATIC CENTER FUND
(See independent auditor's report.)- 59 -

STATISTICAL SECTION
This part of the Vernon Hills Park District’s comprehensive annual financial report presents detailed information as a context for understanding what the information in the financial statements, note disclosures and required supplementary information displays about the District’s overall financial health. Contents Page(s) Financial Trends These schedules contain trend information to help the reader understand how
the District’s financial performance and well-being have been changed over time.
60-69 Revenue Capacity These schedules contain information to help the reader assess the District’s
most significant local revenue source, the property tax.
70-75 Debt Capacity These schedules present information to help the reader assess the
affordability of the District’s current levels of outstanding debt and the District’s ability to issue additional debt in the future.
76-80 Demographic and Economic Information These schedules offer demographic and economic indicators to help the
reader understand the environment within which the District’s financial activities take place.
81-83 Operating Information These schedules contain service and infrastructure data to help the reader
understand how the information in the District’s financial report relates to the services the District provides and the activities it performs.
84-85 Sources: Unless otherwise noted, the information in these schedules is derived from the
comprehensive annual financial reports for the relevant year.

Fiscal Year 2010 2011 2012 2013
GOVERNMENTAL ACTIVITIESNet investment in capital assets 11,869,151$ 13,448,632$ 15,390,796$ 16,530,249$ Restricted - 304,011 445,512 476,022 Unrestricted 7,446,754 2,387,937 2,027,376 1,925,030
Total governmental activities 19,315,905 16,140,580 17,863,684 18,931,301
BUSINESS-TYPE ACTIVITIESNet investment in capital assets - - - - Restricted - - - - Unrestricted - - - -
- - - -
TOTAL GOVERNMENTAL ACTIVITIES AND TOTAL PRIMARY GOVERNMENT 19,315,905$ 16,140,580$ 17,863,684$ 18,931,301$
*In 2018, the Kindergarten Building was classified as a capital projects fund, but is now an enterprise fund.
Data Source
Audited Financial Statements
VERNON HILLS PARK DISTRICTVERNON HILLS, ILLINOIS
NET POSITION
Last Ten Fiscal Years
- 60 -

2014 2015 2016 2017 2018 2019*
17,396,402$ 18,071,739$ 21,807,207$ 22,503,763$ 23,818,815$ 24,235,627$ 394,452 351,716 383,970 356,095 408,730 387,678
3,078,930 3,372,563 1,014,821 882,308 1,208,381 (484,683)
20,869,784 21,796,018 23,205,998 23,742,166 25,435,926 24,138,622
- - - - - 1,779,285 - - - - - - - - - - - (499,249)
- - - - - 1,280,036
20,869,784$ 21,796,018$ 23,205,998$ 23,742,166$ 25,435,926$ 25,418,658$
- 61 -

Fiscal Year 2010 2011 2012 2013
EXPENSESGovernmental activities
General government -$ -$ -$ -$ Parks and recreation 5,218,283 5,753,261 5,620,422 6,866,347 Interest and fiscal charges 214,380 139,911 115,463 85,430
Total governmental activities 5,432,663 5,893,172 5,735,885 6,951,777
Business-type activitiesKindergarten Building - - - -
TOTAL PRIMARY GOVERNMENT EXPENSES 5,432,663$ 5,893,172$ 5,735,885$ 6,951,777$
PROGRAM REVENUESGovernmental activities
Charges for services 1,810,306$ 2,213,211$ 1,947,080$ 2,469,473$ Operating grants and contributions 3,082 - - - Capital grants and contributions - 413,711 14,221 31,150
Total governmental activities 1,813,388 2,626,922 1,961,301 2,500,623
Business-type activitiesKindergarten Building - - - -
TOTAL PRIMARY GOVERNMENT PROGRAM REVENUES 1,813,388$ 2,626,922$ 1,961,301$ 2,500,623$
NET REVENUE (EXPENSE) Governmental activities 3,619,275$ 3,266,250$ 3,774,584$ 4,451,154$ Business-type activities - - - -
TOTAL PRIMARY GOVERNMENT NET REVENUE (EXPENSE) 3,619,275$ 3,266,250$ 3,774,584$ 4,451,154$
VERNON HILLS PARK DISTRICTVERNON HILLS, ILLINOIS
CHANGE IN NET POSITION
Last Ten Fiscal Years
- 62 -

2014 2015 2016 2017 2018 2019
-$ -$ -$ -$ -$ 2,348,818$ 8,085,264 8,376,704 9,631,699 9,644,569 9,847,642 8,252,731
128,635 118,159 91,546 258,625 257,924 264,494
8,213,899 8,494,863 9,723,245 9,903,194 10,105,566 10,866,043
- - - - - -
8,213,899$ 8,494,863$ 9,723,245$ 9,903,194$ 10,105,566$ 10,866,043$
3,752,563$ 4,073,236$ 4,958,474$ 4,880,872$ 4,864,241$ 4,680,777$ - - 1,973,528 507,162 1,131,353 473,605
33,541 23,739 - - - -
3,786,104 4,096,975 6,932,002 5,388,034 5,995,594 5,154,382
- - - - - 536,128
3,786,104$ 4,096,975$ 6,932,002$ 5,388,034$ 5,995,594$ 5,690,510$
4,427,795$ 4,397,888$ 2,791,243$ 4,515,160$ 4,109,972$ 5,711,661$ - - - - - (536,128)
4,427,795$ 4,397,888$ 2,791,243$ 4,515,160$ 4,109,972$ 5,175,533$
- 63 -

Fiscal Year 2010 2011 2012 2013
GENERAL REVENUES AND OTHER CHANGES IN NET POSITION
Governmental activitiesTaxes
Property 4,088,084$ 4,087,125$ 5,317,834$ 5,311,167$ Replacement 19,927 24,587 21,680 22,946
Investment income 64,393 28,818 9,774 14,374 Miscellaneous 10,848 28,761 148,400 171,284
Total governmental activities 4,183,252 4,169,291 5,497,688 5,519,771
Business-type activitiesNone - - - -
TOTAL GENERAL REVENUES 4,183,252$ 4,169,291$ 5,497,688$ 5,519,771$
CHANGE IN NET POSITIONGovernmental activities 563,977$ 903,041$ 1,723,104$ 1,068,617$ Business-type activities - - - -
TOTAL PRIMARY GOVERNMENT CHANGE IN NET POSITION 563,977$ 903,041$ 1,723,104$ 1,068,617$
The District allocated charges to general government beginning in fiscal year 2019.
Data Source
Audited Financial Statements
VERNON HILLS PARK DISTRICTVERNON HILLS, ILLINOIS
CHANGE IN NET POSITION (Continued)
Last Ten Fiscal Years
- 64 -

2014 2015 2016 2017 2018 2019
5,422,697$ 4,573,441$ 4,691,273$ 4,923,723$ 4,836,267$ 4,985,302$ 24,048 25,171 23,173 25,741 27,511 23,301 21,271 12,677 21,430 25,468 51,990 104,351
897,262 712,787 65,904 66,396 887,964 49,170
6,365,278 5,324,076 4,801,780 5,041,328 5,803,732 5,162,124
- - - - - -
6,365,278$ 5,324,076$ 4,801,780$ 5,041,328$ 5,803,732$ 5,162,124$
1,937,483$ 926,188$ 2,010,537$ 526,168$ 1,693,760$ (549,537)$ - - - - - 536,128
1,937,483$ 926,188$ 2,010,537$ 526,168$ 1,693,760$ (13,409)$
- 65 -

Fiscal Year 2010 2011 2012 2013
GENERAL FUNDReserved 28,956$ -$ -$ -$ Unreserved 372,290 498,804 - - Nonspendable in form - - - - Assigned - - - - Unassigned - - 483,373 494,771
TOTAL GENERAL FUND 401,246 498,804 483,373 494,771
ALL OTHER GOVERNMENTAL FUNDSReserved 31,514$ -$ -$ -$ Unreserved, reported in
Special Revenue Funds 556,548 793,717 - - Capital Project Funds 2,149,625 1,432,340 - - Debt Service Funds 388,249 363,911 - -
Nonspendable in form - - - - Restricted - - 487,412 499,522 Committed - - 837,915 1,102,709 Assigned - - 833,594 875,688 Unassigned - - - (384,652)
TOTAL ALL OTHER GOVERNMENTAL FUNDS 3,125,936 2,589,968 2,158,921 2,093,267
TOTAL ALL GOVENMENTAL FUNDS 3,527,182$ 3,088,772$ 2,642,294$ 2,588,038$
The District implemented GASB Statement No. 54 in fiscal year 2012.
Data Source
Audited Financial Statements
Last Ten Fiscal Years
FUND BALANCES OF GOVERNMENTAL FUNDS
VERNON HILLS, ILLINOISVERNON HILLS PARK DISTRICT
- 66 -

2014 2015 2016 2017 2018 2019
-$ -$ -$ -$ -$ -$ - - - - - - - - 3,345 8,984 3,534 2,470 - - - - - -
567,448 867,383 1,064,219 924,990 1,129,073 758,570
567,448 867,383 1,067,564 933,974 1,132,607 761,040
-$ -$ -$ -$ -$ -$
- - - - - - - - - - - - - - - - - - - - - - 6,061 8,714
441,605 397,895 383,973 356,095 408,730 387,678 1,411,406 1,439,814 1,779,946 1,971,169 2,245,656 - 1,757,919 1,832,436 657,474 748,671 1,433,858 3,784,749 (495,967) (588,747) (560,417) (633,621) (838,531) (1,153,053)
3,114,963 3,081,398 2,260,976 2,442,314 3,255,774 3,028,088
3,682,411$ 3,948,781$ 3,328,540$ 3,376,288$ 4,388,381$ 3,789,128$
- 67 -

Fiscal Year 2010 2011 2012 2013
REVENUESTaxes 4,430,549$ 4,111,712$ 5,339,514$ 5,334,113$ Investment income 64,393 28,818 9,774 14,374 Rental income - - - - Charges for services 1,810,306 2,213,211 1,947,080 2,469,473 Intergovernmental revenue - 413,711 14,221 31,150 Merchandise sales - - - - Impact fees - - - - Contributions 3,082 - - - Miscellaneous 10,848 28,761 148,400 171,284
Total revenues 6,319,178 6,796,213 7,458,989 8,020,394
EXPENDITURESGeneral government 1,946,830 1,821,384 2,096,671 2,064,435 Parks and recreation 2,911,187 3,016,518 3,186,785 4,074,710 Capital outlay 242,653 1,554,076 701,736 2,034,399 Debt service
Principal retirement 6,404,000 715,000 1,800,000 1,840,000 Interest 322,755 127,642 120,275 86,106 Issuance costs - - - -
Total expenditures 11,827,425 7,234,620 7,905,467 10,099,650
EXCESS (DEFICIENCY) OF REVENUES OVER EXPENDITURES (5,508,247) (438,407) (446,478) (2,079,256)
OTHER FINANCING SOURCES (USES)Transfers in - - - - Transfers (out) - - - - Bonds issued 6,218,535 - - 2,025,000 Premium on bonds - - - -
Total other financing sources (uses) 6,218,535 - - 2,025,000
NET CHANGE IN FUND BALANCES 710,288$ (438,407)$ (446,478)$ (54,256)$
DEBT SERVICE AS A PERCENTAGE OF NONCAPITAL EXPENDITURES 422.06% (149.54%) (43.09%) 46.16%
Data Source
Audited Financial Statements
Last Ten Fiscal Years
CHANGES IN FUND BALANCES OF GOVERNMENTAL FUNDS
VERNON HILLS, ILLINOISVERNON HILLS PARK DISTRICT
- 68 -

2014 2015 2016 2017 2018 2019
5,446,745$ 4,598,612$ 4,691,273$ 4,923,723$ 4,836,267$ 5,008,603$ 21,271 12,677 21,430 35,468 51,990 104,351
- - - - - 182,773 3,752,563 4,073,236 4,807,978 4,880,872 4,864,241 4,495,561
33,541 23,739 23,173 25,741 807,511 - - - - - - 2,443 - - 360,787 185,301 1,047,302 338,209 - - 1,612,741 315,553 84,051 135,396
400,143 138,718 216,400 72,704 101,013 49,170
9,654,263 8,846,982 11,733,782 10,439,362 11,792,375 10,316,506
2,066,693 1,843,749 2,014,117 1,923,598 2,170,447 775,194 5,065,796 5,709,003 6,026,506 6,213,961 6,441,636 7,875,430 4,421,762 512,104 3,598,768 7,764,738 1,489,144 1,572,066
1,880,000 1,387,285 1,524,166 1,422,880 1,439,810 1,464,205 102,924 119,134 95,007 182,455 258,450 256,672
- - - - - 14,058
13,537,175 9,571,275 13,258,564 17,507,632 11,799,487 11,957,625
(3,882,912) (724,293) (1,524,782) (7,068,270) (7,112) (1,641,119)
- - 488,000 708,880 332,000 873,595 - - (488,000) (708,880) (332,000) (873,595)
4,977,285 990,663 904,528 7,004,810 1,019,205 1,031,385 - - - 111,208 - -
4,977,285 990,663 904,528 7,116,018 1,019,205 1,031,385
1,094,373$ 266,370$ (620,254)$ 47,748$ 1,012,093$ (609,734)$
18.22% 18.90% 14.81% 14.57% 14.39% 15.50%
- 69 -

VERNON HILLS PARK DISTRICTVERNON HILLS, ILLINOIS
ASSESSED VALUE AND ESTIMATED ACTUAL VALUE OF TAXABLE PROPERTY
Last Ten Levy Years
Total Estimated Estimated Equalized Direct Actual Actual
Levy Assessed Tax Taxable TaxableYear Value Rate Value Value
2009 1,290,336,496$ 0.3170 3,871,009,488$ 33.333%
2010 1,245,913,675 0.4270 3,737,741,025 33.333%
2011 1,180,690,605 0.4500 3,542,071,815 33.333%
2012 1,096,575,508 0.4960 3,289,726,524 33.333%
2013 1,037,740,575 0.4450 3,113,221,725 33.333%
2014 1,034,209,066 0.4550 3,102,627,198 33.333%
2015 1,079,105,866 0.4580 3,237,317,598 33.333%
2016 1,154,068,636 0.4190 3,462,205,908 33.333%
2017 1,198,394,088 0.4160 3,595,182,264 33.333%
2018 1,227,876,585 0.4110 3,683,629,755 33.333%
Data Source
Office of the County Clerk
- 70 -

Percentage Percentageof Total of TotalDistrict District
Taxable Taxable Taxable TaxableAssessed Assessed Assessed Assessed
Taxpayer Value Rank Valuation Value Rank Valuation
Westfield Shoppingtown Hawthorn 25,482,639$ 1 2.08% 19,933,340$ 2 1.54%
Azure Partners LLC 13,472,537 2 1.10%
Mesirow Financial Revf II Reit LLC 12,561,131 3 1.02% 21,388,738 1 1.66%
Van Vlissingen & Co 11,549,948 4 0.94% 11,798,664 3 0.91%
Leahy Vernon Hills Development 9,118,882 5 0.74% 9,627,300 6 0.75%
CDW Computer Centers, Inc. 8,232,248 6 0.67% 10,746,574 5 0.83%
Inland Real Estate 8,215,251 7 0.67%
Hawthorn Hills Square, LLC 7,810,200 8 0.64%
PWA Continental Executive Park LP 6,961,601 9 0.57%
Dfair Acquisition LLC 6,680,797 10
Museum Gardens II LLC 11,609,910 4 0.90%
HCP Ventures 6,572,420 7 0.51%
Walmart Property 6,497,544 8 0.50%
PAC/SIB LLC 6,265,314 9 0.49%
Hawthorn-Vernon Hills LLC 6,077,677 10 0.47%
110,085,234$ 8.43% 110,517,481$ 8.56%
N/A - not available
Data Source
Office of the County Clerk
VERNON HILLS PARK DISTRICTVERNON HILLS, ILLINOIS
2019 2009
Note: Every effort has been made to seek out and report the largest taxpayers. However, many of the taxpayers contain multiple parcels, and it ispossible that some parcels and their valuations have been overlooked.
PRINCIPAL PROPERTY TAXPAYERS
Current Year and Nine Years Ago
- 71 -

Levy Year 2009 2010 2011 2012 2013 2014 2015 2016 2017 2018
DISTRICT RATESCorporate 0.1460 0.1570 0.1690 0.1890 0.2040 0.2079 0.2029 0.1930 0.1918 0.1891 Recreation 0.0880 0.0940 0.1010 0.1120 0.1210 0.1243 0.1205 0.1141 0.1112 0.1145 IMRF - - - - - - - - - - Liability Insurance - - - - - - - - - - Audit - - - - - - - - - - Special Recreation 0.0120 0.0210 0.0170 0.0190 0.0240 0.0251 0.0400 0.0235 0.0259 0.0204 Paving and Lighting - - - - - - - - - - Police Protection - - - - - - - - - - Social Security - - - - - - - - - - Bonds and Interest 0.0710 0.1550 0.1630 0.1760 0.0960 0.0977 0.0944 0.0888 0.0874 0.0870
Total District rates 0.3170 0.4270 0.4500 0.4960 0.4450 0.4550 0.4578 0.4194 0.4163 0.4110
Lake County 0.4530 0.4640 0.5540 0.6080 0.6630 0.6830 0.6630 0.6320 0.6220 0.6120 Village of Vernon Hills - - - - - - - - - - Village of Mundelein 1.1430 1.1790 1.3440 N/A N/A N/A 1.5710 1.5630 1.5590 1.4194 Lake County Forest Preserve District 0.1990 0.2000 0.2010 0.2120 0.2190 0.2100 0.2080 0.1930 0.1870 0.1820 Libertyville Township 0.1040 0.1060 0.1110 0.1220 0.1310 0.1340 0.1310 0.1240 0.1220 0.1220 Vernon Township 0.0490 0.0540 0.0570 0.0600 0.0650 0.0663 0.0644 0.0611 0.0564 N/ACentral Lake County JAWA 0.0420 0.0420 0.0470 0.0520 0.0550 0.0560 0.0540 0.0460 0.0410 - Countryside Fire Protection District 0.4170 0.4210 0.4950 0.5520 0.5970 0.6130 0.5990 0.5670 0.5620 0.5640 Lincolnshire-Riverwoods 0.5290 0.5520 0.6620 N/A N/A N/A 0.7480 0.7470 0.7470 0.7511 Cook County Memorial Library District 0.2220 0.2230 0.2540 0.2820 0.3030 0.3120 0.3040 0.2890 0.2840 0.2840 Vernon Area Library District 0.2220 0.2260 0.2610 N/A N/A N/A 0.3080 0.2930 0.2910 0.2939 School District No. 73 2.8780 2.8990 3.3060 3.6780 3.9970 4.1180 4.0330 3.8710 3.8250 3.8470 School District No. 76 3.3780 3.3620 3.3370 N/A N/A N/A 4.8710 4.6800 4.5670 4.5799 School District No. 96 2.8690 2.9160 3.4530 N/A N/A N/A 3.8700 3.6900 3.6550 3.7166 School District No. 103 2.2000 2.2010 2.5580 N/A N/A N/A 3.0240 2.8770 2.8700 2.8884 High School District No. 120 1.7350 1.7630 2.1650 N/A N/A N/A 2.7710 2.6200 2.5520 2.5431 High School District No. 125 2.1390 2.1850 2.4650 N/A N/A N/A 3.0040 2.8580 2.8620 2.5021 High School District No. 128 2.1630 2.1790 2.3990 2.5800 2.9190 2.6870 2.7320 2.5320 2.4940 2.5020 Community College District No. 532 0.1960 0.2000 0.2400 0.2720 0.2960 0.3060 0.2990 0.2850 0.2810 0.2820
TOTAL TAX RATES (2) 21.2550 21.5990 24.3590 8.9140 9.6900 9.6403 29.7122 28.3475 27.9937 27.5005
N/A - Information not available
Note: (1) Source Lake County Clerk (2) Representative tax rate is for Libertyville Township Tax Code 11-012, which represents the largest portion of the District's total 2018 equalized assessed valuation.
PROPERTY TAX RATES - DIRECT AND OVERLAPPING GOVERNMENTS
VERNON HILLS PARK DISTRICTVERNON HILLS, ILLINOIS
Last Ten Levy Years
(Lake County)Per $100 Equalized Assessed Valuation
- 72 -

Levy Year 2009 2010 2011 2012
PROPERTY CLASSRural 60,953$ 54,888$ 55,976$ 56,163$ Residential 928,732,268 889,806,030 832,609,911 761,856,115 Commercial 360,694,657 355,138,718 347,132,737 333,862,936 Industrial 544,172 551,337 555,771 561,152 Railroad 304,446 362,702 336,210 219,342
TOTAL 1,290,336,496$ 1,245,913,675$ 1,180,690,605$ 1,096,555,708$
Data Source
Lake County Clerk
VERNON HILLS PARK DISTRICTVERNON HILLS, ILLINOIS
PROPERTY ASSESSMENT AND TAX INFORMATION
Last Ten Levy Years
- 73 -

2013 2014 2015 2016 2017 2018
56,052$ 57,466$ 58,324$ 62,900$ 67,161$ 557,920$ 710,262,453 708,727,808 746,990,442 800,235,469 835,451,312 852,228,758 326,600,515 324,568,601 331,139,226 352,785,757 361,918,122 374,095,282
594,926 589,810 597,831 630,956 665,469 687,163 226,629 265,381 320,043 353,554 292,024 307,462
1,037,740,575$ 1,034,209,066$ 1,079,105,866$ 1,154,068,636$ 1,198,394,088$ 1,227,876,585$
- 74 -

VERNON HILLS PARK DISTRICTVERNON HILLS, ILLINOIS
PROPERTY TAX LEVIES AND COLLECTIONS
Last Ten Levy Years
Collections
Levy Percentage in Subsequent PercentageYear Tax Levied Amount of Levy Years Amount of Levy
2009 4,090,366$ 4,087,126$ 99.92% N/A 4,087,126$ 99.92%
2010 5,320,051 5,317,834 99.96% N/A 5,317,834 99.96%
2011 5,313,108 5,311,167 99.96% N/A 5,311,167 99.96%
2012 5,439,016 5,422,698 99.70% N/A 5,422,698 99.70%
2013 4,617,946 4,573,440 99.04% N/A 4,573,440 99.04%
2014 4,705,196 4,691,273 99.70% N/A 4,691,273 99.70%
2015 4,939,790 108,805 2.20% 4,815,008 4,923,813 99.68%
2016 4,840,637 135,396 2.80% 4,700,872 4,836,268 99.91%
2017 4,987,201 543,166 10.89% 4,985,481 5,528,647 110.86%
2018 5,046,118 - 0.00% - - 0.00%
N/A - Information not available
Data Sources
Office of the County Clerk
Collected within theFiscal Year of the Levy Total Collections to Date
- 75 -

RATIOS OF OUTSTANDING DEBT BY TYPE
Last Ten Fiscal Years
Governmental Activities PercentageFiscal General Alternate Installment Financing Total Percentage of Year Obligation Revenue Debt Contract/Lease Other Primary of Personal Per
Ended Bonds Bonds Certificates Payable Governments Government EAV Income Capita
2010 6,235,000$ -$ -$ -$ -$ 6,235,000$ 0.48% 0.67% 266.99$ 2011 5,520,000 - - - - 5,520,000 0.44% 0.58% 236.37 2012 3,720,000 - - - - 3,720,000 0.32% 0.39% 147.55 2013 1,880,000 - - - - 1,880,000 0.17% 0.17% 73.21 2014 4,977,285 - - 990,660 - 5,967,945 0.58% 0.55% 233.00 2015 4,580,660 - - 853,812 - 5,434,472 0.53% 0.49% 209.74 2016 4,167,880 - - 840,306 - 5,008,186 0.46% 0.44% 190.32 2017 9,861,018 - - 840,306 - 10,701,324 0.93% 0.95% 406.68 2018 9,433,462 - - 840,306 - 10,273,768 0.84% 0.88% 391.34 2019 8,993,691 - - 840,306 - 9,833,997 0.80% N/A 369.13
N/A - Information not available
VERNON HILLS PARK DISTRICTVERNON HILLS, ILLINOIS
- 76 -

VERNON HILLS PARK DISTRICTVERNON HILLS, ILLINOIS
RATIOS OF GENERAL BONDED DEBT OUTSTANDING
Last Ten Fiscal Years
Percentage ofLess: Amounts Estimated
General Available Actual TaxableFiscal Obligation In Debt Value of PerYear Bonds Service Fund Total Property Capita
2010 6,235,000$ 388,249$ 5,846,751$ 0.45% 250.36$ 2011 5,520,000 301,011 5,218,989 0.42% 223.48 2012 3,720,000 333,676 3,386,324 0.29% 134.32 2013 1,880,000 353,114 1,526,886 0.14% 59.46 2014 4,977,285 277,736 4,699,549 0.45% 183.48 2015 4,580,660 313,882 4,266,778 0.41% 164.67 2016 4,167,880 313,349 3,854,531 0.36% 146.48 2017 9,861,018 345,555 9,515,463 0.82% 361.61 2018 9,433,462 348,317 9,085,145 0.76% 346.06 2019 8,993,691 336,502 8,657,189 0.71% 324.96
Data Source
Audited Financial Statements
- 77 -

OutstandingDebt Percent (2) Amount
VERNON HILLS PARK DISTRICT 9,833,997$ 100.00% 9,833,997$
OVERLAPPING DEBTLake County 174,530,000 4.62% 8,063,286 Lake County Forest Preserve 240,155,000 4.62% 11,095,161 Village of Vernon Hills 37,749,236 99.92% 37,719,037 Unit School District #73 49,800,529 67.57% 33,650,217 Unit School District #76 11,423,171 26.94% 3,077,402 Unit School District #103 5,740,000 19.33% 1,109,542 High School District #120 14,649,155 1.03% 150,886 High School District #125 44,745,000 8.89% 3,977,831 Community College District #532 58,465,000 4.86% 2,841,399 Countryside Fire Protection District 2,840,000 61.71% 1,752,564
TOTAL OVERLAPPING BONDED DEBT 103,437,325$
TOTAL DIRECT AND OVERLAPPING DEBT 113,271,322$
Data Sources
(1) Source: Lake County Clerk's Office
VERNON HILLS PARK DISTRICTVERNON HILLS, ILLINOIS
(2) Lake County Department of Revenue
Applicable to District
DETAILED OVERLAPPING BONDED DEBT(1)
May 31, 2019
- 78 -

Levy Year 2010 2011 2012 20136
EQUALIZED ASSESSED VALUATION 1,290,336,496$ 1,245,913,675$ 1,180,690,605$ 1,096,575,508$
Statutory Debt Limitation:With Referendum - 2.875% of assessed valuation 37,097,174$ 35,820,018$ 33,944,855$ 31,526,546$
DEBT OUTSTANDING APPLICABLE TO LIMITGeneral Bonded Debt 6,235,000 5,520,000 3,720,000 1,880,000
Total general bonded debt 6,235,000 5,520,000 3,720,000 1,880,000
LEGAL DEBT MARGIN 30,862,174$ 30,300,018$ 30,224,855$ 29,646,546$
Data Source
District Records
VERNON HILLS PARK DISTRICTVERNON HILLS, ILLINOIS
LEGAL DEBT MARGIN INFORMATION
Last Ten Levy Years
- 79 -

2014 2015 2016 2017 2018 2019
1,037,740,575$ 1,034,209,066$ 1,079,105,866$ 1,154,068,636$ 1,198,394,088$ 1,227,876,585$
29,835,042$ 29,733,511$ 31,024,294$ 33,179,473$ 34,453,830$ 35,301,452$
4,977,285 4,580,660 4,167,880 9,861,018 9,433,462 8,896,385
4,977,285 4,580,660 4,167,880 9,861,018 9,433,462 8,896,385
24,857,757$ 25,152,851$ 26,856,414$ 23,318,455$ 25,020,368$ 26,405,067$
- 80 -

VERNON HILLS PARK DISTRICTVERNON HILLS, ILLINOIS
DEMOGRAPHIC AND ECONOMIC INFORMATION
Last Ten Fiscal Years
Personal PerIncome Capita
Fiscal (in thousands Personal UnemploymentYear Population of dollars) Income Rate
2010 23,353 928,822$ 39,773$ 7.40%2011 23,353 953,541 40,832 8.00%2012 25,211 953,541 37,822 7.10%2013 25,678 1,083,740 42,205 6.60%2014 25,613 1,089,679 42,544 5.00%2015 25,911 1,100,103 42,457 6.00%2016 26,314 1,127,450 42,846 4.40%2017 26,314 1,162,671 44,185 4.30%2018 26,253 1,239,299 47,206 3.30%2019 26,641 1,257,615 47,206 3.40%
N/A - Information not available
Data Sources
U.S. Census BureauIllinois Department of Employment Security
- 81 -

VERNON HILLS PARK DISTRICTVERNON HILLS, ILLINOIS
PRINCIPAL EMPLOYERS
Current Year and Nine Years Ago
% of % ofTotal Village Total City
Employer Rank Population Rank Population
Westfield Shoppingtown Hawthorn 1 9.38% 1 10.22%
Zebra Technologies Corp 2 3.38% 2 3.68%
American Hotel Register Co. 3 1.88% 3 1.64%
Mitsubishi Electric Automation, Inc. 4 1.50% 4 1.43%
CDW Cmputer Centers, Inc. 5 1.31% 4 1.43%
ZFAftermarket 5 1.31% 8 0.74%
Rust-Oleum Company 5 1.31% 8 0.74%
Mercer Human Resource Consulting 6 1.28%
Cole-Palmer Instrument Co. 7 1.13% 6 1.23%
Becton Dickinson 8 1.13%
Richard Wolf Medical Instruments Corp. 9 0.75% 7 0.82%
Experient, Inc. 10 0.65%
(NA) Information not available
Data Source
2019 Illinois Manufacturers Directory and Illinois Services Directory
20102019
- 82 -

Function/Program 2010 2011 2012 2013 2014 2015 2016 2017 2018 2019
Full-time employees 27 27 27 42 44 46 50 50 50 50
TOTAL 27 27 27 42 44 46 50 50 50 50
Data Source
District Records
Last Ten Fiscal Years
FULL-TIME EMPLOYEES
VERNON HILLS, ILLINOISVERNON HILLS PARK DISTRICT
- 83 -

Fiscal Year 2010 2011 2012 2013 2014 2015 2016 2017 2018 2019
Population 23,353 23,353 25,211 25,678 25,911 25,911 26,314 26,314 26,253 26,641
PARKS AND FACILITIESParks
Number 23 23 23 23 23 23 23 23 23 23 Acres 444.0 444.0 444.0 453.0 453.0 453.0 453.0 453.0 453.0 453.0
Baseball/Softball Fields 19 19 19 19 19 19 19 19 19 19 Basketball Courts 6 7 7 7 7 7 7 7 7 7 Bike Trails 9 12 12 12 12 12 12 12 12 12 Boat Launches 2 2 2 2 2 2 2 2 2 2 Community Centers 2 2 2 2 2 2 2 2 2 2 Fitness Centers - - - 1 1 1 1 1 1 1 Lakes/Ponds 7 7 7 7 7 7 7 7 7 7 Neighborhood Center 2 2 2 1 1 1 1 1 1 1 Outdoor Skating Rinks 1 2 4 1 1 1 4 4 4 4 Picnic Shelters 30 32 32 32 32 32 32 32 32 32 Playgrounds 24 25 24 24 24 24 24 24 24 24 Skate Parks 1 1 1 1 1 1 1 1 1 1 Sled Hills 1 1 1 1 1 1 1 1 1 1 Soccer Fields 4 5 5 5 5 5 5 5 5 5 Swimming Pools 1 1 1 2 2 2 2 2 2 2 Tennis Courts 12 12 12 12 12 12 12 12 12 12 Volleyball Courts 5 8 6 6 6 6 6 6 6 6
Data Source
District Records
Last Ten Fiscal Years
OPERATING INDICATORS
VERNON HILLS PARK DISTRICTVERNON HILLS, ILLINOIS
- 84 -

Address Acres
Aspen Backyard Park 6 North Aspen Drive 0.70 Augusta Park 210 Augusta Drive 2.30 Beaver Creek Park 2087 Beaver Creek Drive 1.00 Carriage Green Park 540 Grosse Point Circle 8.00 Central Park 520 Central Park Place 2.00 Century Park 1001 Lakeview Parkway 130.00 Deerpath Center 8 Greenvale Road N/ADeerpath Park 299 Onwentsia Road 69.00 Kelli Garvanian Park 215 S. Deerpath Drive 6.00 Donnelley Park 359 Donnelley Road 2.00 Grosse Point Park 900 Grosse Pointe Boulevard 38.00 Hartmann Park/Pavilion 292 Oakwood Road 9.90 Hawthorn Club Park 160 Sheffield Drive 10.00 Hawthorn Mellody Park 2221 Hazeltime Drive 16.00 Kiddie Korral Park 300 Greenbriar Lane 0.40 Lake Charles Park 11 E. Greggs Parkway 69.00 Lakeview Fitness Center 700 Lakeview Parkway 9.00 Laschen Community Center 294 Evergreen Drive N/ACynthia Peterson Park 200 Hawthorn Parkway 16.30 Park Maintenance Facility 7 Phillip Road N/ARanney park 137 Ranney Avenue 1.60 Royal Oak Park 70 Royal Oak Drive 1.30 Stone Fence Farm Park 224 Stone Fence Road 3.70 Sugar Creek Park 1081 Creek View Drive 13.00 Sullivan Community Center 635 North Aspen Drive 12.00 Sullivan Woods Sugar Creek and Hawthorn Clubs Parks 28.00 Torrey Pines Park 520 Torrey Pines Way 4.80 Westwood Park 300 Sullivan Drive 0.50
Data Source
District Records
VERNON HILLS PARK DISTRICTVERNON HILLS, ILLINOIS
CAPITAL ASSET STATISTICS
May 31, 2019
Park
- 85 -