Embed Size (px)
Citation preview
VermontAdult-useDemand,Sales,andTaxRevenueAnalysis
Therevenue-generatingpotentialofcommercialcannabisintheGreenMountainState
Andrew Livingston
Director of Economics & Research Vicente Sederberg LLP Published August 2020
Contributions to local tax revenue case studies from others at Vicente Sederberg:
Tim Callahan Jonathan Cherkoss
Emily Hackman Genevieve Meehan Rebecca Rutenberg
Tucker Wentz
2
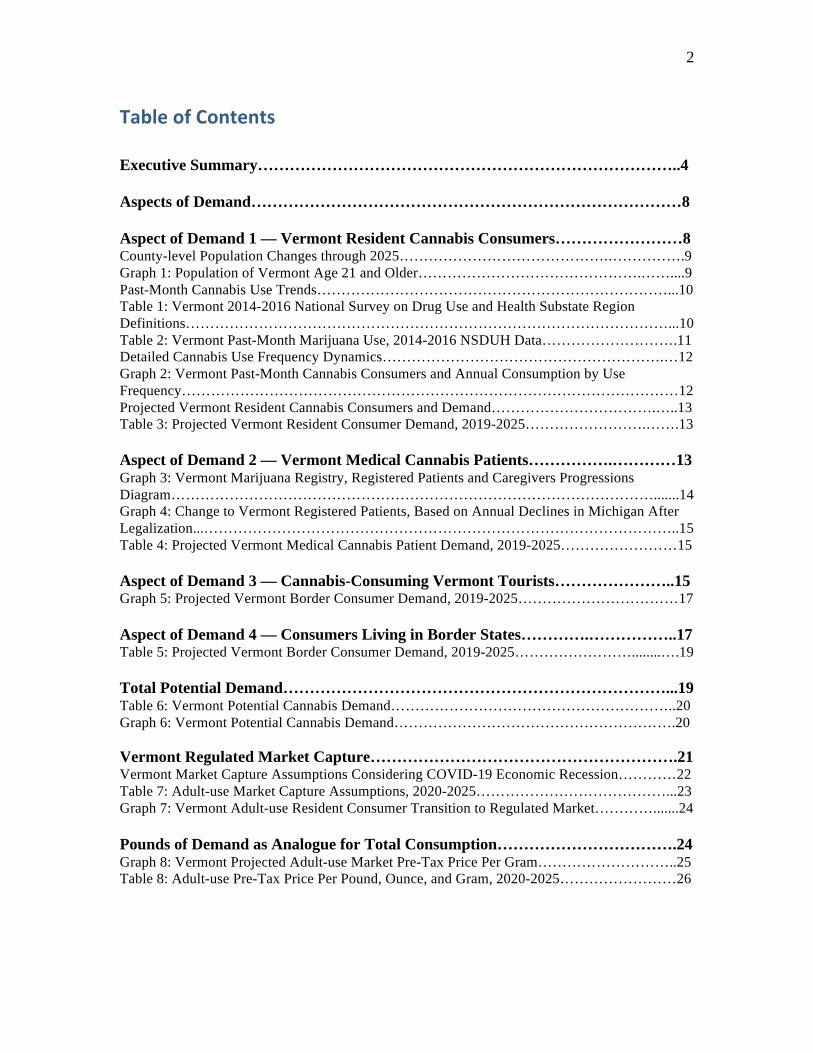
TableofContentsExecutive Summary……………………………………………………………………..4 Aspects of Demand………………………………………………………………………8 Aspect of Demand 1 — Vermont Resident Cannabis Consumers……………………8 County-level Population Changes through 2025…………………………………….…………….9 Graph 1: Population of Vermont Age 21 and Older……………………………………….……....9 Past-Month Cannabis Use Trends………………………………………………………………...10 Table 1: Vermont 2014-2016 National Survey on Drug Use and Health Substate Region Definitions………………………………………………………………………………………...10 Table 2: Vermont Past-Month Marijuana Use, 2014-2016 NSDUH Data……………………….11 Detailed Cannabis Use Frequency Dynamics………………………………………………….…12 Graph 2: Vermont Past-Month Cannabis Consumers and Annual Consumption by Use Frequency…………………………………………………………………………………………12 Projected Vermont Resident Cannabis Consumers and Demand…………………………….…..13 Table 3: Projected Vermont Resident Consumer Demand, 2019-2025…………………….…….13 Aspect of Demand 2 — Vermont Medical Cannabis Patients…………….…………13 Graph 3: Vermont Marijuana Registry, Registered Patients and Caregivers Progressions Diagram……………………………………………………………………………………….......14 Graph 4: Change to Vermont Registered Patients, Based on Annual Declines in Michigan After Legalization...……………………………………………………………………………………..15Table 4: Projected Vermont Medical Cannabis Patient Demand, 2019-2025……………………15 Aspect of Demand 3 — Cannabis-Consuming Vermont Tourists…………………..15 Graph 5: Projected Vermont Border Consumer Demand, 2019-2025……………………………17 Aspect of Demand 4 — Consumers Living in Border States………….……………..17 Table 5: Projected Vermont Border Consumer Demand, 2019-2025……………………........….19 Total Potential Demand………………………………………………………………...19 Table 6: Vermont Potential Cannabis Demand…………………………………………………..20 Graph 6: Vermont Potential Cannabis Demand………………………………………………….20 Vermont Regulated Market Capture………………………………………………….21 Vermont Market Capture Assumptions Considering COVID-19 Economic Recession…………22 Table 7: Adult-use Market Capture Assumptions, 2020-2025…………………………………...23 Graph 7: Vermont Adult-use Resident Consumer Transition to Regulated Market………….......24 Pounds of Demand as Analogue for Total Consumption…………………………….24 Graph 8: Vermont Projected Adult-use Market Pre-Tax Price Per Gram………………………..25 Table 8: Adult-use Pre-Tax Price Per Pound, Ounce, and Gram, 2020-2025……………………26
3
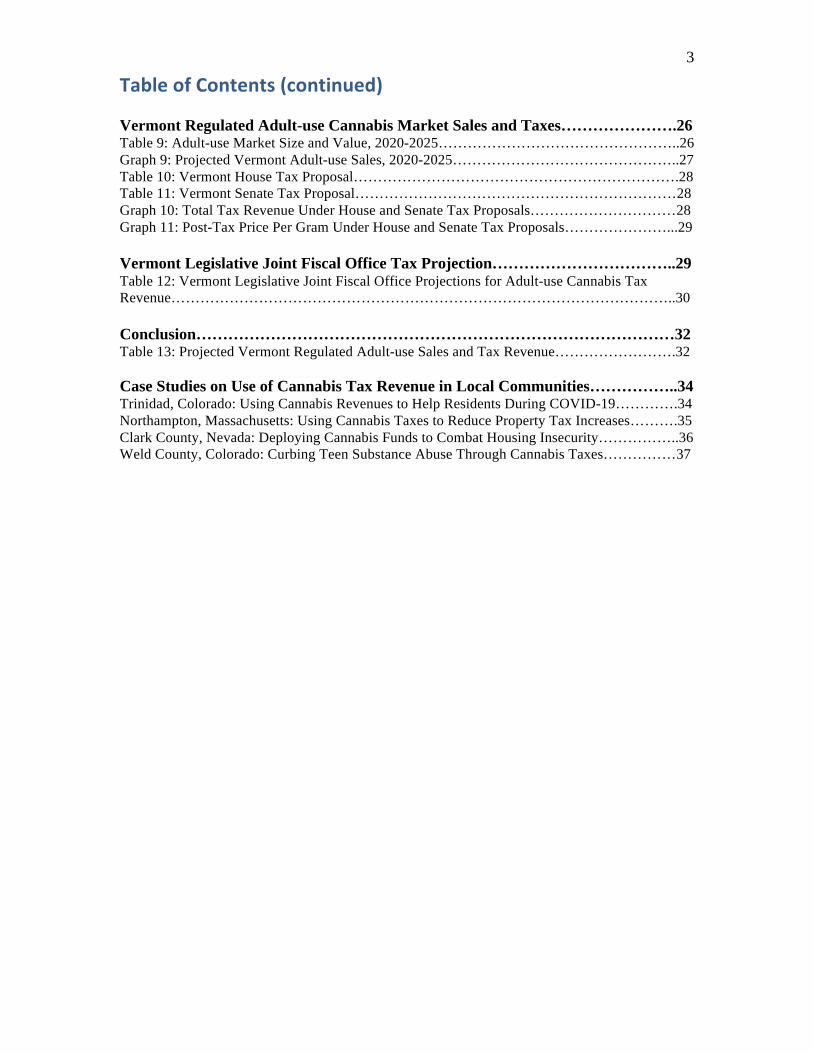
TableofContents(continued) Vermont Regulated Adult-use Cannabis Market Sales and Taxes………………….26 Table 9: Adult-use Market Size and Value, 2020-2025…………………………………………..26 Graph 9: Projected Vermont Adult-use Sales, 2020-2025………………………………………..27 Table 10: Vermont House Tax Proposal………………………………………………………….28 Table 11: Vermont Senate Tax Proposal…………………………………………………………28 Graph 10: Total Tax Revenue Under House and Senate Tax Proposals…………………………28 Graph 11: Post-Tax Price Per Gram Under House and Senate Tax Proposals…………………...29 Vermont Legislative Joint Fiscal Office Tax Projection……………………………..29 Table 12: Vermont Legislative Joint Fiscal Office Projections for Adult-use Cannabis Tax Revenue…………………………………………………………………………………………..30 Conclusion………………………………………………………………………………32 Table 13: Projected Vermont Regulated Adult-use Sales and Tax Revenue…………………….32 Case Studies on Use of Cannabis Tax Revenue in Local Communities……………..34 Trinidad, Colorado: Using Cannabis Revenues to Help Residents During COVID-19………….34 Northampton, Massachusetts: Using Cannabis Taxes to Reduce Property Tax Increases……….35 Clark County, Nevada: Deploying Cannabis Funds to Combat Housing Insecurity……………..36 Weld County, Colorado: Curbing Teen Substance Abuse Through Cannabis Taxes……………37
4
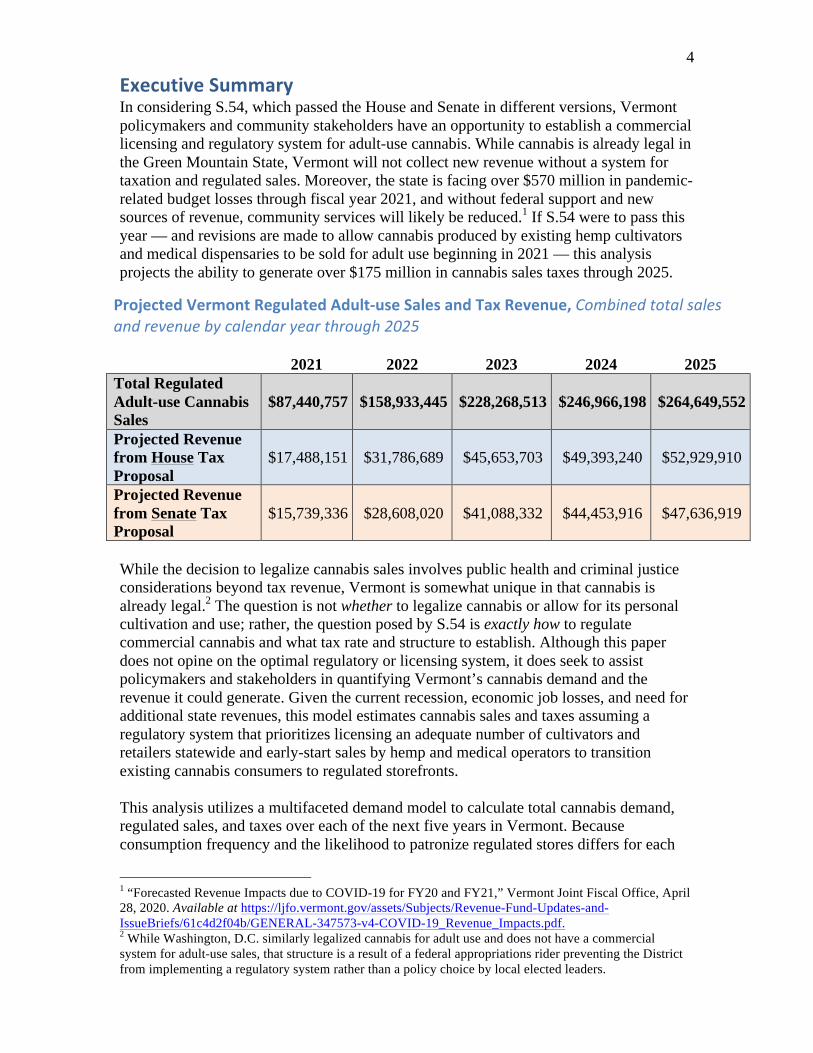
ExecutiveSummaryIn considering S.54, which passed the House and Senate in different versions, Vermont policymakers and community stakeholders have an opportunity to establish a commercial licensing and regulatory system for adult-use cannabis. While cannabis is already legal in the Green Mountain State, Vermont will not collect new revenue without a system for taxation and regulated sales. Moreover, the state is facing over $570 million in pandemic-related budget losses through fiscal year 2021, and without federal support and new sources of revenue, community services will likely be reduced.1 If S.54 were to pass this year — and revisions are made to allow cannabis produced by existing hemp cultivators and medical dispensaries to be sold for adult use beginning in 2021 — this analysis projects the ability to generate over $175 million in cannabis sales taxes through 2025.
ProjectedVermontRegulatedAdult-useSalesandTaxRevenue,Combinedtotalsalesandrevenuebycalendaryearthrough2025
2021 2022 2023 2024 2025 Total Regulated Adult-use Cannabis Sales
$87,440,757 $158,933,445 $228,268,513 $246,966,198 $264,649,552
Projected Revenue from House Tax Proposal
$17,488,151 $31,786,689 $45,653,703 $49,393,240 $52,929,910
Projected Revenue from Senate Tax Proposal
$15,739,336 $28,608,020 $41,088,332 $44,453,916 $47,636,919
While the decision to legalize cannabis sales involves public health and criminal justice considerations beyond tax revenue, Vermont is somewhat unique in that cannabis is already legal.2 The question is not whether to legalize cannabis or allow for its personal cultivation and use; rather, the question posed by S.54 is exactly how to regulate commercial cannabis and what tax rate and structure to establish. Although this paper does not opine on the optimal regulatory or licensing system, it does seek to assist policymakers and stakeholders in quantifying Vermont’s cannabis demand and the revenue it could generate. Given the current recession, economic job losses, and need for additional state revenues, this model estimates cannabis sales and taxes assuming a regulatory system that prioritizes licensing an adequate number of cultivators and retailers statewide and early-start sales by hemp and medical operators to transition existing cannabis consumers to regulated storefronts. This analysis utilizes a multifaceted demand model to calculate total cannabis demand, regulated sales, and taxes over each of the next five years in Vermont. Because consumption frequency and the likelihood to patronize regulated stores differs for each
1 “Forecasted Revenue Impacts due to COVID-19 for FY20 and FY21,” Vermont Joint Fiscal Office, April 28, 2020. Available at https://ljfo.vermont.gov/assets/Subjects/Revenue-Fund-Updates-and-IssueBriefs/61c4d2f04b/GENERAL-347573-v4-COVID-19_Revenue_Impacts.pdf. 2 While Washington, D.C. similarly legalized cannabis for adult use and does not have a commercial system for adult-use sales, that structure is a result of a federal appropriations rider preventing the District from implementing a regulatory system rather than a policy choice by local elected leaders.
5 cannabis consumer group, each cohort is assessed independently. In total, this analysis considers Vermont resident cannabis consumers, Vermont medical cannabis patients, cannabis-consuming Vermont tourists, and consumers living in border states. Demand from medical cannabis patients is subtracted from resident consumer demand as this analysis only considers potential sales and revenue from a regulated adult-use market. To calculate cannabis consumer demand and sales, the report incorporates data from multiple governmental and peer reviewed sources including:
• County-level population and age data from the U.S. Census Bureau’s American Community Survey;
• Past-month cannabis consumption statistics and intra-past-month use frequency data from the National Survey on Drug Use and Health (NSDUH);
• Cannabis use underreporting estimates from the RAND Drug Policy Research Center;
• Peer-reviewed research on consumption volume per use day published in the International Journal of Drug Policy;
• Patient information from the Vermont Department of Public Safety Marijuana Registry;
• Benchmark reports from the Vermont Department of Tourism and Marketing; • Tourist usage data from the 2017 “Market Size and Demand for Marijuana in
Colorado,” prepared for the Colorado Department of Revenue; • Regulated market capture estimates in other states from MPG Consulting, RAND
Drug Policy Research Center, and The Boston Globe; and • Peer-reviewed behavioral economic research on consumer substitution between
legal and illegal cannabis published in Addiction.
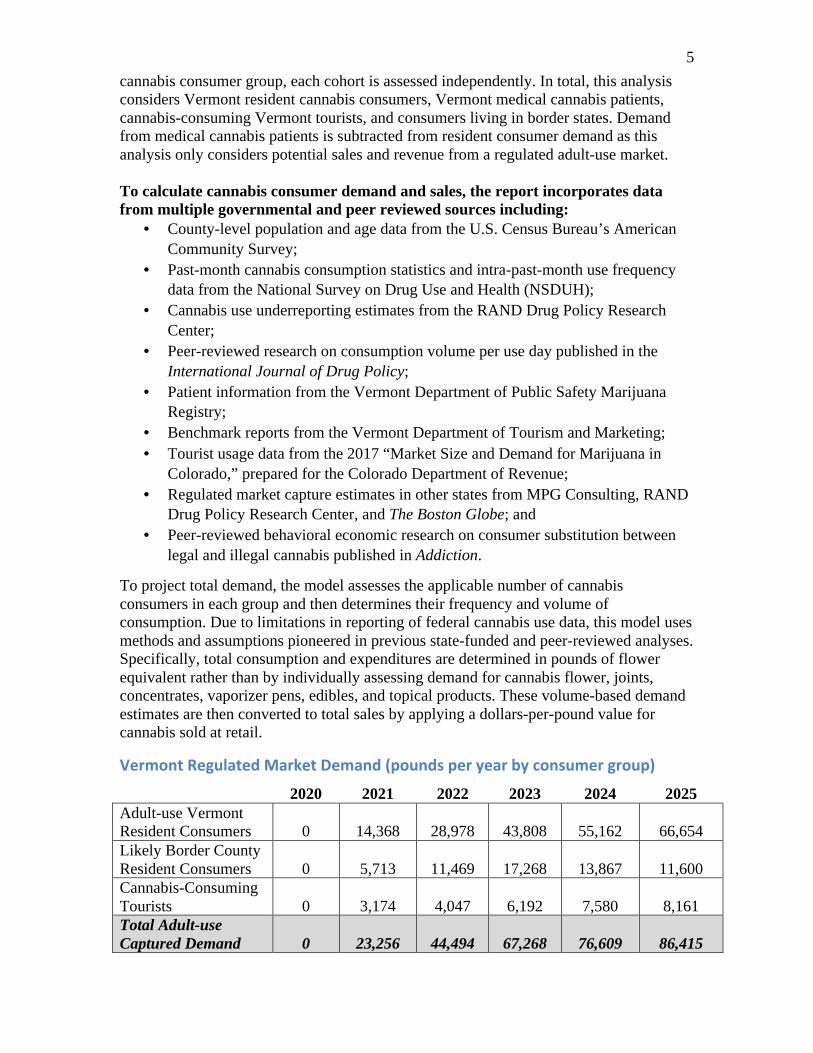
To project total demand, the model assesses the applicable number of cannabis consumers in each group and then determines their frequency and volume of consumption. Due to limitations in reporting of federal cannabis use data, this model uses methods and assumptions pioneered in previous state-funded and peer-reviewed analyses. Specifically, total consumption and expenditures are determined in pounds of flower equivalent rather than by individually assessing demand for cannabis flower, joints, concentrates, vaporizer pens, edibles, and topical products. These volume-based demand estimates are then converted to total sales by applying a dollars-per-pound value for cannabis sold at retail.
VermontRegulatedMarketDemand(poundsperyearbyconsumergroup)
2020 2021 2022 2023 2024 2025
Adult-use Vermont Resident Consumers 0 14,368 28,978 43,808 55,162 66,654 Likely Border County Resident Consumers 0 5,713 11,469 17,268 13,867 11,600 Cannabis-Consuming Tourists 0 3,174 4,047 6,192 7,580 8,161 Total Adult-use Captured Demand 0 23,256 44,494 67,268 76,609 86,415
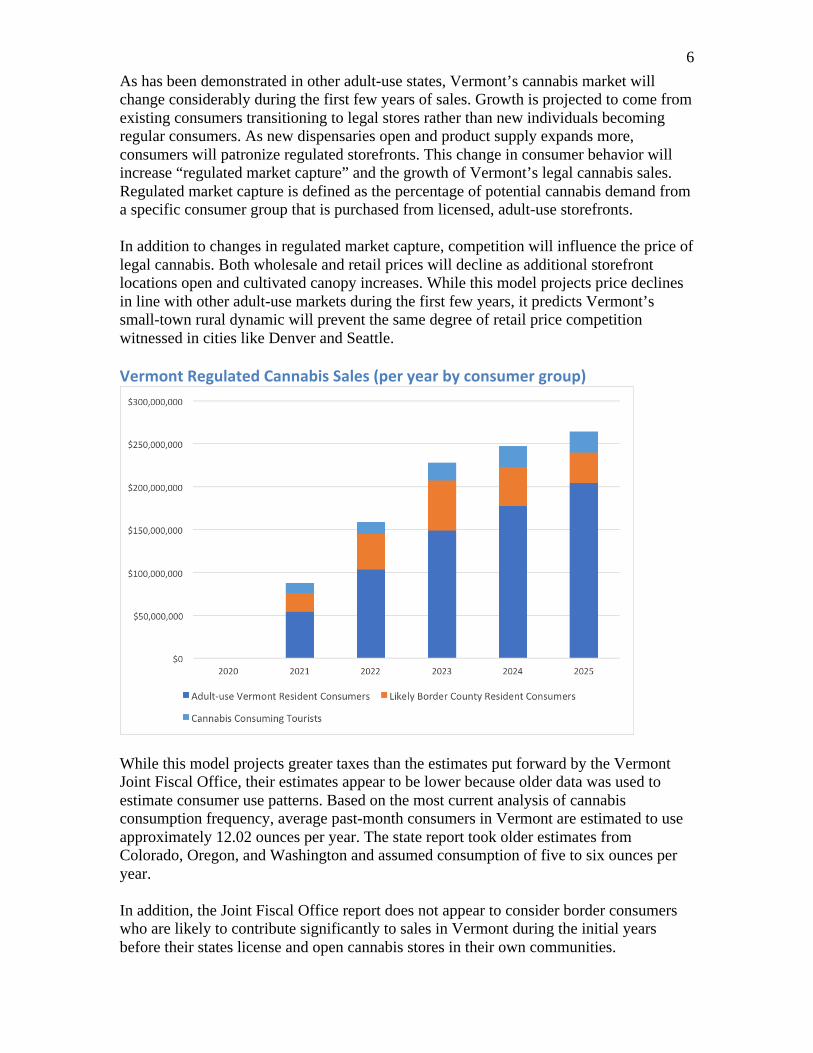
6 As has been demonstrated in other adult-use states, Vermont’s cannabis market will change considerably during the first few years of sales. Growth is projected to come from existing consumers transitioning to legal stores rather than new individuals becoming regular consumers. As new dispensaries open and product supply expands more, consumers will patronize regulated storefronts. This change in consumer behavior will increase “regulated market capture” and the growth of Vermont’s legal cannabis sales. Regulated market capture is defined as the percentage of potential cannabis demand from a specific consumer group that is purchased from licensed, adult-use storefronts. In addition to changes in regulated market capture, competition will influence the price of legal cannabis. Both wholesale and retail prices will decline as additional storefront locations open and cultivated canopy increases. While this model projects price declines in line with other adult-use markets during the first few years, it predicts Vermont’s small-town rural dynamic will prevent the same degree of retail price competition witnessed in cities like Denver and Seattle. VermontRegulatedCannabisSales(peryearbyconsumergroup)
While this model projects greater taxes than the estimates put forward by the Vermont Joint Fiscal Office, their estimates appear to be lower because older data was used to estimate consumer use patterns. Based on the most current analysis of cannabis consumption frequency, average past-month consumers in Vermont are estimated to use approximately 12.02 ounces per year. The state report took older estimates from Colorado, Oregon, and Washington and assumed consumption of five to six ounces per year. In addition, the Joint Fiscal Office report does not appear to consider border consumers who are likely to contribute significantly to sales in Vermont during the initial years before their states license and open cannabis stores in their own communities.
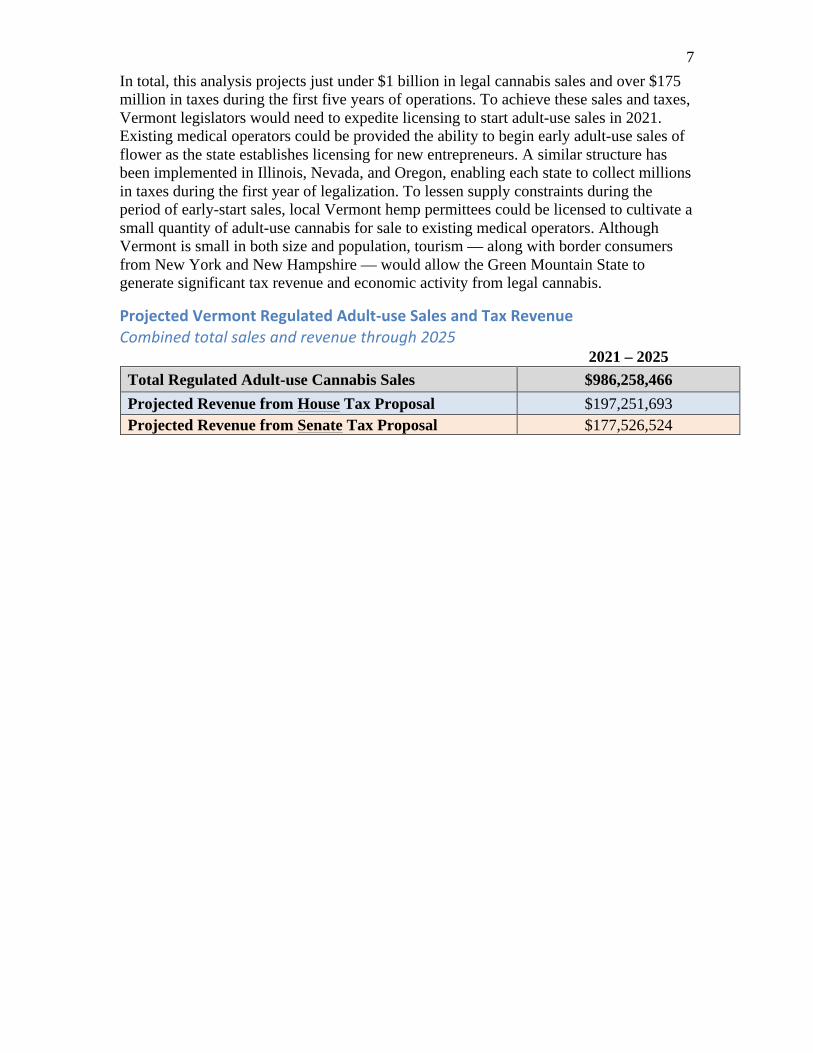
7 In total, this analysis projects just under $1 billion in legal cannabis sales and over $175 million in taxes during the first five years of operations. To achieve these sales and taxes, Vermont legislators would need to expedite licensing to start adult-use sales in 2021. Existing medical operators could be provided the ability to begin early adult-use sales of flower as the state establishes licensing for new entrepreneurs. A similar structure has been implemented in Illinois, Nevada, and Oregon, enabling each state to collect millions in taxes during the first year of legalization. To lessen supply constraints during the period of early-start sales, local Vermont hemp permittees could be licensed to cultivate a small quantity of adult-use cannabis for sale to existing medical operators. Although Vermont is small in both size and population, tourism — along with border consumers from New York and New Hampshire — would allow the Green Mountain State to generate significant tax revenue and economic activity from legal cannabis.
ProjectedVermontRegulatedAdult-useSalesandTaxRevenueCombinedtotalsalesandrevenuethrough2025 2021 – 2025 Total Regulated Adult-use Cannabis Sales $986,258,466 Projected Revenue from House Tax Proposal $197,251,693
Projected Revenue from Senate Tax Proposal $177,526,524
8
AspectsofDemandAccurately projecting the size of Vermont’s future adult-use cannabis market requires a thorough assessment of the different components that comprise regulated storefront demand. Customers that patronize licensed storefronts can be classified into four primary groups.
(1) Cannabis consumers 21 years of age or older who live in Vermont. (2) Medical cannabis patients registered with the state. This analysis assumes
Vermont patients will continue purchasing from regulated dispensaries. Still, the number of registered patients is needed to determine the population of non-patient adult-use consumers.
(3) Tourists to Vermont who consume cannabis and will purchase from storefronts while they are visiting the state.
(4) Consumers living in border states that have not yet legalized who travel to Vermont for the purpose of purchasing regulated cannabis.
Each of these populations will interact with the adult-use market in Vermont in different ways. In this model, the likelihood that each group will purchase from licensed adult-use cannabis storefronts is called regulated market capture. A regulated marketplace with licensed storefronts provides several significant benefits to cannabis consumers. Laboratory-tested edibles, concentrates, and topicals with certified labels increase safety and bring consumers into the legal market. Storefronts offer a safe and well-lit place to purchase. But changes in consumer behavior do not happen immediately. New cultivators and retail stores must be licensed to ensure regulated supply can meet adult-use demand. Consumer groups will vary in their propensity to patronize storefronts, continue home cultivation, or purchase from local suppliers. For instance, tourists are less likely to know Vermont home growers and are thus projected to shop at regulated storefronts at higher rates than resident consumers. Border consumers may rush to visit a nearby regulated storefront when they first open for the wide array of product choices but generally live further from Vermont stores and are thus less likely to become regular shoppers. Once cannabis is legalized in their home state, they will likely no longer regularly patronize Vermont storefronts. Each of these different aspects of demand rely on specific data points and require their own unique models. These models and the results for each aspect of demand are detailed further in this analysis. When combined, these discrete projections create a holistic view of Vermont’s future adult-use cannabis market, annual sales, and estimated tax revenue for the Green Mountain State. AspectofDemand1–VermontResidentCannabisConsumers
County-levelPopulationChangesthrough2025As detailed above, each component of adult-use demand comes from a different population of consumers. To project purchasing behavior for each consumer group, this analysis first assesses the size of each population and its growth or contraction through
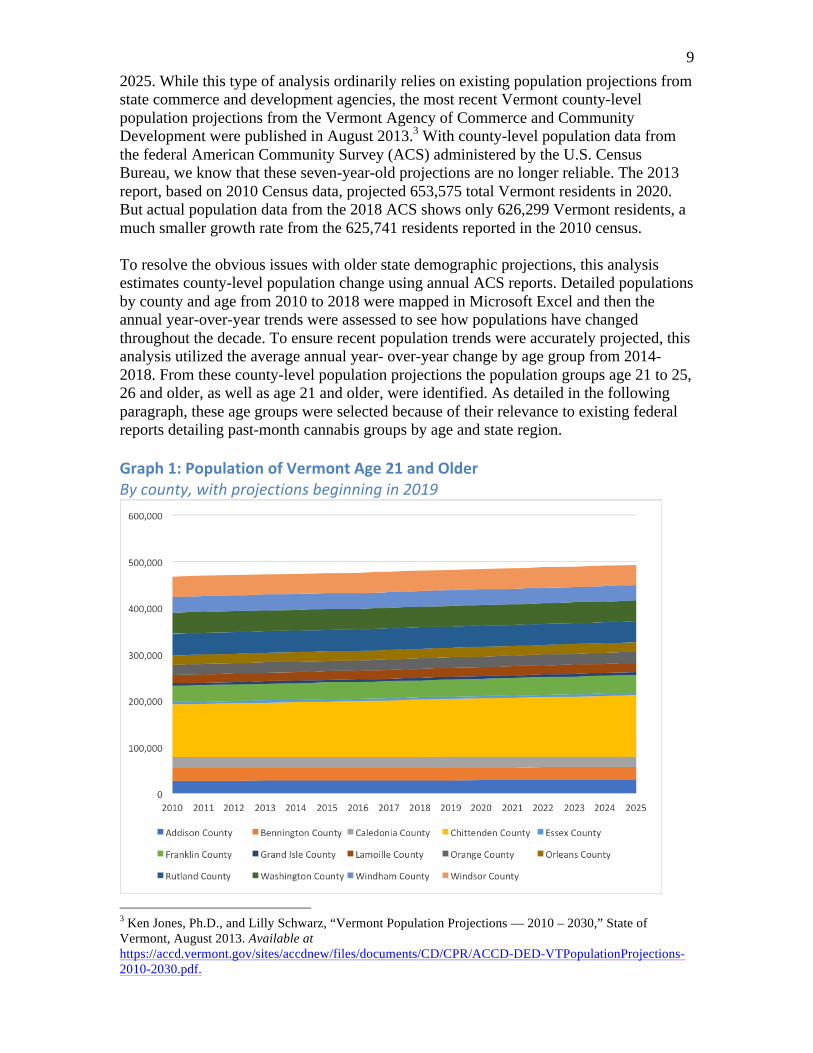
9 2025. While this type of analysis ordinarily relies on existing population projections from state commerce and development agencies, the most recent Vermont county-level population projections from the Vermont Agency of Commerce and Community Development were published in August 2013.3 With county-level population data from the federal American Community Survey (ACS) administered by the U.S. Census Bureau, we know that these seven-year-old projections are no longer reliable. The 2013 report, based on 2010 Census data, projected 653,575 total Vermont residents in 2020. But actual population data from the 2018 ACS shows only 626,299 Vermont residents, a much smaller growth rate from the 625,741 residents reported in the 2010 census. To resolve the obvious issues with older state demographic projections, this analysis estimates county-level population change using annual ACS reports. Detailed populations by county and age from 2010 to 2018 were mapped in Microsoft Excel and then the annual year-over-year trends were assessed to see how populations have changed throughout the decade. To ensure recent population trends were accurately projected, this analysis utilized the average annual year- over-year change by age group from 2014-2018. From these county-level population projections the population groups age 21 to 25, 26 and older, as well as age 21 and older, were identified. As detailed in the following paragraph, these age groups were selected because of their relevance to existing federal reports detailing past-month cannabis groups by age and state region. Graph1:PopulationofVermontAge21andOlderBycounty,withprojectionsbeginningin2019
3 Ken Jones, Ph.D., and Lilly Schwarz, “Vermont Population Projections — 2010 – 2030,” State of Vermont, August 2013. Available at https://accd.vermont.gov/sites/accdnew/files/documents/CD/CPR/ACCD-DED-VTPopulationProjections-2010-2030.pdf.
10
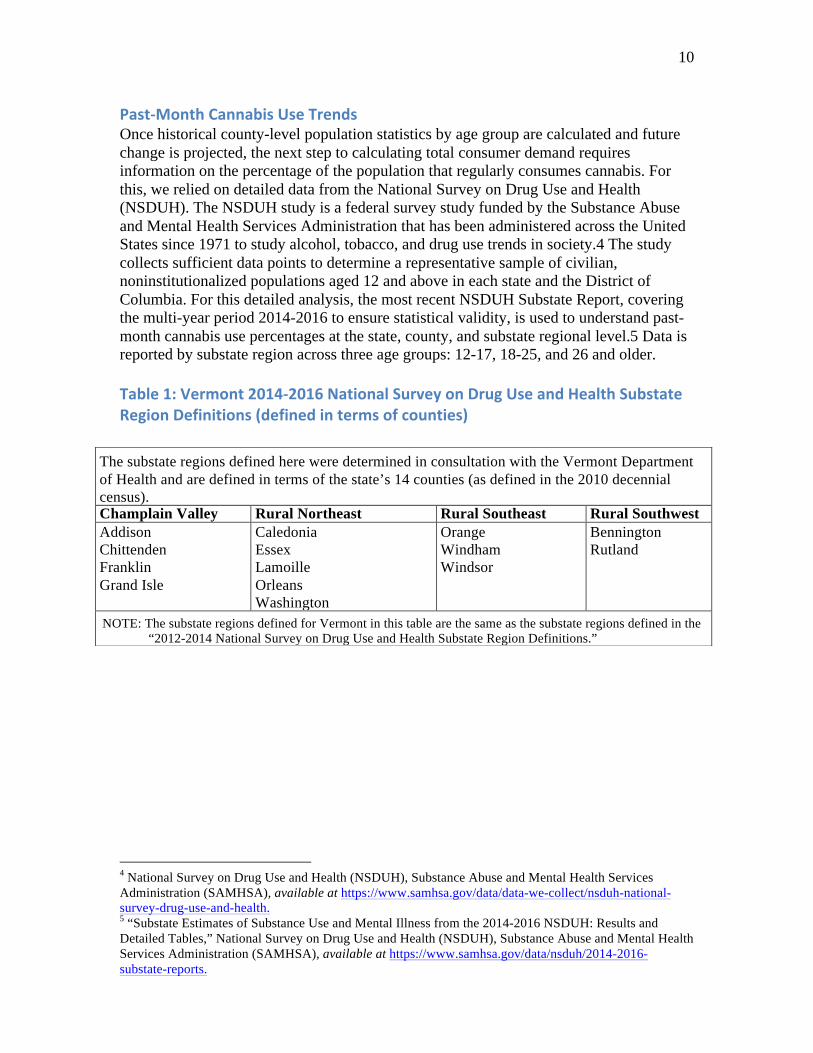
Past-MonthCannabisUseTrends Once historical county-level population statistics by age group are calculated and future change is projected, the next step to calculating total consumer demand requires information on the percentage of the population that regularly consumes cannabis. For this, we relied on detailed data from the National Survey on Drug Use and Health (NSDUH). The NSDUH study is a federal survey study funded by the Substance Abuse and Mental Health Services Administration that has been administered across the United States since 1971 to study alcohol, tobacco, and drug use trends in society.4 The study collects sufficient data points to determine a representative sample of civilian, noninstitutionalized populations aged 12 and above in each state and the District of Columbia. For this detailed analysis, the most recent NSDUH Substate Report, covering the multi-year period 2014-2016 to ensure statistical validity, is used to understand past-month cannabis use percentages at the state, county, and substate regional level.5 Data is reported by substate region across three age groups: 12-17, 18-25, and 26 and older. Table1:Vermont2014-2016NationalSurveyonDrugUseandHealthSubstateRegionDefinitions(definedintermsofcounties)
4 National Survey on Drug Use and Health (NSDUH), Substance Abuse and Mental Health Services Administration (SAMHSA), available at https://www.samhsa.gov/data/data-we-collect/nsduh-national-survey-drug-use-and-health. 5 “Substate Estimates of Substance Use and Mental Illness from the 2014-2016 NSDUH: Results and Detailed Tables,” National Survey on Drug Use and Health (NSDUH), Substance Abuse and Mental Health Services Administration (SAMHSA), available at https://www.samhsa.gov/data/nsduh/2014-2016-substate-reports.
The substate regions defined here were determined in consultation with the Vermont Department of Health and are defined in terms of the state’s 14 counties (as defined in the 2010 decennial census). Champlain Valley Rural Northeast Rural Southeast Rural Southwest Addison Chittenden Franklin Grand Isle
Caledonia Essex Lamoille Orleans Washington
Orange Windham Windsor
Bennington Rutland
NOTE: The substate regions defined for Vermont in this table are the same as the substate regions defined in the “2012-2014 National Survey on Drug Use and Health Substate Region Definitions.”
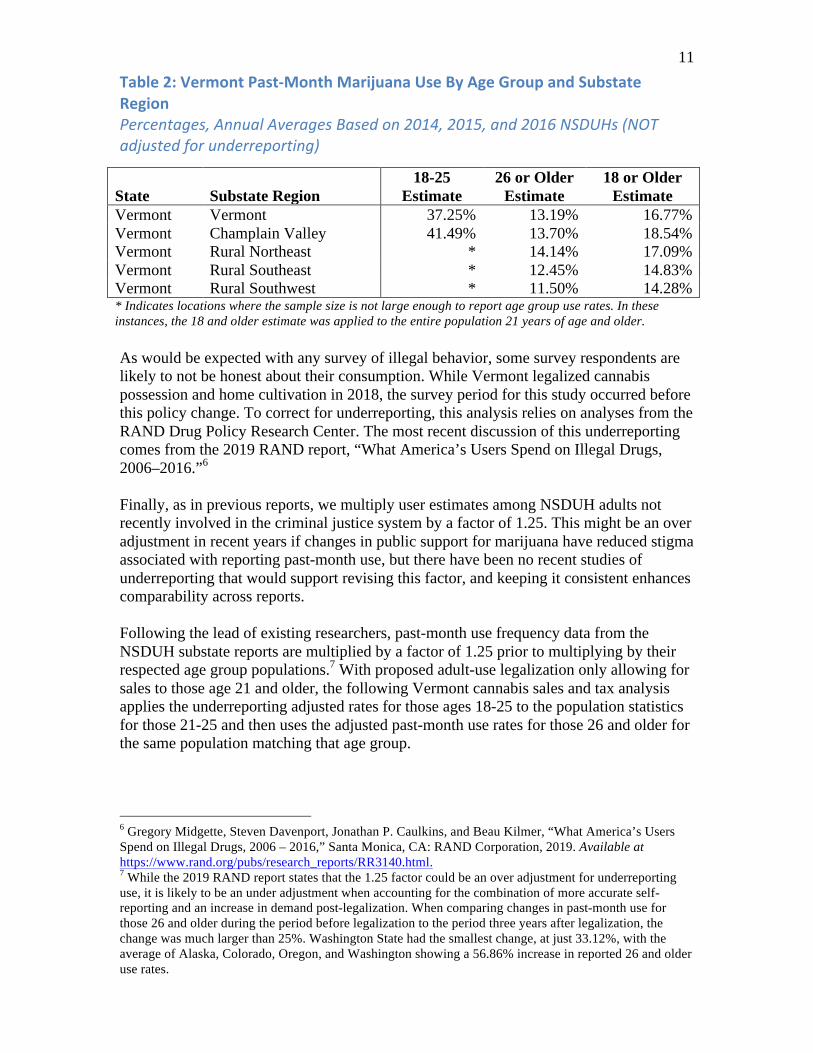
11 Table2:VermontPast-MonthMarijuanaUseByAgeGroupandSubstateRegionPercentages,AnnualAveragesBasedon2014,2015,and2016NSDUHs(NOTadjustedforunderreporting)
As would be expected with any survey of illegal behavior, some survey respondents are likely to not be honest about their consumption. While Vermont legalized cannabis possession and home cultivation in 2018, the survey period for this study occurred before this policy change. To correct for underreporting, this analysis relies on analyses from the RAND Drug Policy Research Center. The most recent discussion of this underreporting comes from the 2019 RAND report, “What America’s Users Spend on Illegal Drugs, 2006–2016.”6 Finally, as in previous reports, we multiply user estimates among NSDUH adults not recently involved in the criminal justice system by a factor of 1.25. This might be an over adjustment in recent years if changes in public support for marijuana have reduced stigma associated with reporting past-month use, but there have been no recent studies of underreporting that would support revising this factor, and keeping it consistent enhances comparability across reports. Following the lead of existing researchers, past-month use frequency data from the NSDUH substate reports are multiplied by a factor of 1.25 prior to multiplying by their respected age group populations.7 With proposed adult-use legalization only allowing for sales to those age 21 and older, the following Vermont cannabis sales and tax analysis applies the underreporting adjusted rates for those ages 18-25 to the population statistics for those 21-25 and then uses the adjusted past-month use rates for those 26 and older for the same population matching that age group.
6 Gregory Midgette, Steven Davenport, Jonathan P. Caulkins, and Beau Kilmer, “What America’s Users Spend on Illegal Drugs, 2006 – 2016,” Santa Monica, CA: RAND Corporation, 2019. Available at https://www.rand.org/pubs/research_reports/RR3140.html. 7 While the 2019 RAND report states that the 1.25 factor could be an over adjustment for underreporting use, it is likely to be an under adjustment when accounting for the combination of more accurate self-reporting and an increase in demand post-legalization. When comparing changes in past-month use for those 26 and older during the period before legalization to the period three years after legalization, the change was much larger than 25%. Washington State had the smallest change, at just 33.12%, with the average of Alaska, Colorado, Oregon, and Washington showing a 56.86% increase in reported 26 and older use rates.
State Substate Region 18-25
Estimate 26 or Older
Estimate 18 or Older
Estimate Vermont Vermont 37.25% 13.19% 16.77% Vermont Champlain Valley 41.49% 13.70% 18.54% Vermont Rural Northeast * 14.14% 17.09% Vermont Rural Southeast * 12.45% 14.83% Vermont Rural Southwest * 11.50% 14.28% * Indicates locations where the sample size is not large enough to report age group use rates. In these instances, the 18 and older estimate was applied to the entire population 21 years of age and older.
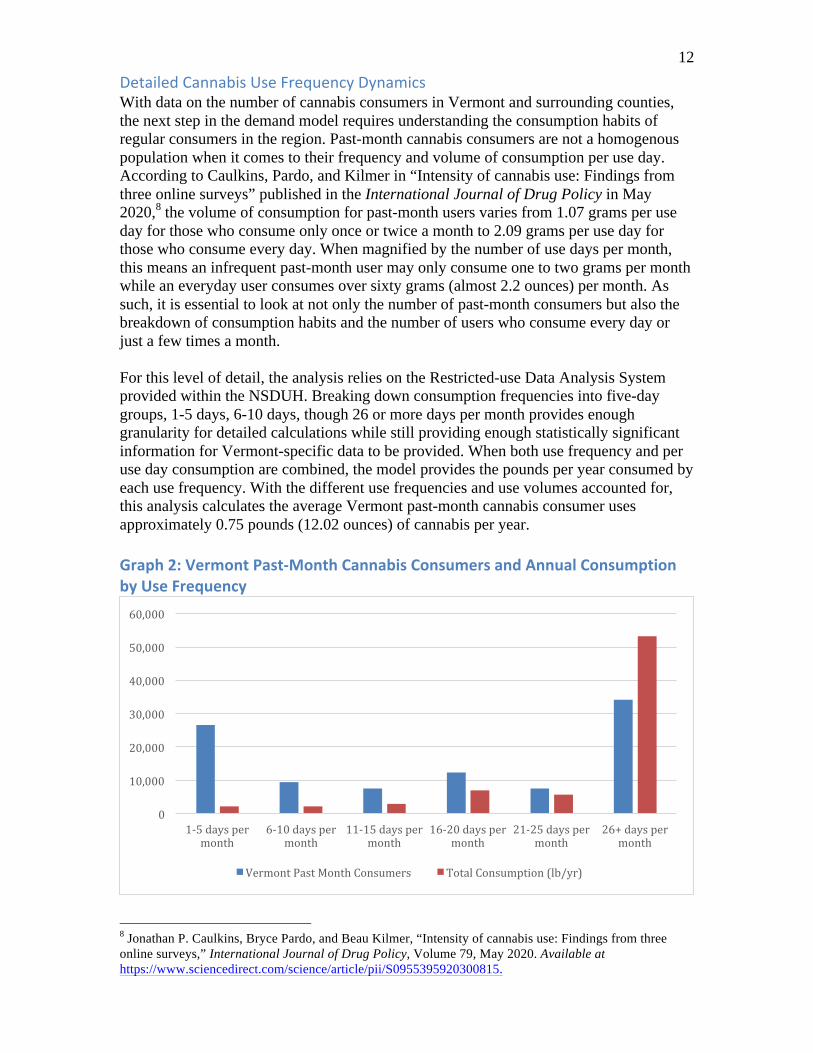
12 DetailedCannabisUseFrequencyDynamicsWith data on the number of cannabis consumers in Vermont and surrounding counties, the next step in the demand model requires understanding the consumption habits of regular consumers in the region. Past-month cannabis consumers are not a homogenous population when it comes to their frequency and volume of consumption per use day. According to Caulkins, Pardo, and Kilmer in “Intensity of cannabis use: Findings from three online surveys” published in the International Journal of Drug Policy in May 2020,8 the volume of consumption for past-month users varies from 1.07 grams per use day for those who consume only once or twice a month to 2.09 grams per use day for those who consume every day. When magnified by the number of use days per month, this means an infrequent past-month user may only consume one to two grams per month while an everyday user consumes over sixty grams (almost 2.2 ounces) per month. As such, it is essential to look at not only the number of past-month consumers but also the breakdown of consumption habits and the number of users who consume every day or just a few times a month. For this level of detail, the analysis relies on the Restricted-use Data Analysis System provided within the NSDUH. Breaking down consumption frequencies into five-day groups, 1-5 days, 6-10 days, though 26 or more days per month provides enough granularity for detailed calculations while still providing enough statistically significant information for Vermont-specific data to be provided. When both use frequency and per use day consumption are combined, the model provides the pounds per year consumed by each use frequency. With the different use frequencies and use volumes accounted for, this analysis calculates the average Vermont past-month cannabis consumer uses approximately 0.75 pounds (12.02 ounces) of cannabis per year.Graph2:VermontPast-MonthCannabisConsumersandAnnualConsumptionbyUseFrequency
8 Jonathan P. Caulkins, Bryce Pardo, and Beau Kilmer, “Intensity of cannabis use: Findings from three online surveys,” International Journal of Drug Policy, Volume 79, May 2020. Available at https://www.sciencedirect.com/science/article/pii/S0955395920300815.
0
10,000
20,000
30,000
40,000
50,000
60,000
1-5dayspermonth
6-10dayspermonth
11-15dayspermonth
16-20dayspermonth
21-25dayspermonth
26+dayspermonth
VermontPastMonthConsumers TotalConsumption(lb/yr)
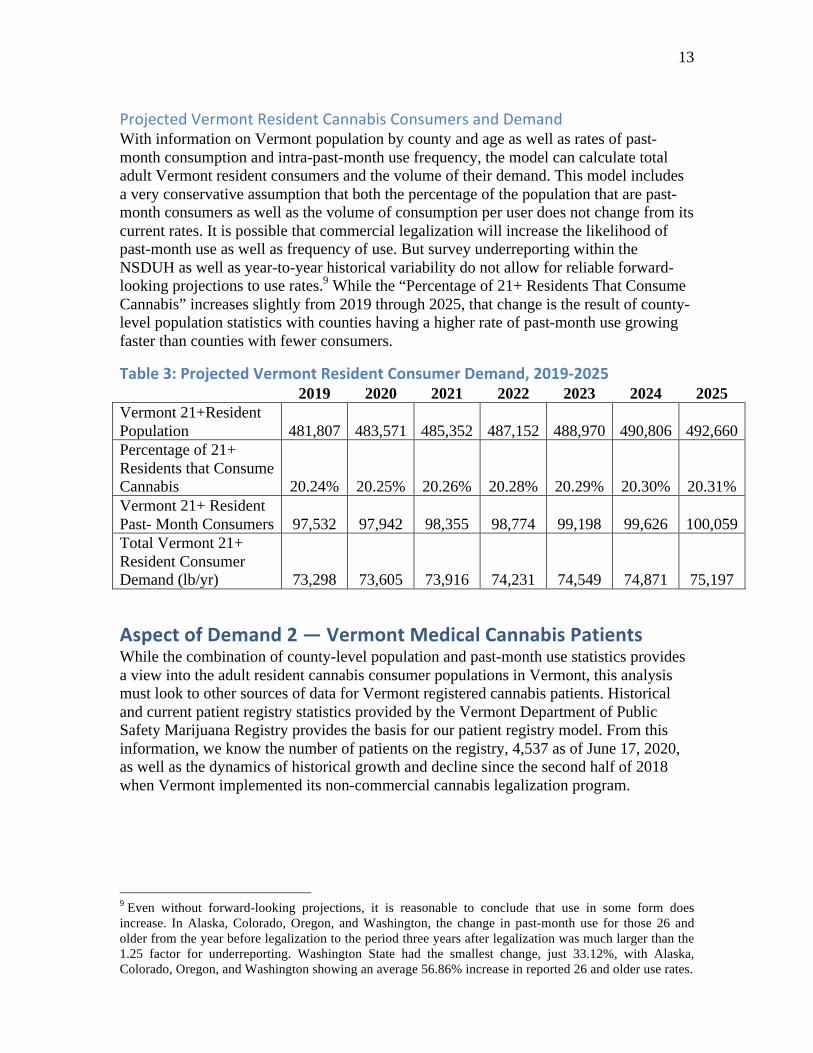
13 ProjectedVermontResidentCannabisConsumersandDemand With information on Vermont population by county and age as well as rates of past-month consumption and intra-past-month use frequency, the model can calculate total adult Vermont resident consumers and the volume of their demand. This model includes a very conservative assumption that both the percentage of the population that are past-month consumers as well as the volume of consumption per user does not change from its current rates. It is possible that commercial legalization will increase the likelihood of past-month use as well as frequency of use. But survey underreporting within the NSDUH as well as year-to-year historical variability do not allow for reliable forward-looking projections to use rates.9 While the “Percentage of 21+ Residents That Consume Cannabis” increases slightly from 2019 through 2025, that change is the result of county-level population statistics with counties having a higher rate of past-month use growing faster than counties with fewer consumers.
Table3:ProjectedVermontResidentConsumerDemand,2019-2025
2019 2020 2021 2022 2023 2024 2025
Vermont 21+Resident Population 481,807 483,571 485,352 487,152 488,970 490,806 492,660 Percentage of 21+ Residents that Consume Cannabis 20.24% 20.25% 20.26% 20.28% 20.29% 20.30% 20.31% Vermont 21+ Resident Past- Month Consumers 97,532 97,942 98,355 98,774 99,198 99,626 100,059 Total Vermont 21+ Resident Consumer Demand (lb/yr) 73,298 73,605 73,916 74,231 74,549 74,871 75,197
AspectofDemand2—VermontMedicalCannabisPatientsWhile the combination of county-level population and past-month use statistics provides a view into the adult resident cannabis consumer populations in Vermont, this analysis must look to other sources of data for Vermont registered cannabis patients. Historical and current patient registry statistics provided by the Vermont Department of Public Safety Marijuana Registry provides the basis for our patient registry model. From this information, we know the number of patients on the registry, 4,537 as of June 17, 2020, as well as the dynamics of historical growth and decline since the second half of 2018 when Vermont implemented its non-commercial cannabis legalization program.
9 Even without forward-looking projections, it is reasonable to conclude that use in some form does increase. In Alaska, Colorado, Oregon, and Washington, the change in past-month use for those 26 and older from the year before legalization to the period three years after legalization was much larger than the 1.25 factor for underreporting. Washington State had the smallest change, just 33.12%, with Alaska, Colorado, Oregon, and Washington showing an average 56.86% increase in reported 26 and older use rates.
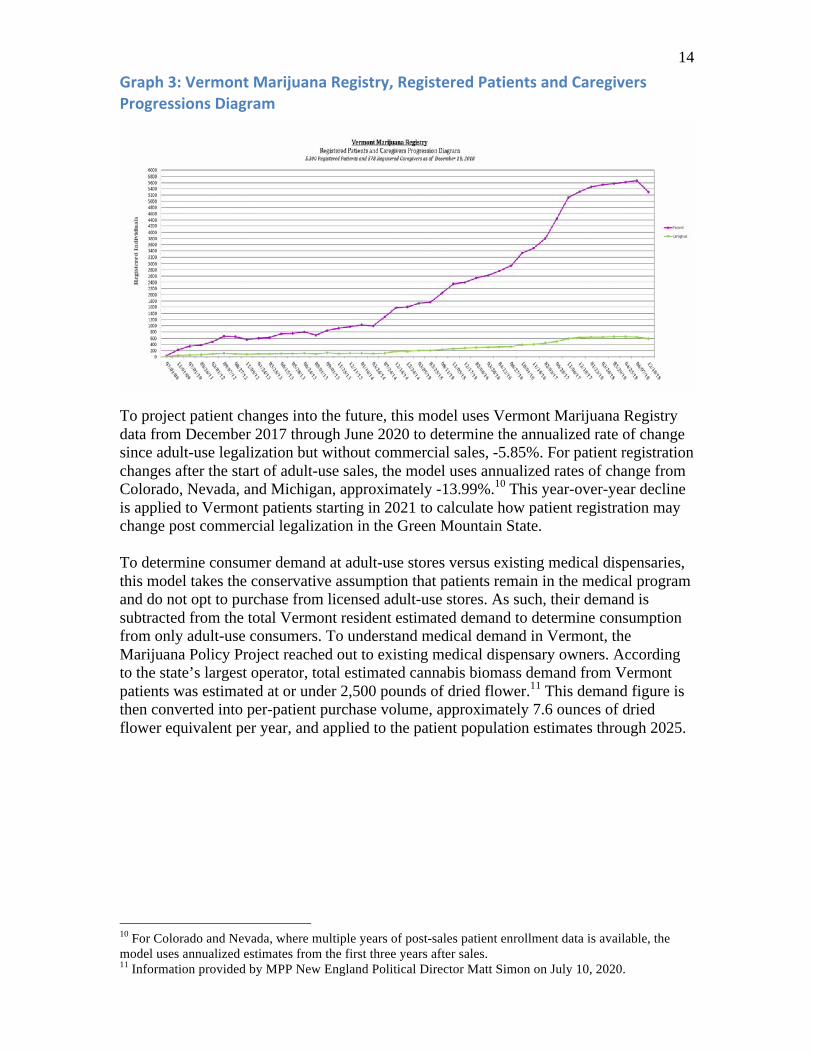
14 Graph3:VermontMarijuanaRegistry,RegisteredPatientsandCaregiversProgressionsDiagram
To project patient changes into the future, this model uses Vermont Marijuana Registry data from December 2017 through June 2020 to determine the annualized rate of change since adult-use legalization but without commercial sales, -5.85%. For patient registration changes after the start of adult-use sales, the model uses annualized rates of change from Colorado, Nevada, and Michigan, approximately -13.99%.10 This year-over-year decline is applied to Vermont patients starting in 2021 to calculate how patient registration may change post commercial legalization in the Green Mountain State. To determine consumer demand at adult-use stores versus existing medical dispensaries, this model takes the conservative assumption that patients remain in the medical program and do not opt to purchase from licensed adult-use stores. As such, their demand is subtracted from the total Vermont resident estimated demand to determine consumption from only adult-use consumers. To understand medical demand in Vermont, the Marijuana Policy Project reached out to existing medical dispensary owners. According to the state’s largest operator, total estimated cannabis biomass demand from Vermont patients was estimated at or under 2,500 pounds of dried flower.11 This demand figure is then converted into per-patient purchase volume, approximately 7.6 ounces of dried flower equivalent per year, and applied to the patient population estimates through 2025.
10 For Colorado and Nevada, where multiple years of post-sales patient enrollment data is available, the model uses annualized estimates from the first three years after sales. 11 Information provided by MPP New England Political Director Matt Simon on July 10, 2020.
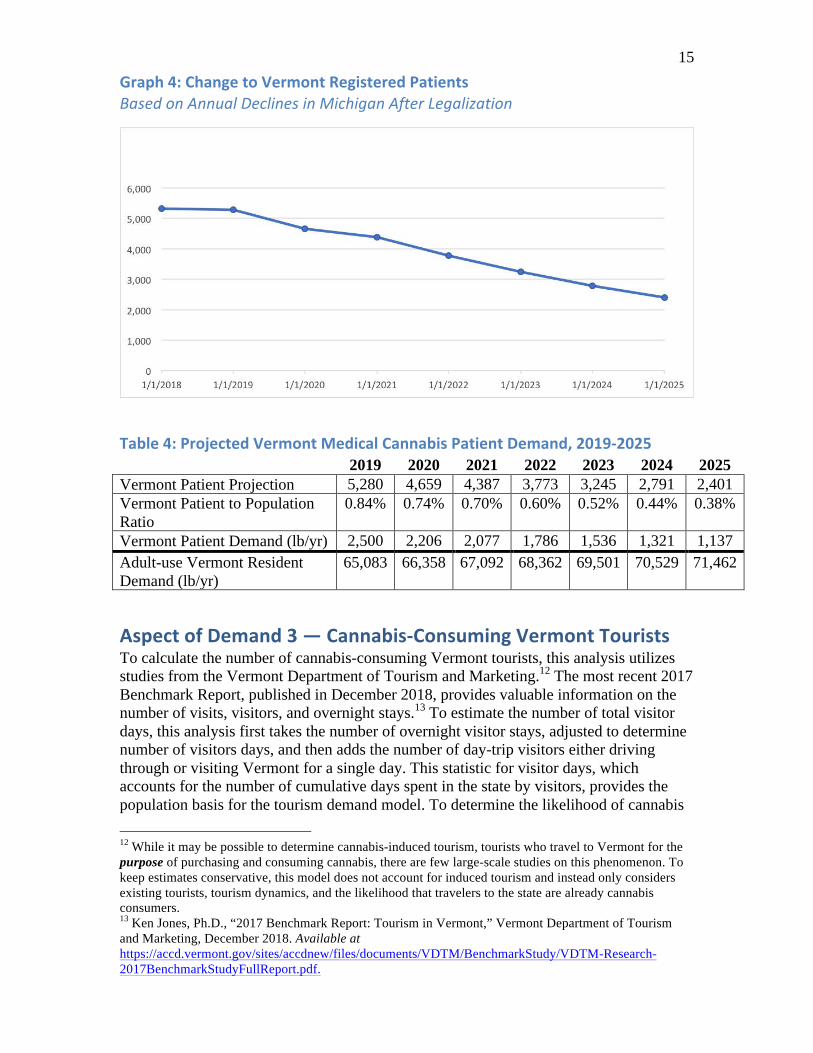
15 Graph4:ChangetoVermontRegisteredPatientsBasedonAnnualDeclinesinMichiganAfterLegalization
Table4:ProjectedVermontMedicalCannabisPatientDemand,2019-2025
2019 2020 2021 2022 2023 2024 2025
Vermont Patient Projection 5,280 4,659 4,387 3,773 3,245 2,791 2,401 Vermont Patient to Population Ratio
0.84% 0.74% 0.70% 0.60% 0.52% 0.44% 0.38%
Vermont Patient Demand (lb/yr) 2,500 2,206 2,077 1,786 1,536 1,321 1,137
Adult-use Vermont Resident Demand (lb/yr)
65,083 66,358 67,092 68,362 69,501 70,529 71,462
AspectofDemand3—Cannabis-ConsumingVermontTouristsTo calculate the number of cannabis-consuming Vermont tourists, this analysis utilizes studies from the Vermont Department of Tourism and Marketing.12 The most recent 2017 Benchmark Report, published in December 2018, provides valuable information on the number of visits, visitors, and overnight stays.13 To estimate the number of total visitor days, this analysis first takes the number of overnight visitor stays, adjusted to determine number of visitors days, and then adds the number of day-trip visitors either driving through or visiting Vermont for a single day. This statistic for visitor days, which accounts for the number of cumulative days spent in the state by visitors, provides the population basis for the tourism demand model. To determine the likelihood of cannabis 12 While it may be possible to determine cannabis-induced tourism, tourists who travel to Vermont for the purpose of purchasing and consuming cannabis, there are few large-scale studies on this phenomenon. To keep estimates conservative, this model does not account for induced tourism and instead only considers existing tourists, tourism dynamics, and the likelihood that travelers to the state are already cannabis consumers. 13 Ken Jones, Ph.D., “2017 Benchmark Report: Tourism in Vermont,” Vermont Department of Tourism and Marketing, December 2018. Available at https://accd.vermont.gov/sites/accdnew/files/documents/VDTM/BenchmarkStudy/VDTM-Research-2017BenchmarkStudyFullReport.pdf.
16 use among visitors, additional data on the residencies of visitors is used in conjunction with the 2014-2016 NSDUH Substate dataset. While individuals who consume less than once a month may visit a licensed cannabis store in Vermont, this model takes a conservative assumption and applies past-month use statistics to determine the population likely to purchase cannabis while traveling in the state. When assessing the impact of tourism consumption on cannabis demand, it is essential to recognize that as reported in the Department of Tourism and Marketing study, even residents of Vermont can be tourists to the state. When it comes to eating at restaurants, purchasing souvenirs, or staying at hotels, a visitor who is a resident of Vermont may act similarly to a visitor who is a resident of New Hampshire. But for cannabis demand, the resident of Vermont who travels outside their hometown to visit another portion of the state does not represent an increase in demand but rather a geographic relocation of demand. To avoid double counting, this model removes all visitor days coming from Vermont residents. Furthermore, this model assumes that 20% of the tourist population are young people under the age of 21 traveling with family and as such are excluded from the total population estimate. This analysis faces some limitations when attempting to project annual changes to cannabis-consuming Vermont tourists through 2025. Data on annual tourism growth in Vermont does not show any specific trends beyond a correlation with the health of the regional economy.14 As such, this model uses a modest 2% annual increase, mentioned in the 2017 Benchmark Report and in-line with U.S. tourism growth trends nationally. To calculate total demand from cannabis-consuming non-resident Vermont tourists, this model multiplies the number of cannabis-consuming visitor days with daily tourist consumption data provided in the comprehensive 2017 report, “Market Size and Demand for Marijuana in Colorado,” prepared for the Colorado Department of Revenue by MPG Consulting.15 According to this report, visitors consume one gram of marijuana per use day while visiting Colorado. This results in a relatively simple measurement for demand that does not require additional accounting for length of stay because the tourist population is measured by total visiting days rather than the number of individual tourists.
14 Id. (page 12) 15 Marijuana Policy Group, “Market Size and Demand for Marijuana in Colorado, 2017 Market Update,” Prepared for the Colorado Department of Revenue, August 2018. Available at https://www.colorado.gov/pacific/sites/default/files/MED%20Demand%20and%20Market%20%20Study%20%20082018.pdf.
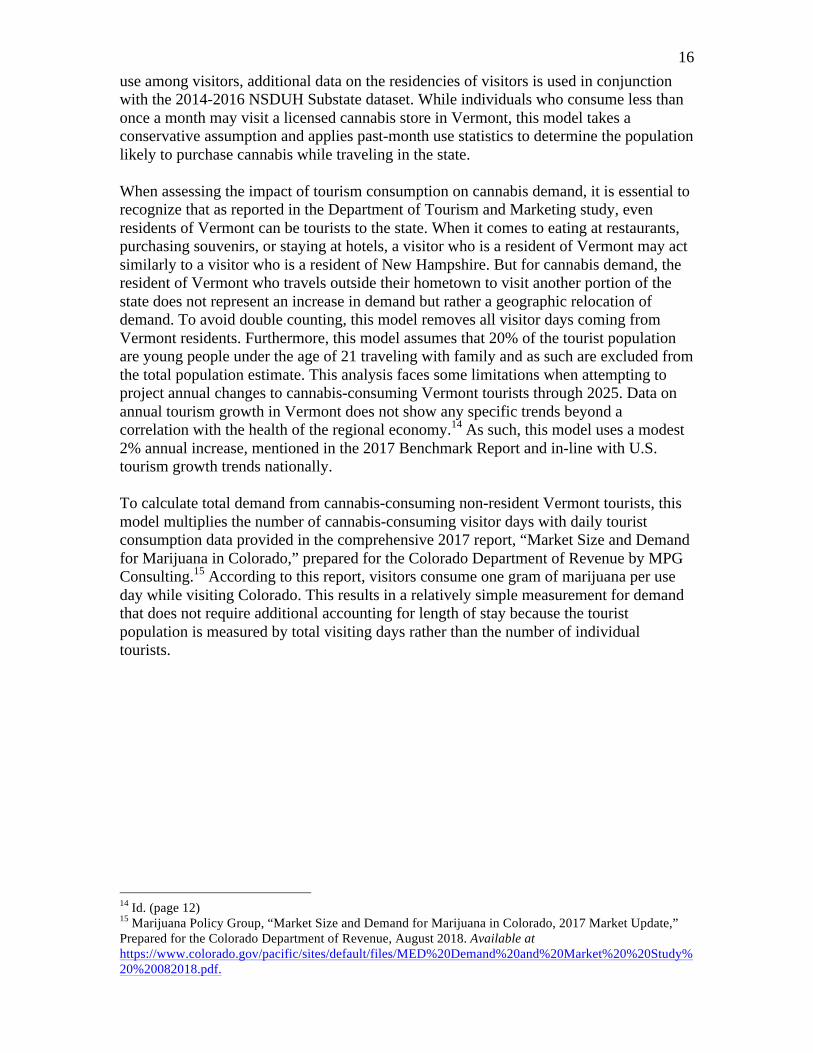
17 Graph5:StateResidenciesofTotalNon-ResidentCannabis-ConsumingTouristDaysin2017
AspectofDemand4—ConsumersLivinginBorderStatesSome cannabis consumers traveling to Vermont will come for the sole or primary purpose of purchasing legal and regulated cannabis. This is clearly demonstrated from news reports showing initial sales in Massachusetts, Michigan, and other adult-use states. In Illinois, the Department of Financial and Professional Regulation reports that from January through May 2020, 23.2% of sales came from out-of-state residents.16 While it is possible that some of these sales came from ordinary tourists who would have traveled to Illinois anyway, many likely came for the purpose of purchasing legal cannabis. Since these types of consumers do not typically show up in tourism reports, particularly studies prior to legalization, border consumers must be factored into the model as their own unique aspect of demand. To assess demand from border consumers, this model uses the same techniques employed for Vermont resident consumers. County-level population data from the Census’s American Community Survey was used to project populations age 21-25 and 26 and older. Regional data on past-month cannabis use rates from NSDUH Substate reports, adjusted 1.25x for underreporting, was then applied to determine the number of cannabis consumers within selected border counties. Just as with Vermont residents, state-level NSDUH past-month use frequency data is employed to better understand how the distribution of occasional to daily consumers affects the average pounds per year consumed by past-month users. New Hampshire and New York both have a lower percentage of daily or near daily consumers, which results in lower average annual consumption for past-month consumers, 10.41 ounces and 8.72 ounces respectively, as compared to Vermont at 12.02 ounces. When determining which areas to include within the definition of “border counties,” this analysis separated counties into three groups. The first is direct border counties, which includes counties adjacent to Vermont as well as those that are not quite adjacent but still 16 “Illinois adult use cannabis monthly sales figures,” Illinois Department of Financial and Professional Regulation, June 11, 2020. Available at https://www.idfpr.com/Forms/AUC/IDFPR%20monthly%20adult%20use%20cannabis%20sales%20061120.pdf.
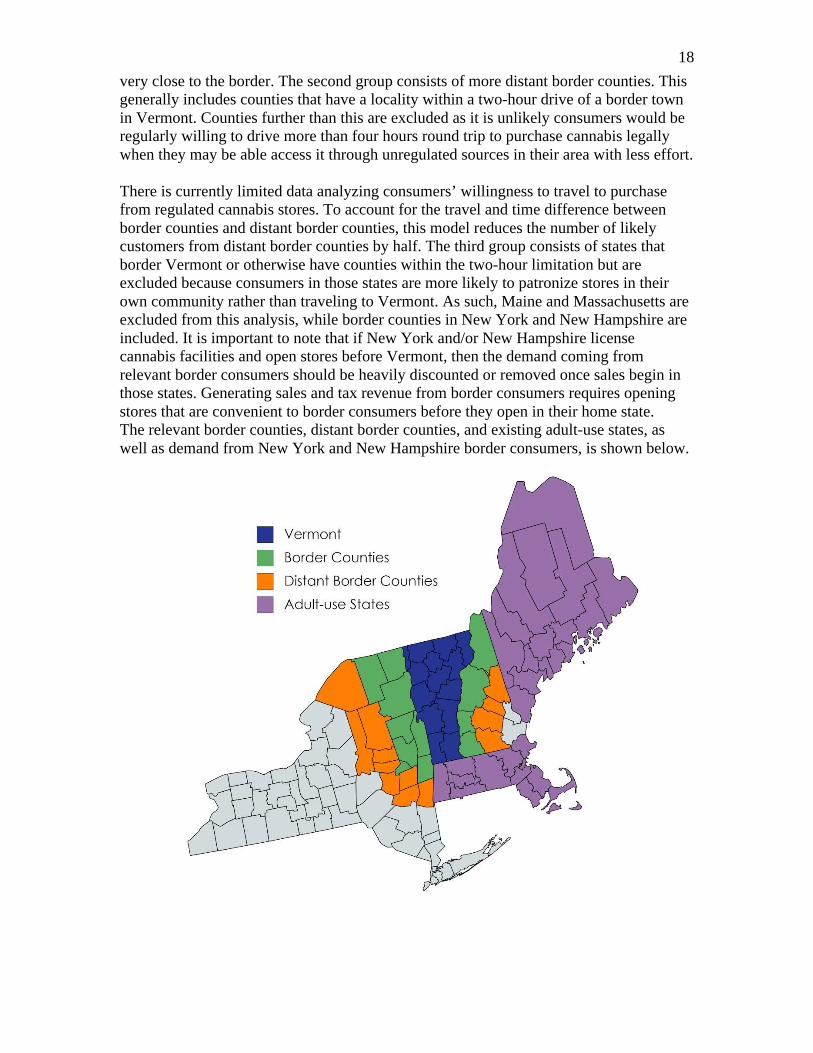
18 very close to the border. The second group consists of more distant border counties. This generally includes counties that have a locality within a two-hour drive of a border town in Vermont. Counties further than this are excluded as it is unlikely consumers would be regularly willing to drive more than four hours round trip to purchase cannabis legally when they may be able access it through unregulated sources in their area with less effort. There is currently limited data analyzing consumers’ willingness to travel to purchase from regulated cannabis stores. To account for the travel and time difference between border counties and distant border counties, this model reduces the number of likely customers from distant border counties by half. The third group consists of states that border Vermont or otherwise have counties within the two-hour limitation but are excluded because consumers in those states are more likely to patronize stores in their own community rather than traveling to Vermont. As such, Maine and Massachusetts are excluded from this analysis, while border counties in New York and New Hampshire are included. It is important to note that if New York and/or New Hampshire license cannabis facilities and open stores before Vermont, then the demand coming from relevant border consumers should be heavily discounted or removed once sales begin in those states. Generating sales and tax revenue from border consumers requires opening stores that are convenient to border consumers before they open in their home state. The relevant border counties, distant border counties, and existing adult-use states, as well as demand from New York and New Hampshire border consumers, is shown below.
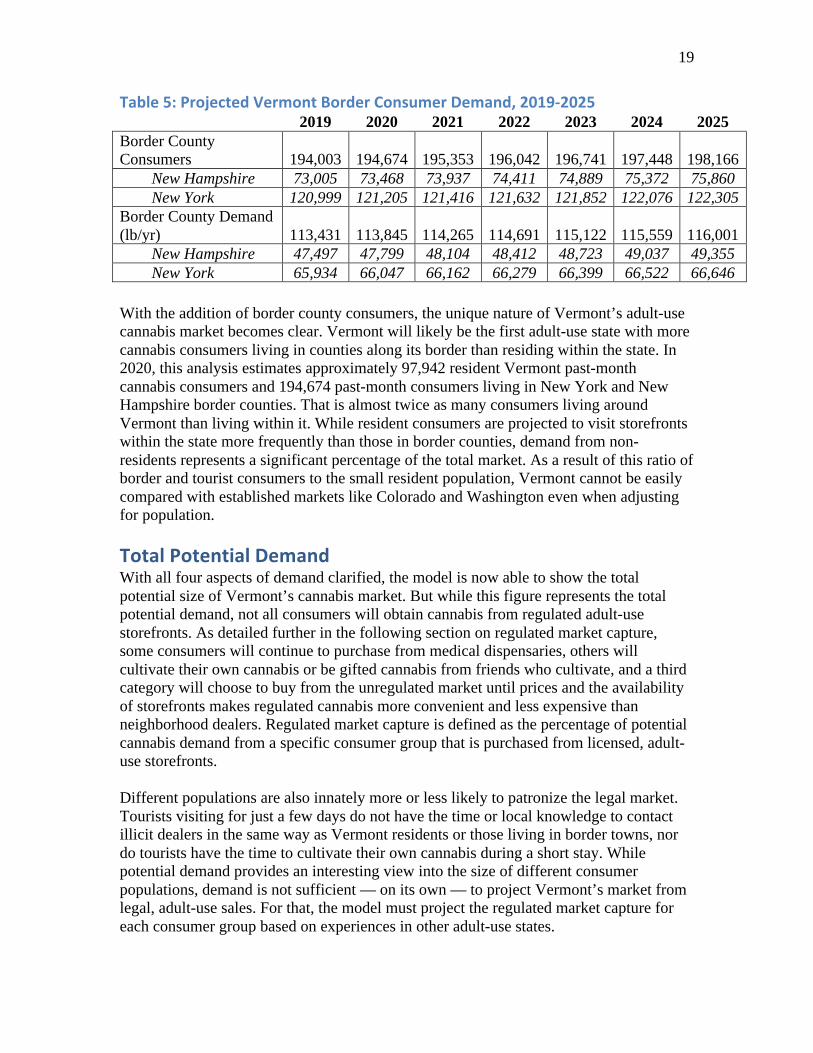
19 Table5:ProjectedVermontBorderConsumerDemand,2019-2025 2019 2020 2021 2022 2023 2024 2025 Border County Consumers 194,003 194,674 195,353 196,042 196,741 197,448 198,166
New Hampshire 73,005 73,468 73,937 74,411 74,889 75,372 75,860 New York 120,999 121,205 121,416 121,632 121,852 122,076 122,305
Border County Demand (lb/yr) 113,431 113,845 114,265 114,691 115,122 115,559 116,001
New Hampshire 47,497 47,799 48,104 48,412 48,723 49,037 49,355 New York 65,934 66,047 66,162 66,279 66,399 66,522 66,646
With the addition of border county consumers, the unique nature of Vermont’s adult-use cannabis market becomes clear. Vermont will likely be the first adult-use state with more cannabis consumers living in counties along its border than residing within the state. In 2020, this analysis estimates approximately 97,942 resident Vermont past-month cannabis consumers and 194,674 past-month consumers living in New York and New Hampshire border counties. That is almost twice as many consumers living around Vermont than living within it. While resident consumers are projected to visit storefronts within the state more frequently than those in border counties, demand from non-residents represents a significant percentage of the total market. As a result of this ratio of border and tourist consumers to the small resident population, Vermont cannot be easily compared with established markets like Colorado and Washington even when adjusting for population. TotalPotentialDemand With all four aspects of demand clarified, the model is now able to show the total potential size of Vermont’s cannabis market. But while this figure represents the total potential demand, not all consumers will obtain cannabis from regulated adult-use storefronts. As detailed further in the following section on regulated market capture, some consumers will continue to purchase from medical dispensaries, others will cultivate their own cannabis or be gifted cannabis from friends who cultivate, and a third category will choose to buy from the unregulated market until prices and the availability of storefronts makes regulated cannabis more convenient and less expensive than neighborhood dealers. Regulated market capture is defined as the percentage of potential cannabis demand from a specific consumer group that is purchased from licensed, adult-use storefronts. Different populations are also innately more or less likely to patronize the legal market. Tourists visiting for just a few days do not have the time or local knowledge to contact illicit dealers in the same way as Vermont residents or those living in border towns, nor do tourists have the time to cultivate their own cannabis during a short stay. While potential demand provides an interesting view into the size of different consumer populations, demand is not sufficient — on its own — to project Vermont’s market from legal, adult-use sales. For that, the model must project the regulated market capture for each consumer group based on experiences in other adult-use states.
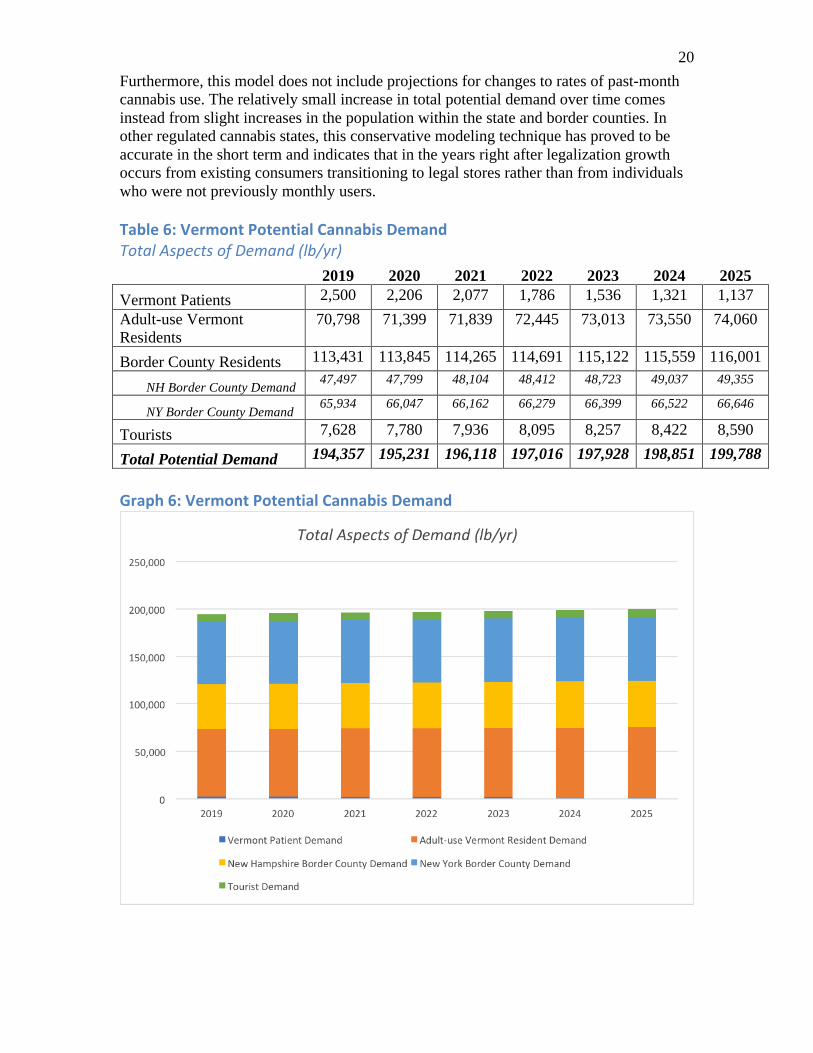
20 Furthermore, this model does not include projections for changes to rates of past-month cannabis use. The relatively small increase in total potential demand over time comes instead from slight increases in the population within the state and border counties. In other regulated cannabis states, this conservative modeling technique has proved to be accurate in the short term and indicates that in the years right after legalization growth occurs from existing consumers transitioning to legal stores rather than from individuals who were not previously monthly users. Table6:VermontPotentialCannabisDemandTotalAspectsofDemand(lb/yr)
2019 2020 2021 2022 2023 2024 2025
Vermont Patients 2,500 2,206 2,077 1,786 1,536 1,321 1,137 Adult-use Vermont Residents
70,798 71,399 71,839 72,445 73,013 73,550 74,060
Border County Residents 113,431 113,845 114,265 114,691 115,122 115,559 116,001
NH Border County Demand 47,497 47,799 48,104 48,412 48,723 49,037 49,355
NY Border County Demand 65,934 66,047 66,162 66,279 66,399 66,522 66,646
Tourists 7,628 7,780 7,936 8,095 8,257 8,422 8,590
Total Potential Demand 194,357 195,231 196,118 197,016 197,928 198,851 199,788
Graph6:VermontPotentialCannabisDemand
21
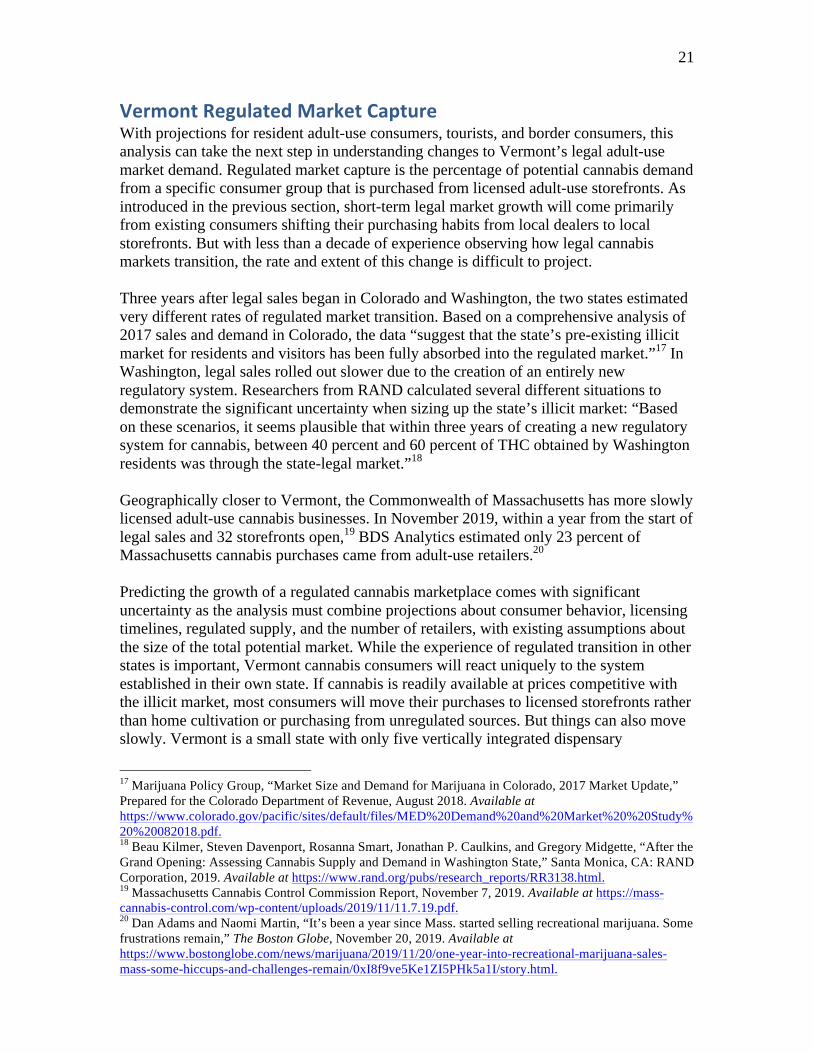
VermontRegulatedMarketCaptureWith projections for resident adult-use consumers, tourists, and border consumers, this analysis can take the next step in understanding changes to Vermont’s legal adult-use market demand. Regulated market capture is the percentage of potential cannabis demand from a specific consumer group that is purchased from licensed adult-use storefronts. As introduced in the previous section, short-term legal market growth will come primarily from existing consumers shifting their purchasing habits from local dealers to local storefronts. But with less than a decade of experience observing how legal cannabis markets transition, the rate and extent of this change is difficult to project. Three years after legal sales began in Colorado and Washington, the two states estimated very different rates of regulated market transition. Based on a comprehensive analysis of 2017 sales and demand in Colorado, the data “suggest that the state’s pre-existing illicit market for residents and visitors has been fully absorbed into the regulated market.”17 In Washington, legal sales rolled out slower due to the creation of an entirely new regulatory system. Researchers from RAND calculated several different situations to demonstrate the significant uncertainty when sizing up the state’s illicit market: “Based on these scenarios, it seems plausible that within three years of creating a new regulatory system for cannabis, between 40 percent and 60 percent of THC obtained by Washington residents was through the state-legal market.”18 Geographically closer to Vermont, the Commonwealth of Massachusetts has more slowly licensed adult-use cannabis businesses. In November 2019, within a year from the start of legal sales and 32 storefronts open,19 BDS Analytics estimated only 23 percent of Massachusetts cannabis purchases came from adult-use retailers.20 Predicting the growth of a regulated cannabis marketplace comes with significant uncertainty as the analysis must combine projections about consumer behavior, licensing timelines, regulated supply, and the number of retailers, with existing assumptions about the size of the total potential market. While the experience of regulated transition in other states is important, Vermont cannabis consumers will react uniquely to the system established in their own state. If cannabis is readily available at prices competitive with the illicit market, most consumers will move their purchases to licensed storefronts rather than home cultivation or purchasing from unregulated sources. But things can also move slowly. Vermont is a small state with only five vertically integrated dispensary
17 Marijuana Policy Group, “Market Size and Demand for Marijuana in Colorado, 2017 Market Update,” Prepared for the Colorado Department of Revenue, August 2018. Available at https://www.colorado.gov/pacific/sites/default/files/MED%20Demand%20and%20Market%20%20Study%20%20082018.pdf. 18 Beau Kilmer, Steven Davenport, Rosanna Smart, Jonathan P. Caulkins, and Gregory Midgette, “After the Grand Opening: Assessing Cannabis Supply and Demand in Washington State,” Santa Monica, CA: RAND Corporation, 2019. Available at https://www.rand.org/pubs/research_reports/RR3138.html. 19 Massachusetts Cannabis Control Commission Report, November 7, 2019. Available at https://mass-cannabis-control.com/wp-content/uploads/2019/11/11.7.19.pdf. 20 Dan Adams and Naomi Martin, “It’s been a year since Mass. started selling recreational marijuana. Some frustrations remain,” The Boston Globe, November 20, 2019. Available at https://www.bostonglobe.com/news/marijuana/2019/11/20/one-year-into-recreational-marijuana-sales-mass-some-hiccups-and-challenges-remain/0xI8f9ve5Ke1ZI5PHk5a1I/story.html.
22 registration certificates and seven dispensing locations. If existing medical licenses were to add adult-use sales, cultivation would need to quickly grow to meet adult-use demand. There are several different policy options lawmakers could consider when expanding supply. Medical operators could be permitted to increase the size of their operations. Vermont agricultural businesses, such as hemp growers or flower nurseries, could be permitted to grow a small quantity of cannabis for sale to dispensaries while state regulators develop a formal licensing system. Each potential option will affect supply and thus the speed at which the regulated market captures consumer demand. Taxes, regulation, and storefront competition influence the prices consumers pay for adult-use cannabis and cannabis products. Consumers may choose not to patronize regulated storefronts or opt to go back to local dealers if a combination of these factors result in prices significantly higher than the illicit market. A 2019 behavioral economics journal article calculating the substitutability of legal and illegal cannabis by survey respondents in adult-use states concluded, “that a price of $10/gram for legal cannabis would not be expected to substantially motivate illegal consumption (81% legal/19% illegal) andthat prices up to $14 would also not be expected to push consumers toward the illegal market.”21 But assessing purchasing choices for cannabis requires more than finding the perfect price. Consumers are moved by convenience and safety as well as price. Storefront hours of operation, a secure location, and reliable laboratory testing provide benefits that are difficult to quantify. At the cohort level, regulated market capture will be affected by the priorities of different consumer groups. Frequent consumers who spend more on cannabis may be more price sensitive than the average user. Mobility impaired consumers will likely prioritize convenience and accessibility and may purchase from their neighborhood supplier unless there is a regulated storefront nearby. VermontMarketCaptureAssumptionsConsideringCOVID-19EconomicRecessionGiven the proposals put forward in Senate Bill 54 and the current state of Vermont’s economy during the COVID-19 pandemic, this model utilizes optimistic assumptions for both regulated market capture and speed of implementation. This was done to demonstrate the sales and tax revenue potential from regulated adult-use cannabis. On April 28, 2020, the Vermont Joint Fiscal Office provided fiscal year 2020 and 2021 budget forecasts as affected by the pandemic and resulting economic recession. Across the General Fund, Transportation Fund and Transportation Infrastructure Bond, and Education Fund, Vermont is projected to lose $146 million in fiscal year 2020 and $430 million in fiscal year 2021.22 This represents a 17.4% decline in total fund revenue for the 2021 fiscal year. While implementing adult-use sales requires additional regulatory funding, these costs can be covered prior to any expenditures with application and
21 Michael Amlung, Derek D. Reed, Vanessa Morris, Elizabeth R. Aston, Jane Metrik, and James MacKillop, “Price elasticity of illegal versus legal cannabis: a behavioral economic substitutability analysis,” Addiction, Volume 114, Issue 1, January 2019. Available at https://onlinelibrary.wiley.com/doi/abs/10.1111/add.14437. 22 “Forecasted Revenue Impacts due to COVID-19 for FY20 and FY21,” Vermont Joint Fiscal Office, April 28, 2020. Available at https://ljfo.vermont.gov/assets/Subjects/Revenue-Fund-Updates-and-Issue-Briefs/61c4d2f04b/GENERAL-347573-v4-COVID-19_Revenue_Impacts.pdf.
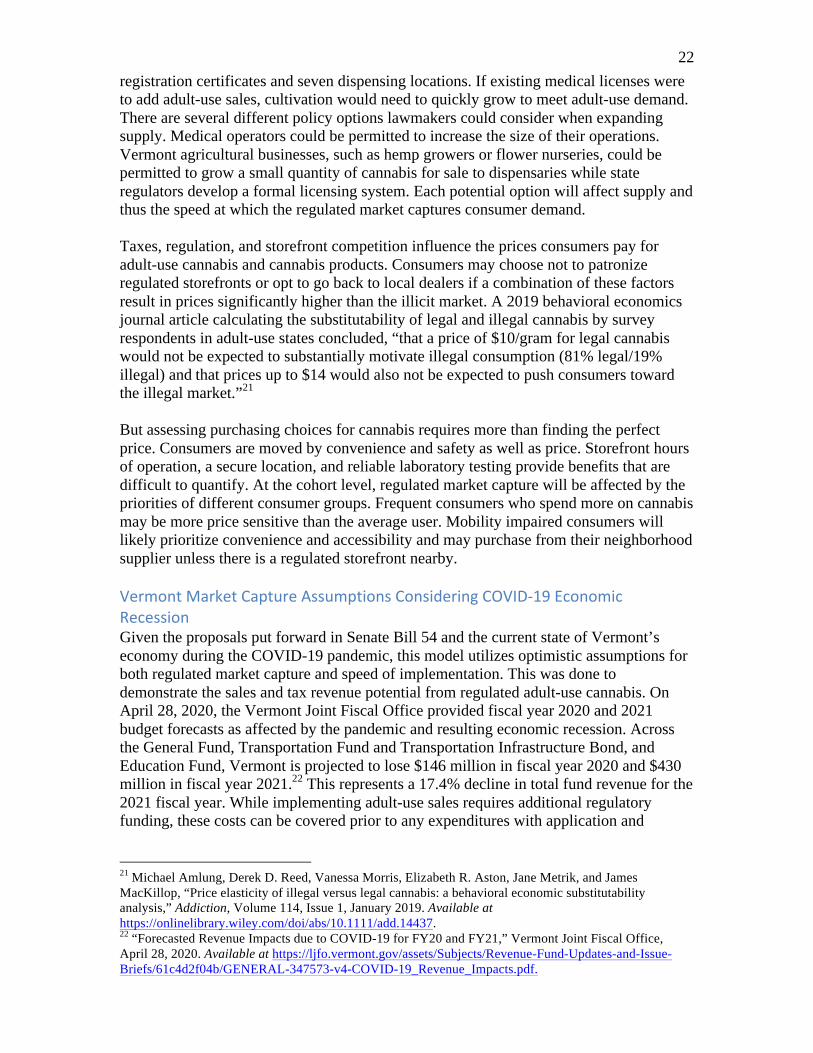
23 transitionary fee revenues. This model assumes Vermont legislators expedite adult-use sales after the passage of commercial legalization. Rather than rulemaking starting in 2021 and licensing beginning in January 2022, this model assumes early-start sales. This could be accomplished by licensing established medical dispensaries as well as current hemp farmers to allow initial sales in January 2021. Illinois, Nevada, and Oregon implemented early-start sales for established medical operators in similar timeframes, allowing each state to generate millions of dollars in tax revenue while new applicants were licensed. Early-start sales are particularly important as they would allow Vermont to take advantage of demand from New York and New Hampshire consumers before their respective state legislatures pass, and regulators implement, their own adult-use laws. Furthermore, this model assumes that Vermont local governments prioritize licensing of cannabis businesses to incentivize economic investment. If existing hemp and other agricultural producers can obtain early-start cultivation permits, Vermont could fully support adult-use sales in 2021 without diverting inventory from medical patients. By implementing these policies, this analysis projects 40% of resident adult-use cannabis consumers would purchase from regulated establishments in 2022, growing to 90% by 2025. As mentioned at the beginning of this section, the regulated market will capture different consumer groups as varied rates. With enough regulated establishments to cultivate, process, and provide accessible sales, Vermont can exceed Massachusetts and Washington adult-use market transition rates. This means moving tens of thousands of consumers away from existing dealers and towards taxed and regulated establishments. While most categories of regulated market capture will increase over time, border county consumer demand at Vermont storefronts is projected to decline in 2023, at which point New York will likely have opened its own regulated cannabis facilities. Table7:Adult-useMarketCaptureAssumptions,2020-2025ByConsumerGroup 2020 2021 2022 2023 2024 2025 Adult-use Vermont Residents 0% 20% 40% 60% 75% 90% Border County Consumers 0% 5% 10% 15% 12% 10% Cannabis Consuming Tourists
0% 40% 50% 75% 90% 95%
24 Graph7:VermontAdult-useResidentConsumerTransitiontoRegulatedMarket
PoundsofDemandasAnalogueforTotalConsumption Regulated cannabis markets provide a diverse array of products from flower to vaporizable oils, edible products, and topical salves. But the NSDUH data set and almost all research on cannabis use asks consumers whether they have used in the past month, how frequently they smoke, and how much they consume per use day in grams. These studies tend to not ask about edibles, concentrates, or topical products. Even after five years of adult-use sales in Colorado and Washington, federal government survey datasets do not have detailed state-level data that can be used to project flower, concentrate, and edible sales in Vermont. To resolve this lack of data and calculate total sales and taxes, this analysis estimates the size of Vermont’s adult-use market by multiplying regulated market demand, measured in pounds of flower, by an estimated retail price per pound. Cannabis flower typically represents 40 to 60% of adult-use sales value, and this metric has been utilized in other assessments of state cannabis markets.23 If policy makers are interested in calculating the potential size of a specific market segment, for instance pre-rolled joints or infused topical products, the projection can be made by simply applying the percentage of sales for those categories to the total estimated size of the regulated Vermont cannabis market. While using a price per pound analogue allows this analysis to project Vermont’s total market size, it does require new assumptions for both the starting market price and the
23 Caulkins, Jonathan P., Beau Kilmer, Mark A. R. Kleiman, Robert J. MacCoun, Gregory Midgette, Pat Oglesby, Rosalie Liccardo Pacula, and Peter Reuter, “Considering Marijuana Legalization: Insights for Vermont and Other Jurisdictions,” Santa Monica, CA: RAND Corporation, 2015. Available at https://www.rand.org/pubs/research_reports/RR864.html; The Marijuana Policy Group, “Market Size and Demand for Marijuana in Colorado,” Prepared for the Colorado Department of Revenue, July 2014. Available at https://www.colorado.gov/pacific/sites/default/files/Market%20Size%20and%20Demand%20Study,%20July%209,%202014%5B1%5D.pdf.
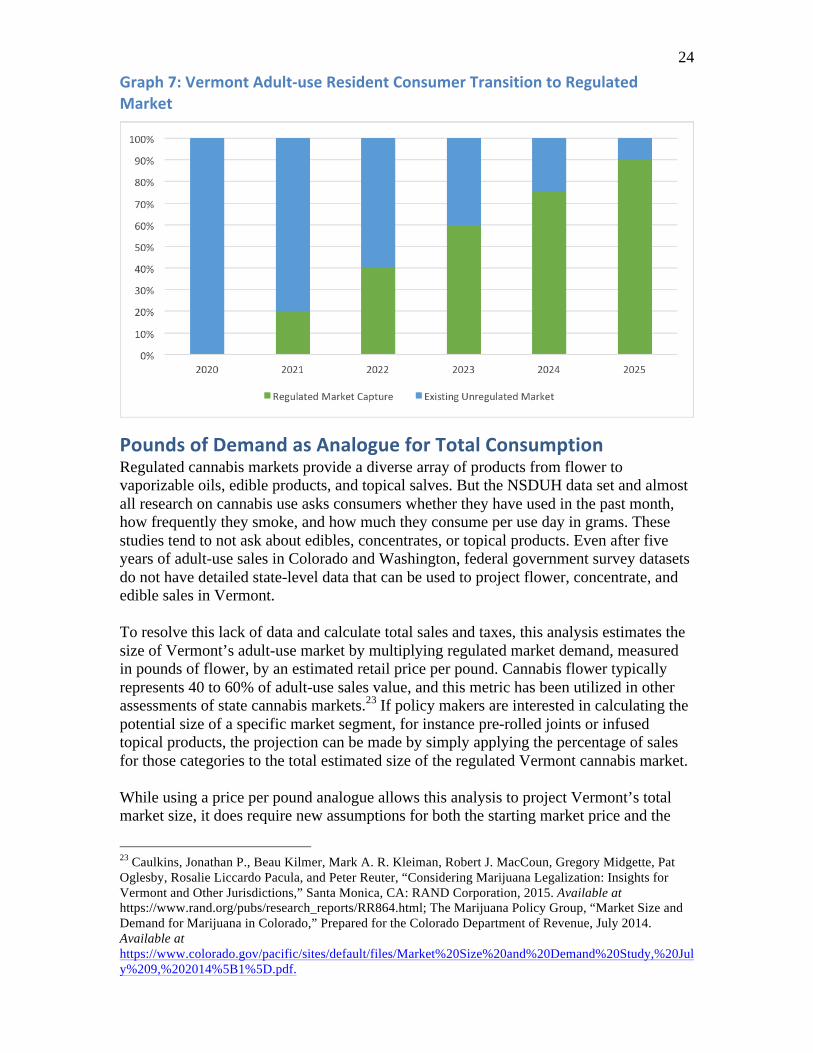
25 rate of change over time. Market prices will depend on both supply and demand. From the analysis, we have a good understanding of demand for cannabis in Vermont from residents, tourists, and border consumers. But supply is much harder to predict without exact knowledge on how Vermont will license new cultivation facilities. Current medical prices, taken from the menus of multiple medical operators,24 show that the average price per gram is approximately $12.65 ($358.51 per ounce and $5,736.14 per pound). With only a handful of medical operators and many more growers likely to be licensed by the state, this price will decline with increased competitive pressures. In Washington State a year after sales began, the price per gram had already fallen to $8.26.25 By 2018, that price dropped to $5.63 per gram with over 450 cultivation licenses in operation.26 As with the assumptions for regulated market capture, this analysis takes an optimistic view on the potential for robust adult-use cultivation and retail licensing in Vermont. While expedited licensing and expansion will advance the rate of regulated market capture, it will also increase competitive pricing pressures. With this model we assume prices will decline in line with the experience in Washington State, to approximately $235 per ounce within the first year of sales, a faster price decline than experienced in Illinois’ and Massachusetts’ new adult-use markets. Once prices decline after initial cultivation and retail expansion, this analysis assumes that price competition will slow with the decline in new retail licensing as small towns reach their cannabis storefront limits. Graph8:VermontProjectedAdult-useMarketPre-TaxPricePerGram
24 This analysis specifically looked at average price per gram listed in online menus provided by Vermont Patients Alliance, Champlain Valley Dispensary, and Grassroots Vermont from June 2020. 25 Data collected by Headset.io and provided to the Marijuana Policy Project by Marijuana Business Daily. 26 Data on price per gram from Headset.io. Data on cultivation licenses was taken from “Marijuana Sales Activity by License Number,” Washington State Liquor and Cannabis Board, available at https://lcb.wa.gov/records/frequently-requested-lists.
26
Table8:Adult-usePre-TaxPricePerPound,Ounce,andGram,2019-2025
2019 2020 2021 2022 2023 2024 2025
Pre-Tax Price Per Pound $5,736 $4,748 $3,760 $3,572 $3,393 $3,224 $3,063 Pre-Tax Price Per Ounce $359 $297 $235 $223 $212 $201 $191 Pre-Tax Price per Gram $12.65 $10.47 $8.29 $7.87 $7.48 $7.11 $6.75
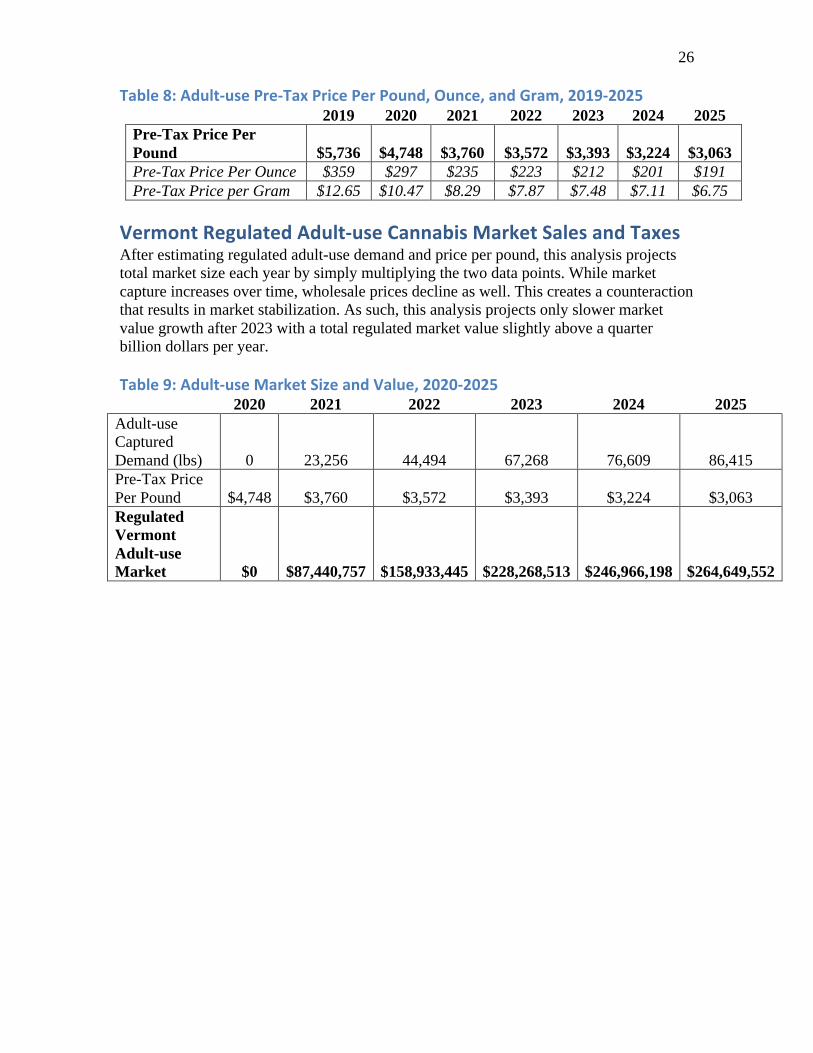
VermontRegulatedAdult-useCannabisMarketSalesandTaxesAfter estimating regulated adult-use demand and price per pound, this analysis projects total market size each year by simply multiplying the two data points. While market capture increases over time, wholesale prices decline as well. This creates a counteraction that results in market stabilization. As such, this analysis projects only slower market value growth after 2023 with a total regulated market value slightly above a quarter billion dollars per year. Table9:Adult-useMarketSizeandValue,2020-2025
2020 2021 2022 2023 2024 2025 Adult-use Captured Demand (lbs) 0 23,256 44,494 67,268 76,609 86,415 Pre-Tax Price Per Pound $4,748 $3,760 $3,572 $3,393 $3,224 $3,063 Regulated Vermont Adult-use Market $0 $87,440,757 $158,933,445 $228,268,513 $246,966,198 $264,649,552
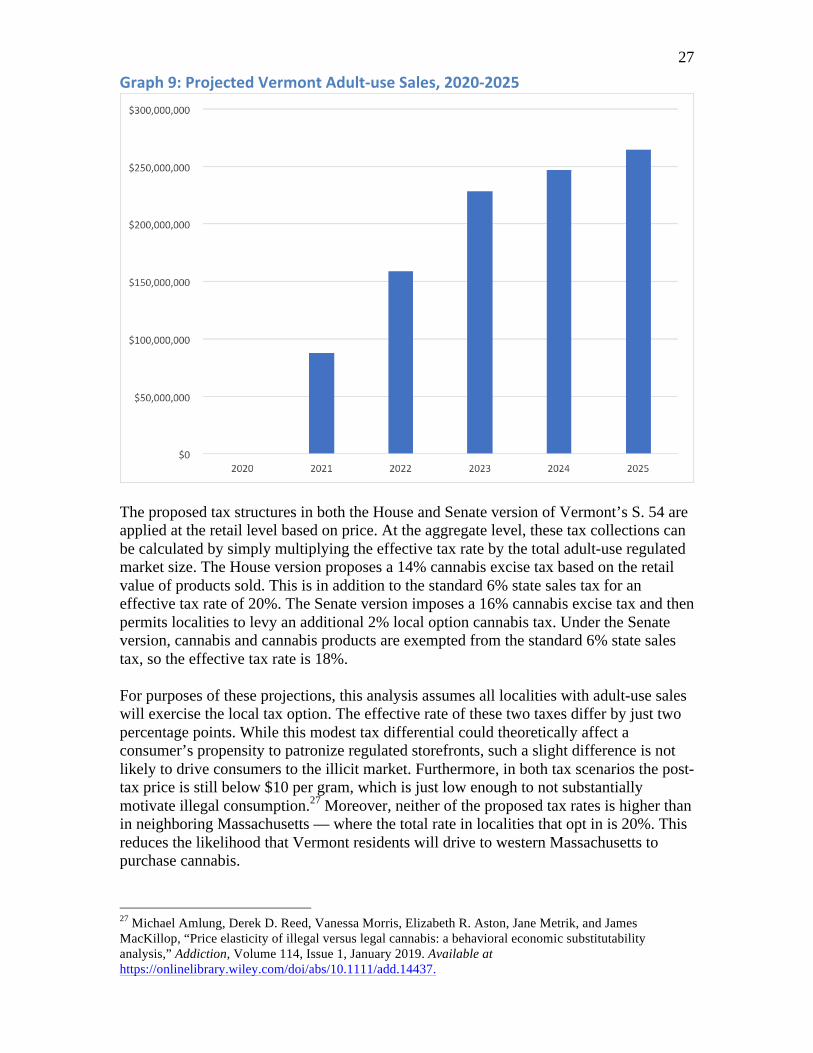
27 Graph9:ProjectedVermontAdult-useSales,2020-2025
The proposed tax structures in both the House and Senate version of Vermont’s S. 54 are applied at the retail level based on price. At the aggregate level, these tax collections can be calculated by simply multiplying the effective tax rate by the total adult-use regulated market size. The House version proposes a 14% cannabis excise tax based on the retail value of products sold. This is in addition to the standard 6% state sales tax for an effective tax rate of 20%. The Senate version imposes a 16% cannabis excise tax and then permits localities to levy an additional 2% local option cannabis tax. Under the Senate version, cannabis and cannabis products are exempted from the standard 6% state sales tax, so the effective tax rate is 18%. For purposes of these projections, this analysis assumes all localities with adult-use sales will exercise the local tax option. The effective rate of these two taxes differ by just two percentage points. While this modest tax differential could theoretically affect a consumer’s propensity to patronize regulated storefronts, such a slight difference is not likely to drive consumers to the illicit market. Furthermore, in both tax scenarios the post-tax price is still below $10 per gram, which is just low enough to not substantially motivate illegal consumption.27 Moreover, neither of the proposed tax rates is higher than in neighboring Massachusetts — where the total rate in localities that opt in is 20%. This reduces the likelihood that Vermont residents will drive to western Massachusetts to purchase cannabis.
27 Michael Amlung, Derek D. Reed, Vanessa Morris, Elizabeth R. Aston, Jane Metrik, and James MacKillop, “Price elasticity of illegal versus legal cannabis: a behavioral economic substitutability analysis,” Addiction, Volume 114, Issue 1, January 2019. Available at https://onlinelibrary.wiley.com/doi/abs/10.1111/add.14437.
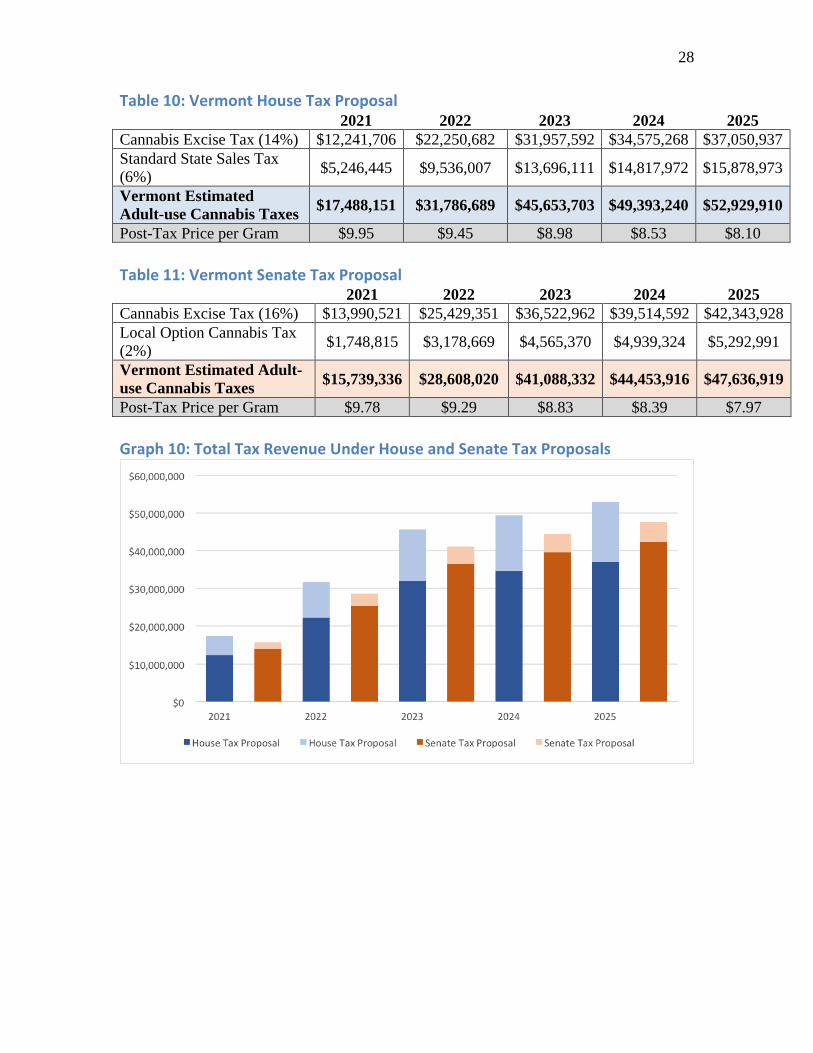
28 Table10:VermontHouseTaxProposal 2021 2022 2023 2024 2025 Cannabis Excise Tax (14%) $12,241,706 $22,250,682 $31,957,592 $34,575,268 $37,050,937 Standard State Sales Tax (6%)
$5,246,445 $9,536,007 $13,696,111 $14,817,972 $15,878,973
Vermont Estimated Adult-use Cannabis Taxes $17,488,151 $31,786,689 $45,653,703 $49,393,240 $52,929,910
Post-Tax Price per Gram $9.95 $9.45 $8.98 $8.53 $8.10
Table11:VermontSenateTaxProposal 2021 2022 2023 2024 2025 Cannabis Excise Tax (16%) $13,990,521 $25,429,351 $36,522,962 $39,514,592 $42,343,928 Local Option Cannabis Tax (2%)
$1,748,815 $3,178,669 $4,565,370 $4,939,324 $5,292,991
Vermont Estimated Adult-use Cannabis Taxes $15,739,336 $28,608,020 $41,088,332 $44,453,916 $47,636,919
Post-Tax Price per Gram $9.78 $9.29 $8.83 $8.39 $7.97
Graph10:TotalTaxRevenueUnderHouseandSenateTaxProposals
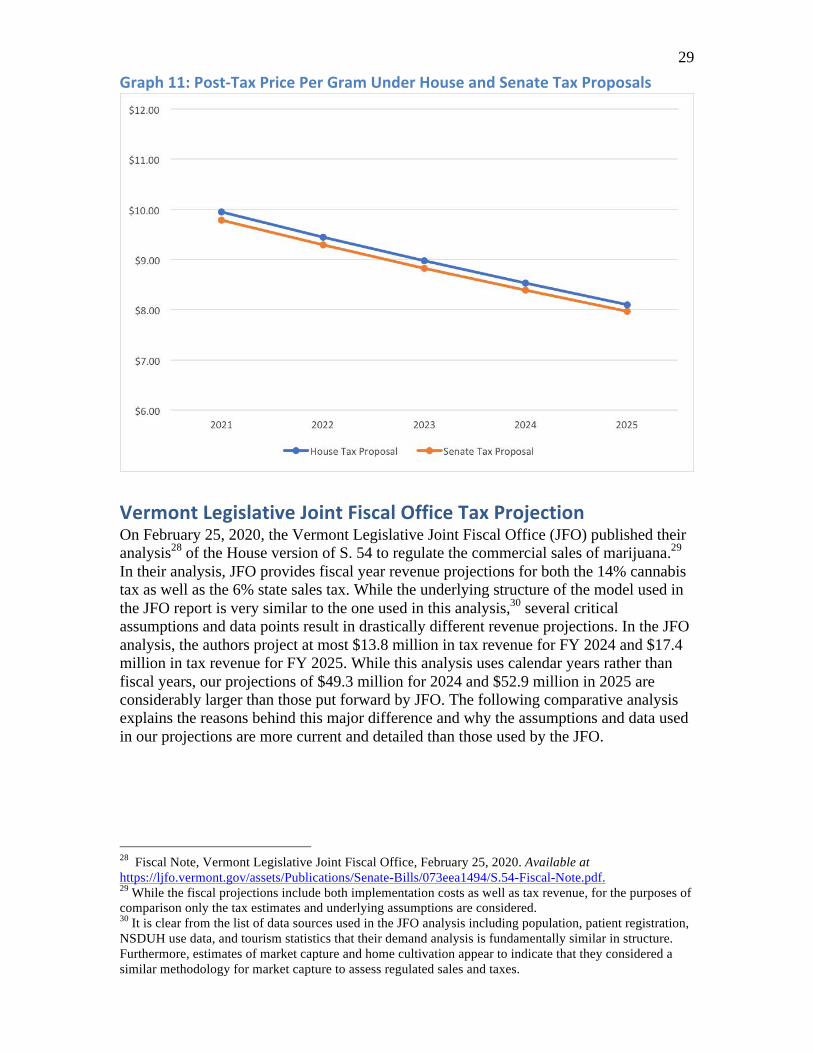
29 Graph11:Post-TaxPricePerGramUnderHouseandSenateTaxProposals
VermontLegislativeJointFiscalOfficeTaxProjectionOn February 25, 2020, the Vermont Legislative Joint Fiscal Office (JFO) published their analysis28 of the House version of S. 54 to regulate the commercial sales of marijuana.29 In their analysis, JFO provides fiscal year revenue projections for both the 14% cannabis tax as well as the 6% state sales tax. While the underlying structure of the model used in the JFO report is very similar to the one used in this analysis,30 several critical assumptions and data points result in drastically different revenue projections. In the JFO analysis, the authors project at most $13.8 million in tax revenue for FY 2024 and $17.4 million in tax revenue for FY 2025. While this analysis uses calendar years rather than fiscal years, our projections of $49.3 million for 2024 and $52.9 million in 2025 are considerably larger than those put forward by JFO. The following comparative analysis explains the reasons behind this major difference and why the assumptions and data used in our projections are more current and detailed than those used by the JFO.
28 Fiscal Note, Vermont Legislative Joint Fiscal Office, February 25, 2020. Available at https://ljfo.vermont.gov/assets/Publications/Senate-Bills/073eea1494/S.54-Fiscal-Note.pdf. 29 While the fiscal projections include both implementation costs as well as tax revenue, for the purposes of comparison only the tax estimates and underlying assumptions are considered. 30 It is clear from the list of data sources used in the JFO analysis including population, patient registration, NSDUH use data, and tourism statistics that their demand analysis is fundamentally similar in structure. Furthermore, estimates of market capture and home cultivation appear to indicate that they considered a similar methodology for market capture to assess regulated sales and taxes.
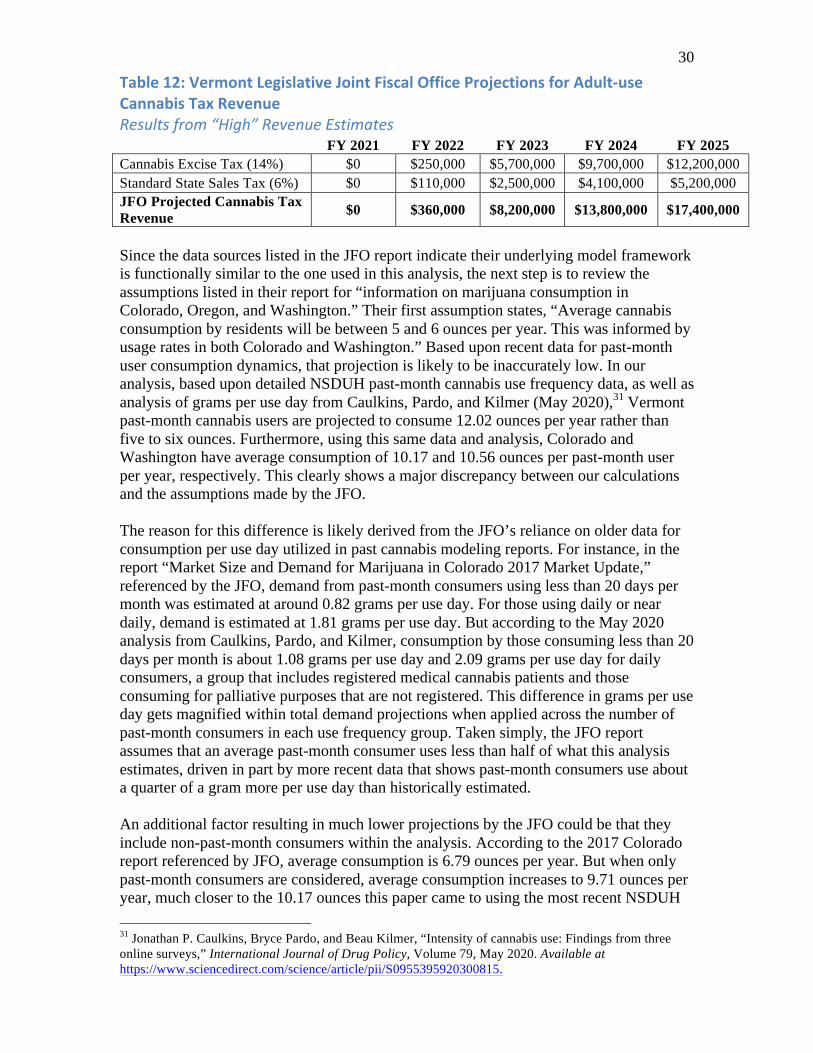
30 Table12:VermontLegislativeJointFiscalOfficeProjectionsforAdult-useCannabisTaxRevenue Resultsfrom“High”RevenueEstimates
FY 2021 FY 2022 FY 2023 FY 2024 FY 2025 Cannabis Excise Tax (14%) $0 $250,000 $5,700,000 $9,700,000 $12,200,000 Standard State Sales Tax (6%) $0 $110,000 $2,500,000 $4,100,000 $5,200,000 JFO Projected Cannabis Tax Revenue $0 $360,000 $8,200,000 $13,800,000 $17,400,000
Since the data sources listed in the JFO report indicate their underlying model framework is functionally similar to the one used in this analysis, the next step is to review the assumptions listed in their report for “information on marijuana consumption in Colorado, Oregon, and Washington.” Their first assumption states, “Average cannabis consumption by residents will be between 5 and 6 ounces per year. This was informed by usage rates in both Colorado and Washington.” Based upon recent data for past-month user consumption dynamics, that projection is likely to be inaccurately low. In our analysis, based upon detailed NSDUH past-month cannabis use frequency data, as well as analysis of grams per use day from Caulkins, Pardo, and Kilmer (May 2020),31 Vermont past-month cannabis users are projected to consume 12.02 ounces per year rather than five to six ounces. Furthermore, using this same data and analysis, Colorado and Washington have average consumption of 10.17 and 10.56 ounces per past-month user per year, respectively. This clearly shows a major discrepancy between our calculations and the assumptions made by the JFO. The reason for this difference is likely derived from the JFO’s reliance on older data for consumption per use day utilized in past cannabis modeling reports. For instance, in the report “Market Size and Demand for Marijuana in Colorado 2017 Market Update,” referenced by the JFO, demand from past-month consumers using less than 20 days per month was estimated at around 0.82 grams per use day. For those using daily or near daily, demand is estimated at 1.81 grams per use day. But according to the May 2020 analysis from Caulkins, Pardo, and Kilmer, consumption by those consuming less than 20 days per month is about 1.08 grams per use day and 2.09 grams per use day for daily consumers, a group that includes registered medical cannabis patients and those consuming for palliative purposes that are not registered. This difference in grams per use day gets magnified within total demand projections when applied across the number of past-month consumers in each use frequency group. Taken simply, the JFO report assumes that an average past-month consumer uses less than half of what this analysis estimates, driven in part by more recent data that shows past-month consumers use about a quarter of a gram more per use day than historically estimated. An additional factor resulting in much lower projections by the JFO could be that they include non-past-month consumers within the analysis. According to the 2017 Colorado report referenced by JFO, average consumption is 6.79 ounces per year. But when only past-month consumers are considered, average consumption increases to 9.71 ounces per year, much closer to the 10.17 ounces this paper came to using the most recent NSDUH 31 Jonathan P. Caulkins, Bryce Pardo, and Beau Kilmer, “Intensity of cannabis use: Findings from three online surveys,” International Journal of Drug Policy, Volume 79, May 2020. Available at https://www.sciencedirect.com/science/article/pii/S0955395920300815.
31 data and analysis for Colorado. According to the 2017 Colorado report, consumers who use less than once a month represent 30.23% of total consumers but just 0.37% of total consumption. Their demand represents less than half of one percent of total consumption but including these consumers within the analysis lowers average consumption per user by over 30%. With this extreme difference in demand across consumer populations, including less than once per month users into the analysis and then averaging per person consumption skews the entire projection in ways that are not truly representative. Since these less than once per month consumers account for such a small quantity of demand, and their consumption likely occurs when more regular consumers share a joint or bowl at a party, they have been excluded from this analysis. Beyond differences in past-month consumer demand, the JFO analysis includes price declines from Colorado and Oregon that are unlikely to occur in Vermont. The JFO reports states that Colorado observed a 62% decline in flower and 48% decline in concentrate prices from 2014 to 2017. Oregon average prices dropped almost $100 from $275 per ounce to $180 per ounce during the first year of legal sales. But a 20% to 35% annual decline for cannabis flower prices in Vermont is extremely unlikely as the Green Mountain State has a very different medical market and will likely have a very different adult-use market than Colorado or Oregon. Both western states had hundreds of medical cultivators and retailers by the time they opened adult-use sales. These were very competitive markets from cultivation through retail. Vermont only has a handful of medical establishments, and while additional stores and cultivation capacity will be licensed, the Green Mountain State does not have cities like Portland and Denver, which can support dozens of retail stores within a few square miles. This density of retail competition drives the price compression as consumers can easily travel to different stores for the best price. Once licensing stabilizes in Vermont, our model anticipates slower price declines in line with other new markets like Massachusetts, where retail licensing occurs slowly with greater local restrictions on storefront density. Finally, it is unclear whether the JFO report factored in demand from border consumers. Since population projections from neighboring states are not mentioned in the list of data sources, it appears that this consumer cohort was excluded. As detailed previously in this report, demand from these border consumers is significant for the Vermont market as there are almost twice as many consumers living within a short drive of Vermont than there are residing within the state itself. While regulated market capture is projected to be lower for border consumers than residents, this report estimates that border consumers will account for 26% of total demand in 2022, declining to just 13% as neighboring states begin to open their own regulated cannabis storefronts. Both the JFO report and this analysis include multiple assumptions that factor into total projected sales and tax revenue. Depending on the variable in question, these demand models can be very sensitive to slight changes. Just a few technical differences between assumptions for past-month consumer use frequency, average consumer demand, and prices can have an outsized effect on total sales and tax revenue. These differences in assumptions explain why the JFO’s projections are significantly lower than what we estimate in this report. It has less to do with our take on regulated market capture and more to do with the fundamental questions of how many potential consumers are in the market, how much they purchase, and at what price. By using older usage data and reducing average consumption with the inclusion of less than once per month consumers,
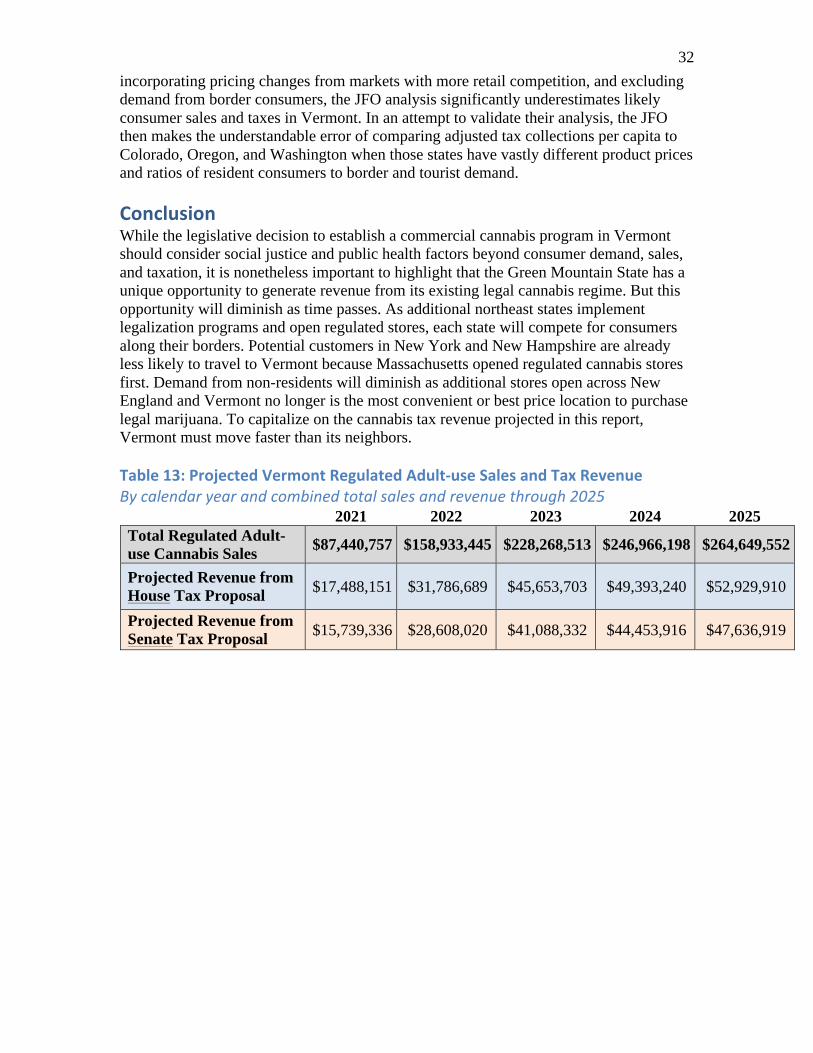
32 incorporating pricing changes from markets with more retail competition, and excluding demand from border consumers, the JFO analysis significantly underestimates likely consumer sales and taxes in Vermont. In an attempt to validate their analysis, the JFO then makes the understandable error of comparing adjusted tax collections per capita to Colorado, Oregon, and Washington when those states have vastly different product prices and ratios of resident consumers to border and tourist demand. ConclusionWhile the legislative decision to establish a commercial cannabis program in Vermont should consider social justice and public health factors beyond consumer demand, sales, and taxation, it is nonetheless important to highlight that the Green Mountain State has a unique opportunity to generate revenue from its existing legal cannabis regime. But this opportunity will diminish as time passes. As additional northeast states implement legalization programs and open regulated stores, each state will compete for consumers along their borders. Potential customers in New York and New Hampshire are already less likely to travel to Vermont because Massachusetts opened regulated cannabis stores first. Demand from non-residents will diminish as additional stores open across New England and Vermont no longer is the most convenient or best price location to purchase legal marijuana. To capitalize on the cannabis tax revenue projected in this report, Vermont must move faster than its neighbors. Table13:ProjectedVermontRegulatedAdult-useSalesandTaxRevenueBycalendaryearandcombinedtotalsalesandrevenuethrough2025 2021 2022 2023 2024 2025 Total Regulated Adult-use Cannabis Sales
$87,440,757 $158,933,445 $228,268,513 $246,966,198 $264,649,552
Projected Revenue from House Tax Proposal $17,488,151 $31,786,689 $45,653,703 $49,393,240 $52,929,910
Projected Revenue from Senate Tax Proposal $15,739,336 $28,608,020 $41,088,332 $44,453,916 $47,636,919
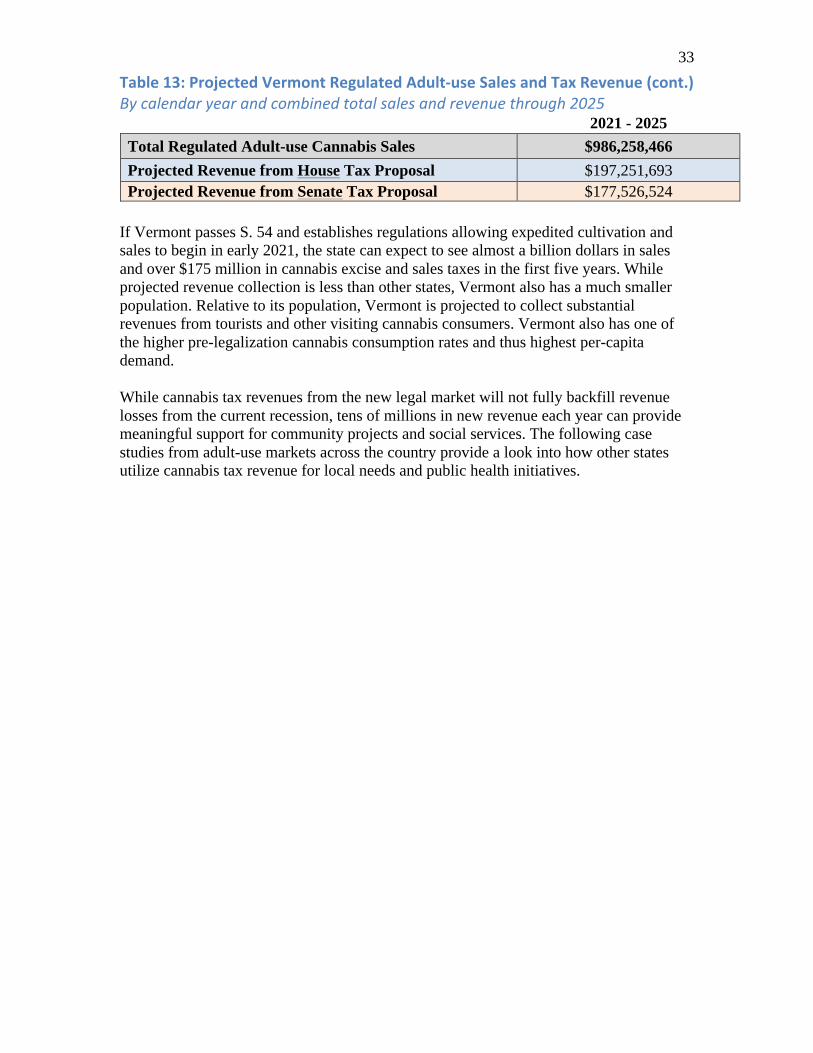
33 Table13:ProjectedVermontRegulatedAdult-useSalesandTaxRevenue(cont.)Bycalendaryearandcombinedtotalsalesandrevenuethrough2025 2021 - 2025 Total Regulated Adult-use Cannabis Sales $986,258,466 Projected Revenue from House Tax Proposal $197,251,693
Projected Revenue from Senate Tax Proposal $177,526,524
If Vermont passes S. 54 and establishes regulations allowing expedited cultivation and sales to begin in early 2021, the state can expect to see almost a billion dollars in sales and over $175 million in cannabis excise and sales taxes in the first five years. While projected revenue collection is less than other states, Vermont also has a much smaller population. Relative to its population, Vermont is projected to collect substantial revenues from tourists and other visiting cannabis consumers. Vermont also has one of the higher pre-legalization cannabis consumption rates and thus highest per-capita demand. While cannabis tax revenues from the new legal market will not fully backfill revenue losses from the current recession, tens of millions in new revenue each year can provide meaningful support for community projects and social services. The following case studies from adult-use markets across the country provide a look into how other states utilize cannabis tax revenue for local needs and public health initiatives.
34
CaseStudiesonUseofCannabisTaxRevenueinLocalCommunitiesTrinidad,Colorado:UsingCannabisRevenuestoHelpResidentsDuringCOVID-19Home to fewer than 10,000 residents, the city of Trinidad, Colorado is located on the Colorado-New Mexico border in Las Animas County. After generating $800,000 in tax revenue during the first year of retail sales — approximately 10% of the city’s general fund — Trinidad embraced cannabis business as a form of economic revitalization. In 2019, Trinidad allocated $2,450,500 in cannabis tax revenue to various city projects.32 Over the last five years, cannabis taxes in Trinidad have been allocated both for immediate reinvestments, such as the purchase of a new fire engine with a pump and the replacement of water pipes that were installed between 1890 and 1950,33 and long-term projects, including over $35,000 for upgrades to the Children’s Museum, $109,000 for the Trinidad Youth Club, and $62,000 for local events such as an art car parade, poetry event, and blues festival.34 The city, also known for the community’s dedication to downtown revival, has allocated $327,975 to Space to Create Commons, a project to create affordable creative sector workforce housing and workspace.35 Recently, Trinidad’s priority expenditures were modified to provide relief to a community navigating the economic downturn associated with COVID-19. In April 2020, the city council passed an emergency ordinance authorizing the implementation of Trinidad’s COVID-19 Emergency Assistance Program, which allocates first quarter 2020 revenues from the five percent local marijuana sales tax, totaling $536,000, to support local businesses and citizens impacted by the COVID-19 pandemic.36 To effectuate the program, the city allocated $500,000 of these funds in three separate tiers.37 Tier 1 was an allocation of $100,000 for critical agencies: $65,000 was allocated to Mt. San Rafael Hospital to cover utility bills for two months of operations, and $25,000 was allocated for government programs to offset costs incurred for staffing and transit to deliver Meals on Wheels and Care & Share food boxes to all parts of Las Animas County during local shutdown. The remaining $10,000 was provided to the Las Animas County Health Department Emergency Management programs. Tier 2 apportioned $300,000 to support locally owned businesses. Trinidad received 152 applications for business assistance, and with the help of marijuana tax revenues, the city
32 “2019 Marijuana Allocations,” City of Trinidad, Colorado. Available at https://www.trinidad.co.gov/2019-marijuana-allocations-2nd-quarter. 33 Ana Cabrera, Mallory Simon and Sara Weisfeldt, “Did pot money save small town from 'abyss of nothingness'?,” CNN Health, April 21, 2016. Available at https://www.cnn.com/2016/04/20/health/trinidad-colorado-small-town-marijuana/index.html. 34 “2018 Marijuana Allocations,” City of Trinidad, Colorado. Available at https://www.trinidad.co.gov/2018-marijuana-allocations. 35 “2019 Marijuana Allocations,” City of Trinidad, Colorado. Available at https://www.trinidad.co.gov/2019-marijuana-allocations-2nd-quarter. 36 “COVID-19 Emergency Business Assistance Program,” City of Trinidad, Colorado. Available at https://www.trinidad.co.gov/covid19businessrelief. 37 “2020 Marijuana Allocations,” City of Trinidad, Colorado. Available at https://www.trinidad.co.gov/2020MarijuanaAllocations.
35
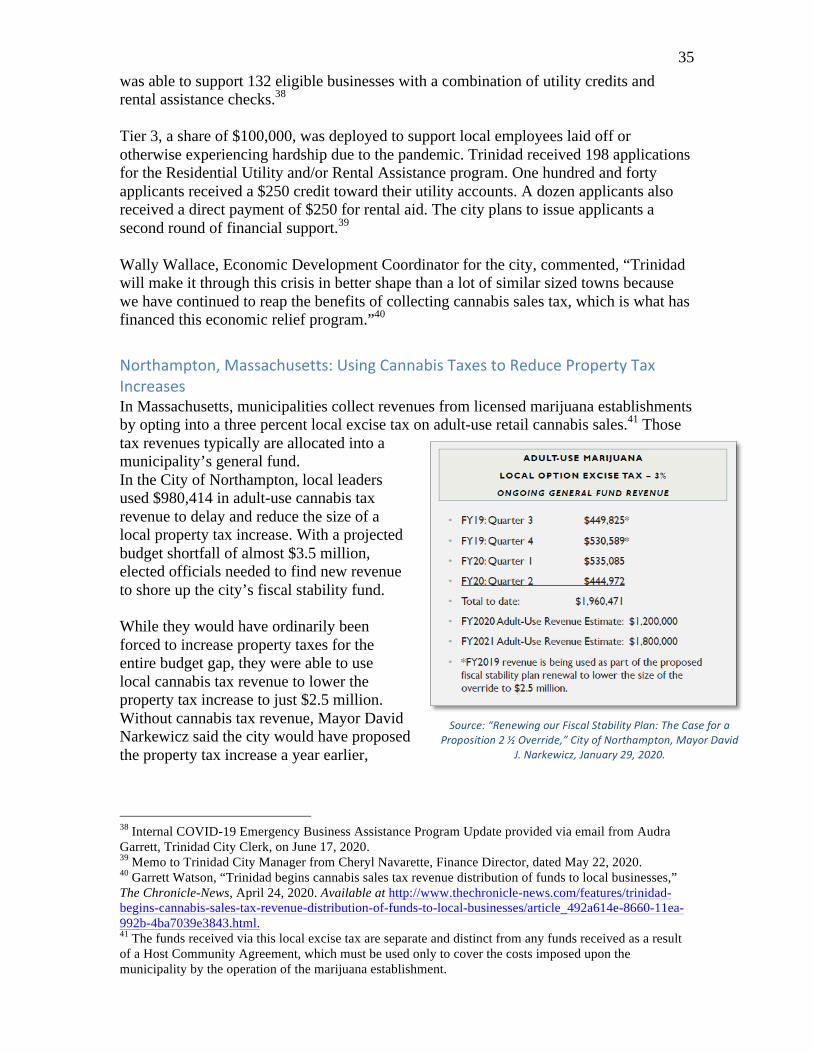
Source:“RenewingourFiscalStabilityPlan:TheCaseforaProposition2½Override,”CityofNorthampton,MayorDavid
J.Narkewicz,January29,2020.
was able to support 132 eligible businesses with a combination of utility credits and rental assistance checks.38 Tier 3, a share of $100,000, was deployed to support local employees laid off or otherwise experiencing hardship due to the pandemic. Trinidad received 198 applications for the Residential Utility and/or Rental Assistance program. One hundred and forty applicants received a $250 credit toward their utility accounts. A dozen applicants also received a direct payment of $250 for rental aid. The city plans to issue applicants a second round of financial support.39 Wally Wallace, Economic Development Coordinator for the city, commented, “Trinidad will make it through this crisis in better shape than a lot of similar sized towns because we have continued to reap the benefits of collecting cannabis sales tax, which is what has financed this economic relief program.”40Northampton,Massachusetts:UsingCannabisTaxestoReducePropertyTaxIncreasesIn Massachusetts, municipalities collect revenues from licensed marijuana establishments by opting into a three percent local excise tax on adult-use retail cannabis sales.41 Those tax revenues typically are allocated into a municipality’s general fund. In the City of Northampton, local leaders used $980,414 in adult-use cannabis tax revenue to delay and reduce the size of a local property tax increase. With a projected budget shortfall of almost $3.5 million, elected officials needed to find new revenue to shore up the city’s fiscal stability fund. While they would have ordinarily been forced to increase property taxes for the entire budget gap, they were able to use local cannabis tax revenue to lower the property tax increase to just $2.5 million. Without cannabis tax revenue, Mayor David Narkewicz said the city would have proposed the property tax increase a year earlier,
38 Internal COVID-19 Emergency Business Assistance Program Update provided via email from Audra Garrett, Trinidad City Clerk, on June 17, 2020. 39 Memo to Trinidad City Manager from Cheryl Navarette, Finance Director, dated May 22, 2020. 40 Garrett Watson, “Trinidad begins cannabis sales tax revenue distribution of funds to local businesses,” The Chronicle-News, April 24, 2020. Available at http://www.thechronicle-news.com/features/trinidad-begins-cannabis-sales-tax-revenue-distribution-of-funds-to-local-businesses/article_492a614e-8660-11ea-992b-4ba7039e3843.html. 41 The funds received via this local excise tax are separate and distinct from any funds received as a result of a Host Community Agreement, which must be used only to cover the costs imposed upon the municipality by the operation of the marijuana establishment.
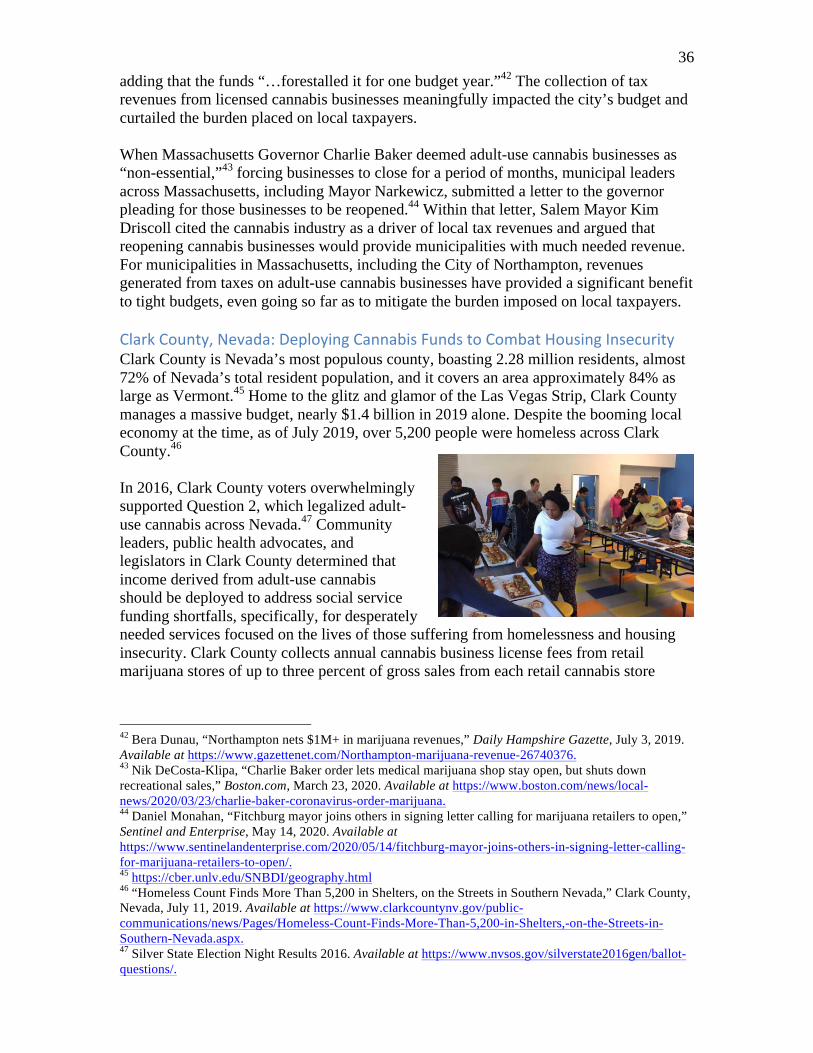
36 adding that the funds “…forestalled it for one budget year.”42 The collection of tax revenues from licensed cannabis businesses meaningfully impacted the city’s budget and curtailed the burden placed on local taxpayers. When Massachusetts Governor Charlie Baker deemed adult-use cannabis businesses as “non-essential,”43 forcing businesses to close for a period of months, municipal leaders across Massachusetts, including Mayor Narkewicz, submitted a letter to the governor pleading for those businesses to be reopened.44 Within that letter, Salem Mayor Kim Driscoll cited the cannabis industry as a driver of local tax revenues and argued that reopening cannabis businesses would provide municipalities with much needed revenue. For municipalities in Massachusetts, including the City of Northampton, revenues generated from taxes on adult-use cannabis businesses have provided a significant benefit to tight budgets, even going so far as to mitigate the burden imposed on local taxpayers. ClarkCounty,Nevada:DeployingCannabisFundstoCombatHousingInsecurityClark County is Nevada’s most populous county, boasting 2.28 million residents, almost 72% of Nevada’s total resident population, and it covers an area approximately 84% as large as Vermont.45 Home to the glitz and glamor of the Las Vegas Strip, Clark County manages a massive budget, nearly $1.4 billion in 2019 alone. Despite the booming local economy at the time, as of July 2019, over 5,200 people were homeless across Clark County.46 In 2016, Clark County voters overwhelmingly supported Question 2, which legalized adult-use cannabis across Nevada.47 Community leaders, public health advocates, and legislators in Clark County determined that income derived from adult-use cannabis should be deployed to address social service funding shortfalls, specifically, for desperately needed services focused on the lives of those suffering from homelessness and housing insecurity. Clark County collects annual cannabis business license fees from retail marijuana stores of up to three percent of gross sales from each retail cannabis store
42 Bera Dunau, “Northampton nets $1M+ in marijuana revenues,” Daily Hampshire Gazette, July 3, 2019. Available at https://www.gazettenet.com/Northampton-marijuana-revenue-26740376. 43 Nik DeCosta-Klipa, “Charlie Baker order lets medical marijuana shop stay open, but shuts down recreational sales,” Boston.com, March 23, 2020. Available at https://www.boston.com/news/local-news/2020/03/23/charlie-baker-coronavirus-order-marijuana. 44 Daniel Monahan, “Fitchburg mayor joins others in signing letter calling for marijuana retailers to open,” Sentinel and Enterprise, May 14, 2020. Available at https://www.sentinelandenterprise.com/2020/05/14/fitchburg-mayor-joins-others-in-signing-letter-calling-for-marijuana-retailers-to-open/. 45 https://cber.unlv.edu/SNBDI/geography.html 46 “Homeless Count Finds More Than 5,200 in Shelters, on the Streets in Southern Nevada,” Clark County, Nevada, July 11, 2019. Available at https://www.clarkcountynv.gov/public-communications/news/Pages/Homeless-Count-Finds-More-Than-5,200-in-Shelters,-on-the-Streets-in-Southern-Nevada.aspx. 47 Silver State Election Night Results 2016. Available at https://www.nvsos.gov/silverstate2016gen/ballot-questions/.
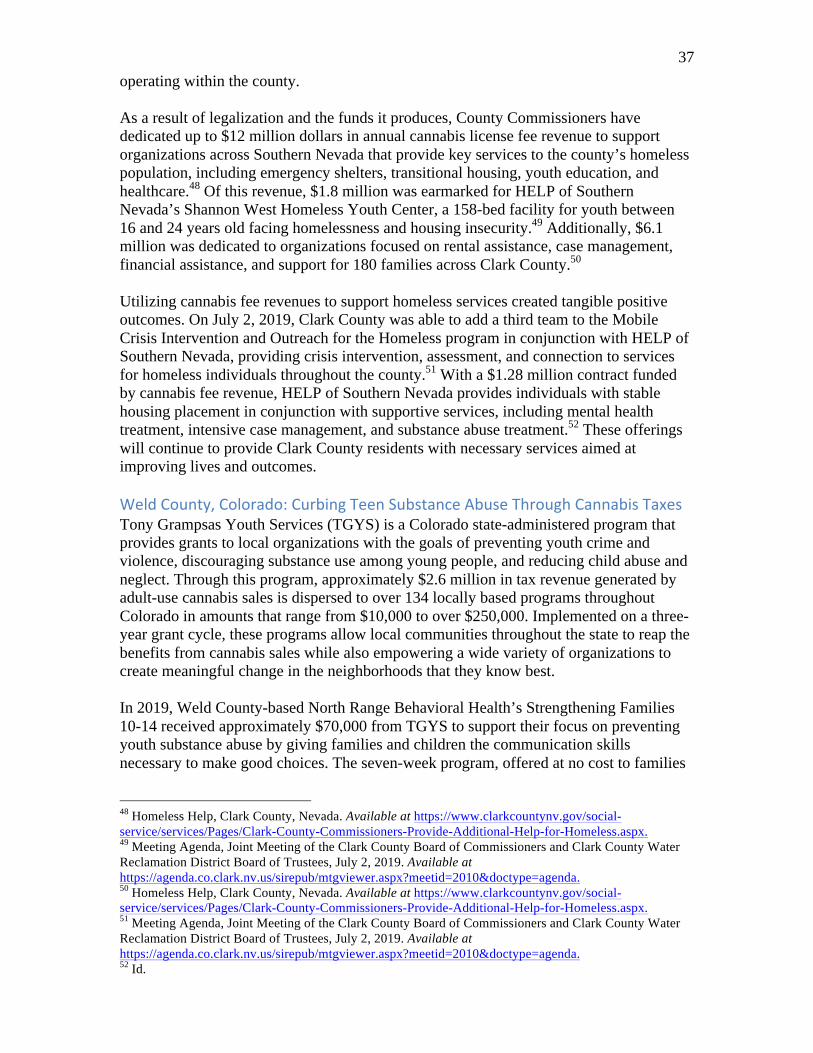
37 operating within the county. As a result of legalization and the funds it produces, County Commissioners have dedicated up to $12 million dollars in annual cannabis license fee revenue to support organizations across Southern Nevada that provide key services to the county’s homeless population, including emergency shelters, transitional housing, youth education, and healthcare.48 Of this revenue, $1.8 million was earmarked for HELP of Southern Nevada’s Shannon West Homeless Youth Center, a 158-bed facility for youth between 16 and 24 years old facing homelessness and housing insecurity.49 Additionally, $6.1 million was dedicated to organizations focused on rental assistance, case management, financial assistance, and support for 180 families across Clark County.50 Utilizing cannabis fee revenues to support homeless services created tangible positive outcomes. On July 2, 2019, Clark County was able to add a third team to the Mobile Crisis Intervention and Outreach for the Homeless program in conjunction with HELP of Southern Nevada, providing crisis intervention, assessment, and connection to services for homeless individuals throughout the county.51 With a $1.28 million contract funded by cannabis fee revenue, HELP of Southern Nevada provides individuals with stable housing placement in conjunction with supportive services, including mental health treatment, intensive case management, and substance abuse treatment.52 These offerings will continue to provide Clark County residents with necessary services aimed at improving lives and outcomes. WeldCounty,Colorado:CurbingTeenSubstanceAbuseThroughCannabisTaxes Tony Grampsas Youth Services (TGYS) is a Colorado state-administered program that provides grants to local organizations with the goals of preventing youth crime and violence, discouraging substance use among young people, and reducing child abuse and neglect. Through this program, approximately $2.6 million in tax revenue generated by adult-use cannabis sales is dispersed to over 134 locally based programs throughout Colorado in amounts that range from $10,000 to over $250,000. Implemented on a three-year grant cycle, these programs allow local communities throughout the state to reap the benefits from cannabis sales while also empowering a wide variety of organizations to create meaningful change in the neighborhoods that they know best. In 2019, Weld County-based North Range Behavioral Health’s Strengthening Families 10-14 received approximately $70,000 from TGYS to support their focus on preventing youth substance abuse by giving families and children the communication skills necessary to make good choices. The seven-week program, offered at no cost to families
48 Homeless Help, Clark County, Nevada. Available at https://www.clarkcountynv.gov/social-service/services/Pages/Clark-County-Commissioners-Provide-Additional-Help-for-Homeless.aspx. 49 Meeting Agenda, Joint Meeting of the Clark County Board of Commissioners and Clark County Water Reclamation District Board of Trustees, July 2, 2019. Available at https://agenda.co.clark.nv.us/sirepub/mtgviewer.aspx?meetid=2010&doctype=agenda. 50 Homeless Help, Clark County, Nevada. Available at https://www.clarkcountynv.gov/social-service/services/Pages/Clark-County-Commissioners-Provide-Additional-Help-for-Homeless.aspx. 51 Meeting Agenda, Joint Meeting of the Clark County Board of Commissioners and Clark County Water Reclamation District Board of Trustees, July 2, 2019. Available at https://agenda.co.clark.nv.us/sirepub/mtgviewer.aspx?meetid=2010&doctype=agenda. 52 Id.
38 in both English and Spanish, has sessions designed specifically for parents, children, and families. Additionally, money from the TGYS helps ensure that North Range Behavioral Health is also able to offer onsite meals and additional childcare to program participants. For years, Weld County, Colorado was recognized as one of the state’s worst areas for underage drinking.53 Money from adult-use cannabis sales has allowed the county to directly address a problem facing its community, and as a result of this and other efforts, the county now has a rate of youth alcohol consumption that is below the state average.54 TGYS funding also provided ample support to ‘The House’ in Grand Junction, Colorado, which provides youth in crisis with a dense web of services that includes connection with positive adults, intensive case management, peer activity groups, innovative mental health services, educational support, formal mentorships, peer counselors, and housing support. Deriving approximately $100,000 of its funding from cannabis tax revenue, The House was the first organization on Colorado’s Western Slope that was catered specifically to teens who are in crisis and need somewhere to stay, whether it is to escape an abusive home, get off drugs, or search for their family. Funding from retail cannabis sales has helped the program expand from a single 10-bedroom building to over a half dozen facilities committed to helping the area’s almost 300 homeless children.
53 Kelly Ragan, “Strengthening Families program helps bring peace to Weld County families,” Greeley Tribune, January 7, 2018. Available at https://www.greeleytribune.com/2018/01/07/strengthening-families-program-helps-bring-peace-to-weld-county-families/. 54 Healthy Kids Colorado Survey data tables and reports, 2017 high school data, Colorado Department of Public Health & Environment. Available at https://www.colorado.gov/pacific/cdphe/healthy-kids-colorado-survey-data-tables-and-reports.