Embed Size (px)
Citation preview

Meeting Agenda available at http://www.goldcoasthealthplan.org
Ventura County MediCal Managed Care Commission (VCMMCC) dba Gold Coast Health Plan (GCHP)
Regular Meeting Monday, June 27, 2016, 3:00 p.m. County of Ventura Government Center – Hall of Administration Lower Plaza Assembly Room, 800 South Victoria Avenue, Ventura, CA 93009
AGENDA CALL TO ORDER PLEDGE OF ALLEGIANCE ROLL CALL PUBLIC COMMENT The public has the opportunity to address Ventura County Medi-Cal Managed Care Commission (VCMMCC) doing business as Gold Coast Health Plan (GCHP) on the agenda. Persons wishing to address VCMMCC should complete and submit a Speaker Card. Persons wishing to address VCMMCC are limited to three (3) minutes. Comments regarding items not on the agenda must be within the subject matter jurisdiction of the Commission. PRESENTATIONS 1. Community Partner Collaborative Presentation Staff: Vickie Lemmon, Director of Health Services CONSENT CALENDAR 2. Approval of Ventura County MediCal Managed Care Commission Meeting Regular
Minutes of April 25, 2016. Staff: Tracy Oehler, Clerk of the Board RECOMMENDATION: Approve the minutes.
Page 1 of 136
3. Approval of Ventura County MediCal Managed Care Commission Meeting Regular Minutes of May 23, 2016.
Staff: Tracy Oehler, Clerk of the Board RECOMMENDATION: Approve the minutes. FORMAL ACTION ITEMS 4. April 2016 Fiscal Year to Date Financials Staff: Patricia Mowlavi, Chief Financial Officer RECOMMENDATION: Accept and file April 2016 Fiscal Year to Date Financials. 5. State of California Department of Health Care Services Contract Amendment 22 Staff: Dale Villani, Chief Executive Officer RECOMMENDATION: Approve and authorize the Chief Executive Officer to execute
Amendment 22 to the Department of Health Care Services Contract, adjusting the Adult Expansion population 2014/2015 capitation rates and revising the Medical Loss Ratio calculation language.
6. Quality Improvement Committee 2016 First Quarter Report Staff: C. Albert Reeves, M.D., Chief Medical Officer RECOMMENDATION: Accept and file the Quality Improvement Committee 2016 First
Quarter Report. 7. Pay-for-Performance Program to Improve Children’s Access to Care (ARCH) Staff: C. Albert Reeves, M.D., Chief Medical Officer RECOMMENDATION: Approve the Pay-for-Performance Program to Improve Children’s
Access to Care.
Page 2 of 136
REPORTS 8. Chief Executive Officer (CEO) Update RECOMMENDATION: Accept and file the report. 9. Chief Operations Officer (COO) Update RECOMMENDATION: Accept and file the report. 10. Health Services Update RECOMMENDATION: Accept and file the report. CLOSED SESSION 11. PUBLIC EMPLOYEE APPOINTMENT Chief Diversity Officer 12. CONFERENCE WITH LABOR NEGOTIATORS Agency designated representatives: Scott Campbell, General Counsel Unrepresented employee: Chief Diversity Officer 13. CONFERENCE WITH LEGAL COUNSEL – ANTICIPATED LITIGATION Significant exposure to litigation pursuant to paragraph (2) of subdivision (d) of Section
54956.9: One Case
14. CONFERENCE WITH LEGAL COUNSEL – EXISTING LITIGATION Paragraph (1) of subdivision (d) of Section 54956.9 Clinicas Del Camino Real Inc. v. Ventura County Medi-Cal Managed Care Commission
dba Gold Coast Health Plan, Ventura County Superior Court Case No. 56-2014-00456149-CU-BC-VTA
COMMENTS FROM COMMISSIONERS ADJOURNMENT Unless otherwise determined by the Commission, the next regular meeting will be held on July 25, 2016, at Gold Coast Health Plan at 711 E. Daily Drive, Suite 106, Camarillo, CA 93010. _________________________________________________________________________________________
Page 3 of 136
Administrative Reports relating to this agenda are available at 711 East Daily Drive, Suite #106, Camarillo, California, during normal business hours and on http://goldcoasthealthplan.org. Materials related to an agenda item submitted to the Commission after distribution of the agenda packet are available for public review during normal business hours at the office of the Clerk of the Board. In compliance with the Americans with Disabilities Act, if you need assistance to participate in this meeting, please contact (805) 437-5509. Notification for accommodation must be made by the Thursday prior to the meeting by 3 p.m. to enable the Clerk of the Board to make reasonable arrangements for accessibility to this meeting. This agenda was posted on Tuesday, June 21, 2016, at 5:00 p.m. at the Gold Coast Health Plan Notice Board and on its website.
Page 4 of 136

AGENDA ITEM NO. 1 TO: Gold Coast Health Plan Commission FROM: Vickie Lemmon, Director of Health Services DATE: June 27, 2016 SUBJECT: Community Partner Collaboration Presentation: Identify Care Gaps, Create
Efficiencies, and Drive Results
VERBAL PRESENTATION
Page 5 of 136Back to Agenda
Gold Coast Health Plan Care Management
Collaborates with Community Partners to:
Identify Care Gaps,
Create Efficiencies &
Drive Results
Vickie Lemmon, RN, MSN, PHNDirector Health Services
Page 6 of 136Back to Agenda

Community Partners:California Children Services
(CCS)
Child Health Disability and Prevention program (CHDP)
Tri-Counties Regional Center (TCRC)
Help Me Grow (funded by First Five)
Public Health-Children’s Health Promotion
Public Health Nursing Maternal Child Health
Public Health Women Infants and Children (WIC)
VC-PACTPact between VC Agencies to promote the continuum of care for children with special health care needs. This is a California Community Collaborative (5Cs)
funded by Lucile Packard Foundation for Children’s Health currently administered by VC Public Health
2
Page 7 of 136Back to Agenda

Presenting today:Vickie Lemmon, RN, MSN, PHN Director of Health Services GCHP
Dee Johnston, RN, BA, CCMManager of Care Management Services GCHP
Patty ChanPH Division Manager, Children's Medical Services Director, Ventura County Public Health
Evy CriswellCHDP Deputy Director, PHN Manager, Children’s Health Programs
Pauline PreciadoCHDP Program Coordinator, Ventura County Public Health
Linda Bays, MPH, MCHESStaff/Services Manager, Ventura County Public Health
Seleta DobroskySupervising PHN, Ventura County Public Health
Cindy ReedHelp Me Grow Ventura County, Program Coordinator
Myra Medina, DPT, PH-CCSupervisor, Conejo Medical Therapy Unit, CCSProject Coordinator, VC-Pact
3
Page 8 of 136Back to Agenda
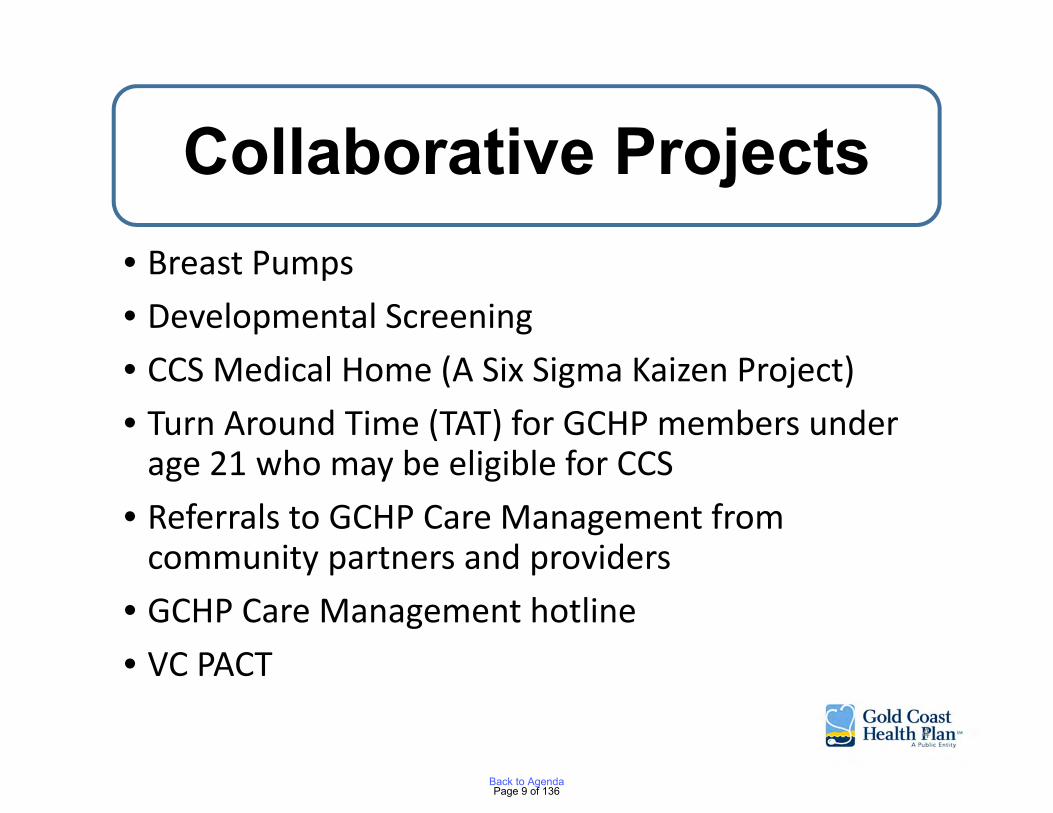
Collaborative Projects• Breast Pumps• Developmental Screening• CCS Medical Home (A Six Sigma Kaizen Project)• Turn Around Time (TAT) for GCHP members under age 21 who may be eligible for CCS
• Referrals to GCHP Care Management from community partners and providers
• GCHP Care Management hotline• VC PACT
4
Page 9 of 136Back to Agenda
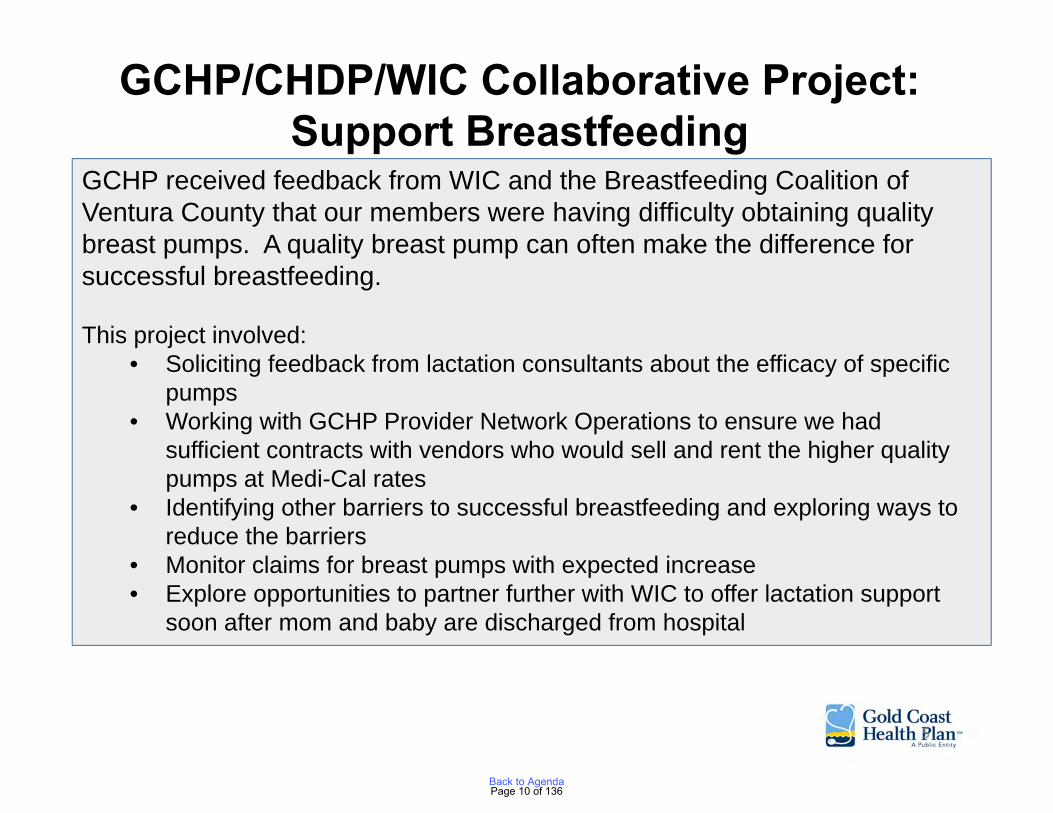
GCHP received feedback from WIC and the Breastfeeding Coalition of Ventura County that our members were having difficulty obtaining quality breast pumps. A quality breast pump can often make the difference for successful breastfeeding.
This project involved:• Soliciting feedback from lactation consultants about the efficacy of specific
pumps • Working with GCHP Provider Network Operations to ensure we had
sufficient contracts with vendors who would sell and rent the higher quality pumps at Medi-Cal rates
• Identifying other barriers to successful breastfeeding and exploring ways to reduce the barriers
• Monitor claims for breast pumps with expected increase• Explore opportunities to partner further with WIC to offer lactation support
soon after mom and baby are discharged from hospital
GCHP/CHDP/WIC Collaborative Project:Support Breastfeeding
5
Page 10 of 136Back to Agenda

Measure:Claims Count
Results
GCHP/CHDP/WIC Collaborative Project:Breast Pumps
Lost a vendor that would sell the
quality pump at Medi‐Cal
rate
6
Page 11 of 136Back to Agenda
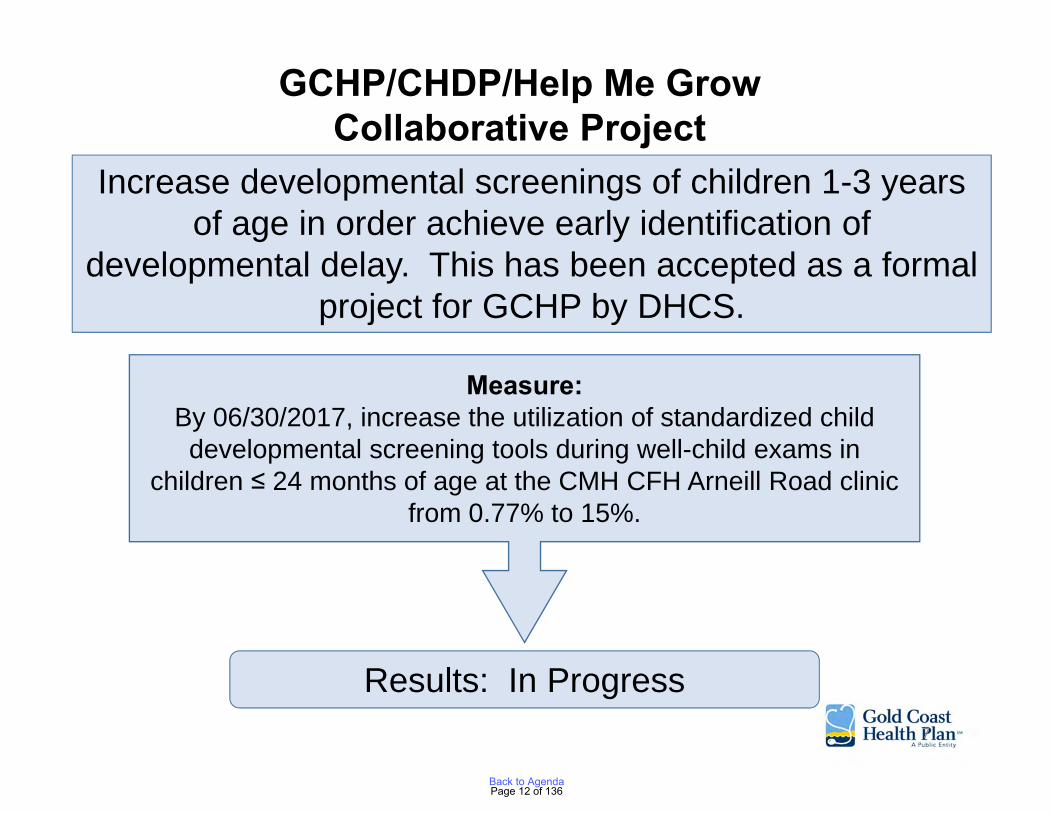
Increase developmental screenings of children 1-3 years of age in order achieve early identification of
developmental delay. This has been accepted as a formal project for GCHP by DHCS.
GCHP/CHDP/Help Me Grow Collaborative Project
Results: In Progress
Measure:By 06/30/2017, increase the utilization of standardized child developmental screening tools during well-child exams in
children ≤ 24 months of age at the CMH CFH Arneill Road clinic from 0.77% to 15%.
7
Page 12 of 136Back to Agenda
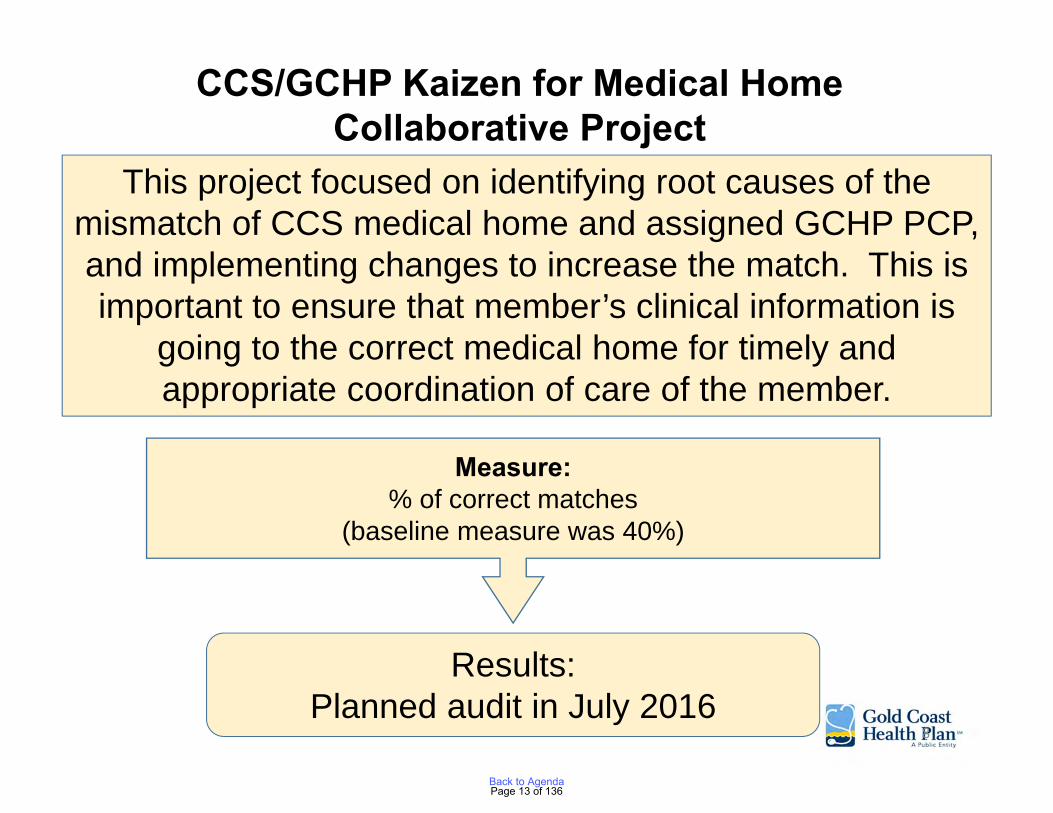
This project focused on identifying root causes of the mismatch of CCS medical home and assigned GCHP PCP, and implementing changes to increase the match. This is important to ensure that member’s clinical information is
going to the correct medical home for timely and appropriate coordination of care of the member.
CCS/GCHP Kaizen for Medical Home Collaborative Project
Results:Planned audit in July 2016
Measure:% of correct matches
(baseline measure was 40%)
8
Page 13 of 136Back to Agenda
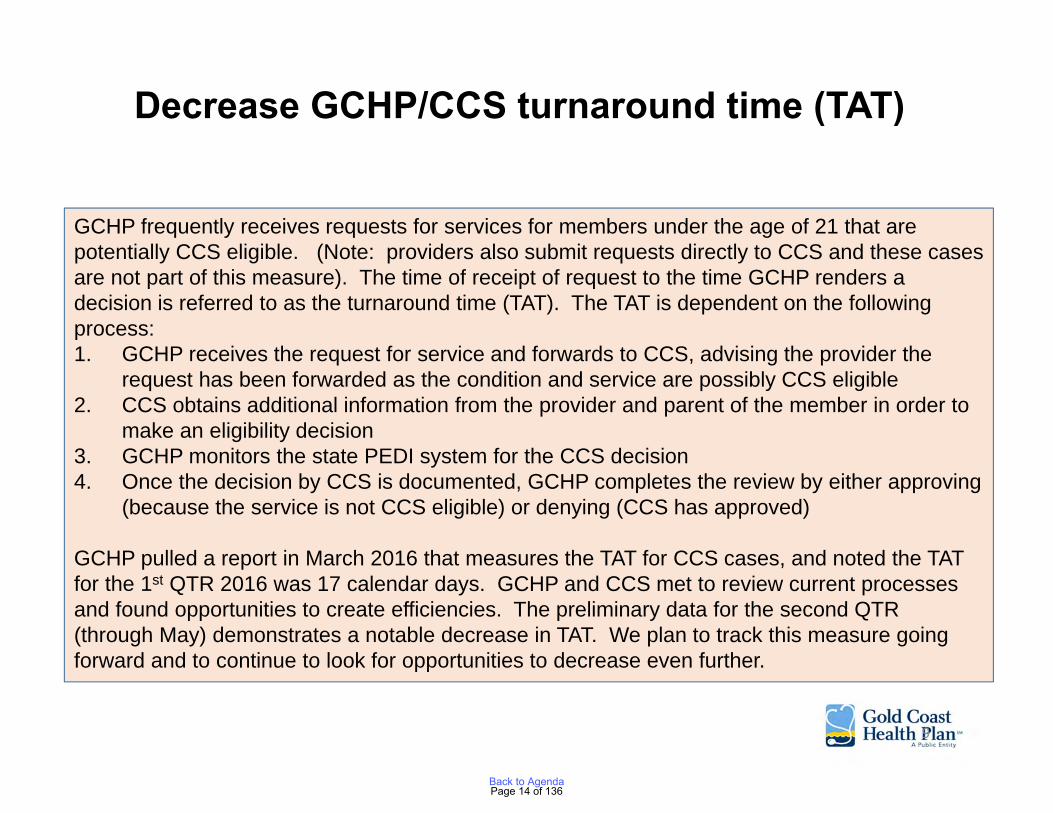
GCHP frequently receives requests for services for members under the age of 21 that are potentially CCS eligible. (Note: providers also submit requests directly to CCS and these cases are not part of this measure). The time of receipt of request to the time GCHP renders a decision is referred to as the turnaround time (TAT). The TAT is dependent on the following process:1. GCHP receives the request for service and forwards to CCS, advising the provider the
request has been forwarded as the condition and service are possibly CCS eligible 2. CCS obtains additional information from the provider and parent of the member in order to
make an eligibility decision3. GCHP monitors the state PEDI system for the CCS decision4. Once the decision by CCS is documented, GCHP completes the review by either approving
(because the service is not CCS eligible) or denying (CCS has approved)
GCHP pulled a report in March 2016 that measures the TAT for CCS cases, and noted the TAT for the 1st QTR 2016 was 17 calendar days. GCHP and CCS met to review current processes and found opportunities to create efficiencies. The preliminary data for the second QTR (through May) demonstrates a notable decrease in TAT. We plan to track this measure going forward and to continue to look for opportunities to decrease even further.
Decrease GCHP/CCS turnaround time (TAT)
9
Page 14 of 136Back to Agenda

Improve GCHP/CCS turnaround time (TAT)
Results:Measure:TAT
What we changed:• The process is most efficient
when the provider submits directly to CCS (not GCHP)
• However, if the provider does submit to GCHP first, it is more efficient for GCHP to forward the request and clinical information to CCS rather than asking the provider to re-fax
• GCHP added a face sheet when faxing the request to CCS that includes information required for CCS to process the request
• Both GCHP and CCS established a clinical liaison to communicate daily and as needed on urgent and expedited requests A 35% reduction in TAT
10
Page 15 of 136Back to Agenda

It is well established that care management can improve member health, decrease hospital readmissions, and reduce ER visits. In an effort to market our services we:• Provided education to community partners about GCHP CM and
invited community partners to present their programs to GCHP CM.
• Increased our collaborative meetings with the regional center (TCRC) to monthly in order to case conference more frequently on mutual members
• Visited providers to explain our care management program and how to do referrals
• Submitted articles with every provider newsletter highlighting CM services
• Partnered with member services and attended the Community Advisory Committee to provide information
Increase referrals to GCHP Care Management (CM)Process Improvement
11
Page 16 of 136Back to Agenda
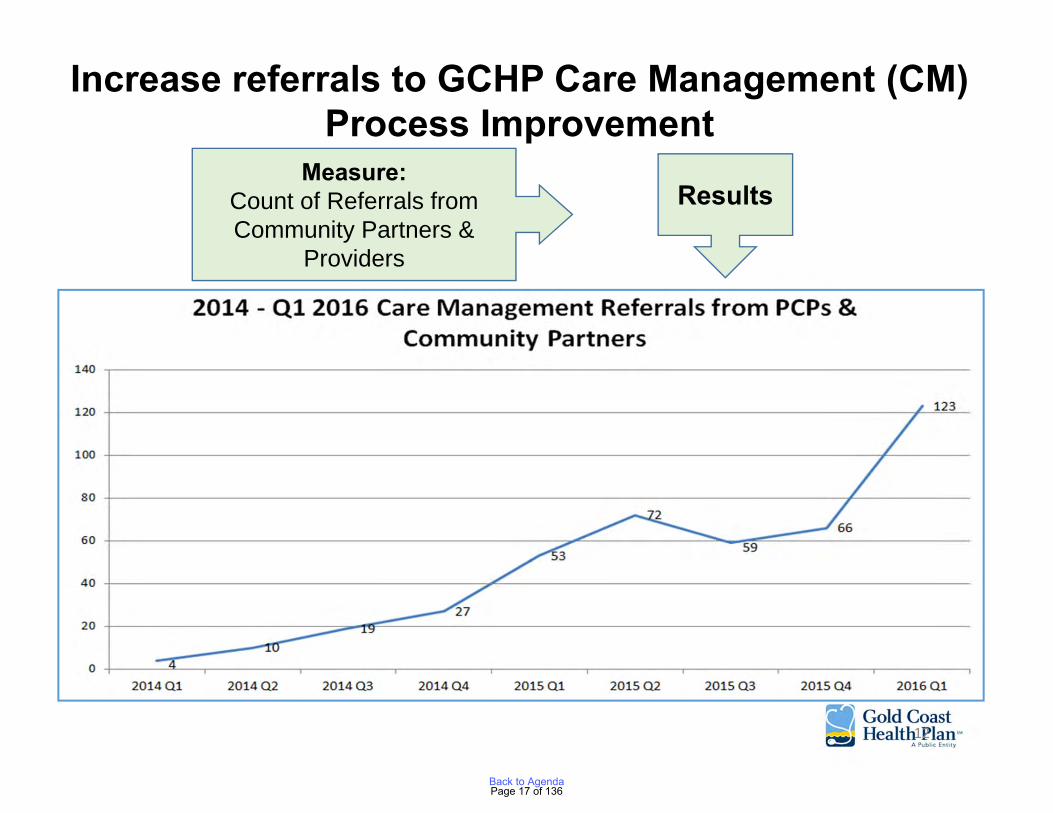
Measure:Count of Referrals from Community Partners &
Providers
Results
Increase referrals to GCHP Care Management (CM)Process Improvement
12
Page 17 of 136Back to Agenda
Public Health (PH) Nursing Collaboration
PH nurses (PHNs) in the field have face to face contact with members in our community, and offer programs that GCHP members benefit from. We established quarterly meetings with the PHNs to explain our services and to learn about the PH programs offered to our members. This shared knowledge helps GCHP case manage our members better, and provides the field nurses with knowledge of how to refer to GCHP CM. Additionally, based on feedback from the PHNs, GCHP opened a phone line dedicated to referrals coming from our community partners.
13
Page 18 of 136Back to Agenda
A pact between Ventura County Agencies to promote the continuum of care for children with special health care needs.
• A California Community Care Coordination Collaborative (5Cs) funded by Lucile Packard Foundation for Children’s Health currently administered by Ventura County Public Health (VCPH).
• This project is part of a national initiative supported by the Health Resources and Services Administration (HRSA) and the Federal Maternal Child Health Bureau (MCHB).
• The VC-Pact coalition serves as a resource to work on system gaps in services for Children with Special Health Care Needs (CSHCN) and particularly addresses family strengths
• Framework: Five Protective Factors
VC-PACT
14
Page 19 of 136Back to Agenda

1. Increase awareness of programs in the county with key contacts to assist in appropriate and timely referral.
2. Improve continuum of care by providing additional care coordination through case reviews to elicit system change
VC PACT GOALS:
Gold Coast Health Plan supports the Strengthening Families and the 5 Protective Factors.
• As the Medi-Cal managed care plan for Ventura County, we also serve many of the children with special care needs.
• Working collaboratively with the many programs and agencies in Ventura County that serve these children will result in greater efficiency and improved health outcomes as we reduce duplication of effort through enhanced communication.
15
Page 20 of 136Back to Agenda

Summary
• GCHP Care Management is committed to partnering with other agencies that serve our members
• We are committed to helping our providers with the coordination of care for their patients, often involving more than one agency
• We are committed to helping our members attain needed services that ultimately help them regain their optimal level of health
16
Page 21 of 136Back to Agenda

Member Story # 1
This member lost her job in July of 2015. She lived in her car for a while until a local church helped her find a room with an elderly lady. She is still searching for a job and struggling to get back on her feet. Both CM and disease management are helping her. She was informed at her doctor’s office that she had diabetes and stated she left terrified and not understanding what it meant or what to do.
“Then Blanca Robles at Gold Coast Health Plan told me about you (the CM and DM nurses). That was one of the best things that has ever happened for me!
When we spoke, you took the time to fully explain what being Diabetic meant. You explained the medications and helped me understand the importance of taking them at the same time and 12 hours between. You told me about nutrition, meal planning and portion control. I am no longer scared because you gave me the tools to handle my Diabetes.
You are so patient, caring and kind. You took the time to answer all of my questions and never made me feel rushed. You make me feel valued as a person and I have not felt valued in a very long time.
I am so grateful that you are in my life, so thankful that you are my Diabetes Coach!”
17
Page 22 of 136Back to Agenda
Member Story # 2
Member is a 62yo woman who is a retired attorney and was assistant district attorney in Hawaii, and retired Law professor.
The member has a history of squamous cell esophageal cancer. She is receiving palliative chemotherapy for her cancer. She has recently lost all of her vision in one eye and mostly sees black floaters in the other. She struggles with bipolar disorder, hypothyroidism, anxiety and depression, panic attacks, irregular heartbeats, and DJD. She currently has sepsis and is on IV home medication via a PICC line. Member states she needs assistance to clean and maintain her home and is unable to stand.
The RNCM has successfully assisted the member in finding a clinical trial. The SWCM has reached out to the Action Foundation a volunteer agency who assists in locating private individuals willing to donate their time and services to others in need. A group of women in the community who own house cleaning services have gotten together and collectively donate their services to individuals with a cancer diagnosis. The cleaning crew is scheduled to go to the member’s home for a full day and do a deep cleaning of the entire house. When the member was called she began to cry and said it was the best day of her life. I never expected this, it is a wonderful gift. She was overjoyed at the thought of having a clean home something that she has not been able to do for herself in many months.
18
Page 23 of 136Back to Agenda
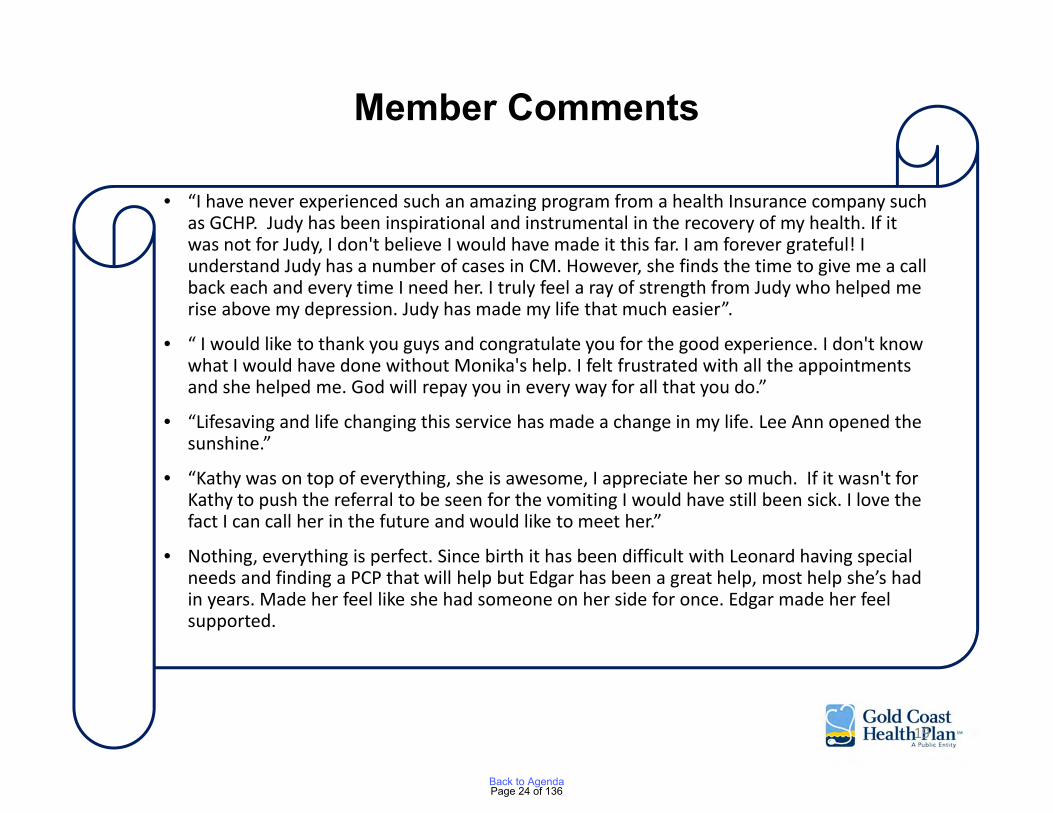
Member Comments
• “I have never experienced such an amazing program from a health Insurance company such as GCHP. Judy has been inspirational and instrumental in the recovery of my health. If it was not for Judy, I don't believe I would have made it this far. I am forever grateful! I understand Judy has a number of cases in CM. However, she finds the time to give me a call back each and every time I need her. I truly feel a ray of strength from Judy who helped me rise above my depression. Judy has made my life that much easier”.
• “ I would like to thank you guys and congratulate you for the good experience. I don't know what I would have done without Monika's help. I felt frustrated with all the appointments and she helped me. God will repay you in every way for all that you do.”
• “Lifesaving and life changing this service has made a change in my life. Lee Ann opened the sunshine.”
• “Kathy was on top of everything, she is awesome, I appreciate her so much. If it wasn't for Kathy to push the referral to be seen for the vomiting I would have still been sick. I love the fact I can call her in the future and would like to meet her.”
• Nothing, everything is perfect. Since birth it has been difficult with Leonard having special needs and finding a PCP that will help but Edgar has been a great help, most help she’s had in years. Made her feel like she had someone on her side for once. Edgar made her feel supported.
19
Page 24 of 136Back to Agenda
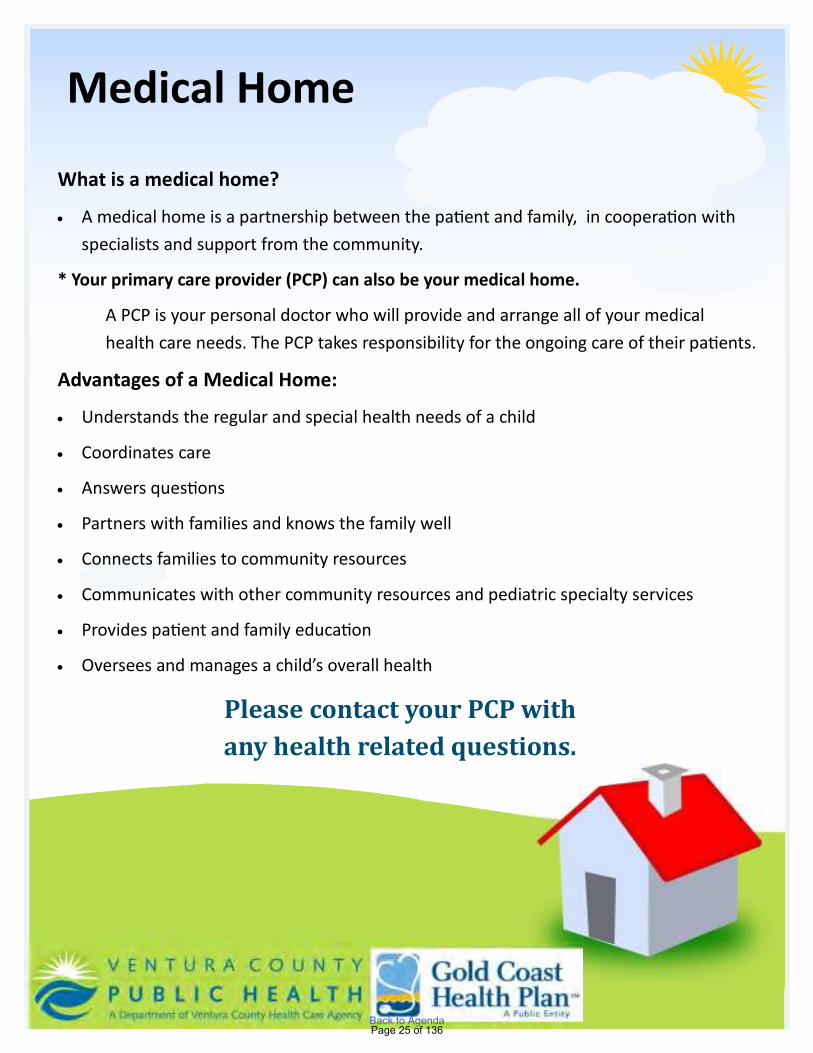
Medical Home
What is a medical home?
• A medical home is a partnership between the pa�ent and family, in coopera�on with
specialists and support from the community.
* Your primary care provider (PCP) can also be your medical home.
A PCP is your personal doctor who will provide and arrange all of your medical
health care needs. The PCP takes responsibility for the ongoing care of their pa�ents.
Advantages of a Medical Home:
• Understands the regular and special health needs of a child
• Coordinates care
• Answers ques�ons
• Partners with families and knows the family well
• Connects families to community resources
• Communicates with other community resources and pediatric specialty services
• Provides pa�ent and family educa�on
• Oversees and manages a child’s overall health
PleasecontactyourPCPwith
anyhealthrelatedquestions.
Page 25 of 136Back to Agenda
AGENDA ITEM NO. 2
Ventura County Medi-Cal Managed Care Commission (VCMMCC) dba Gold Coast Health Plan (GCHP)
April 25, 2016 Regular Meeting Minutes
CALL TO ORDER Commissioner Anthony Alatorre called the meeting to order at 3:03 p.m. in the Lower Plaza Assembly Room at the County of Ventura Government Center – Hall of Administration, 800 South Victoria Avenue, Ventura, California. PLEDGE OF ALLEGIANCE Commissioner Alatorre led the Pledge of Allegiance. ROLL CALL Present: Commissioners Antonio Alatorre, Shawn Atin, Lanyard Dial, M.D., Barry
Fisher, Peter Foy, Michelle Laba, M.D., Darren Lee, Gagan Pawar, M.D., Dee Pupa, and Jennifer Swenson (arrived 3:24 p.m.)
PUBLIC COMMENT Amy Cansler, Script Care Vice President, requested the Commission to either move forward with the top two finalists’ presentations or engage in a proactive longer extension of the current contract for Agenda Item No. 8 Pharmacy Benefits Manager Contract Extension. Frank Messina, Script Care General Counsel, proposed two options regarding Agenda Item No. 8 Pharmacy Benefits Manager Contract Extension: an additional three one month extension option or a 36 month extension option. Earl Hurst, Magellan Rx Management Senior Vice President and General Manager, spoke on behalf of the company’s capability in regards to Agenda Item No. 8, Pharmacy Benefits Manager Contract Extension. Shareh Ghani, Magellan Rx Management Chief Medical Officer, spoke on behalf of the company’s capability in regards to Agenda Item No. 8, Pharmacy Benefits Manager Contract Extension. Susan Whitewood, COPD Access to Community Health Project Director, spoke on behalf of Dr. Higgins, Dr. Underwood, Dr. Landon, and Dr. Bajwa in support of Agenda Item No. 6 Benefit Enhancement – Pulmonary Rehabilitation. Commissioner Swenson arrived at 3:24 p.m.
Page 26 of 136Back to Agenda

April 25, 2016 2
Rob Coppola, Magellan Rx Management Vice President of Medicaid Sales, spoke on behalf of the company’s capability in regards to Agenda Item No. 8, Pharmacy Benefits Manager Contract Extension. OATH OF OFFICE The Clerk of the Board administered the oath of office to Commissioner Swenson. CONSENT ITEMS 1. February 22, 2016 Regular Meeting and March 9, 2016 Special Meeting
Minutes
RECOMMENDATION Approve minutes for February 22, 2016 Regular Meeting and March 9, 2016 Special Meeting.
Commissioner Lee moved to approve the minutes as corrected. Commissioner Fisher seconded. The vote was as follows: AYES: Commissioners Alatorre, Atin, Dial, Fisher, Laba, Lee, Pupa, and Swenson.
NOES: None. ABSTAIN: Commissioners Foy and Pawar. ABSENT: None. Commissioner Alatorre declared the motion carried. 2. Department of Health Care Services (DHCS) Contract Term Date Extension
RECOMMENDATION
Approve the Chief Executive Officer to respond in writing to DHCS to accept the contract term date extension to December 31, 2017.
Dale Villani, Chief Executive Officer, gave the staff report. Commissioner Foy moved to approve the recommendation. Commissioner Fisher seconded. The vote was as follows: AYES: Commissioners Alatorre, Atin, Dial, Fisher, Foy, Laba, Lee, Pawar, Pupa,
and Swenson. NOES: None.
Page 27 of 136Back to Agenda
April 25, 2016 3
ABSTAIN: None. ABSENT: None. Commissioner Alatorre declared the motion carried. FORMAL ACTION ITEMS 3. Adoption of Resolution No. 2016-01 Amending the Bylaws to Establish
Commissioners’ Terms of Office
RECOMMENDATION
Adopt Resolution No. 2016-01 as presented.
Scott Campbell, General Counsel, gave the staff report. Commissioner Foy moved to approve the recommendation. Commissioner Pupa seconded. The vote was as follows: AYES: Commissioners Alatorre, Atin, Dial, Fisher, Foy, Laba, Lee, Pawar, Pupa,
and Swenson. NOES: None. ABSTAIN: None. ABSENT: None. Commissioner Alatorre declared the motion carried. 4. Election of Chairperson and Vice Chairperson to serve two-year terms and
appointment of Executive/Finance Committee
RECOMMENDATION
1. Elect a Commissioner to serve as Chairperson for a two-year term. 2. Elect a Commissioner to serve as Vice Chairperson for a two-year term. 3. Make appointments to the Executive/Finance Committee as follows: a. Chairperson b. Vice Chairperson c. Private Hospital Healthcare Representative d. Ventura County Medical Health System Representative e. Clinicas Del Camino Real Representative
Page 28 of 136Back to Agenda

April 25, 2016 4
Mr. Campbell gave the staff report and noted the election of individual members to these positions does not create any additional conflict of interest that would otherwise exist. Commissioner Lee and Commissioner Fisher were nominated for Chairperson. Commissioner Fisher declined.
The voice vote carried unanimously to elect Commissioner Lee as Chairperson.
Commissioner Pupa and Commissioner Alatorre were nominated for Vice Chairperson.
A roll call vote was as follows: Commissioner Pupa for Vice Chairperson: Commissioners Atin, Foy, Lee, Laba, and Swenson. Commissioner Alatorre for Vice Chairperson: Commissioners Alatorre, Fisher, and Pawar. Abstaining: Commissioners Dial and Pupa. The roll call vote carried 5-3-2, Commissioner Pupa was elected Vice Chairperson.
The Executive/Finance Committee appointments were made per the Commission’s By-Laws: Commissioners Lee, Pupa, and Swenson.
Commissioner Alatorre was nominated and by unanimous consent, appointed to the Executive/Finance Committee. Commissioner Fisher was nominated and by unanimous consent, appointed to the Executive/Finance Committee. Commissioner Lee assumed the Chairperson’s position for the remainder of the meeting. 5. Appointment of a New Member to the Human Resources Cultural Diversity
(HRCD) Committee
RECOMMENDATION Appoint a new committee member to the HRCD Committee. Mr. Campbell gave the staff report.
Commissioner Lee was nominated and by unanimous consent, appointed to the HRCD Committee.
Page 29 of 136Back to Agenda
April 25, 2016 5
6. Benefit Enhancement – Pulmonary Rehabilitation
RECOMMENDATION Approve pulmonary rehabilitation as presented. Nancy Wharfield, M.D., Associate Chief Medical Officer, gave the staff report.
Commissioner Dial moved to approve the recommendation. Commissioner Foy seconded.
AYES: Commissioners Alatorre, Atin, Dial, Fisher, Foy, Laba, Lee, Pawar, Pupa,
and Swenson. NOES: None. ABSTAIN: None. ABSENT: None. Commissioner Lee declared the motion carried.
7. Benefit Enhancement - Podiatry
RECOMMENDATION Approve podiatry rehabilitation as presented. Dr. Wharfield gave the staff report. A discussion followed between the Commissioners and staff clarifying the fiscal impact is an additional $72,000.
Commissioner Dial moved to approve the recommendation. Commissioner Foy seconded.
AYES: Commissioners Alatorre, Atin, Dial, Fisher, Foy, Laba, Lee, Pawar, Pupa,
and Swenson. NOES: None. ABSTAIN: None. ABSENT: None. Commissioner Lee declared the motion carried.
Page 30 of 136Back to Agenda
April 25, 2016 6
8. Pharmacy Benefits Manager (PBM) Contract Extension
RECOMMENDATION Approve the extension of the current PBM contract for six additional one month extensions.
At 3:58 p.m. Mr. Villani recused himself as he had previously owned stock in Magellan. Anne Freese, Director of Pharmacy, gave the staff report. A discussion followed between Commissioners and staff regarding: the contract extension giving the Commission additional time to complete the Request for Proposals, which will produce a new contract with new terms by next spring; the transition time if switching PBMs would be six months; and the status of the current RFP would be discussed in closed session. The Commission unanimously agreed to hold the item until after closed session discussion.
At 4:05 p.m. Mr. Villani returned to the Commission meeting. 9. Provider Advisory Committee Membership
RECOMMENDATION Appoint the individuals listed in the report to the Provider Advisory Committee membership.
Ruth Watson, Chief Operations Officer, gave the staff report. She stated that in addition to the three individuals listed in the staff report, one more individual needs to be appointed as Sue Anderson is stepping down from the committee.
Commissioner Foy moved to approve the appointment of Sim Mandelbum, Joan Buck-Plassmeyer, S. Marsha Smith, and Richard Montminy to the Provider Advisory Committee membership. Commissioner Atin seconded.
AYES: Commissioners Alatorre, Atin, Dial, Fisher, Foy, Laba, Lee, Pawar, Pupa,
and Swenson. NOES: None. ABSTAIN: None. ABSENT: None. Commissioner Lee declared the motion carried.
Page 31 of 136Back to Agenda
April 25, 2016 7
10. Quality Improvement 2015 Work Plan Evaluation and Yearly Quality
Improvement Report
RECOMMENDATION Approve the 2015 Quality Improvement Work Plan Evaluation and 2015 Quality Improvement Program Evaluation Summary. C. Albert Reeves, M.D., Chief Medical Officer, stated as yearly requirements, an evaluation of the previous years’ Quality Improvement Work Plan and the current 2016 Work Plan, are to be provided to the Commission. Kim Osada, Quality Improvement Director, gave the staff report. A discussion followed between the Commissioners and staff addressing concerns regarding the inability to evaluate programs when data from HEDIS is unavailable. Suggestions made from the Commission included changing the verbiage to “preliminary data” and asked staff to consider how to provide the report so it more accurately reflects staff’s efforts. Staff stated the finalized HEDIS results will be presented at the August Commission meeting. Clarification was made that per Department of Health Care Services’ requirements, the Commission needs to approve the Work Plan by a certain date and going forward, the HEDIS rates can be provided on a quarterly basis.
Commissioner Pawar moved to approve the recommendation. Commissioner Dial seconded.
AYES: Commissioners Alatorre, Atin, Dial, Fisher, Foy, Laba, Lee, Pawar, Pupa,
and Swenson. NOES: None. ABSTAIN: None. ABSENT: None. Commissioner Lee declared the motion carried. 11. Quality Improvement Program Description and Work Plan for 2016
RECOMMENDATION Approve the 2016 Quality Improvement Program Description and Work Plan.
Ms. Osada gave the staff report.
Page 32 of 136Back to Agenda
April 25, 2016 8
A discussion followed between the Commissioners and staff concerning the definition of “minority” as being both ethnicity or underserved and gave staff direction to change “minority” to “disparity”.
Commissioner Atin moved to approve the recommendation. Commissioner Alatorre seconded.
AYES: Commissioners Alatorre, Atin, Dial, Fisher, Foy, Laba, Lee, Pawar, Pupa,
and Swenson. NOES: None. ABSTAIN: None. ABSENT: None. Commissioner Lee declared the motion carried. 12. Policy Number QI-023 Potential Quality Issue Investigation and Resolution
RECOMMENDATION Approve Policy Number QI-023 Potential Quality Issue Investigation and Resolution. Dr. Reeves gave the staff report.
Commissioner Foy moved to approve the recommendation. Commissioner Pawar seconded.
AYES: Commissioners Alatorre, Atin, Dial, Fisher, Foy, Laba, Lee, Pawar, Pupa,
and Swenson. NOES: None. ABSTAIN: None. ABSENT: None. Commissioner Lee declared the motion carried. 13. February 2016 Fiscal Year to Date Financials
RECOMMENDATION Accept and file the February 2016 Fiscal Year to Date Financials.
Page 33 of 136Back to Agenda
April 25, 2016 9
Patricia Mowlavi, Chief Financial Officer, gave the staff report. Staff noted the February report does not reflect the loan repayment made to the County of Ventura.
Commissioner Fisher moved to approve the recommendation. Commissioner Pupa seconded.
AYES: Commissioners Alatorre, Atin, Dial, Fisher, Foy, Laba, Lee, Pawar, Pupa,
and Swenson. NOES: None. ABSTAIN: None. ABSENT: None. Commissioner Lee declared the motion carried. 14. National Health Foundation: Ventura Recuperative Care Program (ARCH)
RECOMMENDATION Approve the National Health Foundation sponsorship application request for thirty-eight thousand seven hundred dollars ($38,700) for the Ventura Recuperative Care Program. Ralph Oyaga, Executive Director for Government, Regulatory and External Relations, gave the staff report. Staff clarified the amount is a one-time startup cost.
Commissioner Lee moved to approve the recommendation. Commissioner Atin seconded.
AYES: Commissioners Alatorre, Atin, Dial, Fisher, Foy, Laba, Lee, Pawar, Pupa,
and Swenson. NOES: None. ABSTAIN: None. ABSENT: None. Commissioner Lee declared the motion carried.
Page 34 of 136Back to Agenda
April 25, 2016 10
15. Ventura County Area Agency on Aging: Senior Nutrition Program (ARCH)
RECOMMENDATION Approve the Ventura County Area Agency on Aging sponsorship application request for twenty-thousand dollars ($20,000) for the Senior Nutrition Program. Mr. Oyaga gave the staff report. Staff clarified the amount is a one-time sponsorship.
Commissioner Lee moved to approve the recommendation. Commissioner Fisher seconded.
AYES: Commissioners Alatorre, Atin, Dial, Fisher, Foy, Laba, Lee, Pawar, Pupa,
and Swenson. NOES: None. ABSTAIN: None. ABSENT: None. Commissioner Lee declared the motion carried. REPORTS 16. Chief Executive Officer (CEO) Update
Mr. Villani announced Tracy Oehler as the new Clerk of the Board, thanked Maddie Guiterrez-Roberts for acting as Interim Clerk of the Board, welcomed new Commissioner Swenson, and congratulated Commissioner Fisher on his upcoming retirement. Update highlights included: the repayment of the line of credit to the County of Ventura, which demonstrates to the Department of Health Care Services (DHCS) Gold Coast Health Plan’s increasing financial stability. However, there is still a financial CAP in effect. DHCS is presently conducting the annual medical audit which focuses on six areas. The exit conference is expected to be conducted in June. Ms. Watson will be addressing SB 75 - Full Scope Medi-Cal for All Children. The State is estimating 2,917 children for Ventura County, but speculation is the actual number of children will be higher.
Page 35 of 136Back to Agenda
April 25, 2016 11
17. Employee Satisfaction Results Mr. Villani introduced Vicki Hewlett, Interim Chief Diversity Officer, and Niosha
Sharoori. He stated the survey was an important foundational element to the Plan’s mission and values and included questions approved by the Human Resources/Cultural Diversity Committee about diversity. The employee response rate was 75% and over 80% of employees would recommend working at GCHP.
Ms. Hewlett and Ms. Sharoori gave a PowerPoint presentation on the employee
satisfaction survey and reviewed the results. Overall results were positive and illustrated confidence that GCHP supports diversity. A handout of the slides was distributed and is on file. Areas of opportunity include compensation, promotion and performance review process, training/coaching, and openness.
Commissioners requested GCHP to continue its emphasis on diversity concerns,
of being sensitive to the smaller groups in the workplace, and acknowledged the high participation level and positive survey results.
18. Chief Medical Officer (CMO) Update None. 19. Health Education Update Lupe Gonzalez, MPH, PhD, Director of Health Education, Outreach, Cultural and
Linguistic Services, gave a summary of activities for the months of February and March 2016. Two upcoming events are the 5th Annual Community Resource Fair on May 14 at Plaza Park in Oxnard and a “Diabetes Day” community resource fair on June 11 at Pacific High School in Oxnard in a partnership with the American Diabetes Association. Seven sponsorships were awarded and one letter of support was approved.
20. Health Services Update Dr. Wharfield stated there was a 44% decrease in the average bed days per 1,000
members per calendar year due to tighter utilization processes. Pregnancy related diagnoses continue to surpass all other admitting diagnoses for calendar year 2015 and current year to date.
Page 36 of 136Back to Agenda
April 25, 2016 12
21. Chief Operations Officer (COO) Update
Ms. Watson highlighted SB 75 – Full Scope Medi-Cal for All Children, which will impact two populations of children. The first group is the transition population and is comprised of the 2,900 children previously discussed by CEO Villani. The second group is the new enrollee population, which are children under the age of 19 who meet all eligibility requirements for SB 75, but are not currently enrolled in the Medi-Cal program. These children will need to apply for Medi-Cal through the current application process, but cannot apply for coverage until May 16, 2016. DHCS is estimating that approximately 55,000 undocumented children under the age of 19 are currently eligible statewide and are not enrolled, and that 50% will obtain coverage over a 12-month period once the program is operational. It is believed this figure is an underestimation due to the State’s agricultural industry. One of the challenges for this group is the issue of being on restricted Medi-Cal. When the Medi-Cal Expansion population was brought on, there was a year moratorium on redetermination. The new group will have to do a redetermination within a month of their original determination date. There is concern this could cause a fall from the roles thereby creating difficulties in managing care. GCHP is working in partnership with the County to reach out to the Plan’s members to help navigate the program and assist in redetermination. The Commission expressed concern about the increase in members and whether there were sufficient providers to fulfill the members’ needs. It was stated from a ratio perspective, the Plan has sufficient providers to serve this membership. The issue is the providers’ willingness to see the members and limitations placed on the number of children seen. To help mitigate this issue, GCHP is working on pay for performance programs to incentivize providers, possibly sponsoring pediatricians to come to Ventura County, and rate increases across the board. It was noted the Commission had approved at the February meeting the selection of Optimity Advisors to assist in the review of the existing administrative services contract with Xerox. The project kick-off date occurred March 17. Optimity Advisors has conducted interviews with all internal stakeholders and are in the process of gathering industry financial information regarding service benchmarks for analysis in preparation of completing the vendor assessment report.
22. Network Adequacy Report Ms. Watson stated the overall network has increased by 8.6%, predominately in
the areas of primary care, specialty services, and long term care facilities. GCHP has contracts with all of the 18 long term care facilities located in the County.
Page 37 of 136Back to Agenda
April 25, 2016 13
GCHP meets or exceeds member to provider ratios for primary care and top specialty services, as well as provider to member geographical standards for primary care and top specialty services. It was reiterated there are adequate specialty provider resources to support the Plan’s membership with the continuing challenge of ensuring members are seen on a timely basis.
A discussion followed between the Commission and staff regarding closing the gap
rate to be more competitive; the lack of certain sub specialties in the County; the use of the emergency room for primary medical care; utilizing Alternative Resources for Community Health (ARCH) programs to incentivize providers; the need to strategize on how to close the gaps in provider access measurements; how to reduce the administrative burden on providers as Medi-Cal requires extensive reporting; the availability of money to fund the ARCH programs; and the need for better metrics regarding appointment availability.
Staff noted there was formula error on page 205 and the PCPs – General
Pediatrics total number should be 199. Staff is working on three pilots for pay for performance programs with
implementation scheduled by the end of the fiscal year. The pilots consist of an encounter data submission program, an enhancement reimbursement program for the required data for Pre Intervention Referral Treatment, and a patient navigator program. Future incentive programs are also being vetted.
23. Chief Information and Strategy Officer (CISO) Update A discussion occurred between the Commission and staff about the availability of
data on how quickly Helpdesk Service Tickets are closed. Melissa Scrymgeour, CISO, stated the project steering committee is working on a very aggressive project portfolio for next fiscal year with focus on regulatory compliance, business operations, and operational efficiencies. One of the projects is the member facing mobile application for a diabetes management program text messaging campaign.
24. Chief Diversity Officer (CDO) Update
Mr. Campbell stated the diversity interview panel met with three individuals last Wednesday and another meeting is scheduled for April 26. Once the process is finalized, the candidates will be brought to the Commission on May 23 or June 27 for interviews.
Commissioner Dial moved to accept and file Agenda Item Nos. 16 through 24. Commissioner Foy seconded.
Page 38 of 136Back to Agenda
April 25, 2016 14
AYES: Commissioners Alatorre, Atin, Dial, Fisher, Foy, Laba, Lee, Pawar, Pupa,
and Swenson. NOES: None. ABSTAIN: None. ABSENT: None. Commissioner Lee declared the motion carried. Mr. Campbell stated there would be three closed items: the existing litigation with Clinicas; anticipated litigation involving the PBM Request for Proposals and as the facts are unknown to the plaintiffs and will not be disclosed; and the performance evaluation for the Chief Executive Officer. The Clinicas representatives will recuse themselves from Agenda Item No. 25 and Mr. Villani will recuse himself from Agenda Item No. 26 due to previous stock ownership in Magellan. CLOSED SESSION The Commission adjourned to Closed Session at 5:50 p.m. regarding the following items: 25. Conference with Legal Counsel – Existing Litigation Paragraph (1) of subdivision (d) of Section 54956.9 Clinicas Del Camino Real Inc. v. Ventura County Medi-Cal Managed Care
Commission dba Gold Coast Health Plan, Ventura County Superior Court Case No. 56-2014-00456149-CU-BC-VTA
26. Conference with Legal Counsel – Anticipated Litigation Significant exposure to litigation pursuant to paragraph (2) of subdivision (d) of
Section 54956.9: Two Cases 27. Public Employee Performance Evaluation Title: Chief Executive Officer
OPEN SESSION The Regular Meeting reconvened at 6:56 p.m. Mr. Campbell reported for Agenda Item No. 26, the Commissioners unanimously directed staff to prepare an agenda item for an upcoming special meeting formally rejecting all current bids received for the pharmacy benefit manager (“PBM”) Request for Proposals (“RFP”) process. The Commissioners want to be more active in the selection process. The Commissioners also want the RFP responses to include greater detail on the proposers’ plans to work with local pharmacies as well as a discussion regarding the 340B drug pricing program. The decision to direct staff to prepare staff report rejecting the
Page 39 of 136Back to Agenda
April 25, 2016 15
current bids was also due to the Commission’s concern that CEO Dale Villani’s attendance at two of the three interviews raised potential conflict of interest issues given Mr. Villani’s ownership of some shares in Magellan, one of the companies that submitted a proposal. Mr. Villani did not attend the interview with Magellan. There was no evidence that Mr. Villani’s participation in the two other interviews had any effect on the scoring or outcome of the RFP. However, in abundance of caution, the Commissioners felt it was in the Plan’s best interest to reject all bids and restart the process. 8. Pharmacy Benefits Manager (PBM) Contract Extension
RECOMMENDATION Approve the extension of the current PBM contract for six additional one month extensions.
Commissioner Lee moved to approve the contract amendment be extended for six additional one month extensions for a total of nine months. Commissioner Foy seconded.
AYES: Commissioners Alatorre, Atin, Dial, Fisher, Foy, Laba, Lee, Pawar, Pupa,
and Swenson. NOES: None. ABSTAIN: None. ABSENT: None. Commissioner Lee declared the motion carried. ADJOURNMENT The meeting was adjourned at 6:59 p.m.
Page 40 of 136Back to Agenda
May 23, 2016 1
AGENDA ITEM NO. 3
Ventura County Medi-Cal Managed Care Commission (VCMMCC) dba Gold Coast Health Plan (GCHP)
May 23, 2016 Regular Meeting Minutes
CALL TO ORDER Commissioner Darren Lee called the meeting to order at 3:04 p.m. in the Lower Plaza Assembly Room at the County of Ventura Government Center – Hall of Administration, 800 South Victoria Avenue, Ventura, California. PLEDGE OF ALLEGIANCE Commissioner Lee led the Pledge of Allegiance. ROLL CALL Present: Commissioners Antonio Alatorre, Shawn Atin, Barry Fisher, Darren Lee,
Gagan Pawar, M.D., Dee Pupa, and Jennifer Swenson Absent: Commissioners Lanyard Dial, Peter Foy, and Michelle Laba, M.D. PUBLIC COMMENT David Cruz, Ventura County resident, invited the Commission to appear on his community outreach program. SPECIAL PRESENTATIONS 1. Sponsorship Award to National Health Foundation 2. Sponsorship Award to Ventura County Area Agency on Aging The Commission unanimously agreed to hear the special presentations once both recipients arrived. FORMAL ACTION ITEMS 3. Pharmacy Benefits Manager (PBM) Request for Proposals
RECOMMENDATION
Reject all proposals from the Request for Proposals (RFP) that staff initiated on November 6, 2015; and provide direction to staff to either: (i) open a revised RFP to all proposers, or (ii) limit a revised RFP to the three finalists identified in the current RFP process.
Page 41 of 136Back to Agenda
May 23, 2016 2
Scott Campbell, General Counsel, stated due to prior ownership of Magellan stock, Chief Executive Officer Dale Villani will recuse himself and Chief Operating Officer Ruth Watson will recuse herself due to nature of the Request for Proposal (RFP) and the potential for appeal. General Counsel Campbell stated the reasons for the recommendation is there is a potential of a conflict of interest challenge due to the interview process with the prior RFP panel; the Commission has indicated it wants the RFP to have an additional focus on the ability of the proposers to be able to serve the local pharmacies as stated by the pharmacists at the February 22, 2016 meeting; and to address the 340B issues. If all the bids are rejected, the new RFP should be ready by the end of the week, the proposals can be evaluated within 30 days, and the interviews with the finalists are scheduled for July. Additionally, the Commission’s rules allow for the Commission to submit the new RFP to the three candidates.
Kevin Brown, Script Care President, spoke in favor of Agenda Item No. 3, Pharmacy Benefits Manager Request for Proposals. Keely Michalk, Script Care Director of Provider Quality Assurance, spoke in favor of Agenda Item No. 3, Pharmacy Benefits Manager Request for Proposals. Amy Cansler, Script Care Vice President, spoke in favor of Agenda Item No. 3, Pharmacy Benefits Manager Request for Proposals. Andrew Kugler, Mayer Brown LLP, General Counsel for Script Care, spoke in favor of Agenda Item No. 3, Pharmacy Benefits Manager Request for Proposals.
Earl Hurst, Magellan Rx Management Senior Vice President and General Manager, spoke in opposition of Agenda Item No. 3, Pharmacy Benefits Manager Request for Proposals. Mara Mitchel, Magellan Rx Management Senior Vice President of Strategic Operations, spoke in opposition of Agenda Item No. 3, Pharmacy Benefits Manager Request for Proposals. Tony Zappa, pharmacist representing Magellan Rx Management, spoke in opposition of Agenda Item No. 3, Pharmacy Benefits Manager Request for Proposals. Rob Coppola, Magellan Rx Management Vice President of Medicaid Sales, spoke in opposition of Agenda Item No. 3, Pharmacy Benefits Manager Request for Proposals. Ron Foll, Magellan Rx Management Senior Legal Counsel, addressed the conflict of interest issue concerning the Plan’s CEO citing Government Code (G.C.) 1091.5
Page 42 of 136Back to Agenda

May 23, 2016 3
and spoke in opposition of Agenda Item No. 3, Pharmacy Benefits Manager Request for Proposals. Jennifer Dauer, Diepenbrock Elkin Gleason LLP, outside counsel for Magellan Rx Management, spoke in opposition of Agenda Item No. 3, Pharmacy Benefits Manager Request for Proposals.
The Commission unanimously agreed to hear Agenda Item No. 3, Pharmacy Benefits Manager Request for Proposals after the Closed Session. General Counsel Campbell stated per G.C.1091.5, the Ventura County representatives do not have conflict of interest as salary received from the County does not to qualify. Commissioner Alatorre stated he did not have a conflict of interest and would not be recusing himself. General Counsel Campbell noted additional information was received from Magellan today that pertains to the non-existence of the conflict of interest, which will be discussed in Closed Session. Mr. Villani and Ms. Watson returned to the meeting. SPECIAL PRESENTATIONS 1. Sponsorship Award to National Health Foundation
Kelly Bruno, representative for the National Health Foundation, received the sponsorship award.
2. Sponsorship Award to Ventura County Area Agency on Aging
Victoria Jump, representative for the Senior Nutrition Program, received the sponsorship award.
FORMAL ACTION ITEMS 4. March 2016 Fiscal Year to Date Financials
RECOMMENDATION
Accept and file March 2016 Fiscal Year to Date Financials.
Patricia Mowlavi, Chief Financial Officer, noted the Department of Health Care Services gave the Plan permission to repay line of credit to the County of Ventura and as of March 2016, the Plan’s Tangible Net Equity (TNE) is at 545% of the State required minimum.
Page 43 of 136Back to Agenda
May 23, 2016 4
Commissioner Fisher moved to approve the recommendation. Commissioner Alatorre seconded.
AYES: Commissioners Alatorre, Atin, Fisher, Lee, Pawar, Pupa, and Swenson. NOES: None. ABSTAIN: None. ABSENT: Commissioners Dial, Foy, and Laba. Commissioner Lee declared the motion carried. 5. Fiscal Year 2016/2017 Budget
RECOMMENDATION Approve Fiscal Year 2016/2017 Budget and the staffing levels. Ms. Mowlavi stated due to the Plan’s stable financial position, it will allow for additional investments in improving the health of the Plan’s members by supporting its providers, and per the federal government’s direction, is committed to moving towards outcome and value based performance. Key budget assumptions included:
• Anticipated flat growth of 6,000 members • 4.8% reduction in revenue rates driven by the 13.9% reduction for the Adult
Expansion rates • $12.1 million investment in Alternative Resources for Community Health
(ARCH) program • Administrative expenses budgeted to remain flat at 6.7% of revenue • TNE projected to be at 498% of the state required minimum
Staff gave a budget presentation which included:
• The ARCH program • Value Based Contracting: Triple Aim of Health Care • Impact of the Center for Medicare and Medicaid Services approved
regulations for Medicaid • Breakdown of how the revenue received from the State is applied • Increase in provider reimbursement rates • $2.8 million for one time investments for strategic projects • Estimations of the number of SB 75 enrollees • Projection of a 84% Medical Loss Ratio by the end of next year • $170 million reduction in cash/investment by August/September which was
created by the State’s overpayments • Little change in membership mix and revenue impact from last fiscal year • Intentional draw down of the TNE
Page 44 of 136Back to Agenda

May 23, 2016 5
• Medical Cost Ratio budgeted at 92% • Breakdown of health care costs • Employee investments • Focus on how project investments align with the Plan’s strategic initiatives
Commissioner Pupa moved to approve the recommendation. Commissioner Fisher seconded.
AYES: Commissioners Alatorre, Atin, Fisher, Lee, Pawar, Pupa, and Swenson. NOES: None. ABSTAIN: None. ABSENT: Commissioners Dial, Foy, and Laba. Commissioner Lee declared the motion carried. 6. Internal Audit Report, Revenue
RECOMMENDATION Approve the Internal Audit Report. Martin Haisma, Certified Information System Analyst, Certified Internal Auditor, Project Management Professional, Etonien Consulting, stated there were three insignificant findings in the review of the revenue policy and procedures, which have been remediated, and is currently conducting a review around Human Resources, Payroll, and Office Expenditures.
Commissioner Swenson moved to approve the recommendation. Commissioner Atin seconded.
AYES: Commissioners Alatorre, Atin, Fisher, Lee, Pawar, Pupa, and Swenson. NOES: None. ABSTAIN: None. ABSENT: Commissioners Dial, Foy, and Laba. Commissioner Lee declared the motion carried.
Page 45 of 136Back to Agenda
May 23, 2016 6
7. Reinsurance for High Cost Claims Policy Renewal
RECOMMENDATION Approve and authorize binding reinsurance for high cost claims policy renewal with StarLine per the quote estimate. Ms. Mowlavi stated the current reinsurance policy will expire on June 30, 2016. Beecher Carlson, the Plan’s insurance broker, received five bids. The StarLine quote was the lowest received with a rate reduction of $453,000 and there is a possibility of a refund from the prior year’s premium.
Commissioner Fisher moved to approve the recommendation. Commissioner Alatorre seconded.
AYES: Commissioners Alatorre, Atin, Fisher, Lee, Pawar, Pupa, and Swenson. NOES: None. ABSTAIN: None. ABSENT: Commissioners Dial, Foy, and Laba. Commissioner Lee declared the motion carried. 8. Ventura County Behavioral Health Overdose Rescue Project Sponsorship
Application Request (ARCH)
RECOMMENDATION Approve the Ventura County Behavioral Health Overdose Rescue Project sponsorship application request for fifty-one thousand three hundred dollars ($51,300) for 1,000 naloxone overdose rescue kits.
Commissioner Fisher recused himself as he is the Director of the Ventura County Health Care Agency.
Ralph Oyaga, Executive Director for Government, Regulatory and External Relations, gave the staff report and noted the kits come with information and training. Dan Hicks, Ventura County Behavioral Health ADP Prevention Manager, stated the County loses 80 to 100 people each year from accidental opiate overdose, which is part of a national epidemic. Opiate overdose is the gradually cessation of breathing allowing time to respond and anyone with the proper training can legally administer the naloxone in response to an overdose crisis. A handout of overdose statistics was distributed and is on file.
Page 46 of 136Back to Agenda
May 23, 2016 7
A discussion followed between Commissioners and staff regarding the clarification of the contents and distribution of the kits; the benefit to current members who are at high risk of accidental overdose; ARCH requests being funded by excess resources for the current fiscal year and a budget set for fiscal year 2016/2017; and the data collection of confirmed overdose reversals.
Commissioner Atin moved to approve the recommendation. Commissioner Pawar seconded.
AYES: Commissioners Alatorre, Atin, Lee, Pawar, Pupa, and Swenson. NOES: None. ABSTAIN: Commissioner Fisher. ABSENT: Commissioners Dial, Foy, and Laba. Commissioner Lee declared the motion carried.
Commissioner Fisher returned to the Commission meeting. REPORTS 9. Chief Executive Officer (CEO) Update
Mr. Villani highlighted the 5th Annual Community Resource Fair held on Saturday, May 14, 2016, at Park Place in Oxnard and thanked Lupe Gonzalez and the Health Education, Community Outreach team for their great work on the event.
10. Chief Operations Officer (COO) Update
Ms. Watson stated staff is producing new information regarding membership churn statistics and is working with the County to reach out to members who are approaching the end of the redetermination period to prevent them from falling off and coming back retroactively.
11. Health Services Update Nancy Wharfield, M.D., Associate Chief Medical Officer, noted the reporting period
data was relatively flat. 12. Health Education Update C. Albert Reeves, M.D., Chief Medical Officer, stated Lupe Gonzalez, MPH, PhD,
Director of Health Education, Outreach, Cultural and Linguistic Services, is available for questions on the Community Outreach Summary report.
Page 47 of 136Back to Agenda
May 23, 2016 8
Commissioner Fisher moved to accept and file the reports. Commissioner Pupa seconded.
AYES: Commissioners Alatorre, Atin, Fisher, Lee, Pawar, Pupa, and Swenson. NOES: None. ABSTAIN: None. ABSENT: Commissioners Dial, Foy, and Laba. Commissioner Lee declared the motion carried. COMMENTS FROM COMMISSIONERS Mr. Campbell stated staff will be polling the Commissioners regarding availability for the next four Commission meetings. Commissioner Lee noted in past discussions it had been proposed to move to electronic packets and would like to revisit the topic. Mr. Campbell announced the Closed Sessions items are the ones listed on the Agenda and on Agenda Item No. 16 Conference with Legal Counsel – Anticipated Litigation, is to discuss the PBM RFP statements, due to the threats of litigation in writing and orally, with Mr. Villani and Ms. Watson recusing themselves for the same reasons as previously noted in Item No. 3. On Agenda Item No. 17 Conference with Legal Counsel – Existing Litigation, the two representatives from Clinicas will be recusing themselves. CLOSED SESSION The Commission adjourned to Closed Session at 4:46 p.m. regarding the following items: 13. PUBLIC EMPLOYEE PERFORMANCE EVALUATION Title: Chief Executive Officer 14. CONFERENCE WITH LABOR NEGOTIATORS Agency designated representatives: Scott Campbell, General Counsel Unrepresented employee: Chief Executive Officer 15. PUBLIC EMPLOYEE APPOINTMENT Title: Chief Diversity Officer
16. CONFERENCE WITH LEGAL COUNSEL – ANTICIPATED LITIGATION Significant exposure to litigation pursuant to paragraph (2) of subdivision (d) of Section 54956.9: Two Cases
Page 48 of 136Back to Agenda
May 23, 2016 9
17. CONFERENCE WITH LEGAL COUNSEL – EXISTING LITIGATION Paragraph (1) of subdivision (d) of Section 54956.9 Clinicas Del Camino Real Inc. v. Ventura County Medi-Cal Managed Care Commission dba Gold Coast Health Plan, Ventura County Superior Court Case No. 56-2014-00456149-CU-BC-VTA
OPEN SESSION The Regular Meeting reconvened at 6:15 p.m. Mr. Campbell stated that no reportable action was taken for Agenda Item Nos. 13, 14, 15, and 16. 3. Pharmacy Benefits Manager Request for Proposals Staff: Scott Campbell, General Counsel RECOMMENDATION Reject all proposals from the Request for Proposals (RFP) that staff initiated on
November 6, 2015; and provide direction to staff to either: (i) open a revised RFP to all proposers, or (ii) limit a revised RFP to the three finalists identified in the initial RFP process.
Commissioner Fisher moved to reject all proposals from the Request for Proposals that staff initiated on November 6, 2015, and directed staff to limit a revised RFP to the three finalists identified in the prior RFP process. Commissioner Pawar seconded.
AYES: Commissioners Alatorre, Atin, Fisher, Lee, Pawar, Pupa, and Swenson. NOES: None. ABSTAIN: None. ABSENT: Commissioners Dial, Foy, and Laba. Commissioner Lee declared the motion carried. CLOSED SESSION The Commission adjourned to Closed Session at 6:17 p.m. regarding the following item: 17. CONFERENCE WITH LEGAL COUNSEL – EXISTING LITIGATION
Paragraph (1) of subdivision (d) of Section 54956.9 Clinicas Del Camino Real Inc. v. Ventura County Medi-Cal Managed Care Commission dba Gold Coast Health Plan, Ventura County Superior Court Case No. 56-2014-00456149-CU-BC-VTA
Page 49 of 136Back to Agenda

May 23, 2016 10
OPEN SESSION The Regular Meeting reconvened at 6:34 p.m. Commissioner Lee stated that no reportable action was taken for Agenda Item No. 17. ADJOURNMENT The meeting was adjourned at 6:35 p.m.
Page 50 of 136Back to Agenda
AGENDA ITEM NO. 4
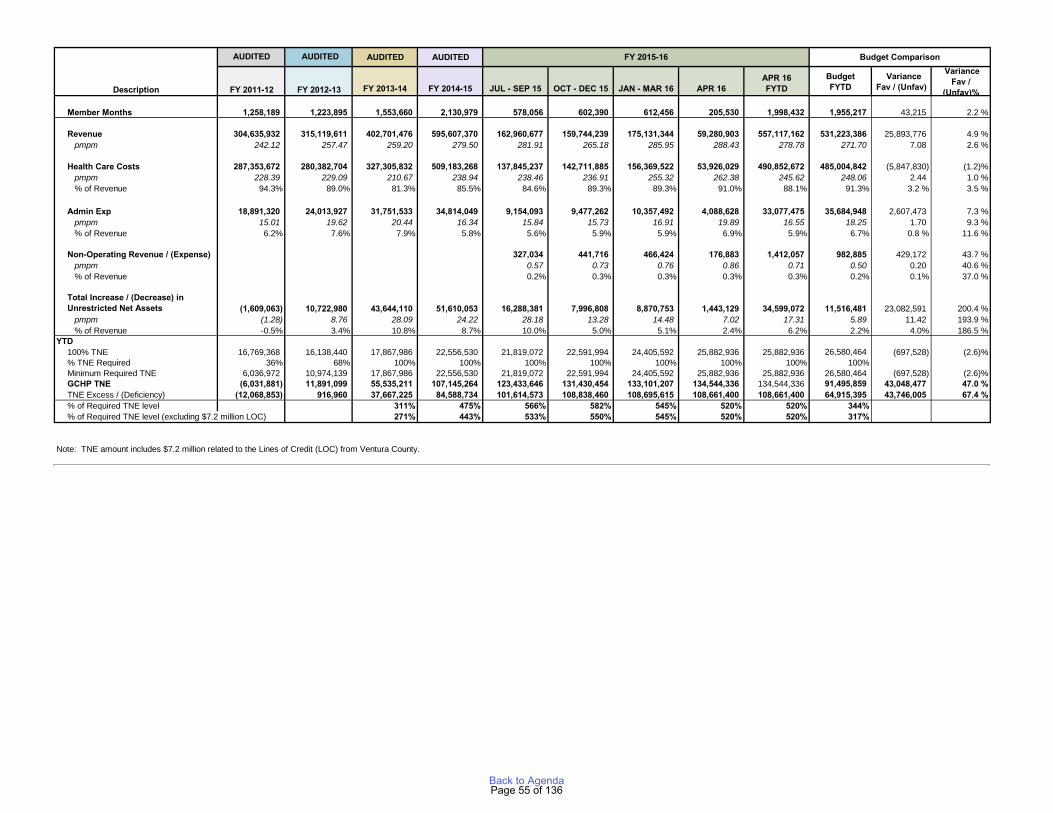
TO: Gold Coast Health Plan Commission FROM: Patricia Mowlavi, CFO DATE: June 27, 2016 SUBJECT: April 2016 Fiscal Year to Date Financials SUMMARY: Staff is presenting the attached fiscal year to date (FYTD) April 2016 financial statements (unaudited) of Gold Coast Health Plan (“Plan”) for the Commission to accept and file. The Executive/Finance Committee did not meet in May and June. BACKGROUND/DISCUSSION: The staff has prepared the FYTD April 2016 financial package, including statements of financial position, statement of revenues, expenses and changes in net assets, and statement of cash flows. FISCAL IMPACT: Financial Highlights Overall Performance – For the ten months ended April 30, 2016, the Plan’s gain in net assets was approximately $34.6 million. This represents a $23.1 million favorable variance to budget which was largely due to the continued growth in membership in the Adult Expansion (“AE”) category of aid. Other performance contributors included, lower than anticipated health care and administrative costs. Tangible Net Equity – The Plan’s operating performance has increased the Tangible Net Equity (TNE) amount to approximately $134.5 million, which is $43.0 million better than budget. Membership – April membership of 205,530 exceeded budget by 4,862 members. As in the prior months, the AE and Adult / Family categories continue to be the catalysts for membership growth, accounting for almost 94% of the total FYTD enrollment growth. Revenue – FYTD, net revenue was $557.1 million or $25.9 million favorable to budget. The positive variance resulted primarily from better than anticipated membership for AE with higher capitation rates.
Page 51 of 136Back to Agenda
For the year, revenue includes a $19.1 million reserve for rate reductions associated with AE. This reserve represents an expected refund, to Department of Health Care Services (“DHCS”), for rate overpayments (DHCS continues to pay at the July 1, 2014 rates rather than the July 1, 2015 published rates) and the anticipated refund of revenue to achieve a medical loss ratio (“MLR”) of 85%, for this aid category. (The MLR is calculated by dividing health care costs by revenue). The combined total due back to the DHCS, for both rate overpayment and 85% MLR portion, is $267.9 million. Beginning in January, the DHCS started to recoup the AE rate overpayment through monthly reductions of its payment to the Plan. Year-to-date, a total of $51.8 million has been was deducted, including $17.3 million in April. Health Care Costs – FYTD health care costs were $490.9 million or $5.8 million above budget. For the year, the MLR was 88.1% versus budget of 91.3%. Some health care cost items of note include:
• Capitation – FYTD, capitation was $83.8 million or $24.8 million unfavorable to budget. The unfavorable variance was driven by the Enhanced Adult Expansion Capitation program, which was revised effective July 2015, as well as higher than budgeted capitated membership growth.
• Fee for Service – FYTD, total claims expense was $393.5 million compared to a budget of $405.5 million. While there was some movement of services between categories, the overall variance was driven by lower than expected Inpatient and Specialty Physician costs.
• Pharmacy – FYTD, overall Pharmacy expense was $81.1 million or $3.7 million unfavorable to budget. This variance was offset by specialty drug reimbursement which appears in revenue.
Administrative Expenses – FYTD, administrative costs were $33.1 million or $2.6 million lower than budget. Savings were realized due to delays in new hires and related costs associated with personnel. These savings were somewhat offset by higher expenses in outside services, which are primarily driven by membership. The administrative cost ratio (“ACR”) for FYTD was 5.9% versus 6.7% for budget. (The ACR is calculated by dividing administrative expenses by total revenue.) Cash and Medi-Cal Receivable – At April 30, 2016, the Plan had $420.9 million in cash and short term investments and $62.6 million in Medi-Cal Receivable for an aggregate amount of $483.5 million. The cash amount also included pass-through payments for AB 85 of $1.9 million and Managed Care Organizations (MCO) tax of $3.3 million. Excluding the impact of these amounts, the combined cash and short term investment amount would be $415.7 million. A couple of significant items of note regarding the Plan’s cash position: (1) a significant portion of the cash will be used for repayments of amounts owed to the State of California ($267.9 million) with approximately half the amount owed expected to be paid within the next 12 months and (2) consistent with prior years, and as expected, the end of the State’s fiscal year also means that there will be a long delay in the State paying the Plan. The Plan has been informed that the next payment will not be until July
Page 52 of 136Back to Agenda
at the earliest and will be most likely be in August. Until the next payment, the Plan expects cash usage to be approximately $150 - $175 million to cover health care and operating expenses. Investment Portfolio – As of April 30, 2016, the value of the investments were as follows:
• Short-term Investments $233.7 million: Cal Trust $80.4 million; Ventura County Investment Pool $85.2 million; LAIF CA State $63.1 million; Bonds $5.0 million.
• Long-term Investments (Bonds) $19.4 million.
RECOMMENDATION: Staff requests that the Commission accept and file the April 2016 financial statements. ATTACHMENT: April 2016 Financial Package
Page 53 of 136Back to Agenda
FINANCIAL PACKAGE For the month ended April 30, 2016
TABLE OF CONTENTS
● Financial Overview
● Financial Performance Dashboard
APPENDIX
● Statement of Financial Positions
● YTD Statement of Revenues, Expenses and Changes in Net Assets
● Statement of Revenues, Expenses and Changes in Net Assets
● Statement of Financial Positions
● YTD Cash Flow
● Monthly Cash Flow
● Cash Trend Combined
● Membership
● Total Expense Composition
● Paid Claims and IBNP Composition
● Pharmacy Cost & Utilization Trends
Page 54 of 136Back to Agenda
AUDITED AUDITED
FY 2011-12 FY 2012-13 FY 2013-14 FY 2014-15 JUL - SEP 15 OCT - DEC 15 JAN - MAR 16 APR 16APR 16 FYTD
BudgetFYTD
VarianceFav / (Unfav)
VarianceFav /
(Unfav)%
Member Months 1,258,189 1,223,895 1,553,660 2,130,979 578,056 602,390 612,456 205,530 1,998,432 1,955,217 43,215 2.2 %
Revenue 304,635,932 315,119,611 402,701,476 595,607,370 162,960,677 159,744,239 175,131,344 59,280,903 557,117,162 531,223,386 25,893,776 4.9 % pmpm 242.12 257.47 259.20 279.50 281.91 265.18 285.95 288.43 278.78 271.70 7.08 2.6 %
Health Care Costs 287,353,672 280,382,704 327,305,832 509,183,268 137,845,237 142,711,885 156,369,522 53,926,029 490,852,672 485,004,842 (5,847,830) (1.2)% pmpm 228.39 229.09 210.67 238.94 238.46 236.91 255.32 262.38 245.62 248.06 2.44 1.0 % % of Revenue 94.3% 89.0% 81.3% 85.5% 84.6% 89.3% 89.3% 91.0% 88.1% 91.3% 3.2 % 3.5 %
Admin Exp 18,891,320 24,013,927 31,751,533 34,814,049 9,154,093 9,477,262 10,357,492 4,088,628 33,077,475 35,684,948 2,607,473 7.3 % pmpm 15.01 19.62 20.44 16.34 15.84 15.73 16.91 19.89 16.55 18.25 1.70 9.3 % % of Revenue 6.2% 7.6% 7.9% 5.8% 5.6% 5.9% 5.9% 6.9% 5.9% 6.7% 0.8 % 11.6 %
Non-Operating Revenue / (Expense) 327,034 441,716 466,424 176,883 1,412,057 982,885 429,172 43.7 % pmpm 0.57 0.73 0.76 0.86 0.71 0.50 0.20 40.6 % % of Revenue 0.2% 0.3% 0.3% 0.3% 0.3% 0.2% 0.1% 37.0 %
Total Increase / (Decrease) in Unrestricted Net Assets (1,609,063) 10,722,980 43,644,110 51,610,053 16,288,381 7,996,808 8,870,753 1,443,129 34,599,072 11,516,481 23,082,591 200.4 % pmpm (1.28) 8.76 28.09 24.22 28.18 13.28 14.48 7.02 17.31 5.89 11.42 193.9 % % of Revenue -0.5% 3.4% 10.8% 8.7% 10.0% 5.0% 5.1% 2.4% 6.2% 2.2% 4.0% 186.5 %
YTD 100% TNE 16,769,368 16,138,440 17,867,986 22,556,530 21,819,072 22,591,994 24,405,592 25,882,936 25,882,936 26,580,464 (697,528) (2.6)%% TNE Required 36% 68% 100% 100% 100% 100% 100% 100% 100% 100%Minimum Required TNE 6,036,972 10,974,139 17,867,986 22,556,530 21,819,072 22,591,994 24,405,592 25,882,936 25,882,936 26,580,464 (697,528) (2.6)%GCHP TNE (6,031,881) 11,891,099 55,535,211 107,145,264 123,433,646 131,430,454 133,101,207 134,544,336 134,544,336 91,495,859 43,048,477 47.0 %TNE Excess / (Deficiency) (12,068,853) 916,960 37,667,225 84,588,734 101,614,573 108,838,460 108,695,615 108,661,400 108,661,400 64,915,395 43,746,005 67.4 %% of Required TNE level 311% 475% 566% 582% 545% 520% 520% 344%% of Required TNE level (excluding $7.2 million LOC) 271% 443% 533% 550% 545% 520% 520% 317%
Note: TNE amount includes $7.2 million related to the Lines of Credit (LOC) from Ventura County.
Description
AUDITED Budget Comparison AUDITED FY 2015-16
Page 55 of 136Back to Agenda
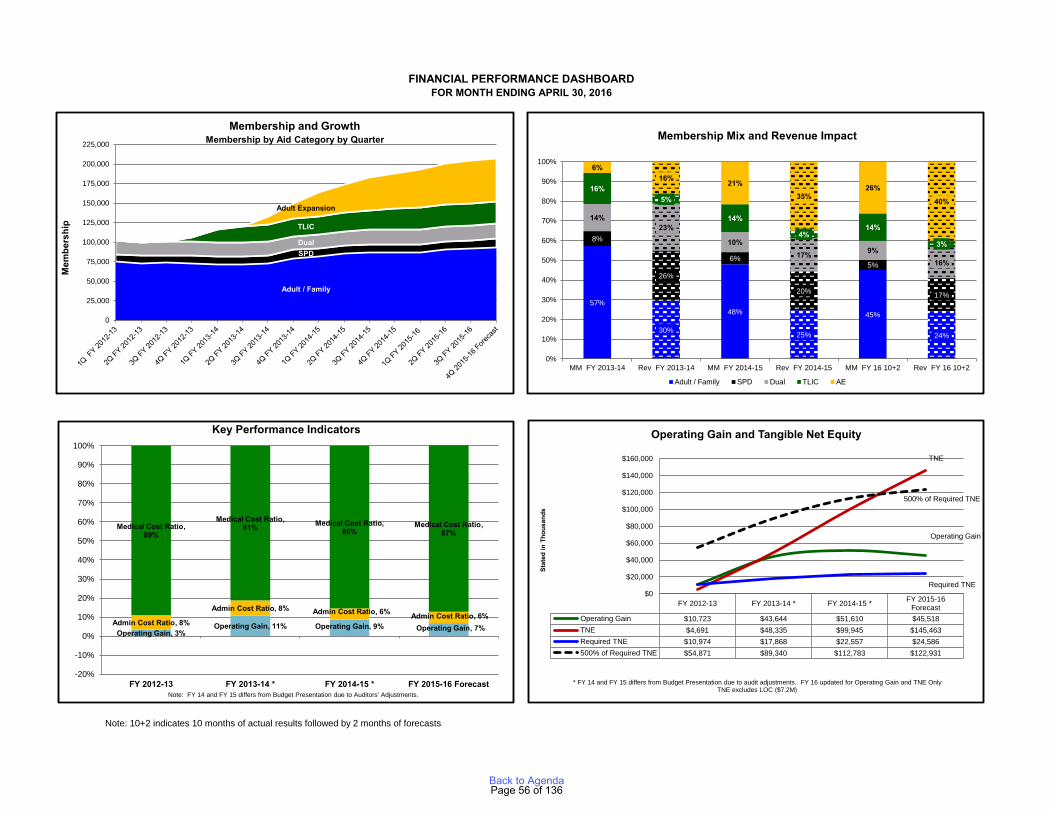
Note: 10+2 indicates 10 months of actual results followed by 2 months of forecasts
FINANCIAL PERFORMANCE DASHBOARDFOR MONTH ENDING APRIL 30, 2016
Adult / Family
SPDDual
TLIC
Adult Expansion
0
25,000
50,000
75,000
100,000
125,000
150,000
175,000
200,000
225,000
Mem
bers
hip
Membership and GrowthMembership by Aid Category by Quarter
57%
30%
48%
25%
45%
24%
8%
26%
6%
20%
5%
17%
14%23%
10%17% 9%
16%
16%5%
14%
4%14%
3%
6%16% 21%
35%26%
40%
0%
10%
20%
30%
40%
50%
60%
70%
80%
90%
100%
MM FY 2013-14 Rev FY 2013-14 MM FY 2014-15 Rev FY 2014-15 MM FY 16 10+2 Rev FY 16 10+2
Adult / Family SPD Dual TLIC AE
Membership Mix and Revenue Impact
Operating Gain, 3%Operating Gain, 11% Operating Gain, 9% Operating Gain, 7%
Admin Cost Ratio, 8%
Admin Cost Ratio, 8% Admin Cost Ratio, 6% Admin Cost Ratio, 6%
Medical Cost Ratio, 89%
Medical Cost Ratio, 81% Medical Cost Ratio,
86%Medical Cost Ratio,
87%
ARCH / Provider Incentive, 0%
ARCH / Provider Incentive, 0%
ARCH / Provider Incentive, 0%
-20%
-10%
0%
10%
20%
30%
40%
50%
60%
70%
80%
90%
100%
FY 2012-13 FY 2013-14 * FY 2014-15 * FY 2015-16 ForecastNote: FY 14 and FY 15 differs from Budget Presentation due to Auditors' Adjustments.
Key Performance Indicators
FY 2012-13 FY 2013-14 * FY 2014-15 * FY 2015-16Forecast
Operating Gain $10,723 $43,644 $51,610 $45,518TNE $4,691 $48,335 $99,945 $145,463Required TNE $10,974 $17,868 $22,557 $24,586500% of Required TNE $54,871 $89,340 $112,783 $122,931
Operating Gain
TNE
Required TNE
500% of Required TNE
$0
$20,000
$40,000
$60,000
$80,000
$100,000
$120,000
$140,000
$160,000
Stat
ed in
Tho
usan
ds
Operating Gain and Tangible Net Equity
* FY 14 and FY 15 differs from Budget Presentation due to audit adjustments. FY 16 updated for Operating Gain and TNE Only TNE excludes LOC ($7.2M)
Page 56 of 136Back to Agenda
For the month ended April 30, 2016
APPENDIX
● Statement of Financial Positions
● YTD Statement of Revenues, Expenses and Changes in Net Assets
● Statement of Revenues, Expenses and Changes in Net Assets
● Statement of Financial Positions
● YTD Cash Flow
● Monthly Cash Flow
● Cash Trend Combined
● Membership
● Total Expense Composition
● Paid Claims and IBNP Composition
● Pharmacy Cost & Utilization Trends
Page 57 of 136Back to Agenda
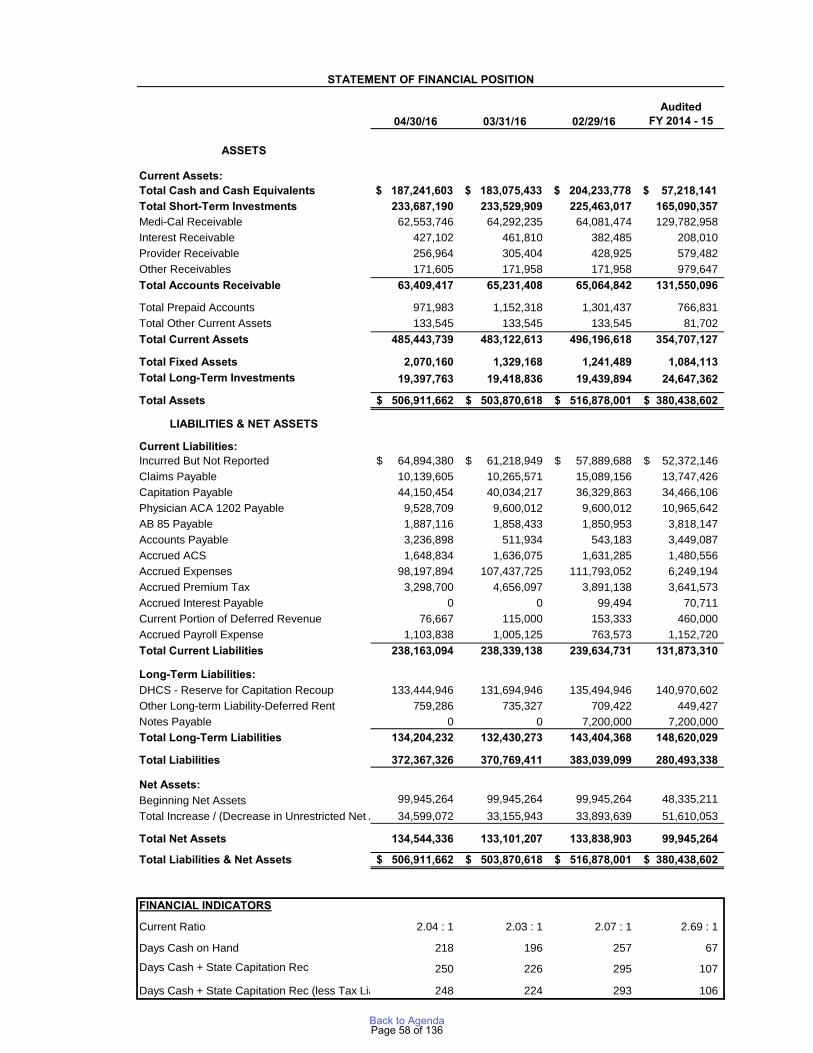
04/30/16 03/31/16 02/29/16Audited
FY 2014 - 15
ASSETS
Current Assets:Total Cash and Cash Equivalents $ 187,241,603 $ 183,075,433 $ 204,233,778 $ 57,218,141 Total Short-Term Investments 233,687,190 233,529,909 225,463,017 165,090,357Medi-Cal Receivable 62,553,746 64,292,235 64,081,474 129,782,958Interest Receivable 427,102 461,810 382,485 208,010Provider Receivable 256,964 305,404 428,925 579,482Other Receivables 171,605 171,958 171,958 979,647Total Accounts Receivable 63,409,417 65,231,408 65,064,842 131,550,096
Total Prepaid Accounts 971,983 1,152,318 1,301,437 766,831Total Other Current Assets 133,545 133,545 133,545 81,702Total Current Assets 485,443,739 483,122,613 496,196,618 354,707,127
Total Fixed Assets 2,070,160 1,329,168 1,241,489 1,084,113Total Long-Term Investments 19,397,763 19,418,836 19,439,894 24,647,362
Total Assets 506,911,662$ 503,870,618$ 516,878,001$ 380,438,602$
LIABILITIES & NET ASSETS
Current Liabilities:Incurred But Not Reported 64,894,380$ 61,218,949$ 57,889,688$ 52,372,146$ Claims Payable 10,139,605 10,265,571 15,089,156 13,747,426Capitation Payable 44,150,454 40,034,217 36,329,863 34,466,106Physician ACA 1202 Payable 9,528,709 9,600,012 9,600,012 10,965,642AB 85 Payable 1,887,116 1,858,433 1,850,953 3,818,147Accounts Payable 3,236,898 511,934 543,183 3,449,087Accrued ACS 1,648,834 1,636,075 1,631,285 1,480,556Accrued Expenses 98,197,894 107,437,725 111,793,052 6,249,194Accrued Premium Tax 3,298,700 4,656,097 3,891,138 3,641,573Accrued Interest Payable 0 0 99,494 70,711Current Portion of Deferred Revenue 76,667 115,000 153,333 460,000Accrued Payroll Expense 1,103,838 1,005,125 763,573 1,152,720Total Current Liabilities 238,163,094 238,339,138 239,634,731 131,873,310
Long-Term Liabilities:DHCS - Reserve for Capitation Recoup 133,444,946 131,694,946 135,494,946 140,970,602Other Long-term Liability-Deferred Rent 759,286 735,327 709,422 449,427Notes Payable 0 0 7,200,000 7,200,000Total Long-Term Liabilities 134,204,232 132,430,273 143,404,368 148,620,029
Total Liabilities 372,367,326 370,769,411 383,039,099 280,493,338
Net Assets:Beginning Net Assets 99,945,264 99,945,264 99,945,264 48,335,211Total Increase / (Decrease in Unrestricted Net Assets)34,599,072 33,155,943 33,893,639 51,610,053
Total Net Assets 134,544,336 133,101,207 133,838,903 99,945,264
Total Liabilities & Net Assets 506,911,662$ 503,870,618$ 516,878,001$ 380,438,602$
FINANCIAL INDICATORS
Current Ratio 2.04 : 1 2.03 : 1 2.07 : 1 2.69 : 1
Days Cash on Hand 218 196 257 67
Days Cash + State Capitation Rec 250 226 295 107
Days Cash + State Capitation Rec (less Tax Liab) 248 224 293 106
STATEMENT OF FINANCIAL POSITION
Page 58 of 136Back to Agenda

Variance Actual Budget Fav / (Unfav)
Membership (includes retro members) 1,998,108 1,955,217 42,891
RevenuePremium 596,972,246$ 583,222,494$ 13,749,752$ Reserve for Rate Reduction (19,075,000) (30,623,870) 11,548,870MCO Premium Tax (21,465,258) (21,758,571) 293,313
Total Net Premium 556,431,987 530,840,053 25,591,934
Other Revenue:Miscellaneous Income 685,175 383,333 301,842
Total Other Revenue 685,175 383,333 301,842
Total Revenue 557,117,162 531,223,386 25,893,776
Medical Expenses:Capitation (PCP, Specialty, Kaiser, NEMT & Vision) 83,810,264 58,992,471 (24,817,793)
FFS Claims Expenses:Inpatient 91,571,380 100,062,619 8,491,239LTC / SNF 88,889,905 91,166,244 2,276,339Outpatient 36,936,296 32,242,322 (4,693,974)Laboratory and Radiology 3,124,996 2,274,080 (850,916)Emergency Room 15,887,383 13,124,834 (2,762,549)Physician Specialty 37,763,611 42,360,031 4,596,420Primary Care Physician 12,275,981 13,318,010 1,042,029Home & Community Based Services 12,360,388 12,481,313 120,925Applied Behavior Analysis Services 758,933 1,310,146 551,213Mental Health Services 3,726,826 4,506,915 780,089Pharmacy 81,120,769 77,254,201 (3,866,568)Provider Reserve 0 5,787,773 5,787,773Other Medical Professional 1,911,012 2,098,551 187,539Other Medical Care 1,032 0 (1,032)Other Fee For Service 5,989,147 6,064,521 75,374Transportation 1,205,599 1,449,304 243,705
Total Claims 393,519,445 405,500,864 11,981,419
Medical & Care Management Expense 13,140,077 17,703,517 4,563,440Reinsurance 2,059,055 2,807,990 748,936Claims Recoveries (1,676,169) 0 1,676,169
Sub-total 13,522,963 20,511,507 6,988,544
Total Cost of Health Care 490,852,672 485,004,842 (5,847,830)Contribution Margin 66,264,490 46,218,544 20,045,946
General & Administrative Expenses:Salaries and Wages 7,551,408 8,765,685 1,214,277Payroll Taxes and Benefits 2,040,864 2,647,639 606,775Travel and Training 206,304 507,987 301,683Outside Service - ACS 16,007,834 15,116,933 (890,901)Outside Services - Other 1,512,710 1,818,661 305,951Accounting & Actuarial Services 217,673 222,000 4,328Legal 1,282,263 875,000 (407,263)Insurance 325,641 271,680 (53,961)Lease Expense - Office 793,640 869,400 75,760Consulting Services 907,080 1,337,833 430,753Advertising and Promotion 60,528 65,246 4,718General Office 1,446,280 2,305,118 858,838Depreciation & Amortization 219,235 370,865 151,630Printing 64,651 163,175 98,524Shipping & Postage 94,668 131,255 36,587Interest 346,697 216,471 (130,226)
Total G & A Expenses 33,077,475 35,684,948 2,607,473
Total Operating Gain / (Loss) 33,187,015$ 10,533,596$ 22,653,419$
Non OperatingRevenues - Interest 1,445,932 1,000,000 445,932Expenses - Interest 33,876 17,115 (16,761)
Total Non-Operating 1,412,057 982,885 429,172
Total Increase / (Decrease) in Unrestricted Net Assets 34,599,072$ 11,516,481$ 23,082,591$
Net Assets, Beginning of Year 99,945,264Net Assets, End of Year 134,544,336
April 2016 Year-To-Date
STATEMENT OF REVENUES, EXPENSES AND CHANGES IN NET ASSETSFOR TEN MONTHS ENDING APRIL 30, 2015
Page 59 of 136Back to Agenda

JAN 16 FEB 16 MAR 16 Variance Actual Budget Fav / (Unfav)
Membership (includes retro members) 202,945 203,981 205,206 205,530 200,668 4,862
Revenue:Premium 60,525,329$ 60,531,080$ 61,560,475$ 61,368,425$ 58,428,417$ 2,940,008$ Reserve for Rate Reduction (2,100,000) (2,110,000) 3,800,000 (1,750,000) (1,622,916) (127,084)MCO Premium Tax (2,383,185) (2,383,411) (2,423,944) (375,856) (2,236,717) 1,860,861
Total Net Premium 56,042,144 56,037,668 62,936,531 59,242,569 54,568,784 4,673,785
Other Revenue:Miscellaneous Income 38,333 38,333 38,333 38,333 38,333 (0)
Total Other Revenue 38,333 38,333 38,333 38,333 38,333 (0)
Total Revenue 56,080,478 56,076,002 62,974,864 59,280,903 54,607,117 4,673,785
Medical Expenses:Capitation (PCP, Specialty, Kaiser, NEMT & Vision) 8,597,538 9,085,138 8,798,713 8,910,531 5,656,787 (3,253,744)
FFS Claims Expenses:Inpatient 9,397,915 7,392,640 12,503,077 10,955,509 10,492,792 (462,717)LTC / SNF 9,940,604 7,895,479 10,257,828 9,453,929 9,286,783 (167,146)Outpatient 3,126,572 3,379,287 4,852,606 3,309,821 3,356,669 46,848Laboratory and Radiology 544,597 278,498 197,693 251,864 238,088 (13,776)Emergency Room 1,534,104 1,672,260 2,487,940 1,867,611 1,362,119 (505,492)Physician Specialty 3,148,079 4,054,445 5,109,877 4,469,065 4,428,445 (40,620)Primary Care Physician 1,165,162 1,110,036 2,054,272 1,351,441 1,374,918 23,477Home & Community Based Services 1,468,164 1,158,925 1,323,347 1,432,175 1,271,641 (160,534)Applied Behavior Analysis Services 82,896 58,589 200,187 109,735 163,333 53,598Mental Health Services 318,802 298,271 434,177 387,574 467,192 79,618Pharmacy 8,140,173 8,431,109 9,377,773 8,840,622 8,043,909 (796,713)Provider Reserve 0 0 0 0 597,869 597,869Other Medical Professional 259,041 165,970 292,238 249,687 218,791 (30,896)Other Medical Care 0 293 0 0 0 0Other Fee For Service 549,506 599,049 655,014 678,196 625,054 (53,142)Transportation 97,684 114,225 152,782 104,234 150,982 46,748
Total Claims 39,773,299 36,609,076 49,898,811 43,461,462 42,078,585 (1,382,877)
Medical & Care Management Expense 1,325,198 1,185,612 1,344,784 1,301,636 1,874,943 573,307Reinsurance 133,103 291,461 291,220 292,601 296,091 3,490Claims Recoveries (611,548) (274,027) (78,857) (40,201) 0 40,201
Sub-total 846,753 1,203,046 1,557,148 1,554,036 2,171,034 616,998
Total Cost of Health Care 49,217,590 46,897,260 60,254,672 53,926,029 49,906,406 (4,019,623)Contribution Margin 6,862,888 9,178,742 2,720,192 5,354,874 4,700,711 654,163
General & Administrative Expenses:Salaries and Wages 794,596 740,575 866,810 767,490 941,603 174,113 Payroll Taxes and Benefits 239,223 217,016 221,933 221,391 293,341 71,950 Travel and Training 19,361 40,568 35,035 20,844 39,201 18,357 Outside Service - ACS 1,614,744 1,613,004 1,637,111 1,670,227 1,550,291 (119,936)Outside Services - Other 140,276 183,036 173,053 175,025 193,462 18,437 Accounting & Actuarial Services 1,680 6,895 18,300 24,060 0 (24,060)Legal 155,481 130,846 183,477 541,187 87,500 (453,687)Insurance 32,588 32,588 32,588 32,177 27,168 (5,009)Lease Expense - Office 66,034 110,467 110,467 110,467 86,940 (23,527)Consulting Services 152,043 82,510 38,009 261,268 140,644 (120,624)Advertising and Promotion 2,721 3,803 2,849 2,956 1,973 (983)General Office 105,893 131,842 160,291 159,493 178,426 18,933 Depreciation & Amortization 21,247 21,153 21,153 32,100 46,562 14,462 Printing 9,836 376 19,515 11,514 14,245 2,731 Shipping & Postage 29,771 108 3,610 22,178 8,144 (14,034)Interest 25,541 9,282 98,188 36,253 22,162 (14,091)
Total G & A Expenses 3,411,034 3,324,069 3,622,389 4,088,628 3,631,662 (456,966) Total Operating Gain / (Loss) 3,451,854 5,854,672 (902,197) 1,266,246 1,069,049 197,197
Non Operating:Revenues - Interest 152,995 153,877 169,594 176,883 100,000 76,883Expenses - Interest 1,361 3,588 5,092 0 34 34
Total Non-Operating 151,634 150,288 164,501 176,883 99,966 76,917
Total Increase / (Decrease) in Unrestricted Net Assets 3,603,488 6,004,961 (737,696) 1,443,129 1,169,015 274,114
Full Time Employees 183 204 21
APRIL 2016
STATEMENT OF REVENUES, EXPENSES AND CHANGES IN NET ASSETS
Current MonthFY 2015-16 Monthly Trend
Page 60 of 136Back to Agenda

Variance JAN 16 FEB 16 MAR 16 Actual Budget Fav / (Unfav)
Membership (includes retro members) 202,945 203,981 205,206 205,530 200,668 4,862
Revenue:Premium 298.24 296.75 299.99 298.59 291.17 7.42Reserve for Rate Reduction (10.35) (10.34) 18.52 (8.51) (8.09) (0.43)MCO Premium Tax (11.74) (11.68) (11.81) (1.83) (11.15) 9.32
Total Net Premium 276.14 274.72 306.70 288.24 271.94 16.31
Other Revenue:Interest Income 0.00 0.00 0.00 0.00 0.00 0.00Miscellaneous Income 0.19 0.19 0.19 0.19 0.19 (0.00)
Total Other Revenue 0.19 0.19 0.19 0.19 0.19 (0.00)
Total Revenue 276.33 274.91 306.89 288.43 272.13 16.30
Medical Expenses:Capitation (PCP, Specialty, Kaiser, NEMT & Vision) 42.36 44.54 42.88 43.35 28.19 (15.16)
FFS Claims Expenses:Inpatient 46.31 36.24 60.93 53.30 52.29 (1.01)LTC / SNF 48.98 38.71 49.99 46.00 46.28 0.28Outpatient 15.41 16.57 23.65 16.10 16.73 0.62Laboratory and Radiology 2.68 1.37 0.96 1.23 1.19 (0.04)Emergency Room 7.56 8.20 12.12 9.09 6.79 (2.30)Physician Specialty 15.51 19.88 24.90 21.74 22.07 0.32Primary Care Physician 5.74 5.44 10.01 6.58 6.85 0.28Home & Community Based Services 7.23 5.68 6.45 6.97 6.34 (0.63)Applied Behavior Analysis Services 0.41 0.29 0.98 0.53 0.81 0.28Mental Health Services 1.57 1.46 2.12 1.89 2.33 0.44Pharmacy 40.11 41.33 45.70 43.01 40.09 (2.93)Provider Reserve 0.00 0.00 0.00 0.00 2.98 2.98Other Medical Professional 1.28 0.81 1.42 1.21 1.09 (0.12)Other Medical Care 0.00 0.00 0.00 0.00 0.00 0.00Other Fee For Service 2.71 2.94 3.19 3.30 3.11 (0.18)Transportation 0.48 0.56 0.74 0.51 0.75 0.25
Total Claims 195.98 179.47 243.16 211.46 209.69 (1.77)
Medical & Care Management Expense 6.53 5.81 6.55 6.33 9.34 3.01Reinsurance 0.66 1.43 1.42 1.42 1.48 0.05Claims Recoveries (3.01) (1.34) (0.38) (0.20) 0.00 0.20
Sub-total 4.17 5.90 7.59 7.56 10.82 3.26
Total Cost of Health Care 242.52 229.91 293.63 262.38 248.70 (13.67)Contribution Margin 33.82 45.00 13.26 26.05 23.43 2.63
General & Administrative Expenses:Salaries and Wages 3.92 3.63 4.22 3.73 4.69 0.96Payroll Taxes and Benefits 1.18 1.06 1.08 1.08 1.46 0.38Travel and Training 0.10 0.20 0.17 0.10 0.20 0.09Outside Service - ACS 7.96 7.91 7.98 8.13 7.73 (0.40)Outside Services - Other 0.69 0.90 0.84 0.85 0.96 0.11Accounting & Actuarial Services 0.01 0.03 0.09 0.12 0.00 (0.12)Legal 0.77 0.64 0.89 2.63 0.44 (2.20)Insurance 0.16 0.16 0.16 0.16 0.14 (0.02)Lease Expense - Office 0.33 0.54 0.54 0.54 0.43 (0.10)Consulting Services 0.75 0.40 0.19 1.27 0.70 (0.57)Advertising and Promotion 0.01 0.02 0.01 0.01 0.01 (0.00)General Office 0.52 0.65 0.78 0.78 0.89 0.11Depreciation & Amortization 0.10 0.10 0.10 0.16 0.23 0.08Printing 0.05 0.00 0.10 0.06 0.07 0.01Shipping & Postage 0.15 0.00 0.02 0.11 0.04 (0.07)Interest 0.13 0.05 0.48 0.18 0.11 (0.07)Other/ Miscellaneous Expenses 0.00 0.00 0.00 0.00 0.00 0.00
Total G & A Expenses 16.81 16.30 17.65 19.89 18.10 (1.80)
Total Operating Gain / (Loss) 17.01 28.70 (4.40) 6.16 5.33 0.83
Non Operating:Revenues - Interest 0.75 0.75 0.83 0.86 0.50 0.36Expenses - Interest 0.01 0.02 0.02 0.00 0.00 0.00
Total Non-Operating 0.75 0.74 0.80 0.86 0.50 0.36
Total Increase / (Decrease) in Unrestricted Net Assets 17.76 29.44 (3.59) 7.02 5.83 1.20
APRIL 2016
PMPM - STATEMENT OF REVENUES, EXPENSES AND CHANGES IN NET ASSETS
Page 61 of 136Back to Agenda
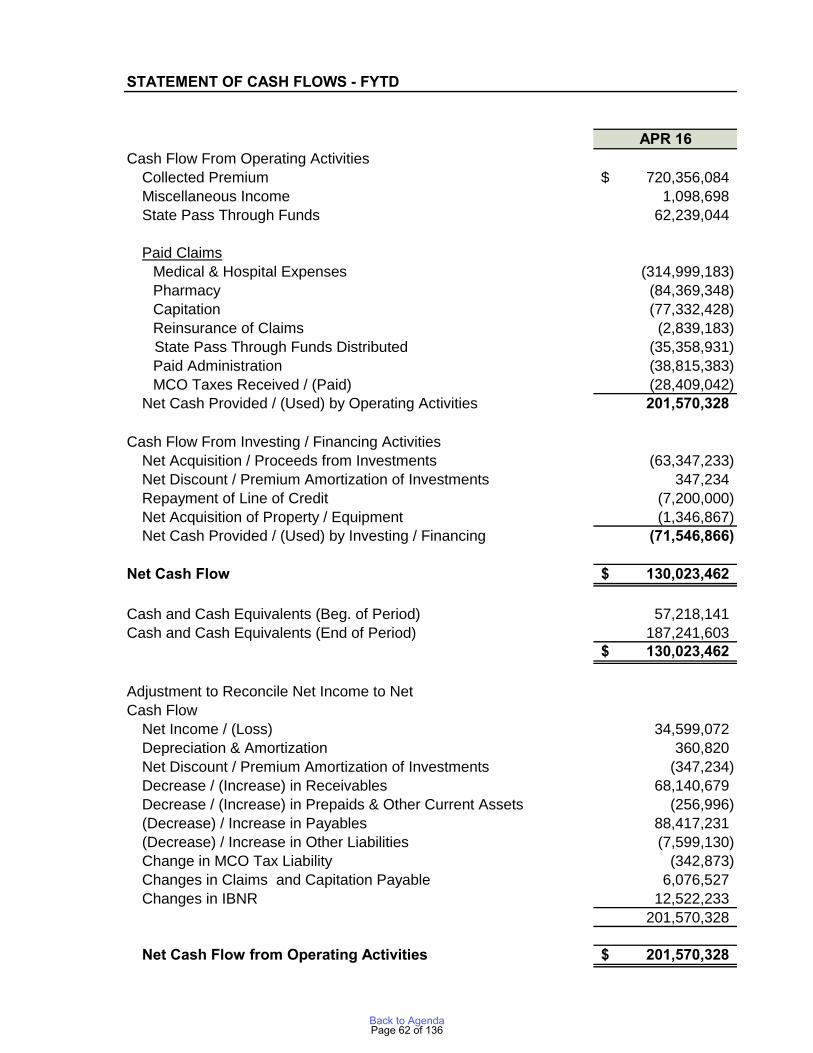
STATEMENT OF CASH FLOWS - FYTD
APR 16Cash Flow From Operating Activities
Collected Premium 720,356,084$ Miscellaneous Income 1,098,698 State Pass Through Funds 62,239,044
Paid ClaimsMedical & Hospital Expenses (314,999,183) Pharmacy (84,369,348) Capitation (77,332,428) Reinsurance of Claims (2,839,183)
State Pass Through Funds Distributed (35,358,931) Paid Administration (38,815,383) MCO Taxes Received / (Paid) (28,409,042)
Net Cash Provided / (Used) by Operating Activities 201,570,328
Cash Flow From Investing / Financing ActivitiesNet Acquisition / Proceeds from Investments (63,347,233) Net Discount / Premium Amortization of Investments 347,234 Repayment of Line of Credit (7,200,000) Net Acquisition of Property / Equipment (1,346,867) Net Cash Provided / (Used) by Investing / Financing (71,546,866)
Net Cash Flow 130,023,462$
Cash and Cash Equivalents (Beg. of Period) 57,218,141 Cash and Cash Equivalents (End of Period) 187,241,603
130,023,462$
Adjustment to Reconcile Net Income to NetCash Flow
Net Income / (Loss) 34,599,072 Depreciation & Amortization 360,820 Net Discount / Premium Amortization of Investments (347,234) Decrease / (Increase) in Receivables 68,140,679 Decrease / (Increase) in Prepaids & Other Current Assets (256,996) (Decrease) / Increase in Payables 88,417,231 (Decrease) / Increase in Other Liabilities (7,599,130) Change in MCO Tax Liability (342,873) Changes in Claims and Capitation Payable 6,076,527 Changes in IBNR 12,522,233
201,570,328
Net Cash Flow from Operating Activities 201,570,328$
Page 62 of 136Back to Agenda
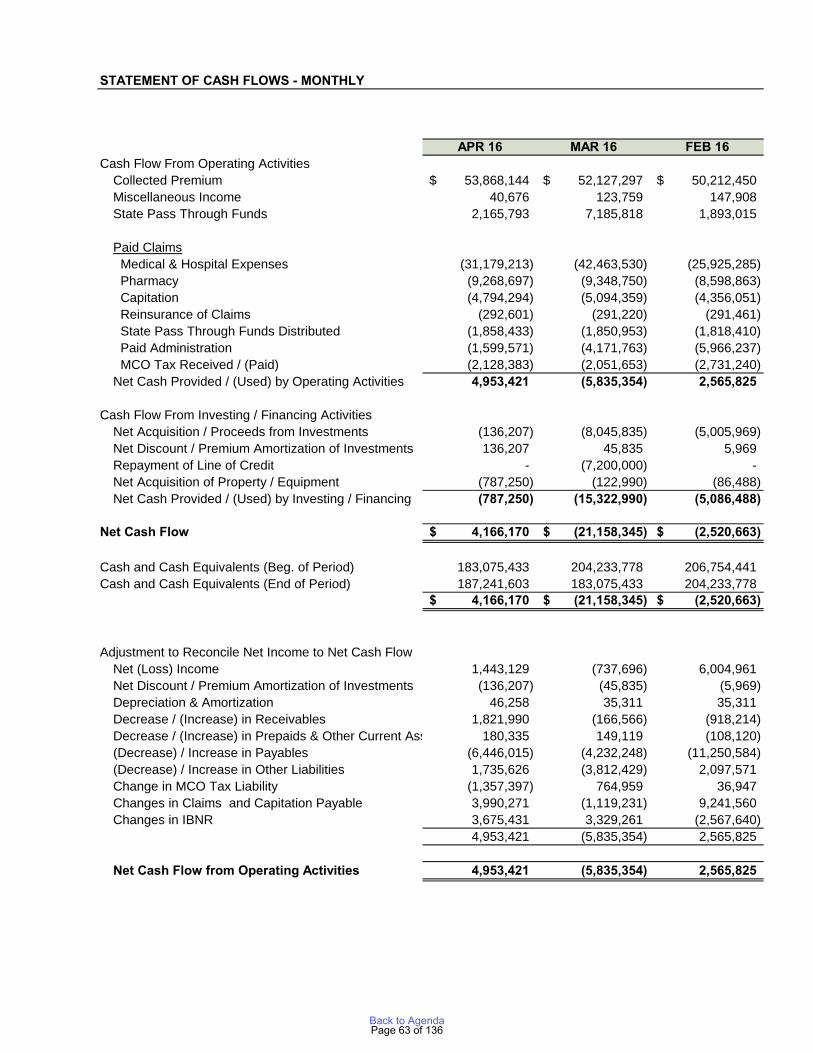
STATEMENT OF CASH FLOWS - MONTHLY
APR 16 MAR 16 FEB 16Cash Flow From Operating Activities
Collected Premium 53,868,144$ 52,127,297$ 50,212,450$ Miscellaneous Income 40,676 123,759 147,908 State Pass Through Funds 2,165,793 7,185,818 1,893,015
Paid Claims Medical & Hospital Expenses (31,179,213) (42,463,530) (25,925,285) Pharmacy (9,268,697) (9,348,750) (8,598,863) Capitation (4,794,294) (5,094,359) (4,356,051) Reinsurance of Claims (292,601) (291,220) (291,461) State Pass Through Funds Distributed (1,858,433) (1,850,953) (1,818,410) Paid Administration (1,599,571) (4,171,763) (5,966,237) MCO Tax Received / (Paid) (2,128,383) (2,051,653) (2,731,240) Net Cash Provided / (Used) by Operating Activities 4,953,421 (5,835,354) 2,565,825
Cash Flow From Investing / Financing ActivitiesNet Acquisition / Proceeds from Investments (136,207) (8,045,835) (5,005,969) Net Discount / Premium Amortization of Investments 136,207 45,835 5,969 Repayment of Line of Credit - (7,200,000) - Net Acquisition of Property / Equipment (787,250) (122,990) (86,488) Net Cash Provided / (Used) by Investing / Financing (787,250) (15,322,990) (5,086,488)
Net Cash Flow 4,166,170$ (21,158,345)$ (2,520,663)$
Cash and Cash Equivalents (Beg. of Period) 183,075,433 204,233,778 206,754,441 Cash and Cash Equivalents (End of Period) 187,241,603 183,075,433 204,233,778
4,166,170$ (21,158,345)$ (2,520,663)$
Adjustment to Reconcile Net Income to Net Cash FlowNet (Loss) Income 1,443,129 (737,696) 6,004,961 Net Discount / Premium Amortization of Investments (136,207) (45,835) (5,969) Depreciation & Amortization 46,258 35,311 35,311 Decrease / (Increase) in Receivables 1,821,990 (166,566) (918,214) Decrease / (Increase) in Prepaids & Other Current Assets 180,335 149,119 (108,120) (Decrease) / Increase in Payables (6,446,015) (4,232,248) (11,250,584) (Decrease) / Increase in Other Liabilities 1,735,626 (3,812,429) 2,097,571 Change in MCO Tax Liability (1,357,397) 764,959 36,947 Changes in Claims and Capitation Payable 3,990,271 (1,119,231) 9,241,560 Changes in IBNR 3,675,431 3,329,261 (2,567,640)
4,953,421 (5,835,354) 2,565,825
Net Cash Flow from Operating Activities 4,953,421 (5,835,354) 2,565,825
Page 63 of 136Back to Agenda

Less: Passthough Funds from State
Less: Passthough Funds from State
GOLD COAST HEALTH PLANAPRIL 2016
$351.54
$403.80 $406.84
$427.99
$457.76 $464.64 $484.62 $488.04
$474.38 $478.30
$176.73 $194.52
$215.06
$236.21
$264.27
$294.73 $311.31
$342.44 $360.38 $357.36
$392.84 $399.53 $407.70 $413.57 $421.13 $419.99 $415.80 $423.02 $424.97 $429.70
$150
$200
$250
$300
$350
$400
$450
$500
$550
Jul Aug Sep Oct Nov Dec Jan Feb Mar Apr
Cash + Medi-Cal Receivable Trend ($ in Millions)(Net of MCO Tax Liability and excludes pass-through funds)
FY 2015-16Reported
FY 2014-15 Reported
FY 2015-16
Page 64 of 136Back to Agenda
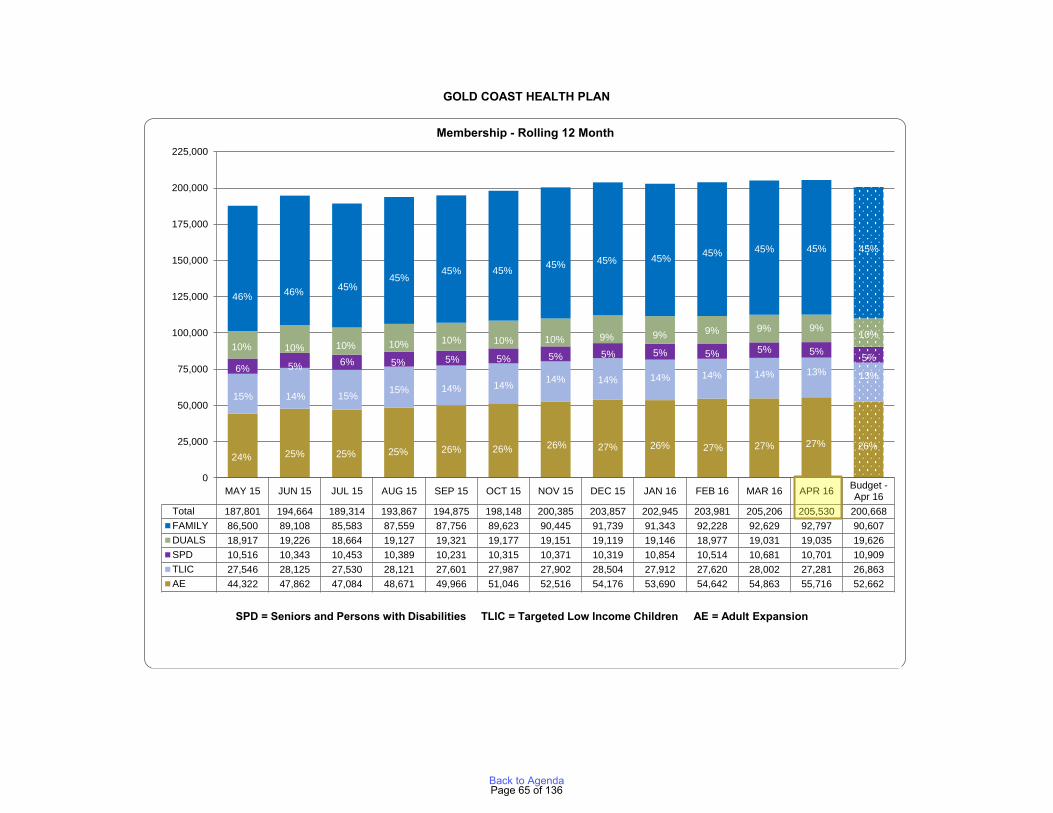
GOLD COAST HEALTH PLAN
MAY 15 JUN 15 JUL 15 AUG 15 SEP 15 OCT 15 NOV 15 DEC 15 JAN 16 FEB 16 MAR 16 APR 16 Budget -Apr 16
Total 187,801 194,664 189,314 193,867 194,875 198,148 200,385 203,857 202,945 203,981 205,206 205,530 200,668FAMILY 86,500 89,108 85,583 87,559 87,756 89,623 90,445 91,739 91,343 92,228 92,629 92,797 90,607DUALS 18,917 19,226 18,664 19,127 19,321 19,177 19,151 19,119 19,146 18,977 19,031 19,035 19,626SPD 10,516 10,343 10,453 10,389 10,231 10,315 10,371 10,319 10,854 10,514 10,681 10,701 10,909TLIC 27,546 28,125 27,530 28,121 27,601 27,987 27,902 28,504 27,912 27,620 28,002 27,281 26,863AE 44,322 47,862 47,084 48,671 49,966 51,046 52,516 54,176 53,690 54,642 54,863 55,716 52,662AE1 24% 25% 25% 25% 26% 26% 26% 27% 26% 27% 27% 27% 26%FAMILY1 46% 46% 45% 45% 45% 45% 45% 45% 45% 45% 45% 45% 45%DUALS1 10% 10% 10% 10% 10% 10% 10% 9% 9% 9% 9% 9% 10%SPD1 6% 5% 6% 5% 5% 5% 5% 5% 5% 5% 5% 5% 5%TLIC1 15% 14% 15% 15% 14% 14% 14% 14% 14% 14% 14% 13% 13%
15% 14% 15% 15% 14% 14% 14% 14% 14% 14% 14% 13% 13%6% 5% 6% 5% 5% 5% 5% 5% 5% 5% 5% 5% 5%
10% 10% 10% 10% 10% 10% 10% 9% 9% 9% 9% 9% 10%
46% 46% 45%45%
45% 45% 45% 45% 45% 45% 45% 45% 45%
24% 25% 25% 25% 26% 26% 26% 27% 26% 27% 27% 27% 26%
0
25,000
50,000
75,000
100,000
125,000
150,000
175,000
200,000
225,000
Membership - Rolling 12 Month
SPDSPD = Seniors and Persons with Disabilities TLIC = Targeted Low Income Children AE = Adult Expansion
Page 65 of 136Back to Agenda
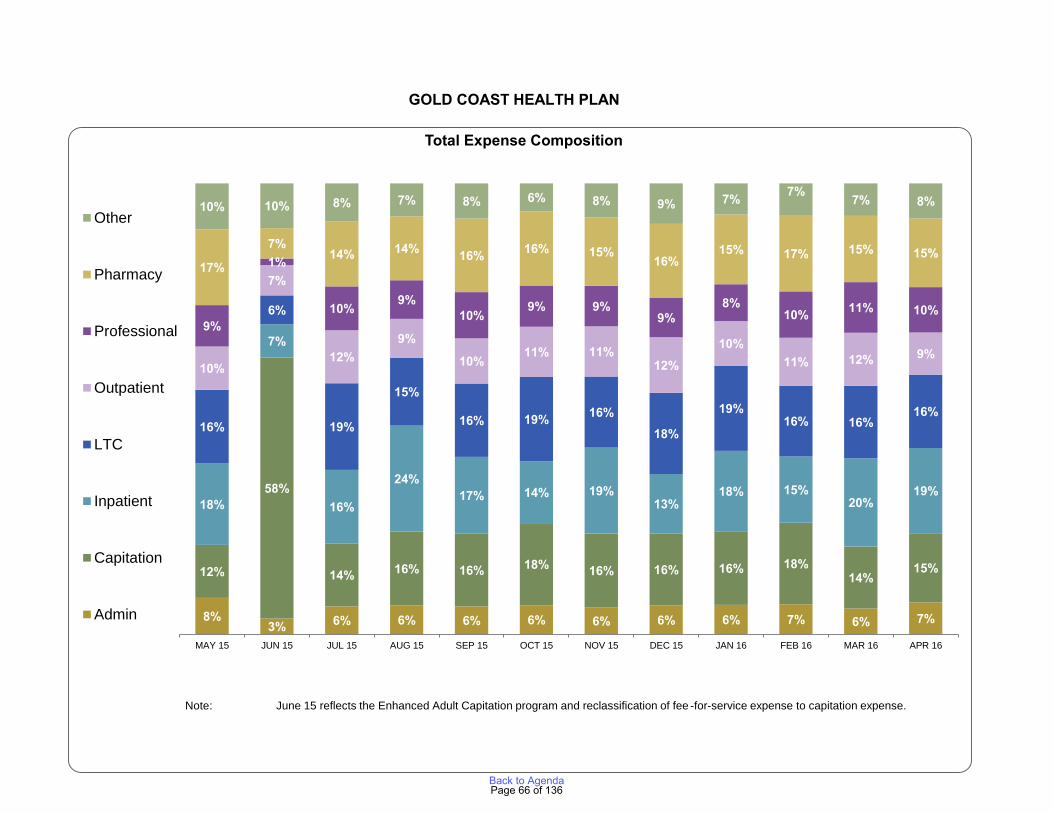
For the month ended February 28, 2014
GOLD COAST HEALTH PLAN
8%3% 6% 6% 6% 6% 6% 6% 6% 7% 6% 7%
12%
58%
14% 16% 16% 18% 16% 16% 16% 18%14%
15%
18%
7%
16%
24%17% 14% 19%
13%18% 15%
20%19%
16%
6%
19%
15%
16% 19% 16%18%
19%16% 16%
16%
10%
7%
12%9%
10%11% 11%
12%10%
11% 12% 9%
9%
1%
10% 9%10%
9% 9%9%
8%10% 11% 10%
17%
7%14% 14% 16% 16% 15%
16%15% 17% 15% 15%
10% 10% 8% 7% 8% 6% 8% 9% 7% 7% 7% 8%
MAY 15 JUN 15 JUL 15 AUG 15 SEP 15 OCT 15 NOV 15 DEC 15 JAN 16 FEB 16 MAR 16 APR 16
Total Expense Composition
Other
Pharmacy
Professional
Outpatient
LTC
Inpatient
Capitation
Admin
Note: June 15 reflects the Enhanced Adult Capitation program and reclassification of fee -for-service expense to capitation expense.
Page 66 of 136Back to Agenda
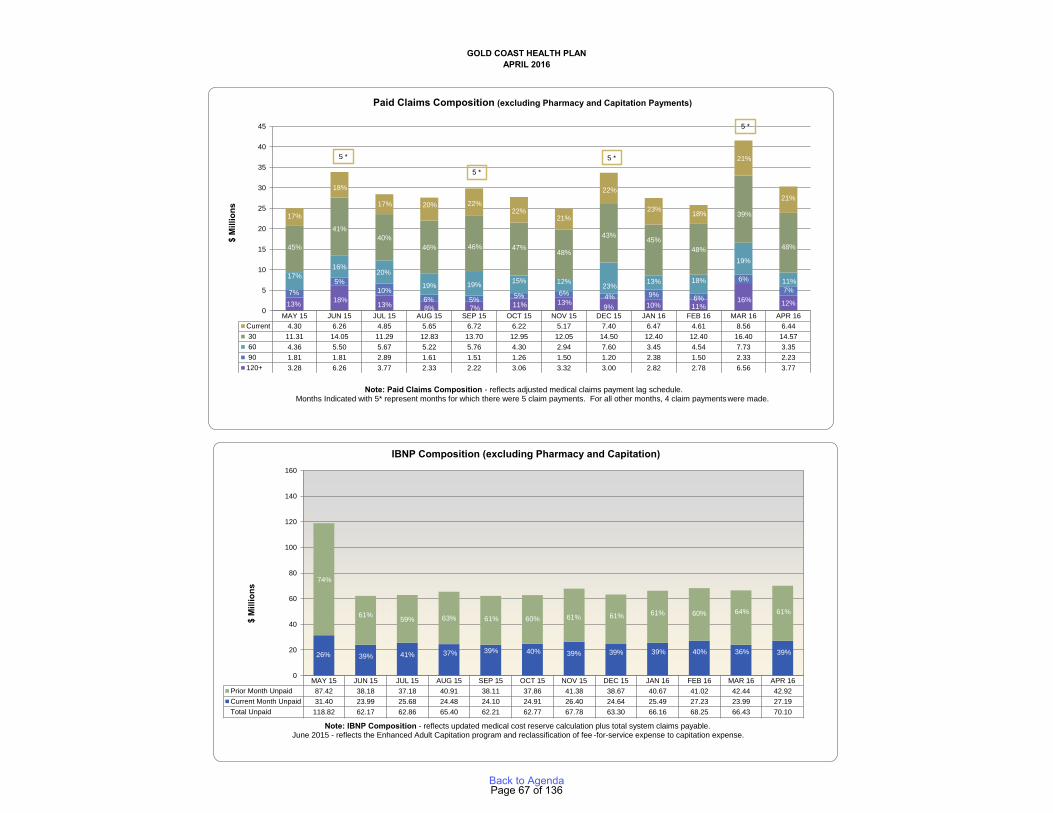
For Reporting Period:35 36 37 38 39 40 41 42 43 44 45 46
10/1/2012 0 MAY 15 JUN 15 JUL 15 AUG 15 SEP 15 OCT 15 NOV 15 DEC 15 JAN 16 FEB 16 MAR 16 APR 16 018 2 120+ 3.28 6.26 3.77 2.33 2.22 3.06 3.32 3.00 2.82 2.78 6.56 3.77 0
3 90 1.81 1.81 2.89 1.61 1.51 1.26 1.50 1.20 2.38 1.50 2.33 2.23 04 60 4.36 5.50 5.67 5.22 5.76 4.30 2.94 7.60 3.45 4.54 7.73 3.35 05 30 11.31 14.05 11.29 12.83 13.70 12.95 12.05 14.50 12.40 12.40 16.40 14.57 0
For the month ended February 28, 2014 6 Current 4.30 6.26 4.85 5.65 6.72 6.22 5.17 7.40 6.47 4.61 8.56 6.44 012 120+ 13% 18% 13% 8% 7% 11% 13% 9% 10% 11% 16% 12% 013 90 7% 5% 10% 6% 5% 5% 6% 4% 9% 6% 6% 7% 014 60 17% 16% 20% 19% 19% 15% 12% 23% 13% 18% 19% 11% 015 30 45% 41% 40% 46% 46% 47% 48% 43% 45% 48% 39% 48% 016 Current 17% 18% 17% 20% 22% 22% 21% 22% 23% 18% 21% 21% 0
APRIL 2016GOLD COAST HEALTH PLAN
Friday, August 01, 2014
MAY 15 JUN 15 JUL 15 AUG 15 SEP 15 OCT 15 NOV 15 DEC 15 JAN 16 FEB 16 MAR 16 APR 16Current 4.30 6.26 4.85 5.65 6.72 6.22 5.17 7.40 6.47 4.61 8.56 6.44 30 11.31 14.05 11.29 12.83 13.70 12.95 12.05 14.50 12.40 12.40 16.40 14.57 60 4.36 5.50 5.67 5.22 5.76 4.30 2.94 7.60 3.45 4.54 7.73 3.35 90 1.81 1.81 2.89 1.61 1.51 1.26 1.50 1.20 2.38 1.50 2.33 2.23120+ 3.28 6.26 3.77 2.33 2.22 3.06 3.32 3.00 2.82 2.78 6.56 3.77Current 17% 18% 17% 20% 22% 22% 21% 22% 23% 18% 21% 21%30 45% 41% 40% 46% 46% 47% 48% 43% 45% 48% 39% 48%60 17% 16% 20% 19% 19% 15% 12% 23% 13% 18% 19% 11%90 7% 5% 10% 6% 5% 5% 6% 4% 9% 6% 6% 7%120+ 13% 18% 13% 8% 7% 11% 13% 9% 10% 11% 16% 12%
13% 18%13% 8% 7% 11% 13% 9% 10% 11%
16% 12%7%
5%10%
6% 5% 5% 6% 4% 9% 6%
6%7%
17%16%
20%
19% 19% 15% 12% 23% 13% 18%
19%
11%
45%
41%40%
46% 46% 47%48%
43% 45%48%
39%
48%
17%
18%
17% 20% 22%22%
21%
22%
23% 18%
21%
21%
0
5
10
15
20
25
30
35
40
45
$ M
illio
ns
Paid Claims Composition (excluding Pharmacy and Capitation Payments)
5 *
MAY 15 JUN 15 JUL 15 AUG 15 SEP 15 OCT 15 NOV 15 DEC 15 JAN 16 FEB 16 MAR 16 APR 16Prior Month Unpaid 87.42 38.18 37.18 40.91 38.11 37.86 41.38 38.67 40.67 41.02 42.44 42.92Current Month Unpaid 31.40 23.99 25.68 24.48 24.10 24.91 26.40 24.64 25.49 27.23 23.99 27.19Total Unpaid 118.82 62.17 62.86 65.40 62.21 62.77 67.78 63.30 66.16 68.25 66.43 70.10Current Month Unpaid 74% 61% 59% 63% 61% 60% 61% 61% 61% 60% 64% 61%Prior Month Unpaid 26% 39% 41% 37% 39% 40% 39% 39% 39% 40% 36% 39%
74%
61% 59% 63% 61% 60% 61% 61% 61% 60% 64% 61%
26% 39% 41% 37% 39% 40% 39% 39% 39% 40% 36% 39%
0
20
40
60
80
100
120
140
160
IBNP Composition (excluding Pharmacy and Capitation)
Note: Paid Claims Composition - reflects adjusted medical claims payment lag schedule.Months Indicated with 5* represent months for which there were 5 claim payments. For all other months, 4 claim paymentswere made.
$ M
illio
ns
5 *
Note: IBNP Composition - reflects updated medical cost reserve calculation plus total system claims payable. June 2015 - reflects the Enhanced Adult Capitation program and reclassification of fee -for-service expense to capitation expense.
5 *
5 *
Page 67 of 136Back to Agenda
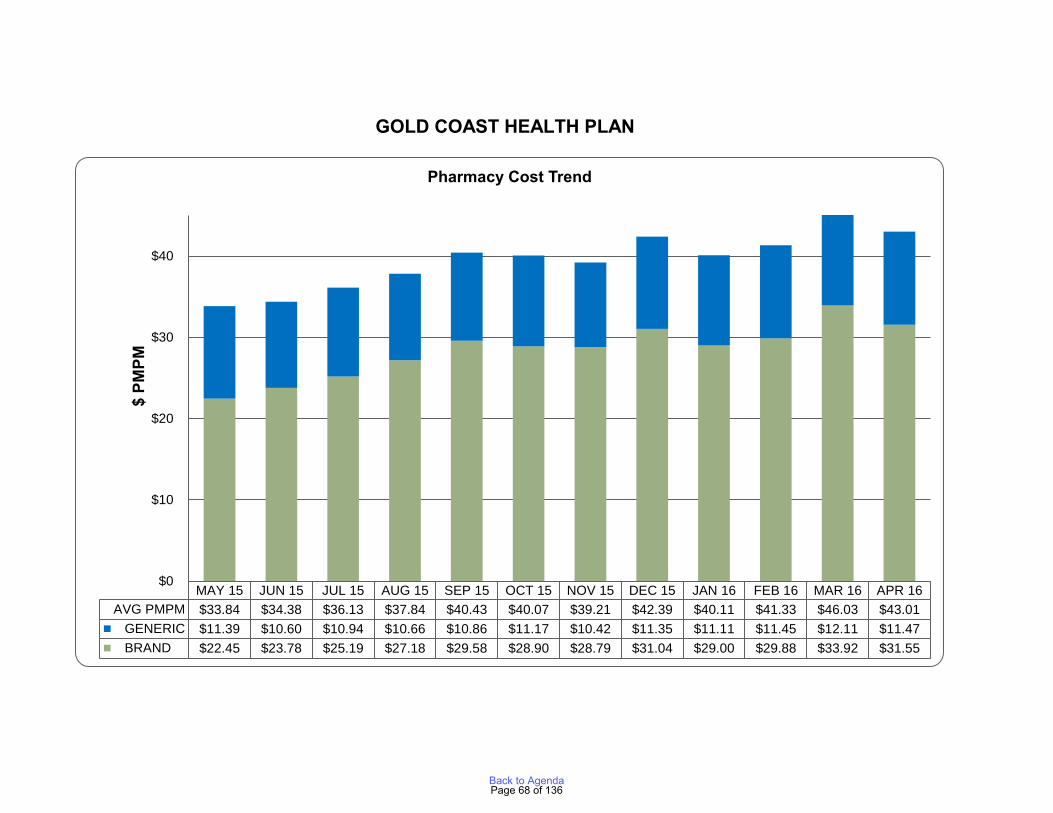
For the month ended February 28, 2014
GENERIC % all claims
Plan Cost BRAND GENERIC
Total
Plan Cost (Hep C Kick Deducted)Hep C Kick Payment
BRAND - Net of Hep C
Brand Cost pmpmGeneric Cost pmpmAVG PMPMPrior Year
GOLD COAST HEALTH PLAN
MAY 15 JUN 15 JUL 15 AUG 15 SEP 15 OCT 15 NOV 15 DEC 15 JAN 16 FEB 16 MAR 16 APR 16AVG PMPM $33.84 $34.38 $36.13 $37.84 $40.43 $40.07 $39.21 $42.39 $40.11 $41.33 $46.03 $43.01 GENERIC $11.39 $10.60 $10.94 $10.66 $10.86 $11.17 $10.42 $11.35 $11.11 $11.45 $12.11 $11.47 BRAND $22.45 $23.78 $25.19 $27.18 $29.58 $28.90 $28.79 $31.04 $29.00 $29.88 $33.92 $31.55
$0
$10
$20
$30
$40
$ PM
PM
Pharmacy Cost Trend
Page 68 of 136Back to Agenda
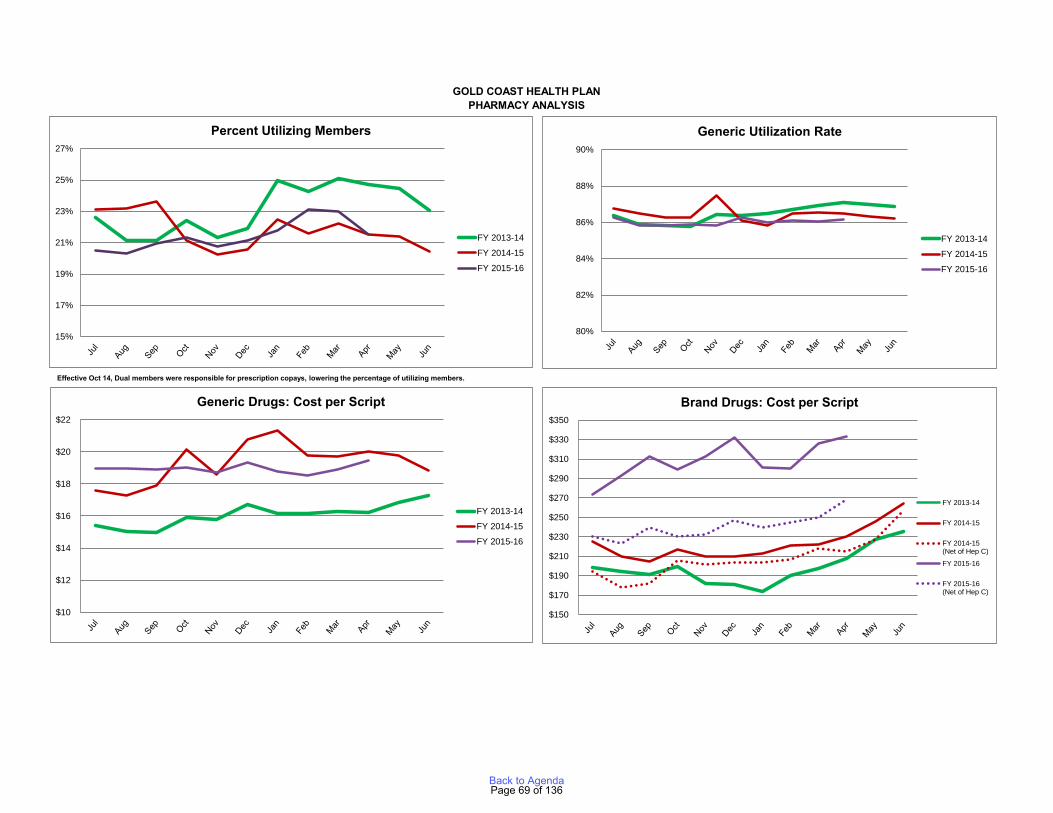
GOLD COAST HEALTH PLANPHARMACY ANALYSIS
15%
17%
19%
21%
23%
25%
27%
Percent Utilizing Members
FY 2013-14
FY 2014-15
FY 2015-16
80%
82%
84%
86%
88%
90%
Generic Utilization Rate
FY 2013-14
FY 2014-15
FY 2015-16
$10
$12
$14
$16
$18
$20
$22
Generic Drugs: Cost per Script
FY 2013-14
FY 2014-15
FY 2015-16
$150
$170
$190
$210
$230
$250
$270
$290
$310
$330
$350
Brand Drugs: Cost per Script
FY 2013-14
FY 2014-15
FY 2014-15(Net of Hep C)
FY 2015-16
FY 2015-16(Net of Hep C)
Effective Oct 14, Dual members were responsible for prescription copays, lowering the percentage of utilizing members.
Page 69 of 136Back to Agenda
AGENDA ITEM NO. 5 TO: Gold Coast Health Plan Commission FROM: Dale Villani, CEO DATE: June 27, 2016 SUBJECT: State of California Contract Amendment A22 SUMMARY: The State of California Department of Health Care Services (DHCS) establishes monthly capitation payments by major Medi-Cal population groups and updates them periodically to reflect policy changes and other adjustments. Amendment A22 reflects expected changes to Gold Coast Health Plan (GCHP or Plan) capitation rates for FY2014-15. BACKGROUND/DISCUSSION: GCHP received a contract amendment from DHCS on May 24, 2016 which updates the Plan’s FY2014-15 capitation rates for a certain Medi-Cal aid code as follows:
• The amendment adjusts the FY2014-15 rate for the second half of the fiscal year for the Adult Expansion (AE) population. The amended rate includes additional rate range funding for the county facility pursuant to Assembly Bill (AB) 85.
• The amendment also contains minor language changes related to the definitions of the Medical Loss Ratio calculation specific to the AE population.
FISCAL IMPACT: Amendment A22 memorializes rates included in a rate package received by GCHP on December 12, 2014. The decreased capitation rates for the FY2014-15 apply to the AE population only. As the Plan had recorded revenue based on the rates in the rate package, there is no impact to the Plan’s net assets. The AB85 funding included in the rates has been treated as a pass-through item and has not impacted the Plan’s net assets. RECOMMENDATION: Staff is recommending the Commission approve and authorize the CEO to execute DHCS contract amendment A22.
Page 70 of 136Back to Agenda

AGENDA ITEM NO. 6 TO: Gold Coast Health Plan Commission FROM: C. Albert Reeves, MD, Chief Medical Officer DATE: June 27, 2016 SUBJECT: Quality Improvement Committee Report RECOMMENDATION: To accept and file the 2016 First Quarter Quality Improvement Committee Report.
Page 71 of 136Back to Agenda
Quality Improvement
Committee Report
1st Quarter 2016
Commission Meeting 6/27/16
C. Albert Reeves, MD, CMO
Page 72 of 136Back to Agenda
HEDIS
2016 Status (March 29, 2016)
• This year’s HEDIS project is well underway. • Schedule:
- 1st production run February 25, 2016 - List of records for hybrid chart review (411)
February 4, 2016 - 2nd production run April 15, 2016 - Last day for hybrid chart review May 15, 2016 - NCQA locks results June 15, 2016 - NCQA final certification July 15, 2016
Page 73 of 136Back to Agenda
HEDIS
1. Diabetic Retinal Eye Exam Member Incentive – Preliminary results for HEDIS 2015 indicate that the rate will be high. This project is not carried over to 2016.
2. Cervical Cancer Screening – reminder letters – HEDIS Preliminary rates are low. Waiting for 2nd administrative run and chart review. Will review this project for effectiveness.
Page 74 of 136Back to Agenda
HEDIS
3. Children and Adolescents Access to Primary Care Providers Member Incentive – HEDIS Based upon the 1st administrative run:
For the W34 measure, we did not meet our goal of increasing the admin rate by 5%. For the CAP measure, we met our goal of meeting the MPL for the 12-24 age group; however this rate decreased by 1.01 percentage points. In contrast, the other three age groups in the CAP measure had improved rates, but these increased rates did not meet the MPL. Note: The preliminary 2015 MY rate may increase after the Admin Refresh in April 2016 that will capture any claims lags.
Page 75 of 136Back to Agenda
HEDIS
4. Postpartum Exam Member Incentive – HEDIS Based upon the 1st administrative run:
We almost met our goal of increasing the 2015 MY postpartum care administrative HEDIS rate by at least 5%. The 2015 preliminary admin rate increased 4.17 percentage points from 50.61 for the 2014 MY to 54.78 for the 2015 MY. However, due to expected claims lags resulting from contractual arrangements that allow providers to bill for services up to 180 days after services are rendered, the preliminary rates may increase after more 2015 postpartum claims are captured in the April 2016 admin refresh.
Page 76 of 136Back to Agenda
5. Medication Management in People on Persistent Medications - HEDIS
Based upon the 1st administrative run:
We were only 0.38 points from meeting our goal to increase the combined rate of medication monitoring labs at seventeen VCMC clinics by 5% from 85.48% to 90.48%, the expansion of the performance feedback reports had positive results and enabled us to identify barriers that are preventing the improvement of the MPM measure.
HEDIS
Page 77 of 136Back to Agenda
5. (Cont’d) The increase in labs completed by non-compliant members demonstrates that this intervention helps providers identify members who are missing labs. Of the 560 noncompliant members with no labs, providers ordered labs for 42.32% (237 members) but only 28.4% (159 members) completed their labs during the three-month study period. The study shows that providers are receptive to the reports but further analysis at the clinic level will help determine which clinics were less receptive and may need additional outreach.
HEDIS
Page 78 of 136Back to Agenda
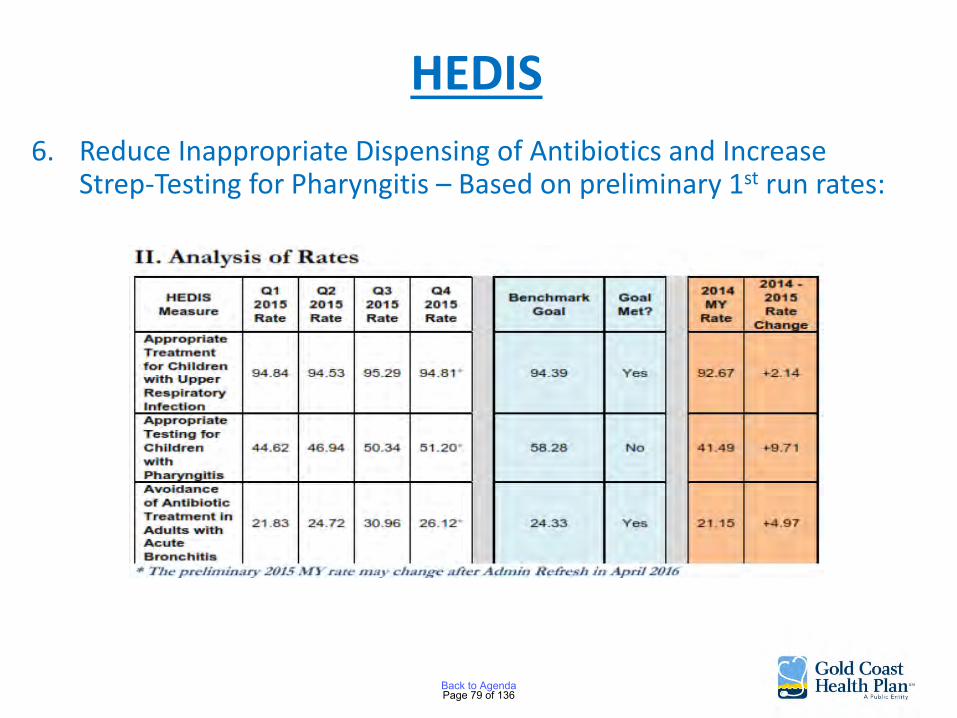
HEDIS
6. Reduce Inappropriate Dispensing of Antibiotics and Increase Strep-Testing for Pharyngitis – Based on preliminary 1st run rates:
Page 79 of 136Back to Agenda
Approvals
• QI -023 Potential Quality Issue Investigation and Resolution Policy
• Quality Improvement 2015 Work Plan Evaluation
• Quality Improvement 2016 Program Description
• Quality Improvement 2016 Work Plan
Page 80 of 136Back to Agenda
California Performance
Improvement Projects (PIP)
PIP #1 – Immunizations for Two Year Olds Goal is to increase the rate of immunization given to 2 year olds.
Status: Working with Las Islas Clinic that has the largest number of children with the lowest rate of immunizations. There are 5 modules total – 3 modules completed. Training on modules 4 & 5 by HSAG in April 2016.
Page 81 of 136Back to Agenda
California Performance
Improvement Projects (PIP)
PIP #2 – Increasing the rate of SBIRT was proposed to DHCS but was denied.
GCHP has identified that there is a low rate of developmental screening of our members.
A project to increase the rate of developmental screening was submitted to DHCS and was approved.
Page 82 of 136Back to Agenda
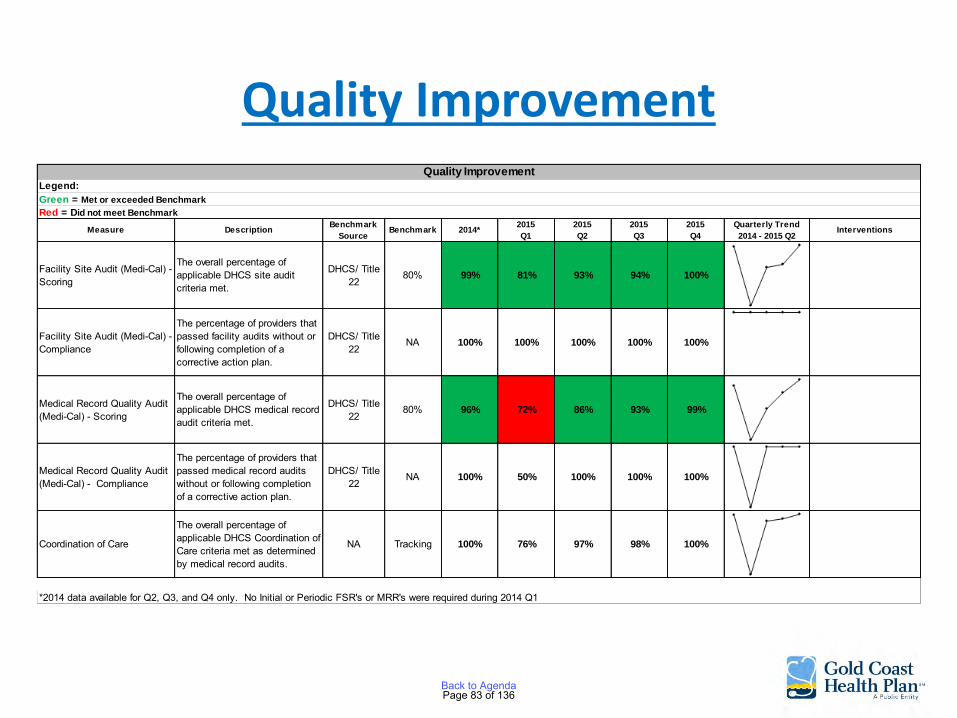
Quality Improvement
Measure DescriptionBenchmark
SourceBenchmark 2014*
2015
Q1
2015
Q2
2015
Q3
2015
Q4
Quarterly Trend
2014 - 2015 Q2Interventions
Facility Site Audit (Medi-Cal) - Scoring
The overall percentage of applicable DHCS site audit criteria met.
DHCS/ Title 22
80% 99% 81% 93% 94% 100%
Facility Site Audit (Medi-Cal) - Compliance
The percentage of providers that passed facility audits without or following completion of a corrective action plan.
DHCS/ Title 22
NA 100% 100% 100% 100% 100%
Medical Record Quality Audit (Medi-Cal) - Scoring
The overall percentage of applicable DHCS medical record audit criteria met.
DHCS/ Title 22
80% 96% 72% 86% 93% 99%
Medical Record Quality Audit (Medi-Cal) - Compliance
The percentage of providers that passed medical record audits without or following completion of a corrective action plan.
DHCS/ Title 22
NA 100% 50% 100% 100% 100%
Coordination of Care
The overall percentage of applicable DHCS Coordination of Care criteria met as determined by medical record audits.
NA Tracking 100% 76% 97% 98% 100%
Quality Improvement
*2014 data available for Q2, Q3, and Q4 only. No Initial or Periodic FSR's or MRR's were required during 2014 Q1
Legend:
Green = Met or exceeded Benchmark
Red = Did not meet Benchmark
Page 83 of 136Back to Agenda
Pharmacy and Therapeutics P&T Committee reviews all drugs newly approved by the FDA
Newly Approved Drugs and Formulary Management
12 New Drugs or new drug combinations were reviewed • 8 approved to be added to the formulary because they
provide significant clinical advantages • 4 drugs were denied formulary placement
2 drugs requested by providers were reviewed and added 6 Brand Name Drugs were removed due to new generics now available
Page 84 of 136Back to Agenda
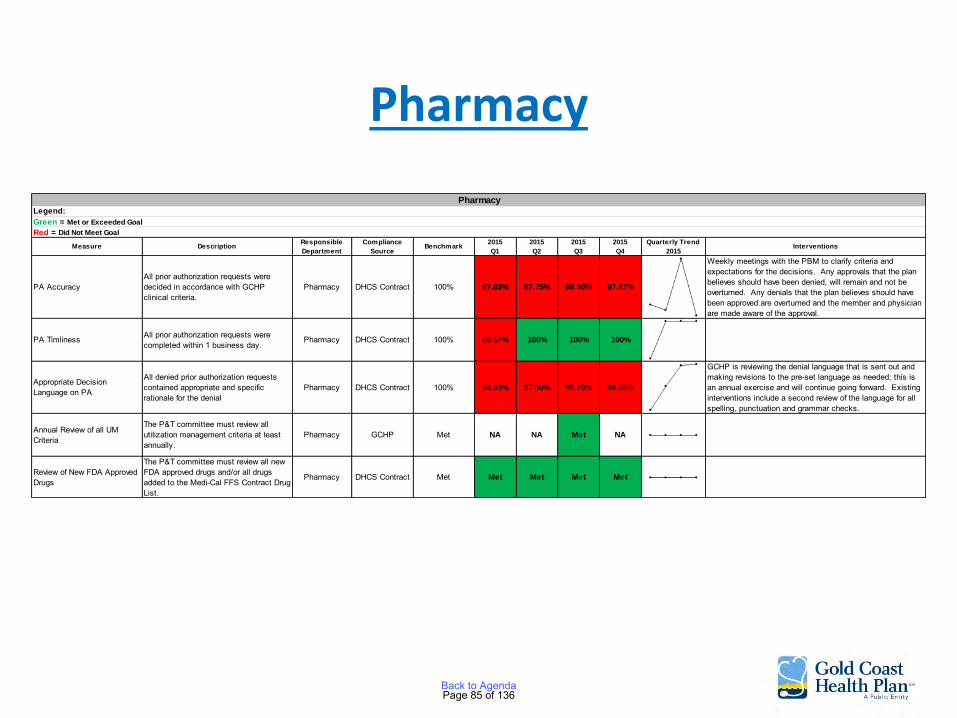
Pharmacy
Measure DescriptionResponsible
Department
Compliance
SourceBenchmark
2015
Q1
2015
Q2
2015
Q3
2015
Q4
Quarterly Trend
2015Interventions
PA AccuracyAll prior authorization requests were decided in accordance with GCHP clinical criteria.
Pharmacy DHCS Contract 100% 97.83% 97.75% 98.50% 97.67%
Weekly meetings with the PBM to clarify criteria and expectations for the decisions. Any approvals that the plan believes should have been denied, will remain and not be overturned. Any denials that the plan believes should have been approved are overturned and the member and physician are made aware of the approval.
PA Timliness All prior authorization requests were completed within 1 business day.
Pharmacy DHCS Contract 100% 99.57% 100% 100% 100%
Appropriate Decision Language on PA
All denied prior authorization requests contained appropriate and specific rationale for the denial
Pharmacy DHCS Contract 100% 94.93% 97.50% 99.70% 99.86%
GCHP is reviewing the denial language that is sent out and making revisions to the pre-set language as needed; this is an annual exercise and will continue going forward. Existing interventions include a second review of the language for all spelling, punctuation and grammar checks.
Annual Review of all UM Criteria
The P&T committee must review all utilization management criteria at least annually.
Pharmacy GCHP Met NA NA Met NA
Review of New FDA Approved Drugs
The P&T committee must review all new FDA approved drugs and/or all drugs added to the Medi-Cal FFS Contract Drug List.
Pharmacy DHCS Contract Met Met Met Met Met
PharmacyLegend:
Green = Met or Exceeded Goal
Red = Did Not Meet Goal
Page 85 of 136Back to Agenda
Credentials/Peer Review
Monitoring of Medical Board of California (MBC) Actions against GCHP Providers
• The 2 providers on probation continue to be monitored and have been compliant
Credentialing
• 121 new providers approved – 1 to be monitored
• 8 providers recredentialed
• 7 facilities credentialed
Page 86 of 136Back to Agenda
Credentials/Peer Review
Peer Review • 19 PQI’s were submitted :
• 14 were rated and closed, 4 are open, 1 not a PQI
• 5 high rated cases presented to the committee – 1 case rated a 3 for outcome and
system has been reviewed by the facility and procedures changed to prevent recurrence
Page 87 of 136Back to Agenda
Credentials/Peer Review
- 1 case identified an issue where procedures were not followed causing potential injury and increased costs – the facility has completed in-service reviews with staff to prevent a recurrence
- 2 cases of member elopement from a facility. Procedures of the facility have been reviewed and changed
- 1 case of continuity of care at a tertiary facility reviewed by the facility and continuity improved
Page 88 of 136Back to Agenda

Credentials/Peer Review
Measure Description Benchmark Source Benchmark 2014*2015
Q1
2015
Q2
2015
Q3
2015
Q4
Quarterly Trend
2014 - 2015 Q2Interventions
Monitoring of Medicare/Medicaid sanctions
An OIG query is performed on every provider at the time of intitial and re-credentialing
DHCS/ Title 22
Standard met for 100% of files presented to CPRC
100% 100% 100% 100% 100%
Monitoring of sanctions and limitations on licensure
An Medical Board of California (MBOC) query is performed on every provider at the time of initial and re-credentialing. Other state licensing boards are also queried as needed
DHCS/ Title 22
Standard met for 100% of files presented to CPRC
100% 100% 100% 100% 100%
Monitoring of Complaints Member complaint data is considered during re-credentialing.
DHCS/ Title 22
Standard met for 100% of files presented to CPRC
NA NA NA NA NA
Quality of Care concerns are reviewed at a minimum of every 6 months and are forwarded to Credentials/Peer Review Committee (CPRC) as indicated.
DHCS/ Title 22 Biannually NA 100% 100% 100% 100%
HIPDB queries are performed within 180 days prior to the date of initial and re-credentialing
DHCS/ Title 22
Standard met for 100% of files presented to CPRC
100% 100% 100% 100% 100%
Timeliness of provider notification of credentialing decisions
Providers will be notified of the credentialing decision in writing within 60 days
DHCS/ Title 22
Standard met for 100% of files presented to CPRC
100% 100% 100% 100% 100%
Timeliness of verificationsAll credentialing verifications are performed within 180 days prior to the credentialing date, as required DHCS/ Title 22
Standard met for 100% of files presented to CPRC
100% 100% 90% 100% 100%
GCHP Compliance changed the audit tool used by Credentialing from NCQA to ICE which requires audits within 180 days instead of the historical 365 days. Any historical files that were previously on a 365 day audit cycle will transistion to a 180 days audit and be caught up over the next 2 quarters.
# of provider terminations for quality issues
Credentials/Peer Review Committee (CPRC) denial of a credentialing application for quality issues will cause termination of the provider from the network
DHCS/ Title 22
Standard met for 100% of files presented to CPRC
None forQ3 and Q4
None for Q1 None for Q2 None for Q3
Monitoring of adverse events
Credentials
Legend:
Green = Met or Exceeded Benchmark
Red = Did Not Meet Benchmark
Access Indicators
Page 89 of 136Back to Agenda

Credentials/Peer Review
Timeliness of processing of initial applications
Initial applications will be processed within 90 days DHCS/ Title 22
Standard met for 90% of applications received
100% 90% 90% 100% 90%
Timeliness of processing of re-credentialing applications
Recredentialing applications will be processed within 90 days
DHCS/ Title 22
Standard met for 90% of applications received
100% 90% 100% 100% 90%
Timeliness of Physician Recredentialing
Percent of physicians recredentialed within 36 months of the last approval date
NCQA: CR Standards Standard met for 90% of providers
90% 90% 90% 100% 90%
Continuous Monitoring of Allied Providers
Percent of allied providers' expirable elements that are current
NA Standard met for 90% of elements
100% 100% 100% 100% 100%
Timeliness of Organization Reassessment
Percent of organizations reassessed within 36 months of the last assessment
NCQA: CR Standards Standard met for 90% of providers
100% 100% 90% 100% 100%
*2014 data available forQ3 and Q4 only.
Service Indicators
Quality Indicators (under NMC purview)
Measure Description Benchmark Source Benchmark 2014*2015
Q1
2015
Q2
2015
Q3
2015
Q4
Quarterly Trend
2014 - 2015 Q2Interventions
Credentials
Legend:
Green = Met or Exceeded Benchmark
Red = Did Not Meet Benchmark
Page 90 of 136Back to Agenda
Medical Advisory
Approved Health Plan Policies
• HS-044 Intravenous Sedation and General Anesthesia for Dental Services Policy and Procedures
• Intravenous Sedation and General Anesthesia for Dental Services Guidelines
• Diabetes Clinical Guidelines 2016 • Disease Management – Future Targeted Disease
Selection – Asthma possible before moving to the next type of sedation
Page 91 of 136Back to Agenda
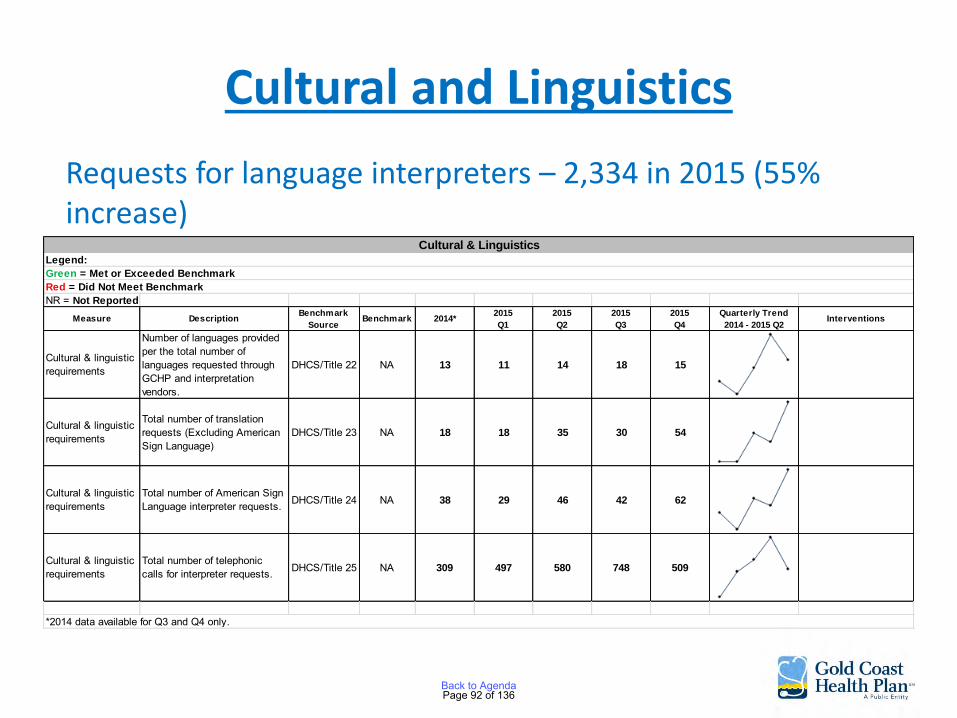
Cultural and Linguistics
Requests for language interpreters – 2,334 in 2015 (55% increase)
NR = Not Reported
Measure DescriptionBenchmark
SourceBenchmark 2014*
2015
Q1
2015
Q2
2015
Q3
2015
Q4
Quarterly Trend
2014 - 2015 Q2Interventions
Cultural & linguistic requirements
Number of languages provided per the total number of languages requested through GCHP and interpretation vendors.
DHCS/Title 22 NA 13 11 14 18 15
Cultural & linguistic requirements
Total number of translation requests (Excluding American Sign Language)
DHCS/Title 23 NA 18 18 35 30 54
Cultural & linguistic requirements
Total number of American Sign Language interpreter requests. DHCS/Title 24 NA 38 29 46 42 62
Cultural & linguistic requirements
Total number of telephonic calls for interpreter requests. DHCS/Title 25 NA 309 497 580 748 509
Cultural & Linguistics
Legend:
Green = Met or Exceeded Benchmark
Red = Did Not Meet Benchmark
*2014 data available for Q3 and Q4 only.
Page 92 of 136Back to Agenda
Health Education
• Diabetes Education Classes in association with clinics
• Diabetes Education Directory – classes by other organizations
• Community Health Education Workshops Health Navigator Program • Retinal Eye Exam Member Incentive • Reach members with diabetes for the disease
management program
Page 93 of 136Back to Agenda
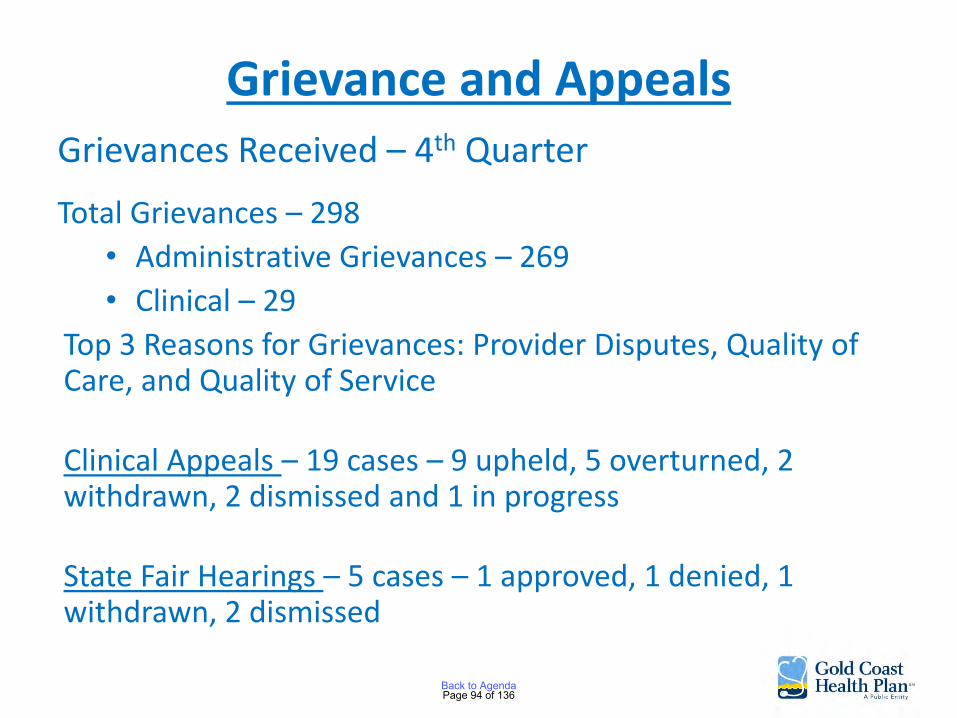
Grievance and Appeals
Grievances Received – 4th Quarter
Total Grievances – 298
• Administrative Grievances – 269
• Clinical – 29
Top 3 Reasons for Grievances: Provider Disputes, Quality of Care, and Quality of Service
Clinical Appeals – 19 cases – 9 upheld, 5 overturned, 2 withdrawn, 2 dismissed and 1 in progress
State Fair Hearings – 5 cases – 1 approved, 1 denied, 1 withdrawn, 2 dismissed
Page 94 of 136Back to Agenda

The Quality Workgroup reviewed a total of 56 quality issues and 20 were referred as PQI’s for review.
Measure DescriptionCompliance
SourceBenchmark 2014*
2015
Q1
2015
Q2
2015
Q3
2015
Q4
Quarterly Trend
2014 Q2 - 2015 Q2Interventions
Resolution Turnaround Times (TAT) Grievances
100% TAT within 30 calendar days GCHP 81% 42% 70% 94% 97%
Post Service TAR Provider Appeals Processing Time - Resolution
The percentage of provider appeals processed within 30 business days from receipt.
GCHP 100% 100% 100% 100% 100%
Provider Grievances: Complaint, Appeal, or Inquiry
Timely resolution of provider grievances GCHP NA 16% 60% 93% 94%
Monitoring of ComplaintsMember complaints are monitored at a minimum of every six months to assess for trends/outliers
GCHP Monitoring NA 100% 100% 100% 100%
*2014 data available for Q2, Q3 and Q4 only.
Grievance & Appeals
Green = Met or Exceeded Goal
Red = Did Not Meet Goal
Legend:
Page 95 of 136Back to Agenda
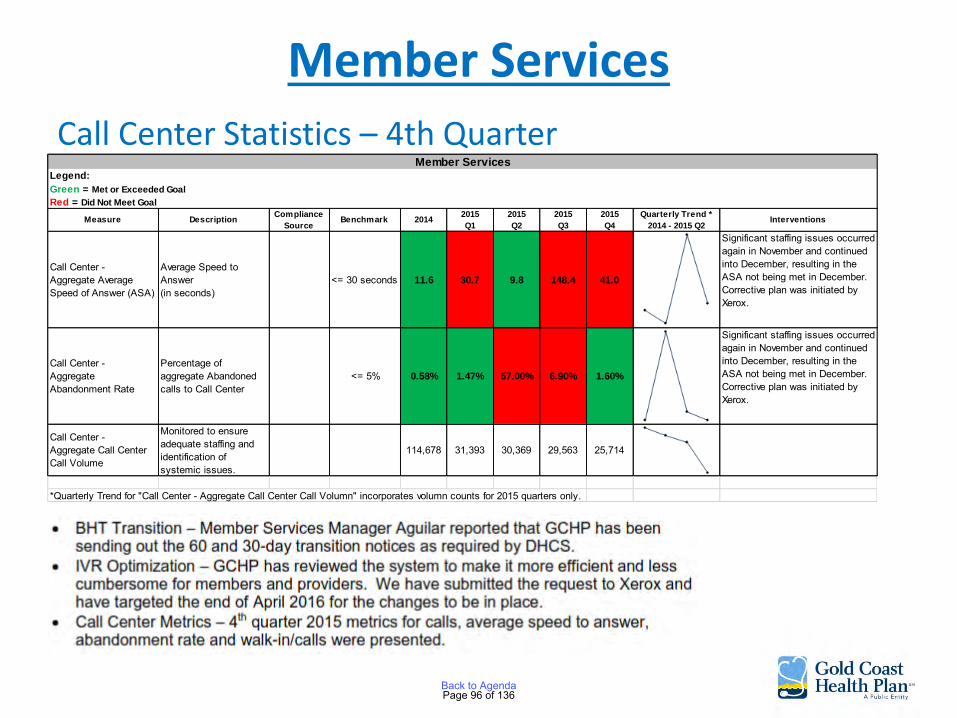
Member Services
Call Center Statistics – 4th Quarter
Measure DescriptionCompliance
SourceBenchmark 2014
2015
Q1
2015
Q2
2015
Q3
2015
Q4
Quarterly Trend *
2014 - 2015 Q2Interventions
Call Center - Aggregate Average Speed of Answer (ASA)
Average Speed to Answer(in seconds)
<= 30 seconds 11.6 30.7 9.8 148.4 41.0
Significant staffing issues occurred again in November and continued into December, resulting in the ASA not being met in December.Corrective plan was initiated by Xerox.
Call Center -Aggregate Abandonment Rate
Percentage of aggregate Abandoned calls to Call Center
<= 5% 0.58% 1.47% 57.00% 6.90% 1.60%
Significant staffing issues occurred again in November and continued into December, resulting in the ASA not being met in December.Corrective plan was initiated by Xerox.
Call Center - Aggregate Call Center Call Volume
Monitored to ensure adequate staffing and identification of systemic issues.
114,678 31,393 30,369 29,563 25,714
*Quarterly Trend for "Call Center - Aggregate Call Center Call Volumn" incorporates volumn counts for 2015 quarters only.
Member ServicesLegend:
Green = Met or Exceeded Goal
Red = Did Not Meet Goal
Page 96 of 136Back to Agenda
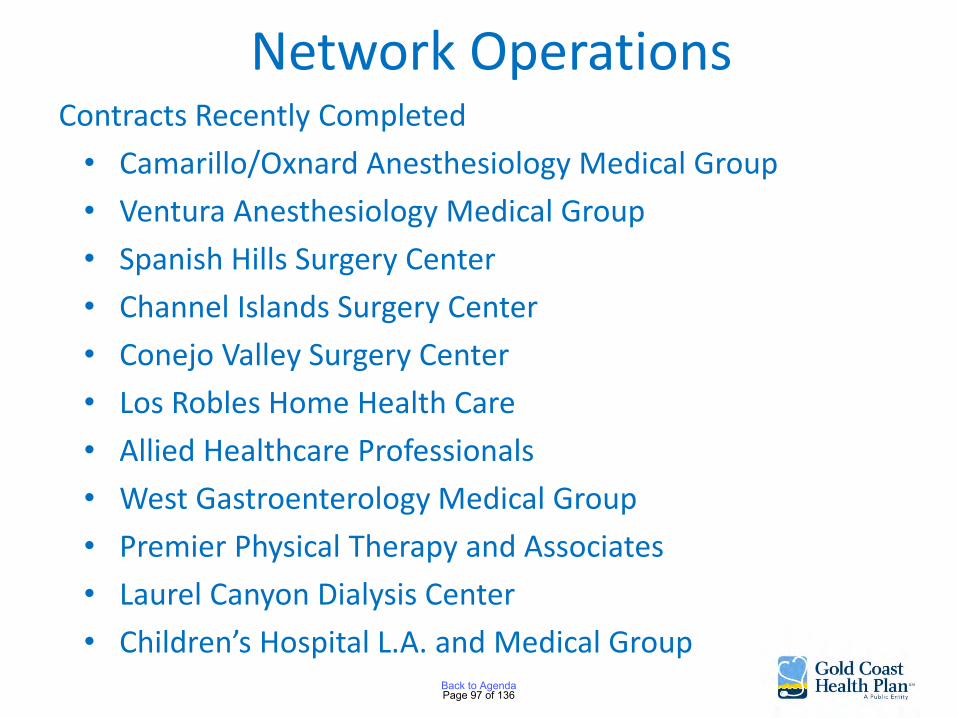
Network Operations Contracts Recently Completed
• Camarillo/Oxnard Anesthesiology Medical Group
• Ventura Anesthesiology Medical Group
• Spanish Hills Surgery Center
• Channel Islands Surgery Center
• Conejo Valley Surgery Center
• Los Robles Home Health Care
• Allied Healthcare Professionals
• West Gastroenterology Medical Group
• Premier Physical Therapy and Associates
• Laurel Canyon Dialysis Center
• Children’s Hospital L.A. and Medical Group
Page 97 of 136Back to Agenda
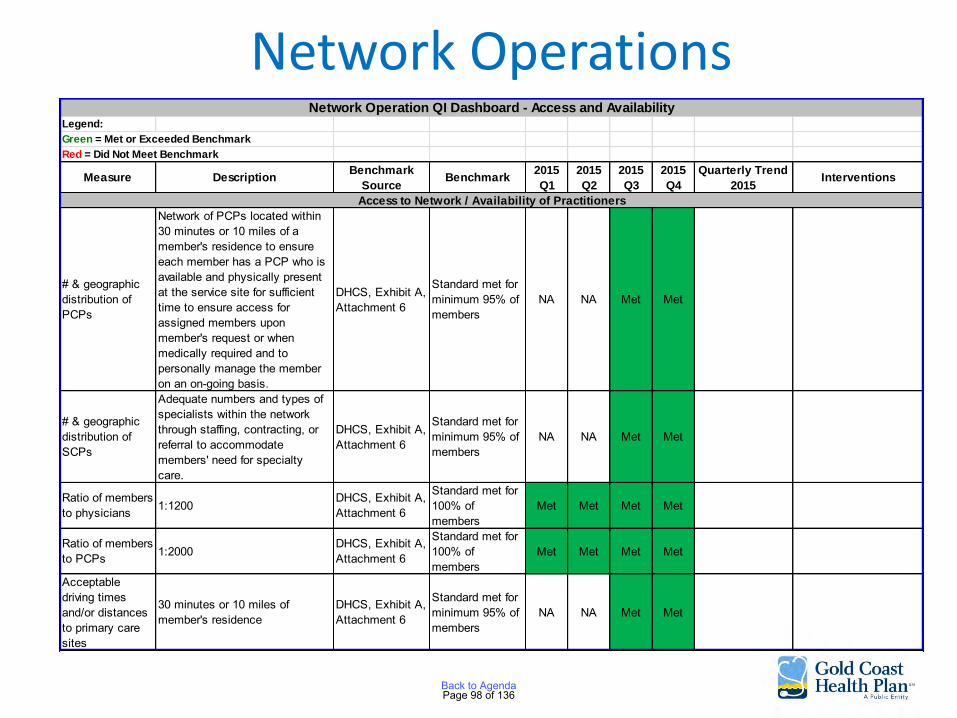
Network Operations Legend:
Green = Met or Exceeded Benchmark
Red = Did Not Meet Benchmark
Measure DescriptionBenchmark
SourceBenchmark
2015
Q1
2015
Q2
2015
Q3
2015
Q4
Quarterly Trend
2015Interventions
# & geographic distribution of PCPs
Network of PCPs located within 30 minutes or 10 miles of a member's residence to ensure each member has a PCP who is available and physically present at the service site for sufficient time to ensure access for assigned members upon member's request or when medically required and to personally manage the member on an on-going basis.
DHCS, Exhibit A, Attachment 6
Standard met for minimum 95% of members
NA NA Met Met
# & geographic distribution of SCPs
Adequate numbers and types of specialists within the network through staffing, contracting, or referral to accommodate members' need for specialty care.
DHCS, Exhibit A, Attachment 6
Standard met for minimum 95% of members
NA NA Met Met
Ratio of members to physicians 1:1200
DHCS, Exhibit A, Attachment 6
Standard met for 100% of members
Met Met Met Met
Ratio of members to PCPs 1:2000
DHCS, Exhibit A, Attachment 6
Standard met for 100% of members
Met Met Met Met
Acceptable driving times and/or distances to primary care sites
30 minutes or 10 miles of member's residence
DHCS, Exhibit A, Attachment 6
Standard met for minimum 95% of members
NA NA Met Met
Network Operation QI Dashboard - Access and Availability
Access to Network / Availability of Practitioners
Page 98 of 136Back to Agenda
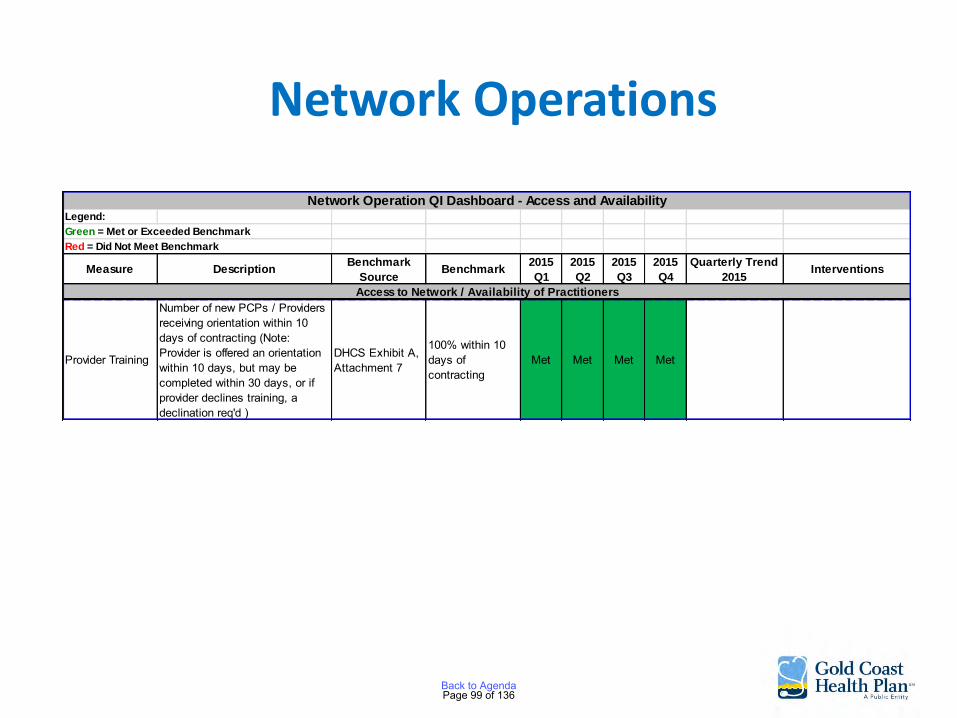
Network Operations
Provider Training
Number of new PCPs / Providers receiving orientation within 10 days of contracting (Note: Provider is offered an orientation within 10 days, but may be completed within 30 days, or if provider declines training, a declination req'd )
DHCS Exhibit A, Attachment 7
100% within 10 days of contracting
Met Met Met Met
Legend:
Green = Met or Exceeded Benchmark
Red = Did Not Meet Benchmark
Measure DescriptionBenchmark
SourceBenchmark
2015
Q1
2015
Q2
2015
Q3
2015
Q4
Quarterly Trend
2015Interventions
Network Operation QI Dashboard - Access and Availability
Access to Network / Availability of Practitioners
Page 99 of 136Back to Agenda

Health Services Utilization Management Committee
Approval of: • 2016 UM Work Plan • 2016 UM Program Description • 2016 Care Management (CM) Program Description • Home Health Guideline – reapproved • IV Sedation and General Anesthesia for Dental
Services Adopted • Zostavax Guideline – retired • 2015 UM Work Plan Evaluation • 2015 CM Work Plan Evaluation
Page 100 of 136Back to Agenda
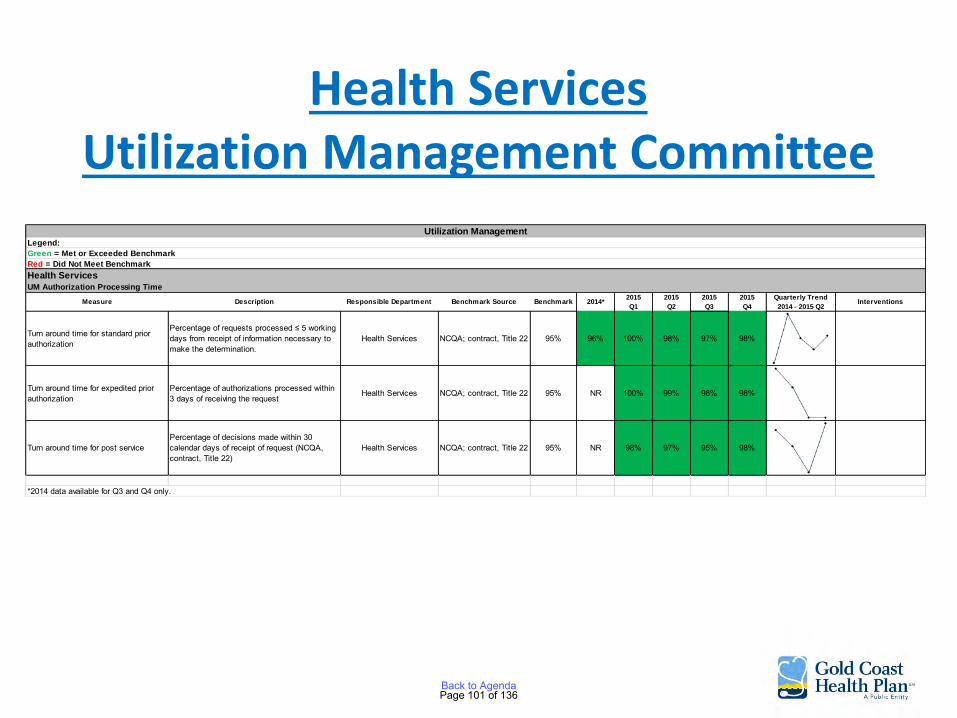
Health Services Utilization Management Committee
Measure Description Responsible Department Benchmark Source Benchmark 2014*2015
Q1
2015
Q2
2015
Q3
2015
Q4
Quarterly Trend
2014 - 2015 Q2Interventions
Turn around time for standard prior authorization
Percentage of requests processed ≤ 5 working days from receipt of information necessary to make the determination.
Health Services NCQA; contract, Title 22 95% 96% 100% 98% 97% 98%
Turn around time for expedited prior authorization
Percentage of authorizations processed within 3 days of receiving the request
Health Services NCQA; contract, Title 22 95% NR 100% 99% 98% 98%
Turn around time for post servicePercentage of decisions made within 30 calendar days of receipt of request (NCQA, contract, Title 22)
Health Services NCQA; contract, Title 22 95% NR 98% 97% 95% 98%
*2014 data available for Q3 and Q4 only.
UM Authorization Processing Time
Health Services
Utilization Management
Legend:
Green = Met or Exceeded Benchmark
Red = Did Not Meet Benchmark
Page 101 of 136Back to Agenda
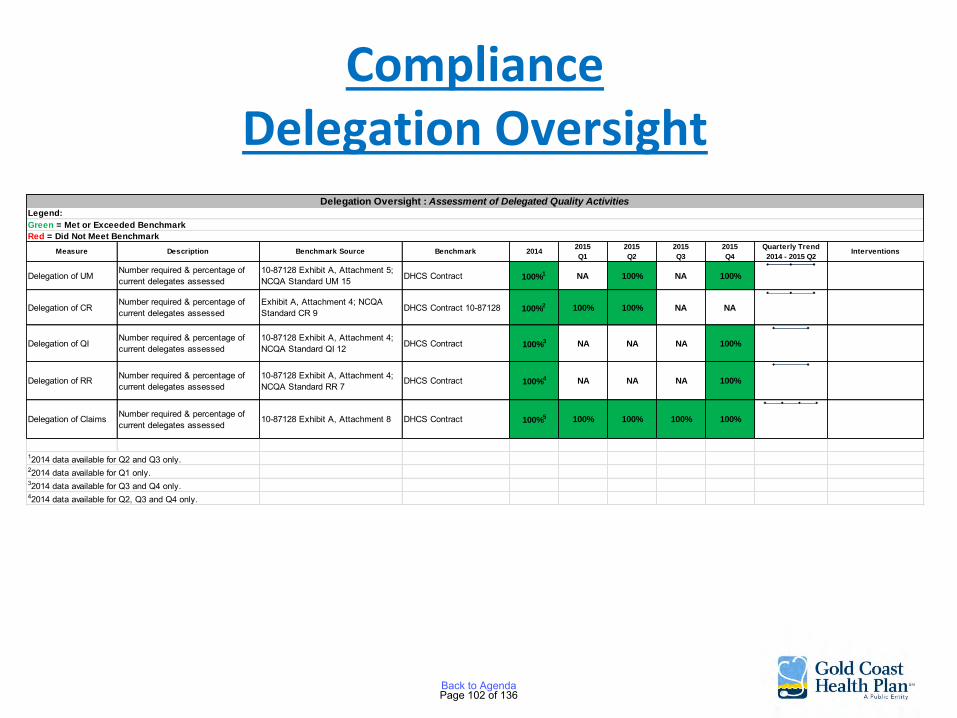
Compliance Delegation Oversight
Measure Description Benchmark Source Benchmark 20142015
Q1
2015
Q2
2015
Q3
2015
Q4
Quarterly Trend
2014 - 2015 Q2Interventions
Delegation of UMNumber required & percentage of current delegates assessed
10-87128 Exhibit A, Attachment 5; NCQA Standard UM 15 DHCS Contract 100%1 NA 100% NA 100%
Delegation of CRNumber required & percentage of current delegates assessed
Exhibit A, Attachment 4; NCQA Standard CR 9 DHCS Contract 10-87128 100%2 100% 100% NA NA
Delegation of QINumber required & percentage of current delegates assessed
10-87128 Exhibit A, Attachment 4; NCQA Standard QI 12 DHCS Contract 100%3 NA NA NA 100%
Delegation of RR Number required & percentage of current delegates assessed
10-87128 Exhibit A, Attachment 4; NCQA Standard RR 7
DHCS Contract 100%4 NA NA NA 100%
Delegation of Claims Number required & percentage of current delegates assessed
10-87128 Exhibit A, Attachment 8 DHCS Contract 100%5 100% 100% 100% 100%
12014 data available for Q2 and Q3 only.22014 data available for Q1 only.32014 data available for Q3 and Q4 only.42014 data available for Q2, Q3 and Q4 only.
Delegation Oversight : Assessment of Delegated Quality ActivitiesLegend:
Green = Met or Exceeded Benchmark
Red = Did Not Meet Benchmark
Page 102 of 136Back to Agenda
AGENDA ITEM NO. 7 TO: Gold Coast Health Plan Commission FROM: C. Albert Reeves, MD, Chief Medical Officer DATE: June 27, 2016 SUBJECT: Pay-for-Performance Program to Improve Children’s Access to Care SUMMARY: As part of Gold Coast Health Plan’s ARCH Program, the Plan seeks to improve children’s access to care as measured in the 2016 Healthcare Effectiveness Data and Information Set (HEDIS) Measure for access for children by offering to providers caring for children a pay-for-performance program to develop strategies to improve access to care for children. BACKGROUND: Gold Coast Health Plan has failed to meet the Department of Health Care Services requirement to reach the 25th percentile for the children’s access to care HEDIS Measure three (3) years in a row. The Plan attempted by various means to improve the score and access by offering a member incentive and by providing providers with the names of members not seen in the first half of the year. The scores have improved but the scores have not reached the required 25th percentile. The Plan is proposing to improve access with a pay-for-performance program to incentivize providers to institute programs to increase visits by children. DISCUSSION: The Plan will budget 1.4 million dollars for this pay-for-performance program. The amount made available to any group or provider will be roughly related to the ratio of eligible children assigned to that group or provider. One-third of the monies available will be paid to the group or provider when the group or provider has submitted an acceptable proposal for their program to improve access. Examples of strategies that would be considered would be:
• Expanded office hours to evenings or weekends • Adding providers who care for children • Outreach to their assigned members who have been identified as not being seen in the
year and making appointments for them • Improving the provider’s encounter data submitted to the Plan
Page 103 of 136Back to Agenda
To be eligible for the pay-for-performance component of this program, the group or provider must submit a progress report to the plan on September 30, 2016, and December 31, 2016, which shows that their proposed strategies have been instituted. The group or provider will receive a defined monetary payment if they achieve a 5%, 7.5% or 10% improvement in their access for children for the 2016 measurement year as reported on the National Committee for Quality Assurance Certified result released on July 15, 2017. If all groups and providers develop an acceptable program and achieve a 10% improvement in the HEDIS Score the Plan will score well above the 25th percentile and the entire 1.4 million dollars will be paid. If any of the groups or providers do not participate or achieve the maximum results the monies not paid will return to the Plan’s Alternative Resources for Community Health Program Fund. RECOMMENDATION: The Plan recommends the Commission approve the Children’s Access to Care Pay-for-Performance Program.
Page 104 of 136Back to Agenda

AGENDA ITEM NO. 8 TO: Gold Coast Health Plan Commission FROM: Dale Villani, Chief Executive Officer (CEO) DATE: June 27, 2016 SUBJECT: Chief Executive Officer Update MEDICAID MANAGED CARE FINAL RULE “MEGA RULE” The Medicaid Managed Care rule takes effect on July 5, 2016. Many of the provisions that take effect next month were unchanged from the 2002 rule. Examples include enrollee rights, capitation payments made to managed care plans, and actuarial soundness. Managed care plans are expected to remain compliant with the 2002 regulations until the implementation dates of the specified rule take effect. Major provisions of the rule take effect in one to three years. Provisions Effective July 1, 2017 Delivery System Reform: Pass-Through Payments to Providers
• Limits the ability of states to make supplemental payments via health plans. • The health plans cannot be tied to providing Intergovernmental Payments; payments
made by the plans must be based on utilization, delivery of services, and performance/quality.
• The “Mega Rule” provides a ten year transition period for hospital supplemental payments and a five year transition for physician and nursing facility supplemental payments.
Grievance & Appeals
• The grievance and appeals requirements were revised in the final rule to align with Medicare Advantage and Quality Health Plan standards.
• Members are required to complete one level of internal appeal at the plan before moving to the State Fair Hearing process. If a plan fails to comply with appeal timeframes the member can file for a State Fair Hearing.
• Benefits must continue for the duration of the appeal and State Fair Hearing process.
Page 105 of 136Back to Agenda
Program Integrity
• Plans are required to suspend payment to a network provider when the state determines a credible allegation of fraud exists.
Care Coordination Activities
• Broadens care coordination to include all care (not just primary care). • Managed care organization services must be coordinated with services from community
and social support providers.
Recordkeeping
• Sets a 10 year standard record retention schedule and requirements for plans and their subcontractors.
• Records must be kept of member grievance and appeal records, Medical Loss Ratio (MLR) reports, and monitoring and program integrity documentation.
Provisions Effective July 1, 2018 Actuarial Soundness & Rate Development
• Rate ranges are no longer permissible and actuaries are required to certify each rate cell.
• However, the Centers for Medicare and Medicaid Services (CMS) provides states with a 1.5% flexibility to move rates above or below the certified rate cell without having to obtain CMS approval for the new rate cell.
Network Adequacy
• States are required to develop time and distance standards for the following specialists o Primary Care o Specialty Care o Behavioral Health (mental health and Substance Use Disorder (SUD) for both
adult and pediatric) o Hospitals o Pharmacy Services
• States must take telemedicine into consideration for setting time and distance standards. • Plans are required to certify their provider networks annually.
Page 106 of 136Back to Agenda
Beneficiary Support System
• States must develop and implement a beneficiary support system for beneficiaries both prior to and after enrollment in a plan.
• The support system must be accessible via phone, internet, and in-person as well as via auxiliary aids and services when requested.
Quality Rating System (QRS)
• CMS will establish a common framework for all states contracting with Managed Care Organizations (MCOs) to use in implementing a quality rating system.
• The system must align with the Marketplace QRS. • CMS will conduct a public engagement process to develop a proposed QRS framework
and methodology. • Publication of the proposed QRS in the Federal Register with opportunity to comment,
followed by notice of the final Medicaid and Children’s Health Insurance Program (CHIP) QRS expected in 2018.
• States will have flexibility to adopt an alternative QRS with CMS approval. • States will have three years to implement a QRS following final notice in the Federal
Register
Provisions Effective July 1, 2019 Medical Loss Ratio (MLR) Requirement
• Actuarially-sound rates must be set to allow plans to reach 85% MLR.
The Department of Health Care Services (DHCS) is currently analyzing the impact the “Mega Rule” will have in California. The DHCS analysis will be released sometime this summer. The Government Relations team will provide the Commission with updates as necessary.
Page 107 of 136Back to Agenda
CALIFORNIA LEGISLATIVE UPDATE State Budget On Wednesday, June 15th, the Legislature approved the state budget; Governor Brown must approve the budget before July 1, 2016 when the new fiscal year begins. It is likely the Governor will not line veto any items in the budget, since many items were highly negotiated between the Legislature and the Governor before being approved by the Legislature. The budget totals $122.5 billion and makes a $2 billion deposit into the Proposition 2 Rainy Day Fund bringing the total reserve to $8.4 billion. The following are approved budget items relevant to Medi-Cal:
• Restoration of Acupuncture as a Medi-Cal benefit: $3.7 million General Fund (GF) in the first year $4.4 million ongoing GF. Benefit restoration begins on July 1, 2016.
• Funding for Medi-Cal Interpreters: Provides $3 million for one-time support of multi-county pilot program, including a study, on the availability and reimbursement of certified in-person language interpreters for Medi-Cal beneficiaries. The funding is contingent upon enactment of legislation that establishes the pilot program.
• 1115 Waiver: Approves $10.8 million ($5.4 million GF) to support implementation of the new waiver.
• Health Homes: Provides $1 million (federal and special funds) for three years to implement the Health Homes Program.
• Estate Recovery: Limits estate recovery under Medi-Cal to those services required to be collected under federal law.
o Limits the definition “estate” to include only the real and personal property and other assets required to be collected by federal law.
o Prohibits recovery from the estate of a deceased Medi-Cal member who is survived by spouse or registered domestic partner.
o Budget year costs are $5.7 million GF; $28.9 million GF in out years.
Legislative Bills Update Friday, June 3rd, was the last day for each house to pass bills introduced in their house of origin. The table below provides a summary of the legislative bills that can potentially impact Gold Coast Health Plan. These legislative bills are waiting to be heard in their respective committee.
Page 108 of 136Back to Agenda
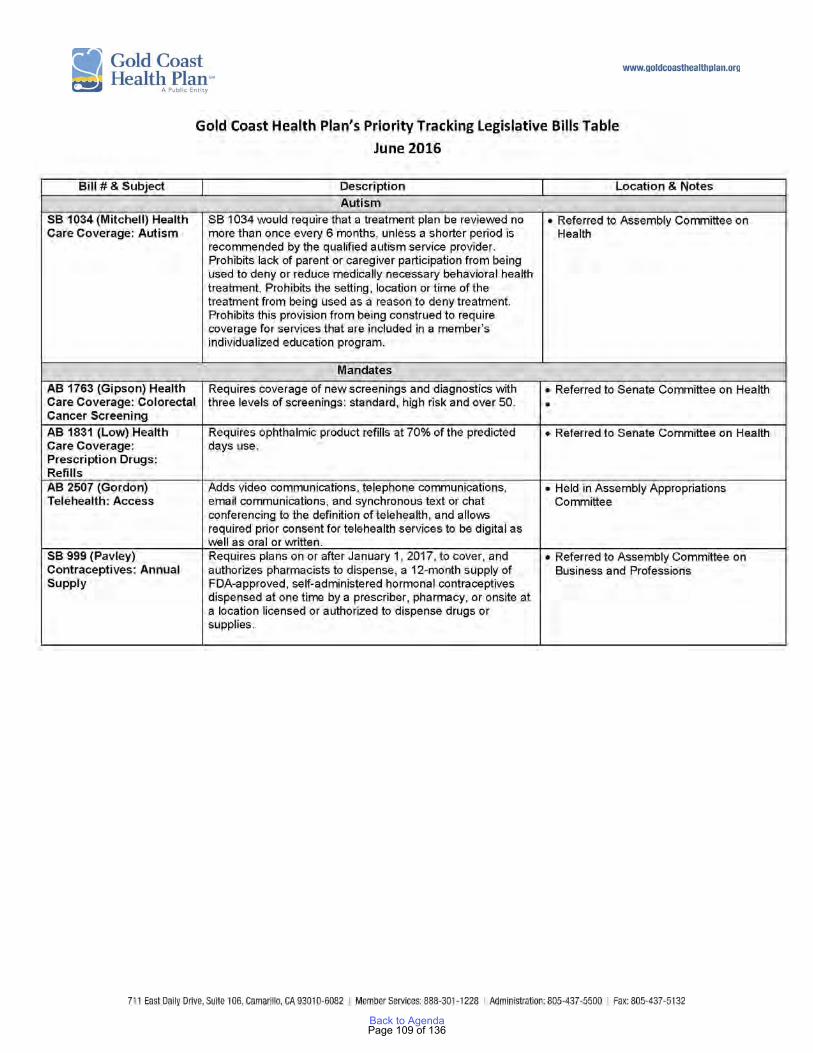
Page 109 of 136Back to Agenda
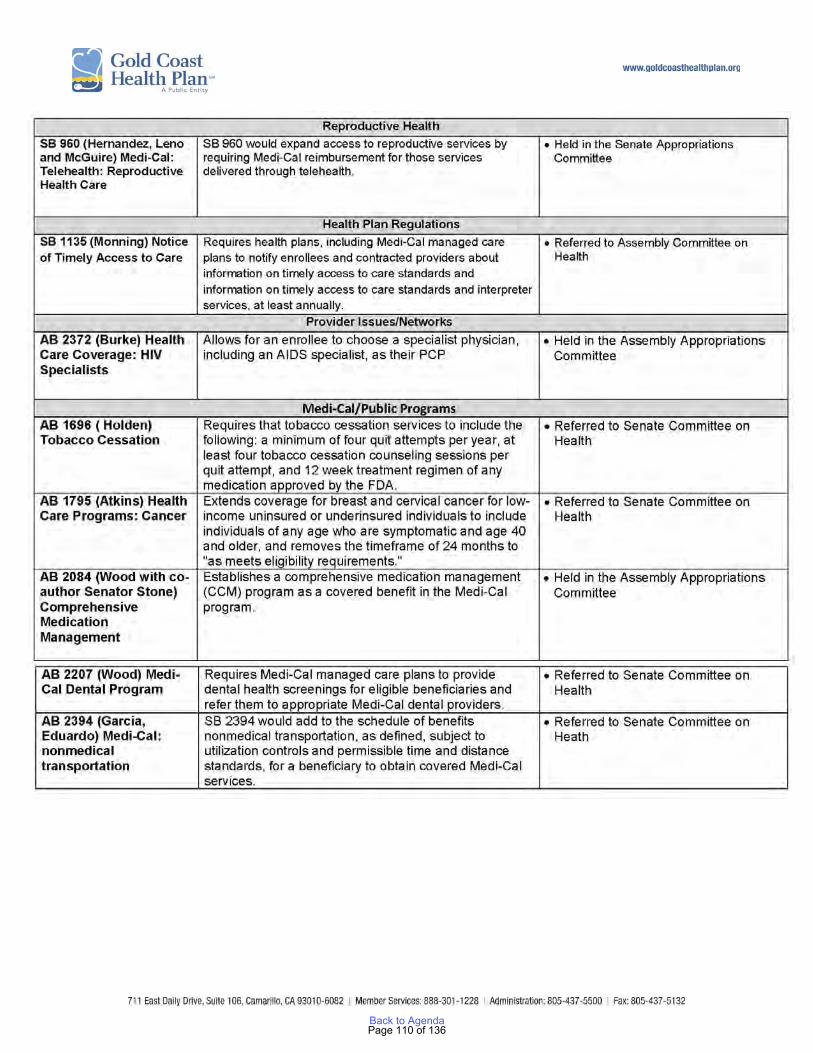
Page 110 of 136Back to Agenda
COMPLIANCE UPDATE Gold Coast Health Plan (GCHP) successfully closed out the DHCS Medical Audit Corrective Action Plan (CAP) on March 16, 2016. GCHP was notified on February 25, 2016 by Audits & Investigations (A&I) the annual medical audit for 2016 will take place, April 25, 2016 through May 6, 2016. GCHP had to submit pre-audit documentation material to A&I by March 18, 2016. The review period for the medical audit is April 1, 2015 through March 31, 2016. GCHP anticipates the final report and or CAP being issued in July/August 2016. The DHCS corrective action plan, Financial (Addendum A) remains open and the plan continues to submit items on a monthly basis as required and defined by the CAP. GCHP continues to meet all regulatory contract submission requirements. In addition to routine deliverables GCHP provides weekly and monthly reports to DHCS as a part of ongoing monitoring activities. All regulatory agency inquiries and requests are handled timely and requested information is provided within the specified required timeframe(s). Compliance staff is actively engaged in sustaining contract compliance. With the transition of ABA services on February 1, 2016 additional weekly and daily reporting has been required. GCHP compliance staff conducted a six month claims follow up audit on GCHP vision service provider and mental health behavioral organization (MBHO). The onsite audits occurred during the second and third week of May 2016. Both audits identified deficiencies and corrective action plans were issued. Commissioners will receive an email from GCHP compliance department, which will include training login information for HIPAA and Fraud, Waste and Abuse (FWA). Commissioners may have a requirement from their employers to complete HIPAA and FWA trainings; however the training required from GCHP is tailored to managed care. Commissioners will also receive GCHP’s code of conduct, with a request for attestation via signature. Compliance staff is available for any questions commissioners may have on the trainings. The compliance dashboard is attached for reference and includes information on but is not limited to: staff trainings, fraud referrals, HIPAA breaches, delegate audits.
Page 111 of 136Back to Agenda
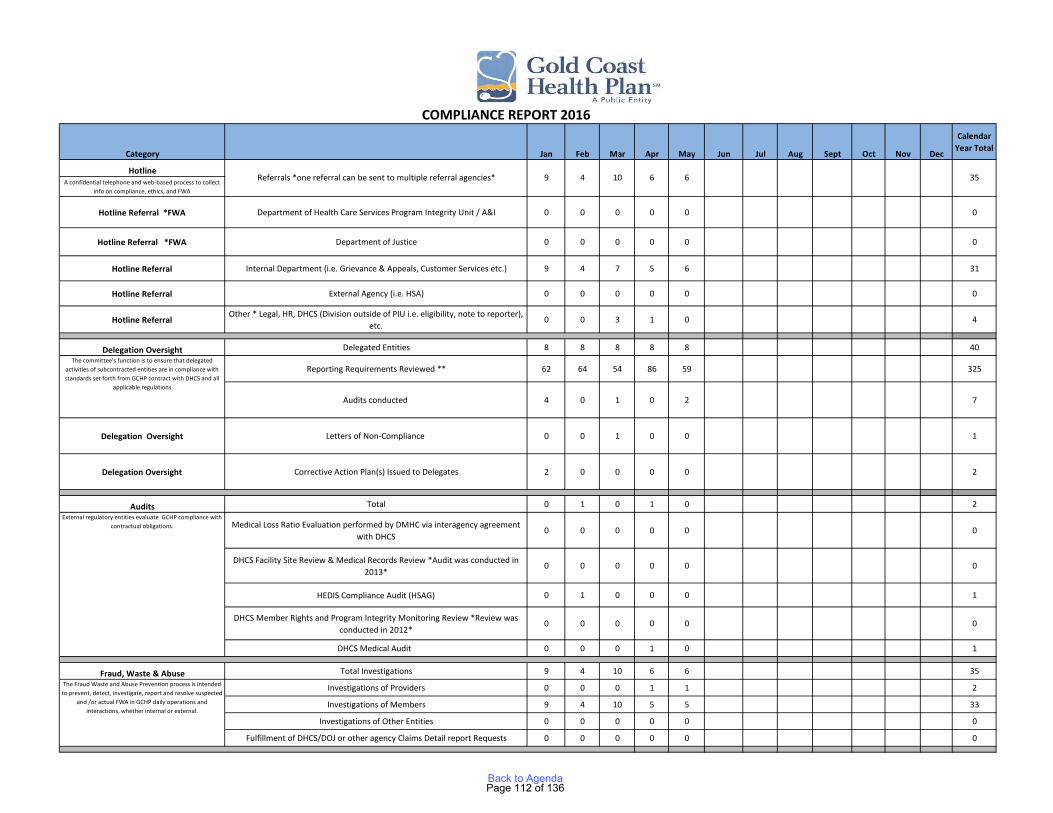
Category Jan Feb Mar Apr May Jun Jul Aug Sept Oct Nov Dec
Calendar Year Total
HotlineA confidential telephone and web-based process to collect
info on compliance, ethics, and FWA
Hotline Referral *FWA Department of Health Care Services Program Integrity Unit / A&I 0 0 0 0 0 0
Hotline Referral *FWA Department of Justice 0 0 0 0 0 0
Hotline Referral Internal Department (i.e. Grievance & Appeals, Customer Services etc.) 9 4 7 5 6 31
Hotline Referral External Agency (i.e. HSA) 0 0 0 0 0 0
Hotline Referral Other * Legal, HR, DHCS (Division outside of PIU i.e. eligibility, note to reporter),
etc.0 0 3 1 0 4
Delegation Oversight Delegated Entities 8 8 8 8 8 40
Reporting Requirements Reviewed ** 62 64 54 86 59 325
Audits conducted 4 0 1 0 2 7
Delegation Oversight Letters of Non-Compliance 0 0 1 0 0 1
Delegation Oversight Corrective Action Plan(s) Issued to Delegates 2 0 0 0 0 2
Audits Total 0 1 0 1 0 2
Medical Loss Ratio Evaluation performed by DMHC via interagency agreement with DHCS
0 0 0 0 0 0
DHCS Facility Site Review & Medical Records Review *Audit was conducted in 2013*
0 0 0 0 0 0
HEDIS Compliance Audit (HSAG) 0 1 0 0 0 1
DHCS Member Rights and Program Integrity Monitoring Review *Review was conducted in 2012*
0 0 0 0 0 0
DHCS Medical Audit 0 0 0 1 0 1
Fraud, Waste & Abuse Total Investigations 9 4 10 6 6 35
Investigations of Providers 0 0 0 1 1 2
Investigations of Members 9 4 10 5 5 33
Investigations of Other Entities 0 0 0 0 0 0
Fulfillment of DHCS/DOJ or other agency Claims Detail report Requests 0 0 0 0 0 0
COMPLIANCE REPORT 2016
Referrals *one referral can be sent to multiple referral agencies* 9 4 10 6 6 35
The committee's function is to ensure that delegated activities of subcontracted entities are in compliance with standards set forth from GCHP contract with DHCS and all
applicable regulations
External regulatory entities evaluate GCHP compliance with contractual obligations.
The Fraud Waste and Abuse Prevention process is intended to prevent, detect, investigate, report and resolve suspected
and /or actual FWA in GCHP daily operations and interactions, whether internal or external.
Page 112 of 136Back to Agenda

Category Jan Feb Mar Apr May Jun Jul Aug Sept Oct Nov Dec
Calendar Year Total
HIPAA Referrals 1 4 2 3 0 10
State Notification 1 4 2 3 0 10
Federal Notification 0 4 0 0 0 4
Member Notification 0 0 0 1 0 1
HIPAA Internal Audits Conducted 0 1 0 0 0 1***
Training Training Sessions 20 15 27 12 49 123
Fraud, Waste & Abuse Prevention (Individual Training) 6 3 7 2 21 39
Fraud, Waste & Abuse Prevention (Member Orientations) 6 6 6 6 6 30
Code of Conduct 2 3 7 2 1 15
HIPAA (Individual Training) 6 3 7 2 21 39
HIPAA (Department Training) 0 0 0 0 0 0
** Reporting Requirements are defined by functions delegated and contract terms. Revised contracts, amendments or new requirements form DHCS may require additional requirements from subcontractors as a result the number is fluid** Audits- Please note multiple audits have been conducted on the Plan, however many occurred in 2012 and 2013 and will be visible on the annual comparison dashboard** This report is intended to provide a high level overview of certain components of the compliance department and does not include/reflect functions the department is responsible for on a daily basis.***Training Sessions: 1 new employee, along with 20 yearly training.
Appropriate safeguards, including administrative policies and procedures, to protect the confidentiality of health
information and ensure compliance with HIPAA regulatory requirements.
Staff are informed of the GCHP's Code of conduct, Fraud Waste and Abuse Prevention Program, and HIPAA
Page 113 of 136Back to Agenda
PRESS UPDATE Medi-Cal plan’s funding effort targets the homeless, shut-ins, opioid abusers By Tom Kisken of the Ventura County Star Dan Levine's health relies not only on doctor's visits and medications but also on meals of meat loaf, mashed potatoes, carrots and peas. The braces on both legs make it difficult for the 72-year-old survivor of bone marrow cancer to go grocery shopping. Buying food is limited too by a budget that leans on Social Security. Every two weeks, the former real estate agent from Ventura receives 10 frozen meals along with bread, milk, snap peas, salads and other essentials. The food comes through a meal delivery service that received $20,000 from a new Gold Coast Health Plan program invented to broaden health care. Levine parcels out the chicken, beef and fish meals, along with the occasional $5 meal he buys from Kentucky Fried Chicken, to last two weeks until another delivery arrives. "It bridges the gap between being hungry and trying to figure out if I have enough money from Social Security to buy some food," he said. The Gold Coast Health Plan, launched five years ago, provides Medi-Cal insurance to more than 200,000 low-income Ventura County residents. Once immersed in red, the publicly-funded plan has built reserves that allow it to spend about two cents from every dollar of revenue on a new program called Alternative Resources for Community Health. That adds up to $12.1 million. The spending program orbits around finding different ways to help people's health. One involves tackling addiction. About $51,000 of ARCH's $12.1 million budget will be spent on kits that include nasal spray or syringes of the medication naloxone. It is used to help people breathe and reverse potentially fatal overdoses caused by opioids ranging from heroin to painkillers like Percocet. Ventura County Behavioral Health Department leaders say their pilot program involving naloxone has brought proof of 32 overdoses that were reversed. They say the money from ARCH will bring 1,000 more naloxone kits. "There is a crisis in this country of opioid use. We're not immune that," said Dr. C. Albert Reeves, chief medical officer for the Gold Coast Health Plan. In Ventura County, 85 deaths in 2014 were linked to opiate overdose.
Page 114 of 136Back to Agenda

"If we can save some lives from overdoses, that money is well spent," he said. Saving in the long term by spending now is the heartbeat of ARCH. Much of the $12 million will be spent on incentives to doctors and others. Still being formulated, the money will link financial rewards not to the number of services provided but to health outcomes. "The goal is to provide better care at less cost," Reeves said. Time to recuperate Homeless people on Medi-Cal have nowhere to go when they're discharged from a hospital. They end up back on the streets, don't fully recuperate and often land back in an emergency room. Or they never leave the hospital. "We have members that are filling hospital beds that we are paying for ... because they don't have a place to go," Reeves said. Some believe the answer is more time to recover. The nonprofit National Health Foundation is working on the launch of a program where hospitals would discharge homeless people to a recuperative care program based at Salvation Army in Ventura. The $600,000 program still needs final approval from the Ventura County Board of Supervisors but, as planned, would be funded by hospitals across Ventura County. ARCH has committed to providing $38,700 in startup costs. "We're hoping for it to open in the fall," said Kelly Bruno, CEO of the National Health Foundation. The $20,000 from ARCH for meals delivered to people like Dan Levine goes through the Ventura County Area Agency on Aging. In Ventura and Oxnard, meals are delivered by FOOD Share. The money is a small piece of the program's funding but it allows for 3,000 more meals, meaning a maxed-out program can expand. If they're like Levine, they learn to budget the meals. He's a Mormon who plans on offering oranges from trees at his home to FOOD Share, envisioning the fruit delivered to shut-ins. "We have to help each other," Levine said, trying to explain how he's aided by meals delivered twice a month. "It's enough to sustain me," he said.
Page 115 of 136Back to Agenda

AGENDA ITEM NO. 9
TO: Gold Coast Health Plan Commission
FROM: Ruth Watson, Chief Operating Officer DATE: June 27, 2016 SUBJECT: COO Update OPERATIONS UPDATE Membership Update – June 2016 Gold Coast Health Plan (GCHP) had a net increase of 2,301 members this month. GCHP’s membership as of June 1, 2016 is 206,920 and includes SB 75 Transition Population children (please refer to SB 75 Update below for additional details). GCHP's membership has increased by 88,408 (74.6%) since the beginning of Medi-Cal Expansion in January 2014. The cumulative new membership since January 1, 2014 is summarized as follows: Aid Code # of New Members L1 – Low Income Health Plan (LIHP) 1,349 M1 – Adult Expansion 53,864 7U – CalFresh Adults 1,703 7W – CalFresh Children 386 7S – Parents of 7Ws 424 Traditional Medi-Cal 30,682 Total New Membership 1/1/14 – 6/1/16 88,408
Adult Expansion members (aid code M1) represent 60.9% of GCHP’s new membership since the start of Medi-Cal Expansion.
L1 M1 7U 7W 7S Jun 16 1,349 53,864 1,703 386 424 May 16 1,407 52,898 1,820 433 478 Apr 16 1,596 51,769 1,910 462 549 Mar 16 1,800 50,648 2,015 510 620 Feb 16 1,873 50,185 2,110 549 579 Jan 16 1,953 49,653 2,205 608 736
Page 116 of 136Back to Agenda
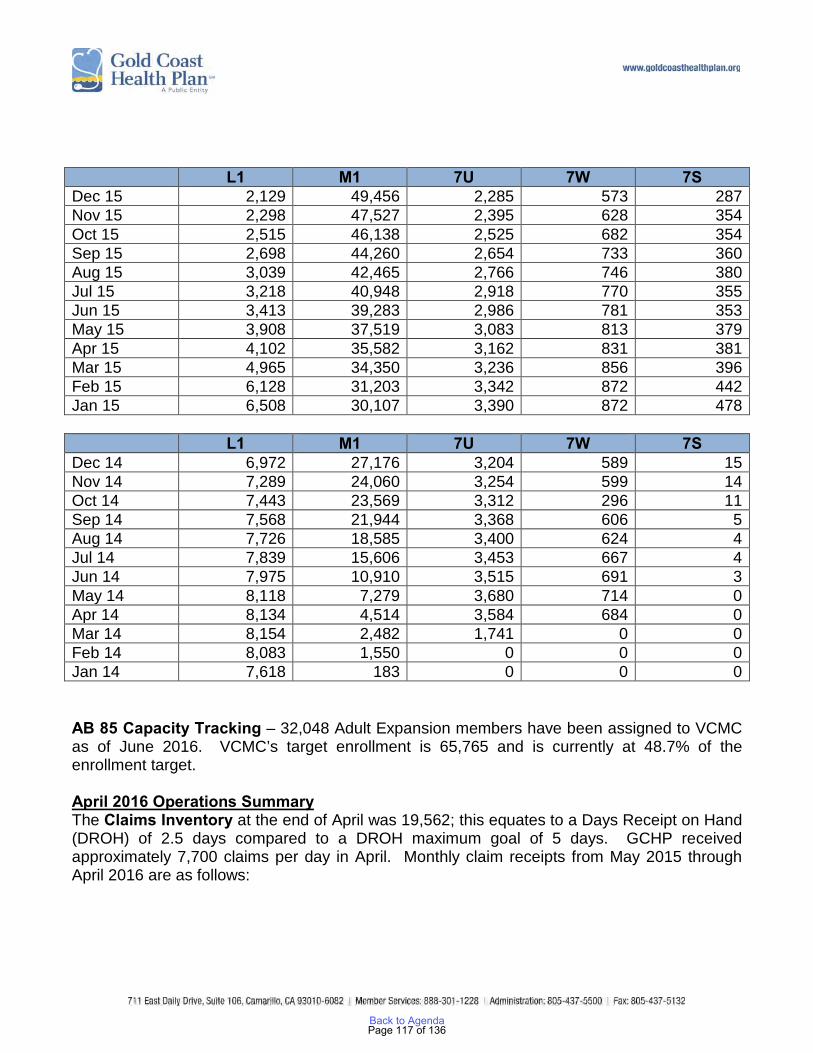
L1 M1 7U 7W 7S Dec 15 2,129 49,456 2,285 573 287 Nov 15 2,298 47,527 2,395 628 354 Oct 15 2,515 46,138 2,525 682 354 Sep 15 2,698 44,260 2,654 733 360 Aug 15 3,039 42,465 2,766 746 380 Jul 15 3,218 40,948 2,918 770 355 Jun 15 3,413 39,283 2,986 781 353 May 15 3,908 37,519 3,083 813 379 Apr 15 4,102 35,582 3,162 831 381 Mar 15 4,965 34,350 3,236 856 396 Feb 15 6,128 31,203 3,342 872 442 Jan 15 6,508 30,107 3,390 872 478 L1 M1 7U 7W 7S Dec 14 6,972 27,176 3,204 589 15 Nov 14 7,289 24,060 3,254 599 14 Oct 14 7,443 23,569 3,312 296 11 Sep 14 7,568 21,944 3,368 606 5 Aug 14 7,726 18,585 3,400 624 4 Jul 14 7,839 15,606 3,453 667 4 Jun 14 7,975 10,910 3,515 691 3 May 14 8,118 7,279 3,680 714 0 Apr 14 8,134 4,514 3,584 684 0 Mar 14 8,154 2,482 1,741 0 0 Feb 14 8,083 1,550 0 0 0 Jan 14 7,618 183 0 0 0 AB 85 Capacity Tracking – 32,048 Adult Expansion members have been assigned to VCMC as of June 2016. VCMC’s target enrollment is 65,765 and is currently at 48.7% of the enrollment target. April 2016 Operations Summary The Claims Inventory at the end of April was 19,562; this equates to a Days Receipt on Hand (DROH) of 2.5 days compared to a DROH maximum goal of 5 days. GCHP received approximately 7,700 claims per day in April. Monthly claim receipts from May 2015 through April 2016 are as follows:
Page 117 of 136Back to Agenda
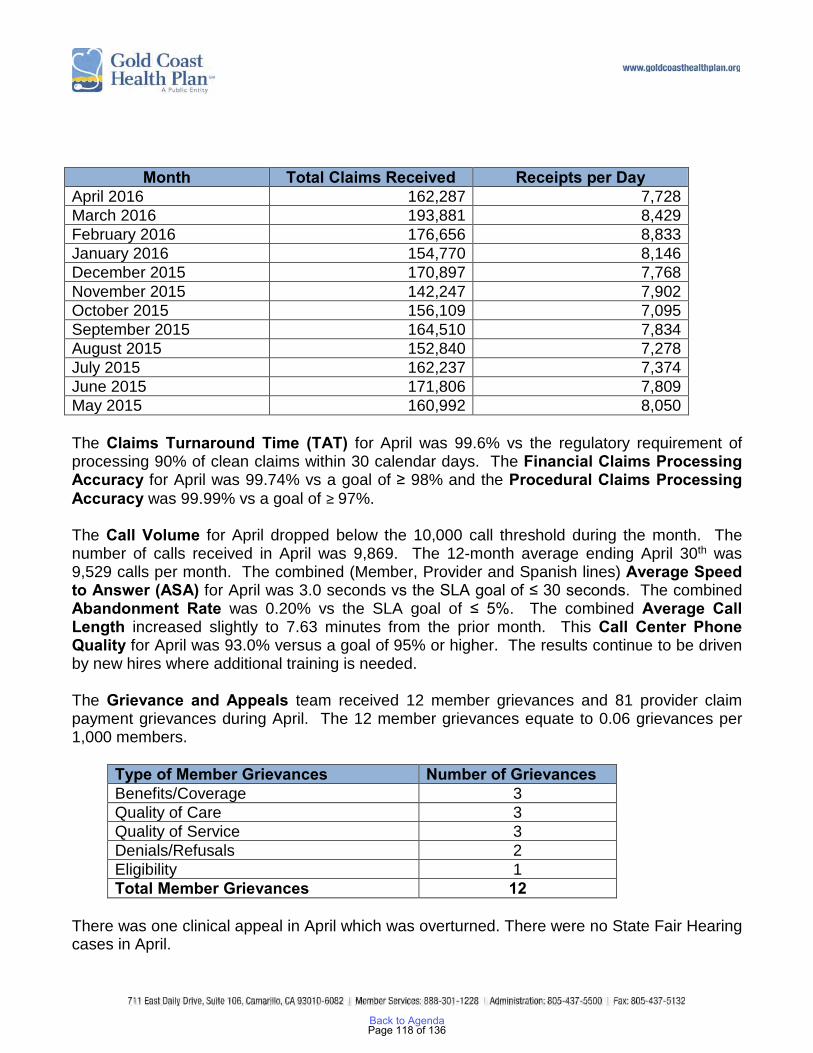
The Claims Turnaround Time (TAT) for April was 99.6% vs the regulatory requirement of processing 90% of clean claims within 30 calendar days. The Financial Claims Processing Accuracy for April was 99.74% vs a goal of ≥ 98% and the Procedural Claims Processing Accuracy was 99.99% vs a goal of ≥ 97%. The Call Volume for April dropped below the 10,000 call threshold during the month. The number of calls received in April was 9,869. The 12-month average ending April 30th was 9,529 calls per month. The combined (Member, Provider and Spanish lines) Average Speed to Answer (ASA) for April was 3.0 seconds vs the SLA goal of ≤ 30 seconds. The combined Abandonment Rate was 0.20% vs the SLA goal of ≤ 5%. The combined Average Call Length increased slightly to 7.63 minutes from the prior month. This Call Center Phone Quality for April was 93.0% versus a goal of 95% or higher. The results continue to be driven by new hires where additional training is needed. The Grievance and Appeals team received 12 member grievances and 81 provider claim payment grievances during April. The 12 member grievances equate to 0.06 grievances per 1,000 members.
There was one clinical appeal in April which was overturned. There were no State Fair Hearing cases in April.
Month Total Claims Received Receipts per Day April 2016 162,287 7,728 March 2016 193,881 8,429 February 2016 176,656 8,833 January 2016 154,770 8,146 December 2015 170,897 7,768 November 2015 142,247 7,902 October 2015 156,109 7,095 September 2015 164,510 7,834 August 2015 152,840 7,278 July 2015 162,237 7,374 June 2015 171,806 7,809 May 2015 160,992 8,050
Type of Member Grievances Number of Grievances Benefits/Coverage 3 Quality of Care 3 Quality of Service 3 Denials/Refusals 2 Eligibility 1 Total Member Grievances 12
Page 118 of 136Back to Agenda

SB 75 – Full Scope Medi-Cal for All Children DHCS previously informed GCHP that Ventura County had a total of 2,917 children who were in restricted scope that would be eligible for full scope Medi-Cal as of May 1, 2016 and would transition to GCHP as of June 1, 2016. Upon receipt of the June 834 eligibility file, GCHP performed an analysis of the file by comparing it to the data provided to us by DHCS. Of the 2,917 potential new members, 2,149 children or approximately 74%, transitioned to GCHP on June 1, 2016. The following is a breakdown of the analysis: New members as of 6/1/16 - 2,149 No Status - 672 (included in the 834 file but had no status so unable to load them into Ika) Not Included - 64 (not included in the 834 file at all) On-going - 28 (already GCHP members) On-going w/SOC - 2 (not eligible with GCHP until Share of Cost is satisfied) On Hold - 2 (DHCS or Ventura County has placed the eligibility determination on hold) The primary focus is on the 672 children that were included in the 834 file but have no status. GCHP reached out to DHCS for information regarding the “No Status” as well as the “Not Included” members. DHCS has advised all health plans that approximately 80% of the children in restricted scope transitioned on June 1, 2016 and anticipates that the remainder should transition on July 1, 2016. Member Orientation Meetings A total of 49 members (42 English, 7 Spanish) have attended Member Orientation meetings from January through May 2016. Of the 49 members, 31 indicated they learned about the meeting as a result of the informational flyer included in each new member packet. Administrative Services Organization (ASO) Evaluation GCHP is evaluating the Vendor Assessment Report and Total Cost of Ownership (TCO) Summary prepared by Optimity and presented to staff on May 13, 2016. The TCO analysis focused on three functions to consider for insourcing – the call center, claims processing and encounter data processing. These three areas provide the greatest opportunity in terms of key differentiating capabilities as it relates to performance and how we are viewed by our members and providers. Senior Leadership will be reviewing recommendations at the upcoming Strategic Planning Session.
Page 119 of 136Back to Agenda
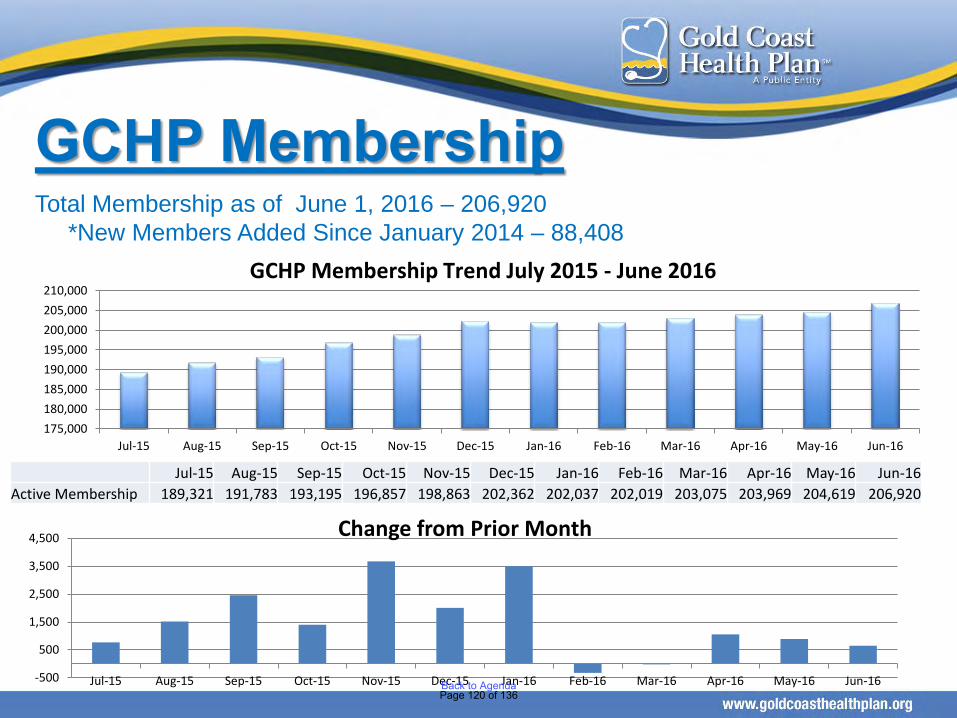
Total Membership as of June 1, 2016 – 206,920*New Members Added Since January 2014 – 88,408
GCHP Membership
175,000180,000185,000190,000195,000200,000205,000210,000
Jul-15 Aug-15 Sep-15 Oct-15 Nov-15 Dec-15 Jan-16 Feb-16 Mar-16 Apr-16 May-16 Jun-16
GCHP Membership Trend July 2015 - June 2016
Jul-15 Aug-15 Sep-15 Oct-15 Nov-15 Dec-15 Jan-16 Feb-16 Mar-16 Apr-16 May-16 Jun-16Active Membership 189,321 191,783 193,195 196,857 198,863 202,362 202,037 202,019 203,075 203,969 204,619 206,920
-500
500
1,500
2,500
3,500
4,500
Jul-15 Aug-15 Sep-15 Oct-15 Nov-15 Dec-15 Jan-16 Feb-16 Mar-16 Apr-16 May-16 Jun-16
Change from Prior Month
Page 120 of 136Back to Agenda
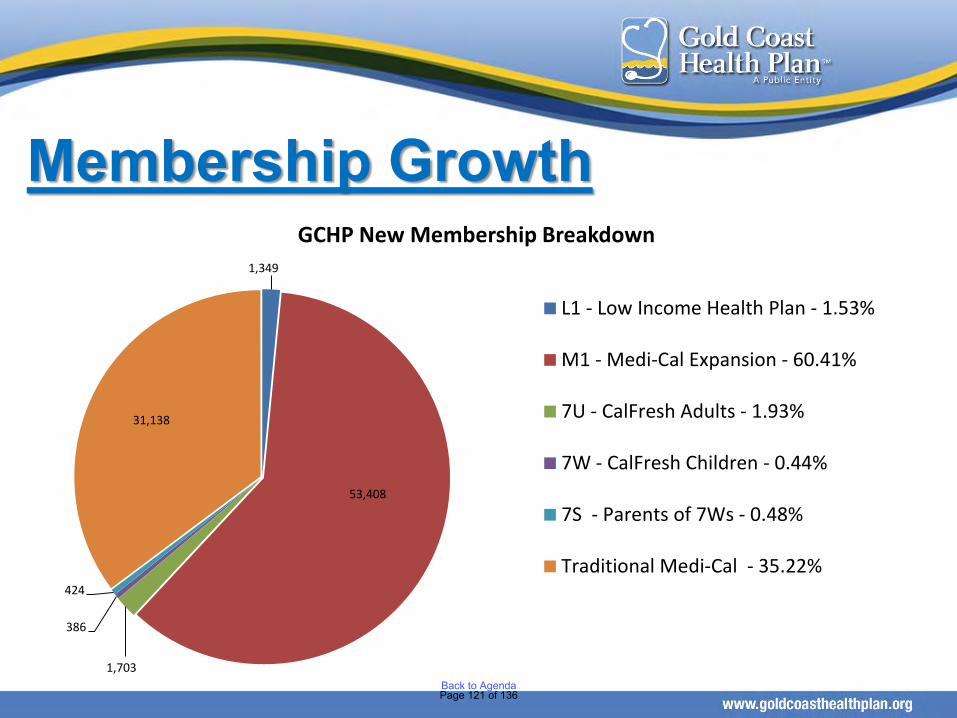
Membership Growth1,349
53,408
1,703
386
424
31,138
GCHP New Membership Breakdown
L1 - Low Income Health Plan - 1.53%
M1 - Medi-Cal Expansion - 60.41%
7U - CalFresh Adults - 1.93%
7W - CalFresh Children - 0.44%
7S - Parents of 7Ws - 0.48%
Traditional Medi-Cal - 35.22%
Page 121 of 136Back to Agenda

GCHP Membership Churn Summary – FY 2015-16
Jul-15 Aug-15 Sep-15 Oct-15 Nov-15 Dec-15 Jan-16 Feb-16 Mar-16 Apr-16 May-16 Jun-16 Membership from Prior Month 187,801 189,321 191,783 193,185 196,857 198,863 202,362 202,037 202,019 203,075 203,969 204,619 Prior Month Members Inactive in Current Month 5,352 4,448 5,280 3,371 4,141 3,236 6,906 6,139 6,078 5,723 5,642 5,584
Sub-total 182,449 184,873 186,503 189,814 192,716 195,627 195,456 195,898 195,941 197,352 198,327 199,035 Percentage of Inactive Members from Prior Month 2.85% 2.35% 2.75% 1.74% 2.10% 1.63% 3.41% 3.04% 3.01% 2.82% 2.77% 2.73%
Current Month New Members 5,068 5,241 5,383 5,503 5,015 5,454 5,794 4,215 5,059 4,742 4,368 6,316
Sub-total 187,517 190,114 191,886 195,317 197,731 201,081 201,250 200,113 201,000 202,094 202,695 205,351 Percentage of New Members Reflected in Current Membership 2.68% 2.73% 2.79% 2.80% 2.52% 2.70% 2.87% 2.09% 2.49% 2.32% 2.13% 3.05%
Retroactive Member Additions 1,804 1,669 1,299 1,540 1,132 1,281 787 1,906 2,075 1,875 1,924 1,569 Active Current Month Membership 189,321 191,783 193,185 196,857 198,863 202,362 202,037 202,019 203,075 203,969 204,619 206,920
Percentage of Retroactive Members Reflected in Current Membership 0.95% 0.87% 0.67% 0.78% 0.57% 0.63% 0.39% 0.94% 1.02% 0.92% 0.94% 0.76%
Page 122 of 136Back to Agenda

GCHP Auto Assignment by PCP/Clinic as of June 1, 2016
Auto Assignment Process • 75% of eligible Adult Expansion (AE) members (M1 & 7U) are assigned to the County as
required by AB 85 • The remaining 25% are combined with the regular eligible members and assigned using the
standard auto assignment process, i.e., 3:1 for safety net providers and 1:1 for all others • The County’s overall auto assignment results will be higher than 75% since they receive
75% of the AE members plus a 3:1 ratio of all other unassigned members • VCMC’s target enrollment is 65,765
VCMC has 32,048 assigned Adult Expansion members as of June 1, 2016 and is currently at 48.7% of capacity
Jun-16 May-16 Apr-16 Mar-16 Feb-16 Jan-16 Count % Count % Count % Count % Count % Count % AB85 Eligible 1,075 1,329 1,807 1,188 1,591 1,292
VCMC 806 74.98% 996 74.94% 1,355 74.99% 891 75.00% 1,193 74.98% 969 75.00% Balance 269 25.02% 333 25.06% 452 25.01% 297 25.00% 398 25.02% 323 25.00%
Regular Eligible 815 1,317 1,335 1,076 1,250 944 Regular + AB85 Balance 1,084 1,650 1,787 1,373 1,648 1,267
Clinicas 237 21.86% 396 24.00% 426 23.84% 272 19.81% 305 18.51% 251 19.81% CMH 128 11.81% 171 10.36% 217 12.14% 165 12.02% 193 11.71% 144 11.37% Independent 38 3.51% 52 3.15% 33 1.85% 23 1.68% 34 2.06% 23 1.82% VCMC 681 62.82% 1,031 62.48% 1,111 62.17% 913 66.50% 1,116 67.72% 849 67.01%
Total Assigned 1,890 2,646 3,142 2,264 2,841 2,236
Clinicas 237 12.54% 396 14.97% 426 13.56% 272 12.01% 305 10.74% 251 11.23% CMH 128 6.77% 171 6.46% 217 6.91% 165 7.29% 193 6.79% 144 6.44% Independent 38 2.01% 52 1.97% 33 1.05% 23 1.02% 34 1.20% 23 1.03% VCMC 1,487 78.68% 2,027 76.61% 2,466 78.49% 1,804 79.68% 2,309 81.27% 1,818 81.31%
Page 123 of 136Back to Agenda
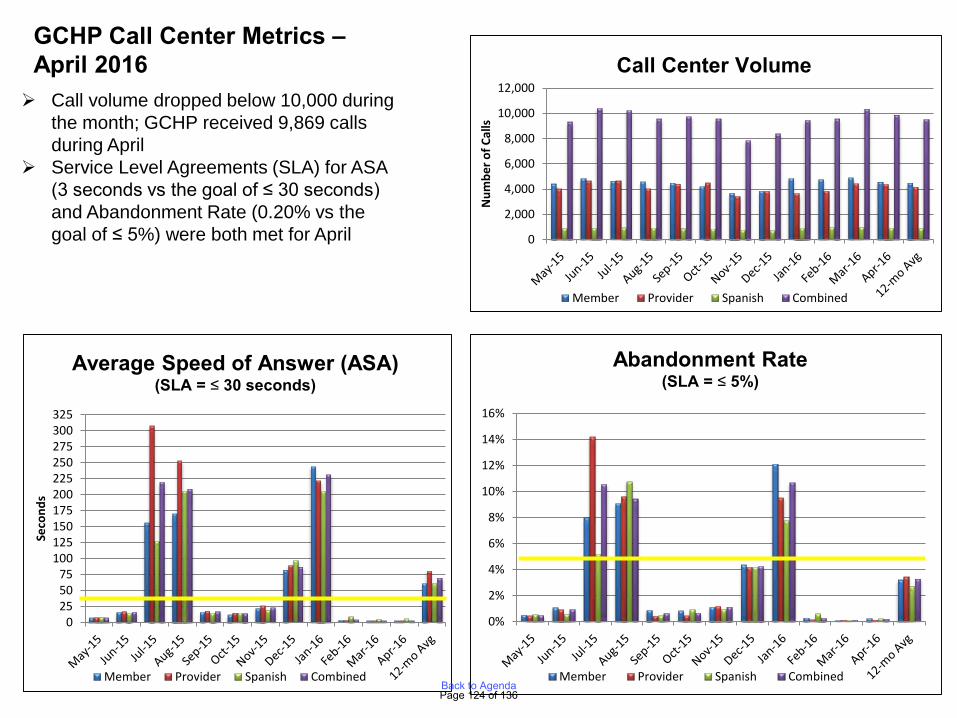
Call volume dropped below 10,000 during the month; GCHP received 9,869 calls during April
Service Level Agreements (SLA) for ASA (3 seconds vs the goal of ≤ 30 seconds) and Abandonment Rate (0.20% vs the goal of ≤ 5%) were both met for April
GCHP Call Center Metrics –April 2016
0
2,000
4,000
6,000
8,000
10,000
12,000
Num
ber o
f Cal
ls
Member Provider Spanish Combined
Call Center Volume
0255075
100125150175200225250275300325
Seco
nds
Member Provider Spanish Combined
Average Speed of Answer (ASA)(SLA = ≤ 30 seconds)
0%
2%
4%
6%
8%
10%
12%
14%
16%
Member Provider Spanish Combined
Abandonment Rate(SLA = ≤ 5%)
Page 124 of 136Back to Agenda
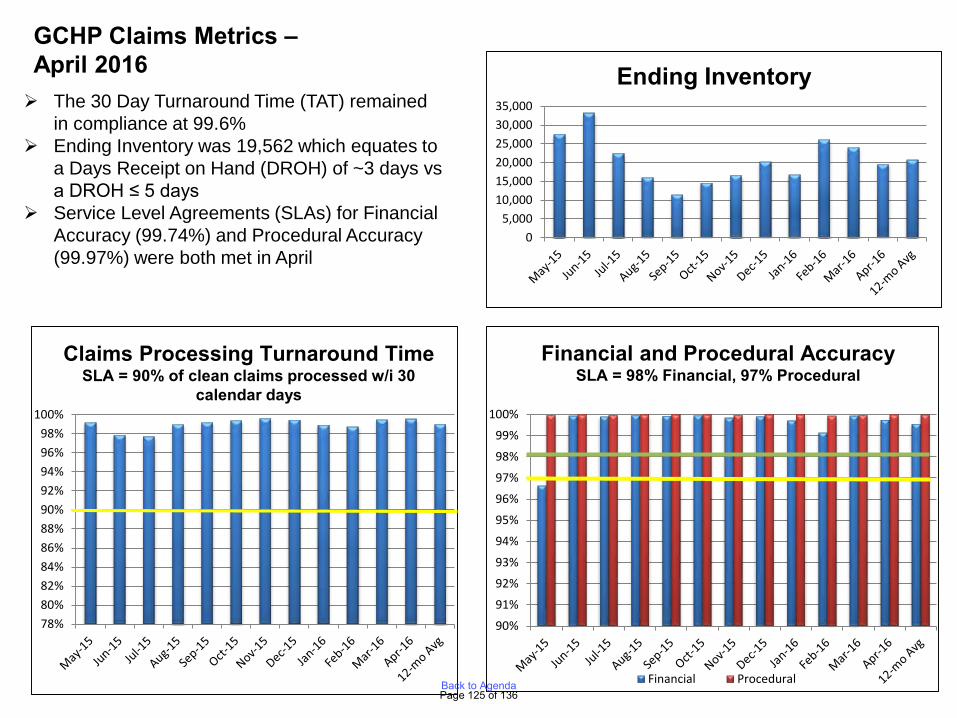
The 30 Day Turnaround Time (TAT) remained in compliance at 99.6%
Ending Inventory was 19,562 which equates to a Days Receipt on Hand (DROH) of ~3 days vs a DROH ≤ 5 days
Service Level Agreements (SLAs) for Financial Accuracy (99.74%) and Procedural Accuracy (99.97%) were both met in April
GCHP Claims Metrics –April 2016
05,000
10,00015,00020,00025,00030,00035,000
Ending Inventory
78%80%82%84%86%88%90%92%94%96%98%
100%
Claims Processing Turnaround TimeSLA = 90% of clean claims processed w/i 30
calendar days
90%
91%
92%
93%
94%
95%
96%
97%
98%
99%
100%
Financial Procedural
Financial and Procedural AccuracySLA = 98% Financial, 97% Procedural
Page 125 of 136Back to Agenda
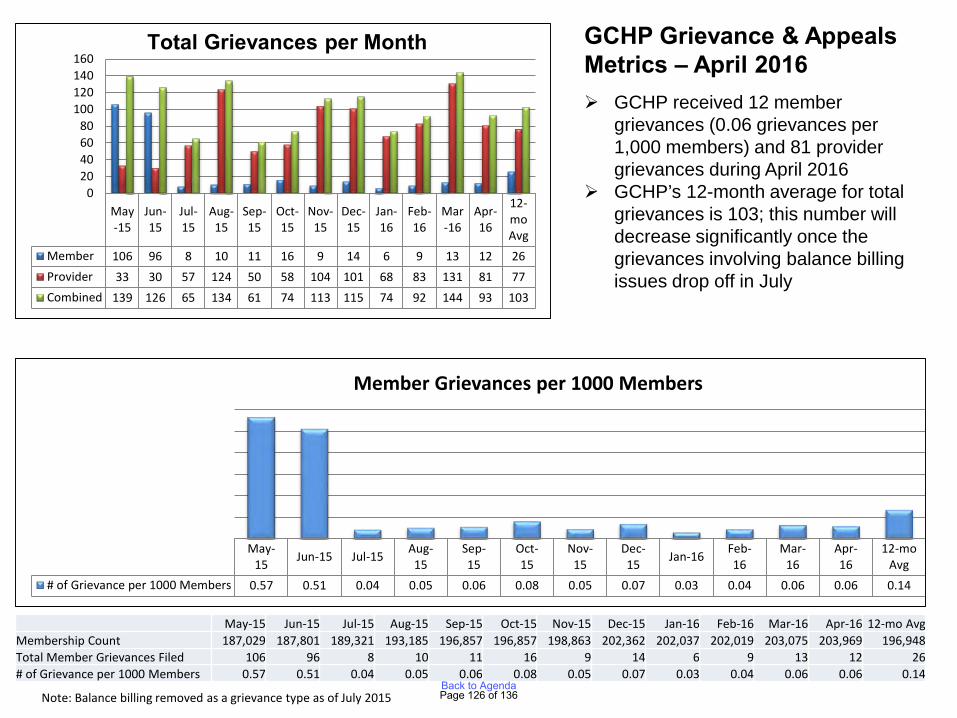
GCHP Grievance & Appeals Metrics – April 2016 GCHP received 12 member
grievances (0.06 grievances per 1,000 members) and 81 provider grievances during April 2016
GCHP’s 12-month average for total grievances is 103; this number will decrease significantly once the grievances involving balance billing issues drop off in July
Note: Balance billing removed as a grievance type as of July 2015
May-15
Jun-15
Jul-15
Aug-15
Sep-15
Oct-15
Nov-15
Dec-15
Jan-16
Feb-16
Mar-16
Apr-16
12-moAvg
Member 106 96 8 10 11 16 9 14 6 9 13 12 26Provider 33 30 57 124 50 58 104 101 68 83 131 81 77Combined 139 126 65 134 61 74 113 115 74 92 144 93 103
020406080
100120140160
Total Grievances per Month
May-15 Jun-15 Jul-15 Aug-
15Sep-15
Oct-15
Nov-15
Dec-15 Jan-16 Feb-
16Mar-
16Apr-16
12-moAvg
# of Grievance per 1000 Members 0.57 0.51 0.04 0.05 0.06 0.08 0.05 0.07 0.03 0.04 0.06 0.06 0.14
Member Grievances per 1000 Members
May-15 Jun-15 Jul-15 Aug-15 Sep-15 Oct-15 Nov-15 Dec-15 Jan-16 Feb-16 Mar-16 Apr-16 12-mo AvgMembership Count 187,029 187,801 189,321 193,185 196,857 196,857 198,863 202,362 202,037 202,019 203,075 203,969 196,948Total Member Grievances Filed 106 96 8 10 11 16 9 14 6 9 13 12 26# of Grievance per 1000 Members 0.57 0.51 0.04 0.05 0.06 0.08 0.05 0.07 0.03 0.04 0.06 0.06 0.14
Page 126 of 136Back to Agenda
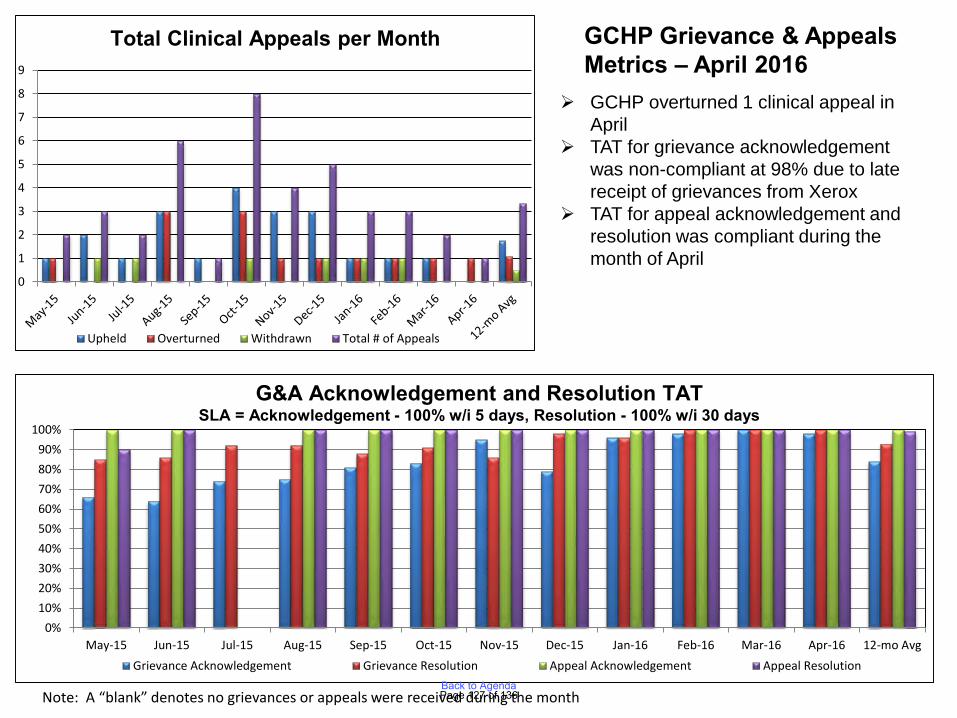
GCHP Grievance & Appeals Metrics – April 2016
GCHP overturned 1 clinical appeal in April
TAT for grievance acknowledgement was non-compliant at 98% due to late receipt of grievances from Xerox
TAT for appeal acknowledgement and resolution was compliant during the month of April
Note: A “blank” denotes no grievances or appeals were received during the month
0
1
2
3
4
5
6
7
8
9
Upheld Overturned Withdrawn Total # of Appeals
Total Clinical Appeals per Month
0%10%20%30%40%50%60%70%80%90%
100%
May-15 Jun-15 Jul-15 Aug-15 Sep-15 Oct-15 Nov-15 Dec-15 Jan-16 Feb-16 Mar-16 Apr-16 12-mo AvgGrievance Acknowledgement Grievance Resolution Appeal Acknowledgement Appeal Resolution
G&A Acknowledgement and Resolution TATSLA = Acknowledgement - 100% w/i 5 days, Resolution - 100% w/i 30 days
Page 127 of 136Back to Agenda
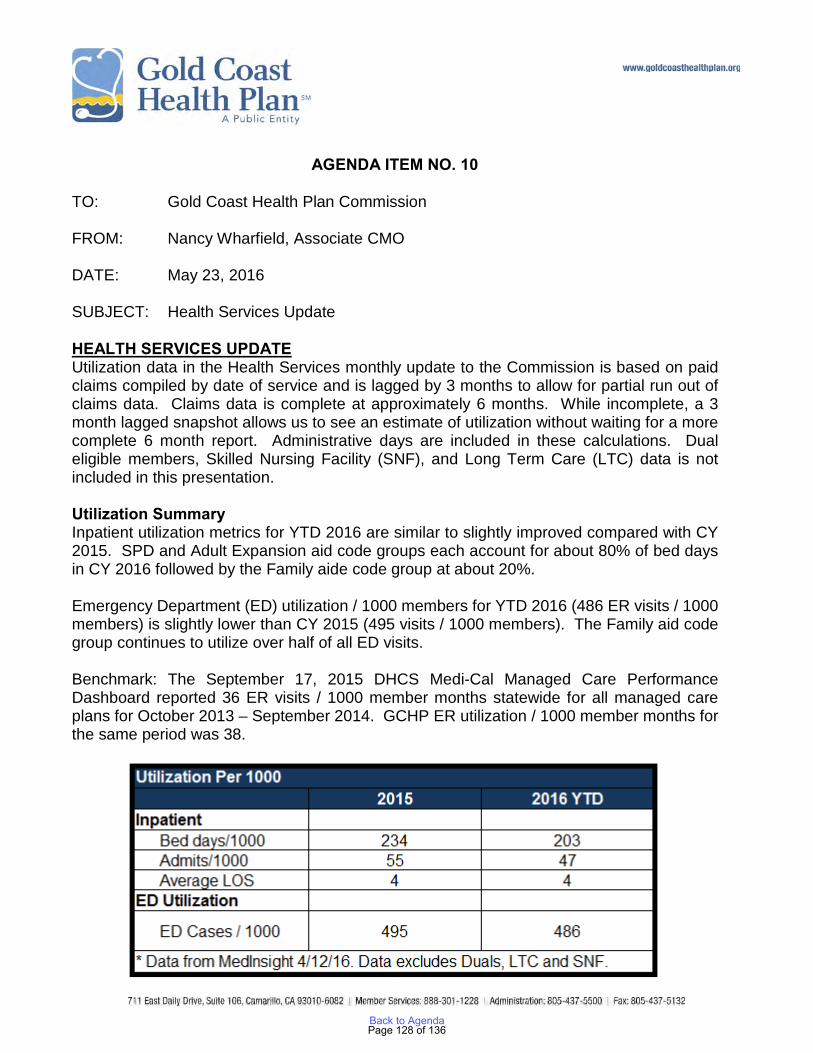
AGENDA ITEM NO. 10 TO: Gold Coast Health Plan Commission FROM: Nancy Wharfield, Associate CMO DATE: May 23, 2016 SUBJECT: Health Services Update HEALTH SERVICES UPDATE Utilization data in the Health Services monthly update to the Commission is based on paid claims compiled by date of service and is lagged by 3 months to allow for partial run out of claims data. Claims data is complete at approximately 6 months. While incomplete, a 3 month lagged snapshot allows us to see an estimate of utilization without waiting for a more complete 6 month report. Administrative days are included in these calculations. Dual eligible members, Skilled Nursing Facility (SNF), and Long Term Care (LTC) data is not included in this presentation. Utilization Summary Inpatient utilization metrics for YTD 2016 are similar to slightly improved compared with CY 2015. SPD and Adult Expansion aid code groups each account for about 80% of bed days in CY 2016 followed by the Family aide code group at about 20%. Emergency Department (ED) utilization / 1000 members for YTD 2016 (486 ER visits / 1000 members) is slightly lower than CY 2015 (495 visits / 1000 members). The Family aid code group continues to utilize over half of all ED visits. Benchmark: The September 17, 2015 DHCS Medi-Cal Managed Care Performance Dashboard reported 36 ER visits / 1000 member months statewide for all managed care plans for October 2013 – September 2014. GCHP ER utilization / 1000 member months for the same period was 38.
Page 128 of 136Back to Agenda
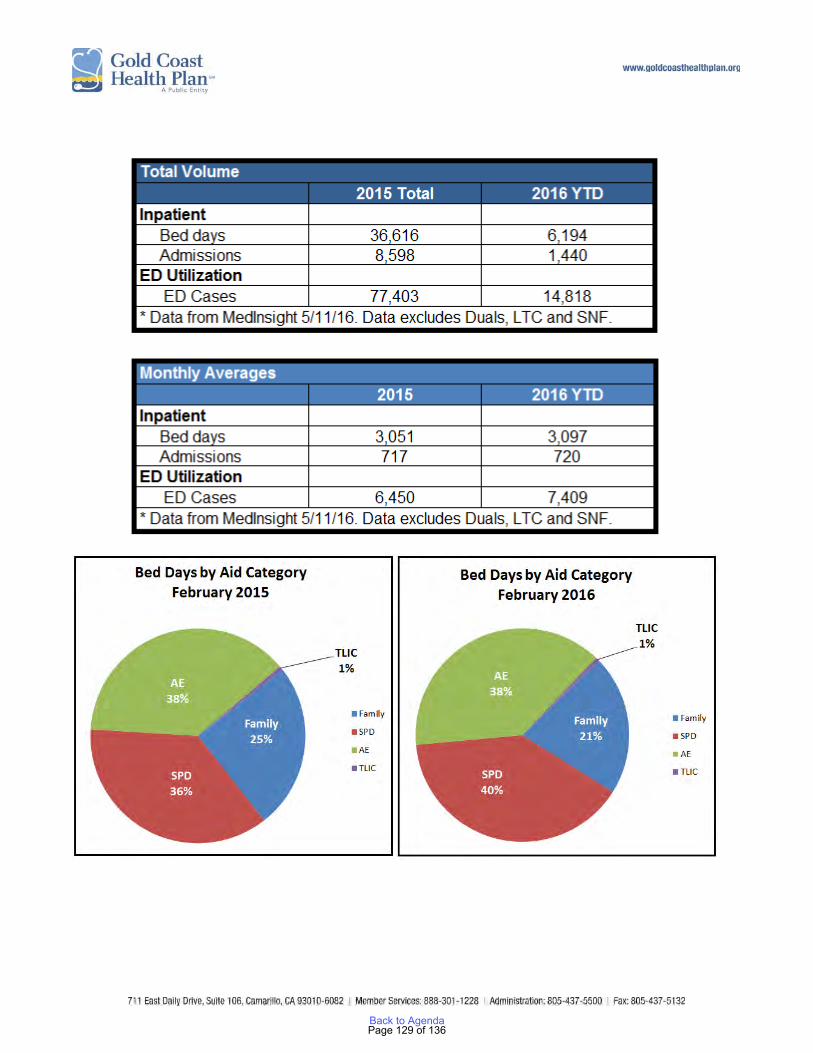
Page 129 of 136Back to Agenda
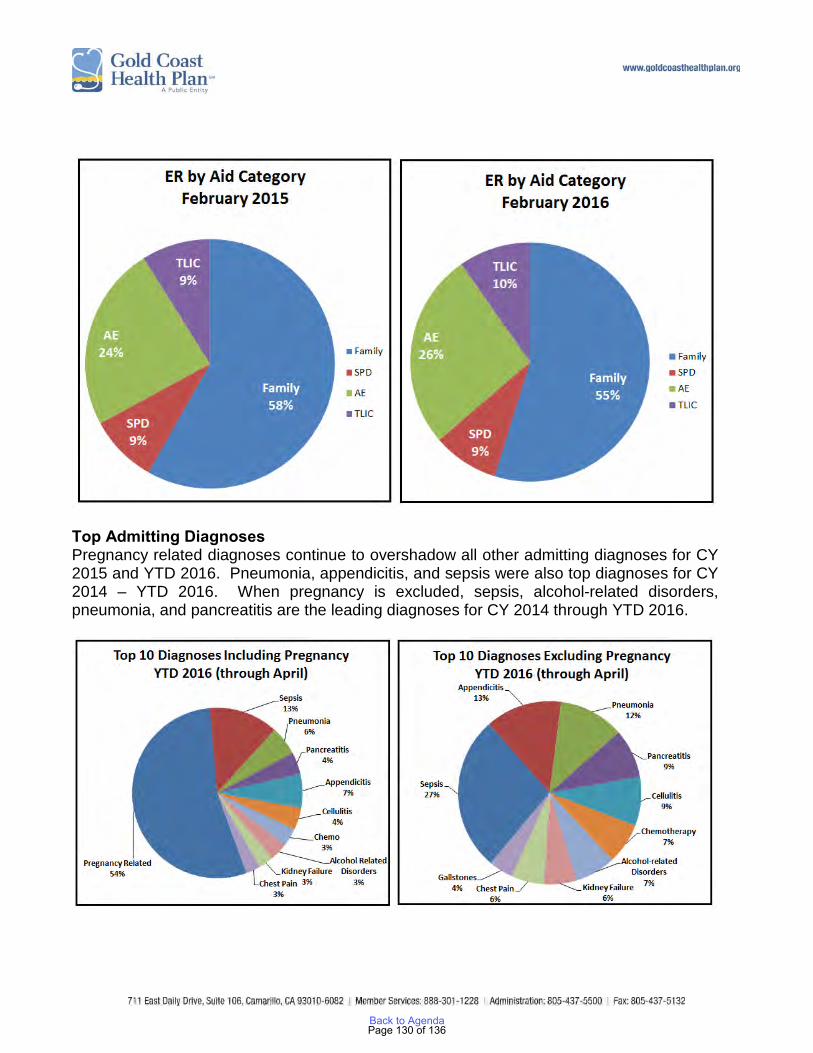
Top Admitting Diagnoses Pregnancy related diagnoses continue to overshadow all other admitting diagnoses for CY 2015 and YTD 2016. Pneumonia, appendicitis, and sepsis were also top diagnoses for CY 2014 – YTD 2016. When pregnancy is excluded, sepsis, alcohol-related disorders, pneumonia, and pancreatitis are the leading diagnoses for CY 2014 through YTD 2016.
Page 130 of 136Back to Agenda
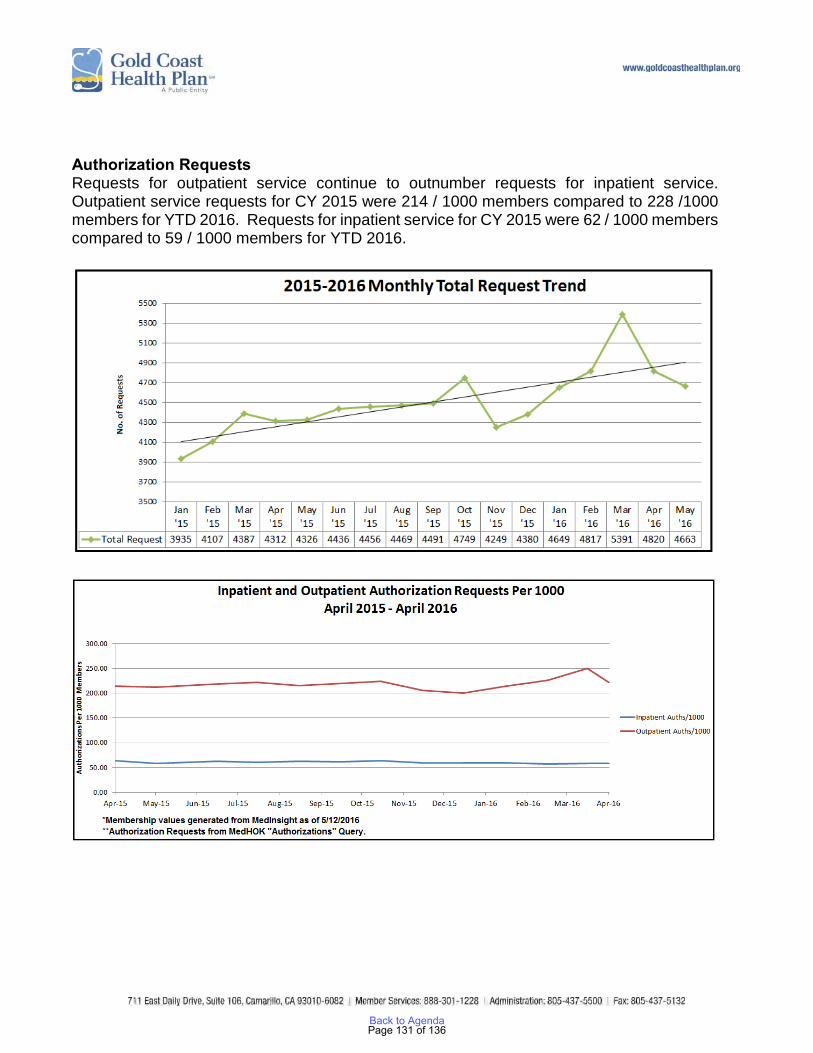
Authorization Requests Requests for outpatient service continue to outnumber requests for inpatient service. Outpatient service requests for CY 2015 were 214 / 1000 members compared to 228 /1000 members for YTD 2016. Requests for inpatient service for CY 2015 were 62 / 1000 members compared to 59 / 1000 members for YTD 2016.
Page 131 of 136Back to Agenda
END OF LIFE SERVICES The Department of Health Care Services (DHCS) has provided Medi-Cal Managed Care Plans with guidance regarding end of life services mandated under the End of Life Option Act (AB x2-15), signed into law October 2015, through All Plan Letter (APL) 16-006. The End of Life Option Act became effective June 9, 2016 and establishes a benefit to permit terminally ill individuals age 18 or older to make a request to be prescribed aid-in-dying medications. Two physicians, one “attending” and one “consulting” physician, must each independently determine that the individual has a terminal disease with a prognosis of six months or less, and has the capacity to make medical decisions. Provision of these services by health care providers is voluntary, and refusal to provide these services will not place any physician at risk for civil, criminal, or professional penalties. DHCS has indicated in APL 16-006 that end of life services, including consultations and the prescription of aid-in-dying drug, are a carve-out to Medi-Cal Managed Care plans. Therefore, these services are delivered and payable only under Fee for Service (FFS) Medi-Cal. Medi-Cal Managed Care providers who are not enrolled with DHCS as FFS providers, or who choose not to provide end of life services, may document the beneficiary’s oral request in the medical record, and should advise beneficiaries that they should seek these services with an appropriate FFS provider. Medi-Cal Managed Care providers who are enrolled with DHCS as FFS providers who elect to provide end of life services, and will bill for such services to FFS Medi-Cal. Pharmacies providing end of life medications will bill FFS Medi-Cal. DHCS will make additional information available to FFS providers regarding their roles and responsibilities through an upcoming Medi-Cal Provider Manual update. Of note, the APL specifies that beneficiaries are responsible for finding a Medi-Cal FFS physician who can provide end of life care.
Page 132 of 136Back to Agenda
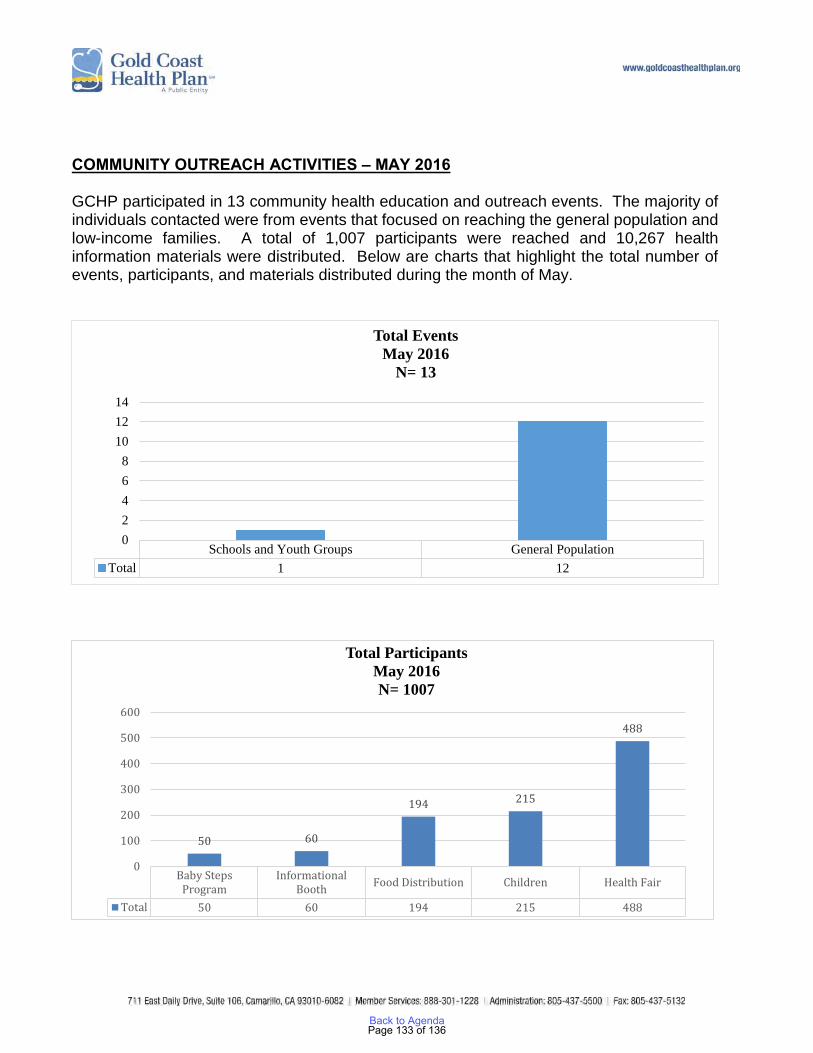
COMMUNITY OUTREACH ACTIVITIES – MAY 2016 GCHP participated in 13 community health education and outreach events. The majority of individuals contacted were from events that focused on reaching the general population and low-income families. A total of 1,007 participants were reached and 10,267 health information materials were distributed. Below are charts that highlight the total number of events, participants, and materials distributed during the month of May.
Schools and Youth Groups General PopulationTotal 1 12
02468
101214
Total EventsMay 2016
N= 13
Baby StepsProgram
InformationalBooth Food Distribution Children Health Fair
Total 50 60 194 215 488
50 60
194 215
488
0
100
200
300
400
500
600
Total ParticipantsMay 2016N= 1007
Page 133 of 136Back to Agenda
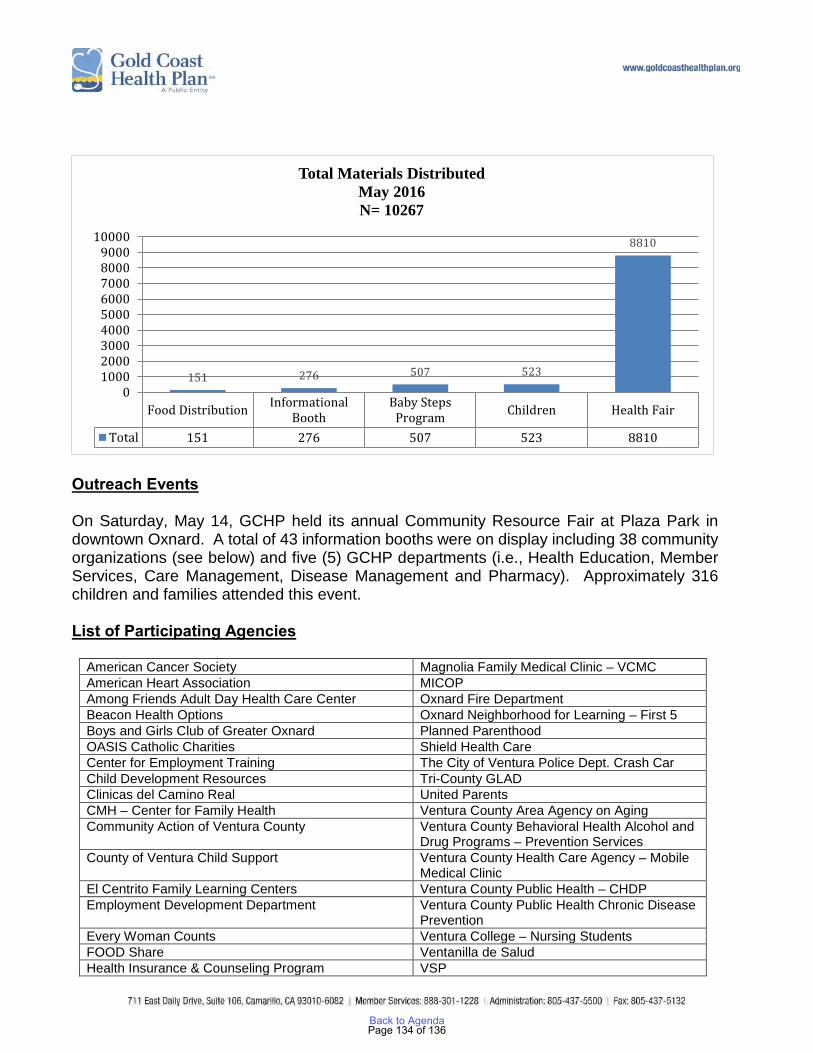
Outreach Events On Saturday, May 14, GCHP held its annual Community Resource Fair at Plaza Park in downtown Oxnard. A total of 43 information booths were on display including 38 community organizations (see below) and five (5) GCHP departments (i.e., Health Education, Member Services, Care Management, Disease Management and Pharmacy). Approximately 316 children and families attended this event. List of Participating Agencies
American Cancer Society Magnolia Family Medical Clinic – VCMC American Heart Association MICOP Among Friends Adult Day Health Care Center Oxnard Fire Department Beacon Health Options Oxnard Neighborhood for Learning – First 5 Boys and Girls Club of Greater Oxnard Planned Parenthood OASIS Catholic Charities Shield Health Care Center for Employment Training The City of Ventura Police Dept. Crash Car Child Development Resources Tri-County GLAD Clinicas del Camino Real United Parents CMH – Center for Family Health Ventura County Area Agency on Aging Community Action of Ventura County Ventura County Behavioral Health Alcohol and
Drug Programs – Prevention Services County of Ventura Child Support Ventura County Health Care Agency – Mobile
Medical Clinic El Centrito Family Learning Centers Ventura County Public Health – CHDP Employment Development Department Ventura County Public Health Chronic Disease
Prevention Every Woman Counts Ventura College – Nursing Students FOOD Share Ventanilla de Salud Health Insurance & Counseling Program VSP
Food Distribution InformationalBooth
Baby StepsProgram Children Health Fair
Total 151 276 507 523 8810
151 276 507 523
8810
0100020003000400050006000700080009000
10000
Total Materials DistributedMay 2016N= 10267
Page 134 of 136Back to Agenda

Interface Children & Family Services Ventura Transit System, Inc. Kids and Family Together Livingston Memorial Visiting Nurse Assn.
Participants were able to receive free blood pressure and glucose screenings through the Ventura County Health Care Agency – Mobile Medical Clinic (staffed by the Las Islas Clinic) and Clinicas del Camino Real. Ventura College Nursing students performed body mass index (BMI) screening. The Oxnard Fire Department offered CPR demonstration and the City of Ventura Police Department, in collaboration with Ventura County Behavioral Health, displayed the DUI Crashed Car Trailer. Other youth and family activities included physical fitness walk, face painting, Zumba demonstration, musical entertainment and dance group (Folklorico) by INLAKECH Cultural Arts Centers. Several other social service agencies were also available to provide information and resources to participants. GCHP Employee Participation GCHP had a total of 53 employees who participated in the community resource fair. Gold Coast Health Plan had five (5) information booths representing various departments including Pharmacy, Care Management, Disease Management, Member Services, and Health Education. A total of 1,085 encounters were made by the various departments, below is a breakdown of the adults, seniors and children that were reached during the event. Approximately 42% of the encounters reached by GCHP were under the age of 18, 47% were adults and 10% seniors.
GCHP Department Adults Seniors Minors Totals
Pharmacy Department 72 22 53 147
Care Management Dept. 73 20 90 183
Disease Management Dept. 120 2 67 189
Member Services 43 23 47 113
Health Education 133 31 113 277
Health Education - Kids Zone 65 20 91 176 Certificate of Appreciation from Elected Officials GCHP received certificates of appreciation from several distinguished elected officials including Ventura County Supervisor John C. Zaragoza, Mayor of Oxnard Pro Tem, Carmen Ramirez, Field Representative Allison Maginot for Senator Hannah-Beth Jackson, and Field Representative Jason Barnes for Congresswomen Julia Brownley.
Page 135 of 136Back to Agenda
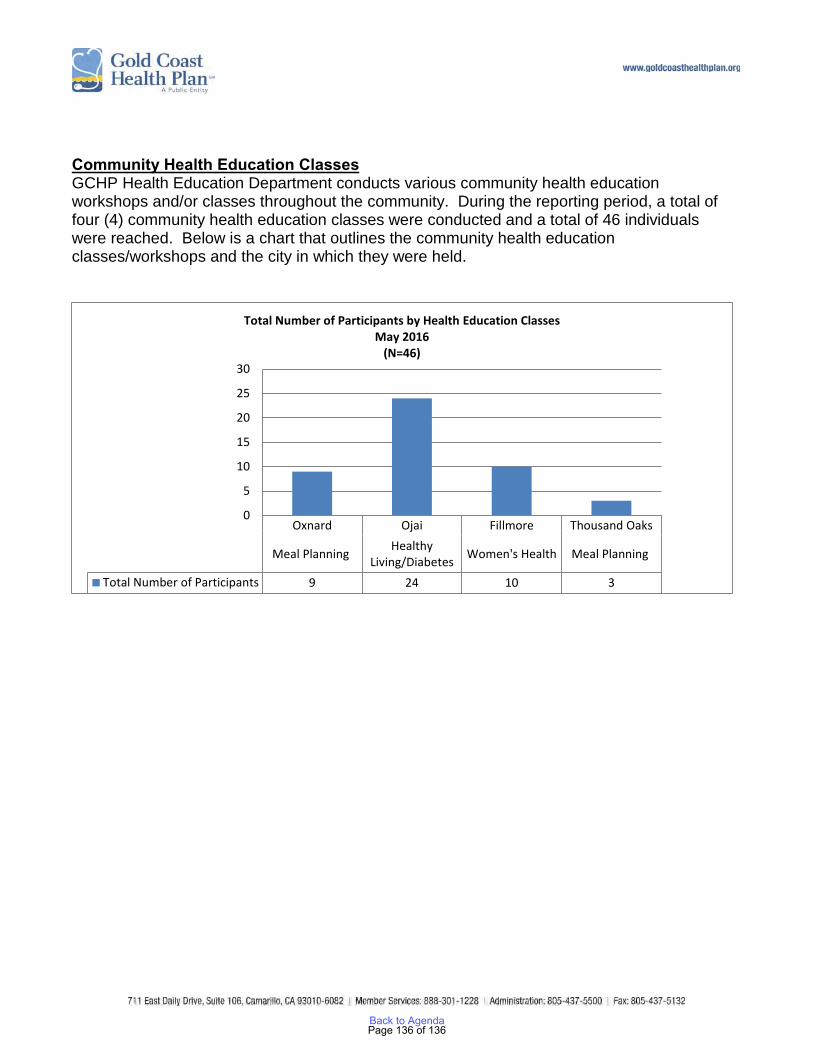
Community Health Education Classes GCHP Health Education Department conducts various community health education workshops and/or classes throughout the community. During the reporting period, a total of four (4) community health education classes were conducted and a total of 46 individuals were reached. Below is a chart that outlines the community health education classes/workshops and the city in which they were held.
Oxnard Ojai Fillmore Thousand Oaks
Meal Planning HealthyLiving/Diabetes Women's Health Meal Planning
Total Number of Participants 9 24 10 3
0
5
10
15
20
25
30
Total Number of Participants by Health Education ClassesMay 2016
(N=46)
Page 136 of 136Back to Agenda