Embed Size (px)
Citation preview
VENTRICULAR FUNCTION
Atrial and ventricular volume and function in persistent and
permanent atrial fibrillation, a magnetic resonance
imaging study
SUSETTE KROHN THERKELSEN, M.D.,1,* BJOERN AARIS GROENNING,2 JESPER HASTRUP SVENDSEN,3 andGORM BOJE JENSEN1
1Department of Cardiology, Copenhagen University Hospital Hvidovre, Copenhagen, Denmark2Danish Research Center for Magnetic Resonance, Copenhagen University Hospital Hvidovre, Copenhagen, Denmark3Cardiac Catheterization Laboratory, The Heart Centre, Copenhagen University Hospital Rigshospitalet, Copenhagen, Denmark
Left atrial size is independently related to cardiovascular morbidity and mortality, and atrial fibrillation (AF) is strongly associated with atrialsize. Our aims were to report atrial and ventricular dimensions in patients with AF evaluated with magnetic resonance imaging (MRI), andto assess the inter-study reproducibility of the measurements. Nineteen healthy volunteers, 19 patients with permanent AF, and 58 patientswith persistent AF had cardiac dimensions evaluated by 6-mm cinematographic breath-hold MRI scans using a 1.5 Tesla Siemens VisionMagnetom scanner with a phased array chest coil. Intraobserver variability and inter-study reproducibility of the cardiac volumes andejection fractions (EF) gave acceptable Bland-Altman plots, good correlations (R2: 0.80–0.99), and low reproducibility coefficients. Themean atrial volumes were similar in the two groups with AF [systolic vol. index (SVI): 75.9–80.3 mL/m2; diastolic vol. index (DVI): 77.4–82.1 mL/m2] and significantly different from the healthy volunteers (SVI: 30.3 mL/m2; DVI: 62.3 mL/m2; p < 0.0001). Mean leftventricular (LV) volumes and EF were significantly different in permanent AF (SVI: 34.2 mL/m2; DVI: 68.3 mL/m2; EF: 50.8%) comparedto persistent AF [SVI: 44.0 mL/m2 (p = 0.02); DVI: 77.2 mL/m2 (p = 0.03); EF: 44.9% (p = 0.02)], and closer to the normal values (SVI:22.4 mL/m2; DVI: 66.5 mL/m2; EF: 67.0%). MRI is a highly reproducible method for measurement of atrial and ventricular dimensions inhealthy volunteers and in patients with AF. Our results suggest that atrial dilatation appears within the first months of AF and stays more orless unchanged thereafter. The LV appears to dilate early as a response to AF, but later seems to adapt.
Key Words: Atrial volume; Atrial function; Ventricular volume; Ventricular function; Atrial fibrillation; Magnetic resonance imaging
1. Introduction
Atrial fibrillation (AF) is the most common cardiac arrhyth-mia. The prevalence goes up with increasing age of thepopulation (1), and recently, the age-standardized prevalencehas been shown to be increasing in the male population (2).AF is classified as either paroxysmal, requiring no interven-tion for termination (self-limited); persistent with a durationof usually more than 7 days, requiring medical or electricalcardioversion to achieve sinus rhythm; or permanent, whereachieving sinus rhythm is either not possible or has not beenattempted (1).
Left atrial (LA) size is independently related to car-diovascular morbidity and mortality (3–5). Moreover, it is
well known that AF is strongly associated with atrial size,as atrial dilatation is both the cause and consequence ofAF (1, 6).
Magnetic Resonance Imaging (MRI) of the atria has onlybeen evaluated in few studies and never in patients withpersistent or permanent AF (7, 8). For imaging of the cardiacventricles, MRI is regarded as the gold standard, but has onlybeen examined in a few studies in patients with AF (9).Echocardiography is the most widespread cardiac imagingtechnique. However, due to technical limitations, it is oftendifficult to accurately assess cardiac chamber volumes.Echocardiographic atrial volume measurements are dependenton correct angulations and positioning of the imaging planesand on geometric assumptions about atrial shape. Echocar-diography underestimates LAvolumes significantly comparedto MRI (10), and is difficult in AF due to the irregular heartrhythm, causing a significant variation in ventricular filling.
Our aim was to assess the reproducibility of MRI for1) measuring atrial volumes and ejection fraction (EF) inhealthy volunteers and for 2) measuring atrial and ventricularvolumes as well as EF in patients with AF. In addition, we
Journal of Cardiovascular Magnetic Resonance (2005) 7, 465–473
Copyright D 2005 Taylor & Francis Inc.
ISSN: 1097-6647 print / 1532-429X online
DOI: 10.1081/JCMR-200053618
Received 24 June 2004; accepted 6 December 2004.*Address correspondence to Susette Krohn Therkelsen, M.D.,Department of Cardiology, 253, Copenhagen University HospitalHvidovre, Kettegaardsalle 30, DK-2650, Denmark; Fax: +45-36-32-37-55; E-mail: [email protected]
1097-6647 D 2005 Taylor & Francis Inc. 465Order reprints of this article at www.copyright.rightslink.com
report atrial measurements in healthy volunteers and atrial andventricular measurements in patients with persistent andpermanent AF.
2. Materials and methods
2.1. Study population
Between April 2001 and January 2003 a total of 96 par-ticipants were included: 19 healthy volunteers, 19 patientswith permanent AF, and 58 patients with persistent AF. Thehealthy volunteers with no prior history of cardiovascular orother chronic disease were recruited by internal advertising inthe hospital. They all had a normal physical examination,normal blood pressure (< 130/85 mm Hg), a normal restingelectrocardiogram defined by the Minnesota Code Criteriaand a normal echocardiogram (11), and were on no medica-tion (Table 1). Patients with persistent AF were consecutivelyrecruited as they were planned for elective cardioversion if the
duration of AF was less than 8 months, and patients withpermanent AF were recruited from our out-patient clinic.The patients with AF are described in Table 1. Exclusioncriteria for patients with AF were contraindications to MRI(pacemaker, claustrophobia, obesity, etc.), significant valvulardisease, previous cardiac surgery, severe pulmonary or renaldisease, severe heart failure (NYHA III and IV), and cardiacdiseases other than those listed in Table 1. The patients werein AF during the MRI examination.
The study conformed with the principles outlined in theDeclaration of Helsinki, and was approved by the local ethicscommittee. Written informed consent was obtained from thepatients and healthy volunteers.
2.2. MR imaging technique
MRI was performed using a 1.5 Tesla Siemens VisionMagnetom (Siemens Medical Systems, Erlangen, Germany)with high performance gradients (maximum amplitude 20
Table 1. Demographics and patient characteristics
Healthy volunteers Persistent AF Permanent AF
Number 19 58 19
Age years 56 (51–69) 65 (34–84)a 67 (44–83)a
Sex male/female 69%/31% 78%/22% 64%/36%Weight kg 75 (48–90) 84 (54–118)a 82 (52–120)Height cm 175 (162–192) 176 (155–196) 175 (155–195)Systolic BP mmHg 135 (110–170) 144 (72–200) 148 (111–186)a
Diastolic BP mmHg 83 (70–92) 89 (58–124)a 86 (61–117)Heart rate 66 (50–89) 77 (39–110)a 82 (57–109)a
Smoking 5 (26%) 16 (28%) 3 (16%)Medication
Digoxin 0 10 (17%)a 11 (58%)a,b
Verapamil 0 16 (28%)a 4 (21%)a
Beta blocker (other than Sotalol) 0 12 (21%)a 3 (16%)Sotalol 0 20 (35%)a 2 (11%)b
Flecainide 0 1 (2%) 0Propafenone 0 41 (71%)a 1 (5%)b
Amiodarone 0 3 (5%) 0ACE Inhibitors 0 17 (29%)a 9 (47%)a
Angiotensin II antagonists 0 2 (3%) 1 (5%)Cardiac history
Ischemic heart disease (by historgy) 0 8 (14%)a 3 (16%)Previous myocardial infraction 0 7 (12%)a 1 (5%)Hypertension (on medication) 0 23 (40%)a 7 (37%)a
LV systolic dysfunction (EF < 60%) 0 10 (17%)a 5 (26%)a
EF % at baseline echo (if EF < 60%) 42% (35–55%) 35% (30–40%)Days since last in sinusrhytm 0 107 (14–240)a 1022 (311–4745)a,b
Days with AF in total 0 146 (35–440)a 1154 (360–4745)a,b
Lone atrial fibrillation 0 24 (41%)a 9 (47%)a
Note: Values are either mean (range) or total number (%).aSignificantly different compared to the group with healthy volunteers.bSignificantly different compared to the group with persistent AF.
Therkelsen et al.466
mT/m; maximum slew rate 66 T/m/s). Imaging wasperformed with patients in the supine position using a phasedarray chest coil. Localizing scans were followed by breathhold (in expiration) cine acquisitions. Each slice was obtainedover 15 heart beats with an electrocardiographically gatedfast low angle shot (FLASH) cinematographic pulse se-quence, with echo sharing to improve the temporal resolu-tion. The time resolution between images was 50 ms (TR =9.9 ms; TE = 4.8 ms; flip angle = 20�; field of view = 350 �350 mm, and matrix size = 128 � 256 interpolated to 256 �256). Atrial slices were planned parallel to the axis goingfrom the tip of the mitral valve to the apex of the left ventricleon the cinematographic four-chamber image at ventricularend diastole (0 ms), creating vertical long-axis atrial images.The vertical long axis was chosen, as Jarvinen (7) showed thatthe definition of the atrioventricular borders (atrioventricularvalve annulus) is optimal in this position. Both atria werecovered by 20–25 6-mm slices with no inter-slice gaps. Thesame sequence was used to visualize both ventricles with astack of short-axis images. The short-axis images werepositioned according to the protocol suggested by Pennell(12), although we used 6-mm slices with no inter-slice gaps.In all, we had 18–25 slices covering both ventricles. The
healthy volunteers only had atrial scans, and consequently weused ventricular data from Lorenz et al. (13) as our normalreference intervals.
2.3. Image analysis
Image analysis was performed off-line using CMR tools(CMR tools, Evaluation Version 1, Imperial College, Lon-don, UK). All atrial and ventricular volumes were analyzedblindly in one batch by the same examiner with manualtracing of the systolic and diastolic endocardial borders, seeFig. 1. For each slice, atrial and ventricular systole anddiastole were defined.
Atrial image analyses: Atrial systole was defined as the firstimage (time = 0 ms) triggered by the R-wave, and atrialdiastole as the image immediately preceding the opening ofthe mitral valve. Care was taken to exclude the caval veinsand the pulmonary arteries from the atrial volumes.
Ventricular image analyses: Ventricular end-diastole wasdefined as the first image after the R-wave. Ventricular end-systole was chosen at the point where the blood pool wassmallest. The contour tracing was aided by reviewing the cinescans in the movie mode. The basal slice of the ventricles was
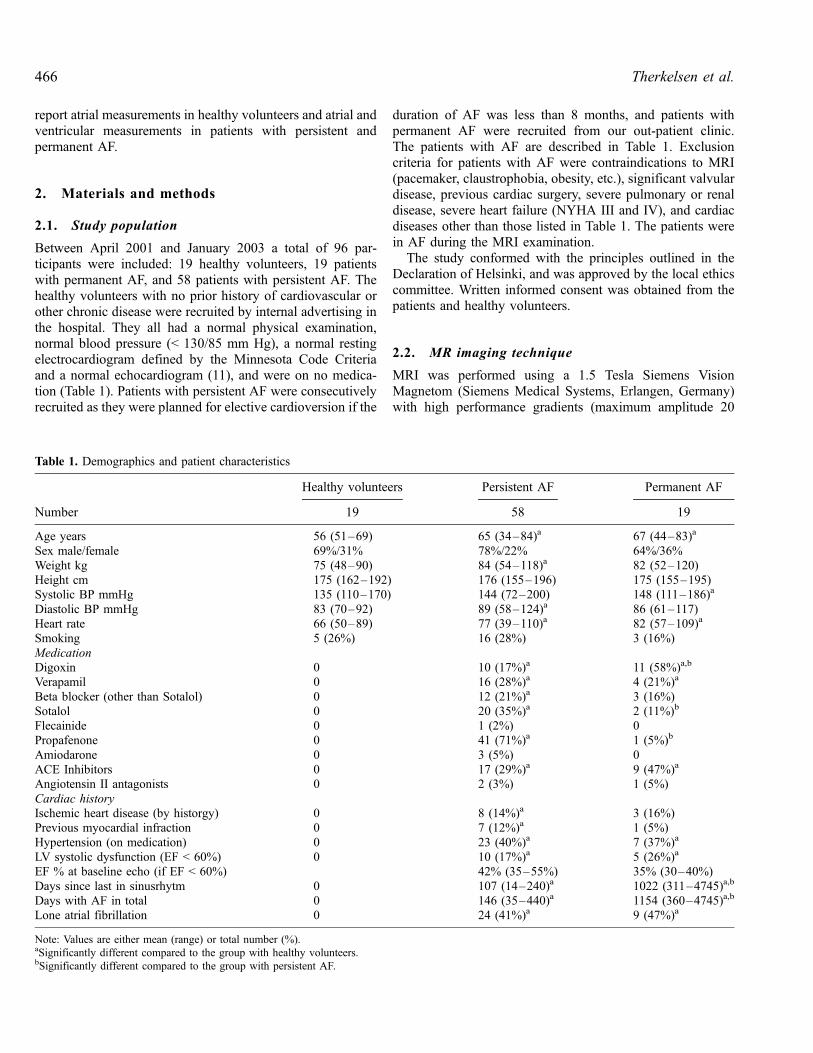
Figure 1. Examples of the atrial slices in vertical long axis with endocardial contours in atrial diastole in patients with atrial fibrillation.Contours are drawn manually on all slices in diastole and systole. LA: left atrium; RA: right atrium; LV: left ventricle; RV: right ventricle;PV: pulmonary vein; IVS: Inter-ventricular septum: Ao: Aorta; PA: pulmonary artery; IVC: inferior vena cava; SVC: Superior Vena Cava.
467Atrial and Ventricular Volumes in Atrial Fibrillation by MRI
carefully positioned according to Pennell (12), but in case ofdoubt, slices were considered to be within the left ventricle ifthe blood volume was surrounded by 50% or more ofventricular myocardium. The papillary muscles were outlinedseparately and included as myocardial mass. If the pulmonaryvalve was evident in the basal slice, only the part of thechamber below the level of the pulmonary valve was includedin the RV volume. In the inflow part of the right ventricle, theblood volume was excluded from the RV volume if thesurrounding wall appeared thin and untrabeculated.
The volumes were calculated by adding the volumes ofall the slices covering left and right atria and ventricles
(Simpson’s method). The EF was calculated as EF (%) =[End Diastolic Volume (EDV) � End Systolic Volume (ESV)]/DV � 100. LV mass was calculated as LV mass = 1.05 �(epicardial volume � endocardial volume). Body weight andbody height were measured and body surface area (BSA) (14)was calculated. Subsequently, division with BSA indexed allMRI variables apart from EF.
2.1.1. Intraobserver variability andinter-study reproducibility
To evaluate the intraobserver variability of atrial MRI, the 19healthy volunteer examinations were reanalyzed at least 2months after the initial analysis. Ten of the 19 patients withpermanent AF had two MRI scans to establish the inter-studyreproducibility of atrial and ventricular volume measure-ments in patients with AF. The two MRI scans were per-formed 1–5 days apart. The same 10 patients with permanentAF as above had their first MRI scan reanalyzed 7 monthsafter the initial analyses to evaluate the intraobserver var-iability. The same examiner evaluated all examinations.
2.4. Statistical analysis
For all MRI variables, verification of normal distribution ofdata was accomplished using histograms, and mean values± one standard deviation (SD) were calculated. Two-sample
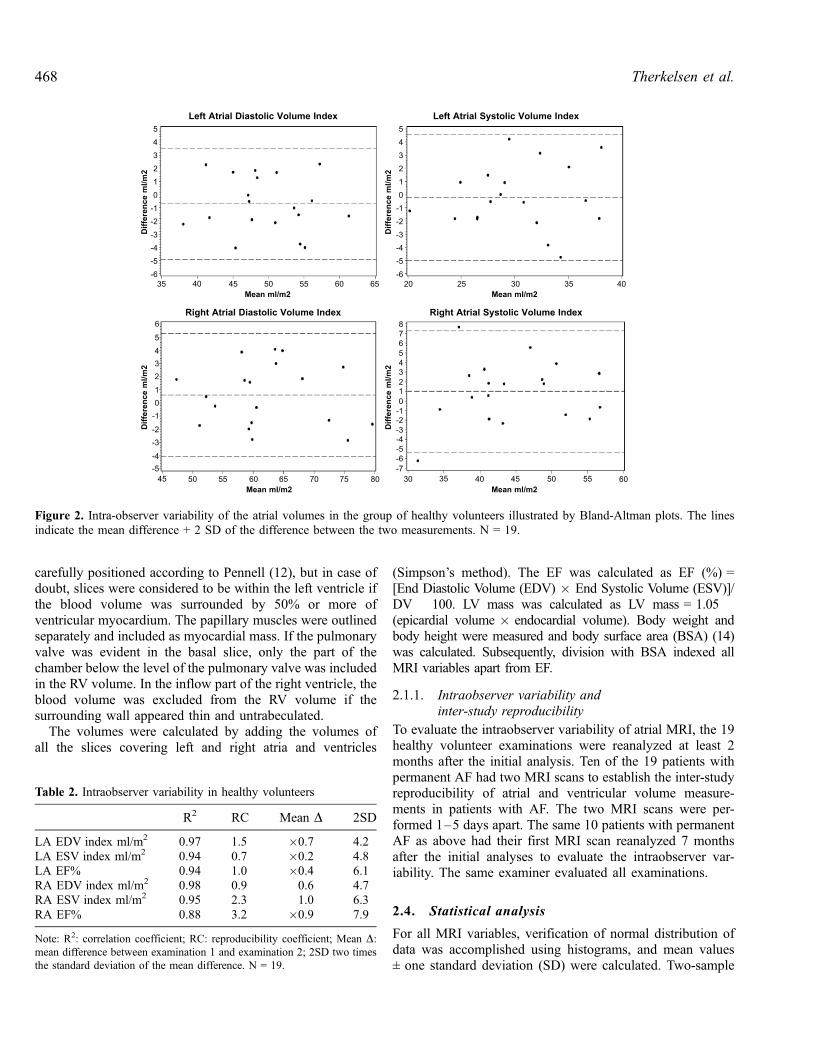
Figure 2. Intra-observer variability of the atrial volumes in the group of healthy volunteers illustrated by Bland-Altman plots. The linesindicate the mean difference + 2 SD of the difference between the two measurements. N = 19.
Table 2. Intraobserver variability in healthy volunteers
R2 RC Mean D 2SD
LA EDV index ml/m2 0.97 1.5 �0.7 4.2LA ESV index ml/m2 0.94 0.7 �0.2 4.8LA EF% 0.94 1.0 �0.4 6.1RA EDV index ml/m2 0.98 0.9 0.6 4.7RA ESV index ml/m2 0.95 2.3 1.0 6.3RA EF% 0.88 3.2 �0.9 7.9
Note: R2: correlation coefficient; RC: reproducibility coefficient; Mean D:mean difference between examination 1 and examination 2; 2SD two times
the standard deviation of the mean difference. N = 19.
Therkelsen et al.468
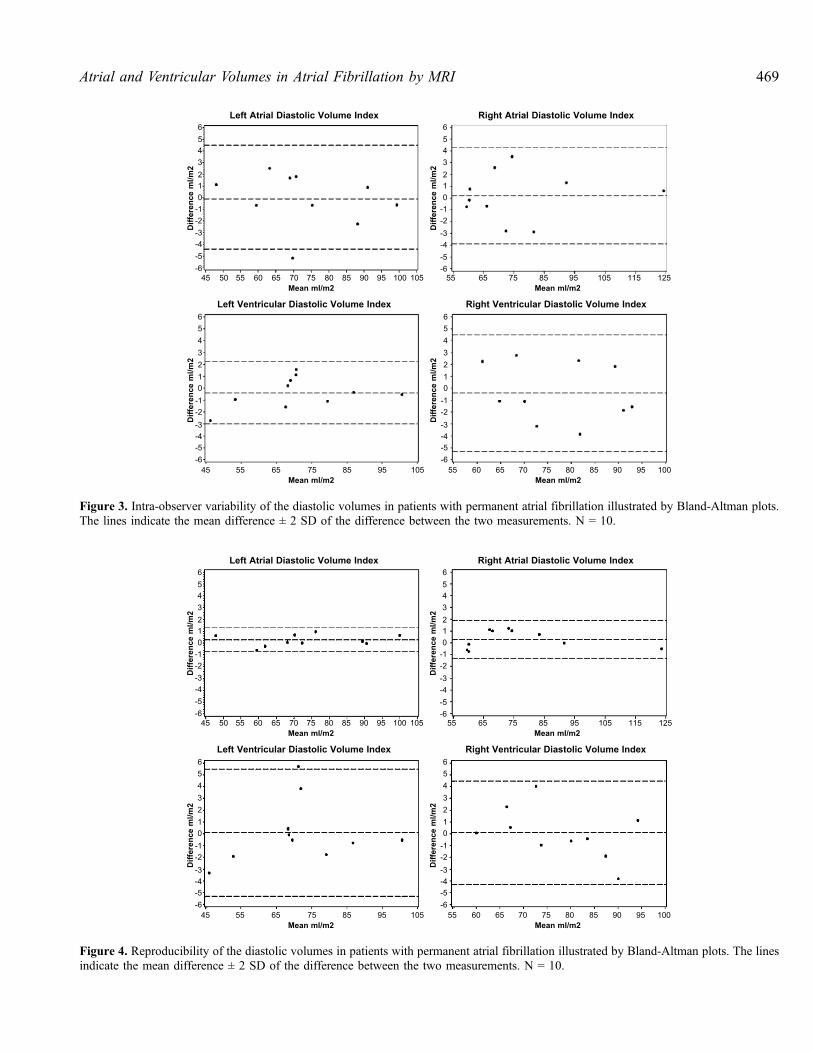
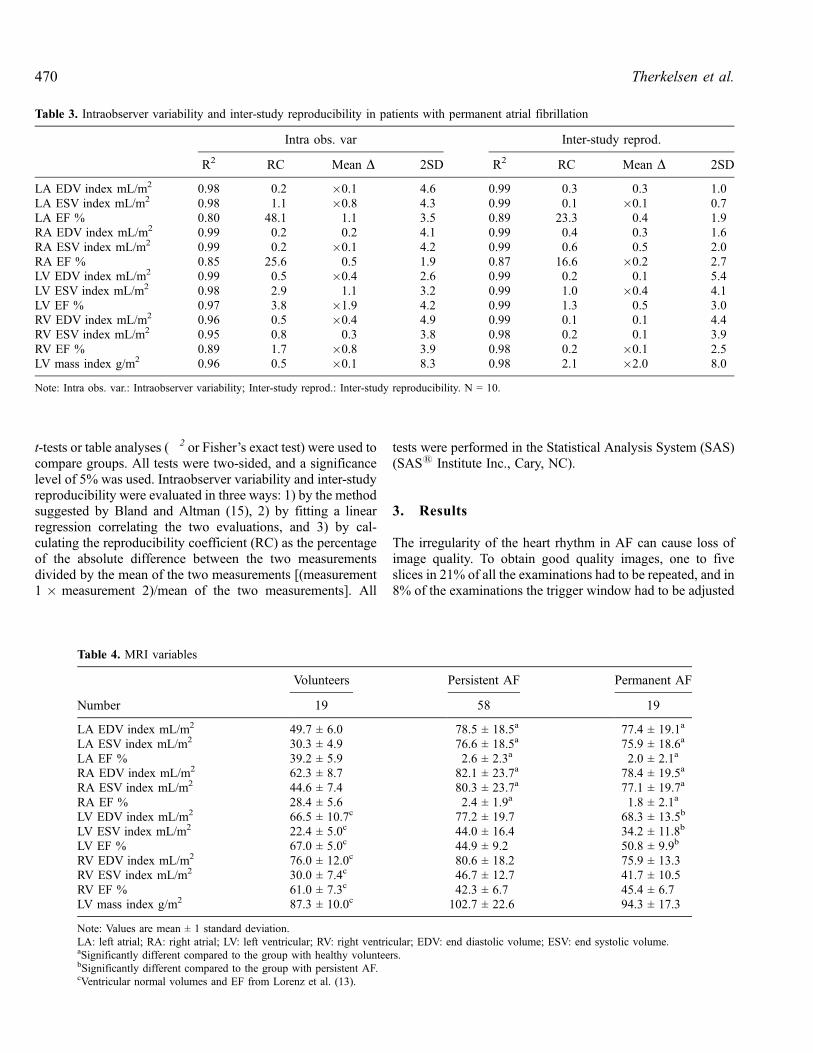
Figure 4. Reproducibility of the diastolic volumes in patients with permanent atrial fibrillation illustrated by Bland-Altman plots. The linesindicate the mean difference ± 2 SD of the difference between the two measurements. N = 10.
Figure 3. Intra-observer variability of the diastolic volumes in patients with permanent atrial fibrillation illustrated by Bland-Altman plots.The lines indicate the mean difference ± 2 SD of the difference between the two measurements. N = 10.
469Atrial and Ventricular Volumes in Atrial Fibrillation by MRI
t-tests or table analyses (�2 or Fisher’s exact test) were used tocompare groups. All tests were two-sided, and a significancelevel of 5% was used. Intraobserver variability and inter-studyreproducibility were evaluated in three ways: 1) by the methodsuggested by Bland and Altman (15), 2) by fitting a linearregression correlating the two evaluations, and 3) by cal-culating the reproducibility coefficient (RC) as the percentageof the absolute difference between the two measurementsdivided by the mean of the two measurements [(measurement1 � measurement 2)/mean of the two measurements]. All
tests were performed in the Statistical Analysis System (SAS)(SAS1 Institute Inc., Cary, NC).
3. Results
The irregularity of the heart rhythm in AF can cause loss ofimage quality. To obtain good quality images, one to fiveslices in 21% of all the examinations had to be repeated, and in8% of the examinations the trigger window had to be adjusted
Table 4. MRI variables
Volunteers Persistent AF Permanent AF
Number 19 58 19
LA EDV index mL/m2 49.7 ± 6.0 78.5 ± 18.5a 77.4 ± 19.1a
LA ESV index mL/m2 30.3 ± 4.9 76.6 ± 18.5a 75.9 ± 18.6a
LA EF % 39.2 ± 5.9 2.6 ± 2.3a 2.0 ± 2.1a
RA EDV index mL/m2 62.3 ± 8.7 82.1 ± 23.7a 78.4 ± 19.5a
RA ESV index mL/m2 44.6 ± 7.4 80.3 ± 23.7a 77.1 ± 19.7a
RA EF % 28.4 ± 5.6 2.4 ± 1.9a 1.8 ± 2.1a
LV EDV index mL/m2 66.5 ± 10.7c 77.2 ± 19.7 68.3 ± 13.5b
LV ESV index mL/m2 22.4 ± 5.0c 44.0 ± 16.4 34.2 ± 11.8b
LV EF % 67.0 ± 5.0c 44.9 ± 9.2 50.8 ± 9.9b
RV EDV index mL/m2 76.0 ± 12.0c 80.6 ± 18.2 75.9 ± 13.3RV ESV index mL/m2 30.0 ± 7.4c 46.7 ± 12.7 41.7 ± 10.5RV EF % 61.0 ± 7.3c 42.3 ± 6.7 45.4 ± 6.7LV mass index g/m2 87.3 ± 10.0c 102.7 ± 22.6 94.3 ± 17.3
Note: Values are mean ± 1 standard deviation.
LA: left atrial; RA: right atrial; LV: left ventricular; RV: right ventricular; EDV: end diastolic volume; ESV: end systolic volume.aSignificantly different compared to the group with healthy volunteers.bSignificantly different compared to the group with persistent AF.cVentricular normal volumes and EF from Lorenz et al. (13).
Table 3. Intraobserver variability and inter-study reproducibility in patients with permanent atrial fibrillation
Intra obs. var Inter-study reprod.
R2 RC Mean D 2SD R2 RC Mean D 2SD
LA EDV index mL/m2 0.98 0.2 �0.1 4.6 0.99 0.3 0.3 1.0LA ESV index mL/m2 0.98 1.1 �0.8 4.3 0.99 0.1 �0.1 0.7LA EF % 0.80 48.1 1.1 3.5 0.89 23.3 0.4 1.9RA EDV index mL/m2 0.99 0.2 0.2 4.1 0.99 0.4 0.3 1.6RA ESV index mL/m2 0.99 0.2 �0.1 4.2 0.99 0.6 0.5 2.0RA EF % 0.85 25.6 0.5 1.9 0.87 16.6 �0.2 2.7LV EDV index mL/m2 0.99 0.5 �0.4 2.6 0.99 0.2 0.1 5.4LV ESV index mL/m2 0.98 2.9 1.1 3.2 0.99 1.0 �0.4 4.1LV EF % 0.97 3.8 �1.9 4.2 0.99 1.3 0.5 3.0RV EDV index mL/m2 0.96 0.5 �0.4 4.9 0.99 0.1 0.1 4.4RV ESV index mL/m2 0.95 0.8 0.3 3.8 0.98 0.2 0.1 3.9RV EF % 0.89 1.7 �0.8 3.9 0.98 0.2 �0.1 2.5LV mass index g/m2 0.96 0.5 �0.1 8.3 0.98 2.1 �2.0 8.0
Note: Intra obs. var.: Intraobserver variability; Inter-study reprod.: Inter-study reproducibility. N = 10.
Therkelsen et al.470
during the MRI scan. However, diagnostic quality data setswere obtained in all subjects. Figure 1 shows an example ofsome of the slices covering both atria in atrial diastole in thevertical long axis in a patient with atrial fibrillation.
Patients with AF were 9–11 years older than the healthyvolunteers and had slightly higher blood pressure and heartrate during the MRI scan. Patients with permanent AF had ahistory of significantly longer duration of AF (1154 vs. 146days), received significantly less sotalol and propafenone, andmore digoxin than the patients with persistent AF. Otherwise,the groups were comparable (Table 1).
The intraobserver variability for atrial measurements inhealthy volunteers is presented in Fig. 2 and Table 2. Theintraobserver variability and inter-study reproducibility of theatrial and ventricular measurements for the patients withpermanent AF are given in Fig. 3 and Fig. 4, respectively, andin Table 3. The agreement between the two evaluations in thehealthy volunteers and in patients with AF and between thetwo MRI scans in patients with permanent AF was very goodfor all variables. Bland-Altman plots are shown for selectedatrial and ventricular volume measurements (Figs. 2–4).
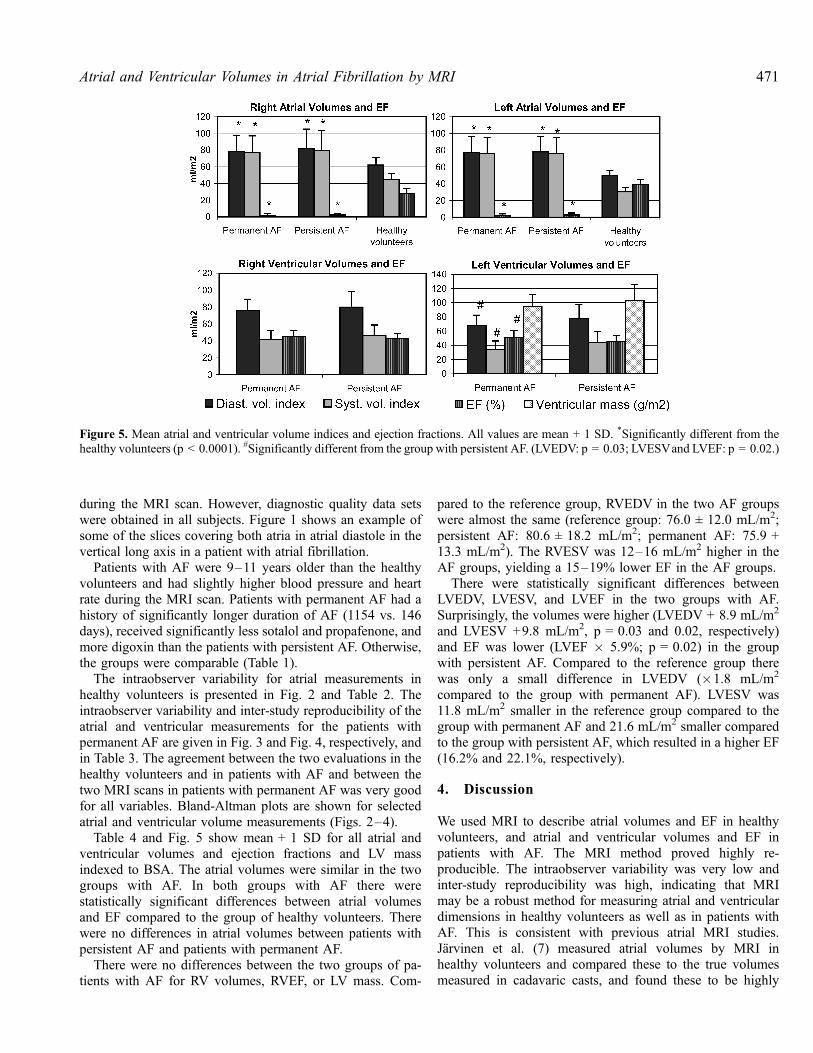
Table 4 and Fig. 5 show mean + 1 SD for all atrial andventricular volumes and ejection fractions and LV massindexed to BSA. The atrial volumes were similar in the twogroups with AF. In both groups with AF there werestatistically significant differences between atrial volumesand EF compared to the group of healthy volunteers. Therewere no differences in atrial volumes between patients withpersistent AF and patients with permanent AF.
There were no differences between the two groups of pa-tients with AF for RV volumes, RVEF, or LV mass. Com-
pared to the reference group, RVEDV in the two AF groupswere almost the same (reference group: 76.0 ± 12.0 mL/m2;persistent AF: 80.6 ± 18.2 mL/m2; permanent AF: 75.9 +13.3 mL/m2). The RVESV was 12–16 mL/m2 higher in theAF groups, yielding a 15–19% lower EF in the AF groups.
There were statistically significant differences betweenLVEDV, LVESV, and LVEF in the two groups with AF.Surprisingly, the volumes were higher (LVEDV + 8.9 mL/m2
and LVESV +9.8 mL/m2, p = 0.03 and 0.02, respectively)and EF was lower (LVEF � 5.9%; p = 0.02) in the groupwith persistent AF. Compared to the reference group therewas only a small difference in LVEDV (�1.8 mL/m2
compared to the group with permanent AF). LVESV was11.8 mL/m2 smaller in the reference group compared to thegroup with permanent AF and 21.6 mL/m2 smaller comparedto the group with persistent AF, which resulted in a higher EF(16.2% and 22.1%, respectively).
4. Discussion
We used MRI to describe atrial volumes and EF in healthyvolunteers, and atrial and ventricular volumes and EF inpatients with AF. The MRI method proved highly re-producible. The intraobserver variability was very low andinter-study reproducibility was high, indicating that MRImay be a robust method for measuring atrial and ventriculardimensions in healthy volunteers as well as in patients withAF. This is consistent with previous atrial MRI studies.Jarvinen et al. (7) measured atrial volumes by MRI inhealthy volunteers and compared these to the true volumesmeasured in cadavaric casts, and found these to be highly
Figure 5. Mean atrial and ventricular volume indices and ejection fractions. All values are mean + 1 SD. *Significantly different from thehealthy volunteers (p < 0.0001). #Significantly different from the group with persistent AF. (LVEDV: p = 0.03; LVESVand LVEF: p = 0.02.)
471Atrial and Ventricular Volumes in Atrial Fibrillation by MRI
comparable. Ishimoto, Ito, and Kinoshita (8) used MRIto examine patients with paroxysmal AF, while in sinusrhythm. They found no difference in atrial volumes be-tween patients with paroxysmal AF and healthy volunteers.Hauser et al. (16) measured the LA with MRI in patientsbefore ablation for AF, again the patients were in sinusrhythm at the time of the MRI scan. Other studies haveexamined atrial dimensions with MRI in healthy volunteers(17, 18) in cardiac diseases, e.g., myocardial infarction (19)and in hypertension (20).
MRI is currently considered to be the gold standard forcardiac ventricular imaging in patients without AF. A majordifficulty in evaluating the LV with echocardiography in AFis that the irregular rhythm makes the contraction heteroge-neous, and it is often necessary to average measurements overseveral heart beats. MRI inherently compensates for anirregular heart rhythm since each image slice is acquired over15 heartbeats. This corresponds well with the findings ofHundley et al. (9), who found that MRI of the LV in AF ispossible and comparable to invasive methods (ven-triculography), when measuring volumes and EF. RV vol-umes and EF in AF have not been described with MRI before.
It is well known from previous echocardiographic studiesthat both atria dilate during AF. Our results indicate that theatrial dilatation appears within the first months of AF andstays unchanged afterwards. However, further studies withserial measurements are needed before any final conclusionscan be drawn. The LV responded differently to the presence ofAF. Patients with permanent AF had smaller ventricularvolumes and higher EF than patients with persistent AF,although only statistically significant for the left ventricularmeasurements, indicating that the LV may dilate early as aresponse to AF, but later appears to adapt. LVEDV was veryclose to normal in permanent AF, and significantly smallerthan in patients with persistent AF. Again, serial measure-ments are needed before definitive conclusions can be drawn.
One could speculate that the differences between the twogroups of patients with AF were attributable to differences inmedication. Beta blockers are known to improve LV functionin patients with heart failure, and might have the same effectin patients with AF. However, patients with permanent AFreceived significantly less beta blockade than patients withpersistent AF, making the degree of beta blockade an unlikelyexplanation for our findings.
Patients with permanent AF received significantly moredigoxin than patients with persistent AF. Dernellis andPanaretou (21) showed that digoxin significantly decreasesboth LA and LV volume and increases LA and LV functionevaluated by echocardiography in patients with heart failureas well as in healthy volunteers. We did not see this proposeddigoxin effect on atrial volumes, but it remains a poten-tial contributory explanation for the observed differences inLV measurements.
In recent years, large studies (22, 23) of different treatmentstrategies for patients with AF have been published. They
have shown that mortality and quality of life are similar inpatients where achieving sinus rhythm is attempted comparedto patients where AF is accepted. The finding that the LVvolumes and systolic function normalize over time in patientswith long-term AF could be part of the explanation for theseclinical findings.
5. Limitations
It is known that the turbo gradient echo sequence used in ourstudy underestimates ventricular volumes compared tosteady-state free precession sequences (SSFP) (24). It isunknown whether the use of SSFP sequences would have aninfluence on atrial volume measurements. Consequently,caution is required when comparing the volumes reported inour study to volumes obtained with SSFP sequences.
We used prospective gating in this study due to limitationsof the MRI scanner. Retrospective gating might have alloweda more accurate determination of atrial end-systole.
We did not test for inter-observer variability.
6. Conclusions
MRI is a highly reproducible method for measurement ofatrial and ventricular dimensions in healthy volunteers and inpatients with atrial fibrillation.
In our study, patients with persistent AF had similar atrialvolumes compared to patients with permanent AF, suggestingthat atrial dilatation appears within the first months of AF andstays more or less unchanged thereafter. Our study shows thatpatients with persistent AF have dilated left ventricles andlower EF compared to patients with permanent AF, suggest-ing that the LV dilates early as a response to AF, but laterappears to adapt.
Acknowledgments
We are grateful to Sussi Larsen and the other operators at theDept. of MRI at Copenhagen University Hosptial Hvidovrefor their assistance with the MRI scans. Grants were receivedfrom The Foundation of 17.12. 1981, The A.P. MøllerFoundation for the Advancement of Medical Science, DanishHospital Foundation for Medical Research, Region ofCopenhagen, The Faroe Islands and Greenland, The DanishHeart Foundation, and Copenhagen Hospital Corporation.
References
1. Fuster V, Ryden LE, Asinger RW, Cannom DS, Crijns HJ, Frye RL,
Halperin JL, Kay GN, Klein WW, Levy S, McNamara RL,
Therkelsen et al.472
Prystowsky EN, Wann LS, Wyse DG, Gibbons RJ, Antman EM,
Alpert JS, Faxon DP, Gregoratos G, Hiratzka LF, Jacobs AK, Russell
RO, Smith SC Jr, Klein WW, Alonzo-Garcia A, Blomstrom-
Lundqvist C, de Backer G, Flather M, Hradec J, Oto A,
Parkhomenko A, Silben S, Torbicki A. ACC/AHA/ESC guidelines
for the management of patients with atrial fibrillation: executive
summary: a report of the American college of cardiology/American
heart association task force on practice guidelines and the European
society of cardiology committee for practice guidelines and policy
conferences (committee to develop guidelines for the management of
patients with atrial fibrillation) developed in collaboration with the
North American society of pacing and electrophysiology. J Am Coll
Cardiol 2001; 38:1231–1265.
2. Friberg J, Scharling H, Gadsboll N, Jensen GB. Sex-specific increase
in the prevalence of atrial fibrillation (the Copenhagen city heart
study). Am J Cardiol 2003; 92:1419–1423.
3. Benjamin EJ, D’Agostino RB, Belanger AJ, Wolf PA, Levy D. Left
atrial size and the risk of stroke and death. The framingham heart
study. Circulation 1995; 92:835–841.
4. Di Tullio MR, Sacco RL, Sciacca RR, Homma S. Left atrial size and
the risk of ischemic stroke in an ethnically mixed population. Stroke
1999; 30:2019–2024.
5. Modena MG, Muia N, Sgura FA, Molinari R, Castella A, Rossi R. Left
atrial size is the major predictor of cardiac death and overall clinical
outcome in patients with dilated cardiomyopathy: a long-term follow-
up study. Clin Cardiol 1997; 20:553–560.
6. Vaziri SM, Larson MG, Benjamin EJ, Levy D. Echocardiographic
predictors of nonrheumatic atrial fibrillation. The framingham heart
study. Circulation 1994; 89:724–730.
7. Jarvinen V. Assessment of Left and Right Atrial Function and
Transmitral Flow Profiles By Magnetic Resonance Imaging. Thesisbased on five publications: Finland, 1996.
8. Ishimoto N, Ito M, Kinoshita M. Signal-averaged P-wave abnormal-
ities and atrial size in patients with and without idiopathic paroxysmal
atrial fibrillation. Am Heart J 2000; 139:684–689.
9. Hundley WG, Meshack BM, Willett DL, Sayad DE, Lange RA,
Willard JE, Landau C, Hillis LD, Peshock RM. Comparison of
quantitation of left ventricular volume, ejection fraction, and cardiac
output in patients with atrial fibrillation by cine magnetic resonance
imaging versus invasive measurements. Am J Cardiol 1996; 78:1119–
1123.
10. Rodevand O, Bjornerheim R, Ljosland M, Maehle J, Smith HJ, Ihlen
H. Left atrial volumes assessed by three-and two-dimensional
echocardiography compared to MRI estimates. Int J Card Imaging
1999; 15:397–410.
11. Egeblad H. Ekkokardiografi. 1st ed. Copenhagen: Lægeforeningensforlag, 2001.
12. Pennell DJ. Ventricular volume and mass by CMR. J Cardiovasc Magn
Reson 2002; 4:507–513.
13. Lorenz CH, Walker ES, Morgan VL, Klein SS, Graham TP Jr. Normal
human right and left ventricular mass, systolic function, and gender
differences by cine magnetic resonance imaging. J Cardiovasc Magn
Reson 1999; 1:7–21.
14. Guyton AC. Textbook of Medical Physiology. 7th ed. Philadelphia:Saunders, 1986.
15. Martin Bland J, Altman D. Statistical methods for assessing agreement
between two methods of clinical measurement. The Lancet 1986;
327:307–310.
16. Hauser TH, McClennen S, Katsimaglis G, Josephson ME, Manning
WJ, Yeon SB. Assessment of left atrial volume by contrast enhanced
magnetic resonance angiography. J Cardiovasc Magn Reson 2004;
6:491–497.
17. Tseng WY, Liao TY, Wang JL. Normal systolic and diastolic functions
of the left ventricle and left atrium by cine magnetic resonance im-
aging. J Cardiovasc Magn Reson 2002; 4:443–457.
18. Keller AM, Gopal AS, King DL. Left and right atrial volume by
freehand three-dimensional echocardiography: in vivo validation using
magnetic resonance imaging. Eur J Echocardiog 2000; 1:55–65.
19. Mohiaddin RH, Hasegawa M. Measurement of atrial volumes by
magnetic resonance imaging in healthy volunteers and in patients with
myocardial infarction. Eur Heart J 1995; 16:106–111.
20. Mineoi K, Shigematsu Y, Ochi T, Hiwada K. Left ventricular mass and
atrial volume determined by cine magnetic resonance imaging in
essential hypertension. Am J Hypertens 2000; 13:1103–1109.
21. Dernellis JM, Panaretou MP. Effects of digoxin on left atrial function
in heart failure. Heart 2003; 89:1308–1315.
22. The Atrial Fibrillation Follow-up Investigation of Rhythm Manage-
ment (AFFIRM) Investigators. A comparison of rate control and
rhythm control in patients with atrial fibrillation. N Engl J Med 2002;
347:1825–1833.
23. Van Gelder IC, Hagens VE, Bosker HA, Kingma JH, Kamp O,
Kingma T, Said SA, Darmanata JI, Timmermans AJM, Tijssen JGP,
Crijns HJGM, The Rate Control versus Electrical Cardioversion for
Persistent Atrial Fibrillation Study Group. A comparison of rate
control and rhythm control in patients with recurrent persistent atrial
fibrillation. N Engl J Med 2002; 347:1834–1840.
24. Alfakih K, Plein S, Thiele H, Jones T, Ridgway JP, Sivananthan MU.
Normal human left and right ventricular dimensions for MRI as
assessed by turbo gradient echo and steady-state free precession
imaging sequences. J Magn Reson Imaging 2003; 17:323–329.
473Atrial and Ventricular Volumes in Atrial Fibrillation by MRI