Embed Size (px)
Citation preview

smedical
Issue no. 1.2003 MAGNETOMF L A S H
MAGNETOM World MeetingSheraton Perdana HotelLangkawi, Malaysia17-18 Jan 2003
Topic PageEDITORIAL
Seeing is Believing: Phoenix Protocol Exchange Platform and Virtual Siemens MR Booths at the RSNA 2002 & ECR 2003 4
PHOENIX
MAGNETOM WorldPhoenix Quick Guide 6
MAGNETOM WORLD MEETINGSheraton Perdana Hotel Langkawi, Malaysia, 17-18 Jan 2003 10
OPEN SYSTEM
Cervical Spine Examination with MAGNETOM Concerto 14
ULTRA HIGH-FIELD
MRI of the Knee Joint:Comparing Sequences at 3 T and 1.5 T 16
High Field Brain Imaging: Clinical Implications 20
PEDIATRIC IMAGING
MT Tissue Contrast Effect and its Role in Pediatric MR Imaging 24
Pediatric MR Workshop 28
MRI and US in Diagnosis of Facial Angiodysplasia in Children 36
Fetal MR Imaging 44
MUSCULOSKELETAL
Magnetic Resonance Imaging of the Elbow 48
Topic Page
The information presented in MAGNETOM® Flash is for illustration only and is not intended to be relied upon by thereader for instruction as to the practice of medicine. Any health care practitioner reading this information is remindedthat they must use their own learning, training and expertise in dealing with their individual patients. This materialdoes not substitute for that duty and is not intended by Siemens Medical Solutions, Inc. to be used for any purpose inthat regard.
2
MAGNETOM FLASH
Content
3www.SiemensMedical.com/MAGNETOM-World
GASTROINTESTINAL IMAGING
MR Enteroclysis: a New Diagnostic Approach for Small Bowel Imaging 54
TECHNOLOGY CORNER
All You Want to Know About “HASTE” 62
MRI SAFETY
Medical Devices and Accessories Developed for Use in the MR Environment and Interventional MRI Procedures 68
Accessories and Supplies from Siemens 72
WOMEN’S HEALTH
Contrast-Enhanced 3–Dimensional Dynamic Breast MR: Monitoring of Neoadjuvant Chemotherapy 74
Thin-MIP Evaluation 3D Mammographic Imaging 80
NEURO IMAGING
Case Report: Stroke Diagnosis with MR 84
CARDIO VASCULAR
Dream Machines and Getaway Speed… 86
MRI Flow Quantification Techniques 90
Application TipBasic Cardiac Positioning and Terminology 102
Upper Extremity CE MRA with CARE-BOLUS Using syngo 2002B 106
FAQs Cardiac Imaging 109
Peripheral MRA with iPAT 116
EVENTS
MAGNETOM World Summit 122
TECHNOLOGY CORNER
20 Years of Development and a Constantly Improving Performance = MAGNETOM 124
“Protocol exchange through images on the internet, the exactexamination parameters from the images on www.SiemensMedical.com/MAGNETOM-World directly to the MAGNETOM and voila! your scanner is replicating what ascanner in Massachusetts General Hospital or New York University (NYU) is doing, or a scanner in the University ofWuerzburg or anywhere else...”
Nobody believed us when we said these ambitions wouldbecome a reality at RSNA in 2002. We were looked at as thoughwe were giving away the plot of the latest Star Trek film, so far-reaching were our aims.
In 2002, we at MR were proud to reveal Phoenix, simply theeasiest protocol exchange method ever. Phoenix allows you toclick on an image, drag it into the measurement queue and instantly duplicate the exact protocol-TR, TE, bandwidth,number of slices, echo spacing, etc. Phoenix extracts thesevalues from the DICOM header and you are ready to scan. If your system has a different gradient strength configurationfrom the source image, Phoenix “adapts” the protocol in lessthan 30 seconds. To convert images, simply press the shift keywhile dragging the image into the queue.
The queue of MR users by the internet demonstration console at the Siemens MR Booth waited patiently but full of anticipationto see and believe what, to our competitors, remains in therealms of science fiction. We have created a virtual RSNA andECR MR booth on our community web page www.SiemensMedical.com/MAGNETOM-World containing the panels from the RSNA and ECR, the images with Phoenixfunctionality (syngo MR 2002B ) from the booths and thepresentations. Our advice is: You do not have to leave thecomfort of your home to see the MR show in the congresses.Simply log on to our web page and see the results in a fascina-ting and simple virtual booth full of images containing thePhoenix icon. These are downloadable with parameters by justclicking on the images. We don't believe we could have made it easier.
4
MAGNETOM FLASH
Editorial
Seeing is Believing: Phoenix Protocol Exchange Platformand Virtual Siemens MR Booths at the RSNA 2002 & ECR 2003
Marion Hellinger, MTRAMR Marketing-Application Training,Erlangen
Milind Dhamankar, M.D.MR Marketing-Applications, Erlangen
Dagmar Thomsik-Schröpfer, Ph.D.MR Marketing-Products,Erlangen
Peter Kreisler, Ph.D. Collaborations &Applications, Erlangen
Charlie Collins, B.S.R.T. Market Manager (USA),Erlangen
Gary R. McNeal, MS(BME) Advanced Application SpecialistCardiovascular MR ImagingSiemens Medical Solutions USA
Laurie Fisher, B.S.R.T., R, MR US Installed Base Manager,Malvern, PA
David Thomasson Ph.D.US R&D CollaborationsMalvern, PA
Michael Wendt, Ph.D. US R&D Collaborations,Malvern, PA
Helmuth Schultze-Haakh,Ph.D.US R&D Collaborations,Malvern, PA
Judy Behrens, R.T. (MR) (CT)Adv. Clinical ApplicationsSpecialist
Raya DubnerDesign Editor, Malvern, PA
Achim RiedlTechnical Support,Erlangen
Tony Enright, Ph.D. Asia Pacific Collaboration,Australia
Enjoy this issue of Flash.
A. Nejat Bengi, M.D.Editor in Chief
5www.SiemensMedical.com/MAGNETOM-World
Our virtual booth was not the only focus of attention:our community web page also attracted much attention as asource of state-of-the-art clinical applications’ and new technicaldevelopments’ demonstration platform. The technology cornerdemonstrated the latest technical steps taken by MR: Maestro Class, iPAT, TrueFISP lung imaging, viability imaging andmore.
Case reports are available from reference sites all around theworld: VIBE MR Cholangiography from NYU, diffusion tensorimaging from Brisbane…
Application tips will help you in your routine practice: Cardiac perfusion imaging from Royal Brompton, MR Angio-graphy from Essen....
Clinical methods help you understand the new techniquesbeing developed and used by other clinics : Imaging AcuteIschemia from MGH, MR demonstration of thoracic central veinsfrom Auckland.
Clinical protocols will help you improve your exam quality tothe levels of internationally renowned clinics: Renal Mass protocol from NYU, MRCP with contrast from NYU…
The future will bring our customers the complete protocol treesfrom different reference sites for different anatomical examina-tions, together with the opportunity to download them all withone click. The future will bring out Phoenix books on Neuro MRand Orthopedics MR where you can read text books and applythe techniques referred to with one simple click on the images.The future will bring case reports, application tips, clinicalmethods with the Phoenix option which allows you to downloadimages which you believe offer solutions to your immediatequestions.
Our competitors may think of Phoenix books, Phoenix protocoltrees and Phoenix application tips as pure science fiction.However, we at MAGNETOM world know, and our customersknow, that we do not deal in fiction. We deal in fact, pure andsimple. Seeing is believing.
Editorial Team
We thank Harald Werner, Lawrence Tallentire andIman Staab for their editorial help.
Phoenix is a unique syngo-tool thatallows you to click on an image, dragit into the measurement queue, and instantly duplicate the extractedprotocol – TR, TE, bandwidth, numberof slices, echo spacing, etc..
The Phoenix Quick Guide gives a step-by-step description of how toextract sequence protocol data fromDICOM images worldwide via net-work, CD, or Internet using Phoenix.
The Quick Guide is also included in the Phoenix CD attached to thisMAGNETOM Flash issue.
All images acquired with softwaresyngo MR 2002B and all subsequentversions can be utilized to exchangeparameter from clinical imagesamongst different MAGNETOMusers. On the MAGNETOM Worldpage in the internet the Phoenix logoindicates those images that aresuitable for downloading on a PC.After transferring them to a CD theseimages can be used directly on yourMAGNETOM scanner. We invite youto visit our MAGNETOM World. Go to www.SiemensMedical.com/MAGNETOM-World and downloadinteresting clinical images fromhospitals all over the world.
6
MAGNETOM FLASH
MAGNETOM WorldPhoenix Quick GuideMarion Hellinger, MTRA
MR Marketing-Application Training, Erlangen
For additional copies of this CD, visit our web-site atwww.siemensmedical.com/MAGNETOM-World.
Please click on „Contact“ on the right upper side ofthe page, give your name/address and the numberof copies that you would like to receive. The CDs
will be sent to you as soon as possible.
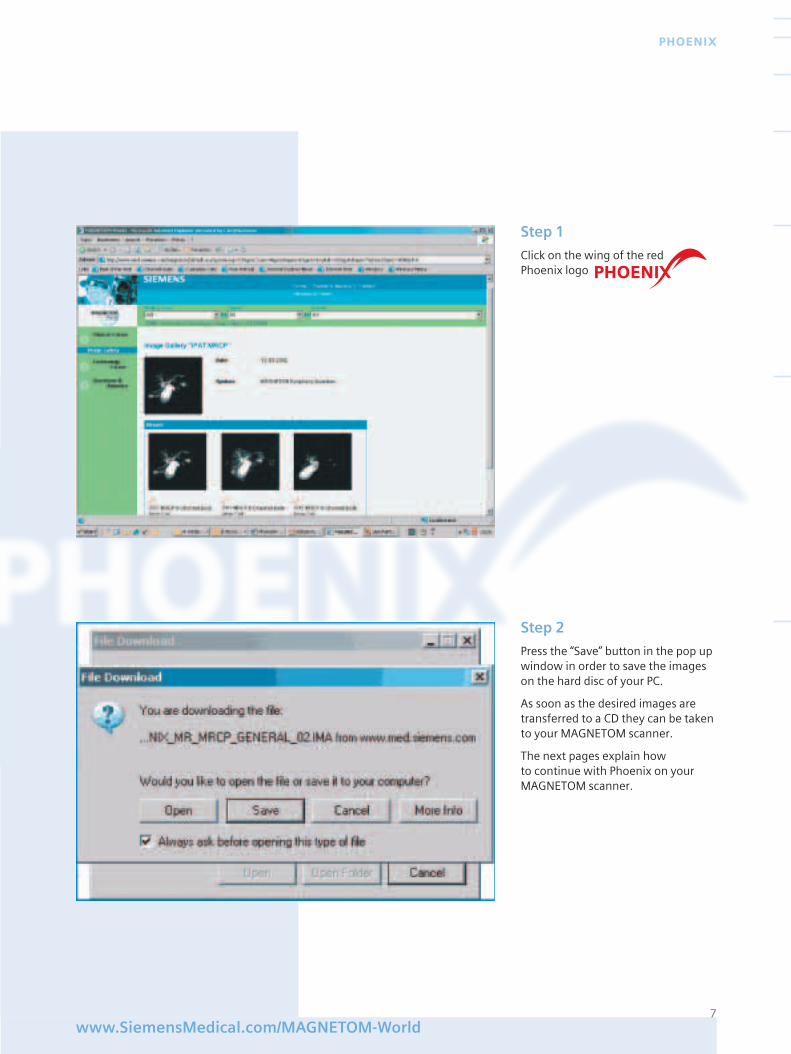
Step 1
Click on the wing of the red Phoenix logo
7www.SiemensMedical.com/MAGNETOM-World
PHOENIX
Step 2
Press the “Save” button in the pop upwindow in order to save the imageson the hard disc of your PC.
As soon as the desired images aretransferred to a CD they can be takento your MAGNETOM scanner.
The next pages explain how to continue with Phoenix on yourMAGNETOM scanner.
8
MAGNETOM FLASH
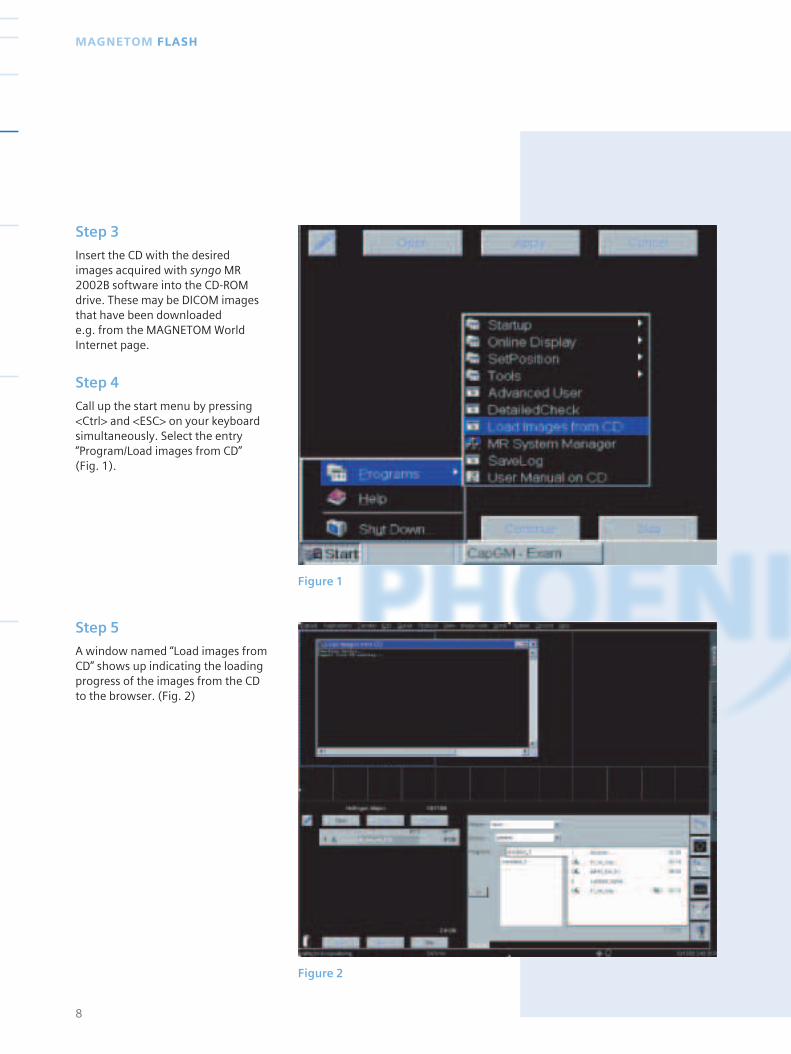
Step 4
Call up the start menu by pressing<Ctrl> and <ESC> on your keyboardsimultaneously. Select the entry“Program/Load images from CD” (Fig. 1).
Step 5
A window named “Load images fromCD” shows up indicating the loadingprogress of the images from the CDto the browser. (Fig. 2)
Step 3
Insert the CD with the desired images acquired with syngo MR2002B software into the CD-ROMdrive. These may be DICOM imagesthat have been downloaded e.g. from the MAGNETOM World Internet page.
Figure 1
Figure 2
9www.SiemensMedical.com/MAGNETOM-World
PHOENIX
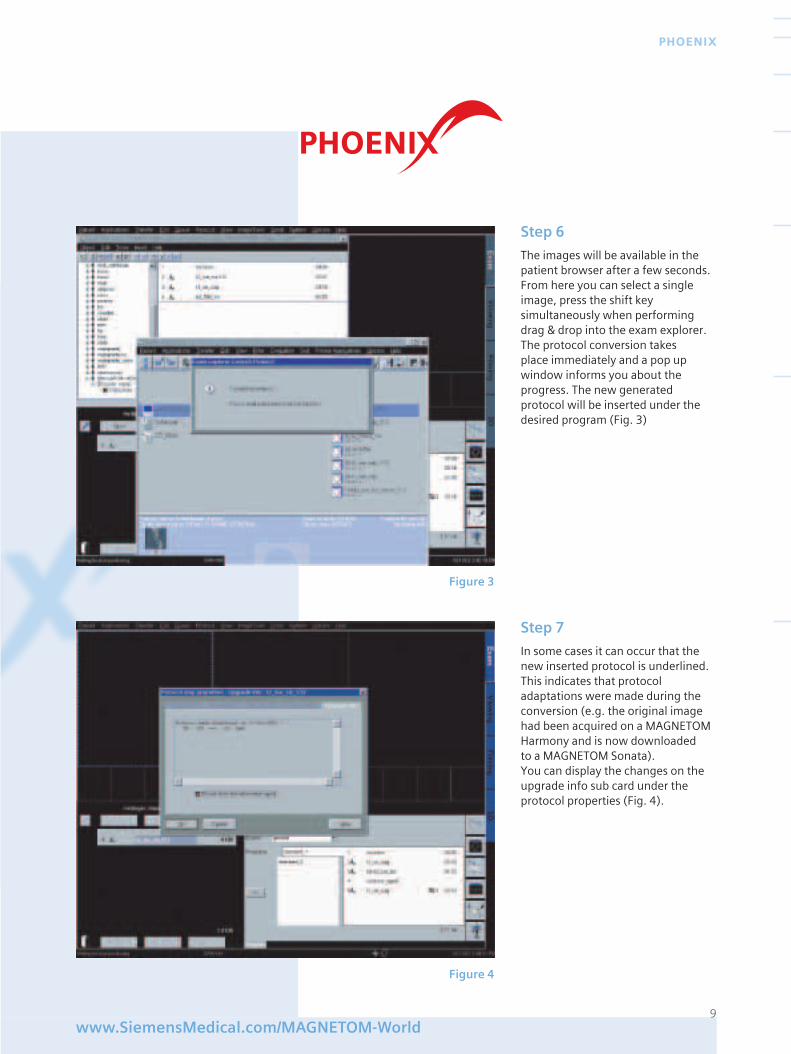
Figure 3
Figure 4
Step 6
The images will be available in thepatient browser after a few seconds.From here you can select a singleimage, press the shift key simultaneously when performingdrag & drop into the exam explorer.The protocol conversion takesplace immediately and a pop upwindow informs you about theprogress. The new generatedprotocol will be inserted under thedesired program (Fig. 3)
Step 7
In some cases it can occur that thenew inserted protocol is underlined.This indicates that protocoladaptations were made during theconversion (e.g. the original imagehad been acquired on a MAGNETOMHarmony and is now downloaded to a MAGNETOM Sonata).You can display the changes on theupgrade info sub card under theprotocol properties (Fig. 4).
The aim was to demonstrate the MAGNETOM Concerto’s range ofclinical applications and imagequality. There were two guest spea-kers, Dr. Craig Platenberg, MedTelInternational, USA and Dr. KennethTan, Cardinal Santos Medical Centre,Philippines.
Dr. Platenberg gave two presen-tations, one focusing on the clinicaloutcomes of low field MR and theother on the business model of hiscorporation.
Dr. Tan also presented low fieldclinical outcomes and also a compa-rison between 1.5T and Concertoimage quality and clinical results.
Both speakers were extremely wellreceived by the audience, whichconsisted of radiologists, administra-tors, Siemens sales staff and Siemens
dealers, representing eight countries.Of particular interest was the diver-sity of applications and the extremelyhigh image quality.
Shaun Seery also gave a presentationon marketing concepts and howmarketing could be used to streng-then a business model. This wasgreeted with enthusiasm by theattendees.
The event concluded with a “jungleparty”, including a barbeque andnative Malaysian dancing (support by some of the attendees), conduc-ted in a true tropical rainforest withinwalking distance of the hotel.
All attendees gave the overall event a big “thumbs up” and look forwardto future events to stimulate infor-mation exchange.
10
MAGNETOM FLASH
MAGNETOM World MeetingASEAN, Malaysia, 17-18 Jan 2003
The ASEAN region covers countrieslike Indonesia, Malaysia, Philipines,Singapore, Thailand and Vietnam.We recognize a growing interest in1.5T as well as in low field systems inthis area. Our Asian business centreis located in Singapore. MarivicSantos (ASEAN MR Modality Mana-ger) and Shaun Seery (GeneralManager MR Asia Pacific) organizedthe event over two days on theMalaysian Island resort of Langkawi.
MAGNETOM World Meetingin ASEAN

11
MAGNETOM WORLD SUMMIT MALAYSIA
www.SiemensMedical.com/MAGNETOM-World

12
MAGNETOM FLASH
13www.SiemensMedical.com/MAGNETOM-World
MAGNETOM WORLD SUMMIT MALAYSIA
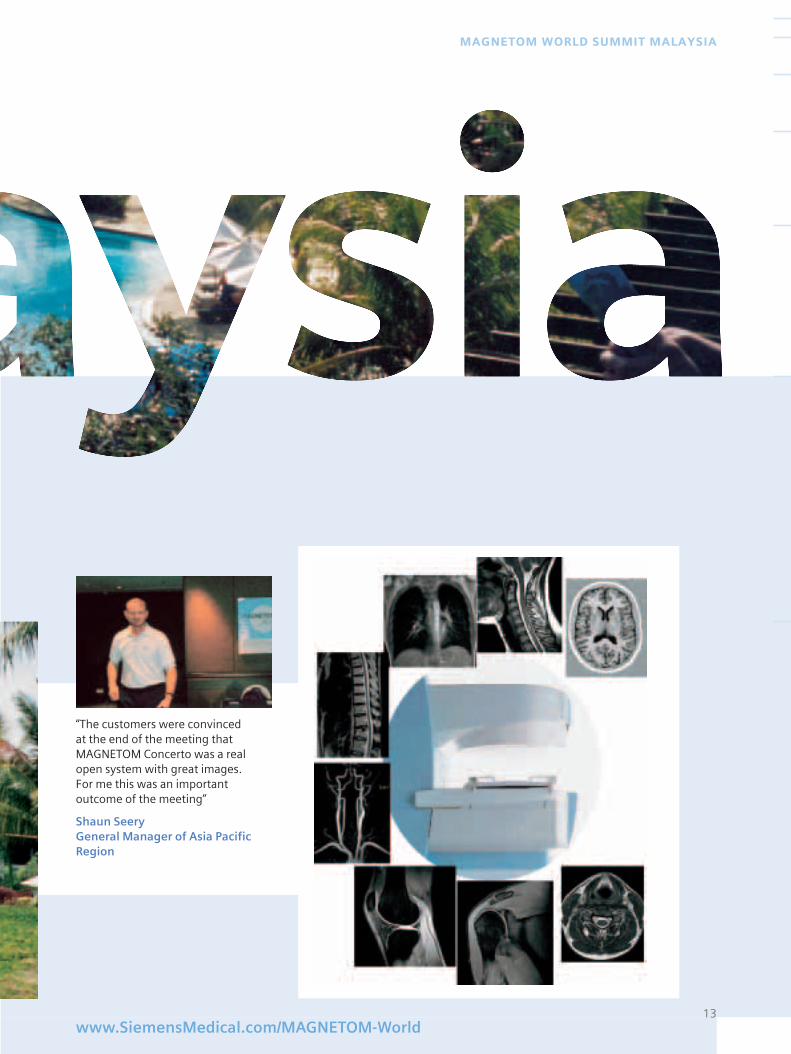
“The customers were convinced at the end of the meeting thatMAGNETOM Concerto was a realopen system with great images. For me this was an important outcome of the meeting”
Shaun Seery General Manager of Asia PacificRegion
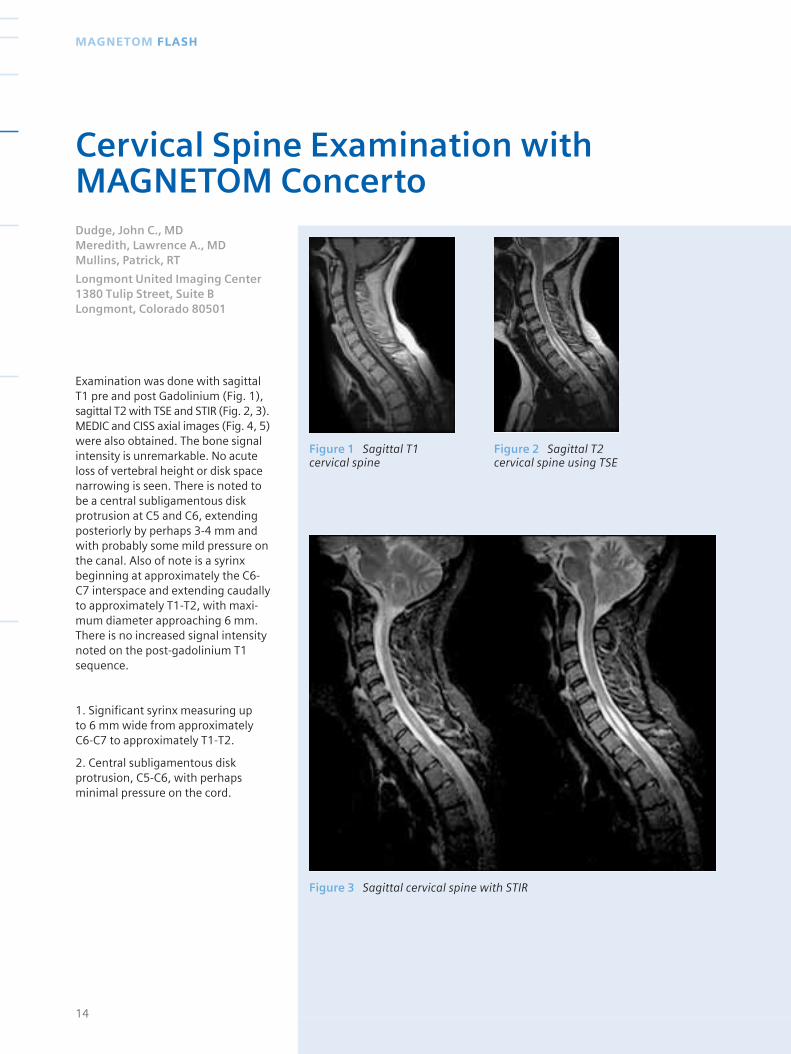
Figure 1 Sagittal T1cervical spine
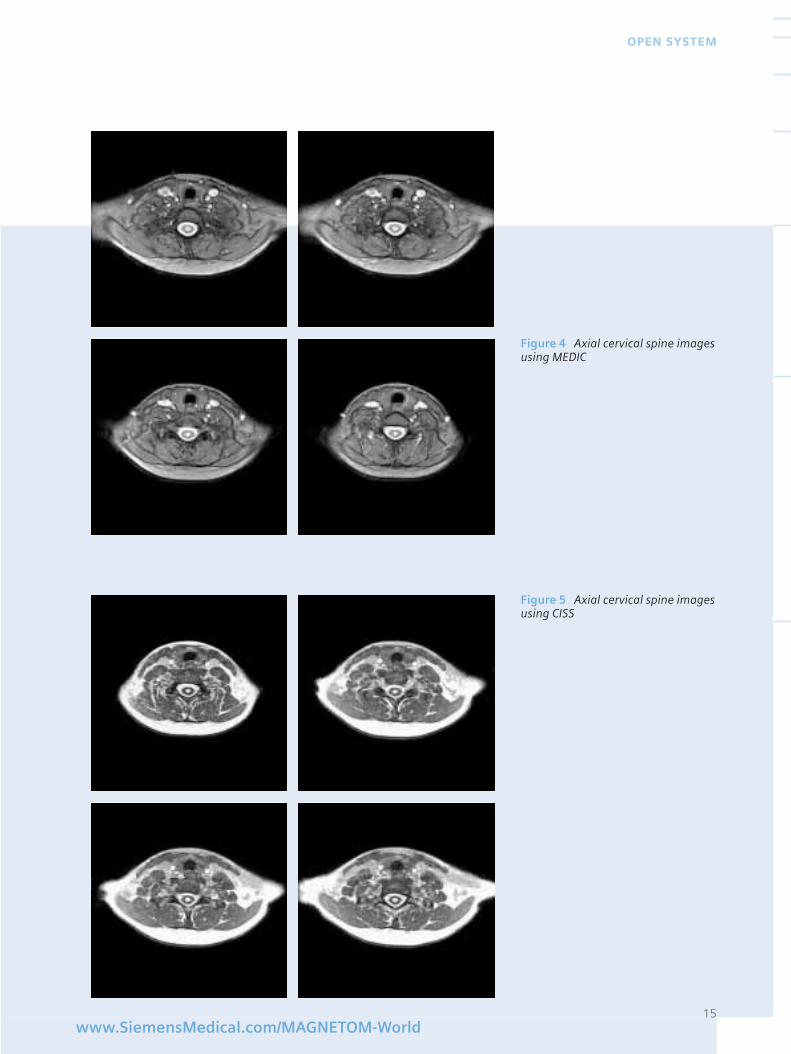
Examination was done with sagittalT1 pre and post Gadolinium (Fig. 1),sagittal T2 with TSE and STIR (Fig. 2, 3).MEDIC and CISS axial images (Fig. 4, 5)were also obtained. The bone signalintensity is unremarkable. No acuteloss of vertebral height or disk spacenarrowing is seen. There is noted tobe a central subligamentous diskprotrusion at C5 and C6, extendingposteriorly by perhaps 3-4 mm andwith probably some mild pressure onthe canal. Also of note is a syrinxbeginning at approximately the C6-C7 interspace and extending caudallyto approximately T1-T2, with maxi-mum diameter approaching 6 mm.There is no increased signal intensitynoted on the post-gadolinium T1sequence.
1. Significant syrinx measuring up to 6 mm wide from approximately C6-C7 to approximately T1-T2.
2. Central subligamentous diskprotrusion, C5-C6, with perhapsminimal pressure on the cord.
14
MAGNETOM FLASH
Cervical Spine Examination withMAGNETOM ConcertoDudge, John C., MDMeredith, Lawrence A., MDMullins, Patrick, RT
Longmont United Imaging Center1380 Tulip Street, Suite BLongmont, Colorado 80501
Figure 2 Sagittal T2cervical spine using TSE
Figure 3 Sagittal cervical spine with STIR
15www.SiemensMedical.com/MAGNETOM-World
OPEN SYSTEM
Figure 4 Axial cervical spine imagesusing MEDIC
Figure 5 Axial cervical spine imagesusing CISS
Introduction
MRI of the knee performed at con-ventional field strengths is sensitivefor the detection of cruciate andcollateral ligament tears as well as forthe detection of meniscal tears. Thespatial resolution and excellent soft-tissue contrast provided by 1.5 Teslaclinical MRI scanners are perfectlysatisfactory. The signal-to-noise ratio(SNR) and spatial resolution at thisstandard field strength, however,remain inadequate for the study offine structural details in certaincritical joint components such asarticular cartilage. Consequently, theintroduction of high-field whole body magnetic resonance imagingsystems, such as 3.0 T and above, is aconsecutive step to achieve a higherspatial resolution in vivo. Applica-tions for this technology in musculo-skeletal systems include the imagingof small joints and of morphologicallycomplex and vulnerable structuressuch as articular cartilage.
The accurate imaging of articularcartilage is of major clinicalimportance as cartilage degenerationis a significant cause of morbidity.
Diagnostic arthroscopy is stillfrequently used for articular cartilageassessment despite the fact that onlythe surface condition of the cartilagecan be directly evaluated by thismethod. In particular, cartilage repairand degeneration cannot be monito-red over time by such invasivemethods. Such monitoring becomesparticularly important, however, for
the objective assessment in clinicaltrials of new pharmacological and surgical treatments for articularcartilage lesions.
High-field MRI systems enable smallfield-of-view images with improvedspatial resolution due to an increasedSNR. Factors such as B0 homogeneityand the increased chemical-shiftartefacts can, however, reduce thegains offered by a higher magneticfield. Given this situation, the aim ofour study was the direct comparisonof sequences with identical para-meters at different field strengthswith respect to SNR, image contrast,and artefacts. In a second step, theadaptation of sequence parametersfor optimal imaging at 3 Tesla hasbeen initiated.
Methods
MR imaging of the knee was perfor-med on healthy volunteers, aged 31-45 years, with a 1.5 T MAGNETOMSonata Scanner (Siemens, Germany)using a circularly polarized extremitycoil. The routine protocol included a T1 weighted spin-echo sequence(TR = 450 ms, TE = 15 ms, FOV = 180mm) and a turbo spin-echo sequence (TR = 5000 ms, TE = 15 ms and 100 ms)for simultaneous recording of protondensity- and T2-weighted images.Additionally, two special techniquesdedicated to depict cartilage wereapplied: a dual echo steady state(DESS) sequence (TR = 21 ms, TE = 6ms) and a multi-echo sequence witha high bandwidth: MEDIC (TR = 120ms, TE = 21 ms). Finally a TIRM (TR =7000 ms, TE = 58 ms, TI = 180 ms)sequence and a standard gradientecho sequence (GRE) with differentTE’s were applied (TR = 120 ms, TE = 10 and 20 ms, FOV = 180 mm).Examinations were repeated on a 3.0T whole body imager (MAGNETOMTrio, Siemens, Germany) with identi-
cal sequence parameters. SNR atboth field strengths were measuredand tissue contrast was comparedqualitatively between 1.5 and 3 T. Aschemical shift doubles from 1.5 to3.0 T, particular attention was givento the evaluation of chemical shiftartefacts at 3.0 T.
Results
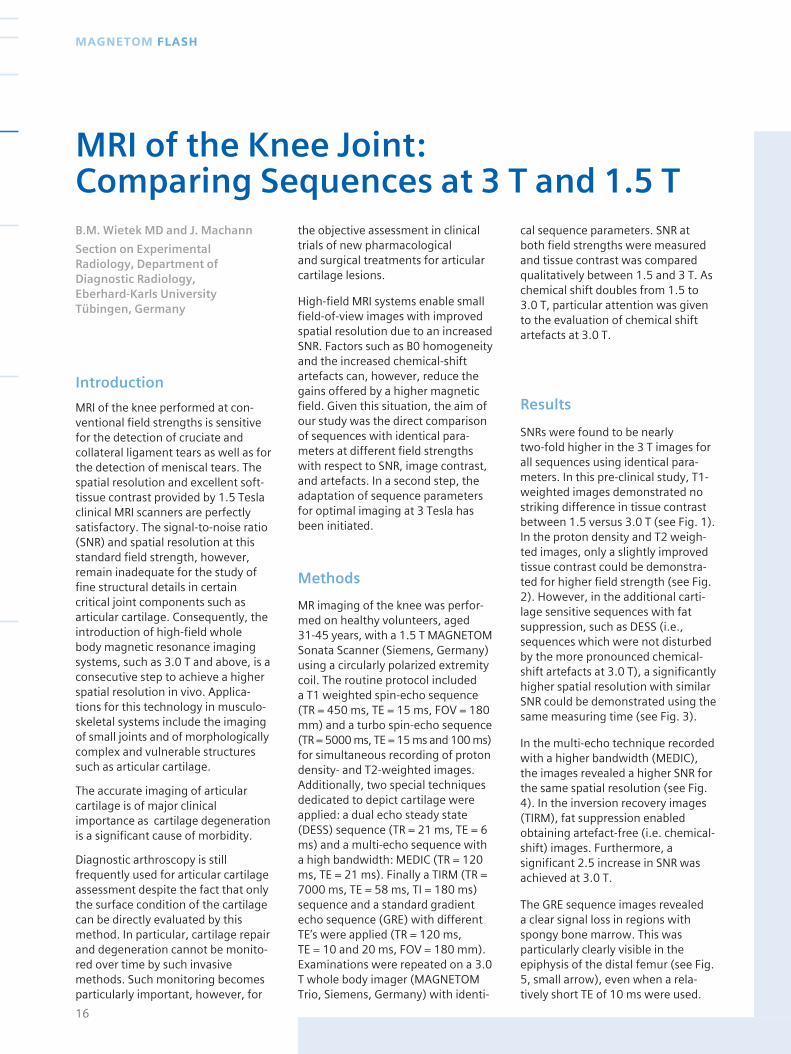
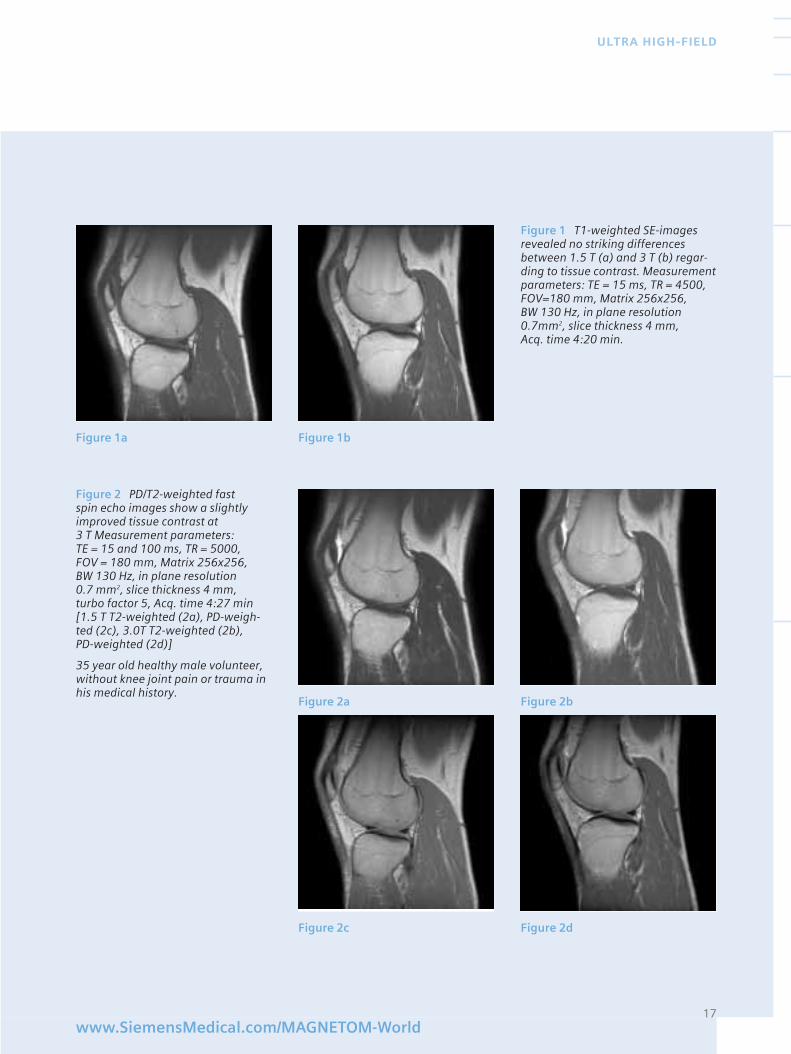
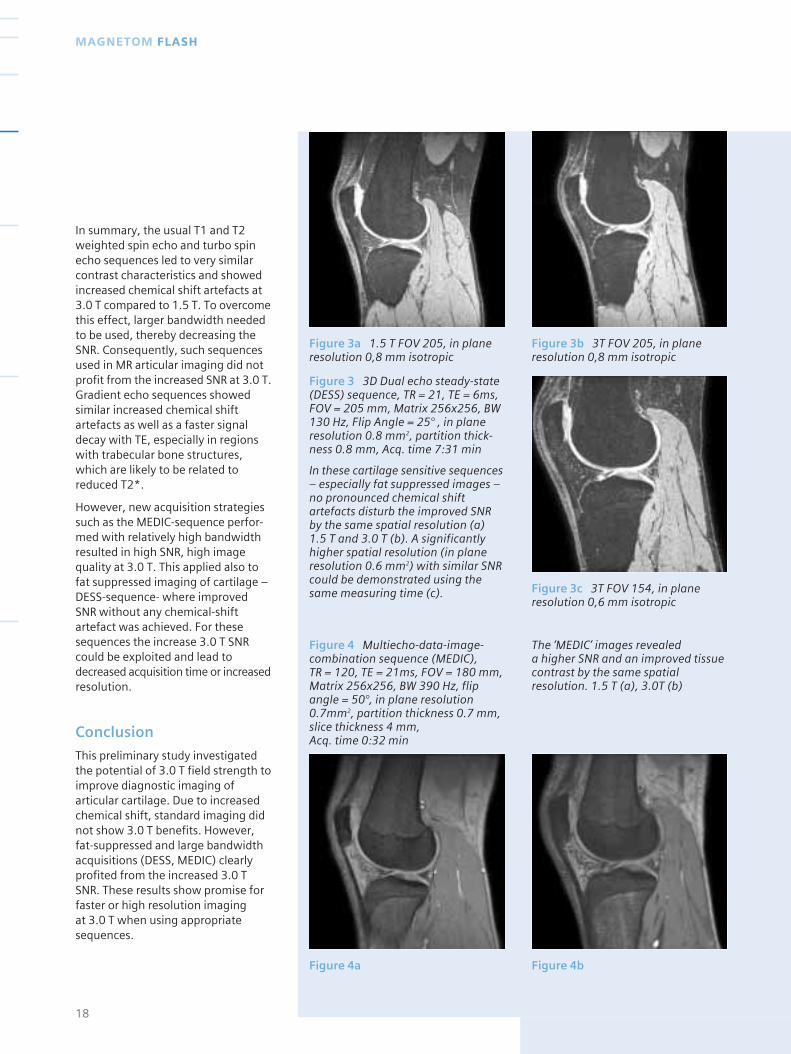
SNRs were found to be nearly two-fold higher in the 3 T images forall sequences using identical para-meters. In this pre-clinical study, T1-weighted images demonstrated nostriking difference in tissue contrastbetween 1.5 versus 3.0 T (see Fig. 1).In the proton density and T2 weigh-ted images, only a slightly improvedtissue contrast could be demonstra-ted for higher field strength (see Fig.2). However, in the additional carti-lage sensitive sequences with fatsuppression, such as DESS (i.e.,sequences which were not disturbedby the more pronounced chemical-shift artefacts at 3.0 T), a significantlyhigher spatial resolution with similarSNR could be demonstrated using thesame measuring time (see Fig. 3).
In the multi-echo technique recordedwith a higher bandwidth (MEDIC),the images revealed a higher SNR forthe same spatial resolution (see Fig.4). In the inversion recovery images(TIRM), fat suppression enabledobtaining artefact-free (i.e. chemical-shift) images. Furthermore, a significant 2.5 increase in SNR wasachieved at 3.0 T.
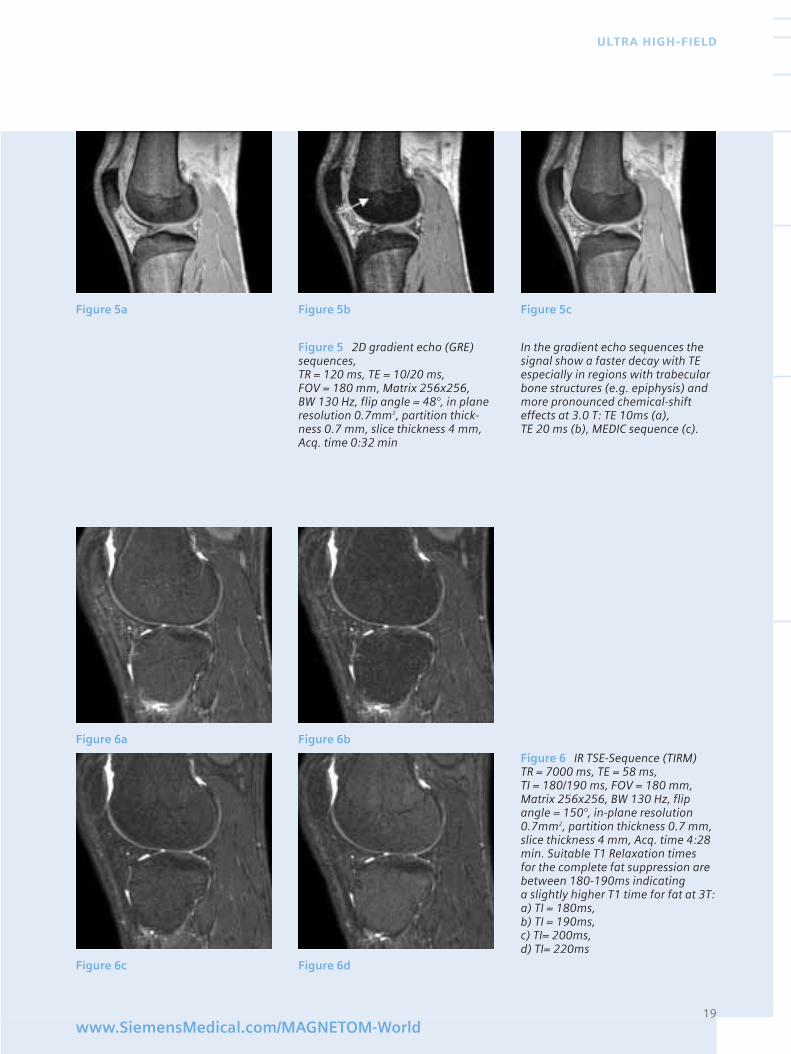
The GRE sequence images revealed a clear signal loss in regions withspongy bone marrow. This wasparticularly clearly visible in theepiphysis of the distal femur (see Fig.5, small arrow), even when a rela-tively short TE of 10 ms were used.
16
MAGNETOM FLASH
MRI of the Knee Joint:Comparing Sequences at 3 T and 1.5 TB.M. Wietek MD and J. Machann
Section on ExperimentalRadiology, Department ofDiagnostic Radiology, Eberhard-Karls UniversityTübingen, Germany
17www.SiemensMedical.com/MAGNETOM-World
ULTRA HIGH-FIELD
Figure 1 T1-weighted SE-imagesrevealed no striking differencesbetween 1.5 T (a) and 3 T (b) regar-ding to tissue contrast. Measurementparameters: TE = 15 ms, TR = 4500,FOV=180 mm, Matrix 256x256, BW 130 Hz, in plane resolution0.7mm2, slice thickness 4 mm, Acq. time 4:20 min.
Figure 1a Figure 1b
Figure 2 PD/T2-weighted fast spin echo images show a slightlyimproved tissue contrast at 3 T Measurement parameters: TE = 15 and 100 ms, TR = 5000, FOV = 180 mm, Matrix 256x256, BW 130 Hz, in plane resolution 0.7 mm2, slice thickness 4 mm, turbo factor 5, Acq. time 4:27 min[1.5 T T2-weighted (2a), PD-weigh-ted (2c), 3.0T T2-weighted (2b), PD-weighted (2d)]
35 year old healthy male volunteer,without knee joint pain or trauma inhis medical history.
Figure 2a Figure 2b
Figure 2c Figure 2d
18
MAGNETOM FLASH
In summary, the usual T1 and T2weighted spin echo and turbo spinecho sequences led to very similarcontrast characteristics and showedincreased chemical shift artefacts at3.0 T compared to 1.5 T. To overcomethis effect, larger bandwidth neededto be used, thereby decreasing theSNR. Consequently, such sequencesused in MR articular imaging did notprofit from the increased SNR at 3.0 T.Gradient echo sequences showedsimilar increased chemical shiftartefacts as well as a faster signaldecay with TE, especially in regionswith trabecular bone structures,which are likely to be related toreduced T2*.
However, new acquisition strategiessuch as the MEDIC-sequence perfor-med with relatively high bandwidthresulted in high SNR, high imagequality at 3.0 T. This applied also tofat suppressed imaging of cartilage –DESS-sequence- where improvedSNR without any chemical-shiftartefact was achieved. For thesesequences the increase 3.0 T SNRcould be exploited and lead todecreased acquisition time or increasedresolution.
Conclusion
This preliminary study investigatedthe potential of 3.0 T field strength toimprove diagnostic imaging ofarticular cartilage. Due to increasedchemical shift, standard imaging didnot show 3.0 T benefits. However,fat-suppressed and large bandwidthacquisitions (DESS, MEDIC) clearlyprofited from the increased 3.0 TSNR. These results show promise forfaster or high resolution imaging at 3.0 T when using appropriatesequences.
Figure 3 3D Dual echo steady-state(DESS) sequence, TR = 21, TE = 6ms,FOV = 205 mm, Matrix 256x256, BW130 Hz, Flip Angle = 25° , in planeresolution 0.8 mm2, partition thick-ness 0.8 mm, Acq. time 7:31 min
In these cartilage sensitive sequences– especially fat suppressed images –no pronounced chemical shiftartefacts disturb the improved SNRby the same spatial resolution (a) 1.5 T and 3.0 T (b). A significantlyhigher spatial resolution (in planeresolution 0.6 mm2) with similar SNRcould be demonstrated using thesame measuring time (c).
Figure 3a 1.5 T FOV 205, in planeresolution 0,8 mm isotropic
Figure 3b 3T FOV 205, in planeresolution 0,8 mm isotropic
Figure 3c 3T FOV 154, in planeresolution 0,6 mm isotropic
Figure 4a Figure 4b
Figure 4 Multiecho-data-image-combination sequence (MEDIC), TR = 120, TE = 21ms, FOV = 180 mm,Matrix 256x256, BW 390 Hz, flipangle = 50°, in plane resolution0.7mm2, partition thickness 0.7 mm,slice thickness 4 mm, Acq. time 0:32 min
The ‘MEDIC’ images revealed a higher SNR and an improved tissuecontrast by the same spatialresolution. 1.5 T (a), 3.0T (b)
19www.SiemensMedical.com/MAGNETOM-World
ULTRA HIGH-FIELD
Figure 5 2D gradient echo (GRE)sequences, TR = 120 ms, TE = 10/20 ms, FOV = 180 mm, Matrix 256x256, BW 130 Hz, flip angle = 48°, in planeresolution 0.7mm2, partition thick-ness 0.7 mm, slice thickness 4 mm,Acq. time 0:32 min
Figure 6 IR TSE-Sequence (TIRM) TR = 7000 ms, TE = 58 ms, TI = 180/190 ms, FOV = 180 mm,Matrix 256x256, BW 130 Hz, flipangle = 150°, in-plane resolution0.7mm2, partition thickness 0.7 mm,slice thickness 4 mm, Acq. time 4:28min. Suitable T1 Relaxation times for the complete fat suppression arebetween 180-190ms indicating a slightly higher T1 time for fat at 3T:a) TI = 180ms, b) TI = 190ms, c) TI= 200ms, d) TI= 220ms
Figure 5a Figure 5b Figure 5c
Figure 6a Figure 6b
Figure 6c Figure 6d
In the gradient echo sequences thesignal show a faster decay with TEespecially in regions with trabecularbone structures (e.g. epiphysis) andmore pronounced chemical-shifteffects at 3.0 T: TE 10ms (a), TE 20 ms (b), MEDIC sequence (c).
Introduction
Magnetic resonance imaging haschanged medical practice, particularlyin the brain. Diagnosis of anatomicdiseases has become possible with alevel of precision that was previouslyunthinkable: tumors, aneurysms,congenital abnormalities, and trau-matic injuries are now routinelydiagnosed with a higher degree ofaccuracy than ever before.
Nevertheless, the full potential ofMRI remains to be realized. In anumber of clinical applications in thebrain, MRI might be able to offersignificantly more benefit than itcurrently offers. Take these fourexamples:
■ Most psychiatric diseases havelittle if any gross anatomic changedetectable by MRI. Instead, suchdiseases appear to be caused byincorrect functioning of normal-appearing tissue. Functional MRI – anapproach that may be able to changethis shortcoming – has been limitedby the lack of signal relative to thebiologic noise present (as well asother problems).
■ Magnetic resonance angiography,though steadily improving, has notyet replaced catheter-based x-rayangiography as a gold standard.From a health care policy point ofview, the sensitivity and specificityare too low; from a technical point ofview, coverage and spatial resolutionare both insufficient.
■ The investigation of microscopicanatomy with diffusion imaging andperfusion imaging is just beginningto achieve widespread clinical accep-tance. However, such images aremarkedly limited by signal to noiseconstraints. This is one reason for thelower spatial resolution of diffusionand perfusion MRI compared toconventional imaging.
■ Spectroscopy and spectroscopicimaging have had limited success inthe clinical arena, despite markedsuccess in the laboratory setting. Onekey reason is the time needed toacquire clinically useful information.
In each of these scenarios, a funda-mental limitation that current MRItechniques suffer from can bethought of as simply too low a ratioof signal to noise. As users look forways to get more signal, an increa-sing number are using higher fieldstrengths. This article will illustratesome of the benefits we have recog-nized in our practice by moving from1.5 Tesla (the current standardpremier clinical system) to 3.0 Tesla.We have found significant benefit bymoving to 3T in a variety of routineand investigative settings.
Signal to noise: the “currency” of MRI
An important concept in consideringthe benefits of high field imaging isthat signal to noise can be viewed asa type of “currency” that the radiolo-gist can choose to “spend” in a num-ber of ways. Improved SNR might beused to increase the imaging matrix,or to choose thinner slices, or toreduce the number of signal averages,or in some cases to decrease theamount of contrast agent administe-red. This flexibility of improved SNR isone of its greatest advantages. Once
additional SNR is available, how bestto use it is for the radiologist todecide.
It is also important to note thatincreasing field strength is not theonly way to improve the ratio ofsignal to noise. A four-fold increasein imaging time will lead to a doub-ling of the signal to noise ratio (SNR).This means that when one refers toSNR, it always assumes a fixedamount of imaging time, since onecan improve SNR simply by imaginglonger. SNR can also be improved by utilizing improved receiver coils(such as surface coils, singly or inarrays); in some instances by shorte-ning echo times (made possible by improved gradient hardware); orby utilizing novel pulse sequences(these often optimize contrast tonoise, or CNR, but sometimes boostSNR as well). However, most new1.5T systems in use today are alreadyusing optimized hardware andsoftware. While longer imaging timesmight provide better SNR, increasingthe imaging time by a factor of four issimply not possible in many situa-tions for a variety of patient relatedreasons. For example, the exam mayalready be as long as feasible, or thepatient is not stable, or there may beeconomic reasons, e.g. throughputof patients. Therefore, using a higherfield strength is an option that meritsexploration.
Areas of Potential Benefit
We will briefly explore each of theabove listed areas of MRI limitation tosee what benefit higher field imagingmight bring.
Conventional AnatomicImaging
Conventional MRI already provideshigh quality imaging in many
20
MAGNETOM FLASH
High Field Brain Imaging: Clinical ImplicationsA. Gregory Sorensen, M.D.
Massachusetts General Hospital,USA
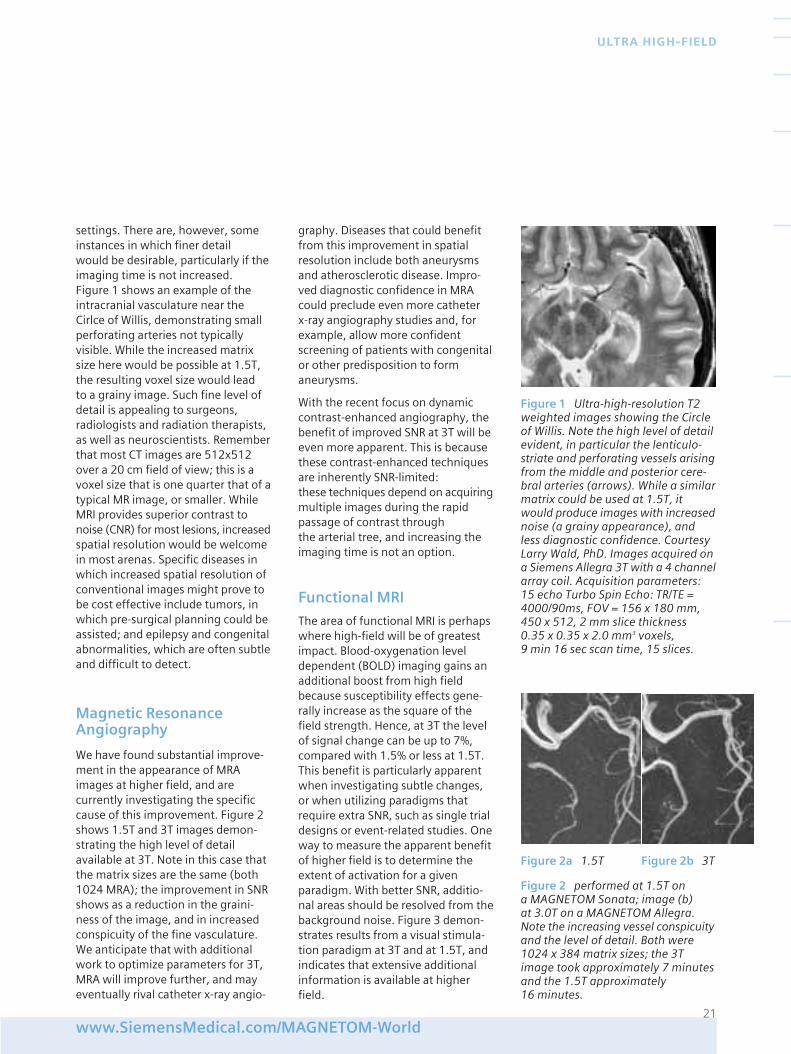
settings. There are, however, someinstances in which finer detail would be desirable, particularly if theimaging time is not increased. Figure 1 shows an example of theintracranial vasculature near theCirlce of Willis, demonstrating smallperforating arteries not typicallyvisible. While the increased matrixsize here would be possible at 1.5T,the resulting voxel size would lead to a grainy image. Such fine level ofdetail is appealing to surgeons,radiologists and radiation therapists,as well as neuroscientists. Rememberthat most CT images are 512x512over a 20 cm field of view; this is avoxel size that is one quarter that of atypical MR image, or smaller. WhileMRI provides superior contrast tonoise (CNR) for most lesions, increasedspatial resolution would be welcomein most arenas. Specific diseases inwhich increased spatial resolution ofconventional images might prove tobe cost effective include tumors, inwhich pre-surgical planning could beassisted; and epilepsy and congenitalabnormalities, which are often subtleand difficult to detect.
Magnetic ResonanceAngiography
We have found substantial improve-ment in the appearance of MRAimages at higher field, and arecurrently investigating the specificcause of this improvement. Figure 2shows 1.5T and 3T images demon-strating the high level of detailavailable at 3T. Note in this case thatthe matrix sizes are the same (both1024 MRA); the improvement in SNRshows as a reduction in the graini-ness of the image, and in increasedconspicuity of the fine vasculature.We anticipate that with additionalwork to optimize parameters for 3T,MRA will improve further, and mayeventually rival catheter x-ray angio-
graphy. Diseases that could benefitfrom this improvement in spatialresolution include both aneurysmsand atherosclerotic disease. Impro-ved diagnostic confidence in MRAcould preclude even more catheter x-ray angiography studies and, forexample, allow more confidentscreening of patients with congenitalor other predisposition to formaneurysms.
With the recent focus on dynamiccontrast-enhanced angiography, thebenefit of improved SNR at 3T will beeven more apparent. This is becausethese contrast-enhanced techniquesare inherently SNR-limited: these techniques depend on acquiringmultiple images during the rapidpassage of contrast through the arterial tree, and increasing theimaging time is not an option.
Functional MRI
The area of functional MRI is perhapswhere high-field will be of greatestimpact. Blood-oxygenation leveldependent (BOLD) imaging gains anadditional boost from high fieldbecause susceptibility effects gene-rally increase as the square of thefield strength. Hence, at 3T the levelof signal change can be up to 7%,compared with 1.5% or less at 1.5T.This benefit is particularly apparentwhen investigating subtle changes,or when utilizing paradigms thatrequire extra SNR, such as single trialdesigns or event-related studies. Oneway to measure the apparent benefitof higher field is to determine theextent of activation for a givenparadigm. With better SNR, additio-nal areas should be resolved from thebackground noise. Figure 3 demon-strates results from a visual stimula-tion paradigm at 3T and at 1.5T, andindicates that extensive additionalinformation is available at higherfield.
21www.SiemensMedical.com/MAGNETOM-World
ULTRA HIGH-FIELD
Figure 1 Ultra-high-resolution T2weighted images showing the Circleof Willis. Note the high level of detailevident, in particular the lenticulo-striate and perforating vessels arisingfrom the middle and posterior cere-bral arteries (arrows). While a similarmatrix could be used at 1.5T, itwould produce images with increasednoise (a grainy appearance), andless diagnostic confidence. CourtesyLarry Wald, PhD. Images acquired ona Siemens Allegra 3T with a 4 channelarray coil. Acquisition parameters:15 echo Turbo Spin Echo: TR/TE =4000/90ms, FOV = 156 x 180 mm,450 x 512, 2 mm slice thickness 0.35 x 0.35 x 2.0 mm3 voxels, 9 min 16 sec scan time, 15 slices.
Figure 2a 1.5T Figure 2b 3T
Figure 2 performed at 1.5T on a MAGNETOM Sonata; image (b) at 3.0T on a MAGNETOM Allegra.Note the increasing vessel conspicuityand the level of detail. Both were1024 x 384 matrix sizes; the 3Timage took approximately 7 minutesand the 1.5T approximately 16 minutes.
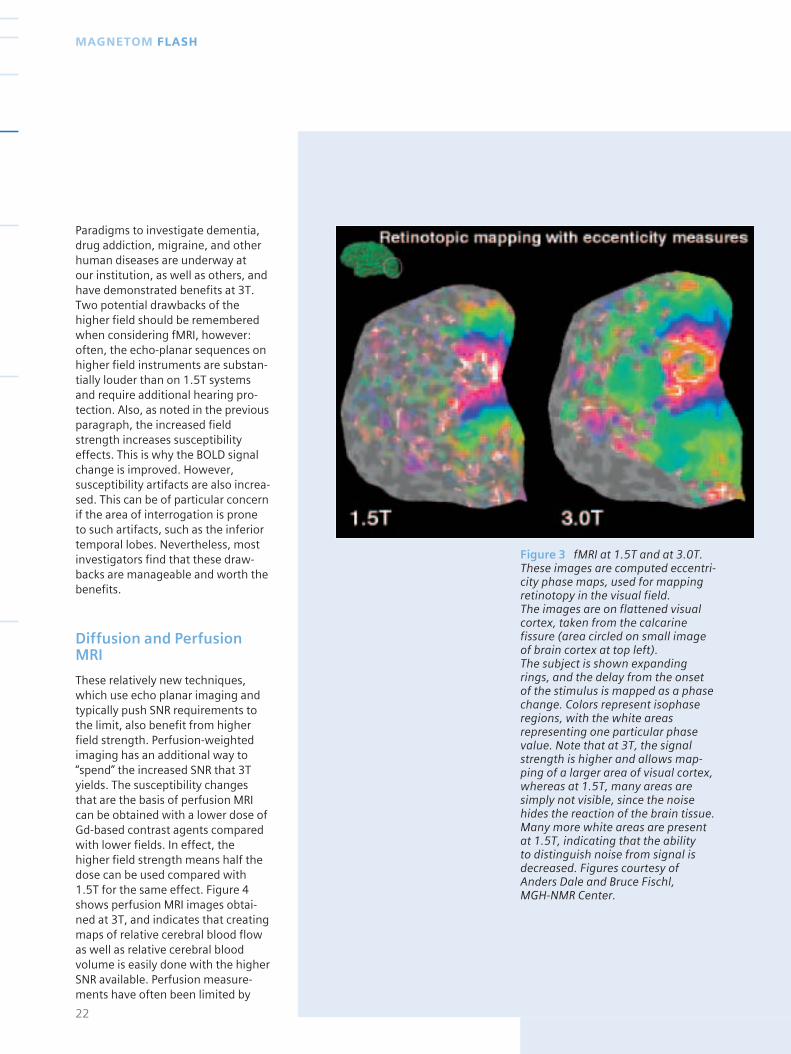
Figure 3 fMRI at 1.5T and at 3.0T.These images are computed eccentri-city phase maps, used for mappingretinotopy in the visual field. The images are on flattened visualcortex, taken from the calcarinefissure (area circled on small imageof brain cortex at top left). The subject is shown expandingrings, and the delay from the onsetof the stimulus is mapped as a phasechange. Colors represent isophaseregions, with the white areasrepresenting one particular phasevalue. Note that at 3T, the signalstrength is higher and allows map-ping of a larger area of visual cortex,whereas at 1.5T, many areas aresimply not visible, since the noisehides the reaction of the brain tissue.Many more white areas are presentat 1.5T, indicating that the ability to distinguish noise from signal isdecreased. Figures courtesy ofAnders Dale and Bruce Fischl, MGH-NMR Center.
Paradigms to investigate dementia,drug addiction, migraine, and otherhuman diseases are underway at our institution, as well as others, andhave demonstrated benefits at 3T.Two potential drawbacks of thehigher field should be rememberedwhen considering fMRI, however:often, the echo-planar sequences onhigher field instruments are substan-tially louder than on 1.5T systemsand require additional hearing pro-tection. Also, as noted in the previousparagraph, the increased fieldstrength increases susceptibilityeffects. This is why the BOLD signalchange is improved. However,susceptibility artifacts are also increa-sed. This can be of particular concernif the area of interrogation is prone to such artifacts, such as the inferiortemporal lobes. Nevertheless, mostinvestigators find that these draw-backs are manageable and worth thebenefits.
Diffusion and PerfusionMRI
These relatively new techniques,which use echo planar imaging andtypically push SNR requirements tothe limit, also benefit from higherfield strength. Perfusion-weightedimaging has an additional way to“spend” the increased SNR that 3Tyields. The susceptibility changesthat are the basis of perfusion MRIcan be obtained with a lower dose ofGd-based contrast agents comparedwith lower fields. In effect, thehigher field strength means half thedose can be used compared with1.5T for the same effect. Figure 4shows perfusion MRI images obtai-ned at 3T, and indicates that creatingmaps of relative cerebral blood flowas well as relative cerebral bloodvolume is easily done with the higherSNR available. Perfusion measure-ments have often been limited by
22
MAGNETOM FLASH

23www.SiemensMedical.com/MAGNETOM-World
ULTRA HIGH-FIELD
SNR, since the first pass of a contrastagents occurs so quickly and thereforethere are relatively few data points tocompute hemodynamic parametersfrom. The additional SNR boost(assuming the same dose of Gd isgiven) can allow more precise mea-surement of hemodynamics, particu-larly in disease states such as strokewhere hypoperfusion is present andonly a small amount of contrastagent might be arriving into a voxel.
Diffusion MRI is also limited by SNR:many sites typically acquire multiplesignal averages at 1.5T, and still haveinsufficient SNR to fully study pheno-mena such as anisotropy and behaviorof the full diffusion tensor in diseasestates such as stroke. The additionalSNR boost should help these studiesas well.
The Future
We anticipate that the quest forhigher field strength will continue. A few centers (including ours) areinstalling even higher field strengths:7.0 Tesla and beyond (WIP). Whilethere are a number of technicalissues at high field, including radio-frequency power deposition, fieldinhomogeneity, and increasedsystem performance requirements,we believe that these are challengesthat are well worth the effort needed.As with echo-planar imaging, thewidespread clinical acceptance ofthese systems requires a streamlineduser interface and increased robust-ness, as opposed to the less reliableperformance of research systems.Which of the above applications (orperhaps other applications notmentioned) will provide the mostcompelling reason to move to higherfield in the clinical setting remains to be determined, but the move to high field for clinical imaging isundisputable.
Figure 4 Perfusion MRI at 3.0 T*Maps of relative cerebral bloodvolume (rCBV) and relative cerebralblood flow (rCBF) can be createdfrom dynamic data acquired at 3.0T.These images demonstrate abnor-mally elevated rCBF and rCBV in a residual grade 3 tumor. Note theexcellent gray / white ratio, consi-stent with known differences in graymatter and white matter blood flowand blood volume (Siemens MAGNETOM Allegra, Spin Echo EPI).
* This informationconcerns use of contrast media that has not beenapproved by the Food and Drug Administration.
Introduction
When imaging the pediatric brain,many techniques and methods mustbe considered. We, the staff at TheChildren's Hospital of Philadelphia,plan to share with you our experien-ces in this area through a series ofarticles and tips.
It is known that the pediatric patientpresents many challenges during anMR exam. These challenges include:
1. Safe sedation techniques
2. Monitoring during the MRI exam
3. Technical parameters
In this article, we will discuss tissuecontrast considerations for imagingthe pediatric brain.
Brain development
Why does the pediatric brain presentimaging challenges that the maturebrain does not? The brain matures in an organized and predeterminedpattern that correlates with thedevelopment of functions in thenewborn and infant. As the pediatricbrain develops, its water contentdecreases and its myelin contentincreases. The infant brain has amuch higher water content than thatof the older child or adult. The highbrain water content at birth decreasesrapidly over the first six months oflife. It continues to decrease at a slower rate until age 2, and thenlevels off. Myelination of whitematter is an important component ofbrain maturation. It facilitates the
transmission of neural impulsesthrough the CNS. Myelination isongoing throughout the first decadeof life, and myelin contains proteinand lipids, which contribute to T1contrast. During the first two years of life, this development should betaken into account when selectingtechniques that will produce optimalpediatric images.
MR pulse sequence:Magnetization transfersuppression (MTS)
Magnetization transfer (MT) suppres-sion is a technique similar to fatsaturation in terms of hardwareimplementation. However, instead ofan RF pulse centered at the fatfrequency, magnetization transferuses a narrow bandwidth RF pulsewith a center frequency approximately1-10 kHz away from the main waterresonance. This off-resonance pulseaffects some of the tissue waterprotons, more specifically the “boundwater” protons.
Water within a tissue is either mobile(freely moving) or bound to macro-molecules. While both free andbound water protons have the sameresonance frequency, they will havedifferent T2 relaxation times. Freewater protons will have a long T2 anda sharp peak. Bound water has a veryshort T2 and a broad resonance peak,not normally visualized in an image.The two peaks will be superimposedat the same center frequency.
Magnetization transfer sequencesapply a narrow bandwidth presatura-tion pulse that is centered 1-10 kHzaway from the central water frequency.The magnetization transfer RF pulseis applied off-resonance to saturatethe bound water protons. Exchangebetween the bound and free waterprotons transfers the saturation to the free water protons, reducing
signal intensity from the free water.This is the process of magnetizationtransfer. Contrast is enhancedbetween tissues that undergo mag-netization transfer (water-containingtissues) and those that do not (fat-containing tissues). Magnetizationtransfer pulses may be used in SpinEcho (T1) following administration ofa contrast agent and in Gradient Echosequences (3D TOF MRA), to produceadditional signal suppression oftissue water.
The clinical applications of magneti-zation transfer can be divided intotwo categories: contrast augmenta-tion and tissue characterization. In a given tissue, the saturation pulsesused in magnetization transferreduce the signal intensity. Thedegree of signal intensity reductiondepends on the amount of magneti-zation transfer present in this tissue.Using magnetization transfer sup-pression, contrast between tissueswith different amounts of magneti-zation transfer can be increased.
Magnetization transfer saturationpulses can be combined with allconventional MR sequences. Whenusing magnetization transfer forcontrast augmentation, the familiartissue contrasts on these sequenceschange. For example, when combi-ning a T1 weighted sequence with anMT saturation pulse in brain imaging,fat appears brighter, and the graymatter of the central sulcus, putamen,and caudate increases in brightnessand conspicuity.
On Time of Flight (TOF) images,blood vessels stand out against a dark background due to selectivesaturation of stationary tissue. Thiseffect is based on two phenomena.One, blood flowing into the imagingplane does not experience the satu-rating effect on the MT pulse, andtwo; the MT effect of blood is lowerthan that of brain parenchyma.
24
MAGNETOM FLASH
MT Tissue Contrast Effect and its Role in Pediatric MR ImagingChristine Harris, RT (R)(MR)Tamara D. Lee, BSRT(R)(MR)(CT)
The Children's Hospital of Philadelphia

Another clinical application is the useof MT pulses in combination withcontrast enhanced TOF. The repeatedapplication of RF pulses in TOF MRAnot only gives rise to saturation of stationary tissue, but also leads tosaturation of blood flowing in theimaging plane. As a result, a reduc-tion in the vessel-to-background ratiooccurs. By using gadolinium chelates,this phenomenon can be reduced.These agents shorten intravascularT1 relaxation times, which diminishesthe sensitivity of blood to saturationeffects. Gadolinium is largely insensitive to MT pulses; however,the combination of gadolinium andMT pulses increases vessel to back-ground contrast.
Magnetization transfer suppressioncan also be used to quantitativelycharacterize tissues. The amount ofMT in tissues depends on the physicaland chemical characteristics of tissuecomponents, which may change in disease states. Such changes canbe quantified using magnetizationtransfer. To quantify these changes,two MR sequences are needed: onein conjunction with the MT pulse,and the second one identical butcarried out in the absence of the MTpulse.
Effects of MT on MR imaging
MT is utilized routinely with MRA tosuppress the background signalwhile maintaining the signal contrastfrom the vessel. MT increases theconspicuity of small and distal bloodvessels.
By suppressing the background signal,the signal ratio between vessel andbrain tissue will be improved. MT usewith post-contrast imaging increasesthe contrast to noise ratio of enhance-ment, which is nearly doubled whencompared with non-MT MR Imaging.
The benefit is similar to giving larger doses of contrast, but withoutthe added expense. This will improvelesion visibility.
Pitfall
We have noted that when using theMT pulse sequence with childrenunder the age of two, MT resulted indecreased conspicuity of edema aswell as gray/white matter contrast.(Fig. 1 and 2).
Protocol
At our institution, MTS is utilized with pre- and post-contrast imaging,and for enhancing lesions such asinfection and infarction.
Pre-MTS imaging is utilized to assesspathological enhancement accuratelyas well as the sensitivity of certaindisease processes which may beobscured during standard T1 imaging(Fig. 3 and 4).
25www.SiemensMedical.com/MAGNETOM-World
PEDIATRIC IMAGING
Figure 1 Figure 2
Figures 1 and 2 were both acquired with the same parameters, except thatin Figure 2 we added an MT pulse. Note the decrease in gray/white mattercontrast in Figure 2.
Figure 3 Routine Spin Echo Figure 4 Spin Echo with MT Pulse.Note increased visualization of TSdisease process vs. non-MT image(Fig. 3)
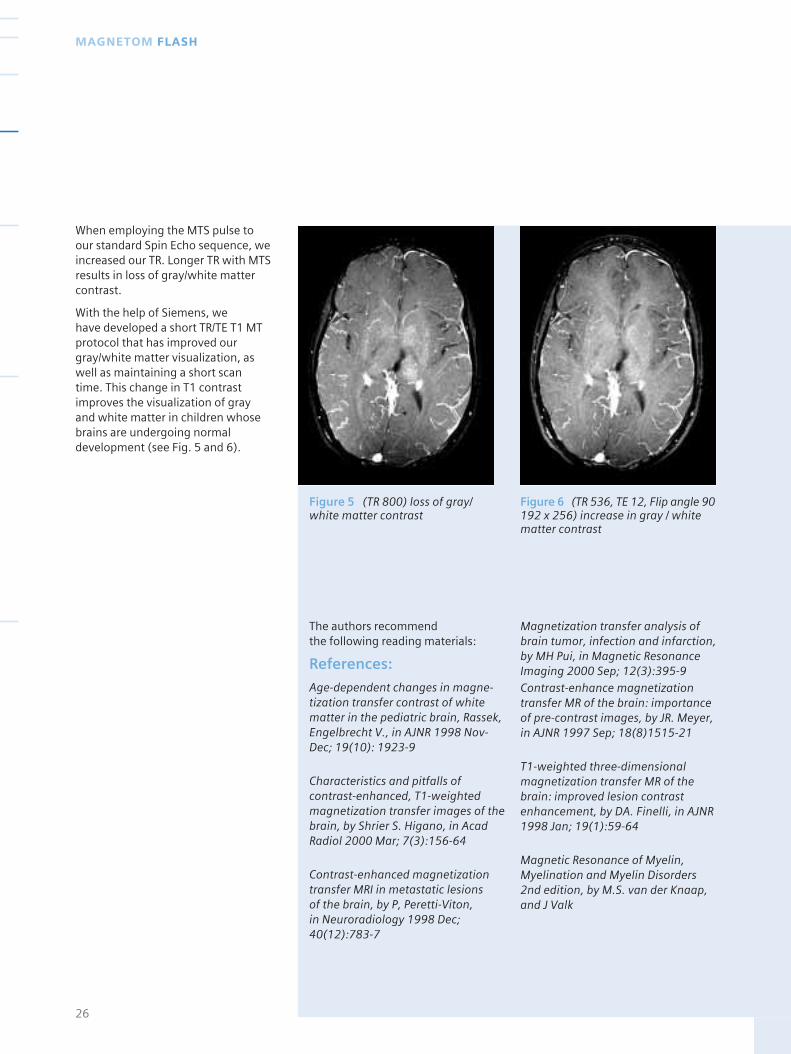
When employing the MTS pulse toour standard Spin Echo sequence, weincreased our TR. Longer TR with MTSresults in loss of gray/white mattercontrast.
With the help of Siemens, we have developed a short TR/TE T1 MTprotocol that has improved ourgray/white matter visualization, aswell as maintaining a short scantime. This change in T1 contrastimproves the visualization of grayand white matter in children whosebrains are undergoing normaldevelopment (see Fig. 5 and 6).
The authors recommend the following reading materials:
References:
Age-dependent changes in magne-tization transfer contrast of whitematter in the pediatric brain, Rassek,Engelbrecht V., in AJNR 1998 Nov-Dec; 19(10): 1923-9
Characteristics and pitfalls ofcontrast-enhanced, T1-weightedmagnetization transfer images of thebrain, by Shrier S. Higano, in AcadRadiol 2000 Mar; 7(3):156-64
Contrast-enhanced magnetizationtransfer MRI in metastatic lesions of the brain, by P, Peretti-Viton, in Neuroradiology 1998 Dec;40(12):783-7
Magnetization transfer analysis ofbrain tumor, infection and infarction,by MH Pui, in Magnetic ResonanceImaging 2000 Sep; 12(3):395-9Contrast-enhance magnetizationtransfer MR of the brain: importanceof pre-contrast images, by JR. Meyer,in AJNR 1997 Sep; 18(8)1515-21
T1-weighted three-dimensionalmagnetization transfer MR of thebrain: improved lesion contrastenhancement, by DA. Finelli, in AJNR1998 Jan; 19(1):59-64
Magnetic Resonance of Myelin,Myelination and Myelin Disorders2nd edition, by M.S. van der Knaap,and J Valk
26
MAGNETOM FLASH
Figure 5 (TR 800) loss of gray/white matter contrast
Figure 6 (TR 536, TE 12, Flip angle 90192 x 256) increase in gray / whitematter contrast

Proven outcomes. It’s what we are helping
to deliver right now. Across the entire
healthcare continuum. Outcomes that result from
truly efficient workflow. Outcomes that dramatically
improve your bottom line. Outcomes that lead to
a level of care that feels exceptional to the patient.
And the care provider. Proof positive of the value
of integrating medical technology, IT, management
consulting and services. In a way that only Siemens
can. Visit SiemensMedical.com/proof. See what we
see. Tangible solutions. Proven outcomes.
Siemens Medical Solutions that help
we see a way to do 50% more exams with only 25% more staff
What do you see?
we see a way to increase patient satisfaction by improving scheduling accuracy
we see a way to speed radiology order time by 3 hours
we see a way to get reports to physicians 12 hours faster

The lack of radiation exposure, thepossibility of multi-planar imagingand the wide range of tissue contrasthave made magnetic resonance (MR)imaging an important tool in theevaluation of pediatric diseases.
Siemens organized a workshop onthis topic, which took place in Erlan-gen. Its aims were two-fold. Firstly,to get a better understanding of theuse of MAGNETOM systems in thisarea, and secondly, to get feedbackfrom Siemens’ customers regardingfuture developments which mightimpact on solutions provided bySiemens MR systems.
The workshop was attended by:
Christine HarrisCHOP, Philadelphia
Tamara LeeCHOP, Philadelphia
Dr. Robert ZimmermanCHOP, Philadelphia
Dr. Cornelia CzipullUniversity of Karlsruhe
Dr. Susan PalasisCHOA, Atlanta
Dr. Damien Grattan-SmithCHOA, Atlanta
Dr. Richard JonesCHOA, Atlanta
Dr. Robert OggSt. Judes, Memphis
Dr. Thomas KellerKantonsspital, Baden
Prof. David GadianUniversity College London
Prof. Dr. Ludger SieverdingUniversity of Tuebingen
Prof. Dr. Rudolf StollbergerUniversity of Graz
Prof. Dr. Franz EbnerUniversity of Graz
Prof. Dr. Thomas RupprechtUniversity of Erlangen
Highlights of the meeting
Children’s Hospital ofAtlanta
Dr. Grattan-Smith & Dr. Jones talkedabout their experience in evaluatingrenal perfusion and interpolatingfunctional parameters from theinformation obtained from renalcortex, medulla perfusion (Fig.1).
They believed that a good way tomeasure EF was to measure extrac-tion from blood into the cortex(descending aorta as input function)and from the cortex into the collec-ting system.
The second focus in renal imagingwas to evaluate the ADC (ApparentDiffusion Coefficient) of the kidneyas a marker for renal development.
Dr. Palasis concentrated on spectros-copy of the brain. She classified the use of spectroscopy under thefollowing subgroups :
1. Brain tumors: Diagnosis andcharacterization of tumors in difficultlocations particularly. Delineation of the extent of tumor infiltrationpast obvious anatomic abnormality.Monitoring of tumor progression or response to therapy.
2. Seizures: Localization
3. Ischemia: Prognostication inneonatal hypoxic ischemic injury andpediatric stroke.
4. Metabolic disorders:Diagnosis and characterization.
She emphasized “Short TE” MRspectroscopy as an important tool inthe diagnosis and classification of brain tumors. She mentioned thatmI:Cr ratio, seen with short TEspectroscopy, had predictive valueregarding tumor grade and histology.Also for tectal plate tumors, MR couldpredict aggressive (Fig. 2) or non-aggressive behavior (Fig. 3). Overallshe said that MRS was valuable forthe evaluation of brain tumors andhad high accuracy in predictingtumor grade, adding that both shortand long TE sequences needed to beperformed. She summarized thefuture goals for Siemens in terms ofspectroscopy as :
28
MAGNETOM FLASH
Pediatric MR Workshop

29www.SiemensMedical.com/MAGNETOM-World
PEDIATRIC IMAGING
0 100 200 300 500 700400 600 8000
10
20
30
40
50
60
Time(seconds)
R1(s
ec-1
)
CortexCortex(fit)Renal pelvisRenal pelvis(fit)
Figure 1 Interpolating functionalparameters from renal cortex, me-dulla perfusion.
Figure 2 3 year old girl withvomiting. Tectal plate tumor,spectroscopy shows aggressivemetabolite profile.
Figure 3 9 year old girl with head-aches, tectal plate tumor is seen.Spectroscopy shows non-aggressivemetabolite profile
Long TE SVS
Short TE SVS
Long TE SVS
Short TE SVS

Figure 4
1. To evaluate as much of the brain as possible (2D CSI- 3D CSI),(Fig. 4);
2. To evaluate as muchperipherally as possible;
3. To evaluate tissue microhetero-geneity;
4. To maintain spectral resolution
5. Keep imaging time as short aspossible
Karl-Franzens-University,Graz and LKH / GeneralHospital
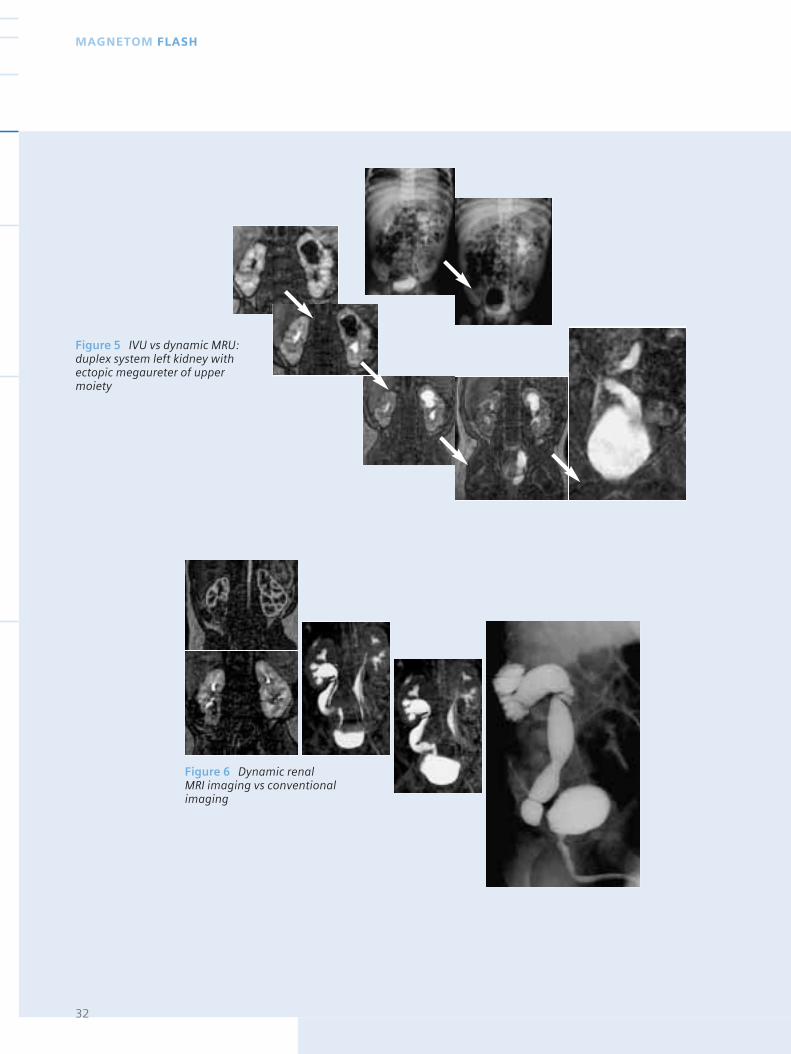
Prof. Dr. Stollberger & Prof. Dr. FranzEbner stressed protocol optimization.They sub-grouped the patients as 0-3 months, 3-12 months, 12-24months and above. Their philosophywas to optimize the spatial resolution,contrast resolution, S/N and coil use.One of his interesting research topics was MR urography, which theysaid could replace the conventionaltechniques. Dr. Ebner defined this technique as “one-stop shop” imaging, replacing conventionaltechniques like IVU, scintigraphy andsonography (Fig. 5-6).
University of Tuebingen
Prof. Dr. Sieverding provided asummary of MR use in pediatriccardiac imaging including morpho-logy, function (contractility, volume,flow, perfusion, viability) and meta-bolism. The sequences used forcongenital heart diseases (Fig. 7) areblack blood sequences, Spin Echoseqeuences, 2D Gradient Echo and3D Gradient Echo sequences. He alsoexpressed his needs in terms of fasterimaging and, in particular, bettermonitoring of the patients.
30
MAGNETOM FLASH
Children’s Hospital ofPhiladelphia
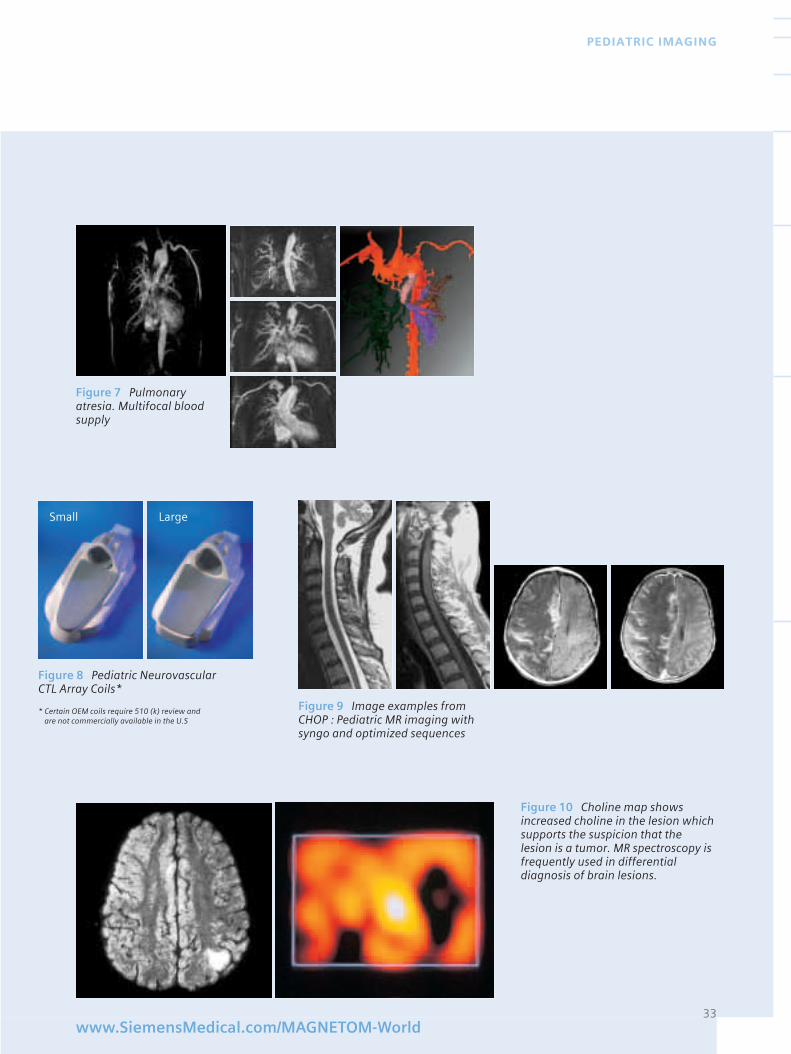
Christine Harris and Tamara Leeintroduced the Children’s Hospital ofPhiladelphia where more than11,000 MR examinations are per-formed in any one year. They wereconvinced that the new dedicatedpediatrics coils from MRI Devices(Fig. 8) – supported with 2002software – would be very useful inroutine practice. In general theyexpressed a need for dedicatedpediatric coils for almost all applica-tions. They mentioned some recentremarkable improvements in imagequality with syngo (Fig. 9).
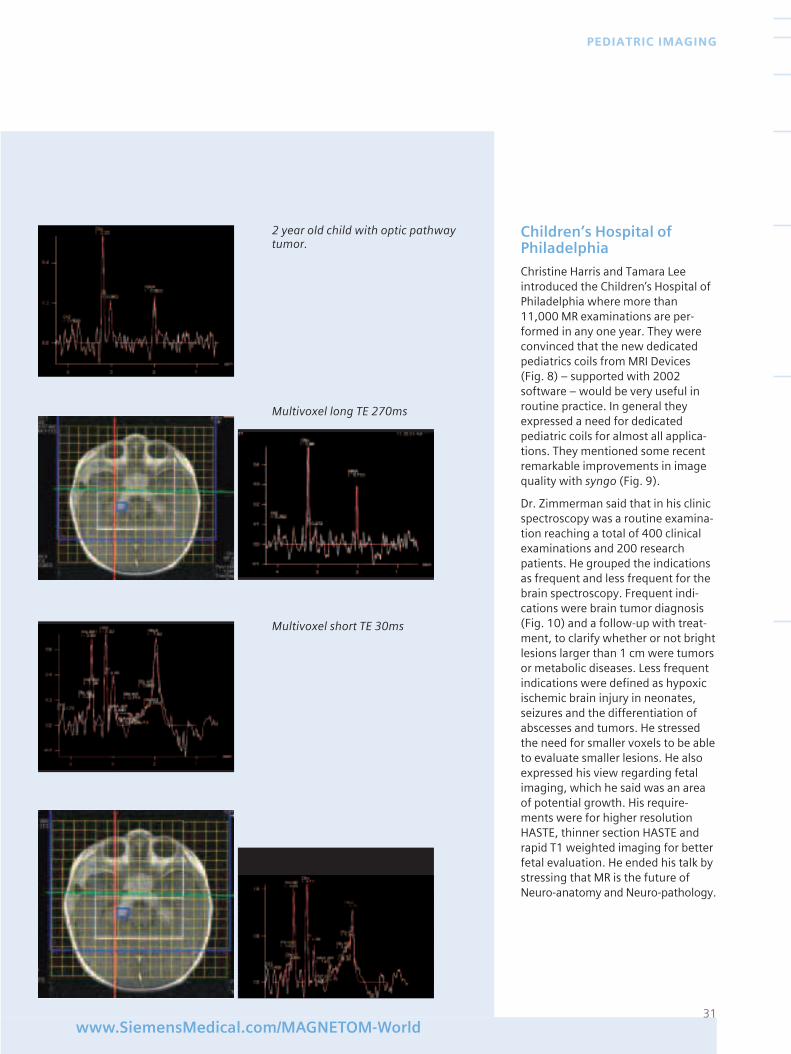
Dr. Zimmerman said that in his clinicspectroscopy was a routine examina-tion reaching a total of 400 clinicalexaminations and 200 researchpatients. He grouped the indicationsas frequent and less frequent for thebrain spectroscopy. Frequent indi-cations were brain tumor diagnosis(Fig. 10) and a follow-up with treat-ment, to clarify whether or not brightlesions larger than 1 cm were tumorsor metabolic diseases. Less frequentindications were defined as hypoxicischemic brain injury in neonates,seizures and the differentiation ofabscesses and tumors. He stressedthe need for smaller voxels to be ableto evaluate smaller lesions. He alsoexpressed his view regarding fetalimaging, which he said was an areaof potential growth. His require-ments were for higher resolutionHASTE, thinner section HASTE andrapid T1 weighted imaging for betterfetal evaluation. He ended his talk bystressing that MR is the future ofNeuro-anatomy and Neuro-pathology.
31www.SiemensMedical.com/MAGNETOM-World
PEDIATRIC IMAGING
2 year old child with optic pathwaytumor.
Multivoxel long TE 270ms
Multivoxel short TE 30ms
32
MAGNETOM FLASH
Figure 5 IVU vs dynamic MRU:duplex system left kidney withectopic megaureter of uppermoiety
Figure 6 Dynamic renal MRI imaging vs conventionalimaging
33www.SiemensMedical.com/MAGNETOM-World
PEDIATRIC IMAGING
Figure 7 Pulmonaryatresia. Multifocal bloodsupply
Figure 8 Pediatric NeurovascularCTL Array Coils*
Figure 9 Image examples fromCHOP : Pediatric MR imaging withsyngo and optimized sequences
Small Large
Figure 10 Choline map showsincreased choline in the lesion whichsupports the suspicion that the lesion is a tumor. MR spectroscopy isfrequently used in differentialdiagnosis of brain lesions.
* Certain OEM coils require 510 (k) review andare not commercially available in the U.S

34
MAGNETOM FLASH
University College London
Prof. Dr. Gadian talked about structure and function relationshipsin children with brain disease. Hestressed three major topics, epilepsy,ischemic disease and specific cogni-tive impairments. He gave examplesof hippocampal sclerosis diagnosisusing T2 mapping (Fig. 11) and alsospectroscopic findings (Fig. 12)related to them. His focus in ischemicdiseases was sickle cell disease (Scd).His conclusion was that Scd patientshad potential for preventive therapy,and perfusion fills a key gap linkingcerebrovascular abnormalities totissue damage. Combined diffusion /perfusion MRI would help withidentification of tissues at risk andcontribute to patient management,including the evaluation of treatmentoutcome. In the area of functionalMRI, Dr. Gadian said that this appli-cation might be used in mapping ofsubclinical/interictal events, presur-gical identification of sensorimotorcortex, presurgical language/memorylateralization and identification ofsites of functional reorganization.
Dr. J. Ogg, from St. Jude Children’sResearch Hospital, talked about themajor research projects in his clinic.He also gave a detailed explanationof the use of fMRI to investigatecognitive deficits in survivors ofchildhood cancer, which he said wasgenuinely feasible (Fig. 13).
Professor Dr. Thomas Rupprecht from Erlangen University gave anexcellent talk on the use of low fieldOpen Systems in the area of pediatricimaging.
Dr. Thomas Keller, from Kantons-spital Baden Hospital, talked aboutfetal imaging in general and fetallung measurements. He also sharedhis experience with other MRsystems.
The workshop was a great success,providing Siemens MR Team thenecessary feedback for future deve-lopment plans. The friendly atmos-phere also strengthened the bondbetween us and our partners, theSiemens customers (Fig. 14).
Figure 11 Hippocampal T2 mappingin hippocampal sclerosis.
Figure 12 Hippocampal sclerosis andspectroscopic findings.
Figure 13 fMRI results. Patients Healthy adults

35www.SiemensMedical.com/MAGNETOM-World
PEDIATRIC IMAGING
Figure 14 The friendly atmospherein the workshop strengthened thebond between us and our partners,The Siemens customers.
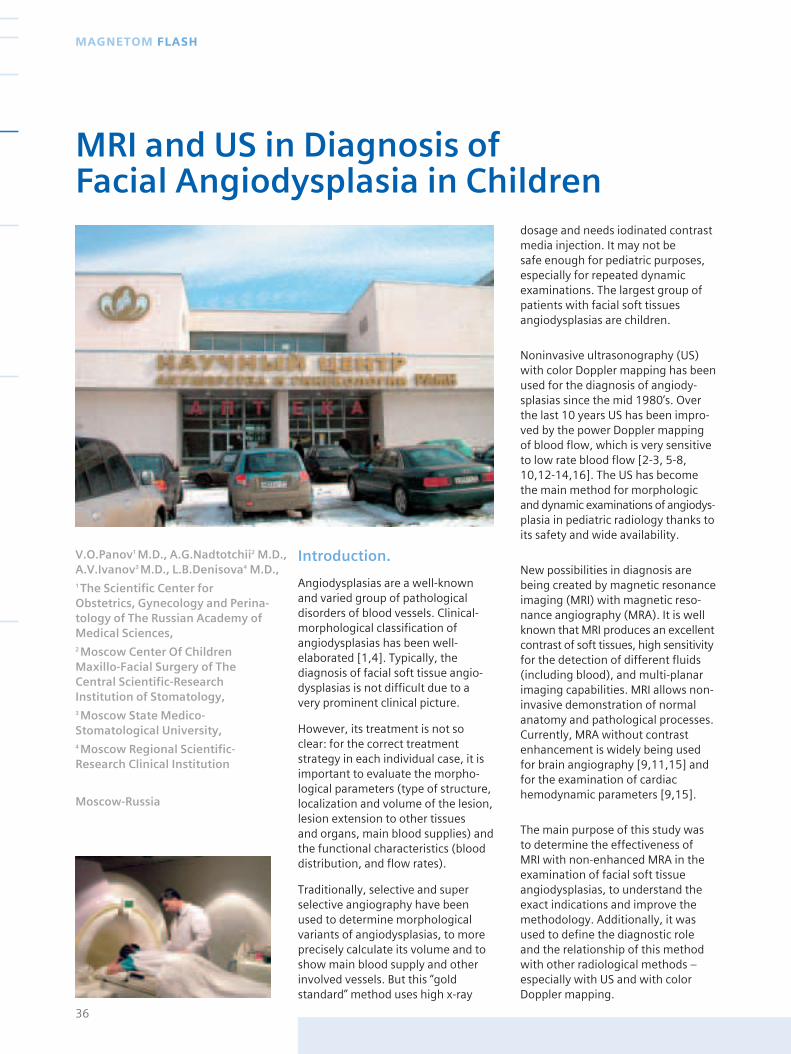
Introduction.
Angiodysplasias are a well-knownand varied group of pathologicaldisorders of blood vessels. Clinical-morphological classification ofangiodysplasias has been well-elaborated [1,4]. Typically, thediagnosis of facial soft tissue angio-dysplasias is not difficult due to avery prominent clinical picture.
However, its treatment is not soclear: for the correct treatmentstrategy in each individual case, it isimportant to evaluate the morpho-logical parameters (type of structure,localization and volume of the lesion,lesion extension to other tissues and organs, main blood supplies) andthe functional characteristics (blooddistribution, and flow rates).
Traditionally, selective and superselective angiography have beenused to determine morphologicalvariants of angiodysplasias, to moreprecisely calculate its volume and toshow main blood supply and otherinvolved vessels. But this “goldstandard” method uses high x-ray
dosage and needs iodinated contrastmedia injection. It may not be safe enough for pediatric purposes,especially for repeated dynamicexaminations. The largest group ofpatients with facial soft tissuesangiodysplasias are children.
Noninvasive ultrasonography (US)with color Doppler mapping has beenused for the diagnosis of angiody-splasias since the mid 1980’s. Overthe last 10 years US has been impro-ved by the power Doppler mappingof blood flow, which is very sensitiveto low rate blood flow [2-3, 5-8,10,12-14,16]. The US has becomethe main method for morphologicand dynamic examinations of angiodys-plasia in pediatric radiology thanks toits safety and wide availability.
New possibilities in diagnosis arebeing created by magnetic resonanceimaging (MRI) with magnetic reso-nance angiography (MRA). It is wellknown that MRI produces an excellentcontrast of soft tissues, high sensitivityfor the detection of different fluids(including blood), and multi-planarimaging capabilities. MRI allows non-invasive demonstration of normalanatomy and pathological processes.Currently, MRA without contrastenhancement is widely being usedfor brain angiography [9,11,15] andfor the examination of cardiachemodynamic parameters [9,15].
The main purpose of this study wasto determine the effectiveness of MRI with non-enhanced MRA in theexamination of facial soft tissueangiodysplasias, to understand theexact indications and improve themethodology. Additionally, it wasused to define the diagnostic roleand the relationship of this methodwith other radiological methods –especially with US and with colorDoppler mapping.
36
MAGNETOM FLASH
MRI and US in Diagnosis of Facial Angiodysplasia in Children
V.O.Panov1 M.D., A.G.Nadtotchii2 M.D.,A.V.Ivanov3 M.D., L.B.Denisova4 M.D.,1 The Scientific Center for Obstetrics, Gynecology and Perina-tology of The Russian Academy ofMedical Sciences, 2 Moscow Center Of Children Maxillo-Facial Surgery of The Central Scientific-Research Institution of Stomatology,3 Moscow State Medico-Stomatological University,4 Moscow Regional Scientific-Research Clinical Institution
Moscow-Russia
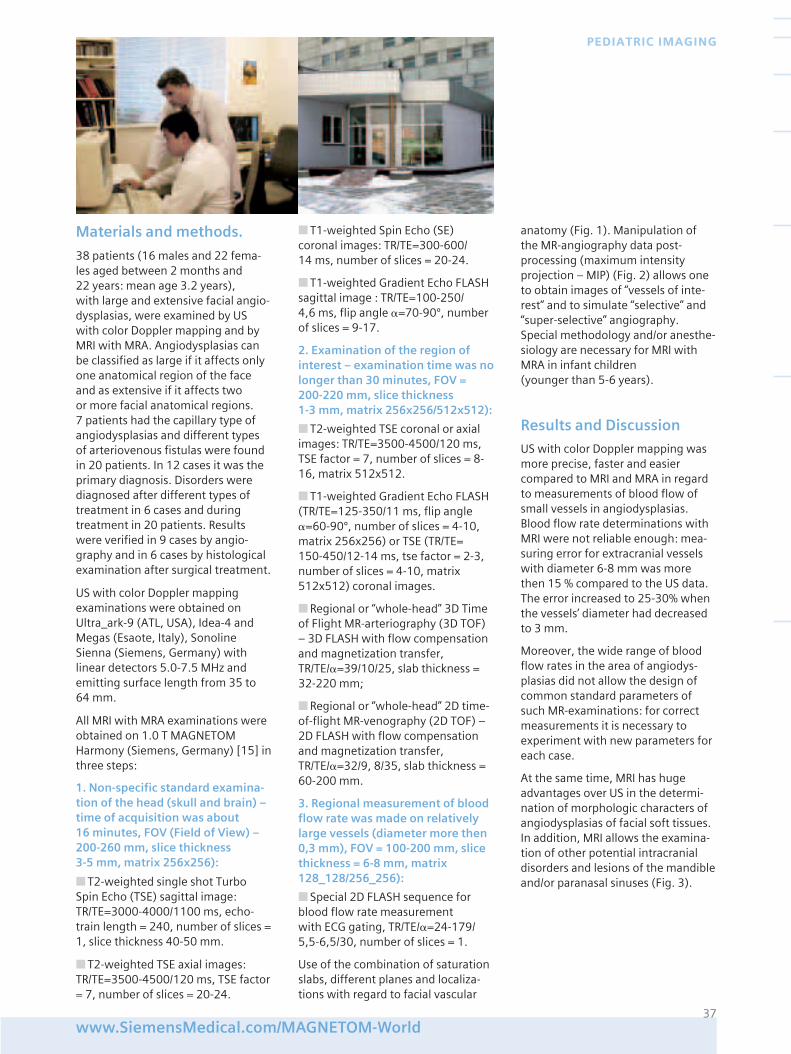
Materials and methods.
38 patients (16 males and 22 fema-les aged between 2 months and 22 years: mean age 3.2 years), with large and extensive facial angio-dysplasias, were examined by USwith color Doppler mapping and byMRI with MRA. Angiodysplasias canbe classified as large if it affects only one anatomical region of the faceand as extensive if it affects two or more facial anatomical regions. 7 patients had the capillary type ofangiodysplasias and different typesof arteriovenous fistulas were foundin 20 patients. In 12 cases it was theprimary diagnosis. Disorders werediagnosed after different types oftreatment in 6 cases and duringtreatment in 20 patients. Resultswere verified in 9 cases by angio-graphy and in 6 cases by histologicalexamination after surgical treatment.
US with color Doppler mappingexaminations were obtained onUltra_ark-9 (ATL, USA), Idea-4 andMegas (Esaote, Italy), SonolineSienna (Siemens, Germany) withlinear detectors 5.0-7.5 MHz andemitting surface length from 35 to64 mm.
All MRI with MRA examinations wereobtained on 1.0 T MAGNETOMHarmony (Siemens, Germany) [15] inthree steps:
1. Non-specific standard examina-tion of the head (skull and brain) –time of acquisition was about 16 minutes, FOV (Field of View) – 200-260 mm, slice thickness 3-5 mm, matrix 256x256):
■ T2-weighted single shot TurboSpin Echo (TSE) sagittal image:TR/TE=3000-4000/1100 ms, echo-train length = 240, number of slices =1, slice thickness 40-50 mm.
■ T2-weighted TSE axial images:TR/TE=3500-4500/120 ms, TSE factor= 7, number of slices = 20-24.
■ T1-weighted Spin Echo (SE)coronal images: TR/TE=300-600/14 ms, number of slices = 20-24.
■ T1-weighted Gradient Echo FLASHsagittal image : TR/TE=100-250/4,6 ms, flip angle �=70-90º, numberof slices = 9-17.
2. Examination of the region ofinterest – examination time was nolonger than 30 minutes, FOV = 200-220 mm, slice thickness 1-3 mm, matrix 256x256/512x512):
■ T2-weighted TSE coronal or axialimages: TR/TE=3500-4500/120 ms,TSE factor = 7, number of slices = 8-16, matrix 512x512.
■ T1-weighted Gradient Echo FLASH(TR/TE=125-350/11 ms, flip angle�=60-90º, number of slices = 4-10,matrix 256x256) or TSE (TR/TE=150-450/12-14 ms, tse factor = 2-3,number of slices = 4-10, matrix512x512) coronal images.
■ Regional or “whole-head” 3D Timeof Flight MR-arteriography (3D TOF)– 3D FLASH with flow compensationand magnetization transfer,TR/TE/�=39/10/25, slab thickness =32-220 mm;
■ Regional or “whole-head” 2D time-of-flight MR-venography (2D TOF) –2D FLASH with flow compensationand magnetization transfer,TR/TE/�=32/9, 8/35, slab thickness =60-200 mm.
3. Regional measurement of bloodflow rate was made on relativelylarge vessels (diameter more then0,3 mm), FOV = 100-200 mm, slicethickness = 6-8 mm, matrix128_128/256_256):
■ Special 2D FLASH sequence forblood flow rate measurement with ECG gating, TR/TE/�=24-179/5,5-6,5/30, number of slices = 1.
Use of the combination of saturationslabs, different planes and localiza-tions with regard to facial vascular
anatomy (Fig. 1). Manipulation ofthe MR-angiography data post-processing (maximum intensityprojection – MIP) (Fig. 2) allows oneto obtain images of “vessels of inte-rest” and to simulate “selective” and“super-selective” angiography.Special methodology and/or anesthe-siology are necessary for MRI withMRA in infant children (younger than 5-6 years).
Results and Discussion
US with color Doppler mapping wasmore precise, faster and easiercompared to MRI and MRA in regardto measurements of blood flow ofsmall vessels in angiodysplasias.Blood flow rate determinations withMRI were not reliable enough: mea-suring error for extracranial vesselswith diameter 6-8 mm was morethen 15 % compared to the US data.The error increased to 25-30% whenthe vessels’ diameter had decreasedto 3 mm.
Moreover, the wide range of bloodflow rates in the area of angiodys-plasias did not allow the design ofcommon standard parameters ofsuch MR-examinations: for correctmeasurements it is necessary toexperiment with new parameters foreach case.
At the same time, MRI has hugeadvantages over US in the determi-nation of morphologic characters ofangiodysplasias of facial soft tissues.In addition, MRI allows the examina-tion of other potential intracranialdisorders and lesions of the mandibleand/or paranasal sinuses (Fig. 3).
37www.SiemensMedical.com/MAGNETOM-World
PEDIATRIC IMAGING
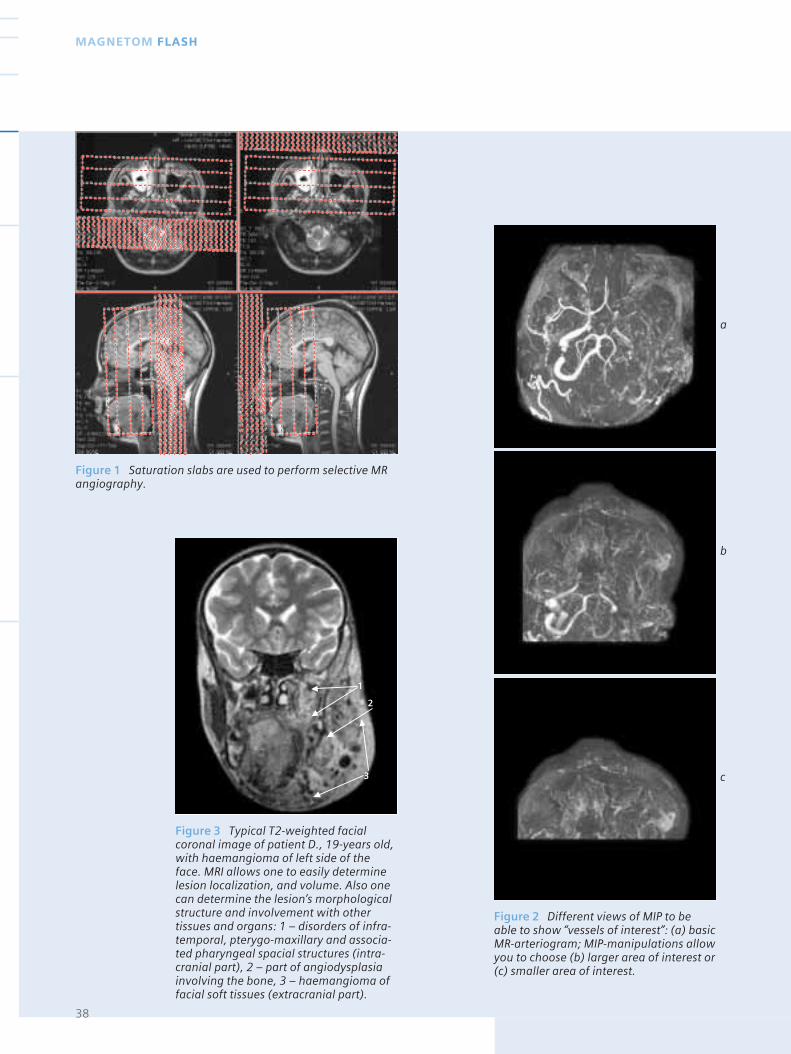
Figure 1 Saturation slabs are used to perform selective MRangiography.
Figure 2 Different views of MIP to beable to show “vessels of interest”: (a) basicMR-arteriogram; MIP-manipulations allowyou to choose (b) larger area of interest or(c) smaller area of interest.
Figure 3 Typical T2-weighted facialcoronal image of patient D., 19-years old,with haemangioma of left side of theface. MRI allows one to easily determinelesion localization, and volume. Also onecan determine the lesion’s morphologicalstructure and involvement with othertissues and organs: 1 – disorders of infra-temporal, pterygo-maxillary and associa-ted pharyngeal spacial structures (intra-cranial part), 2 – part of angiodysplasiainvolving the bone, 3 – haemangioma offacial soft tissues (extracranial part).
38
MAGNETOM FLASH
a
b
c
1
3
2
39www.SiemensMedical.com/MAGNETOM-World
PEDIATRIC IMAGING
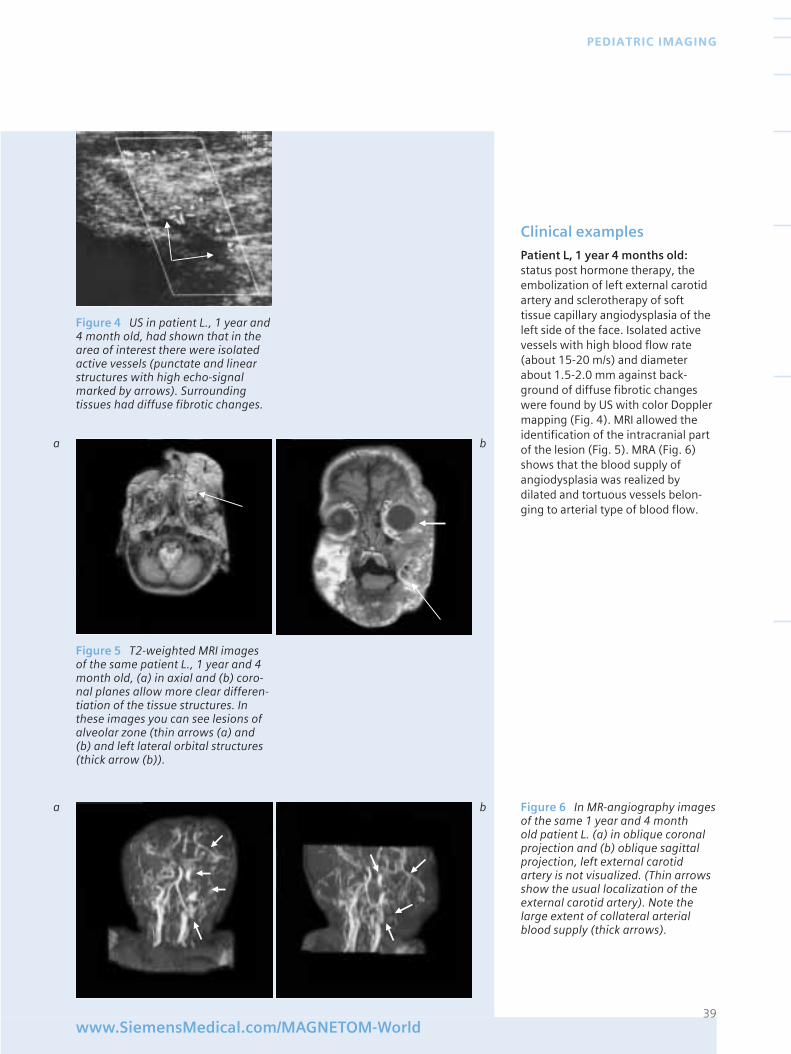
Clinical examples
Patient L, 1 year 4 months old:status post hormone therapy, theembolization of left external carotidartery and sclerotherapy of softtissue capillary angiodysplasia of theleft side of the face. Isolated activevessels with high blood flow rate(about 15-20 m/s) and diameterabout 1.5-2.0 mm against back-ground of diffuse fibrotic changeswere found by US with color Dopplermapping (Fig. 4). MRI allowed theidentification of the intracranial partof the lesion (Fig. 5). MRA (Fig. 6)shows that the blood supply ofangiodysplasia was realized bydilated and tortuous vessels belon-ging to arterial type of blood flow.
Figure 4 US in patient L., 1 year and4 month old, had shown that in thearea of interest there were isolatedactive vessels (punctate and linearstructures with high echo-signalmarked by arrows). Surroundingtissues had diffuse fibrotic changes.
Figure 5 T2-weighted MRI imagesof the same patient L., 1 year and 4month old, (a) in axial and (b) coro-nal planes allow more clear differen-tiation of the tissue structures. Inthese images you can see lesions ofalveolar zone (thin arrows (a) and(b) and left lateral orbital structures(thick arrow (b)).
Figure 6 In MR-angiography imagesof the same 1 year and 4 month old patient L. (a) in oblique coronalprojection and (b) oblique sagittalprojection, left external carotidartery is not visualized. (Thin arrowsshow the usual localization of theexternal carotid artery). Note thelarge extent of collateral arterialblood supply (thick arrows).
a b
a b
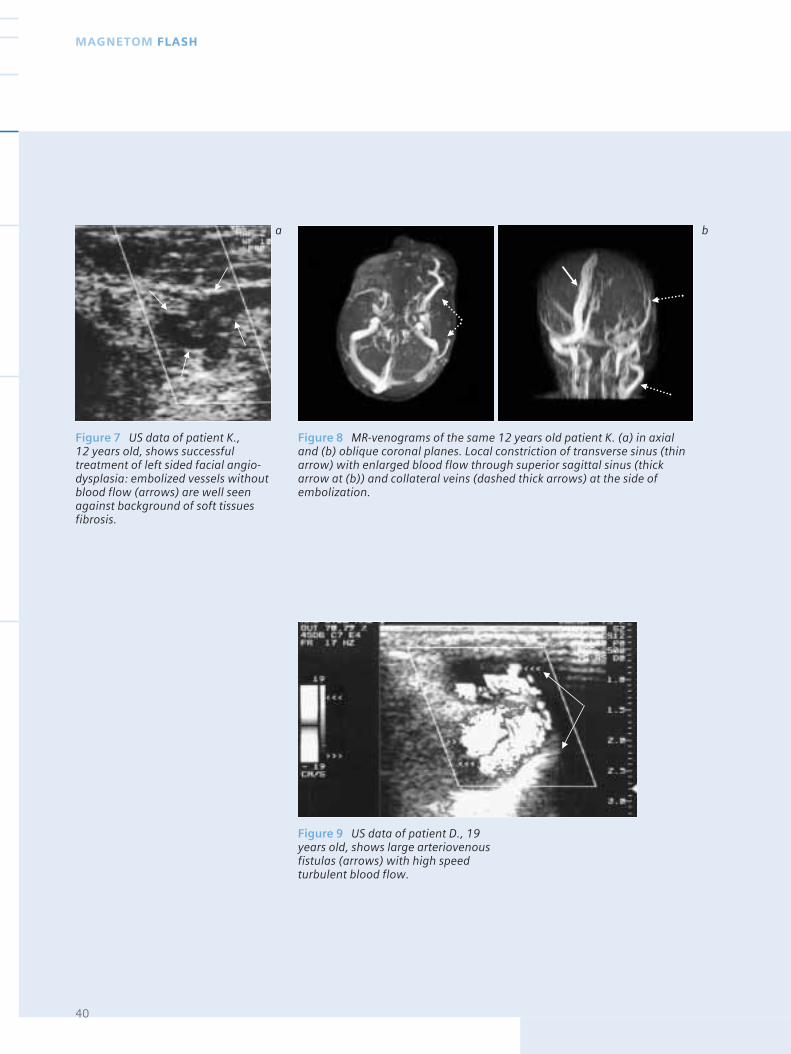
Figure 7 US data of patient K., 12 years old, shows successfultreatment of left sided facial angio-dysplasia: embolized vessels withoutblood flow (arrows) are well seenagainst background of soft tissuesfibrosis.
40
MAGNETOM FLASH
Figure 8 MR-venograms of the same 12 years old patient K. (a) in axialand (b) oblique coronal planes. Local constriction of transverse sinus (thinarrow) with enlarged blood flow through superior sagittal sinus (thickarrow at (b)) and collateral veins (dashed thick arrows) at the side ofembolization.
a b
Figure 9 US data of patient D., 19years old, shows large arteriovenousfistulas (arrows) with high speedturbulent blood flow.
41www.SiemensMedical.com/MAGNETOM-World
PEDIATRIC IMAGING
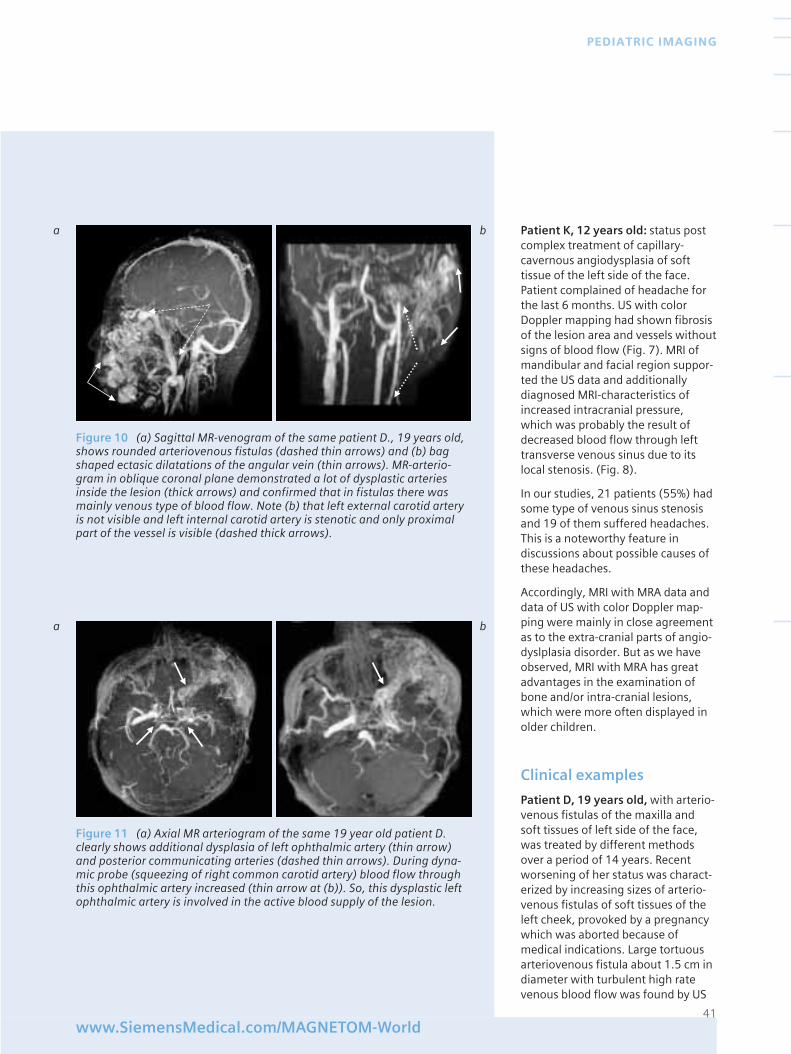
Patient K, 12 years old: status postcomplex treatment of capillary-cavernous angiodysplasia of softtissue of the left side of the face.Patient complained of headache forthe last 6 months. US with colorDoppler mapping had shown fibrosisof the lesion area and vessels withoutsigns of blood flow (Fig. 7). MRI ofmandibular and facial region suppor-ted the US data and additionallydiagnosed MRI-characteristics ofincreased intracranial pressure,which was probably the result ofdecreased blood flow through lefttransverse venous sinus due to itslocal stenosis. (Fig. 8).
In our studies, 21 patients (55%) hadsome type of venous sinus stenosisand 19 of them suffered headaches.This is a noteworthy feature indiscussions about possible causes ofthese headaches.
Accordingly, MRI with MRA data anddata of US with color Doppler map-ping were mainly in close agreementas to the extra-cranial parts of angio-dyslplasia disorder. But as we haveobserved, MRI with MRA has greatadvantages in the examination ofbone and/or intra-cranial lesions,which were more often displayed inolder children.
Clinical examples
Patient D, 19 years old, with arterio-venous fistulas of the maxilla andsoft tissues of left side of the face,was treated by different methodsover a period of 14 years. Recentworsening of her status was charact-erized by increasing sizes of arterio-venous fistulas of soft tissues of theleft cheek, provoked by a pregnancywhich was aborted because ofmedical indications. Large tortuousarteriovenous fistula about 1.5 cm indiameter with turbulent high ratevenous blood flow was found by US
a b
a b
Figure 10 (a) Sagittal MR-venogram of the same patient D., 19 years old,shows rounded arteriovenous fistulas (dashed thin arrows) and (b) bagshaped ectasic dilatations of the angular vein (thin arrows). MR-arterio-gram in oblique coronal plane demonstrated a lot of dysplastic arteriesinside the lesion (thick arrows) and confirmed that in fistulas there wasmainly venous type of blood flow. Note (b) that left external carotid arteryis not visible and left internal carotid artery is stenotic and only proximalpart of the vessel is visible (dashed thick arrows).
Figure 11 (a) Axial MR arteriogram of the same 19 year old patient D.clearly shows additional dysplasia of left ophthalmic artery (thin arrow)and posterior communicating arteries (dashed thin arrows). During dyna-mic probe (squeezing of right common carotid artery) blood flow throughthis ophthalmic artery increased (thin arrow at (b)). So, this dysplastic leftophthalmic artery is involved in the active blood supply of the lesion.
42
MAGNETOM FLASH
Research of patient’s history wasundertaken after MRI examinationand revealed that at 2 years old shehad been surgically treated becauseof the exophytic capillary hemangioma(most likely an angiodysplasia!) ofthe soft tissues of the left cheek. Thiscase illustrates a system characte-ristic of this lesion: angiodysplasiarealized in different (and distant)anatomical areas.
In our opinion this observation israther a special case. This is confir-med by our results: in 5 patients(13% of all examinations), MRI withMRA had found 4 cases of intracranialarterial anomalies and 1 case ofmeningial venous malformation.
Moreover, in our observations of 8 patients (about 19% of allexaminations), MRI with MRA hadalso identified the following arterialabnormalities:
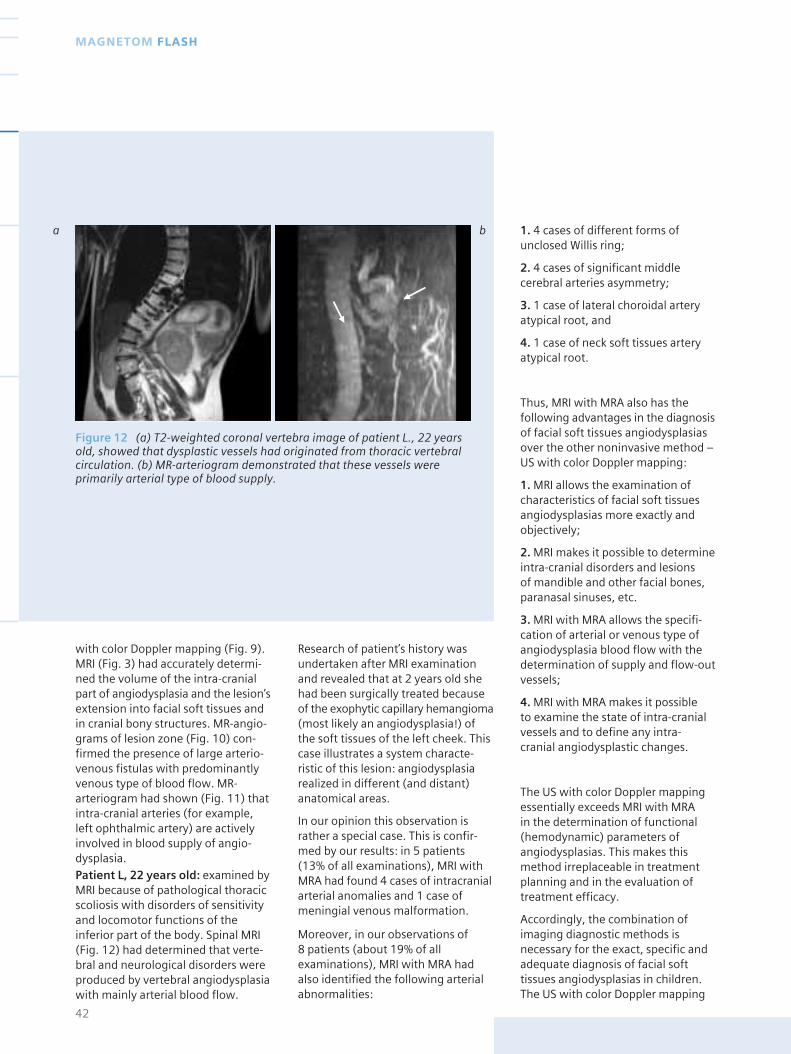
with color Doppler mapping (Fig. 9).MRI (Fig. 3) had accurately determi-ned the volume of the intra-cranialpart of angiodysplasia and the lesion’sextension into facial soft tissues andin cranial bony structures. MR-angio-grams of lesion zone (Fig. 10) con-firmed the presence of large arterio-venous fistulas with predominantlyvenous type of blood flow. MR-arteriogram had shown (Fig. 11) thatintra-cranial arteries (for example,left ophthalmic artery) are activelyinvolved in blood supply of angio-dysplasia.Patient L, 22 years old: examined byMRI because of pathological thoracicscoliosis with disorders of sensitivityand locomotor functions of theinferior part of the body. Spinal MRI(Fig. 12) had determined that verte-bral and neurological disorders wereproduced by vertebral angiodysplasiawith mainly arterial blood flow.
1. 4 cases of different forms ofunclosed Willis ring;
2. 4 cases of significant middlecerebral arteries asymmetry;
3. 1 case of lateral choroidal arteryatypical root, and
4. 1 case of neck soft tissues arteryatypical root.
Thus, MRI with MRA also has thefollowing advantages in the diagnosisof facial soft tissues angiodysplasiasover the other noninvasive method –US with color Doppler mapping:
1. MRI allows the examination ofcharacteristics of facial soft tissuesangiodysplasias more exactly andobjectively;
2. MRI makes it possible to determineintra-cranial disorders and lesions of mandible and other facial bones,paranasal sinuses, etc.
3. MRI with MRA allows the specifi-cation of arterial or venous type ofangiodysplasia blood flow with thedetermination of supply and flow-outvessels;
4. MRI with MRA makes it possible to examine the state of intra-cranialvessels and to define any intra-cranial angiodysplastic changes.
The US with color Doppler mappingessentially exceeds MRI with MRA in the determination of functional(hemodynamic) parameters ofangiodysplasias. This makes thismethod irreplaceable in treatmentplanning and in the evaluation oftreatment efficacy.
Accordingly, the combination ofimaging diagnostic methods isnecessary for the exact, specific andadequate diagnosis of facial softtissues angiodysplasias in children.The US with color Doppler mapping
a b
Figure 12 (a) T2-weighted coronal vertebra image of patient L., 22 yearsold, showed that dysplastic vessels had originated from thoracic vertebralcirculation. (b) MR-arteriogram demonstrated that these vessels wereprimarily arterial type of blood supply.
43www.SiemensMedical.com/MAGNETOM-World
PEDIATRIC IMAGING
and the MRI with MRA have to be atthe top of the list of such methods.
Moreover, our experience ofexaminations of patients with largeand extensive facial angiodysplasiasallows one to establish that facialangiodysplasias in 31% of cases (13 patients out of 38) were only theexternal manifestations of the seg-mental angiodysplasias. So, “whole-brain” (even “whole-body” – if it ispossible) MRI with MRA is anexpedient action in all cases of largeand extensive facial angidysplasias in children when the “object” ofexamination is small.
Literature[ 1 ] Dan V.N. Diagnosis and surgerytreatment of congenital angiodysplasias.// Thesis for a Medical Doctor’s degree. –Moscow-Russia. – 1989. - in Russian.
[ 2 ] Diyakova S.V., Shafranov S.V.,Nadtotchii A.G. et all. Diagnosis andtreatment of large and extensive heman-giom children mandible-facial region.//Methodological recommendations. –Moscow–Russia: MSMSU. - 1996. – 11 p. - in Russian.
[ 3 ] Kulakov O.B., Diyakova S.V., KizyunL.Z., Nadtotchii A.G., Ivanov A.V. Tacticsof treatment of vascular neoplasm oflabrum and labium of children.// InAbstracts of the I Republican Conference“Stomatology and children health”. –Moscow-Russia. - 1996. - p.79. – inRussian.
[ 4 ] Milovanov A.P. Pathomorphology ofextremity angiodysplasias. – Moscow-Russia: Medicine. - 1974. – in Russian.
[ 5 ] Nadtotchii A.G. Ultrasonographyexamination at the stage of diagnosisand treatment of vascular neoplasm offace and neck of children.// IV Meeting ofRussian Association of Physicians ofUltrasound diagnosis in perinatology andgynecoclogy. – Nijnii Novgorod-Russia. -1997. – in Russian.
[ 6 ] Nadtotchii A.G., Dyakova S.V.,Kulakov O.B., Shafranov V.V., PolyaevYu.A., Konstatntinov K.V., NikanorovA.Yu. Hemodynamic in vascular neo-plasm of soft tissues face and neck of
children: angiography and doppler-ographafy comparison.// Visualisation inclinic. – Russia-Moscow: Medicine. -1994. -_4. – p.26-29. – in Russian.
[ 7 ] Nadtotchii A.G.,Dyakova S.V.,Kulakov O.B., Elkonin A.B. Traditionalusltrasonography and dopplerography indiagnosis of vascular neoplasm ofmandible-facial region in children.// TheStomatology. – 1994. -_3. –p.73-77. – inRussian.
[ 8 ] Nadtotchii A.G., Panov V.O., IvanovA.V. Facial angiodysplasia in children:local manifestation of system vascularlesion?// In Abstracts of VII InternationalConference of Mandible-Facial surgeonsand stomatologists. – Sanct-Peterburg-Russia. - 2002. – p.107. – in Russian.
[ 9 ] Edelman R.R., Hesselink J.R., ZlatkinM.B. Clinical Magnetic Resonance Ima-ging. - Philadelphia-USA: W.B.SaundersCompany. – 1996. – p.2190.
[ 10 ] Kramer L.A., Crino J.P., Slopis J.,Hankins L., Yeakley J. Capillary heman-gioma of the neck: prenatal MR findings.//Am.J.Neuroradiol. – 1997. - Sep; 18(8).–p. 1432-1434.
[ 11 ] Panov V., Ivanov A., Inaneishvily M.,Nadtotchi A. Facial haemangiomas asexternal manifestation of the segmentalangiodysplasia: MRI and MRA diagnosisadvantages.// European Radiology. -February 2002, vol.12, suppl.1, p.269 /B-0719/
[ 12 ] Orvieto _., Zago S., Pollinzi V.,Trasforini G. An unusual case of intramu-scular hemangioma. // Pathologica. –1997. - Apr; 89(2). –p.189-92.
[ 13 ] Roebuck D.J., Ahuja A.T.Hemangioendothelioma of the parotidgland in infants: sonography and correla-tive MR imaging.// _m.J.Neuroradiol. –2000. - Jan; 21(1). – p.219-23.
[ 14 ] Robertson R.L., Robson C.D., Barnes P.D., Burrows P.E. Head and neckvascular anomalies of childhood.//Neuroimaging.Clin.N.Am. – 1999. - Feb;9(1). -p.115-32.
[ 15 ] Siemens MAGETOM SymphonyApplication Guide Numaris 3.5 VA11F,2001
[ 16 ] Yang W.T., Ahuja A., Metreweli C.Sonographic features of head and neck hemangiomas and vascularmalformations: review of 23 patients. //J.Ultrasound.Med. – 1997. -Jan; 16(1).–p.39-44.
Information about the Institution
Official name – The ScientificCenter for Obstetrics, Gynecologyand Perinatology of The RussianAcademy of Medical Sciences.(Director V.I.Kulakov is a Member ofthe Academy of Medical Sciences).
Internet site of the Center:www.pregnancy.ru
Beds – 300
In-patient throughput – 12,700 peryear (including 2,500 in obstetrics)and up to 40,000 outpatients peryear – data are for the last year.The profile of The Center is revealedby its name. It covers obstetrics, gynecology andperinatology – all types of obstetriccare. The Center is the leadinginstitution in the Russian Federa-tion (and ex-USSR countries) forsolving problems relating towomen’s genital functions, gyne-cological endocrinology (includingcomplex treatment during clima-cteric and menopause), non-onco-logy surgical gynecology, childgynecology (including uro-genitalsystem development anomalies and their surgical correction) andnewborn pathology treatment.
MR-patient throughput: one sessionfrom 9:00 till 15:00 allows theexamination of 12 patients.Currently the work is organized intwo sessions but in reality themaximum number of patients perday is 18 patients, including up to 3 pregnant patients with theirfetuses.
The Center is predominantlyfinanced by the government via the Medical Academy of MedicalSciences, plus self-financingactivities.
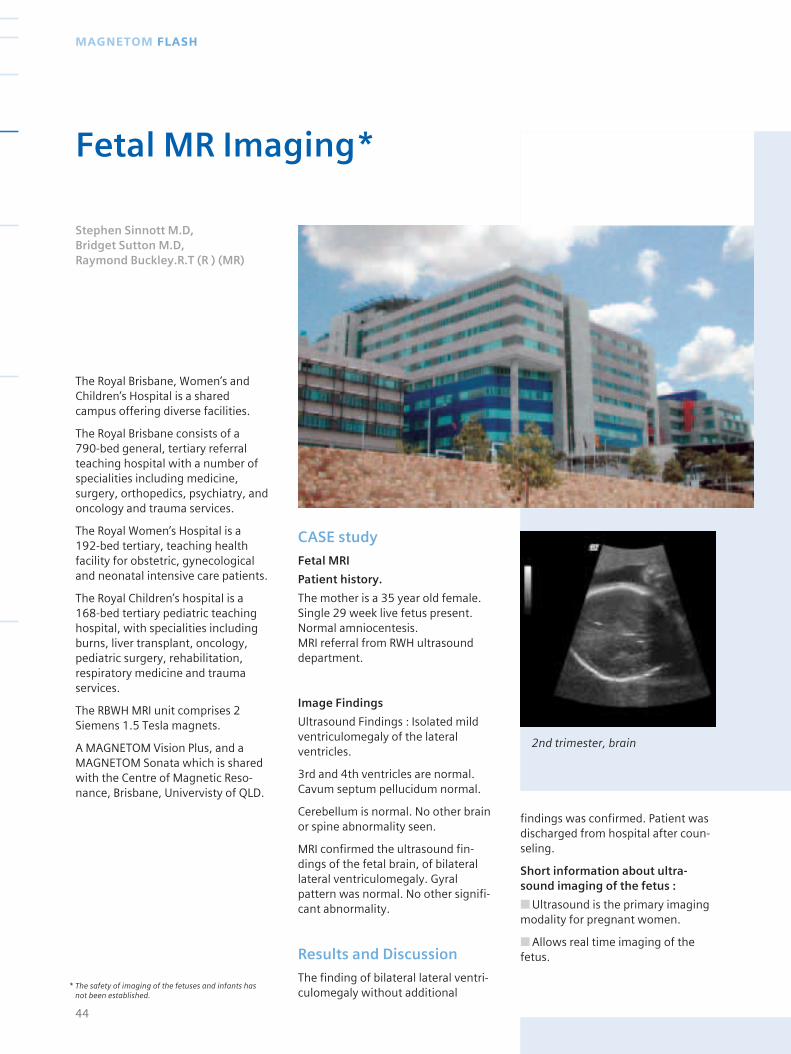
findings was confirmed. Patient wasdischarged from hospital after coun-seling.
Short information about ultra-sound imaging of the fetus :
■ Ultrasound is the primary imagingmodality for pregnant women.
■ Allows real time imaging of thefetus.
The Royal Brisbane, Women’s andChildren’s Hospital is a sharedcampus offering diverse facilities.
The Royal Brisbane consists of a 790-bed general, tertiary referralteaching hospital with a number ofspecialities including medicine,surgery, orthopedics, psychiatry, andoncology and trauma services.
The Royal Women’s Hospital is a 192-bed tertiary, teaching healthfacility for obstetric, gynecologicaland neonatal intensive care patients.
The Royal Children’s hospital is a 168-bed tertiary pediatric teachinghospital, with specialities includingburns, liver transplant, oncology,pediatric surgery, rehabilitation,respiratory medicine and traumaservices.
The RBWH MRI unit comprises 2Siemens 1.5 Tesla magnets.
A MAGNETOM Vision Plus, and aMAGNETOM Sonata which is sharedwith the Centre of Magnetic Reso-nance, Brisbane, Univervisty of QLD.
CASE study
Fetal MRI
Patient history.
The mother is a 35 year old female.Single 29 week live fetus present.Normal amniocentesis. MRI referral from RWH ultrasounddepartment.
Image Findings
Ultrasound Findings : Isolated mildventriculomegaly of the lateralventricles.
3rd and 4th ventricles are normal.Cavum septum pellucidum normal.
Cerebellum is normal. No other brainor spine abnormality seen.
MRI confirmed the ultrasound fin-dings of the fetal brain, of bilaterallateral ventriculomegaly. Gyralpattern was normal. No other signifi-cant abnormality.
Results and Discussion
The finding of bilateral lateral ventri-culomegaly without additional
44
MAGNETOM FLASH
Fetal MR Imaging*
Stephen Sinnott M.D, Bridget Sutton M.D, Raymond Buckley.R.T (R ) (MR)
2nd trimester, brain
* The safety of imaging of the fetuses and infants hasnot been established.
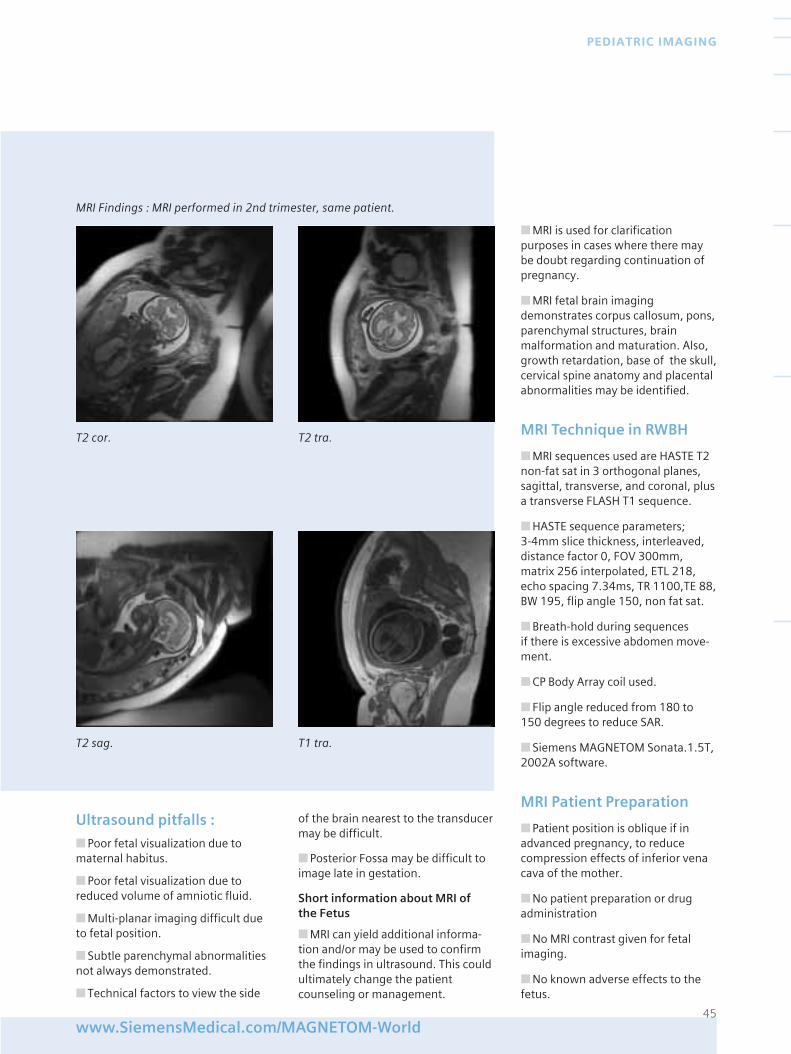
Ultrasound pitfalls :
■ Poor fetal visualization due tomaternal habitus.
■ Poor fetal visualization due toreduced volume of amniotic fluid.
■ Multi-planar imaging difficult dueto fetal position.
■ Subtle parenchymal abnormalitiesnot always demonstrated.
■ Technical factors to view the side
of the brain nearest to the transducermay be difficult.
■ Posterior Fossa may be difficult toimage late in gestation.
Short information about MRI of the Fetus
■ MRI can yield additional informa-tion and/or may be used to confirmthe findings in ultrasound. This couldultimately change the patientcounseling or management.
■ MRI is used for clarificationpurposes in cases where there maybe doubt regarding continuation ofpregnancy.
■ MRI fetal brain imagingdemonstrates corpus callosum, pons,parenchymal structures, brainmalformation and maturation. Also,growth retardation, base of the skull,cervical spine anatomy and placentalabnormalities may be identified.
MRI Technique in RWBH
■ MRI sequences used are HASTE T2non-fat sat in 3 orthogonal planes,sagittal, transverse, and coronal, plusa transverse FLASH T1 sequence.
■ HASTE sequence parameters; 3-4mm slice thickness, interleaved,distance factor 0, FOV 300mm,matrix 256 interpolated, ETL 218,echo spacing 7.34ms, TR 1100,TE 88,BW 195, flip angle 150, non fat sat.
■ Breath-hold during sequences if there is excessive abdomen move-ment.
■ CP Body Array coil used.
■ Flip angle reduced from 180 to150 degrees to reduce SAR.
■ Siemens MAGNETOM Sonata.1.5T,2002A software.
MRI Patient Preparation
■ Patient position is oblique if inadvanced pregnancy, to reducecompression effects of inferior venacava of the mother.
■ No patient preparation or drugadministration
■ No MRI contrast given for fetalimaging.
■ No known adverse effects to thefetus.
45www.SiemensMedical.com/MAGNETOM-World
PEDIATRIC IMAGING
MRI Findings : MRI performed in 2nd trimester, same patient.
T2 cor. T2 tra.
T2 sag. T1 tra.
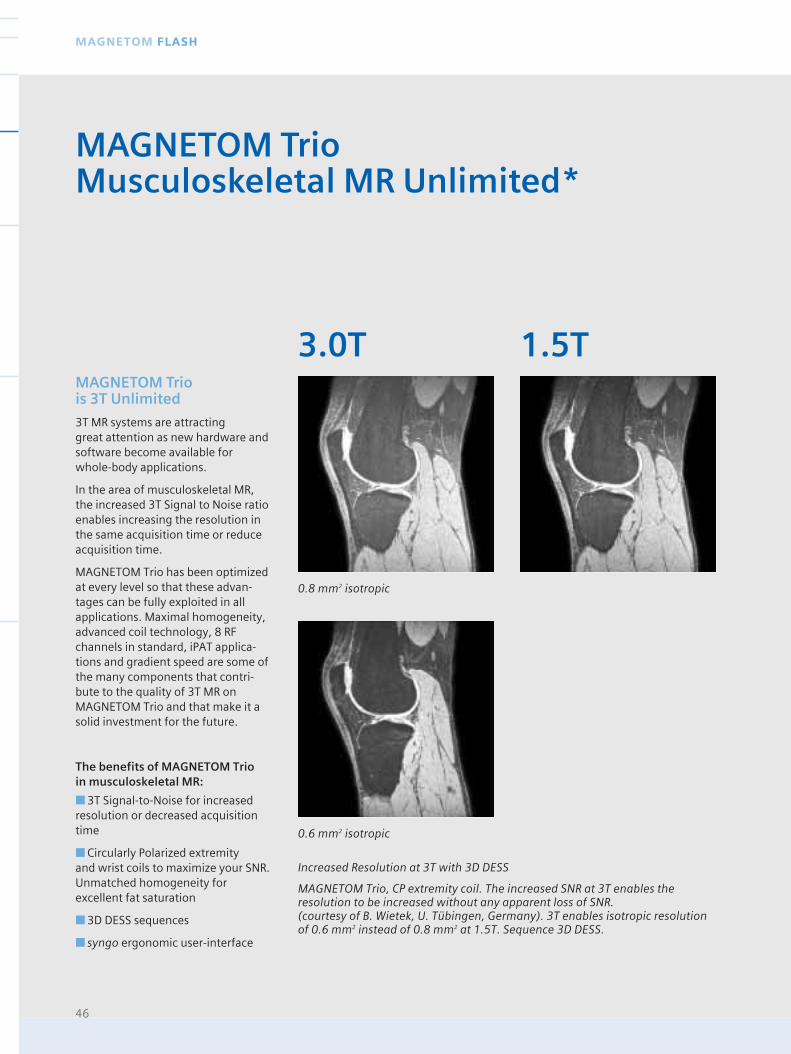
46
MAGNETOM FLASH
Increased Resolution at 3T with 3D DESS
MAGNETOM Trio, CP extremity coil. The increased SNR at 3T enables theresolution to be increased without any apparent loss of SNR. (courtesy of B. Wietek, U. Tübingen, Germany). 3T enables isotropic resolutionof 0.6 mm2 instead of 0.8 mm2 at 1.5T. Sequence 3D DESS.
MAGNETOM Trio is 3T Unlimited
3T MR systems are attracting great attention as new hardware andsoftware become available for whole-body applications.
In the area of musculoskeletal MR,the increased 3T Signal to Noise ratioenables increasing the resolution inthe same acquisition time or reduceacquisition time.
MAGNETOM Trio has been optimizedat every level so that these advan-tages can be fully exploited in allapplications. Maximal homogeneity,advanced coil technology, 8 RFchannels in standard, iPAT applica-tions and gradient speed are some ofthe many components that contri-bute to the quality of 3T MR onMAGNETOM Trio and that make it asolid investment for the future.
The benefits of MAGNETOM Trio in musculoskeletal MR:
■ 3T Signal-to-Noise for increasedresolution or decreased acquisitiontime
■ Circularly Polarized extremity and wrist coils to maximize your SNR.Unmatched homogeneity forexcellent fat saturation
■ 3D DESS sequences
■ syngo ergonomic user-interface
MAGNETOM TrioMusculoskeletal MR Unlimited*
0.8 mm2 isotropic
0.6 mm2 isotropic
3.0T 1.5T
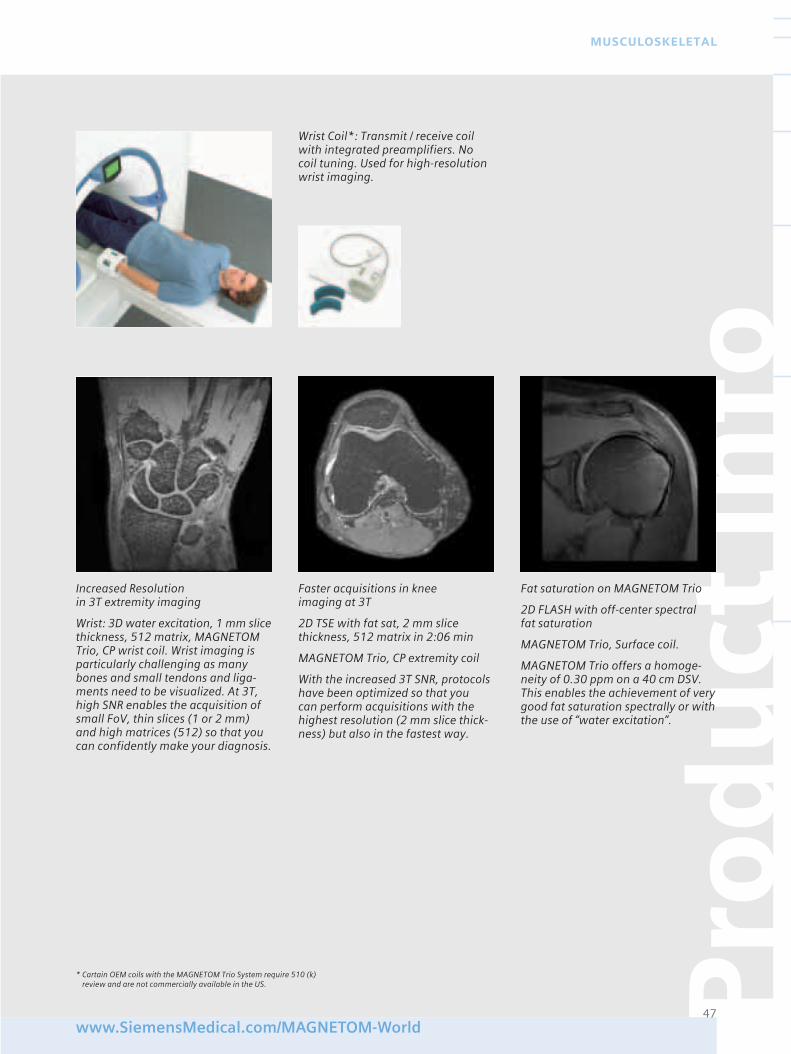
Pro
du
ct In
fo
47www.SiemensMedical.com/MAGNETOM-World
MUSCULOSKELETAL
Wrist Coil*: Transmit / receive coilwith integrated preamplifiers. Nocoil tuning. Used for high-resolutionwrist imaging.
Increased Resolution in 3T extremity imaging
Wrist: 3D water excitation, 1 mm slicethickness, 512 matrix, MAGNETOMTrio, CP wrist coil. Wrist imaging isparticularly challenging as manybones and small tendons and liga-ments need to be visualized. At 3T,high SNR enables the acquisition ofsmall FoV, thin slices (1 or 2 mm)and high matrices (512) so that youcan confidently make your diagnosis.
Faster acquisitions in knee imaging at 3T
2D TSE with fat sat, 2 mm slicethickness, 512 matrix in 2:06 min
MAGNETOM Trio, CP extremity coil
With the increased 3T SNR, protocolshave been optimized so that you can perform acquisitions with thehighest resolution (2 mm slice thick-ness) but also in the fastest way.
Fat saturation on MAGNETOM Trio
2D FLASH with off-center spectral fat saturation
MAGNETOM Trio, Surface coil.
MAGNETOM Trio offers a homoge-neity of 0.30 ppm on a 40 cm DSV.This enables the achievement of verygood fat saturation spectrally or withthe use of “water excitation”.
* Cartain OEM coils with the MAGNETOM Trio System require 510 (k)review and are not commercially available in the US.
The elbow is a difficult joint to imagebecause of its complexity and variousanatomical variants. This articlereviews the basic cross-sectionalanatomy of the elbow joint, technicalparameters, technical factors andindications of the elbow that mostclinicians refer patients for an MRIscan. Imaging of the elbow must bedone keeping in mind the normalanatomy, specific pathology reques-ted, and the resolution and visualiza-tion of these anatomical structureswith a variety of planes and pulsesequences. This combination shouldresult in obtaining an accuratediagnosis for the patient.
Magnetic Resonance Imaging of the elbow joint presents uniquechallenges:
a) Anatomical structures are muchsmaller than other larger joints suchas the knee or shoulder. Therefore, it demands high-resolution images,defined as: thin cuts (2-4mm), highmatrices (256x256 or higher) andsmall Fields of View (10-14cms). Thiscombination results in very smallpixels.
b) The most comfortable position forthe patient is supine with the arms tothe side. Imaging off-centered drivesthe MR system components, such asthe gradients and the homogeneityof the magnetic field to its limits.
c) Small joints require the use ofdedicated surface coils. The closerthe coil is to the joint and smaller thecoil, the better the signal versusnoise.
These requirements result indemand of high signal to noise.Images are typically noisy or grainy if technical parameters arenot chosen properly, such as:
a) Selection of moderate to lowbandwidth sequences. These sequen-ces selectively filter out certainbandwidths of radio frequencies suchas noise, thus increasing the overallsignal to noise ratio. A trade off tothis selection is chemical shift arti-facts, which manifest themselves asmisregistration of signal at fat/waterinterfaces in the readout direction [1].Table 1 should aid in the selection of proper bandwidths [2].
b) Technologically advanced surfacecoils, such as Circular Polarized
Anatomy and pathology of the elbowis rather unique. The numerousligaments, tendons, musculo-tendi-nous structures and bone marrow tobe evaluated within this small areaeach run in a different direction.Therefore, we must image the elbowin a different plane and pulsesequence for each of these structures.
Clinical history from the referringphysician or recognizing what patho-logy one is looking for is imperativeso that the scans are obtained withthe proper planes.
Radiologists determine pathology of soft tissue anatomy such as liga-ments, tendons or muscles with a variety of pulse sequences. Each
48
MAGNETOM FLASH
Magnetic Resonance Imaging of the Elbow Bill J. Leon R.T. (R )(MR)
From the Department of DiagnosticRadiology Magnetic ResonanceImaging Center
Health South Doctors’ Hospital5000 University Drive, Coral Gables, Fl 33146
BW (kHz) BW (Hz/Px) SNR CS in Pixels 1.0T CS in Pixels 1.5T
16 130 1.0 1.13 1.70
10 78 1.3 1.88 2.83
8 65 1.4 2.26 3.39
Table 1
Phase Array Coils or Circular PolarizedFlexible Coils. With these devices the signal to noise is increasedconsiderably.
c) Advanced Pulse sequences such as Turbo Spin Echo (Fast Spin Echo),Turbo STIR (Short Tau InversionRecovery), non-selective 3D gradientecho and low bandwidth pulsesequences. All these techniquesimprove the signal to noise whileproviding the same or similar con-trast to noise and signal intensities ofthe different tissues evaluated.
The elbow, therefore, presents atechnical challenge for technologistssince all available resources shouldbe employed to obtain the bestquality scans in the shortest timepossible.
pulse sequence gives specific infor-mation on the anatomical structure:
T1 weighted images, whether theyare Spin Echo, Turbo Spin Echo (FastSpin Echo), or Gradient Echo pulsesequences, have the characteristic ofrelatively good signal to noise. Theimages are usually pretty and onemay obtain higher resolution imageswith this type of pulse sequence. T1weighted images are known to havehigh sensitivity and low to poorspecificity of pathology. This meansthat if the normal appearance of atendon is of low signal intensity(black) and the tendon revealsintermediate signal (grey) on the T1weighted image, the followingpathology is possible:
1) Inflammation of the tendon(Tendinitis)
2) Partial tears (some fibers may
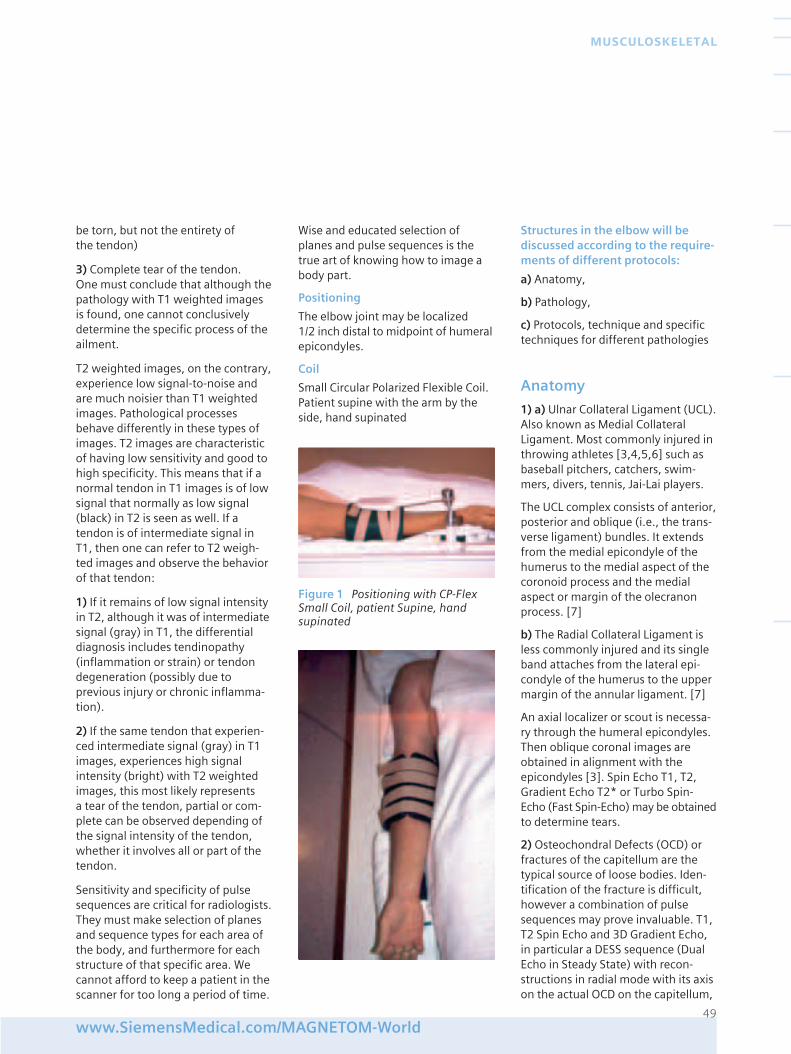
be torn, but not the entirety of the tendon)
3) Complete tear of the tendon.One must conclude that although thepathology with T1 weighted imagesis found, one cannot conclusivelydetermine the specific process of theailment.
T2 weighted images, on the contrary,experience low signal-to-noise andare much noisier than T1 weightedimages. Pathological processesbehave differently in these types ofimages. T2 images are characteristicof having low sensitivity and good tohigh specificity. This means that if anormal tendon in T1 images is of lowsignal that normally as low signal(black) in T2 is seen as well. If atendon is of intermediate signal inT1, then one can refer to T2 weigh-ted images and observe the behaviorof that tendon:
1) If it remains of low signal intensityin T2, although it was of intermediatesignal (gray) in T1, the differentialdiagnosis includes tendinopathy(inflammation or strain) or tendondegeneration (possibly due toprevious injury or chronic inflamma-tion).
2) If the same tendon that experien-ced intermediate signal (gray) in T1images, experiences high signalintensity (bright) with T2 weightedimages, this most likely represents a tear of the tendon, partial or com-plete can be observed depending ofthe signal intensity of the tendon,whether it involves all or part of thetendon.
Sensitivity and specificity of pulsesequences are critical for radiologists.They must make selection of planesand sequence types for each area ofthe body, and furthermore for eachstructure of that specific area. Wecannot afford to keep a patient in thescanner for too long a period of time.
Wise and educated selection ofplanes and pulse sequences is thetrue art of knowing how to image abody part.
Positioning
The elbow joint may be localized 1/2 inch distal to midpoint of humeralepicondyles.
Coil
Small Circular Polarized Flexible Coil.Patient supine with the arm by theside, hand supinated
Structures in the elbow will bediscussed according to the require-ments of different protocols:
a) Anatomy,
b) Pathology,
c) Protocols, technique and specifictechniques for different pathologies
Anatomy
1) a) Ulnar Collateral Ligament (UCL).Also known as Medial CollateralLigament. Most commonly injured inthrowing athletes [3,4,5,6] such asbaseball pitchers, catchers, swim-mers, divers, tennis, Jai-Lai players.
The UCL complex consists of anterior,posterior and oblique (i.e., the trans-verse ligament) bundles. It extendsfrom the medial epicondyle of thehumerus to the medial aspect of thecoronoid process and the medialaspect or margin of the olecranonprocess. [7]
b) The Radial Collateral Ligament isless commonly injured and its singleband attaches from the lateral epi-condyle of the humerus to the uppermargin of the annular ligament. [7]
An axial localizer or scout is necessa-ry through the humeral epicondyles.Then oblique coronal images areobtained in alignment with theepicondyles [3]. Spin Echo T1, T2,Gradient Echo T2* or Turbo Spin-Echo (Fast Spin-Echo) may be obtainedto determine tears.
2) Osteochondral Defects (OCD) orfractures of the capitellum are thetypical source of loose bodies. Iden-tification of the fracture is difficult,however a combination of pulsesequences may prove invaluable. T1,T2 Spin Echo and 3D Gradient Echo,in particular a DESS sequence (DualEcho in Steady State) with recon-structions in radial mode with its axison the actual OCD on the capitellum,
49www.SiemensMedical.com/MAGNETOM-World
MUSCULOSKELETAL
Figure 1 Positioning with CP-FlexSmall Coil, patient Supine, handsupinated
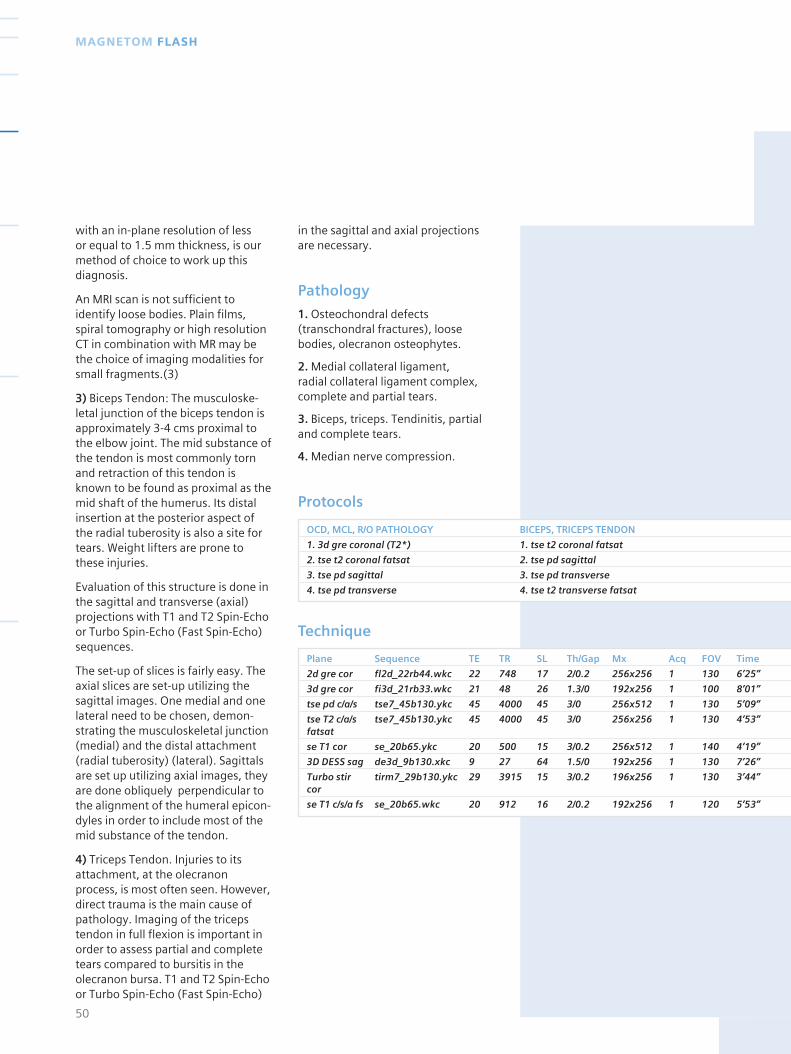
with an in-plane resolution of less or equal to 1.5 mm thickness, is ourmethod of choice to work up thisdiagnosis.
An MRI scan is not sufficient toidentify loose bodies. Plain films,spiral tomography or high resolutionCT in combination with MR may bethe choice of imaging modalities forsmall fragments.(3)
3) Biceps Tendon: The musculoske-letal junction of the biceps tendon isapproximately 3-4 cms proximal tothe elbow joint. The mid substance ofthe tendon is most commonly tornand retraction of this tendon isknown to be found as proximal as themid shaft of the humerus. Its distalinsertion at the posterior aspect ofthe radial tuberosity is also a site fortears. Weight lifters are prone tothese injuries.
Evaluation of this structure is done inthe sagittal and transverse (axial)projections with T1 and T2 Spin-Echoor Turbo Spin-Echo (Fast Spin-Echo)sequences.
The set-up of slices is fairly easy. Theaxial slices are set-up utilizing thesagittal images. One medial and onelateral need to be chosen, demon-strating the musculoskeletal junction(medial) and the distal attachment(radial tuberosity) (lateral). Sagittalsare set up utilizing axial images, theyare done obliquely perpendicular tothe alignment of the humeral epicon-dyles in order to include most of themid substance of the tendon.
4) Triceps Tendon. Injuries to itsattachment, at the olecranonprocess, is most often seen. However,direct trauma is the main cause ofpathology. Imaging of the tricepstendon in full flexion is important inorder to assess partial and completetears compared to bursitis in theolecranon bursa. T1 and T2 Spin-Echoor Turbo Spin-Echo (Fast Spin-Echo)
in the sagittal and axial projectionsare necessary.
Pathology
1. Osteochondral defects(transchondral fractures), loosebodies, olecranon osteophytes.
2. Medial collateral ligament, radial collateral ligament complex,complete and partial tears.
3. Biceps, triceps. Tendinitis, partialand complete tears.
4. Median nerve compression.
Protocols
50
MAGNETOM FLASH
OCD, MCL, R/O PATHOLOGY BICEPS, TRICEPS TENDON
1. 3d gre coronal (T2*) 1. tse t2 coronal fatsat
2. tse t2 coronal fatsat 2. tse pd sagittal
3. tse pd sagittal 3. tse pd transverse
4. tse pd transverse 4. tse t2 transverse fatsat
Plane Sequence TE TR SL Th/Gap Mx Acq FOV Time
2d gre cor fl2d_22rb44.wkc 22 748 17 2/0.2 256x256 1 130 6’25”
3d gre cor fi3d_21rb33.wkc 21 48 26 1.3/0 192x256 1 100 8’01”
tse pd c/a/s tse7_45b130.ykc 45 4000 45 3/0 256x512 1 130 5’09”
tse T2 c/a/s tse7_45b130.ykc 45 4000 45 3/0 256x256 1 130 4’53”fatsat
se T1 cor se_20b65.ykc 20 500 15 3/0.2 256x512 1 140 4’19”
3D DESS sag de3d_9b130.xkc 9 27 64 1.5/0 192x256 1 130 7’26”
Turbo stir tirm7_29b130.ykc 29 3915 15 3/0.2 196x256 1 130 3’44”cor
se T1 c/s/a fs se_20b65.wkc 20 912 16 2/0.2 192x256 1 120 5’53”
Technique
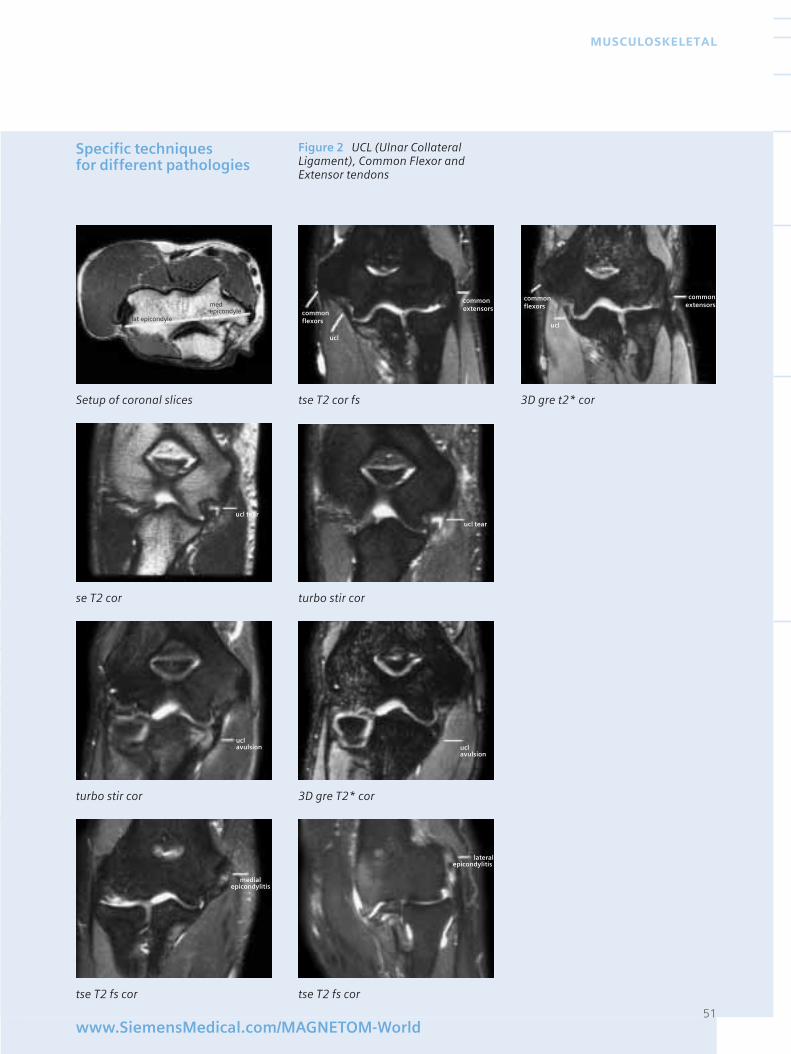
Specific techniques for different pathologies
51www.SiemensMedical.com/MAGNETOM-World
MUSCULOSKELETAL
Figure 2 UCL (Ulnar CollateralLigament), Common Flexor andExtensor tendons
Setup of coronal slices tse T2 cor fs 3D gre t2* cor
se T2 cor turbo stir cor
turbo stir cor 3D gre T2* cor
tse T2 fs cor tse T2 fs cor
commonflexorslat epicondyle
med epicondyle
commonextensors
ucl
ucl tear
ucl tear
uclavulsion
uclavulsion
medialepicondylitis
lateralepicondylitis
commonflexors
commonextensors
ucl
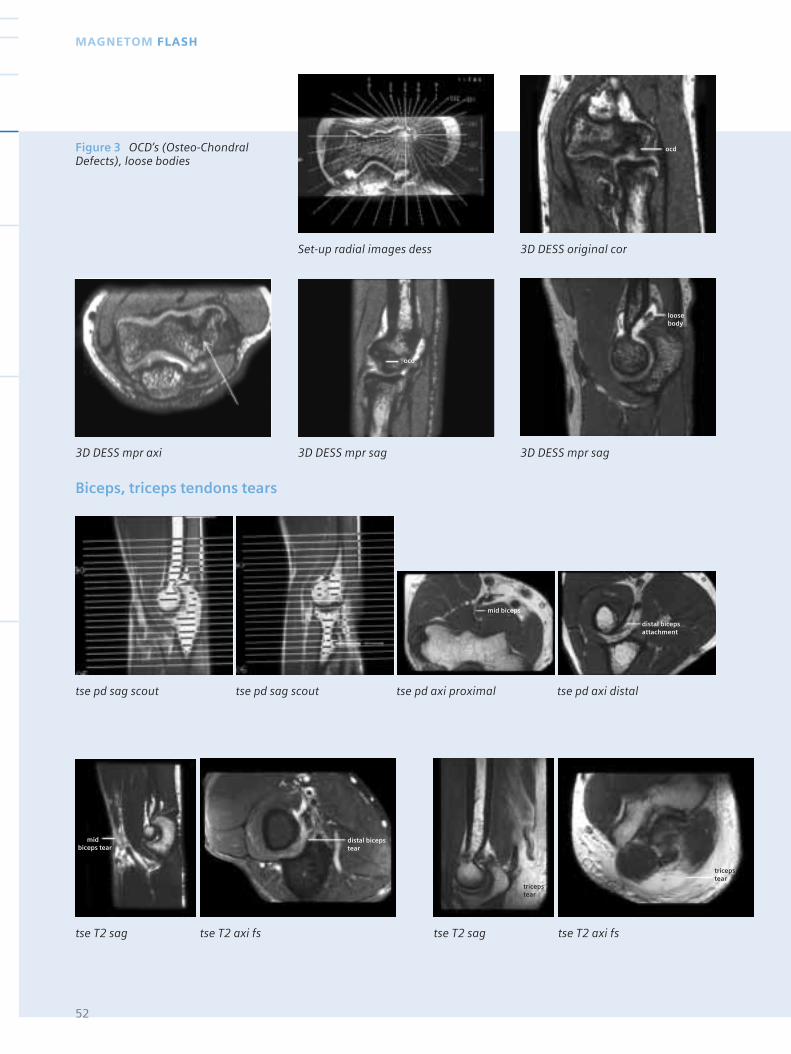
Figure 3 OCD’s (Osteo-ChondralDefects), loose bodies
52
MAGNETOM FLASH
Set-up radial images dess 3D DESS original cor
3D DESS mpr axi 3D DESS mpr sag 3D DESS mpr sag
Biceps, triceps tendons tears
tse pd sag scout tse pd sag scout tse pd axi proximal tse pd axi distal
tse T2 sag tse T2 axi fs tse T2 sag tse T2 axi fs
ocd
loosebody
ocd
mid biceps
distal bicepsattachment
tricepstear
tricepstear
distal bicepstear
mid biceps tear
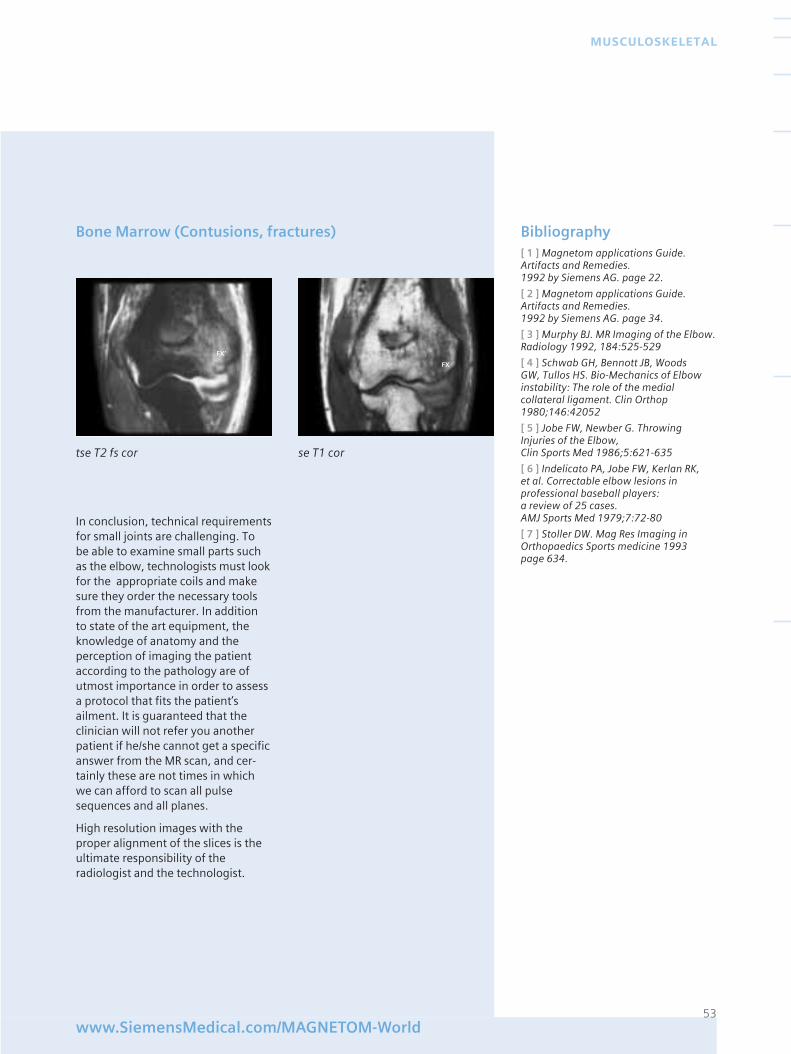
53www.SiemensMedical.com/MAGNETOM-World
MUSCULOSKELETAL
Bone Marrow (Contusions, fractures) Bibliography[ 1 ] Magnetom applications Guide.Artifacts and Remedies. 1992 by Siemens AG. page 22.
[ 2 ] Magnetom applications Guide.Artifacts and Remedies. 1992 by Siemens AG. page 34.
[ 3 ] Murphy BJ. MR Imaging of the Elbow.Radiology 1992, 184:525-529
[ 4 ] Schwab GH, Bennott JB, Woods GW, Tullos HS. Bio-Mechanics of Elbowinstability: The role of the medial collateral ligament. Clin Orthop1980;146:42052
[ 5 ] Jobe FW, Newber G. ThrowingInjuries of the Elbow, Clin Sports Med 1986;5:621-635
[ 6 ] Indelicato PA, Jobe FW, Kerlan RK, et al. Correctable elbow lesions in professional baseball players: a review of 25 cases. AMJ Sports Med 1979;7:72-80
[ 7 ] Stoller DW. Mag Res Imaging inOrthopaedics Sports medicine 1993 page 634.
tse T2 fs cor se T1 cor
In conclusion, technical requirementsfor small joints are challenging. To be able to examine small parts suchas the elbow, technologists must lookfor the appropriate coils and makesure they order the necessary toolsfrom the manufacturer. In addition to state of the art equipment, theknowledge of anatomy and theperception of imaging the patientaccording to the pathology are ofutmost importance in order to assessa protocol that fits the patient’sailment. It is guaranteed that theclinician will not refer you anotherpatient if he/she cannot get a specificanswer from the MR scan, and cer-tainly these are not times in whichwe can afford to scan all pulsesequences and all planes.
High resolution images with theproper alignment of the slices is theultimate responsibility of theradiologist and the technologist.
FX’
FX
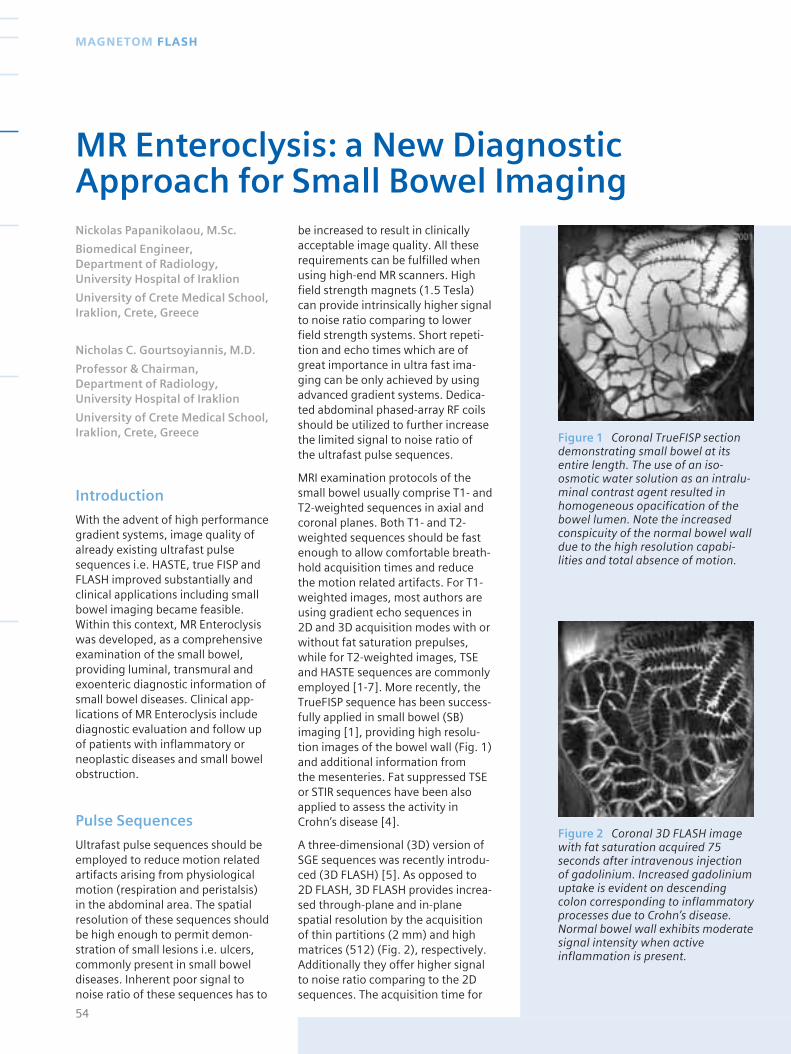
Introduction
With the advent of high performancegradient systems, image quality ofalready existing ultrafast pulsesequences i.e. HASTE, true FISP andFLASH improved substantially andclinical applications including smallbowel imaging became feasible.Within this context, MR Enteroclysiswas developed, as a comprehensiveexamination of the small bowel,providing luminal, transmural andexoenteric diagnostic information ofsmall bowel diseases. Clinical app-lications of MR Enteroclysis includediagnostic evaluation and follow upof patients with inflammatory orneoplastic diseases and small bowelobstruction.
Pulse Sequences
Ultrafast pulse sequences should beemployed to reduce motion relatedartifacts arising from physiologicalmotion (respiration and peristalsis) in the abdominal area. The spatialresolution of these sequences shouldbe high enough to permit demon-stration of small lesions i.e. ulcers,commonly present in small boweldiseases. Inherent poor signal tonoise ratio of these sequences has to
be increased to result in clinicallyacceptable image quality. All theserequirements can be fulfilled whenusing high-end MR scanners. Highfield strength magnets (1.5 Tesla)can provide intrinsically higher signalto noise ratio comparing to lowerfield strength systems. Short repeti-tion and echo times which are ofgreat importance in ultra fast ima-ging can be only achieved by usingadvanced gradient systems. Dedica-ted abdominal phased-array RF coilsshould be utilized to further increasethe limited signal to noise ratio of the ultrafast pulse sequences.
MRI examination protocols of thesmall bowel usually comprise T1- andT2-weighted sequences in axial andcoronal planes. Both T1- and T2-weighted sequences should be fastenough to allow comfortable breath-hold acquisition times and reduce the motion related artifacts. For T1-weighted images, most authors areusing gradient echo sequences in 2D and 3D acquisition modes with orwithout fat saturation prepulses,while for T2-weighted images, TSEand HASTE sequences are commonlyemployed [1-7]. More recently, theTrueFISP sequence has been success-fully applied in small bowel (SB)imaging [1], providing high resolu-tion images of the bowel wall (Fig. 1)and additional information from the mesenteries. Fat suppressed TSE or STIR sequences have been alsoapplied to assess the activity inCrohn’s disease [4].
A three-dimensional (3D) version ofSGE sequences was recently introdu-ced (3D FLASH) [5]. As opposed to2D FLASH, 3D FLASH provides increa-sed through-plane and in-planespatial resolution by the acquisitionof thin partitions (2 mm) and highmatrices (512) (Fig. 2), respectively.Additionally they offer higher signalto noise ratio comparing to the 2Dsequences. The acquisition time for
54
MAGNETOM FLASH
MR Enteroclysis: a New DiagnosticApproach for Small Bowel ImagingNickolas Papanikolaou, M.Sc.
Biomedical Engineer, Department of Radiology, University Hospital of Iraklion
University of Crete Medical School,Iraklion, Crete, Greece
Nicholas C. Gourtsoyiannis, M.D.
Professor & Chairman, Department of Radiology, University Hospital of Iraklion
University of Crete Medical School,Iraklion, Crete, Greece Figure 1 Coronal TrueFISP section
demonstrating small bowel at itsentire length. The use of an iso-osmotic water solution as an intralu-minal contrast agent resulted inhomogeneous opacification of thebowel lumen. Note the increasedconspicuity of the normal bowel walldue to the high resolution capabi-lities and total absence of motion.
Figure 2 Coronal 3D FLASH imagewith fat saturation acquired 75seconds after intravenous injectionof gadolinium. Increased gadoliniumuptake is evident on descendingcolon corresponding to inflammatoryprocesses due to Crohn’s disease.Normal bowel wall exhibits moderatesignal intensity when activeinflammation is present.
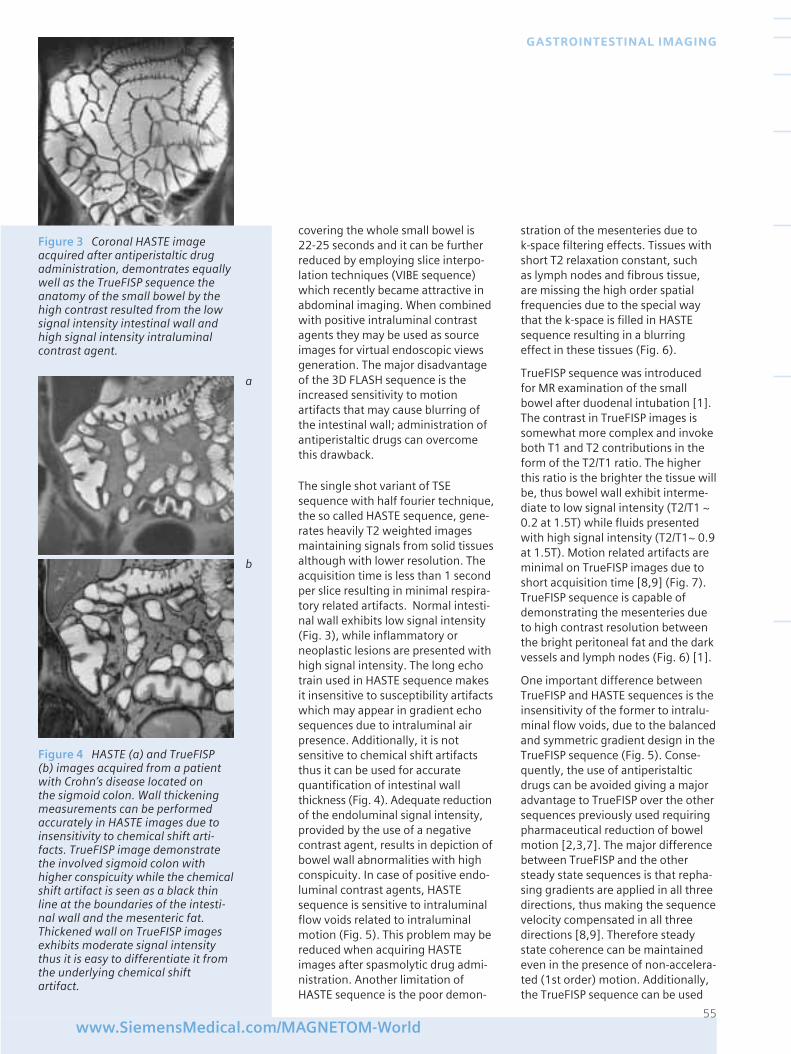
covering the whole small bowel is22-25 seconds and it can be furtherreduced by employing slice interpo-lation techniques (VIBE sequence)which recently became attractive inabdominal imaging. When combinedwith positive intraluminal contrastagents they may be used as sourceimages for virtual endoscopic viewsgeneration. The major disadvantageof the 3D FLASH sequence is theincreased sensitivity to motionartifacts that may cause blurring ofthe intestinal wall; administration ofantiperistaltic drugs can overcomethis drawback.
The single shot variant of TSEsequence with half fourier technique,the so called HASTE sequence, gene-rates heavily T2 weighted imagesmaintaining signals from solid tissuesalthough with lower resolution. Theacquisition time is less than 1 secondper slice resulting in minimal respira-tory related artifacts. Normal intesti-nal wall exhibits low signal intensity(Fig. 3), while inflammatory orneoplastic lesions are presented withhigh signal intensity. The long echotrain used in HASTE sequence makesit insensitive to susceptibility artifactswhich may appear in gradient echosequences due to intraluminal airpresence. Additionally, it is notsensitive to chemical shift artifactsthus it can be used for accuratequantification of intestinal wallthickness (Fig. 4). Adequate reductionof the endoluminal signal intensity,provided by the use of a negativecontrast agent, results in depiction ofbowel wall abnormalities with highconspicuity. In case of positive endo-luminal contrast agents, HASTEsequence is sensitive to intraluminalflow voids related to intraluminalmotion (Fig. 5). This problem may bereduced when acquiring HASTEimages after spasmolytic drug admi-nistration. Another limitation ofHASTE sequence is the poor demon-
stration of the mesenteries due to k-space filtering effects. Tissues withshort T2 relaxation constant, such as lymph nodes and fibrous tissue,are missing the high order spatialfrequencies due to the special waythat the k-space is filled in HASTEsequence resulting in a blurringeffect in these tissues (Fig. 6).
TrueFISP sequence was introducedfor MR examination of the smallbowel after duodenal intubation [1].The contrast in TrueFISP images issomewhat more complex and invokeboth T1 and T2 contributions in theform of the T2/T1 ratio. The higherthis ratio is the brighter the tissue willbe, thus bowel wall exhibit interme-diate to low signal intensity (T2/T1 ~0.2 at 1.5T) while fluids presentedwith high signal intensity (T2/T1~ 0.9at 1.5T). Motion related artifacts areminimal on TrueFISP images due toshort acquisition time [8,9] (Fig. 7).TrueFISP sequence is capable ofdemonstrating the mesenteries dueto high contrast resolution betweenthe bright peritoneal fat and the darkvessels and lymph nodes (Fig. 6) [1].
One important difference betweenTrueFISP and HASTE sequences is theinsensitivity of the former to intralu-minal flow voids, due to the balancedand symmetric gradient design in theTrueFISP sequence (Fig. 5). Conse-quently, the use of antiperistalticdrugs can be avoided giving a majoradvantage to TrueFISP over the othersequences previously used requiringpharmaceutical reduction of bowelmotion [2,3,7]. The major differencebetween TrueFISP and the othersteady state sequences is that repha-sing gradients are applied in all threedirections, thus making the sequencevelocity compensated in all threedirections [8,9]. Therefore steadystate coherence can be maintainedeven in the presence of non-accelera-ted (1st order) motion. Additionally,the TrueFISP sequence can be used
55www.SiemensMedical.com/MAGNETOM-World
GASTROINTESTINAL IMAGING
Figure 3 Coronal HASTE imageacquired after antiperistaltic drugadministration, demontrates equallywell as the TrueFISP sequence theanatomy of the small bowel by thehigh contrast resulted from the lowsignal intensity intestinal wall andhigh signal intensity intraluminalcontrast agent.
Figure 4 HASTE (a) and TrueFISP (b) images acquired from a patientwith Crohn’s disease located on the sigmoid colon. Wall thickeningmeasurements can be performedaccurately in HASTE images due toinsensitivity to chemical shift arti-facts. TrueFISP image demonstratethe involved sigmoid colon withhigher conspicuity while the chemicalshift artifact is seen as a black thinline at the boundaries of the intesti-nal wall and the mesenteric fat.Thickened wall on TrueFISP imagesexhibits moderate signal intensitythus it is easy to differentiate it fromthe underlying chemical shiftartifact.
a
b
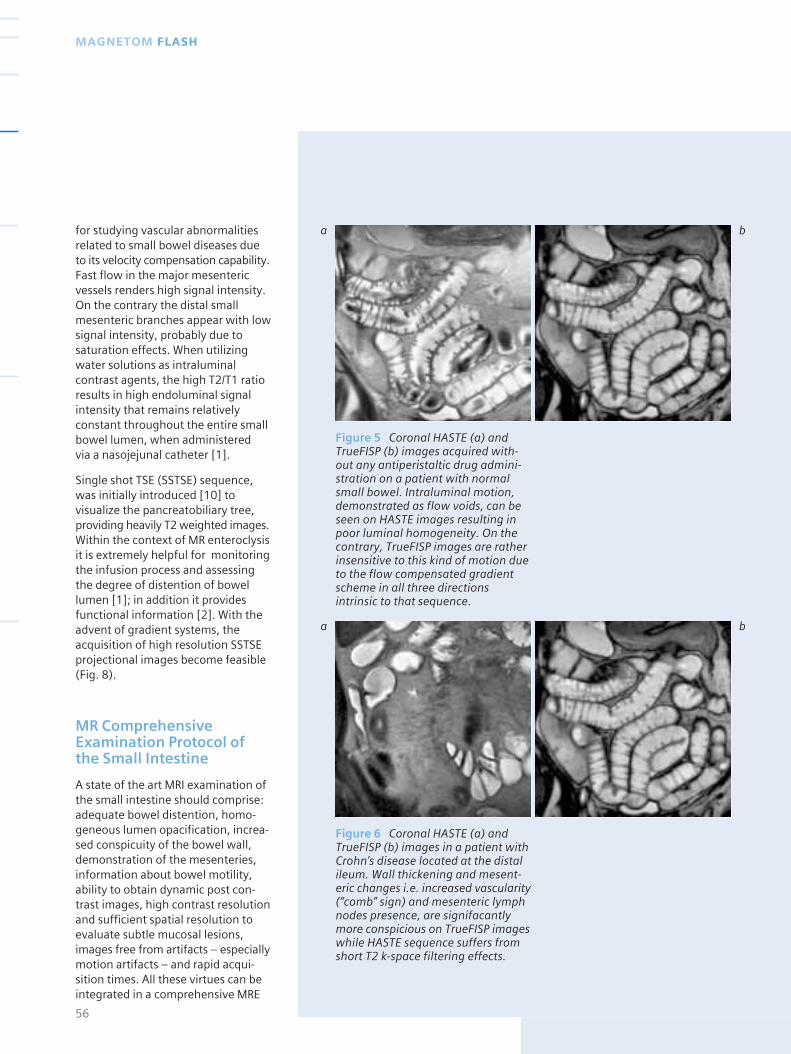
for studying vascular abnormalitiesrelated to small bowel diseases dueto its velocity compensation capability.Fast flow in the major mesentericvessels renders high signal intensity.On the contrary the distal smallmesenteric branches appear with lowsignal intensity, probably due tosaturation effects. When utilizingwater solutions as intraluminalcontrast agents, the high T2/T1 ratioresults in high endoluminal signalintensity that remains relativelyconstant throughout the entire smallbowel lumen, when administered via a nasojejunal catheter [1].
Single shot TSE (SSTSE) sequence,was initially introduced [10] tovisualize the pancreatobiliary tree,providing heavily T2 weighted images.Within the context of MR enteroclysisit is extremely helpful for monitoringthe infusion process and assessingthe degree of distention of bowellumen [1]; in addition it providesfunctional information [2]. With theadvent of gradient systems, theacquisition of high resolution SSTSEprojectional images become feasible(Fig. 8).
MR ComprehensiveExamination Protocol ofthe Small Intestine
A state of the art MRI examination ofthe small intestine should comprise:adequate bowel distention, homo-geneous lumen opacification, increa-sed conspicuity of the bowel wall,demonstration of the mesenteries,information about bowel motility,ability to obtain dynamic post con-trast images, high contrast resolutionand sufficient spatial resolution toevaluate subtle mucosal lesions,images free from artifacts – especiallymotion artifacts – and rapid acqui-sition times. All these virtues can beintegrated in a comprehensive MRE
56
MAGNETOM FLASH
Figure 5 Coronal HASTE (a) andTrueFISP (b) images acquired with-out any antiperistaltic drug admini-stration on a patient with normalsmall bowel. Intraluminal motion,demonstrated as flow voids, can beseen on HASTE images resulting inpoor luminal homogeneity. On thecontrary, TrueFISP images are ratherinsensitive to this kind of motion dueto the flow compensated gradientscheme in all three directionsintrinsic to that sequence.
Figure 6 Coronal HASTE (a) andTrueFISP (b) images in a patient withCrohn’s disease located at the distalileum. Wall thickening and mesent-eric changes i.e. increased vascularity(“comb” sign) and mesenteric lymphnodes presence, are signifacantlymore conspicious on TrueFISP imageswhile HASTE sequence suffers fromshort T2 k-space filtering effects.
a b
a b
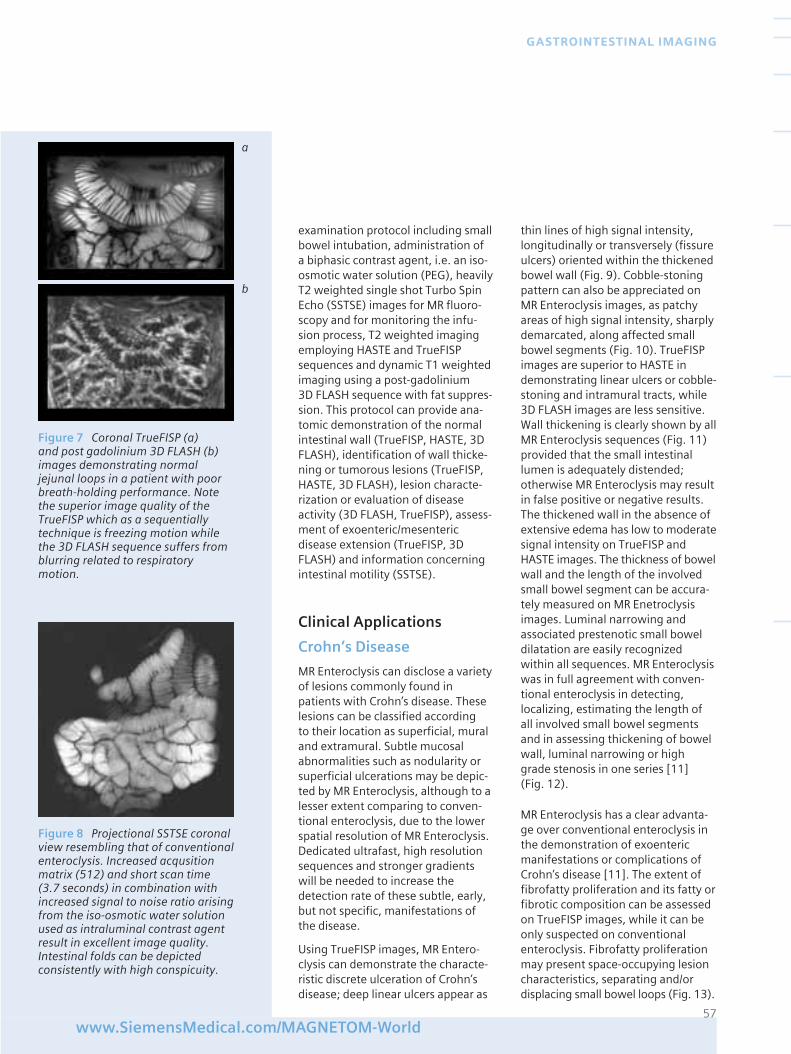
examination protocol including smallbowel intubation, administration of a biphasic contrast agent, i.e. an iso-osmotic water solution (PEG), heavilyT2 weighted single shot Turbo SpinEcho (SSTSE) images for MR fluoro-scopy and for monitoring the infu-sion process, T2 weighted imagingemploying HASTE and TrueFISPsequences and dynamic T1 weightedimaging using a post-gadolinium 3D FLASH sequence with fat suppres-sion. This protocol can provide ana-tomic demonstration of the normalintestinal wall (TrueFISP, HASTE, 3DFLASH), identification of wall thicke-ning or tumorous lesions (TrueFISP,HASTE, 3D FLASH), lesion characte-rization or evaluation of diseaseactivity (3D FLASH, TrueFISP), assess-ment of exoenteric/mesentericdisease extension (TrueFISP, 3DFLASH) and information concerningintestinal motility (SSTSE).
Clinical Applications
Crohn’s Disease
MR Enteroclysis can disclose a varietyof lesions commonly found inpatients with Crohn’s disease. Theselesions can be classified according to their location as superficial, muraland extramural. Subtle mucosalabnormalities such as nodularity orsuperficial ulcerations may be depic-ted by MR Enteroclysis, although to alesser extent comparing to conven-tional enteroclysis, due to the lowerspatial resolution of MR Enteroclysis.Dedicated ultrafast, high resolutionsequences and stronger gradientswill be needed to increase thedetection rate of these subtle, early,but not specific, manifestations ofthe disease.
Using TrueFISP images, MR Entero-clysis can demonstrate the characte-ristic discrete ulceration of Crohn’sdisease; deep linear ulcers appear as
thin lines of high signal intensity,longitudinally or transversely (fissureulcers) oriented within the thickenedbowel wall (Fig. 9). Cobble-stoningpattern can also be appreciated onMR Enteroclysis images, as patchyareas of high signal intensity, sharplydemarcated, along affected smallbowel segments (Fig. 10). TrueFISPimages are superior to HASTE indemonstrating linear ulcers or cobble-stoning and intramural tracts, while3D FLASH images are less sensitive.Wall thickening is clearly shown by allMR Enteroclysis sequences (Fig. 11)provided that the small intestinallumen is adequately distended;otherwise MR Enteroclysis may resultin false positive or negative results.The thickened wall in the absence ofextensive edema has low to moderatesignal intensity on TrueFISP andHASTE images. The thickness of bowelwall and the length of the involvedsmall bowel segment can be accura-tely measured on MR Enetroclysisimages. Luminal narrowing andassociated prestenotic small boweldilatation are easily recognizedwithin all sequences. MR Enteroclysiswas in full agreement with conven-tional enteroclysis in detecting,localizing, estimating the length ofall involved small bowel segmentsand in assessing thickening of bowelwall, luminal narrowing or highgrade stenosis in one series [11] (Fig. 12).
MR Enteroclysis has a clear advanta-ge over conventional enteroclysis inthe demonstration of exoentericmanifestations or complications ofCrohn’s disease [11]. The extent offibrofatty proliferation and its fatty orfibrotic composition can be assessedon TrueFISP images, while it can beonly suspected on conventionalenteroclysis. Fibrofatty proliferationmay present space-occupying lesioncharacteristics, separating and/ordisplacing small bowel loops (Fig. 13).
57www.SiemensMedical.com/MAGNETOM-World
GASTROINTESTINAL IMAGING
Figure 7 Coronal TrueFISP (a) and post gadolinium 3D FLASH (b)images demonstrating normaljejunal loops in a patient with poorbreath-holding performance. Notethe superior image quality of theTrueFISP which as a sequentiallytechnique is freezing motion whilethe 3D FLASH sequence suffers fromblurring related to respiratory motion.
Figure 8 Projectional SSTSE coronalview resembling that of conventionalenteroclysis. Increased acqusitionmatrix (512) and short scan time(3.7 seconds) in combination withincreased signal to noise ratio arisingfrom the iso-osmotic water solutionused as intraluminal contrast agentresult in excellent image quality.Intestinal folds can be depictedconsistently with high conspicuity.
a
b
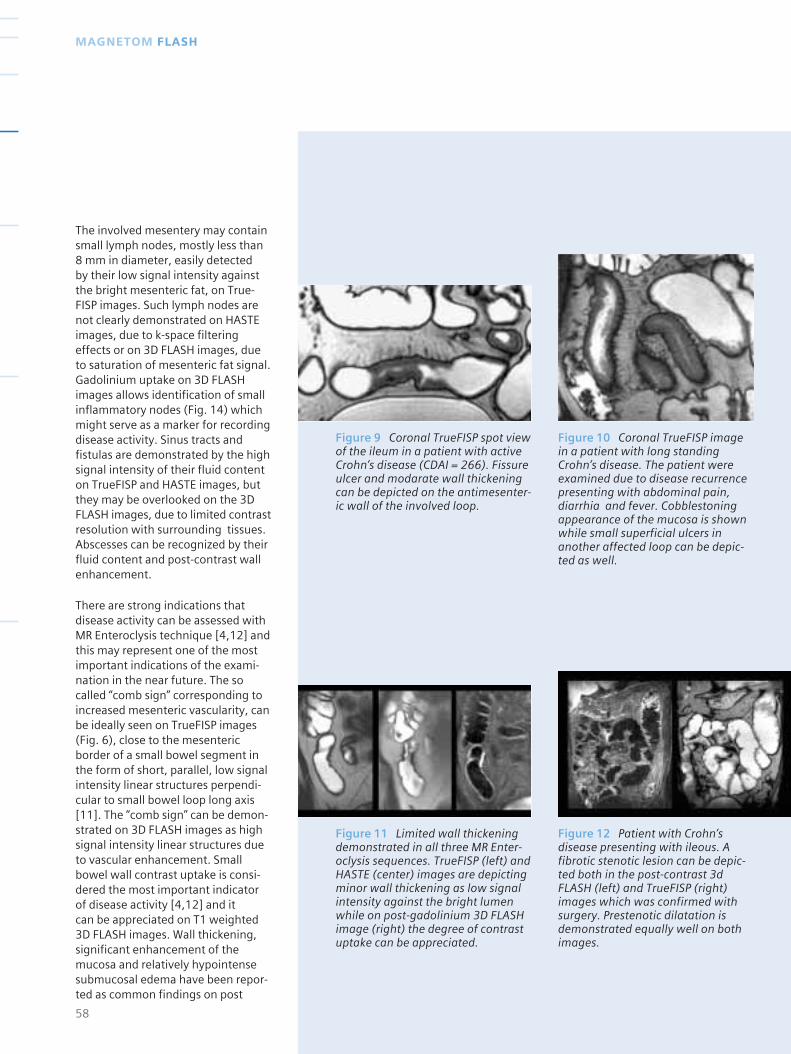
The involved mesentery may containsmall lymph nodes, mostly less than8 mm in diameter, easily detected by their low signal intensity againstthe bright mesenteric fat, on True-FISP images. Such lymph nodes arenot clearly demonstrated on HASTEimages, due to k-space filteringeffects or on 3D FLASH images, dueto saturation of mesenteric fat signal.Gadolinium uptake on 3D FLASHimages allows identification of smallinflammatory nodes (Fig. 14) whichmight serve as a marker for recordingdisease activity. Sinus tracts andfistulas are demonstrated by the highsignal intensity of their fluid contenton TrueFISP and HASTE images, butthey may be overlooked on the 3DFLASH images, due to limited contrastresolution with surrounding tissues.Abscesses can be recognized by theirfluid content and post-contrast wallenhancement.
There are strong indications thatdisease activity can be assessed withMR Enteroclysis technique [4,12] andthis may represent one of the mostimportant indications of the exami-nation in the near future. The socalled “comb sign” corresponding toincreased mesenteric vascularity, canbe ideally seen on TrueFISP images(Fig. 6), close to the mesentericborder of a small bowel segment inthe form of short, parallel, low signalintensity linear structures perpendi-cular to small bowel loop long axis[11]. The “comb sign” can be demon-strated on 3D FLASH images as highsignal intensity linear structures dueto vascular enhancement. Smallbowel wall contrast uptake is consi-dered the most important indicatorof disease activity [4,12] and it can be appreciated on T1 weighted 3D FLASH images. Wall thickening,significant enhancement of themucosa and relatively hypointensesubmucosal edema have been repor-ted as common findings on post
58
MAGNETOM FLASH
Figure 9 Coronal TrueFISP spot viewof the ileum in a patient with activeCrohn’s disease (CDAI = 266). Fissureulcer and modarate wall thickeningcan be depicted on the antimesenter-ic wall of the involved loop.
Figure 10 Coronal TrueFISP imagein a patient with long standingCrohn’s disease. The patient wereexamined due to disease recurrencepresenting with abdominal pain,diarrhia and fever. Cobblestoningappearance of the mucosa is shownwhile small superficial ulcers inanother affected loop can be depic-ted as well.
Figure 11 Limited wall thickeningdemonstrated in all three MR Enter-oclysis sequences. TrueFISP (left) andHASTE (center) images are depictingminor wall thickening as low signalintensity against the bright lumenwhile on post-gadolinium 3D FLASHimage (right) the degree of contrastuptake can be appreciated.
Figure 12 Patient with Crohn’sdisease presenting with ileous. Afibrotic stenotic lesion can be depic-ted both in the post-contrast 3dFLASH (left) and TrueFISP (right)images which was confirmed withsurgery. Prestenotic dilatation isdemonstrated equally well on bothimages.
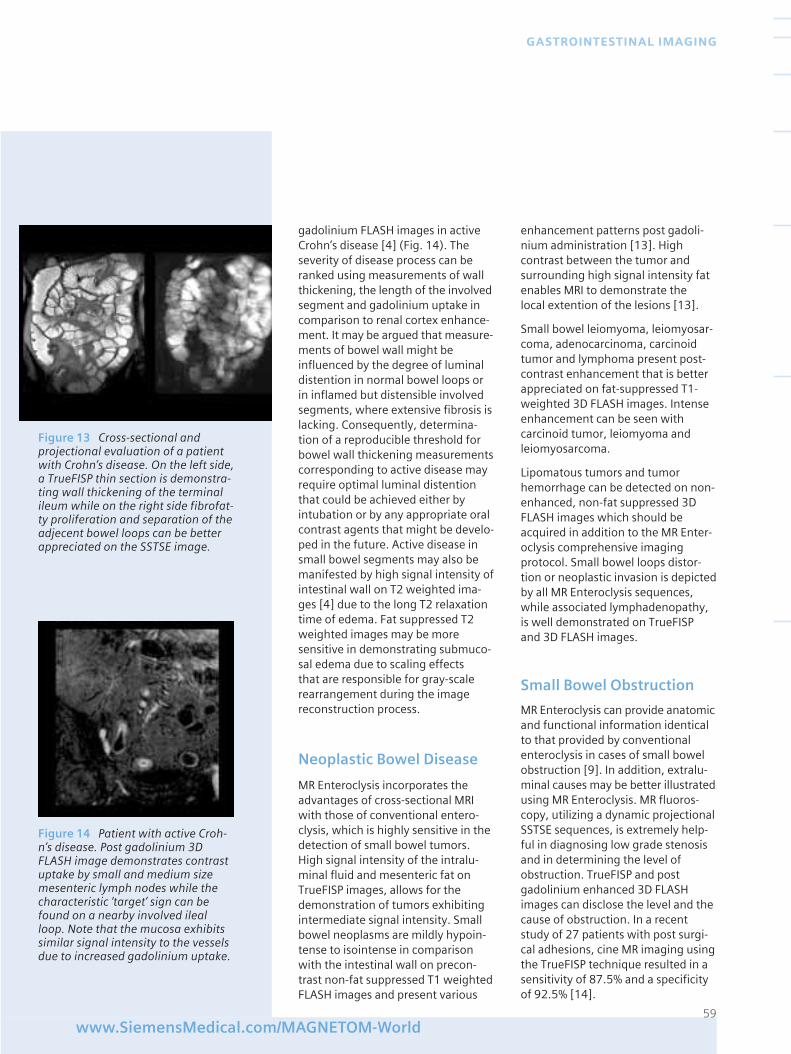
gadolinium FLASH images in activeCrohn’s disease [4] (Fig. 14). Theseverity of disease process can beranked using measurements of wallthickening, the length of the involvedsegment and gadolinium uptake incomparison to renal cortex enhance-ment. It may be argued that measure-ments of bowel wall might beinfluenced by the degree of luminaldistention in normal bowel loops orin inflamed but distensible involvedsegments, where extensive fibrosis islacking. Consequently, determina-tion of a reproducible threshold forbowel wall thickening measurementscorresponding to active disease mayrequire optimal luminal distentionthat could be achieved either byintubation or by any appropriate oralcontrast agents that might be develo-ped in the future. Active disease insmall bowel segments may also bemanifested by high signal intensity ofintestinal wall on T2 weighted ima-ges [4] due to the long T2 relaxationtime of edema. Fat suppressed T2weighted images may be moresensitive in demonstrating submuco-sal edema due to scaling effects that are responsible for gray-scalerearrangement during the imagereconstruction process.
Neoplastic Bowel Disease
MR Enteroclysis incorporates theadvantages of cross-sectional MRIwith those of conventional entero-clysis, which is highly sensitive in thedetection of small bowel tumors.High signal intensity of the intralu-minal fluid and mesenteric fat onTrueFISP images, allows for thedemonstration of tumors exhibitingintermediate signal intensity. Smallbowel neoplasms are mildly hypoin-tense to isointense in comparisonwith the intestinal wall on precon-trast non-fat suppressed T1 weightedFLASH images and present various
enhancement patterns post gadoli-nium administration [13]. Highcontrast between the tumor andsurrounding high signal intensity fatenables MRI to demonstrate the local extention of the lesions [13].
Small bowel leiomyoma, leiomyosar-coma, adenocarcinoma, carcinoidtumor and lymphoma present post-contrast enhancement that is betterappreciated on fat-suppressed T1-weighted 3D FLASH images. Intenseenhancement can be seen withcarcinoid tumor, leiomyoma andleiomyosarcoma.
Lipomatous tumors and tumorhemorrhage can be detected on non-enhanced, non-fat suppressed 3DFLASH images which should beacquired in addition to the MR Enter-oclysis comprehensive imagingprotocol. Small bowel loops distor-tion or neoplastic invasion is depictedby all MR Enteroclysis sequences,while associated lymphadenopathy,is well demonstrated on TrueFISP and 3D FLASH images.
Small Bowel Obstruction
MR Enteroclysis can provide anatomicand functional information identicalto that provided by conventionalenteroclysis in cases of small bowelobstruction [9]. In addition, extralu-minal causes may be better illustratedusing MR Enteroclysis. MR fluoros-copy, utilizing a dynamic projectionalSSTSE sequences, is extremely help-ful in diagnosing low grade stenosisand in determining the level ofobstruction. TrueFISP and postgadolinium enhanced 3D FLASHimages can disclose the level and thecause of obstruction. In a recentstudy of 27 patients with post surgi-cal adhesions, cine MR imaging usingthe TrueFISP technique resulted in asensitivity of 87.5% and a specificityof 92.5% [14].
59www.SiemensMedical.com/MAGNETOM-World
GASTROINTESTINAL IMAGING
Figure 13 Cross-sectional andprojectional evaluation of a patientwith Crohn’s disease. On the left side,a TrueFISP thin section is demonstra-ting wall thickening of the terminalileum while on the right side fibrofat-ty proliferation and separation of theadjecent bowel loops can be betterappreciated on the SSTSE image.
Figure 14 Patient with active Croh-n’s disease. Post gadolinium 3DFLASH image demonstrates contrastuptake by small and medium sizemesenteric lymph nodes while thecharacteristic ‘target’ sign can befound on a nearby involved ilealloop. Note that the mucosa exhibitssimilar signal intensity to the vesselsdue to increased gadolinium uptake.
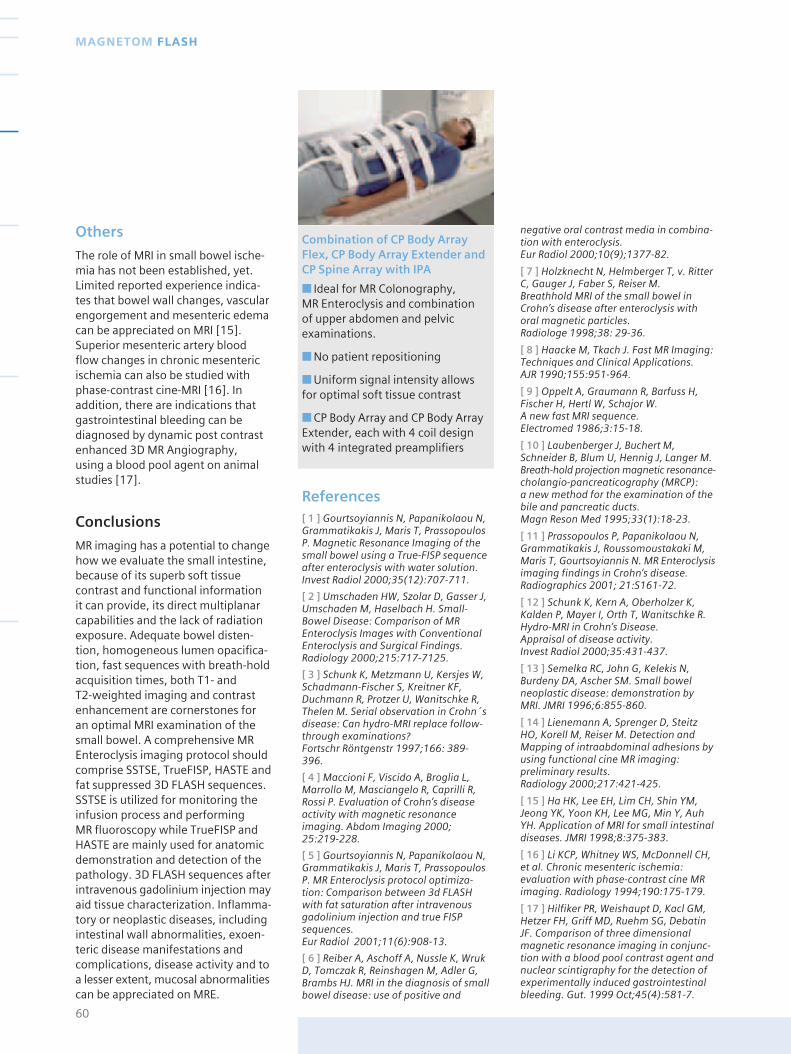
Others
The role of MRI in small bowel ische-mia has not been established, yet.Limited reported experience indica-tes that bowel wall changes, vascularengorgement and mesenteric edemacan be appreciated on MRI [15].Superior mesenteric artery bloodflow changes in chronic mesentericischemia can also be studied withphase-contrast cine-MRI [16]. Inaddition, there are indications thatgastrointestinal bleeding can bediagnosed by dynamic post contrastenhanced 3D MR Angiography, using a blood pool agent on animalstudies [17].
Conclusions
MR imaging has a potential to changehow we evaluate the small intestine,because of its superb soft tissuecontrast and functional informationit can provide, its direct multiplanarcapabilities and the lack of radiationexposure. Adequate bowel disten-tion, homogeneous lumen opacifica-tion, fast sequences with breath-holdacquisition times, both T1- and T2-weighted imaging and contrastenhancement are cornerstones foran optimal MRI examination of thesmall bowel. A comprehensive MREnteroclysis imaging protocol shouldcomprise SSTSE, TrueFISP, HASTE andfat suppressed 3D FLASH sequences.SSTSE is utilized for monitoring theinfusion process and performing MR fluoroscopy while TrueFISP andHASTE are mainly used for anatomicdemonstration and detection of thepathology. 3D FLASH sequences afterintravenous gadolinium injection mayaid tissue characterization. Inflamma-tory or neoplastic diseases, includingintestinal wall abnormalities, exoen-teric disease manifestations andcomplications, disease activity and toa lesser extent, mucosal abnormalitiescan be appreciated on MRE.
Combination of CP Body ArrayFlex, CP Body Array Extender andCP Spine Array with IPA
■ Ideal for MR Colonography, MR Enteroclysis and combination of upper abdomen and pelvic examinations.
■ No patient repositioning
■ Uniform signal intensity allowsfor optimal soft tissue contrast
■ CP Body Array and CP Body ArrayExtender, each with 4 coil designwith 4 integrated preamplifiers
References[ 1 ] Gourtsoyiannis N, Papanikolaou N,Grammatikakis J, Maris T, PrassopoulosP. Magnetic Resonance Imaging of thesmall bowel using a True-FISP sequenceafter enteroclysis with water solution. Invest Radiol 2000;35(12):707-711.
[ 2 ] Umschaden HW, Szolar D, Gasser J,Umschaden M, Haselbach H. Small-Bowel Disease: Comparison of MREnteroclysis Images with ConventionalEnteroclysis and Surgical Findings. Radiology 2000;215:717-7125.
[ 3 ] Schunk K, Metzmann U, Kersjes W,Schadmann-Fischer S, Kreitner KF,Duchmann R, Protzer U, Wanitschke R,Thelen M. Serial observation in Crohn´sdisease: Can hydro-MRI replace follow-through examinations? Fortschr Röntgenstr 1997;166: 389-396.
[ 4 ] Maccioni F, Viscido A, Broglia L,Marrollo M, Masciangelo R, Caprilli R,Rossi P. Evaluation of Crohn’s diseaseactivity with magnetic resonanceimaging. Abdom Imaging 2000;25:219-228.
[ 5 ] Gourtsoyiannis N, Papanikolaou N,Grammatikakis J, Maris T, PrassopoulosP. MR Enteroclysis protocol optimiza-tion: Comparison between 3d FLASHwith fat saturation after intravenousgadolinium injection and true FISPsequences. Eur Radiol 2001;11(6):908-13.
[ 6 ] Reiber A, Aschoff A, Nussle K, WrukD, Tomczak R, Reinshagen M, Adler G,Brambs HJ. MRI in the diagnosis of smallbowel disease: use of positive and
negative oral contrast media in combina-tion with enteroclysis. Eur Radiol 2000;10(9);1377-82.
[ 7 ] Holzknecht N, Helmberger T, v. RitterC, Gauger J, Faber S, Reiser M. Breathhold MRI of the small bowel inCrohn’s disease after enteroclysis withoral magnetic particles. Radiologe 1998;38: 29-36.
[ 8 ] Haacke M, Tkach J. Fast MR Imaging:Techniques and Clinical Applications. AJR 1990;155:951-964.
[ 9 ] Oppelt A, Graumann R, Barfuss H,Fischer H, Hertl W, Schajor W. A new fast MRI sequence. Electromed 1986;3:15-18.
[ 10 ] Laubenberger J, Buchert M,Schneider B, Blum U, Hennig J, Langer M.Breath-hold projection magnetic resonance-cholangio-pancreaticography (MRCP): a new method for the examination of thebile and pancreatic ducts. Magn Reson Med 1995;33(1):18-23.
[ 11 ] Prassopoulos P, Papanikolaou N,Grammatikakis J, Roussomoustakaki M,Maris T, Gourtsoyiannis N. MR Enteroclysisimaging findings in Crohn’s disease.Radiographics 2001; 21:S161-72.
[ 12 ] Schunk K, Kern A, Oberholzer K,Kalden P, Mayer I, Orth T, Wanitschke R.Hydro-MRI in Crohn’s Disease. Appraisal of disease activity. Invest Radiol 2000;35:431-437.
[ 13 ] Semelka RC, John G, Kelekis N,Burdeny DA, Ascher SM. Small bowelneoplastic disease: demonstration byMRI. JMRI 1996;6:855-860.
[ 14 ] Lienemann A, Sprenger D, SteitzHO, Korell M, Reiser M. Detection andMapping of intraabdominal adhesions byusing functional cine MR imaging:preliminary results. Radiology 2000;217:421-425.
[ 15 ] Ha HK, Lee EH, Lim CH, Shin YM,Jeong YK, Yoon KH, Lee MG, Min Y, AuhYH. Application of MRI for small intestinaldiseases. JMRI 1998;8:375-383.
[ 16 ] Li KCP, Whitney WS, McDonnell CH,et al. Chronic mesenteric ischemia:evaluation with phase-contrast cine MRimaging. Radiology 1994;190:175-179.
[ 17 ] Hilfiker PR, Weishaupt D, Kacl GM,Hetzer FH, Griff MD, Ruehm SG, DebatinJF. Comparison of three dimensionalmagnetic resonance imaging in conjunc-tion with a blood pool contrast agent andnuclear scintigraphy for the detection ofexperimentally induced gastrointestinalbleeding. Gut. 1999 Oct;45(4):581-7.
60
MAGNETOM FLASH
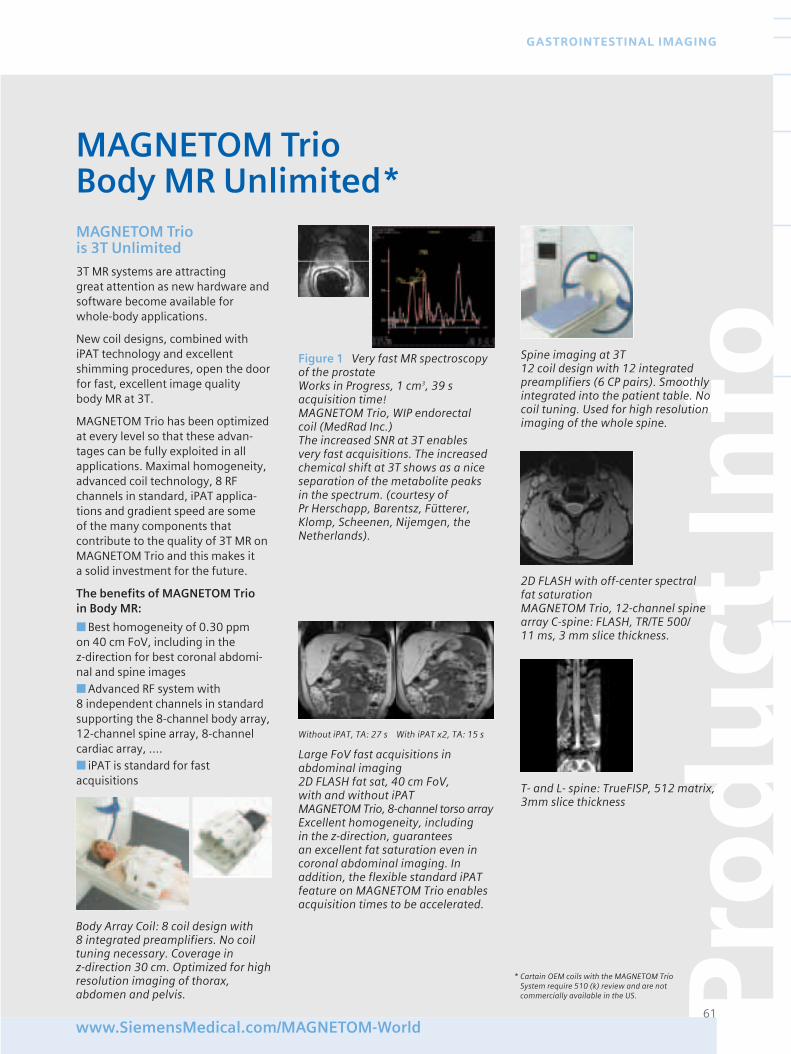
Pro
du
ct In
fo
61www.SiemensMedical.com/MAGNETOM-World
GASTROINTESTINAL IMAGING
Figure 1 Very fast MR spectroscopyof the prostateWorks in Progress, 1 cm3, 39 s acquisition time!MAGNETOM Trio, WIP endorectal coil (MedRad Inc.)The increased SNR at 3T enables very fast acquisitions. The increasedchemical shift at 3T shows as a niceseparation of the metabolite peaksin the spectrum. (courtesy of Pr Herschapp, Barentsz, Fütterer,Klomp, Scheenen, Nijemgen, theNetherlands).
Large FoV fast acquisitions in abdominal imaging2D FLASH fat sat, 40 cm FoV, with and without iPATMAGNETOM Trio, 8-channel torso arrayExcellent homogeneity, including in the z-direction, guarantees an excellent fat saturation even incoronal abdominal imaging. Inaddition, the flexible standard iPATfeature on MAGNETOM Trio enablesacquisition times to be accelerated.
Body Array Coil: 8 coil design with 8 integrated preamplifiers. No coiltuning necessary. Coverage in z-direction 30 cm. Optimized for highresolution imaging of thorax, abdomen and pelvis.
MAGNETOM Trio is 3T Unlimited
3T MR systems are attracting great attention as new hardware andsoftware become available for whole-body applications.
New coil designs, combined withiPAT technology and excellentshimming procedures, open the doorfor fast, excellent image quality body MR at 3T.
MAGNETOM Trio has been optimizedat every level so that these advan-tages can be fully exploited in allapplications. Maximal homogeneity,advanced coil technology, 8 RFchannels in standard, iPAT applica-tions and gradient speed are some of the many components that contribute to the quality of 3T MR onMAGNETOM Trio and this makes it a solid investment for the future.
The benefits of MAGNETOM Trio in Body MR:
■ Best homogeneity of 0.30 ppm on 40 cm FoV, including in the z-direction for best coronal abdomi-nal and spine images■ Advanced RF system with 8 independent channels in standardsupporting the 8-channel body array,12-channel spine array, 8-channelcardiac array, ….■ iPAT is standard for fastacquisitions
MAGNETOM TrioBody MR Unlimited*
* Cartain OEM coils with the MAGNETOM TrioSystem require 510 (k) review and are notcommercially available in the US.
Spine imaging at 3T12 coil design with 12 integratedpreamplifiers (6 CP pairs). Smoothlyintegrated into the patient table. Nocoil tuning. Used for high resolutionimaging of the whole spine.
Without iPAT, TA: 27 s With iPAT x2, TA: 15 s
2D FLASH with off-center spectral fat saturationMAGNETOM Trio, 12-channel spinearray C-spine: FLASH, TR/TE 500/11 ms, 3 mm slice thickness.
T- and L- spine: TrueFISP, 512 matrix,3mm slice thickness
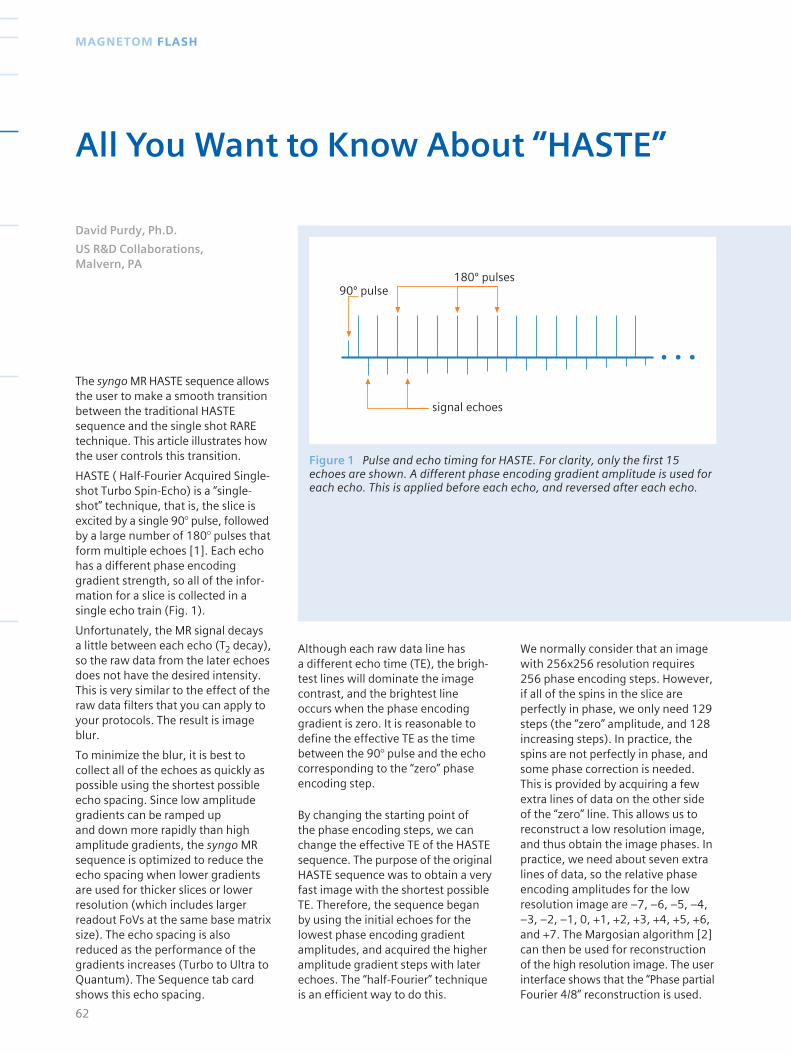
Although each raw data line has a different echo time (TE), the brigh-test lines will dominate the imagecontrast, and the brightest lineoccurs when the phase encodinggradient is zero. It is reasonable todefine the effective TE as the timebetween the 90° pulse and the echocorresponding to the “zero” phaseencoding step.
By changing the starting point of the phase encoding steps, we canchange the effective TE of the HASTEsequence. The purpose of the originalHASTE sequence was to obtain a veryfast image with the shortest possibleTE. Therefore, the sequence beganby using the initial echoes for thelowest phase encoding gradientamplitudes, and acquired the higheramplitude gradient steps with laterechoes. The “half-Fourier” techniqueis an efficient way to do this.
signal echoes
90º pulse180º pulses
Figure 1 Pulse and echo timing for HASTE. For clarity, only the first 15echoes are shown. A different phase encoding gradient amplitude is used foreach echo. This is applied before each echo, and reversed after each echo.
The syngo MR HASTE sequence allowsthe user to make a smooth transitionbetween the traditional HASTEsequence and the single shot RAREtechnique. This article illustrates howthe user controls this transition.
HASTE ( Half-Fourier Acquired Single-shot Turbo Spin-Echo) is a “single-shot” technique, that is, the slice isexcited by a single 90° pulse, followedby a large number of 180° pulses thatform multiple echoes [1]. Each echohas a different phase encodinggradient strength, so all of the infor-mation for a slice is collected in asingle echo train (Fig. 1).
Unfortunately, the MR signal decaysa little between each echo (T2 decay),so the raw data from the later echoesdoes not have the desired intensity.This is very similar to the effect of theraw data filters that you can apply toyour protocols. The result is imageblur.
To minimize the blur, it is best tocollect all of the echoes as quickly aspossible using the shortest possibleecho spacing. Since low amplitudegradients can be ramped up and down more rapidly than highamplitude gradients, the syngo MRsequence is optimized to reduce theecho spacing when lower gradientsare used for thicker slices or lowerresolution (which includes largerreadout FoVs at the same base matrixsize). The echo spacing is alsoreduced as the performance of thegradients increases (Turbo to Ultra toQuantum). The Sequence tab cardshows this echo spacing.
62
MAGNETOM FLASH
All You Want to Know About “HASTE”
David Purdy, Ph.D.
US R&D Collaborations, Malvern, PA
We normally consider that an imagewith 256x256 resolution requires256 phase encoding steps. However,if all of the spins in the slice areperfectly in phase, we only need 129steps (the “zero” amplitude, and 128increasing steps). In practice, thespins are not perfectly in phase, andsome phase correction is needed.This is provided by acquiring a fewextra lines of data on the other sideof the “zero” line. This allows us toreconstruct a low resolution image,and thus obtain the image phases. Inpractice, we need about seven extralines of data, so the relative phaseencoding amplitudes for the lowresolution image are –7, –6, –5, –4,–3, –2, –1, 0, +1, +2, +3, +4, +5, +6,and +7. The Margosian algorithm [2]can then be used for reconstructionof the high resolution image. The userinterface shows that the “Phase partialFourier 4/8” reconstruction is used.
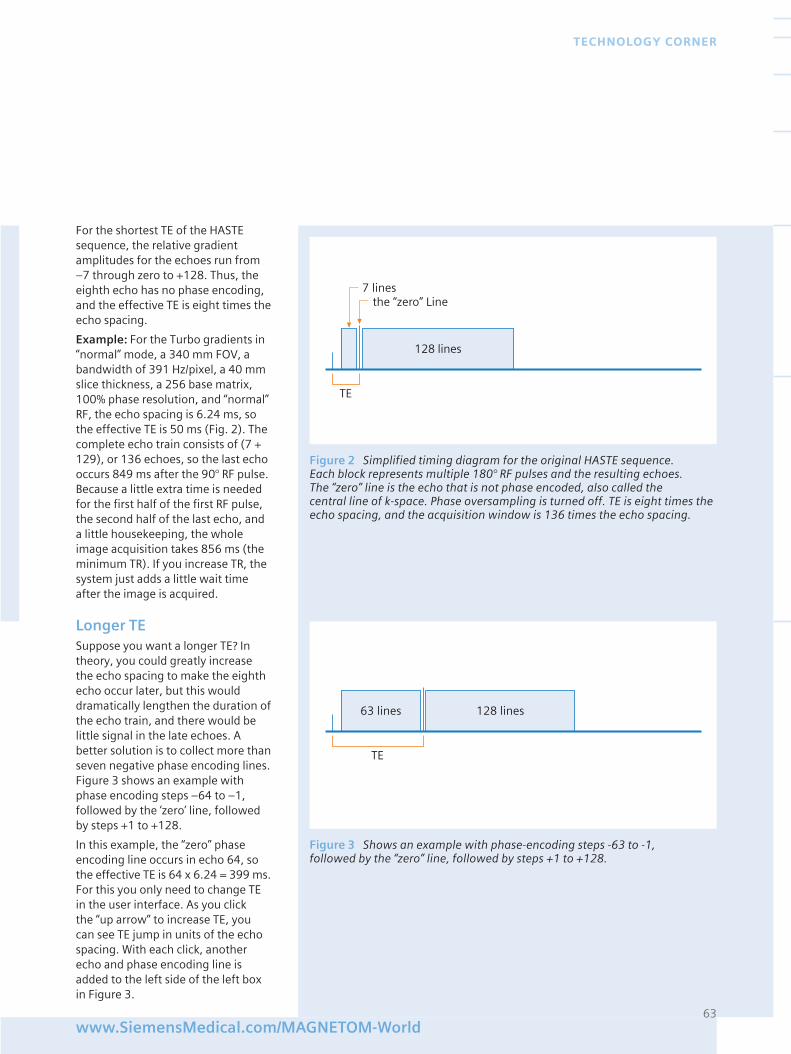
For the shortest TE of the HASTEsequence, the relative gradientamplitudes for the echoes run from–7 through zero to +128. Thus, theeighth echo has no phase encoding,and the effective TE is eight times theecho spacing.
Example: For the Turbo gradients in“normal” mode, a 340 mm FOV, abandwidth of 391 Hz/pixel, a 40 mmslice thickness, a 256 base matrix,100% phase resolution, and “normal”RF, the echo spacing is 6.24 ms, sothe effective TE is 50 ms (Fig. 2). Thecomplete echo train consists of (7 +129), or 136 echoes, so the last echooccurs 849 ms after the 90° RF pulse.Because a little extra time is neededfor the first half of the first RF pulse,the second half of the last echo, anda little housekeeping, the wholeimage acquisition takes 856 ms (theminimum TR). If you increase TR, thesystem just adds a little wait timeafter the image is acquired.
Longer TESuppose you want a longer TE? Intheory, you could greatly increasethe echo spacing to make the eighthecho occur later, but this woulddramatically lengthen the duration ofthe echo train, and there would belittle signal in the late echoes. Abetter solution is to collect more thanseven negative phase encoding lines.Figure 3 shows an example withphase encoding steps –64 to –1,followed by the ‘zero’ line, followedby steps +1 to +128.
In this example, the “zero” phaseencoding line occurs in echo 64, sothe effective TE is 64 x 6.24 = 399 ms.For this you only need to change TEin the user interface. As you click the “up arrow” to increase TE, youcan see TE jump in units of the echospacing. With each click, anotherecho and phase encoding line isadded to the left side of the left boxin Figure 3.
63www.SiemensMedical.com/MAGNETOM-World
TECHNOLOGY CORNER
7 linesthe “zero” Line
128 lines
TE
Figure 2 Simplified timing diagram for the original HASTE sequence. Each block represents multiple 180° RF pulses and the resulting echoes. The “zero” line is the echo that is not phase encoded, also called the central line of k-space. Phase oversampling is turned off. TE is eight times theecho spacing, and the acquisition window is 136 times the echo spacing.
63 lines
TE
128 lines
Figure 3 Shows an example with phase-encoding steps -63 to -1, followed by the “zero” line, followed by steps +1 to +128.
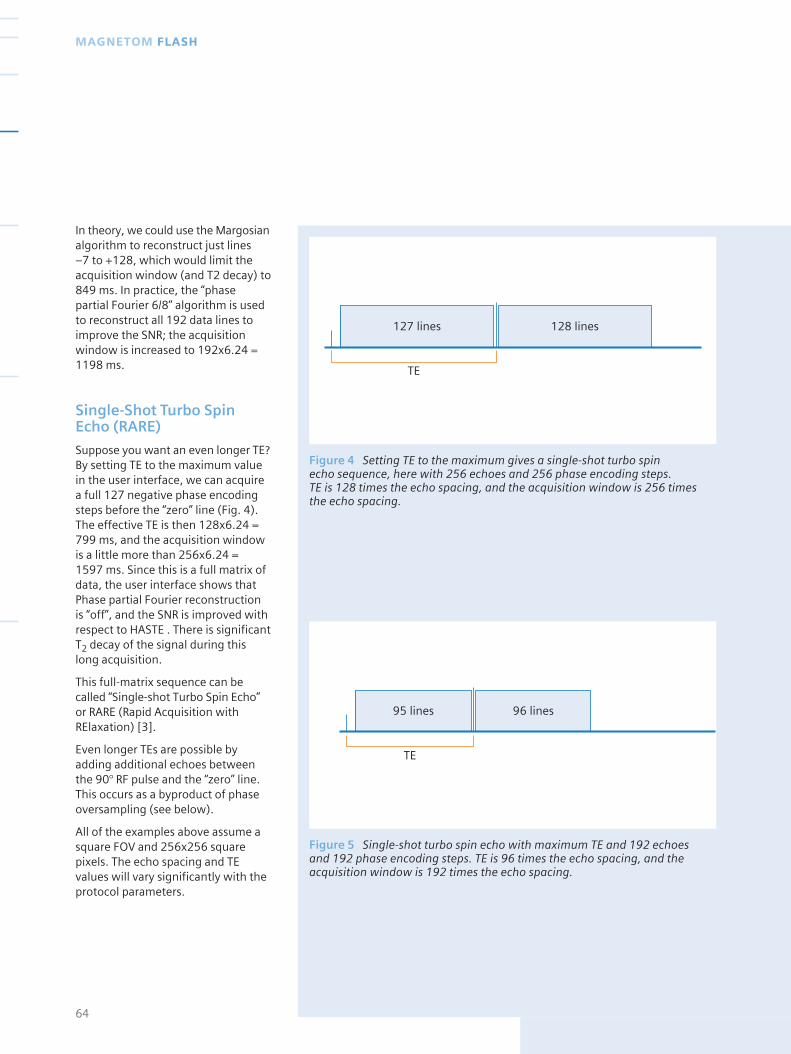
In theory, we could use the Margosianalgorithm to reconstruct just lines –7 to +128, which would limit theacquisition window (and T2 decay) to849 ms. In practice, the “phasepartial Fourier 6/8” algorithm is usedto reconstruct all 192 data lines toimprove the SNR; the acquisitionwindow is increased to 192x6.24 =1198 ms.
Single-Shot Turbo SpinEcho (RARE)
Suppose you want an even longer TE?By setting TE to the maximum valuein the user interface, we can acquirea full 127 negative phase encodingsteps before the “zero” line (Fig. 4).The effective TE is then 128x6.24 =799 ms, and the acquisition windowis a little more than 256x6.24 = 1597 ms. Since this is a full matrix ofdata, the user interface shows thatPhase partial Fourier reconstructionis “off”, and the SNR is improved withrespect to HASTE . There is significantT2 decay of the signal during thislong acquisition.
This full-matrix sequence can becalled “Single-shot Turbo Spin Echo”or RARE (Rapid Acquisition withRElaxation) [3].
Even longer TEs are possible byadding additional echoes betweenthe 90° RF pulse and the “zero” line.This occurs as a byproduct of phaseoversampling (see below).
All of the examples above assume asquare FOV and 256x256 squarepixels. The echo spacing and TEvalues will vary significantly with theprotocol parameters.
64
MAGNETOM FLASH
127 lines
TE
128 lines
Figure 4 Setting TE to the maximum gives a single-shot turbo spin echo sequence, here with 256 echoes and 256 phase encoding steps. TE is 128 times the echo spacing, and the acquisition window is 256 timesthe echo spacing.
95 lines
TE
96 lines
Figure 5 Single-shot turbo spin echo with maximum TE and 192 echoes and 192 phase encoding steps. TE is 96 times the echo spacing, and theacquisition window is 192 times the echo spacing.
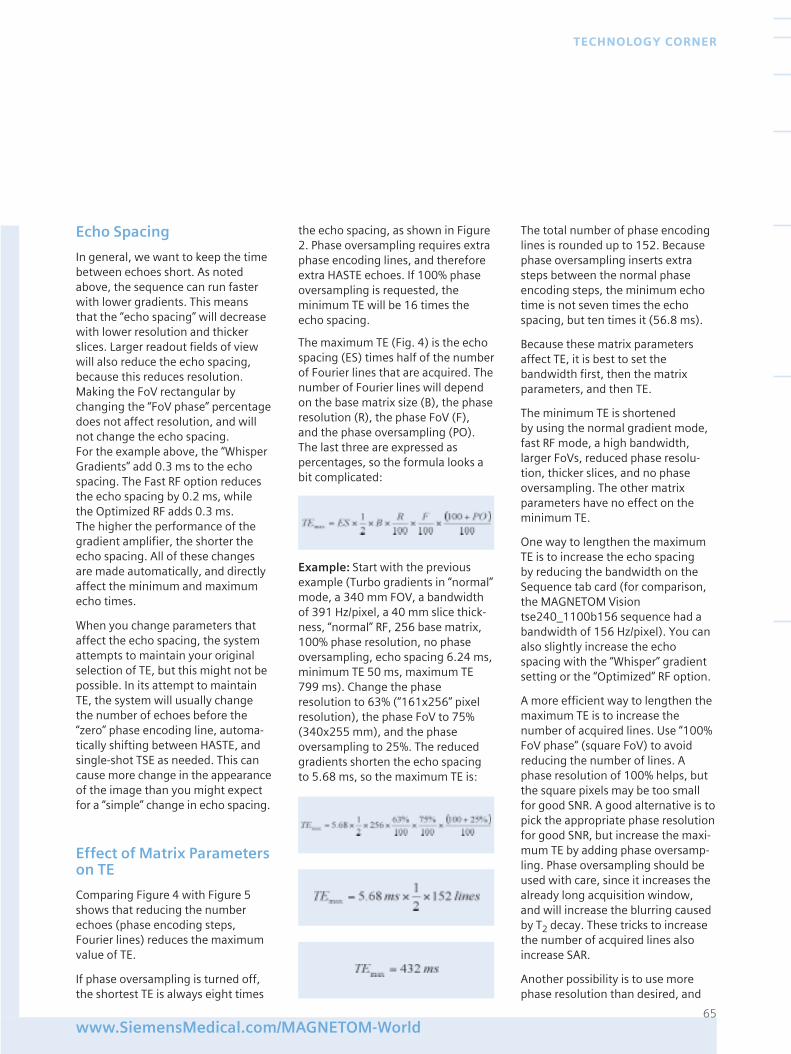
Echo Spacing
In general, we want to keep the timebetween echoes short. As notedabove, the sequence can run fasterwith lower gradients. This meansthat the “echo spacing” will decreasewith lower resolution and thickerslices. Larger readout fields of viewwill also reduce the echo spacing,because this reduces resolution.Making the FoV rectangular bychanging the “FoV phase” percentagedoes not affect resolution, and willnot change the echo spacing. For the example above, the “WhisperGradients” add 0.3 ms to the echospacing. The Fast RF option reducesthe echo spacing by 0.2 ms, whilethe Optimized RF adds 0.3 ms. The higher the performance of thegradient amplifier, the shorter theecho spacing. All of these changesare made automatically, and directlyaffect the minimum and maximumecho times.
When you change parameters thataffect the echo spacing, the systemattempts to maintain your originalselection of TE, but this might not bepossible. In its attempt to maintainTE, the system will usually changethe number of echoes before the“zero” phase encoding line, automa-tically shifting between HASTE, andsingle-shot TSE as needed. This cancause more change in the appearanceof the image than you might expectfor a “simple” change in echo spacing.
Effect of Matrix Parameterson TE
Comparing Figure 4 with Figure 5shows that reducing the numberechoes (phase encoding steps,Fourier lines) reduces the maximumvalue of TE.
If phase oversampling is turned off,the shortest TE is always eight times
the echo spacing, as shown in Figure2. Phase oversampling requires extraphase encoding lines, and thereforeextra HASTE echoes. If 100% phaseoversampling is requested, theminimum TE will be 16 times theecho spacing.
The maximum TE (Fig. 4) is the echospacing (ES) times half of the numberof Fourier lines that are acquired. Thenumber of Fourier lines will dependon the base matrix size (B), the phaseresolution (R), the phase FoV (F), and the phase oversampling (PO).The last three are expressed aspercentages, so the formula looks abit complicated:
Example: Start with the previousexample (Turbo gradients in “normal”mode, a 340 mm FOV, a bandwidthof 391 Hz/pixel, a 40 mm slice thick-ness, “normal” RF, 256 base matrix,100% phase resolution, no phaseoversampling, echo spacing 6.24 ms,minimum TE 50 ms, maximum TE799 ms). Change the phaseresolution to 63% (“161x256” pixelresolution), the phase FoV to 75%(340x255 mm), and the phaseoversampling to 25%. The reducedgradients shorten the echo spacingto 5.68 ms, so the maximum TE is:
The total number of phase encodinglines is rounded up to 152. Becausephase oversampling inserts extrasteps between the normal phaseencoding steps, the minimum echotime is not seven times the echospacing, but ten times it (56.8 ms).
Because these matrix parametersaffect TE, it is best to set thebandwidth first, then the matrixparameters, and then TE.
The minimum TE is shortened by using the normal gradient mode, fast RF mode, a high bandwidth,larger FoVs, reduced phase resolu-tion, thicker slices, and no phaseoversampling. The other matrixparameters have no effect on theminimum TE.
One way to lengthen the maximumTE is to increase the echo spacing by reducing the bandwidth on theSequence tab card (for comparison,the MAGNETOM Visiontse240_1100b156 sequence had abandwidth of 156 Hz/pixel). You canalso slightly increase the echospacing with the “Whisper” gradientsetting or the “Optimized” RF option.
A more efficient way to lengthen themaximum TE is to increase thenumber of acquired lines. Use “100%FoV phase” (square FoV) to avoidreducing the number of lines. Aphase resolution of 100% helps, butthe square pixels may be too smallfor good SNR. A good alternative is topick the appropriate phase resolutionfor good SNR, but increase the maxi-mum TE by adding phase oversamp-ling. Phase oversampling should beused with care, since it increases thealready long acquisition window, and will increase the blurring causedby T2 decay. These tricks to increasethe number of acquired lines alsoincrease SAR.
Another possibility is to use morephase resolution than desired, and
65www.SiemensMedical.com/MAGNETOM-World
TECHNOLOGY CORNER
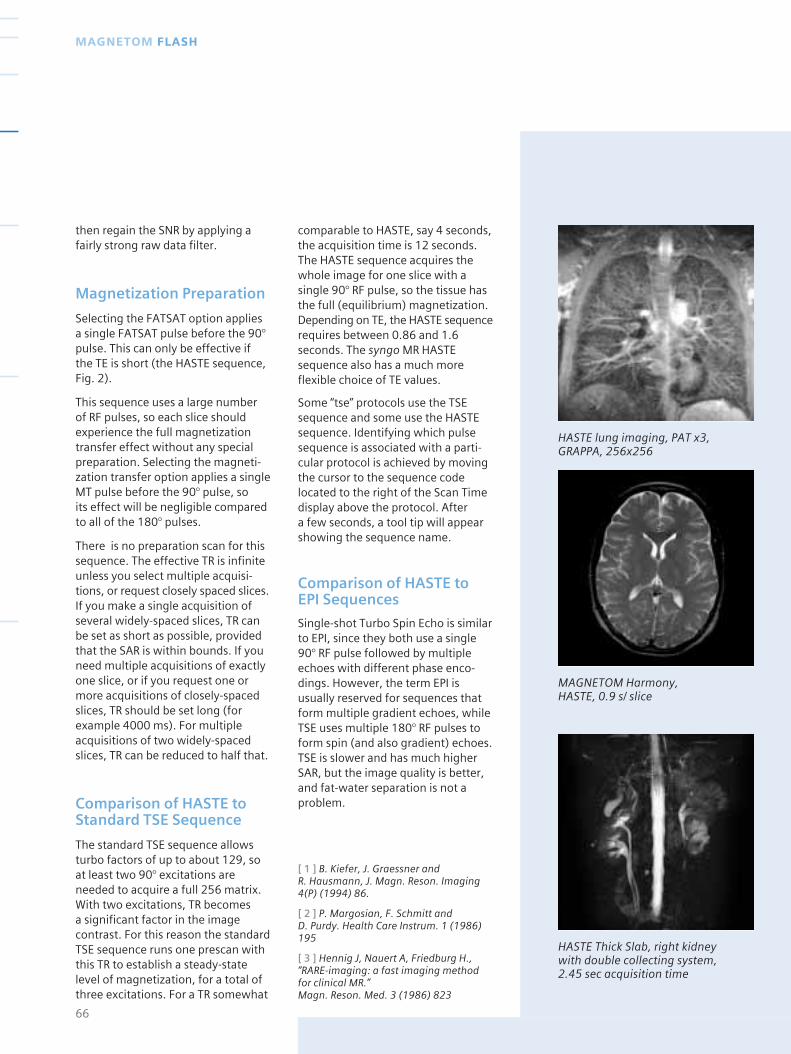
comparable to HASTE, say 4 seconds,the acquisition time is 12 seconds.The HASTE sequence acquires thewhole image for one slice with asingle 90° RF pulse, so the tissue hasthe full (equilibrium) magnetization.Depending on TE, the HASTE sequencerequires between 0.86 and 1.6seconds. The syngo MR HASTEsequence also has a much moreflexible choice of TE values.
Some “tse” protocols use the TSEsequence and some use the HASTEsequence. Identifying which pulsesequence is associated with a parti-cular protocol is achieved by movingthe cursor to the sequence codelocated to the right of the Scan Timedisplay above the protocol. After a few seconds, a tool tip will appearshowing the sequence name.
Comparison of HASTE to EPI Sequences
Single-shot Turbo Spin Echo is similarto EPI, since they both use a single90° RF pulse followed by multipleechoes with different phase enco-dings. However, the term EPI isusually reserved for sequences thatform multiple gradient echoes, whileTSE uses multiple 180° RF pulses toform spin (and also gradient) echoes.TSE is slower and has much higherSAR, but the image quality is better,and fat-water separation is not aproblem.
[ 1 ] B. Kiefer, J. Graessner and R. Hausmann, J. Magn. Reson. Imaging4(P) (1994) 86.
[ 2 ] P. Margosian, F. Schmitt and D. Purdy. Health Care Instrum. 1 (1986)195
[ 3 ] Hennig J, Nauert A, Friedburg H.,“RARE-imaging: a fast imaging methodfor clinical MR.” Magn. Reson. Med. 3 (1986) 823
66
MAGNETOM FLASH
then regain the SNR by applying afairly strong raw data filter.
Magnetization Preparation
Selecting the FATSAT option applies a single FATSAT pulse before the 90°pulse. This can only be effective if the TE is short (the HASTE sequence, Fig. 2).
This sequence uses a large number of RF pulses, so each slice shouldexperience the full magnetizationtransfer effect without any specialpreparation. Selecting the magneti-zation transfer option applies a singleMT pulse before the 90° pulse, so its effect will be negligible comparedto all of the 180° pulses.
There is no preparation scan for thissequence. The effective TR is infiniteunless you select multiple acquisi-tions, or request closely spaced slices.If you make a single acquisition ofseveral widely-spaced slices, TR canbe set as short as possible, providedthat the SAR is within bounds. If youneed multiple acquisitions of exactlyone slice, or if you request one ormore acquisitions of closely-spacedslices, TR should be set long (forexample 4000 ms). For multipleacquisitions of two widely-spacedslices, TR can be reduced to half that.
Comparison of HASTE toStandard TSE Sequence
The standard TSE sequence allowsturbo factors of up to about 129, soat least two 90° excitations areneeded to acquire a full 256 matrix.With two excitations, TR becomes a significant factor in the imagecontrast. For this reason the standardTSE sequence runs one prescan withthis TR to establish a steady-statelevel of magnetization, for a total ofthree excitations. For a TR somewhat
HASTE lung imaging, PAT x3, GRAPPA, 256x256
MAGNETOM Harmony, HASTE, 0.9 s/ slice
HASTE Thick Slab, right kidney with double collecting system, 2.45 sec acquisition time
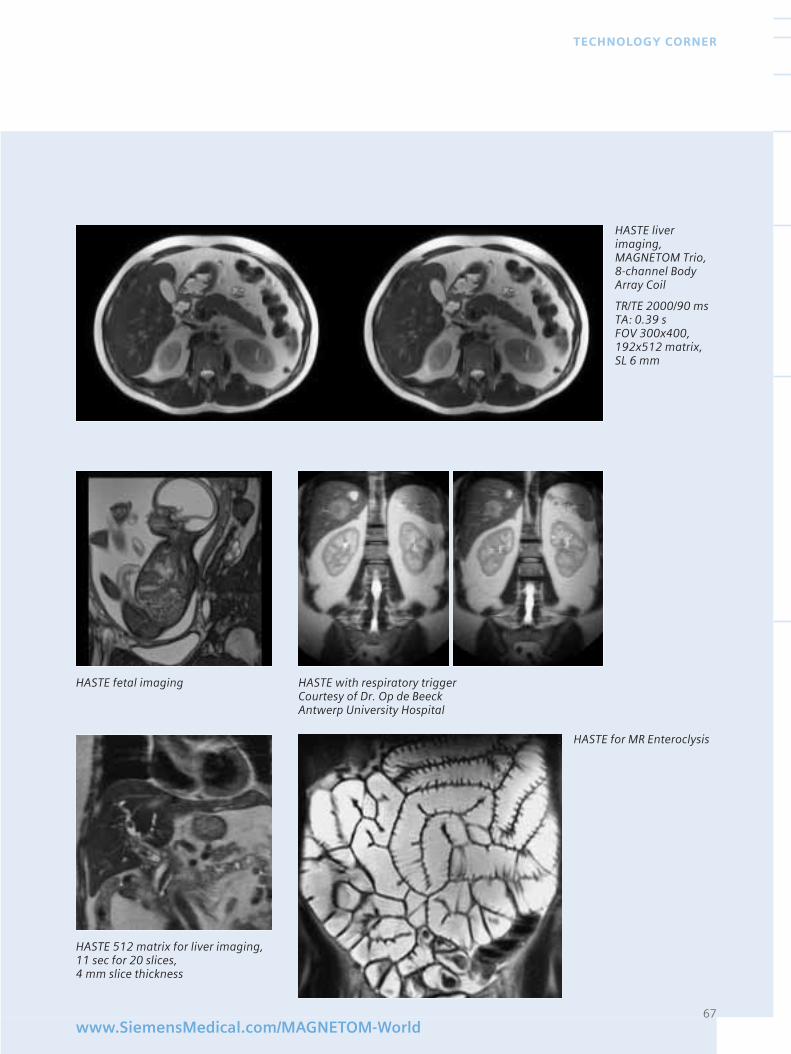
67www.SiemensMedical.com/MAGNETOM-World
TECHNOLOGY CORNER
HASTE liver imaging, MAGNETOM Trio,8-channel BodyArray Coil
TR/TE 2000/90 msTA: 0.39 sFOV 300x400,192x512 matrix,SL 6 mm
HASTE fetal imaging
HASTE 512 matrix for liver imaging,11 sec for 20 slices, 4 mm slice thickness
HASTE with respiratory triggerCourtesy of Dr. Op de BeeckAntwerp University Hospital
HASTE for MR Enteroclysis
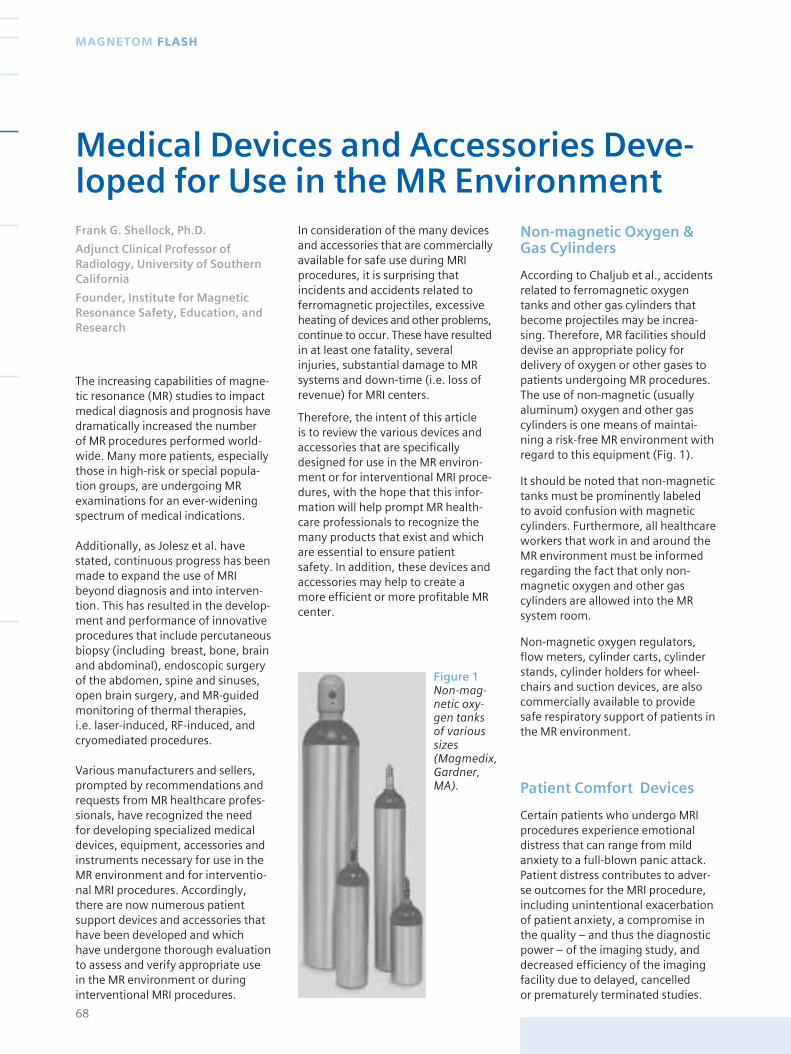
Figure 1Non-mag-netic oxy-gen tanks of varioussizes (Magmedix,Gardner,MA).
The increasing capabilities of magne-tic resonance (MR) studies to impactmedical diagnosis and prognosis havedramatically increased the number of MR procedures performed world-wide. Many more patients, especiallythose in high-risk or special popula-tion groups, are undergoing MRexaminations for an ever-wideningspectrum of medical indications.
Additionally, as Jolesz et al. havestated, continuous progress has beenmade to expand the use of MRIbeyond diagnosis and into interven-tion. This has resulted in the develop-ment and performance of innovativeprocedures that include percutaneousbiopsy (including breast, bone, brainand abdominal), endoscopic surgeryof the abdomen, spine and sinuses,open brain surgery, and MR-guidedmonitoring of thermal therapies, i.e. laser-induced, RF-induced, andcryomediated procedures.
Various manufacturers and sellers,prompted by recommendations andrequests from MR healthcare profes-sionals, have recognized the need for developing specialized medicaldevices, equipment, accessories andinstruments necessary for use in theMR environment and for interventio-nal MRI procedures. Accordingly,there are now numerous patientsupport devices and accessories thathave been developed and whichhave undergone thorough evaluationto assess and verify appropriate usein the MR environment or duringinterventional MRI procedures.
In consideration of the many devicesand accessories that are commerciallyavailable for safe use during MRIprocedures, it is surprising thatincidents and accidents related toferromagnetic projectiles, excessiveheating of devices and other problems,continue to occur. These have resultedin at least one fatality, severalinjuries, substantial damage to MRsystems and down-time (i.e. loss ofrevenue) for MRI centers.
Therefore, the intent of this article is to review the various devices andaccessories that are specificallydesigned for use in the MR environ-ment or for interventional MRI proce-dures, with the hope that this infor-mation will help prompt MR health-care professionals to recognize themany products that exist and whichare essential to ensure patient safety. In addition, these devices andaccessories may help to create amore efficient or more profitable MRcenter.
Non-magnetic Oxygen &Gas Cylinders
According to Chaljub et al., accidentsrelated to ferromagnetic oxygentanks and other gas cylinders thatbecome projectiles may be increa-sing. Therefore, MR facilities shoulddevise an appropriate policy fordelivery of oxygen or other gases topatients undergoing MR procedures.The use of non-magnetic (usuallyaluminum) oxygen and other gascylinders is one means of maintai-ning a risk-free MR environment withregard to this equipment (Fig. 1).
It should be noted that non-magnetictanks must be prominently labeled to avoid confusion with magneticcylinders. Furthermore, all healthcareworkers that work in and around theMR environment must be informedregarding the fact that only non-magnetic oxygen and other gascylinders are allowed into the MRsystem room.
Non-magnetic oxygen regulators,flow meters, cylinder carts, cylinderstands, cylinder holders for wheel-chairs and suction devices, are alsocommercially available to providesafe respiratory support of patients inthe MR environment.
Patient Comfort Devices
Certain patients who undergo MRIprocedures experience emotionaldistress that can range from mildanxiety to a full-blown panic attack.Patient distress contributes to adver-se outcomes for the MRI procedure,including unintentional exacerbationof patient anxiety, a compromise inthe quality – and thus the diagnosticpower – of the imaging study, anddecreased efficiency of the imagingfacility due to delayed, cancelled or prematurely terminated studies.
68
MAGNETOM FLASH
Medical Devices and Accessories Deve-loped for Use in the MR Environment Frank G. Shellock, Ph.D.
Adjunct Clinical Professor ofRadiology, University of SouthernCalifornia
Founder, Institute for MagneticResonance Safety, Education, andResearch
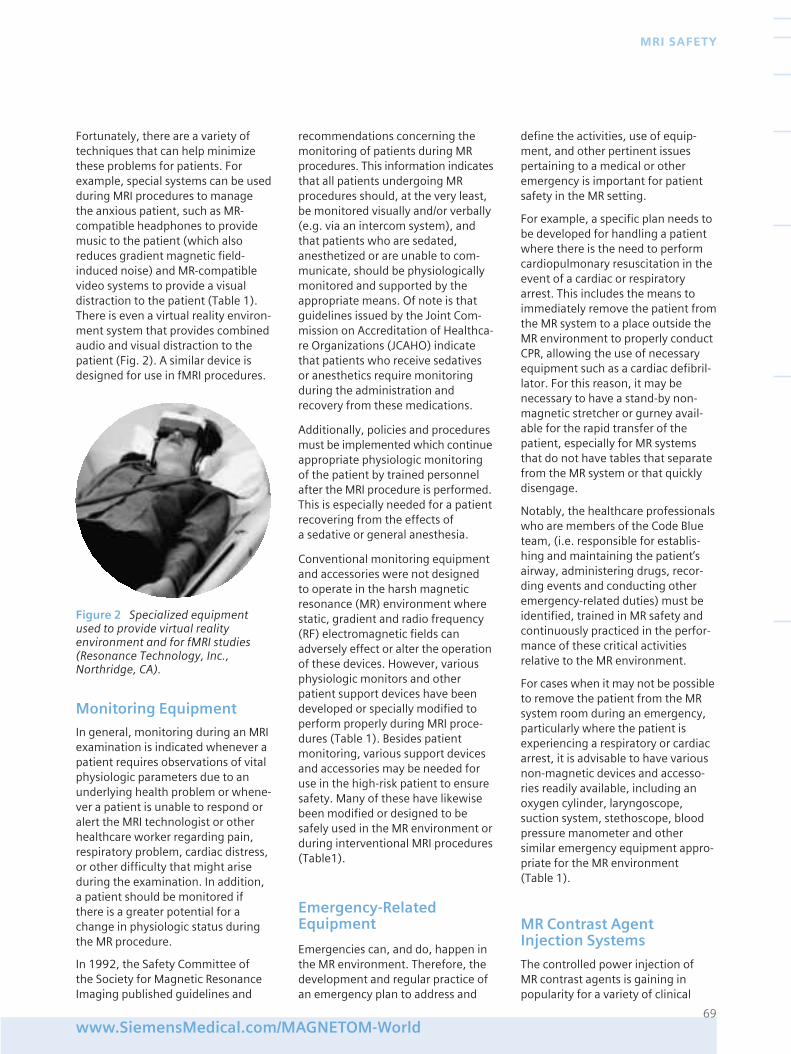
Fortunately, there are a variety oftechniques that can help minimizethese problems for patients. Forexample, special systems can be usedduring MRI procedures to managethe anxious patient, such as MR-compatible headphones to providemusic to the patient (which alsoreduces gradient magnetic field-induced noise) and MR-compatiblevideo systems to provide a visualdistraction to the patient (Table 1).There is even a virtual reality environ-ment system that provides combinedaudio and visual distraction to thepatient (Fig. 2). A similar device isdesigned for use in fMRI procedures.
recommendations concerning themonitoring of patients during MRprocedures. This information indicatesthat all patients undergoing MRprocedures should, at the very least,be monitored visually and/or verbally(e.g. via an intercom system), andthat patients who are sedated,anesthetized or are unable to com-municate, should be physiologicallymonitored and supported by theappropriate means. Of note is thatguidelines issued by the Joint Com-mission on Accreditation of Healthca-re Organizations (JCAHO) indicatethat patients who receive sedativesor anesthetics require monitoringduring the administration andrecovery from these medications.
Additionally, policies and proceduresmust be implemented which continueappropriate physiologic monitoringof the patient by trained personnelafter the MRI procedure is performed.This is especially needed for a patientrecovering from the effects of a sedative or general anesthesia.
Conventional monitoring equipmentand accessories were not designed to operate in the harsh magneticresonance (MR) environment wherestatic, gradient and radio frequency(RF) electromagnetic fields canadversely effect or alter the operationof these devices. However, variousphysiologic monitors and otherpatient support devices have beendeveloped or specially modified toperform properly during MRI proce-dures (Table 1). Besides patientmonitoring, various support devicesand accessories may be needed foruse in the high-risk patient to ensuresafety. Many of these have likewisebeen modified or designed to besafely used in the MR environment orduring interventional MRI procedures(Table1).
Emergency-RelatedEquipment
Emergencies can, and do, happen inthe MR environment. Therefore, thedevelopment and regular practice ofan emergency plan to address and
define the activities, use of equip-ment, and other pertinent issuespertaining to a medical or otheremergency is important for patientsafety in the MR setting.
For example, a specific plan needs tobe developed for handling a patientwhere there is the need to performcardiopulmonary resuscitation in theevent of a cardiac or respiratoryarrest. This includes the means toimmediately remove the patient fromthe MR system to a place outside theMR environment to properly conductCPR, allowing the use of necessaryequipment such as a cardiac defibril-lator. For this reason, it may benecessary to have a stand-by non-magnetic stretcher or gurney avail-able for the rapid transfer of thepatient, especially for MR systemsthat do not have tables that separatefrom the MR system or that quicklydisengage.
Notably, the healthcare professionalswho are members of the Code Blueteam, (i.e. responsible for establis-hing and maintaining the patient’sairway, administering drugs, recor-ding events and conducting otheremergency-related duties) must beidentified, trained in MR safety andcontinuously practiced in the perfor-mance of these critical activitiesrelative to the MR environment.
For cases when it may not be possibleto remove the patient from the MRsystem room during an emergency,particularly where the patient isexperiencing a respiratory or cardiacarrest, it is advisable to have variousnon-magnetic devices and accesso-ries readily available, including anoxygen cylinder, laryngoscope,suction system, stethoscope, bloodpressure manometer and othersimilar emergency equipment appro-priate for the MR environment (Table 1).
MR Contrast AgentInjection Systems
The controlled power injection of MR contrast agents is gaining inpopularity for a variety of clinical
69www.SiemensMedical.com/MAGNETOM-World
MRI SAFETY
Figure 2 Specialized equipmentused to provide virtual realityenvironment and for fMRI studies(Resonance Technology, Inc.,Northridge, CA).
Monitoring Equipment
In general, monitoring during an MRIexamination is indicated whenever apatient requires observations of vitalphysiologic parameters due to anunderlying health problem or whene-ver a patient is unable to respond oralert the MRI technologist or otherhealthcare worker regarding pain,respiratory problem, cardiac distress,or other difficulty that might ariseduring the examination. In addition,a patient should be monitored ifthere is a greater potential for achange in physiologic status duringthe MR procedure.
In 1992, the Safety Committee of the Society for Magnetic ResonanceImaging published guidelines and
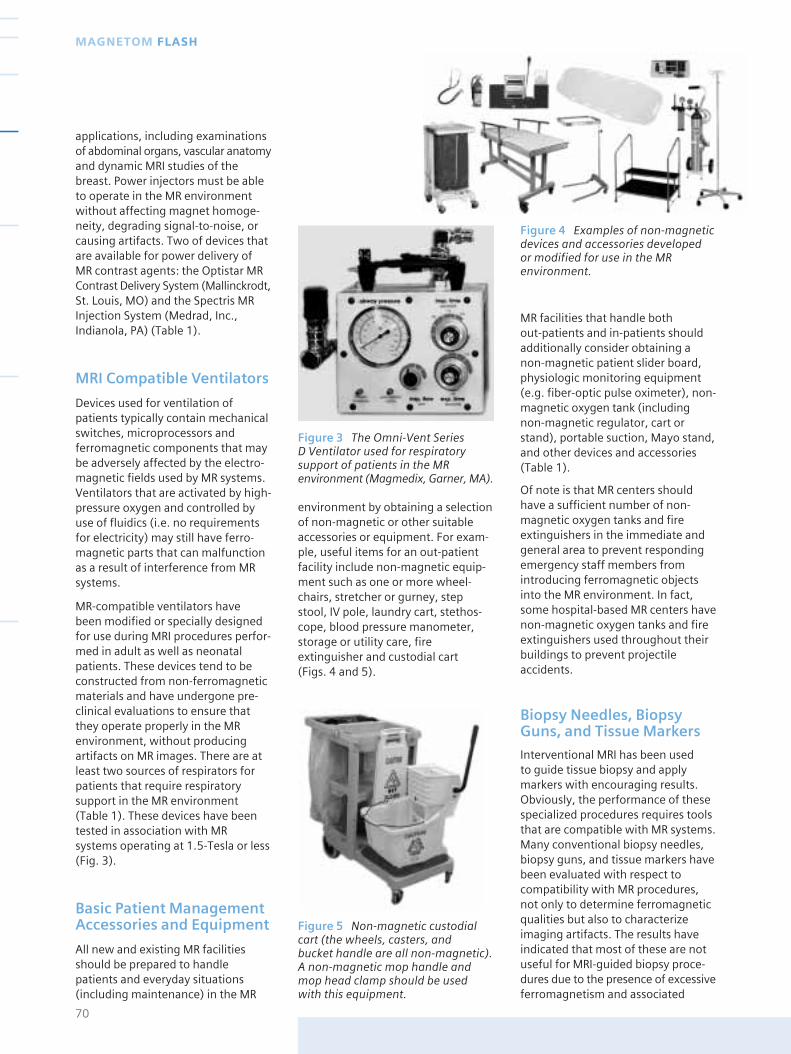
Figure 3 The Omni-Vent Series D Ventilator used for respiratorysupport of patients in the MRenvironment (Magmedix, Garner, MA).
applications, including examinationsof abdominal organs, vascular anatomyand dynamic MRI studies of thebreast. Power injectors must be ableto operate in the MR environmentwithout affecting magnet homoge-neity, degrading signal-to-noise, orcausing artifacts. Two of devices thatare available for power delivery ofMR contrast agents: the Optistar MRContrast Delivery System (Mallinckrodt,St. Louis, MO) and the Spectris MRInjection System (Medrad, Inc.,Indianola, PA) (Table 1).
MRI Compatible Ventilators
Devices used for ventilation ofpatients typically contain mechanicalswitches, microprocessors andferromagnetic components that maybe adversely affected by the electro-magnetic fields used by MR systems.Ventilators that are activated by high-pressure oxygen and controlled byuse of fluidics (i.e. no requirementsfor electricity) may still have ferro-magnetic parts that can malfunctionas a result of interference from MRsystems.
MR-compatible ventilators have been modified or specially designedfor use during MRI procedures perfor-med in adult as well as neonatalpatients. These devices tend to beconstructed from non-ferromagneticmaterials and have undergone pre-clinical evaluations to ensure thatthey operate properly in the MRenvironment, without producingartifacts on MR images. There are atleast two sources of respirators forpatients that require respiratorysupport in the MR environment(Table 1). These devices have beentested in association with MRsystems operating at 1.5-Tesla or less(Fig. 3).
Basic Patient ManagementAccessories and Equipment
All new and existing MR facilitiesshould be prepared to handlepatients and everyday situations(including maintenance) in the MR
environment by obtaining a selectionof non-magnetic or other suitableaccessories or equipment. For exam-ple, useful items for an out-patientfacility include non-magnetic equip-ment such as one or more wheel-chairs, stretcher or gurney, stepstool, IV pole, laundry cart, stethos-cope, blood pressure manometer,storage or utility care, fireextinguisher and custodial cart (Figs. 4 and 5).
MR facilities that handle both out-patients and in-patients shouldadditionally consider obtaining anon-magnetic patient slider board,physiologic monitoring equipment(e.g. fiber-optic pulse oximeter), non-magnetic oxygen tank (includingnon-magnetic regulator, cart orstand), portable suction, Mayo stand,and other devices and accessories(Table 1).
Of note is that MR centers shouldhave a sufficient number of non-magnetic oxygen tanks and fireextinguishers in the immediate andgeneral area to prevent respondingemergency staff members fromintroducing ferromagnetic objectsinto the MR environment. In fact,some hospital-based MR centers havenon-magnetic oxygen tanks and fireextinguishers used throughout theirbuildings to prevent projectileaccidents.
Biopsy Needles, BiopsyGuns, and Tissue Markers
Interventional MRI has been used to guide tissue biopsy and applymarkers with encouraging results.Obviously, the performance of thesespecialized procedures requires toolsthat are compatible with MR systems.Many conventional biopsy needles,biopsy guns, and tissue markers havebeen evaluated with respect tocompatibility with MR procedures,not only to determine ferromagneticqualities but also to characterizeimaging artifacts. The results haveindicated that most of these are notuseful for MRI-guided biopsy proce-dures due to the presence of excessiveferromagnetism and associated
70
MAGNETOM FLASH
Figure 4 Examples of non-magneticdevices and accessories developed or modified for use in the MRenvironment.
Figure 5 Non-magnetic custodialcart (the wheels, casters, and bucket handle are all non-magnetic). A non-magnetic mop handle andmop head clamp should be usedwith this equipment.
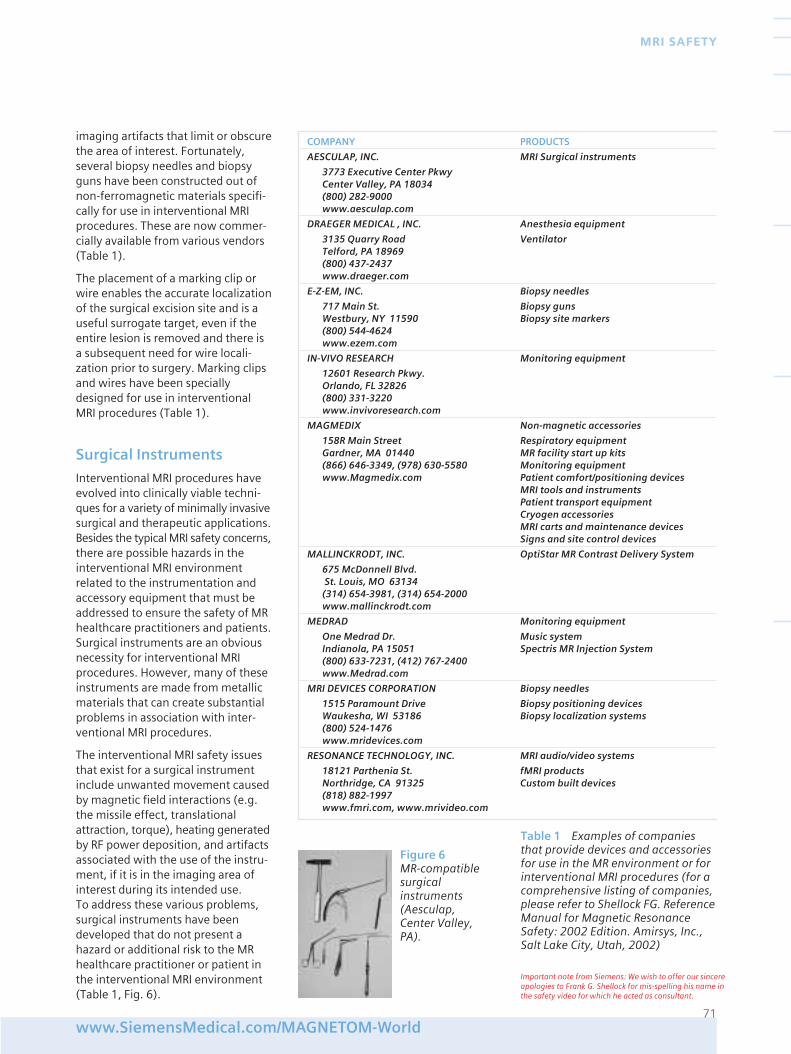
imaging artifacts that limit or obscurethe area of interest. Fortunately,several biopsy needles and biopsyguns have been constructed out ofnon-ferromagnetic materials specifi-cally for use in interventional MRIprocedures. These are now commer-cially available from various vendors(Table 1).
The placement of a marking clip orwire enables the accurate localizationof the surgical excision site and is auseful surrogate target, even if theentire lesion is removed and there isa subsequent need for wire locali-zation prior to surgery. Marking clipsand wires have been speciallydesigned for use in interventionalMRI procedures (Table 1).
Surgical Instruments
Interventional MRI procedures haveevolved into clinically viable techni-ques for a variety of minimally invasivesurgical and therapeutic applications.Besides the typical MRI safety concerns,there are possible hazards in theinterventional MRI environmentrelated to the instrumentation andaccessory equipment that must beaddressed to ensure the safety of MRhealthcare practitioners and patients.Surgical instruments are an obviousnecessity for interventional MRIprocedures. However, many of theseinstruments are made from metallicmaterials that can create substantialproblems in association with inter-ventional MRI procedures.
The interventional MRI safety issuesthat exist for a surgical instrumentinclude unwanted movement causedby magnetic field interactions (e.g.the missile effect, translationalattraction, torque), heating generatedby RF power deposition, and artifactsassociated with the use of the instru-ment, if it is in the imaging area ofinterest during its intended use. To address these various problems,surgical instruments have beendeveloped that do not present ahazard or additional risk to the MRhealthcare practitioner or patient inthe interventional MRI environment(Table 1, Fig. 6).
71www.SiemensMedical.com/MAGNETOM-World
MRI SAFETY
Figure 6MR-compatiblesurgical instruments(Aesculap, Center Valley,PA).
COMPANY PRODUCTS
AESCULAP, INC. MRI Surgical instruments
3773 Executive Center PkwyCenter Valley, PA 18034(800) 282-9000www.aesculap.com
DRAEGER MEDICAL , INC. Anesthesia equipment
3135 Quarry Road VentilatorTelford, PA 18969(800) 437-2437www.draeger.com
E-Z-EM, INC. Biopsy needles
717 Main St. Biopsy gunsWestbury, NY 11590 Biopsy site markers(800) 544-4624www.ezem.com
IN-VIVO RESEARCH Monitoring equipment
12601 Research Pkwy.Orlando, FL 32826(800) 331-3220www.invivoresearch.com
MAGMEDIX Non-magnetic accessories
158R Main Street Respiratory equipmentGardner, MA 01440 MR facility start up kits(866) 646-3349, (978) 630-5580 Monitoring equipmentwww.Magmedix.com Patient comfort/positioning devices
MRI tools and instrumentsPatient transport equipmentCryogen accessoriesMRI carts and maintenance devicesSigns and site control devices
MALLINCKRODT, INC. OptiStar MR Contrast Delivery System
675 McDonnell Blvd.St. Louis, MO 63134 (314) 654-3981, (314) 654-2000www.mallinckrodt.com
MEDRAD Monitoring equipment
One Medrad Dr. Music systemIndianola, PA 15051 Spectris MR Injection System(800) 633-7231, (412) 767-2400www.Medrad.com
MRI DEVICES CORPORATION Biopsy needles
1515 Paramount Drive Biopsy positioning devicesWaukesha, WI 53186 Biopsy localization systems(800) 524-1476www.mridevices.com
RESONANCE TECHNOLOGY, INC. MRI audio/video systems
18121 Parthenia St. fMRI productsNorthridge, CA 91325 Custom built devices(818) 882-1997www.fmri.com, www.mrivideo.com
Table 1 Examples of companiesthat provide devices and accessoriesfor use in the MR environment or forinterventional MRI procedures (for acomprehensive listing of companies,please refer to Shellock FG. ReferenceManual for Magnetic ResonanceSafety: 2002 Edition. Amirsys, Inc.,Salt Lake City, Utah, 2002)
Important note from Siemens: We wish to offer our sincereapologies to Frank G. Shellock for mis-spelling his name inthe safety video for which he acted as consultant.
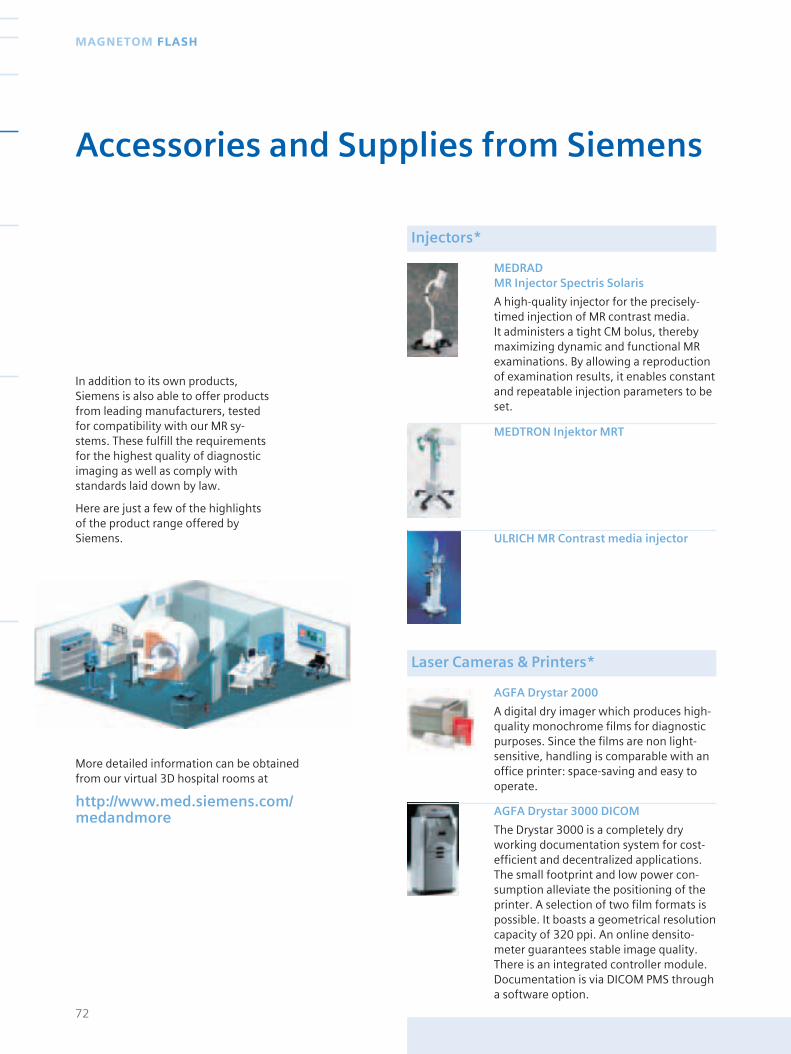
In addition to its own products,Siemens is also able to offer productsfrom leading manufacturers, testedfor compatibility with our MR sy-stems. These fulfill the requirementsfor the highest quality of diagnosticimaging as well as comply withstandards laid down by law.
Here are just a few of the highlightsof the product range offered bySiemens.
Injectors*
Laser Cameras & Printers*
MEDRAD MR Injector Spectris Solaris
A high-quality injector for the precisely-timed injection of MR contrast media. It administers a tight CM bolus, therebymaximizing dynamic and functional MRexaminations. By allowing a reproductionof examination results, it enables constantand repeatable injection parameters to beset.
72
MAGNETOM FLASH
Accessories and Supplies from Siemens
MEDTRON Injektor MRT
AGFA Drystar 2000
A digital dry imager which produces high-quality monochrome films for diagnosticpurposes. Since the films are non light-sensitive, handling is comparable with anoffice printer: space-saving and easy tooperate.
More detailed information can be obtained from our virtual 3D hospital rooms at
http://www.med.siemens.com/medandmore
ULRICH MR Contrast media injector
AGFA Drystar 3000 DICOM
The Drystar 3000 is a completely dryworking documentation system for cost-efficient and decentralized applications.The small footprint and low power con-sumption alleviate the positioning of theprinter. A selection of two film formats ispossible. It boasts a geometrical resolutioncapacity of 320 ppi. An online densito-meter guarantees stable image quality.There is an integrated controller module.Documentation is via DICOM PMS througha software option.
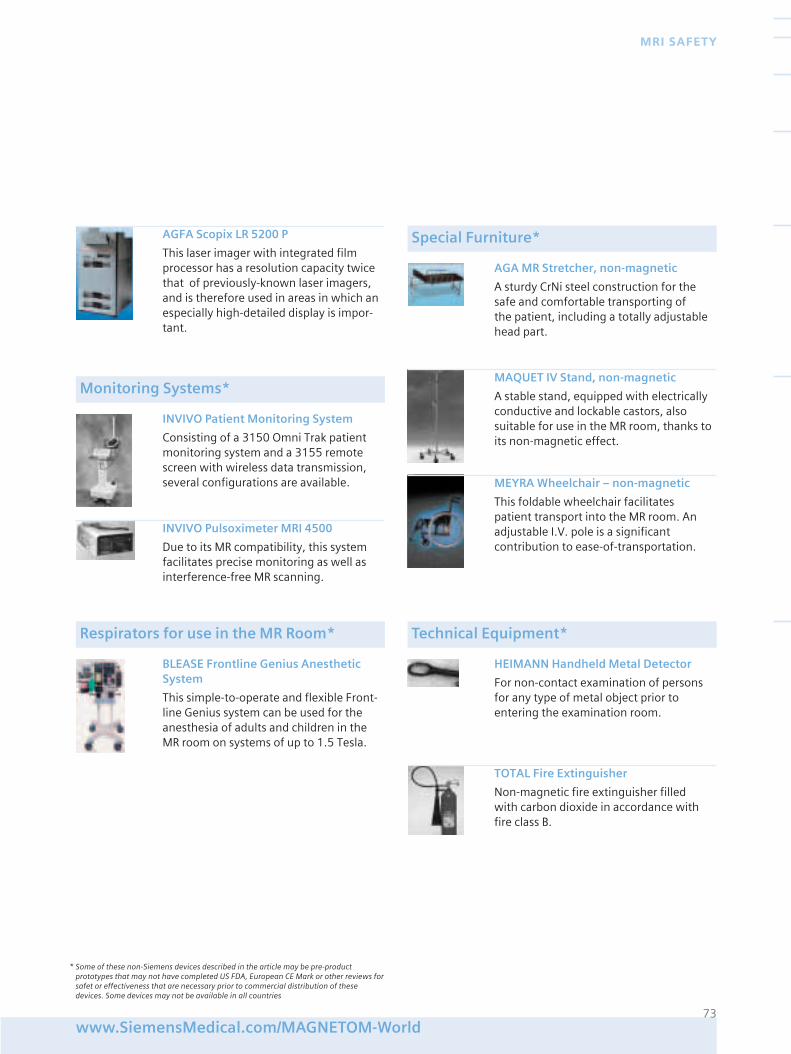
73www.SiemensMedical.com/MAGNETOM-World
MRI SAFETY
INVIVO Patient Monitoring System
Consisting of a 3150 Omni Trak patientmonitoring system and a 3155 remotescreen with wireless data transmission,several configurations are available.
BLEASE Frontline Genius AnestheticSystem
This simple-to-operate and flexible Front-line Genius system can be used for theanesthesia of adults and children in theMR room on systems of up to 1.5 Tesla.
AGA MR Stretcher, non-magnetic
A sturdy CrNi steel construction for thesafe and comfortable transporting of the patient, including a totally adjustable head part.
HEIMANN Handheld Metal Detector
For non-contact examination of personsfor any type of metal object prior toentering the examination room.
Monitoring Systems*
Respirators for use in the MR Room*
Special Furniture*
Technical Equipment*
AGFA Scopix LR 5200 P
This laser imager with integrated filmprocessor has a resolution capacity twicethat of previously-known laser imagers,and is therefore used in areas in which anespecially high-detailed display is impor-tant.
MAQUET IV Stand, non-magnetic
A stable stand, equipped with electricallyconductive and lockable castors, alsosuitable for use in the MR room, thanks toits non-magnetic effect.
MEYRA Wheelchair – non-magnetic
This foldable wheelchair facilitates patient transport into the MR room. Anadjustable I.V. pole is a significant contribution to ease-of-transportation.
TOTAL Fire Extinguisher
Non-magnetic fire extinguisher filled with carbon dioxide in accordance withfire class B.
INVIVO Pulsoximeter MRI 4500
Due to its MR compatibility, this systemfacilitates precise monitoring as well asinterference-free MR scanning.
* Some of these non-Siemens devices described in the article may be pre-productprototypes that may not have completed US FDA, European CE Mark or other reviews forsafet or effectiveness that are necessary prior to commercial distribution of thesedevices. Some devices may not be available in all countries
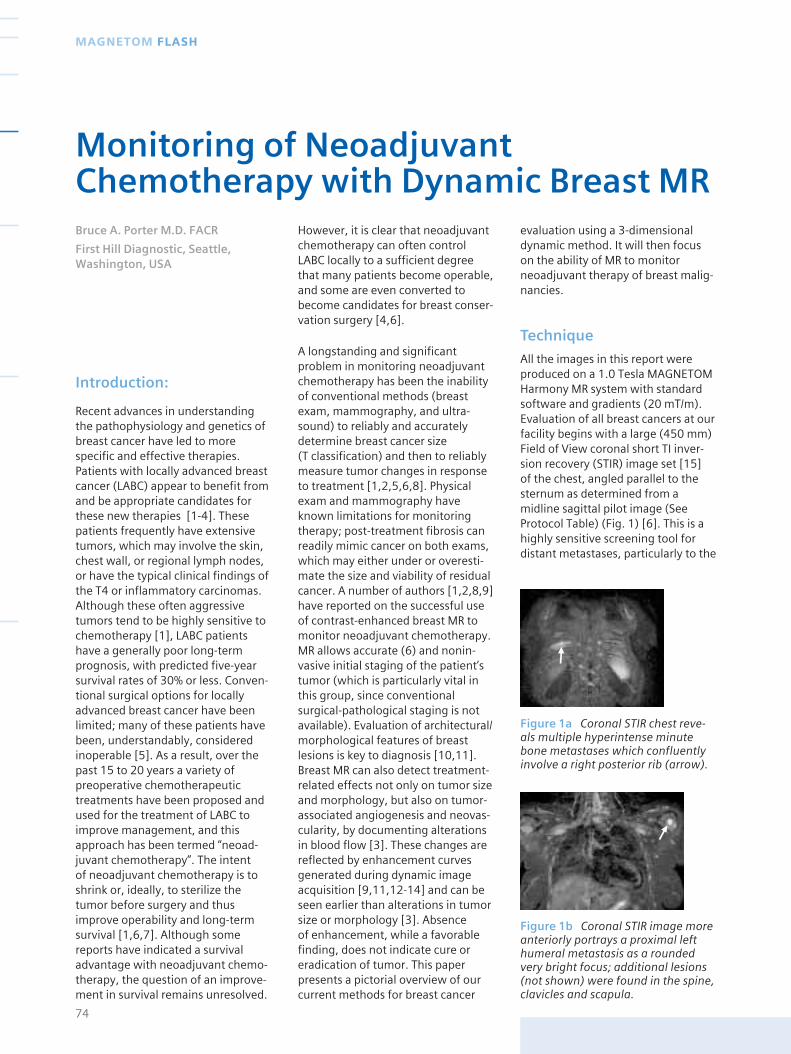
Figure 1b Coronal STIR image moreanteriorly portrays a proximal lefthumeral metastasis as a roundedvery bright focus; additional lesions(not shown) were found in the spine,clavicles and scapula.
Figure 1a Coronal STIR chest reve-als multiple hyperintense minutebone metastases which confluentlyinvolve a right posterior rib (arrow).
Introduction:
Recent advances in understandingthe pathophysiology and genetics ofbreast cancer have led to morespecific and effective therapies.Patients with locally advanced breastcancer (LABC) appear to benefit fromand be appropriate candidates forthese new therapies [1-4]. Thesepatients frequently have extensivetumors, which may involve the skin,chest wall, or regional lymph nodes,or have the typical clinical findings ofthe T4 or inflammatory carcinomas.Although these often aggressivetumors tend to be highly sensitive tochemotherapy [1], LABC patientshave a generally poor long-termprognosis, with predicted five-yearsurvival rates of 30% or less. Conven-tional surgical options for locallyadvanced breast cancer have beenlimited; many of these patients havebeen, understandably, consideredinoperable [5]. As a result, over thepast 15 to 20 years a variety ofpreoperative chemotherapeutictreatments have been proposed andused for the treatment of LABC toimprove management, and thisapproach has been termed “neoad-juvant chemotherapy”. The intent of neoadjuvant chemotherapy is toshrink or, ideally, to sterilize thetumor before surgery and thusimprove operability and long-termsurvival [1,6,7]. Although somereports have indicated a survivaladvantage with neoadjuvant chemo-therapy, the question of an improve-ment in survival remains unresolved.
However, it is clear that neoadjuvantchemotherapy can often controlLABC locally to a sufficient degreethat many patients become operable,and some are even converted tobecome candidates for breast conser-vation surgery [4,6].
A longstanding and significantproblem in monitoring neoadjuvantchemotherapy has been the inabilityof conventional methods (breastexam, mammography, and ultra-sound) to reliably and accuratelydetermine breast cancer size (T classification) and then to reliablymeasure tumor changes in responseto treatment [1,2,5,6,8]. Physicalexam and mammography haveknown limitations for monitoringtherapy; post-treatment fibrosis canreadily mimic cancer on both exams,which may either under or overesti-mate the size and viability of residualcancer. A number of authors [1,2,8,9]have reported on the successful useof contrast-enhanced breast MR tomonitor neoadjuvant chemotherapy.MR allows accurate (6) and nonin-vasive initial staging of the patient’stumor (which is particularly vital inthis group, since conventionalsurgical-pathological staging is notavailable). Evaluation of architectural/morphological features of breastlesions is key to diagnosis [10,11].Breast MR can also detect treatment-related effects not only on tumor sizeand morphology, but also on tumor-associated angiogenesis and neovas-cularity, by documenting alterationsin blood flow [3]. These changes arereflected by enhancement curvesgenerated during dynamic imageacquisition [9,11,12-14] and can beseen earlier than alterations in tumorsize or morphology [3]. Absence of enhancement, while a favorablefinding, does not indicate cure oreradication of tumor. This paperpresents a pictorial overview of ourcurrent methods for breast cancer
evaluation using a 3-dimensionaldynamic method. It will then focuson the ability of MR to monitorneoadjuvant therapy of breast malig-nancies.
Technique
All the images in this report wereproduced on a 1.0 Tesla MAGNETOMHarmony MR system with standardsoftware and gradients (20 mT/m).Evaluation of all breast cancers at ourfacility begins with a large (450 mm)Field of View coronal short TI inver-sion recovery (STIR) image set [15] of the chest, angled parallel to thesternum as determined from amidline sagittal pilot image (SeeProtocol Table) (Fig. 1) [6]. This is ahighly sensitive screening tool fordistant metastases, particularly to the
74
MAGNETOM FLASH
Monitoring of NeoadjuvantChemotherapy with Dynamic Breast MRBruce A. Porter M.D. FACR
First Hill Diagnostic, Seattle,Washington, USA
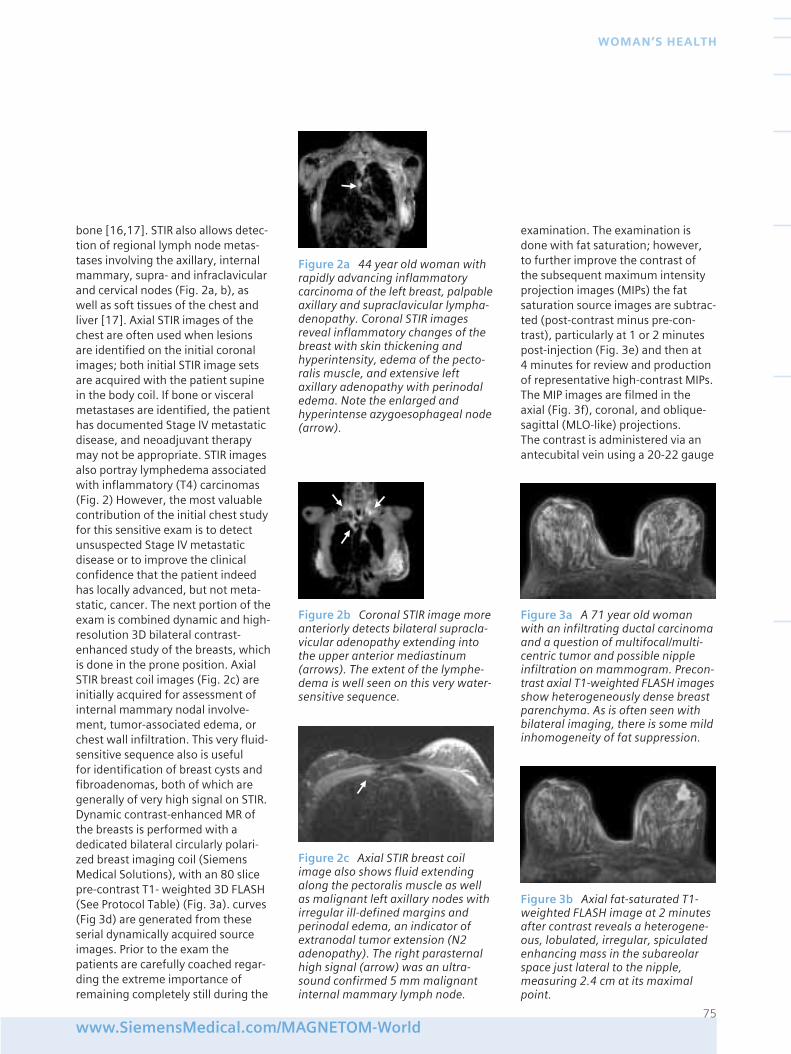
bone [16,17]. STIR also allows detec-tion of regional lymph node metas-tases involving the axillary, internalmammary, supra- and infraclavicularand cervical nodes (Fig. 2a, b), aswell as soft tissues of the chest andliver [17]. Axial STIR images of thechest are often used when lesionsare identified on the initial coronalimages; both initial STIR image setsare acquired with the patient supinein the body coil. If bone or visceralmetastases are identified, the patienthas documented Stage IV metastaticdisease, and neoadjuvant therapymay not be appropriate. STIR imagesalso portray lymphedema associatedwith inflammatory (T4) carcinomas(Fig. 2) However, the most valuablecontribution of the initial chest studyfor this sensitive exam is to detectunsuspected Stage IV metastaticdisease or to improve the clinicalconfidence that the patient indeedhas locally advanced, but not meta-static, cancer. The next portion of theexam is combined dynamic and high-resolution 3D bilateral contrast-enhanced study of the breasts, whichis done in the prone position. AxialSTIR breast coil images (Fig. 2c) areinitially acquired for assessment ofinternal mammary nodal involve-ment, tumor-associated edema, orchest wall infiltration. This very fluid-sensitive sequence also is useful for identification of breast cysts andfibroadenomas, both of which aregenerally of very high signal on STIR.Dynamic contrast-enhanced MR ofthe breasts is performed with adedicated bilateral circularly polari-zed breast imaging coil (SiemensMedical Solutions), with an 80 slicepre-contrast T1- weighted 3D FLASH(See Protocol Table) (Fig. 3a). curves(Fig 3d) are generated from theseserial dynamically acquired sourceimages. Prior to the exam thepatients are carefully coached regar-ding the extreme importance ofremaining completely still during the
examination. The examination isdone with fat saturation; however, to further improve the contrast of the subsequent maximum intensityprojection images (MIPs) the fatsaturation source images are subtrac-ted (post-contrast minus pre-con-trast), particularly at 1 or 2 minutespost-injection (Fig. 3e) and then at 4 minutes for review and productionof representative high-contrast MIPs.The MIP images are filmed in theaxial (Fig. 3f), coronal, and oblique-sagittal (MLO-like) projections. The contrast is administered via anantecubital vein using a 20-22 gauge
75www.SiemensMedical.com/MAGNETOM-World
WOMAN’S HEALTH
Figure 2b Coronal STIR image moreanteriorly detects bilateral supracla-vicular adenopathy extending intothe upper anterior mediastinum(arrows). The extent of the lymphe-dema is well seen on this very water-sensitive sequence.
Figure 2a 44 year old woman withrapidly advancing inflammatorycarcinoma of the left breast, palpableaxillary and supraclavicular lympha-denopathy. Coronal STIR imagesreveal inflammatory changes of thebreast with skin thickening andhyperintensity, edema of the pecto-ralis muscle, and extensive leftaxillary adenopathy with perinodaledema. Note the enlarged andhyperintense azygoesophageal node(arrow).
Figure 3a A 71 year old womanwith an infiltrating ductal carcinomaand a question of multifocal/multi-centric tumor and possible nippleinfiltration on mammogram. Precon-trast axial T1-weighted FLASH imagesshow heterogeneously dense breastparenchyma. As is often seen withbilateral imaging, there is some mildinhomogeneity of fat suppression.
Figure 3b Axial fat-saturated T1-weighted FLASH image at 2 minutesafter contrast reveals a heterogene-ous, lobulated, irregular, spiculatedenhancing mass in the subareolarspace just lateral to the nipple,measuring 2.4 cm at its maximalpoint.
Figure 2c Axial STIR breast coilimage also shows fluid extendingalong the pectoralis muscle as wellas malignant left axillary nodes withirregular ill-defined margins andperinodal edema, an indicator ofextranodal tumor extension (N2adenopathy). The right parasternalhigh signal (arrow) was an ultra-sound confirmed 5 mm malignantinternal mammary lymph node.
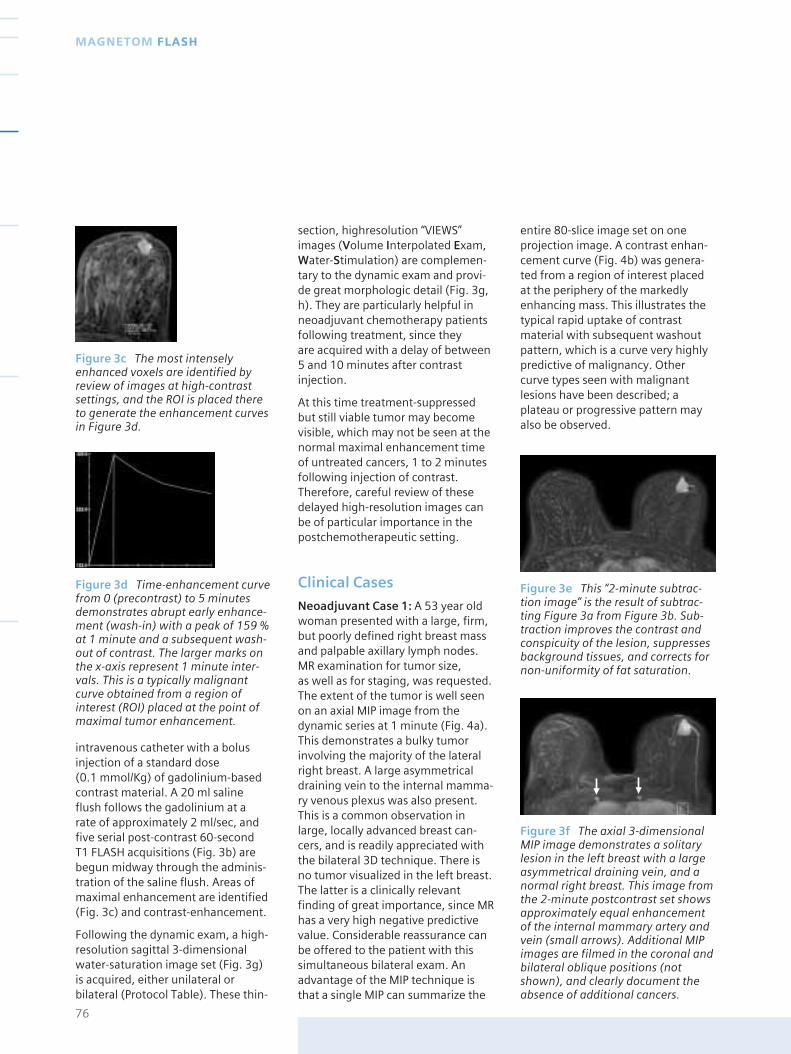
section, highresolution “VIEWS”images (Volume Interpolated Exam,Water-Stimulation) are complemen-tary to the dynamic exam and provi-de great morphologic detail (Fig. 3g,h). They are particularly helpful inneoadjuvant chemotherapy patientsfollowing treatment, since they are acquired with a delay of between5 and 10 minutes after contrastinjection.
At this time treatment-suppressedbut still viable tumor may becomevisible, which may not be seen at thenormal maximal enhancement timeof untreated cancers, 1 to 2 minutesfollowing injection of contrast.Therefore, careful review of thesedelayed high-resolution images canbe of particular importance in thepostchemotherapeutic setting.
Clinical Cases
Neoadjuvant Case 1: A 53 year oldwoman presented with a large, firm,but poorly defined right breast massand palpable axillary lymph nodes.MR examination for tumor size, as well as for staging, was requested.The extent of the tumor is well seenon an axial MIP image from thedynamic series at 1 minute (Fig. 4a).This demonstrates a bulky tumorinvolving the majority of the lateralright breast. A large asymmetricaldraining vein to the internal mamma-ry venous plexus was also present.This is a common observation inlarge, locally advanced breast can-cers, and is readily appreciated withthe bilateral 3D technique. There isno tumor visualized in the left breast.The latter is a clinically relevantfinding of great importance, since MRhas a very high negative predictivevalue. Considerable reassurance canbe offered to the patient with thissimultaneous bilateral exam. Anadvantage of the MIP technique isthat a single MIP can summarize the
entire 80-slice image set on oneprojection image. A contrast enhan-cement curve (Fig. 4b) was genera-ted from a region of interest placedat the periphery of the markedlyenhancing mass. This illustrates thetypical rapid uptake of contrastmaterial with subsequent washoutpattern, which is a curve very highlypredictive of malignancy. Othercurve types seen with malignantlesions have been described; aplateau or progressive pattern mayalso be observed.
76
MAGNETOM FLASH
Figure 3c The most intenselyenhanced voxels are identified byreview of images at high-contrastsettings, and the ROI is placed thereto generate the enhancement curvesin Figure 3d.
Figure 3d Time-enhancement curvefrom 0 (precontrast) to 5 minutesdemonstrates abrupt early enhance-ment (wash-in) with a peak of 159 %at 1 minute and a subsequent wash-out of contrast. The larger marks onthe x-axis represent 1 minute inter-vals. This is a typically malignantcurve obtained from a region ofinterest (ROI) placed at the point ofmaximal tumor enhancement.
Figure 3e This “2-minute subtrac-tion image” is the result of subtrac-ting Figure 3a from Figure 3b. Sub-traction improves the contrast andconspicuity of the lesion, suppressesbackground tissues, and corrects fornon-uniformity of fat saturation.
Figure 3f The axial 3-dimensionalMIP image demonstrates a solitarylesion in the left breast with a largeasymmetrical draining vein, and anormal right breast. This image fromthe 2-minute postcontrast set showsapproximately equal enhancementof the internal mammary artery andvein (small arrows). Additional MIPimages are filmed in the coronal andbilateral oblique positions (notshown), and clearly document theabsence of additional cancers.
intravenous catheter with a bolusinjection of a standard dose (0.1 mmol/Kg) of gadolinium-basedcontrast material. A 20 ml salineflush follows the gadolinium at a rate of approximately 2 ml/sec, andfive serial post-contrast 60-second T1 FLASH acquisitions (Fig. 3b) arebegun midway through the adminis-tration of the saline flush. Areas ofmaximal enhancement are identified(Fig. 3c) and contrast-enhancement.
Following the dynamic exam, a high-resolution sagittal 3-dimensionalwater-saturation image set (Fig. 3g)is acquired, either unilateral orbilateral (Protocol Table). These thin-
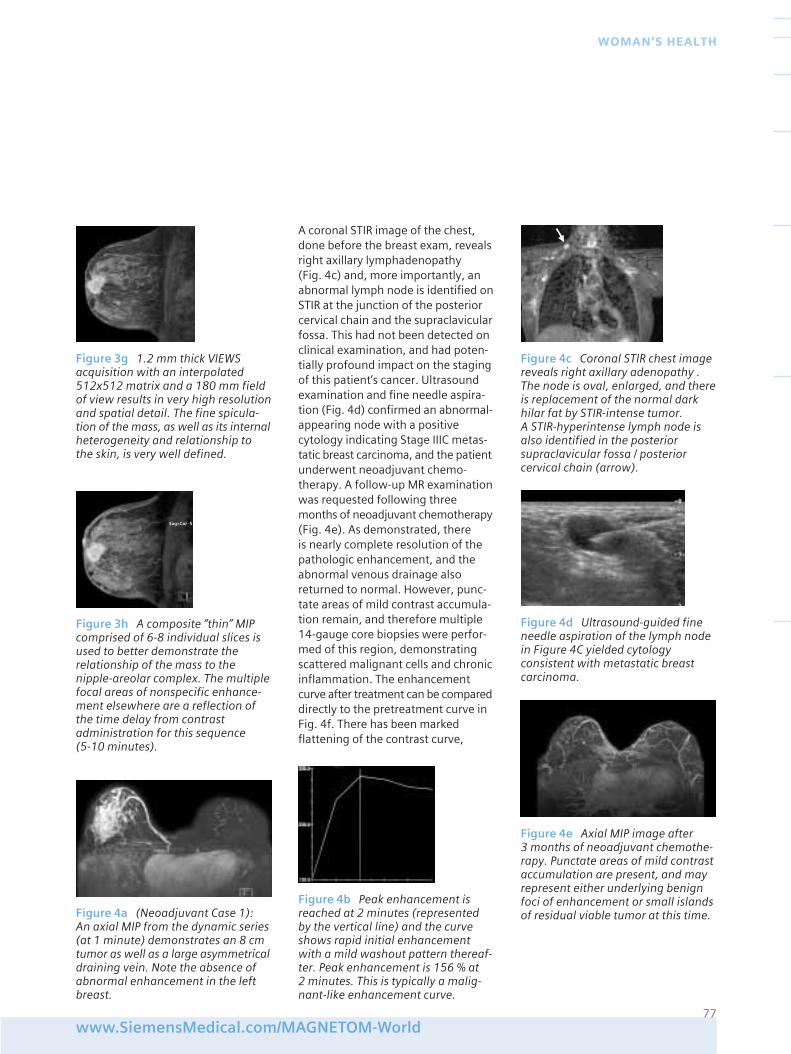
A coronal STIR image of the chest,done before the breast exam, revealsright axillary lymphadenopathy (Fig. 4c) and, more importantly, anabnormal lymph node is identified onSTIR at the junction of the posteriorcervical chain and the supraclavicularfossa. This had not been detected onclinical examination, and had poten-tially profound impact on the stagingof this patient’s cancer. Ultrasoundexamination and fine needle aspira-tion (Fig. 4d) confirmed an abnormal-appearing node with a positivecytology indicating Stage IIIC metas-tatic breast carcinoma, and the patientunderwent neoadjuvant chemo-therapy. A follow-up MR examinationwas requested following threemonths of neoadjuvant chemotherapy(Fig. 4e). As demonstrated, there is nearly complete resolution of thepathologic enhancement, and theabnormal venous drainage alsoreturned to normal. However, punc-tate areas of mild contrast accumula-tion remain, and therefore multiple14-gauge core biopsies were perfor-med of this region, demonstratingscattered malignant cells and chronicinflammation. The enhancementcurve after treatment can be compareddirectly to the pretreatment curve inFig. 4f. There has been markedflattening of the contrast curve,
77www.SiemensMedical.com/MAGNETOM-World
WOMAN’S HEALTH
Figure 4a (Neoadjuvant Case 1): An axial MIP from the dynamic series(at 1 minute) demonstrates an 8 cmtumor as well as a large asymmetricaldraining vein. Note the absence ofabnormal enhancement in the leftbreast.
Figure 3h A composite “thin” MIPcomprised of 6-8 individual slices isused to better demonstrate therelationship of the mass to thenipple-areolar complex. The multiplefocal areas of nonspecific enhance-ment elsewhere are a reflection ofthe time delay from contrastadministration for this sequence (5-10 minutes).
Figure 3g 1.2 mm thick VIEWSacquisition with an interpolated 512x512 matrix and a 180 mm fieldof view results in very high resolutionand spatial detail. The fine spicula-tion of the mass, as well as its internalheterogeneity and relationship to the skin, is very well defined.
Figure 4e Axial MIP image after 3 months of neoadjuvant chemothe-rapy. Punctate areas of mild contrastaccumulation are present, and mayrepresent either underlying benignfoci of enhancement or small islandsof residual viable tumor at this time.
Figure 4d Ultrasound-guided fineneedle aspiration of the lymph nodein Figure 4C yielded cytologyconsistent with metastatic breastcarcinoma.
Figure 4b Peak enhancement isreached at 2 minutes (representedby the vertical line) and the curveshows rapid initial enhancementwith a mild washout pattern thereaf-ter. Peak enhancement is 156 % at 2 minutes. This is typically a malig-nant-like enhancement curve.
Figure 4c Coronal STIR chest imagereveals right axillary adenopathy .The node is oval, enlarged, and thereis replacement of the normal darkhilar fat by STIR-intense tumor. A STIR-hyperintense lymph node isalso identified in the posteriorsupraclavicular fossa / posteriorcervical chain (arrow).
Sag>Cor -5
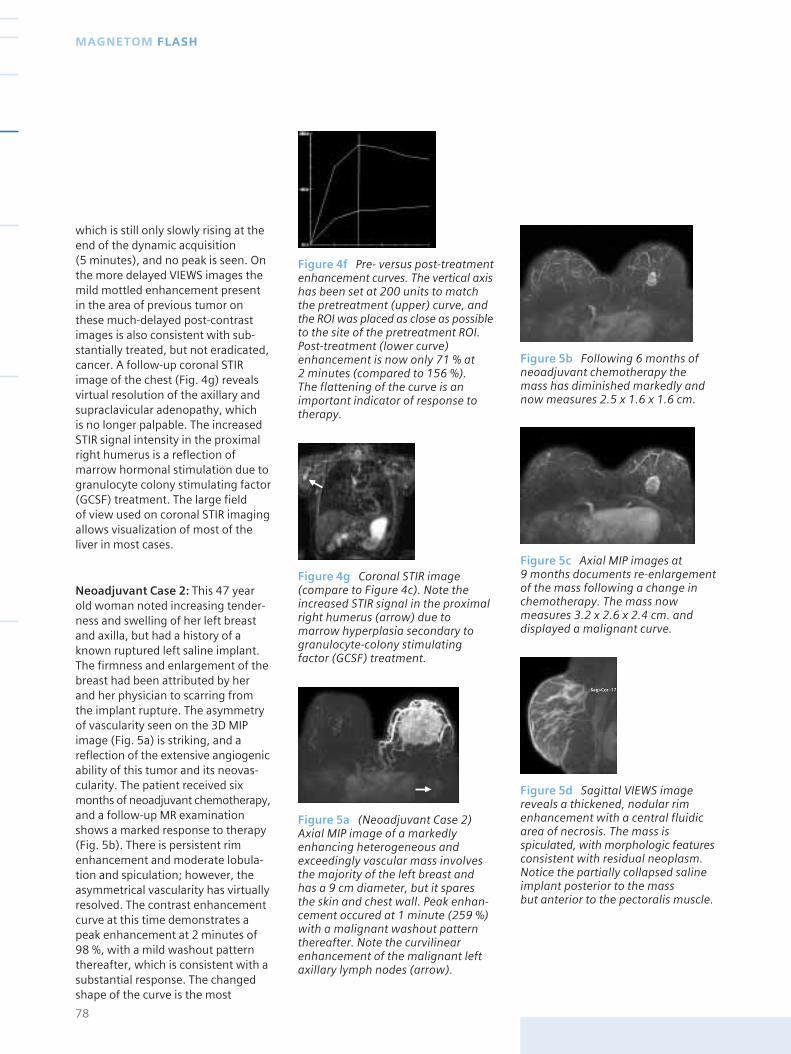
which is still only slowly rising at theend of the dynamic acquisition (5 minutes), and no peak is seen. Onthe more delayed VIEWS images themild mottled enhancement presentin the area of previous tumor onthese much-delayed post-contrastimages is also consistent with sub-stantially treated, but not eradicated,cancer. A follow-up coronal STIRimage of the chest (Fig. 4g) revealsvirtual resolution of the axillary andsupraclavicular adenopathy, which is no longer palpable. The increasedSTIR signal intensity in the proximalright humerus is a reflection ofmarrow hormonal stimulation due togranulocyte colony stimulating factor(GCSF) treatment. The large field of view used on coronal STIR imagingallows visualization of most of theliver in most cases.
Neoadjuvant Case 2: This 47 yearold woman noted increasing tender-ness and swelling of her left breastand axilla, but had a history of aknown ruptured left saline implant.The firmness and enlargement of thebreast had been attributed by herand her physician to scarring fromthe implant rupture. The asymmetryof vascularity seen on the 3D MIPimage (Fig. 5a) is striking, and areflection of the extensive angiogenicability of this tumor and its neovas-cularity. The patient received sixmonths of neoadjuvant chemotherapy,and a follow-up MR examinationshows a marked response to therapy(Fig. 5b). There is persistent rimenhancement and moderate lobula-tion and spiculation; however, theasymmetrical vascularity has virtuallyresolved. The contrast enhancementcurve at this time demonstrates apeak enhancement at 2 minutes of98 %, with a mild washout patternthereafter, which is consistent with asubstantial response. The changedshape of the curve is the most
78
MAGNETOM FLASH
Figure 4f Pre- versus post-treatmentenhancement curves. The vertical axishas been set at 200 units to matchthe pretreatment (upper) curve, andthe ROI was placed as close as possibleto the site of the pretreatment ROI.Post-treatment (lower curve)enhancement is now only 71 % at 2 minutes (compared to 156 %). The flattening of the curve is animportant indicator of response totherapy.
Figure 4g Coronal STIR image(compare to Figure 4c). Note theincreased STIR signal in the proximalright humerus (arrow) due tomarrow hyperplasia secondary togranulocyte-colony stimulatingfactor (GCSF) treatment.
Figure 5a (Neoadjuvant Case 2)Axial MIP image of a markedlyenhancing heterogeneous andexceedingly vascular mass involvesthe majority of the left breast andhas a 9 cm diameter, but it sparesthe skin and chest wall. Peak enhan-cement occured at 1 minute (259 %)with a malignant washout patternthereafter. Note the curvilinearenhancement of the malignant leftaxillary lymph nodes (arrow).
Figure 5b Following 6 months ofneoadjuvant chemotherapy themass has diminished markedly andnow measures 2.5 x 1.6 x 1.6 cm.
Figure 5c Axial MIP images at 9 months documents re-enlargementof the mass following a change inchemotherapy. The mass nowmeasures 3.2 x 2.6 x 2.4 cm. anddisplayed a malignant curve.
Figure 5d Sagittal VIEWS imagereveals a thickened, nodular rimenhancement with a central fluidicarea of necrosis. The mass isspiculated, with morphologic featuresconsistent with residual neoplasm.Notice the partially collapsed salineimplant posterior to the mass but anterior to the pectoralis muscle.
Sag>Cor -17
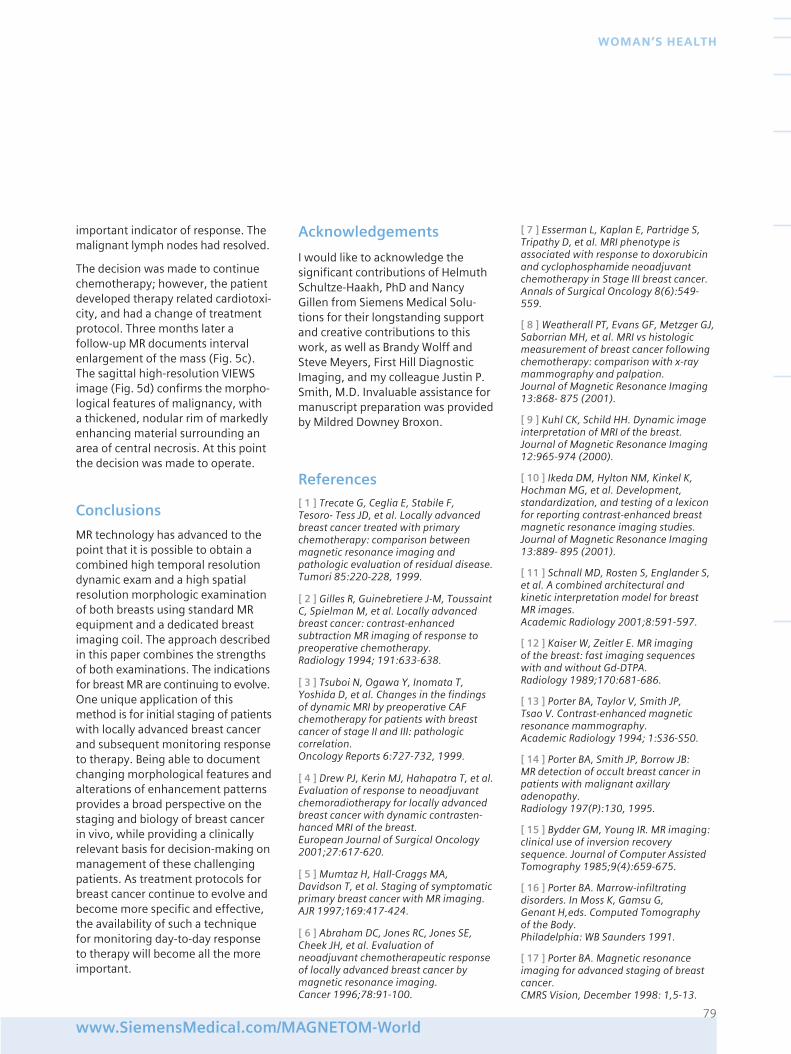
important indicator of response. Themalignant lymph nodes had resolved.
The decision was made to continuechemotherapy; however, the patientdeveloped therapy related cardiotoxi-city, and had a change of treatmentprotocol. Three months later afollow-up MR documents intervalenlargement of the mass (Fig. 5c).The sagittal high-resolution VIEWSimage (Fig. 5d) confirms the morpho-logical features of malignancy, with a thickened, nodular rim of markedlyenhancing material surrounding anarea of central necrosis. At this pointthe decision was made to operate.
Conclusions
MR technology has advanced to thepoint that it is possible to obtain acombined high temporal resolutiondynamic exam and a high spatialresolution morphologic examinationof both breasts using standard MRequipment and a dedicated breastimaging coil. The approach describedin this paper combines the strengthsof both examinations. The indicationsfor breast MR are continuing to evolve.One unique application of thismethod is for initial staging of patientswith locally advanced breast cancerand subsequent monitoring responseto therapy. Being able to documentchanging morphological features andalterations of enhancement patternsprovides a broad perspective on thestaging and biology of breast cancerin vivo, while providing a clinicallyrelevant basis for decision-making onmanagement of these challengingpatients. As treatment protocols forbreast cancer continue to evolve andbecome more specific and effective,the availability of such a techniquefor monitoring day-to-day responseto therapy will become all the moreimportant.
Acknowledgements
I would like to acknowledge thesignificant contributions of HelmuthSchultze-Haakh, PhD and NancyGillen from Siemens Medical Solu-tions for their longstanding supportand creative contributions to thiswork, as well as Brandy Wolff andSteve Meyers, First Hill DiagnosticImaging, and my colleague Justin P.Smith, M.D. Invaluable assistance formanuscript preparation was providedby Mildred Downey Broxon.
References
[ 1 ] Trecate G, Ceglia E, Stabile F, Tesoro- Tess JD, et al. Locally advancedbreast cancer treated with primarychemotherapy: comparison betweenmagnetic resonance imaging andpathologic evaluation of residual disease.Tumori 85:220-228, 1999.
[ 2 ] Gilles R, Guinebretiere J-M, ToussaintC, Spielman M, et al. Locally advancedbreast cancer: contrast-enhancedsubtraction MR imaging of response topreoperative chemotherapy. Radiology 1994; 191:633-638.
[ 3 ] Tsuboi N, Ogawa Y, Inomata T,Yoshida D, et al. Changes in the findingsof dynamic MRI by preoperative CAFchemotherapy for patients with breastcancer of stage II and III: pathologiccorrelation. Oncology Reports 6:727-732, 1999.
[ 4 ] Drew PJ, Kerin MJ, Hahapatra T, et al.Evaluation of response to neoadjuvantchemoradiotherapy for locally advancedbreast cancer with dynamic contrasten-hanced MRI of the breast. European Journal of Surgical Oncology2001;27:617-620.
[ 5 ] Mumtaz H, Hall-Craggs MA,Davidson T, et al. Staging of symptomaticprimary breast cancer with MR imaging.AJR 1997;169:417-424.
[ 6 ] Abraham DC, Jones RC, Jones SE,Cheek JH, et al. Evaluation ofneoadjuvant chemotherapeutic responseof locally advanced breast cancer bymagnetic resonance imaging. Cancer 1996;78:91-100.
[ 7 ] Esserman L, Kaplan E, Partridge S,Tripathy D, et al. MRI phenotype isassociated with response to doxorubicinand cyclophosphamide neoadjuvantchemotherapy in Stage III breast cancer.Annals of Surgical Oncology 8(6):549-559.
[ 8 ] Weatherall PT, Evans GF, Metzger GJ,Saborrian MH, et al. MRI vs histologicmeasurement of breast cancer followingchemotherapy: comparison with x-raymammography and palpation. Journal of Magnetic Resonance Imaging13:868- 875 (2001).
[ 9 ] Kuhl CK, Schild HH. Dynamic imageinterpretation of MRI of the breast.Journal of Magnetic Resonance Imaging12:965-974 (2000).
[ 10 ] Ikeda DM, Hylton NM, Kinkel K,Hochman MG, et al. Development,standardization, and testing of a lexiconfor reporting contrast-enhanced breastmagnetic resonance imaging studies.Journal of Magnetic Resonance Imaging13:889- 895 (2001).
[ 11 ] Schnall MD, Rosten S, Englander S,et al. A combined architectural andkinetic interpretation model for breast MR images. Academic Radiology 2001;8:591-597.
[ 12 ] Kaiser W, Zeitler E. MR imaging of the breast: fast imaging sequenceswith and without Gd-DTPA. Radiology 1989;170:681-686.
[ 13 ] Porter BA, Taylor V, Smith JP, Tsao V. Contrast-enhanced magneticresonance mammography. Academic Radiology 1994; 1:S36-S50.
[ 14 ] Porter BA, Smith JP, Borrow JB: MR detection of occult breast cancer inpatients with malignant axillary adenopathy. Radiology 197(P):130, 1995.
[ 15 ] Bydder GM, Young IR. MR imaging:clinical use of inversion recoverysequence. Journal of Computer AssistedTomography 1985;9(4):659-675.
[ 16 ] Porter BA. Marrow-infiltratingdisorders. In Moss K, Gamsu G, Genant H,eds. Computed Tomography of the Body. Philadelphia: WB Saunders 1991.
[ 17 ] Porter BA. Magnetic resonanceimaging for advanced staging of breastcancer. CMRS Vision, December 1998: 1,5-13.
79www.SiemensMedical.com/MAGNETOM-World
WOMAN’S HEALTH
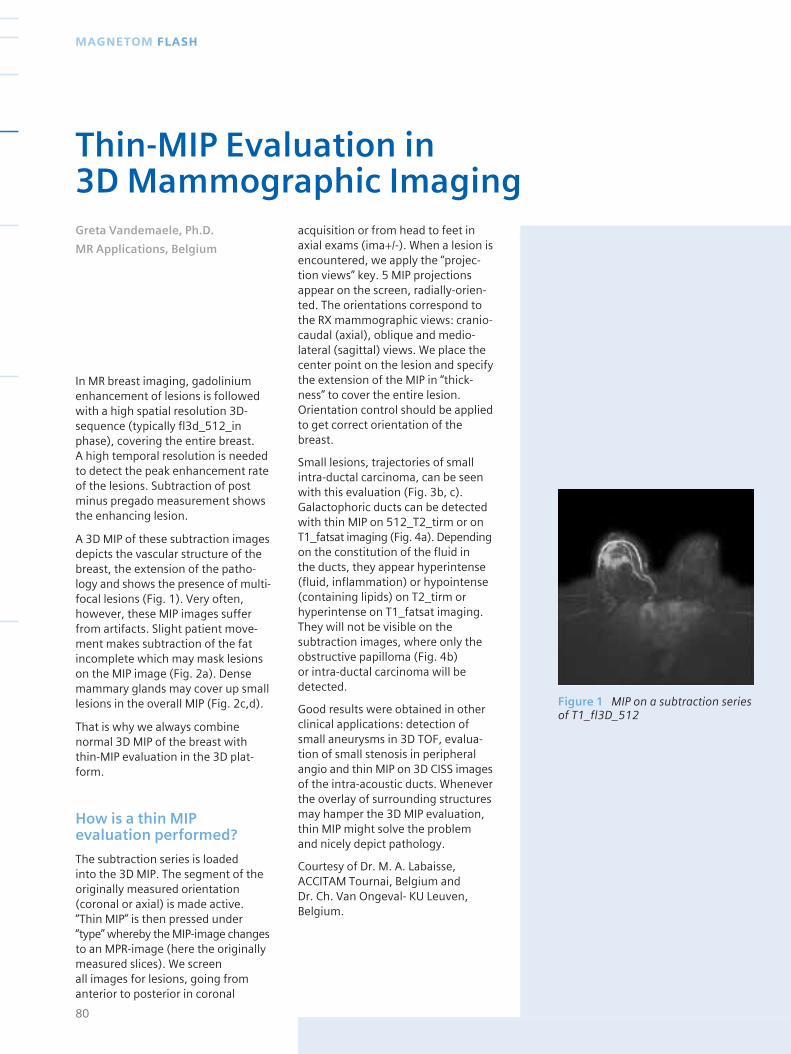
In MR breast imaging, gadoliniumenhancement of lesions is followedwith a high spatial resolution 3D-sequence (typically fl3d_512_inphase), covering the entire breast. A high temporal resolution is neededto detect the peak enhancement rateof the lesions. Subtraction of postminus pregado measurement showsthe enhancing lesion.
A 3D MIP of these subtraction imagesdepicts the vascular structure of thebreast, the extension of the patho-logy and shows the presence of multi-focal lesions (Fig. 1). Very often,however, these MIP images sufferfrom artifacts. Slight patient move-ment makes subtraction of the fatincomplete which may mask lesionson the MIP image (Fig. 2a). Densemammary glands may cover up smalllesions in the overall MIP (Fig. 2c,d).
That is why we always combinenormal 3D MIP of the breast withthin-MIP evaluation in the 3D plat-form.
How is a thin MIPevaluation performed?
The subtraction series is loaded into the 3D MIP. The segment of theoriginally measured orientation(coronal or axial) is made active.“Thin MIP” is then pressed under“type” whereby the MIP-image changesto an MPR-image (here the originallymeasured slices). We screen all images for lesions, going fromanterior to posterior in coronal
acquisition or from head to feet inaxial exams (ima+/-). When a lesion isencountered, we apply the “projec-tion views” key. 5 MIP projectionsappear on the screen, radially-orien-ted. The orientations correspond tothe RX mammographic views: cranio-caudal (axial), oblique and medio-lateral (sagittal) views. We place thecenter point on the lesion and specifythe extension of the MIP in “thick-ness” to cover the entire lesion.Orientation control should be appliedto get correct orientation of thebreast.
Small lesions, trajectories of smallintra-ductal carcinoma, can be seenwith this evaluation (Fig. 3b, c).Galactophoric ducts can be detectedwith thin MIP on 512_T2_tirm or onT1_fatsat imaging (Fig. 4a). Dependingon the constitution of the fluid in the ducts, they appear hyperintense(fluid, inflammation) or hypointense(containing lipids) on T2_tirm orhyperintense on T1_fatsat imaging.They will not be visible on thesubtraction images, where only theobstructive papilloma (Fig. 4b) or intra-ductal carcinoma will bedetected.
Good results were obtained in otherclinical applications: detection ofsmall aneurysms in 3D TOF, evalua-tion of small stenosis in peripheralangio and thin MIP on 3D CISS imagesof the intra-acoustic ducts. Wheneverthe overlay of surrounding structuresmay hamper the 3D MIP evaluation,thin MIP might solve the problemand nicely depict pathology.
Courtesy of Dr. M. A. Labaisse,ACCITAM Tournai, Belgium and Dr. Ch. Van Ongeval- KU Leuven,Belgium.
80
MAGNETOM FLASH
Thin-MIP Evaluation in 3D Mammographic ImagingGreta Vandemaele, Ph.D.
MR Applications, Belgium
Figure 1 MIP on a subtraction seriesof T1_fl3D_512
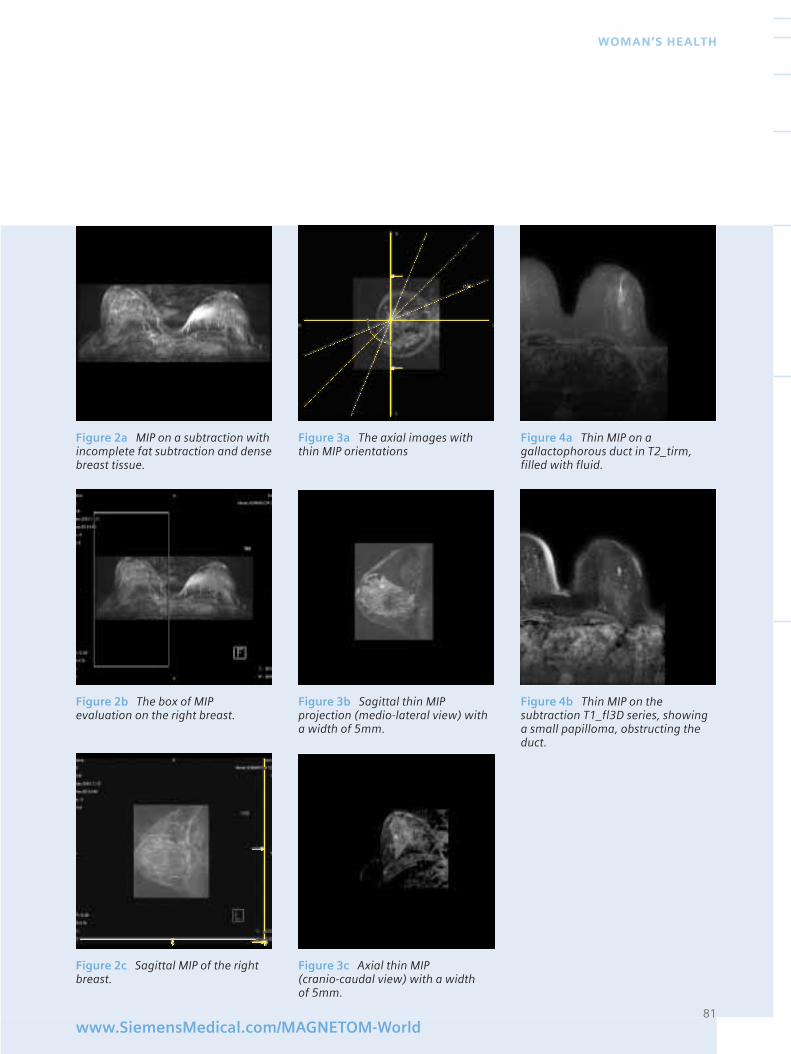
81www.SiemensMedical.com/MAGNETOM-World
WOMAN’S HEALTH
Figure 2a MIP on a subtraction withincomplete fat subtraction and densebreast tissue.
Figure 2b The box of MIPevaluation on the right breast.
Figure 2c Sagittal MIP of the rightbreast.
Figure 3a The axial images withthin MIP orientations
Figure 3b Sagittal thin MIPprojection (medio-lateral view) witha width of 5mm.
Figure 3c Axial thin MIP (cranio-caudal view) with a width of 5mm.
Figure 4a Thin MIP on agallactophorous duct in T2_tirm,filled with fluid.
Figure 4b Thin MIP on thesubtraction T1_fl3D series, showinga small papilloma, obstructing theduct.
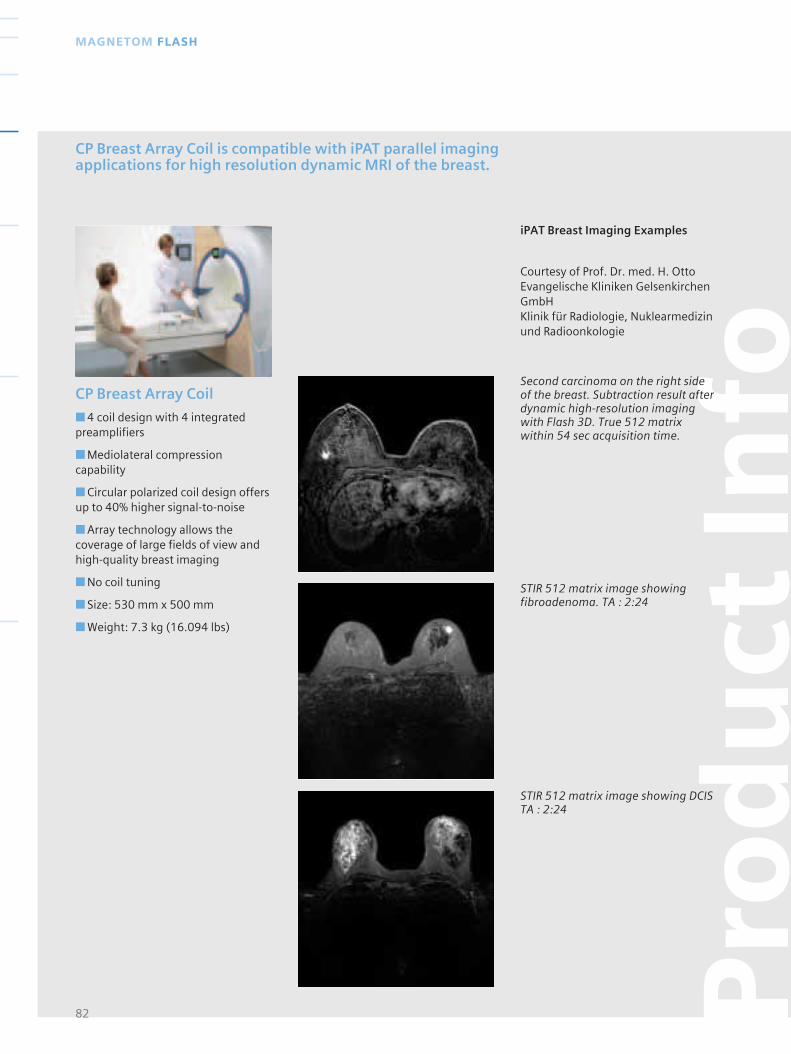
CP Breast Array Coil
■ 4 coil design with 4 integratedpreamplifiers
■ Mediolateral compressioncapability
■ Circular polarized coil design offersup to 40% higher signal-to-noise
■ Array technology allows thecoverage of large fields of view andhigh-quality breast imaging
■ No coil tuning
■ Size: 530 mm x 500 mm
■ Weight: 7.3 kg (16.094 lbs)
82
MAGNETOM FLASH
CP Breast Array Coil is compatible with iPAT parallel imagingapplications for high resolution dynamic MRI of the breast.
Pro
du
ct In
foSecond carcinoma on the right sideof the breast. Subtraction result afterdynamic high-resolution imagingwith Flash 3D. True 512 matrixwithin 54 sec acquisition time.
STIR 512 matrix image showingfibroadenoma. TA : 2:24
STIR 512 matrix image showing DCISTA : 2:24
iPAT Breast Imaging Examples
Courtesy of Prof. Dr. med. H. OttoEvangelische Kliniken GelsenkirchenGmbHKlinik für Radiologie, Nuklearmedizinund Radioonkologie
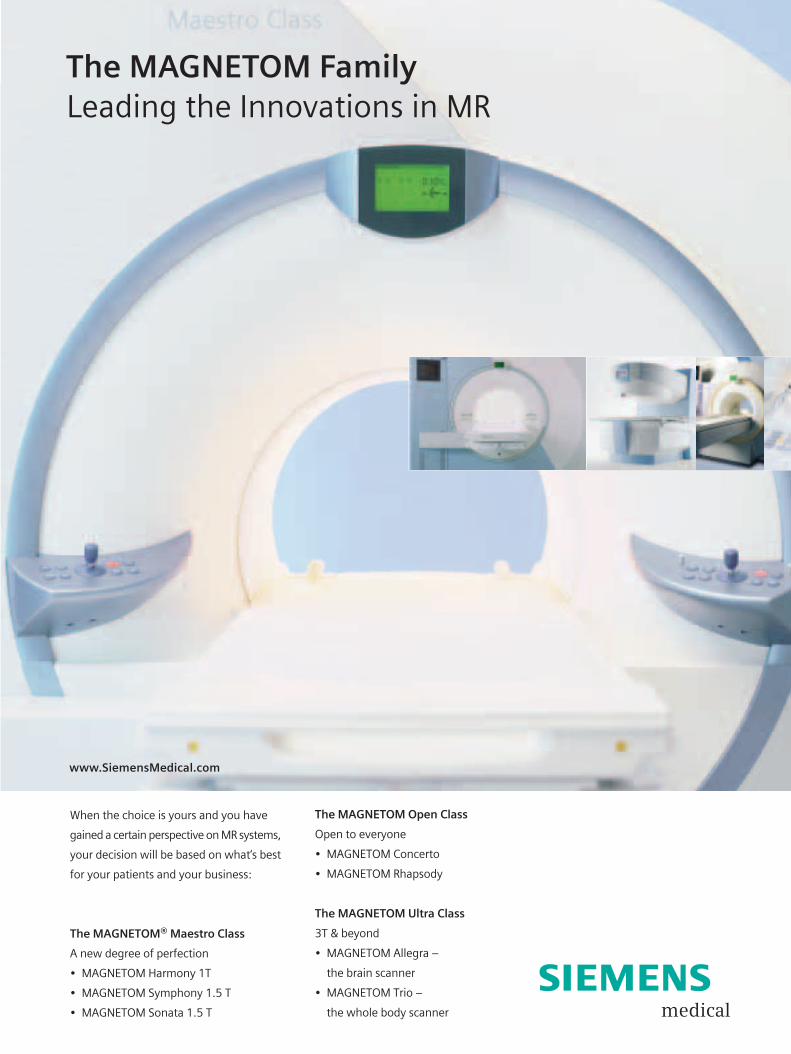
The MAGNETOM FamilyLeading the Innovations in MR
When the choice is yours and you have
gained a certain perspective on MR systems,
your decision will be based on what‘s best
for your patients and your business:
The MAGNETOM® Maestro Class
A new degree of perfection
• MAGNETOM Harmony 1T
• MAGNETOM Symphony 1.5 T
• MAGNETOM Sonata 1.5 T
www.SiemensMedical.com
The MAGNETOM Open Class
Open to everyone
• MAGNETOM Concerto
• MAGNETOM Rhapsody
The MAGNETOM Ultra Class
3T & beyond
• MAGNETOM Allegra –
the brain scanner
• MAGNETOM Trio –
the whole body scanner

81 year old patient suffered fromstroke symptoms during coronaryangiography procedure. Right hemi-paresis and aphasia were the majorfindings in the physical examination.The patient was immediately trans-ferred to our clinic and examined.Diffusion weighted images showed a lesion in the basal ganglia andperfusion weighted images showeddecreased perfusion in a large areafed by left middle cerebral artery.This was a clear perfusion diffusionmismatch indicating an ischemicpenumbra (Fig. 1,2).
The neurologist decided for animmediate thrombolytic therapy withthese findings.
The next day, the patient could talkand move which was a dramaticquick response to the therapy. Follow-up MR examination showed adequateperfusion in the previously diagnosedhypoperfused area (Fig. 3).
84
MAGNETOM FLASH
Case Report: Stroke Diagnosis with MRPriv.Doz. Dr. med. Franz Fellner
Institut für RadiologieLandesnervenklinik Wagner-Jauregg, Linz, Austria
Figure 1a Diffusion weightedimage. B 1000
Figure 2a Perfusion weightedimage before therapy. (MTT, MeanTransit Time map)
Figure 3a Perfusion weightedimage after intravenous thromboly-tic therapy. (MTT, Mean Transit TimeMap)
Figure 1b ADC map
Figure 2b Perfusion weightedimage before therapy . (TTP, Time toPeak Map)
Figure 3b Perfusion weightedimage after intravenous thromboly-tic therapy. (TTP, Time to Peak Map)

www.SiemensMedical.com/MAGNETOM-World
NEURO IMAGING
Pro
du
ct In
fo
85
Application Package: Neuro Perfusion Evaluation
■ Color display of relative MeanTransit Time (relMTT)
■ Flexible selection of Arterial Input Function (AIF) for reliablequantification
■ Single shot and segmented EPIsequences for fast acquisition
■ Diffusion weighted imaging with b max of 10,000 s/mm2
■ Single shot EPI for perfusionimaging
■ Multidirectional DiffusionWeighted (MDDW) imaging fordiffusion tensor imaging
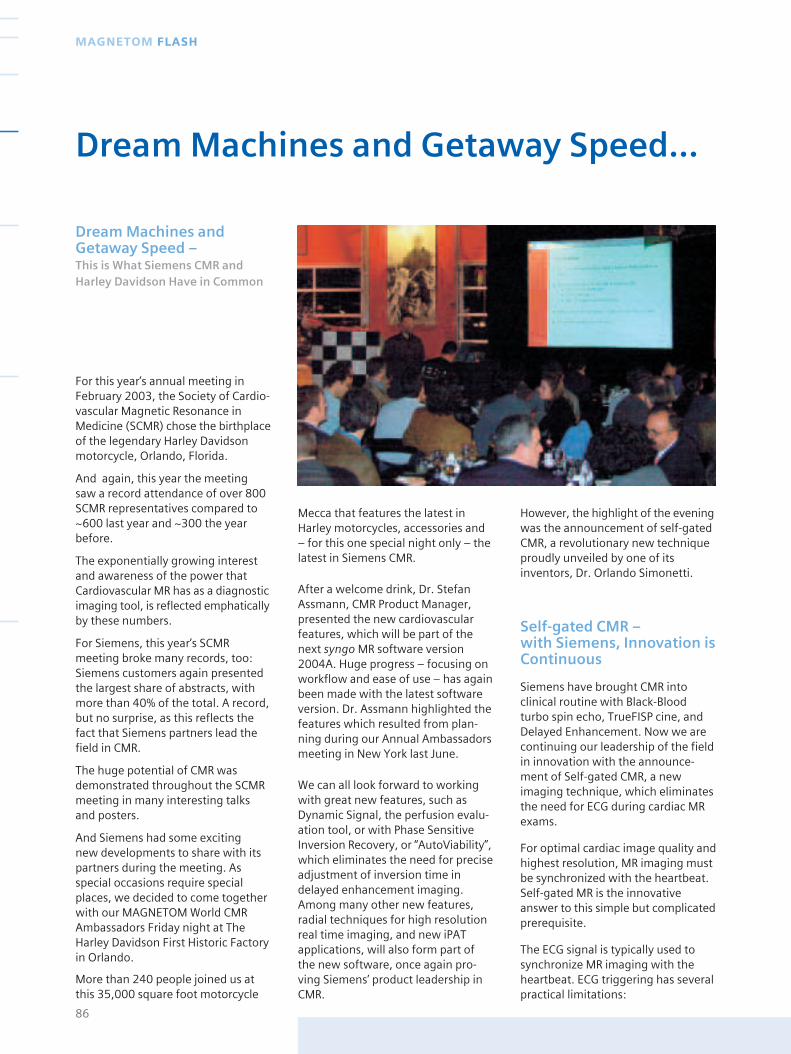
For this year’s annual meeting inFebruary 2003, the Society of Cardio-vascular Magnetic Resonance inMedicine (SCMR) chose the birthplaceof the legendary Harley Davidsonmotorcycle, Orlando, Florida.
And again, this year the meeting saw a record attendance of over 800SCMR representatives compared to~600 last year and ~300 the yearbefore.
The exponentially growing interestand awareness of the power thatCardiovascular MR has as a diagnosticimaging tool, is reflected emphaticallyby these numbers.
For Siemens, this year’s SCMRmeeting broke many records, too:Siemens customers again presentedthe largest share of abstracts, withmore than 40% of the total. A record,but no surprise, as this reflects thefact that Siemens partners lead thefield in CMR.
The huge potential of CMR wasdemonstrated throughout the SCMRmeeting in many interesting talksand posters.
And Siemens had some exciting new developments to share with itspartners during the meeting. Asspecial occasions require specialplaces, we decided to come togetherwith our MAGNETOM World CMRAmbassadors Friday night at TheHarley Davidson First Historic Factoryin Orlando.
More than 240 people joined us atthis 35,000 square foot motorcycle
Mecca that features the latest inHarley motorcycles, accessories and– for this one special night only – thelatest in Siemens CMR.
After a welcome drink, Dr. StefanAssmann, CMR Product Manager,presented the new cardiovascularfeatures, which will be part of thenext syngo MR software version2004A. Huge progress – focusing onworkflow and ease of use – has againbeen made with the latest softwareversion. Dr. Assmann highlighted thefeatures which resulted from plan-ning during our Annual Ambassadorsmeeting in New York last June.
We can all look forward to workingwith great new features, such asDynamic Signal, the perfusion evalu-ation tool, or with Phase SensitiveInversion Recovery, or “AutoViability”,which eliminates the need for preciseadjustment of inversion time indelayed enhancement imaging.Among many other new features,radial techniques for high resolutionreal time imaging, and new iPATapplications, will also form part ofthe new software, once again pro-ving Siemens’ product leadership inCMR.
However, the highlight of the eveningwas the announcement of self-gatedCMR, a revolutionary new techniqueproudly unveiled by one of itsinventors, Dr. Orlando Simonetti.
Self-gated CMR – with Siemens, Innovation isContinuous
Siemens have brought CMR intoclinical routine with Black-Bloodturbo spin echo, TrueFISP cine, andDelayed Enhancement. Now we arecontinuing our leadership of the fieldin innovation with the announce-ment of Self-gated CMR, a newimaging technique, which eliminatesthe need for ECG during cardiac MRexams.
For optimal cardiac image quality andhighest resolution, MR imaging mustbe synchronized with the heartbeat.Self-gated MR is the innovativeanswer to this simple but complicatedprerequisite.
The ECG signal is typically used tosynchronize MR imaging with theheartbeat. ECG triggering has severalpractical limitations:
86
MAGNETOM FLASH
Dream Machines and Getaway Speed…
Dream Machines and Getaway Speed – This is What Siemens CMR andHarley Davidson Have in Common
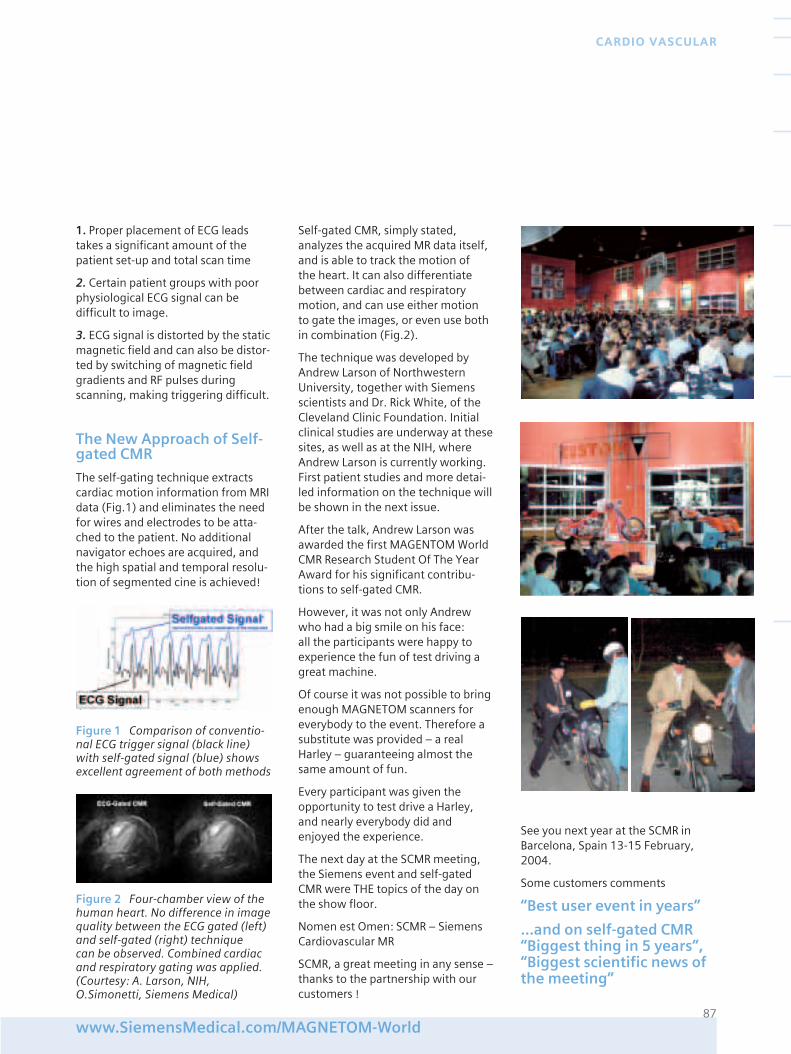
1. Proper placement of ECG leadstakes a significant amount of thepatient set-up and total scan time
2. Certain patient groups with poorphysiological ECG signal can bedifficult to image.
3. ECG signal is distorted by the staticmagnetic field and can also be distor-ted by switching of magnetic fieldgradients and RF pulses duringscanning, making triggering difficult.
The New Approach of Self-gated CMR
The self-gating technique extractscardiac motion information from MRIdata (Fig.1) and eliminates the needfor wires and electrodes to be atta-ched to the patient. No additionalnavigator echoes are acquired, andthe high spatial and temporal resolu-tion of segmented cine is achieved!
87www.SiemensMedical.com/MAGNETOM-World
CARDIO VASCULAR
Figure 1 Comparison of conventio-nal ECG trigger signal (black line)with self-gated signal (blue) showsexcellent agreement of both methods
Figure 2 Four-chamber view of thehuman heart. No difference in imagequality between the ECG gated (left)and self-gated (right) technique can be observed. Combined cardiacand respiratory gating was applied.(Courtesy: A. Larson, NIH, O.Simonetti, Siemens Medical)
Self-gated CMR, simply stated,analyzes the acquired MR data itself,and is able to track the motion of the heart. It can also differentiatebetween cardiac and respiratorymotion, and can use either motion to gate the images, or even use bothin combination (Fig.2).
The technique was developed byAndrew Larson of NorthwesternUniversity, together with Siemensscientists and Dr. Rick White, of theCleveland Clinic Foundation. Initialclinical studies are underway at thesesites, as well as at the NIH, whereAndrew Larson is currently working.First patient studies and more detai-led information on the technique willbe shown in the next issue.
After the talk, Andrew Larson wasawarded the first MAGENTOM WorldCMR Research Student Of The YearAward for his significant contribu-tions to self-gated CMR.
However, it was not only Andrewwho had a big smile on his face: all the participants were happy toexperience the fun of test driving agreat machine.
Of course it was not possible to bringenough MAGNETOM scanners foreverybody to the event. Therefore asubstitute was provided – a realHarley – guaranteeing almost thesame amount of fun.
Every participant was given theopportunity to test drive a Harley,and nearly everybody did andenjoyed the experience.
The next day at the SCMR meeting,the Siemens event and self-gatedCMR were THE topics of the day onthe show floor.
Nomen est Omen: SCMR – SiemensCardiovascular MR
SCMR, a great meeting in any sense –thanks to the partnership with ourcustomers !
See you next year at the SCMR inBarcelona, Spain 13-15 February,2004.
Some customers comments
“Best user event in years”
...and on self-gated CMR“Biggest thing in 5 years”,“Biggest scientific news ofthe meeting”
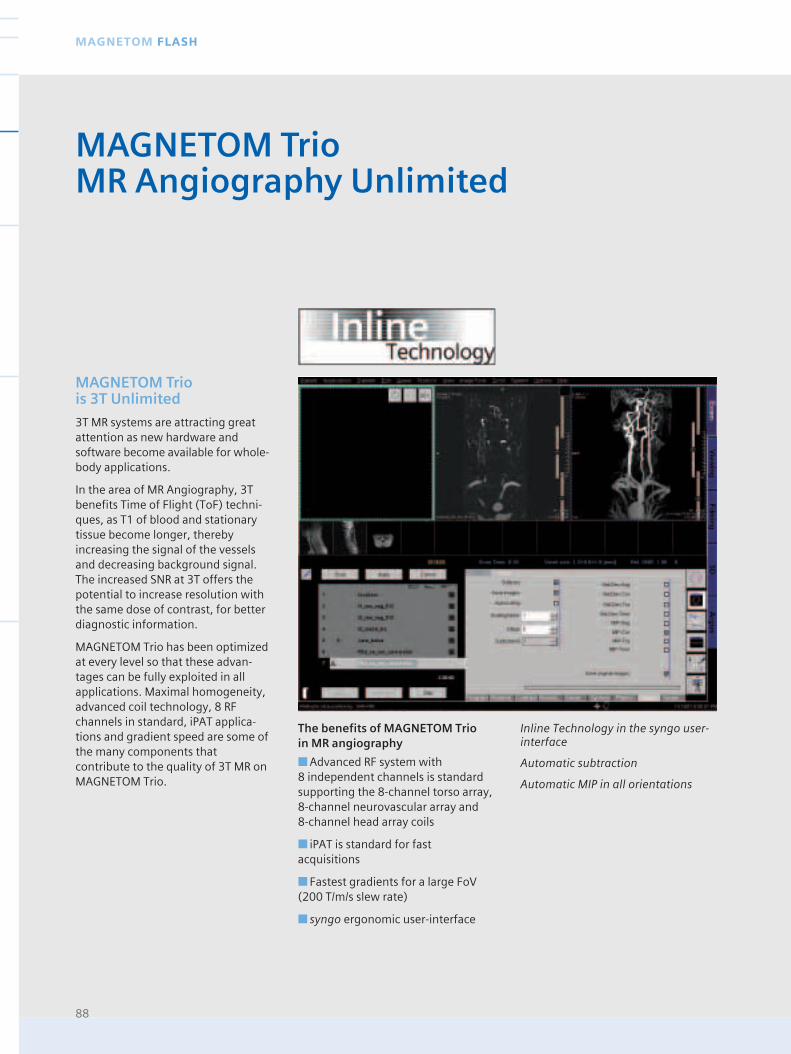
88
MAGNETOM FLASH
MAGNETOM Trio is 3T Unlimited
3T MR systems are attracting greatattention as new hardware andsoftware become available for whole-body applications.
In the area of MR Angiography, 3Tbenefits Time of Flight (ToF) techni-ques, as T1 of blood and stationarytissue become longer, therebyincreasing the signal of the vesselsand decreasing background signal.The increased SNR at 3T offers thepotential to increase resolution withthe same dose of contrast, for betterdiagnostic information.
MAGNETOM Trio has been optimizedat every level so that these advan-tages can be fully exploited in allapplications. Maximal homogeneity,advanced coil technology, 8 RFchannels in standard, iPAT applica-tions and gradient speed are some ofthe many components thatcontribute to the quality of 3T MR onMAGNETOM Trio.
MAGNETOM TrioMR Angiography Unlimited
Inline Technology in the syngo user-interface
Automatic subtraction
Automatic MIP in all orientations
The benefits of MAGNETOM Trio in MR angiography
■ Advanced RF system with 8 independent channels is standardsupporting the 8-channel torso array, 8-channel neurovascular array and 8-channel head array coils
■ iPAT is standard for fastacquisitions
■ Fastest gradients for a large FoV(200 T/m/s slew rate)
■ syngo ergonomic user-interface
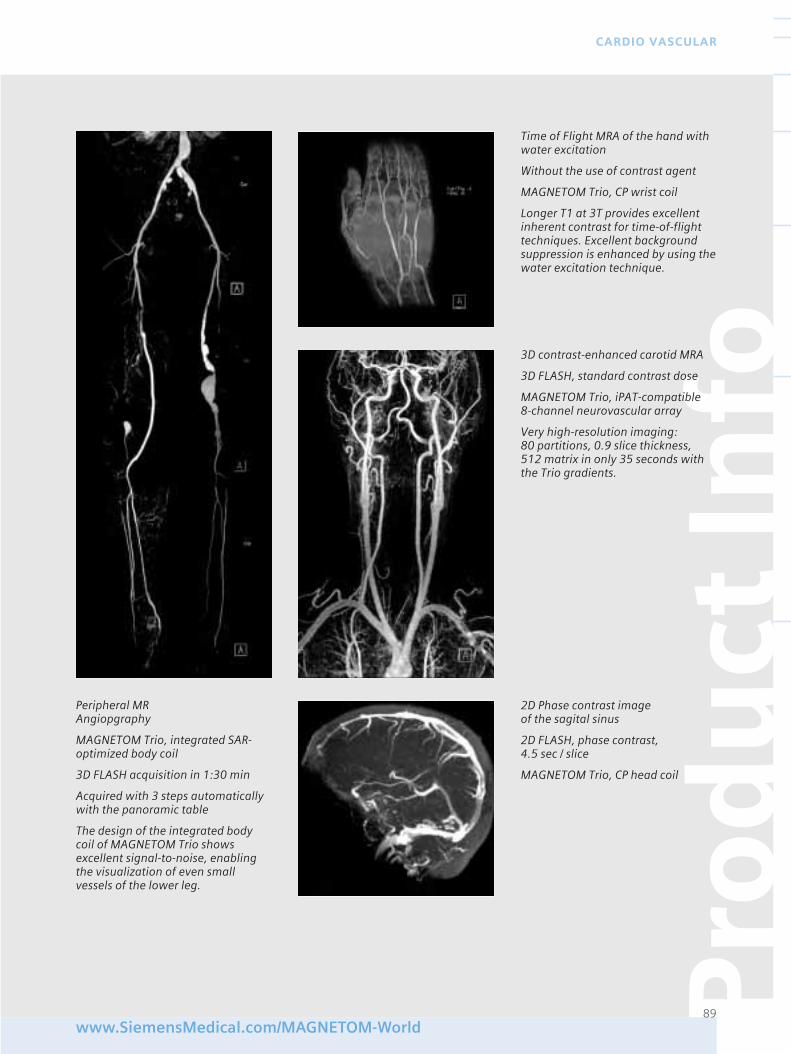
Pro
du
ct In
fo
89www.SiemensMedical.com/MAGNETOM-World
CARDIO VASCULAR
Peripheral MR Angiopgraphy
MAGNETOM Trio, integrated SAR-optimized body coil
3D FLASH acquisition in 1:30 min
Acquired with 3 steps automaticallywith the panoramic table
The design of the integrated bodycoil of MAGNETOM Trio showsexcellent signal-to-noise, enablingthe visualization of even smallvessels of the lower leg.
Time of Flight MRA of the hand withwater excitation
Without the use of contrast agent
MAGNETOM Trio, CP wrist coil
Longer T1 at 3T provides excellentinherent contrast for time-of-flighttechniques. Excellent backgroundsuppression is enhanced by using thewater excitation technique.
2D Phase contrast imageof the sagital sinus
2D FLASH, phase contrast, 4.5 sec / slice
MAGNETOM Trio, CP head coil
3D contrast-enhanced carotid MRA
3D FLASH, standard contrast dose
MAGNETOM Trio, iPAT-compatible 8-channel neurovascular array
Very high-resolution imaging:80 partitions, 0.9 slice thickness, 512 matrix in only 35 seconds withthe Trio gradients.
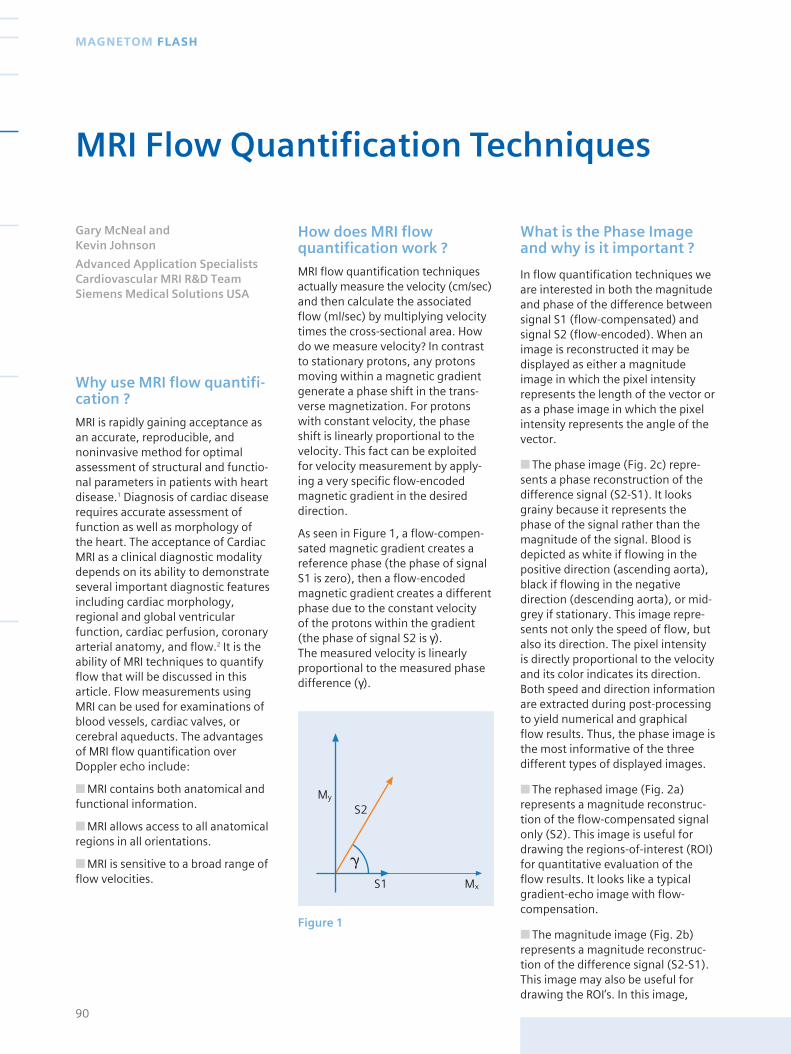
Why use MRI flow quantifi-cation ?
MRI is rapidly gaining acceptance asan accurate, reproducible, andnoninvasive method for optimalassessment of structural and functio-nal parameters in patients with heartdisease.1 Diagnosis of cardiac diseaserequires accurate assessment offunction as well as morphology ofthe heart. The acceptance of CardiacMRI as a clinical diagnostic modalitydepends on its ability to demonstrateseveral important diagnostic featuresincluding cardiac morphology,regional and global ventricularfunction, cardiac perfusion, coronaryarterial anatomy, and flow.2 It is theability of MRI techniques to quantifyflow that will be discussed in thisarticle. Flow measurements usingMRI can be used for examinations ofblood vessels, cardiac valves, orcerebral aqueducts. The advantagesof MRI flow quantification overDoppler echo include:
■ MRI contains both anatomical andfunctional information.
■ MRI allows access to all anatomicalregions in all orientations.
■ MRI is sensitive to a broad range offlow velocities.
How does MRI flowquantification work ?
MRI flow quantification techniquesactually measure the velocity (cm/sec)and then calculate the associatedflow (ml/sec) by multiplying velocitytimes the cross-sectional area. Howdo we measure velocity? In contrastto stationary protons, any protonsmoving within a magnetic gradientgenerate a phase shift in the trans-verse magnetization. For protonswith constant velocity, the phaseshift is linearly proportional to thevelocity. This fact can be exploitedfor velocity measurement by apply-ing a very specific flow-encodedmagnetic gradient in the desireddirection.
As seen in Figure 1, a flow-compen-sated magnetic gradient creates areference phase (the phase of signalS1 is zero), then a flow-encodedmagnetic gradient creates a differentphase due to the constant velocity of the protons within the gradient(the phase of signal S2 is γ). The measured velocity is linearlyproportional to the measured phasedifference (γ).
What is the Phase Imageand why is it important ?
In flow quantification techniques weare interested in both the magnitudeand phase of the difference betweensignal S1 (flow-compensated) andsignal S2 (flow-encoded). When animage is reconstructed it may bedisplayed as either a magnitudeimage in which the pixel intensityrepresents the length of the vector oras a phase image in which the pixelintensity represents the angle of thevector.
■ The phase image (Fig. 2c) repre-sents a phase reconstruction of thedifference signal (S2-S1). It looksgrainy because it represents thephase of the signal rather than themagnitude of the signal. Blood isdepicted as white if flowing in thepositive direction (ascending aorta),black if flowing in the negativedirection (descending aorta), or mid-grey if stationary. This image repre-sents not only the speed of flow, butalso its direction. The pixel intensityis directly proportional to the velocityand its color indicates its direction.Both speed and direction informationare extracted during post-processingto yield numerical and graphical flow results. Thus, the phase image isthe most informative of the threedifferent types of displayed images.
■ The rephased image (Fig. 2a)represents a magnitude reconstruc-tion of the flow-compensated signalonly (S2). This image is useful fordrawing the regions-of-interest (ROI)for quantitative evaluation of theflow results. It looks like a typicalgradient-echo image with flow-compensation.
■ The magnitude image (Fig. 2b)represents a magnitude reconstruc-tion of the difference signal (S2-S1).This image may also be useful fordrawing the ROI’s. In this image,
90
MAGNETOM FLASH
MRI Flow Quantification Techniques
Gary McNeal and Kevin Johnson
Advanced Application SpecialistsCardiovascular MRI R&D TeamSiemens Medical Solutions USA
My
S1 Mx
S2
Figure 1
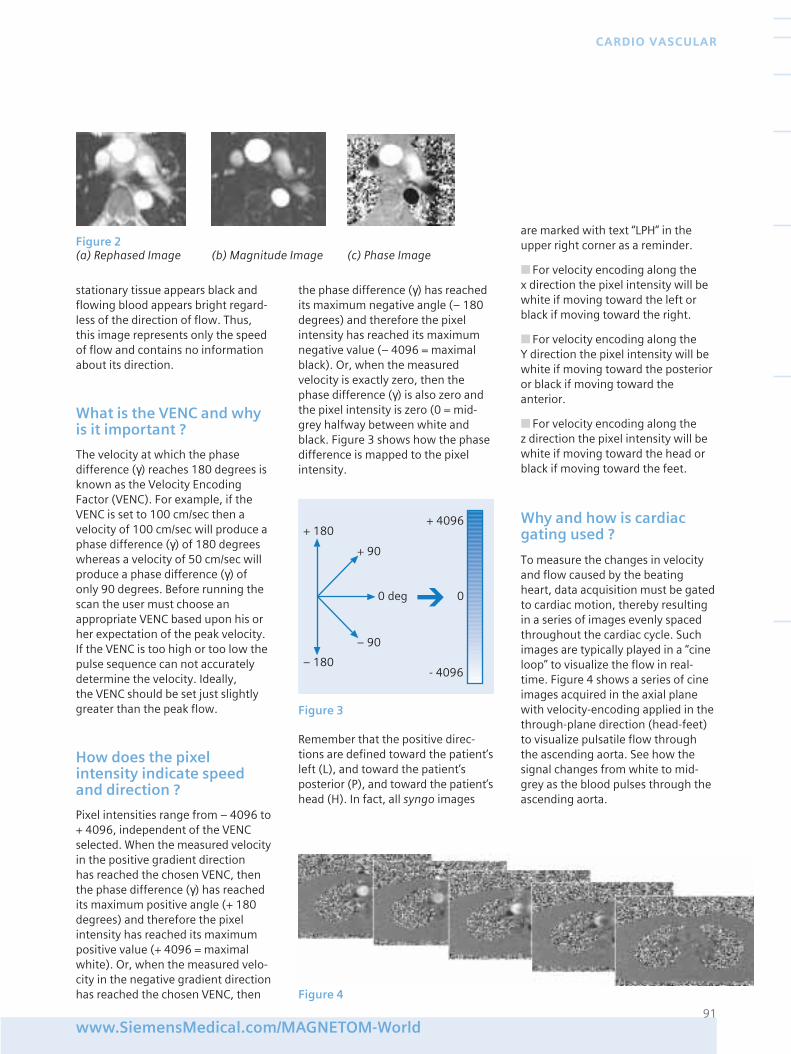
stationary tissue appears black andflowing blood appears bright regard-less of the direction of flow. Thus,this image represents only the speedof flow and contains no informationabout its direction.
What is the VENC and whyis it important ?
The velocity at which the phasedifference (γ) reaches 180 degrees isknown as the Velocity EncodingFactor (VENC). For example, if theVENC is set to 100 cm/sec then avelocity of 100 cm/sec will produce aphase difference (γ) of 180 degreeswhereas a velocity of 50 cm/sec willproduce a phase difference (γ) ofonly 90 degrees. Before running thescan the user must choose anappropriate VENC based upon his orher expectation of the peak velocity. If the VENC is too high or too low thepulse sequence can not accuratelydetermine the velocity. Ideally, the VENC should be set just slightlygreater than the peak flow.
How does the pixelintensity indicate speedand direction ?
Pixel intensities range from – 4096 to+ 4096, independent of the VENCselected. When the measured velocityin the positive gradient direction has reached the chosen VENC, thenthe phase difference (γ) has reachedits maximum positive angle (+ 180degrees) and therefore the pixelintensity has reached its maximumpositive value (+ 4096 = maximalwhite). Or, when the measured velo-city in the negative gradient directionhas reached the chosen VENC, then
the phase difference (γ) has reachedits maximum negative angle (– 180degrees) and therefore the pixelintensity has reached its maximumnegative value (– 4096 = maximalblack). Or, when the measuredvelocity is exactly zero, then thephase difference (γ) is also zero andthe pixel intensity is zero (0 = mid-grey halfway between white andblack. Figure 3 shows how the phasedifference is mapped to the pixelintensity.
are marked with text “LPH” in theupper right corner as a reminder.
■ For velocity encoding along the x direction the pixel intensity will bewhite if moving toward the left orblack if moving toward the right.
■ For velocity encoding along the Y direction the pixel intensity will bewhite if moving toward the posterioror black if moving toward theanterior.
■ For velocity encoding along the z direction the pixel intensity will bewhite if moving toward the head orblack if moving toward the feet.
Why and how is cardiacgating used ?
To measure the changes in velocityand flow caused by the beatingheart, data acquisition must be gatedto cardiac motion, thereby resultingin a series of images evenly spacedthroughout the cardiac cycle. Suchimages are typically played in a “cineloop” to visualize the flow in real-time. Figure 4 shows a series of cineimages acquired in the axial planewith velocity-encoding applied in thethrough-plane direction (head-feet)to visualize pulsatile flow throughthe ascending aorta. See how thesignal changes from white to mid-grey as the blood pulses through theascending aorta.
91www.SiemensMedical.com/MAGNETOM-World
CARDIO VASCULAR
+ 180
+ 90
0 deg
– 90
– 180
+ 4096
- 4096
0
Figure 3
Figure 2(a) Rephased Image (b) Magnitude Image (c) Phase Image
Remember that the positive direc-tions are defined toward the patient’sleft (L), and toward the patient’sposterior (P), and toward the patient’shead (H). In fact, all syngo images
Figure 4
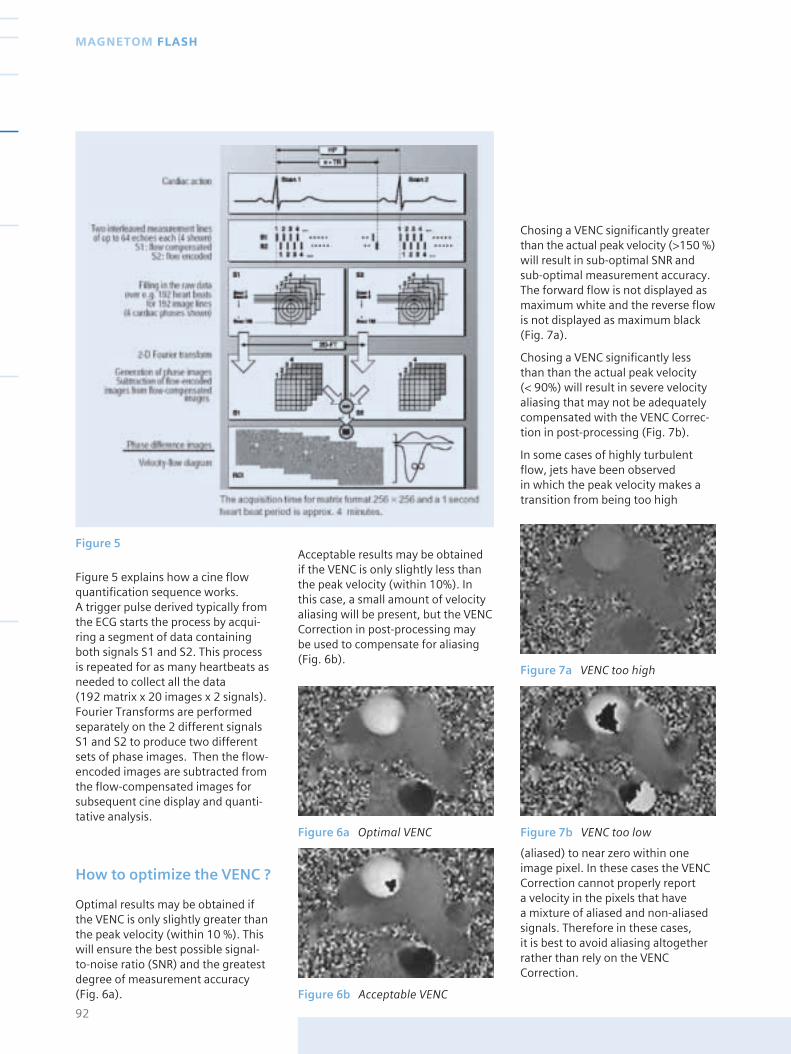
Figure 6a Optimal VENC
Figure 6b Acceptable VENC
Figure 5
Figure 5 explains how a cine flowquantification sequence works. A trigger pulse derived typically fromthe ECG starts the process by acqui-ring a segment of data containingboth signals S1 and S2. This processis repeated for as many heartbeats asneeded to collect all the data (192 matrix x 20 images x 2 signals).Fourier Transforms are performedseparately on the 2 different signalsS1 and S2 to produce two differentsets of phase images. Then the flow-encoded images are subtracted fromthe flow-compensated images forsubsequent cine display and quanti-tative analysis.
How to optimize the VENC ?
Optimal results may be obtained ifthe VENC is only slightly greater thanthe peak velocity (within 10 %). Thiswill ensure the best possible signal-to-noise ratio (SNR) and the greatestdegree of measurement accuracy(Fig. 6a).
Acceptable results may be obtained if the VENC is only slightly less than the peak velocity (within 10%). Inthis case, a small amount of velocityaliasing will be present, but the VENCCorrection in post-processing may be used to compensate for aliasing(Fig. 6b).
Chosing a VENC significantly greaterthan the actual peak velocity (>150 %)will result in sub-optimal SNR andsub-optimal measurement accuracy.The forward flow is not displayed asmaximum white and the reverse flowis not displayed as maximum black(Fig. 7a).
Chosing a VENC significantly lessthan than the actual peak velocity (< 90%) will result in severe velocityaliasing that may not be adequatelycompensated with the VENC Correc-tion in post-processing (Fig. 7b).
In some cases of highly turbulentflow, jets have been observed in which the peak velocity makes atransition from being too high
92
MAGNETOM FLASH
Figure 7a VENC too high
Figure 7b VENC too low
(aliased) to near zero within oneimage pixel. In these cases the VENCCorrection cannot properly report a velocity in the pixels that have a mixture of aliased and non-aliasedsignals. Therefore in these cases, it is best to avoid aliasing altogetherrather than rely on the VENCCorrection.
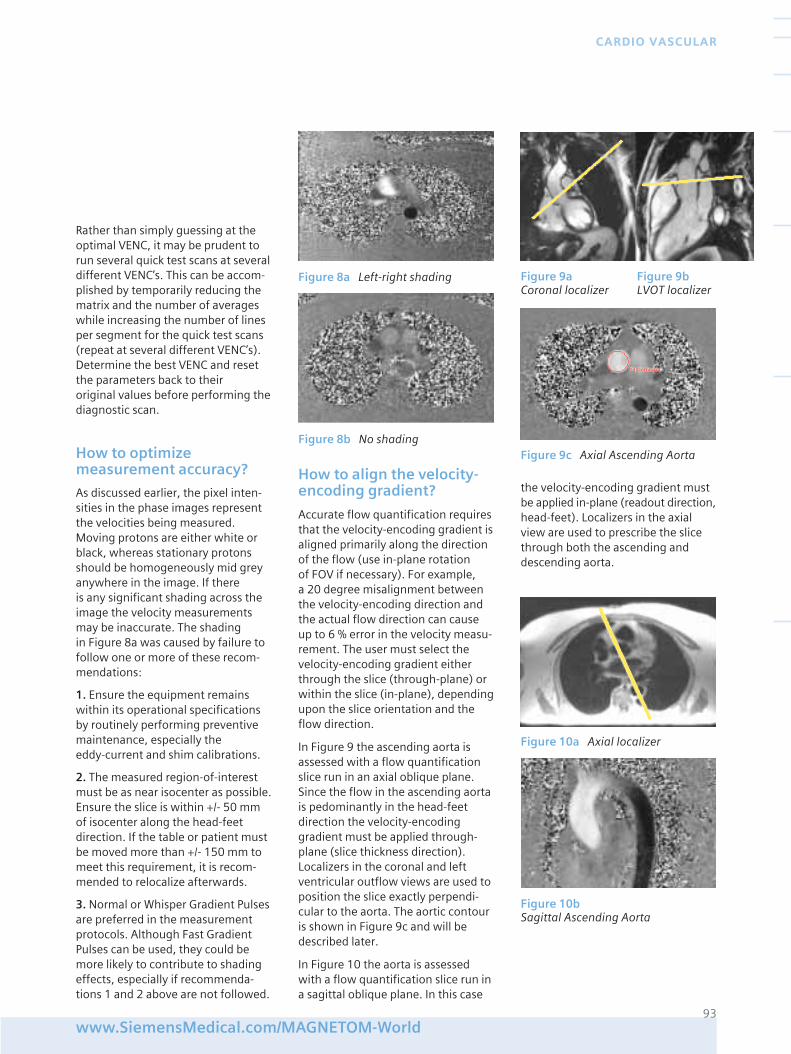
Rather than simply guessing at theoptimal VENC, it may be prudent torun several quick test scans at severaldifferent VENC’s. This can be accom-plished by temporarily reducing thematrix and the number of averageswhile increasing the number of linesper segment for the quick test scans(repeat at several different VENC’s).Determine the best VENC and resetthe parameters back to their original values before performing thediagnostic scan.
How to optimizemeasurement accuracy?
As discussed earlier, the pixel inten-sities in the phase images representthe velocities being measured.Moving protons are either white orblack, whereas stationary protonsshould be homogeneously mid greyanywhere in the image. If there is any significant shading across theimage the velocity measurementsmay be inaccurate. The shading in Figure 8a was caused by failure tofollow one or more of these recom-mendations:
1. Ensure the equipment remainswithin its operational specificationsby routinely performing preventivemaintenance, especially the eddy-current and shim calibrations.
2. The measured region-of-interestmust be as near isocenter as possible.Ensure the slice is within +/- 50 mmof isocenter along the head-feetdirection. If the table or patient mustbe moved more than +/- 150 mm tomeet this requirement, it is recom-mended to relocalize afterwards.
3. Normal or Whisper Gradient Pulsesare preferred in the measurementprotocols. Although Fast GradientPulses can be used, they could bemore likely to contribute to shadingeffects, especially if recommenda-tions 1 and 2 above are not followed.
How to align the velocity-encoding gradient?
Accurate flow quantification requiresthat the velocity-encoding gradient isaligned primarily along the directionof the flow (use in-plane rotation of FOV if necessary). For example, a 20 degree misalignment betweenthe velocity-encoding direction andthe actual flow direction can causeup to 6 % error in the velocity measu-rement. The user must select thevelocity-encoding gradient eitherthrough the slice (through-plane) orwithin the slice (in-plane), dependingupon the slice orientation and theflow direction.
In Figure 9 the ascending aorta isassessed with a flow quantificationslice run in an axial oblique plane.Since the flow in the ascending aortais pedominantly in the head-feetdirection the velocity-encodinggradient must be applied through-plane (slice thickness direction).Localizers in the coronal and leftventricular outflow views are used toposition the slice exactly perpendi-cular to the aorta. The aortic contouris shown in Figure 9c and will bedescribed later.
In Figure 10 the aorta is assessedwith a flow quantification slice run ina sagittal oblique plane. In this case
the velocity-encoding gradient mustbe applied in-plane (readout direction,head-feet). Localizers in the axialview are used to prescribe the slicethrough both the ascending anddescending aorta.
93www.SiemensMedical.com/MAGNETOM-World
CARDIO VASCULAR
Figure 8a Left-right shading
Figure 8b No shading
Figure 10a Axial localizer
Figure 10bSagittal Ascending Aorta
Figure 9c Axial Ascending Aorta
Figure 9a Figure 9b Coronal localizer LVOT localizer
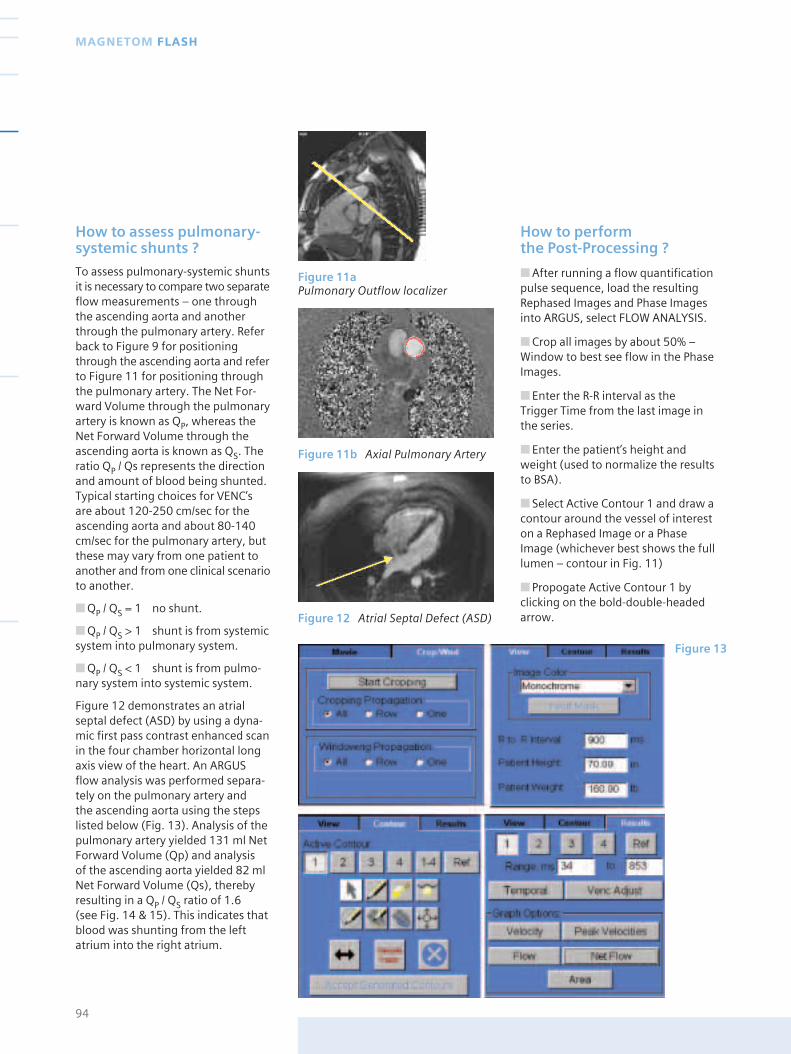
How to assess pulmonary-systemic shunts ?
To assess pulmonary-systemic shuntsit is necessary to compare two separateflow measurements – one throughthe ascending aorta and anotherthrough the pulmonary artery. Referback to Figure 9 for positioningthrough the ascending aorta and referto Figure 11 for positioning throughthe pulmonary artery. The Net For-ward Volume through the pulmonaryartery is known as QP, whereas theNet Forward Volume through theascending aorta is known as QS. Theratio QP / Qs represents the directionand amount of blood being shunted.Typical starting choices for VENC’sare about 120-250 cm/sec for theascending aorta and about 80-140cm/sec for the pulmonary artery, butthese may vary from one patient toanother and from one clinical scenarioto another.
■ QP / QS = 1 no shunt.
■ QP / QS > 1 shunt is from systemicsystem into pulmonary system.
■ QP / QS < 1 shunt is from pulmo-nary system into systemic system.
Figure 12 demonstrates an atrialseptal defect (ASD) by using a dyna-mic first pass contrast enhanced scanin the four chamber horizontal longaxis view of the heart. An ARGUSflow analysis was performed separa-tely on the pulmonary artery and the ascending aorta using the stepslisted below (Fig. 13). Analysis of thepulmonary artery yielded 131 ml NetForward Volume (Qp) and analysis of the ascending aorta yielded 82 mlNet Forward Volume (Qs), therebyresulting in a QP / QS ratio of 1.6 (see Fig. 14 & 15). This indicates thatblood was shunting from the leftatrium into the right atrium.
How to perform the Post-Processing ?
■ After running a flow quantificationpulse sequence, load the resultingRephased Images and Phase Imagesinto ARGUS, select FLOW ANALYSIS.
■ Crop all images by about 50% –Window to best see flow in the PhaseImages.
■ Enter the R-R interval as the Trigger Time from the last image inthe series.
■ Enter the patient’s height andweight (used to normalize the resultsto BSA).
■ Select Active Contour 1 and draw acontour around the vessel of intereston a Rephased Image or a PhaseImage (whichever best shows the fulllumen – contour in Fig. 11)
■ Propogate Active Contour 1 byclicking on the bold-double-headedarrow.
94
MAGNETOM FLASH
Figure 11aPulmonary Outflow localizer
Figure 11b Axial Pulmonary Artery
Figure 12 Atrial Septal Defect (ASD)
Figure 13
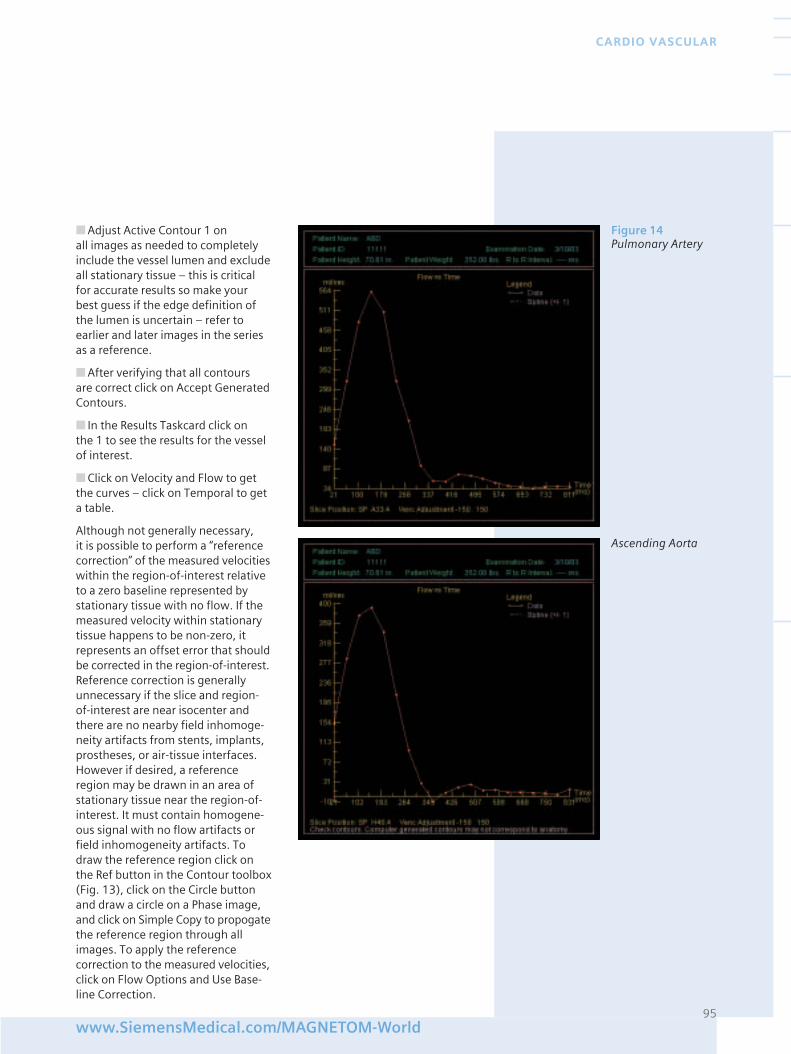
■ Adjust Active Contour 1 on all images as needed to completelyinclude the vessel lumen and excludeall stationary tissue – this is criticalfor accurate results so make yourbest guess if the edge definition ofthe lumen is uncertain – refer toearlier and later images in the seriesas a reference.
■ After verifying that all contours are correct click on Accept GeneratedContours.
■ In the Results Taskcard click on the 1 to see the results for the vesselof interest.
■ Click on Velocity and Flow to getthe curves – click on Temporal to geta table.
Although not generally necessary, it is possible to perform a “referencecorrection” of the measured velocitieswithin the region-of-interest relativeto a zero baseline represented bystationary tissue with no flow. If themeasured velocity within stationarytissue happens to be non-zero, itrepresents an offset error that shouldbe corrected in the region-of-interest.Reference correction is generallyunnecessary if the slice and region-of-interest are near isocenter andthere are no nearby field inhomoge-neity artifacts from stents, implants,prostheses, or air-tissue interfaces.However if desired, a referenceregion may be drawn in an area ofstationary tissue near the region-of-interest. It must contain homogene-ous signal with no flow artifacts orfield inhomogeneity artifacts. Todraw the reference region click onthe Ref button in the Contour toolbox(Fig. 13), click on the Circle buttonand draw a circle on a Phase image,and click on Simple Copy to propogatethe reference region through allimages. To apply the referencecorrection to the measured velocities,click on Flow Options and Use Base-line Correction.
95www.SiemensMedical.com/MAGNETOM-World
CARDIO VASCULAR
Figure 14Pulmonary Artery
Ascending Aorta
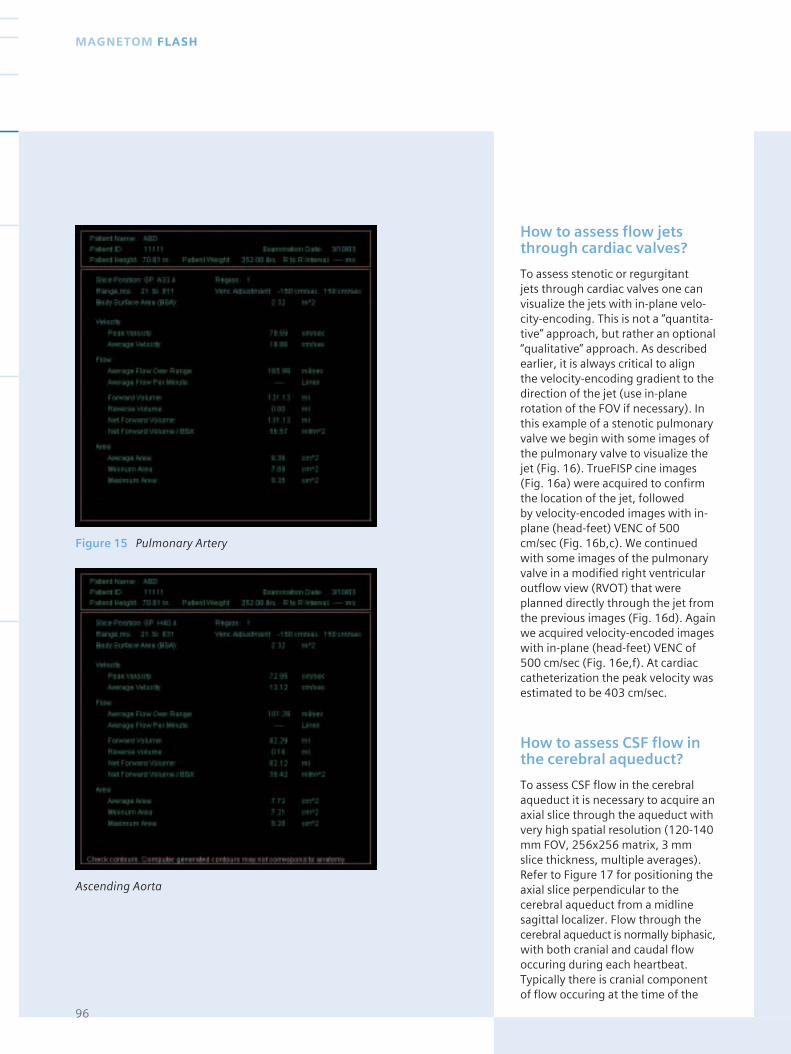
How to assess flow jetsthrough cardiac valves?
To assess stenotic or regurgitant jets through cardiac valves one canvisualize the jets with in-plane velo-city-encoding. This is not a “quantita-tive” approach, but rather an optional“qualitative” approach. As describedearlier, it is always critical to align the velocity-encoding gradient to thedirection of the jet (use in-planerotation of the FOV if necessary). Inthis example of a stenotic pulmonaryvalve we begin with some images ofthe pulmonary valve to visualize thejet (Fig. 16). TrueFISP cine images(Fig. 16a) were acquired to confirmthe location of the jet, followed by velocity-encoded images with in-plane (head-feet) VENC of 500cm/sec (Fig. 16b,c). We continuedwith some images of the pulmonaryvalve in a modified right ventricularoutflow view (RVOT) that wereplanned directly through the jet fromthe previous images (Fig. 16d). Againwe acquired velocity-encoded imageswith in-plane (head-feet) VENC of500 cm/sec (Fig. 16e,f). At cardiaccatheterization the peak velocity wasestimated to be 403 cm/sec.
How to assess CSF flow inthe cerebral aqueduct?
To assess CSF flow in the cerebralaqueduct it is necessary to acquire anaxial slice through the aqueduct withvery high spatial resolution (120-140mm FOV, 256x256 matrix, 3 mmslice thickness, multiple averages).Refer to Figure 17 for positioning theaxial slice perpendicular to thecerebral aqueduct from a midlinesagittal localizer. Flow through thecerebral aqueduct is normally biphasic,with both cranial and caudal flowoccuring during each heartbeat.Typically there is cranial componentof flow occuring at the time of the
96
MAGNETOM FLASH
Figure 15 Pulmonary Artery
Ascending Aorta
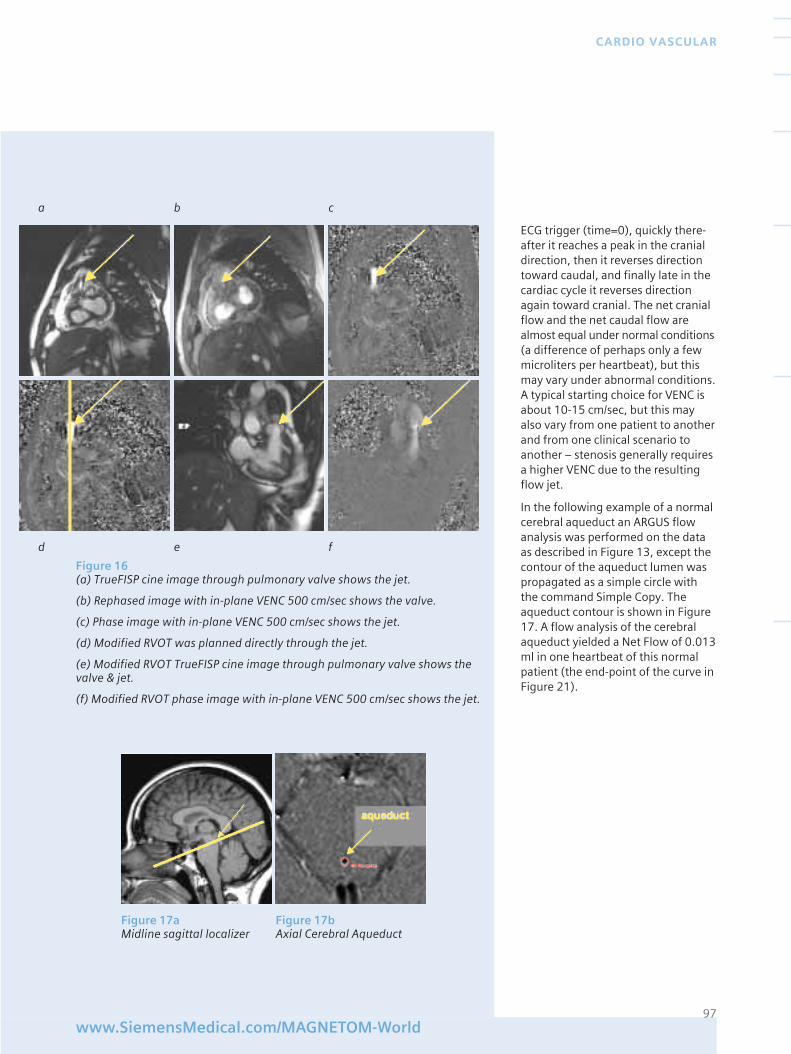
ECG trigger (time=0), quickly there-after it reaches a peak in the cranialdirection, then it reverses directiontoward caudal, and finally late in thecardiac cycle it reverses directionagain toward cranial. The net cranialflow and the net caudal flow arealmost equal under normal conditions(a difference of perhaps only a fewmicroliters per heartbeat), but thismay vary under abnormal conditions.A typical starting choice for VENC isabout 10-15 cm/sec, but this mayalso vary from one patient to anotherand from one clinical scenario toanother – stenosis generally requiresa higher VENC due to the resultingflow jet.
In the following example of a normalcerebral aqueduct an ARGUS flowanalysis was performed on the dataas described in Figure 13, except thecontour of the aqueduct lumen waspropagated as a simple circle withthe command Simple Copy. Theaqueduct contour is shown in Figure17. A flow analysis of the cerebralaqueduct yielded a Net Flow of 0.013ml in one heartbeat of this normalpatient (the end-point of the curve inFigure 21).
97www.SiemensMedical.com/MAGNETOM-World
CARDIO VASCULAR
a b c
d e f
Figure 16(a) TrueFISP cine image through pulmonary valve shows the jet.
(b) Rephased image with in-plane VENC 500 cm/sec shows the valve.
(c) Phase image with in-plane VENC 500 cm/sec shows the jet.
(d) Modified RVOT was planned directly through the jet.
(e) Modified RVOT TrueFISP cine image through pulmonary valve shows thevalve & jet.
(f) Modified RVOT phase image with in-plane VENC 500 cm/sec shows the jet.
Figure 17a Figure 17bMidline sagittal localizer Axial Cerebral Aqueduct
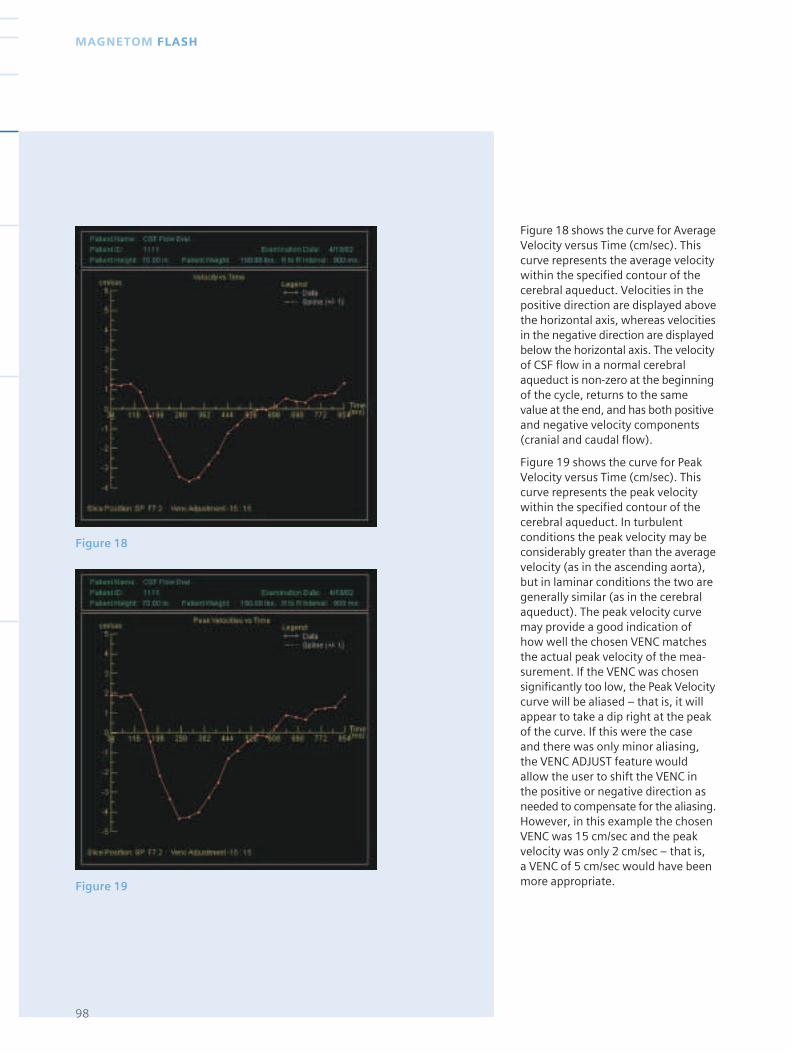
Figure 18
Figure 19
Figure 18 shows the curve for AverageVelocity versus Time (cm/sec). Thiscurve represents the average velocitywithin the specified contour of thecerebral aqueduct. Velocities in thepositive direction are displayed abovethe horizontal axis, whereas velocitiesin the negative direction are displayedbelow the horizontal axis. The velocityof CSF flow in a normal cerebralaqueduct is non-zero at the beginningof the cycle, returns to the samevalue at the end, and has both positiveand negative velocity components(cranial and caudal flow).
Figure 19 shows the curve for PeakVelocity versus Time (cm/sec). Thiscurve represents the peak velocitywithin the specified contour of thecerebral aqueduct. In turbulentconditions the peak velocity may beconsiderably greater than the averagevelocity (as in the ascending aorta),but in laminar conditions the two aregenerally similar (as in the cerebralaqueduct). The peak velocity curvemay provide a good indication ofhow well the chosen VENC matchesthe actual peak velocity of the mea-surement. If the VENC was chosensignificantly too low, the Peak Velocitycurve will be aliased – that is, it willappear to take a dip right at the peakof the curve. If this were the case and there was only minor aliasing,the VENC ADJUST feature wouldallow the user to shift the VENC inthe positive or negative direction asneeded to compensate for the aliasing.However, in this example the chosenVENC was 15 cm/sec and the peakvelocity was only 2 cm/sec – that is, a VENC of 5 cm/sec would have beenmore appropriate.
98
MAGNETOM FLASH
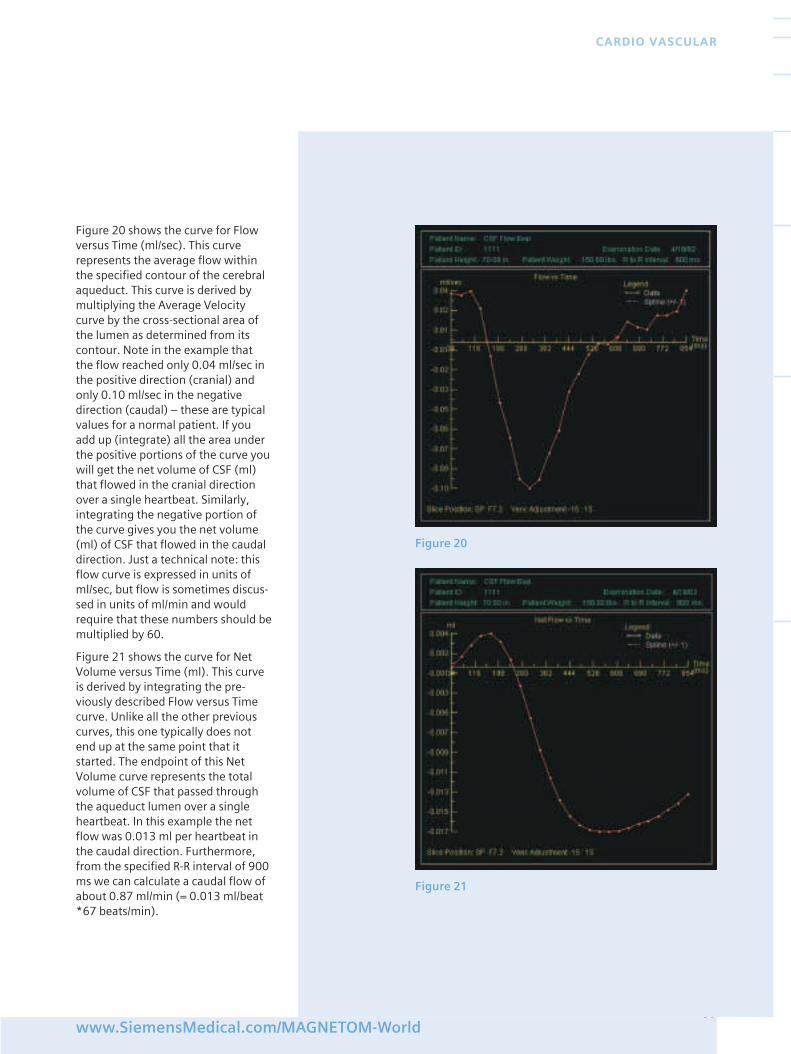
Figure 20 shows the curve for Flowversus Time (ml/sec). This curverepresents the average flow withinthe specified contour of the cerebralaqueduct. This curve is derived bymultiplying the Average Velocitycurve by the cross-sectional area ofthe lumen as determined from itscontour. Note in the example thatthe flow reached only 0.04 ml/sec inthe positive direction (cranial) andonly 0.10 ml/sec in the negativedirection (caudal) – these are typicalvalues for a normal patient. If youadd up (integrate) all the area underthe positive portions of the curve youwill get the net volume of CSF (ml)that flowed in the cranial directionover a single heartbeat. Similarly,integrating the negative portion ofthe curve gives you the net volume(ml) of CSF that flowed in the caudaldirection. Just a technical note: thisflow curve is expressed in units ofml/sec, but flow is sometimes discus-sed in units of ml/min and wouldrequire that these numbers should bemultiplied by 60.
Figure 21 shows the curve for NetVolume versus Time (ml). This curveis derived by integrating the pre-viously described Flow versus Timecurve. Unlike all the other previouscurves, this one typically does notend up at the same point that itstarted. The endpoint of this NetVolume curve represents the totalvolume of CSF that passed throughthe aqueduct lumen over a singleheartbeat. In this example the netflow was 0.013 ml per heartbeat inthe caudal direction. Furthermore,from the specified R-R interval of 900ms we can calculate a caudal flow ofabout 0.87 ml/min (= 0.013 ml/beat*67 beats/min).
99www.SiemensMedical.com/MAGNETOM-World
CARDIO VASCULAR
Figure 20
Figure 21
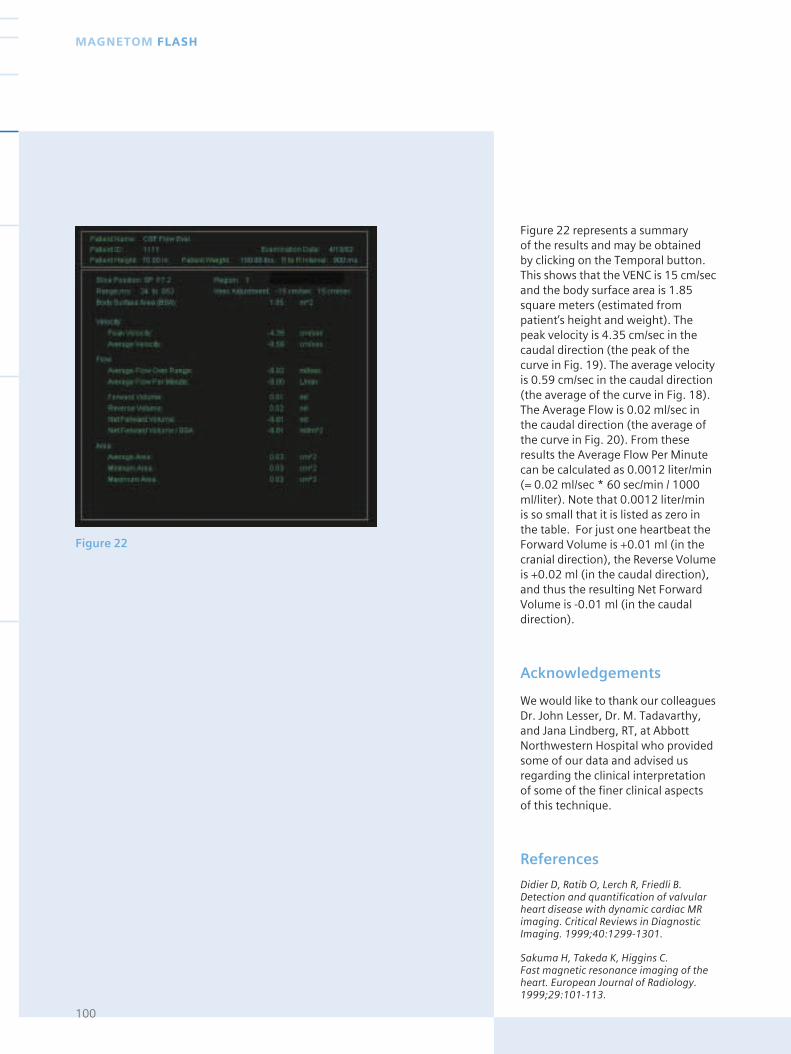
Figure 22
Figure 22 represents a summary of the results and may be obtainedby clicking on the Temporal button. This shows that the VENC is 15 cm/secand the body surface area is 1.85square meters (estimated frompatient’s height and weight). Thepeak velocity is 4.35 cm/sec in thecaudal direction (the peak of thecurve in Fig. 19). The average velocityis 0.59 cm/sec in the caudal direction(the average of the curve in Fig. 18).The Average Flow is 0.02 ml/sec inthe caudal direction (the average ofthe curve in Fig. 20). From theseresults the Average Flow Per Minutecan be calculated as 0.0012 liter/min(= 0.02 ml/sec * 60 sec/min / 1000ml/liter). Note that 0.0012 liter/min is so small that it is listed as zero inthe table. For just one heartbeat theForward Volume is +0.01 ml (in thecranial direction), the Reverse Volumeis +0.02 ml (in the caudal direction),and thus the resulting Net ForwardVolume is -0.01 ml (in the caudaldirection).
Acknowledgements
We would like to thank our colleaguesDr. John Lesser, Dr. M. Tadavarthy,and Jana Lindberg, RT, at AbbottNorthwestern Hospital who providedsome of our data and advised usregarding the clinical interpretationof some of the finer clinical aspectsof this technique.
References
Didier D, Ratib O, Lerch R, Friedli B.Detection and quantification of valvularheart disease with dynamic cardiac MRimaging. Critical Reviews in DiagnosticImaging. 1999;40:1299-1301.
Sakuma H, Takeda K, Higgins C. Fast magnetic resonance imaging of theheart. European Journal of Radiology.1999;29:101-113.
100
MAGNETOM FLASH
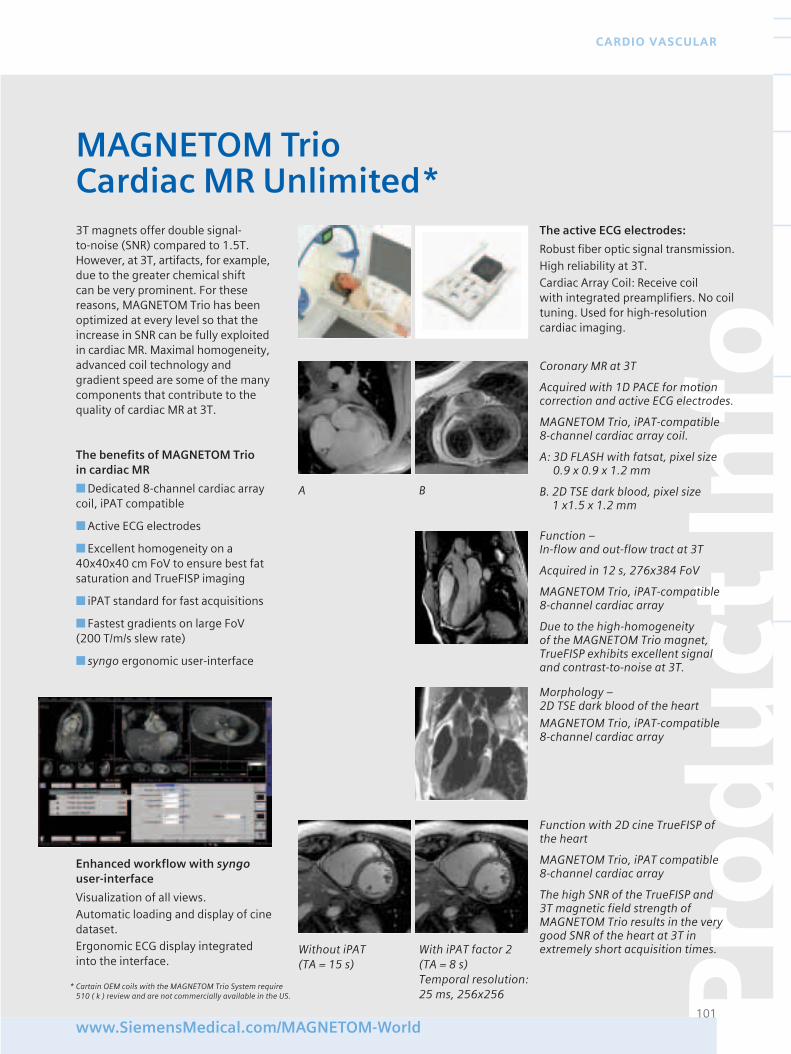
Pro
du
ct In
fo
101www.SiemensMedical.com/MAGNETOM-World
CARDIO VASCULAR
Coronary MR at 3T
Acquired with 1D PACE for motioncorrection and active ECG electrodes.
MAGNETOM Trio, iPAT-compatible 8-channel cardiac array coil.
A: 3D FLASH with fatsat, pixel size0.9 x 0.9 x 1.2 mm
B. 2D TSE dark blood, pixel size 1 x1.5 x 1.2 mm
Function – In-flow and out-flow tract at 3T
Acquired in 12 s, 276x384 FoV
MAGNETOM Trio, iPAT-compatible 8-channel cardiac array
Due to the high-homogeneity of the MAGNETOM Trio magnet,TrueFISP exhibits excellent signaland contrast-to-noise at 3T.
3T magnets offer double signal-to-noise (SNR) compared to 1.5T.However, at 3T, artifacts, for example,due to the greater chemical shift can be very prominent. For thesereasons, MAGNETOM Trio has beenoptimized at every level so that theincrease in SNR can be fully exploitedin cardiac MR. Maximal homogeneity,advanced coil technology andgradient speed are some of the manycomponents that contribute to thequality of cardiac MR at 3T.
The benefits of MAGNETOM Trio in cardiac MR
■ Dedicated 8-channel cardiac arraycoil, iPAT compatible
■ Active ECG electrodes
■ Excellent homogeneity on a40x40x40 cm FoV to ensure best fatsaturation and TrueFISP imaging
■ iPAT standard for fast acquisitions
■ Fastest gradients on large FoV(200 T/m/s slew rate)
■ syngo ergonomic user-interface
MAGNETOM TrioCardiac MR Unlimited*
The active ECG electrodes:
Robust fiber optic signal transmission.High reliability at 3T.Cardiac Array Coil: Receive coil with integrated preamplifiers. No coiltuning. Used for high-resolutioncardiac imaging.
Enhanced workflow with syngouser-interface
Visualization of all views.Automatic loading and display of cinedataset.Ergonomic ECG display integratedinto the interface.
Morphology – 2D TSE dark blood of the heart
MAGNETOM Trio, iPAT-compatible 8-channel cardiac array
A B
Function with 2D cine TrueFISP ofthe heart
MAGNETOM Trio, iPAT compatible 8-channel cardiac array
The high SNR of the TrueFISP and 3T magnetic field strength ofMAGNETOM Trio results in the verygood SNR of the heart at 3T inextremely short acquisition times.Without iPAT With iPAT factor 2
(TA = 15 s) (TA = 8 s)Temporal resolution: 25 ms, 256x256
* Cartain OEM coils with the MAGNETOM Trio System require 510 ( k ) review and are not commercially available in the US.
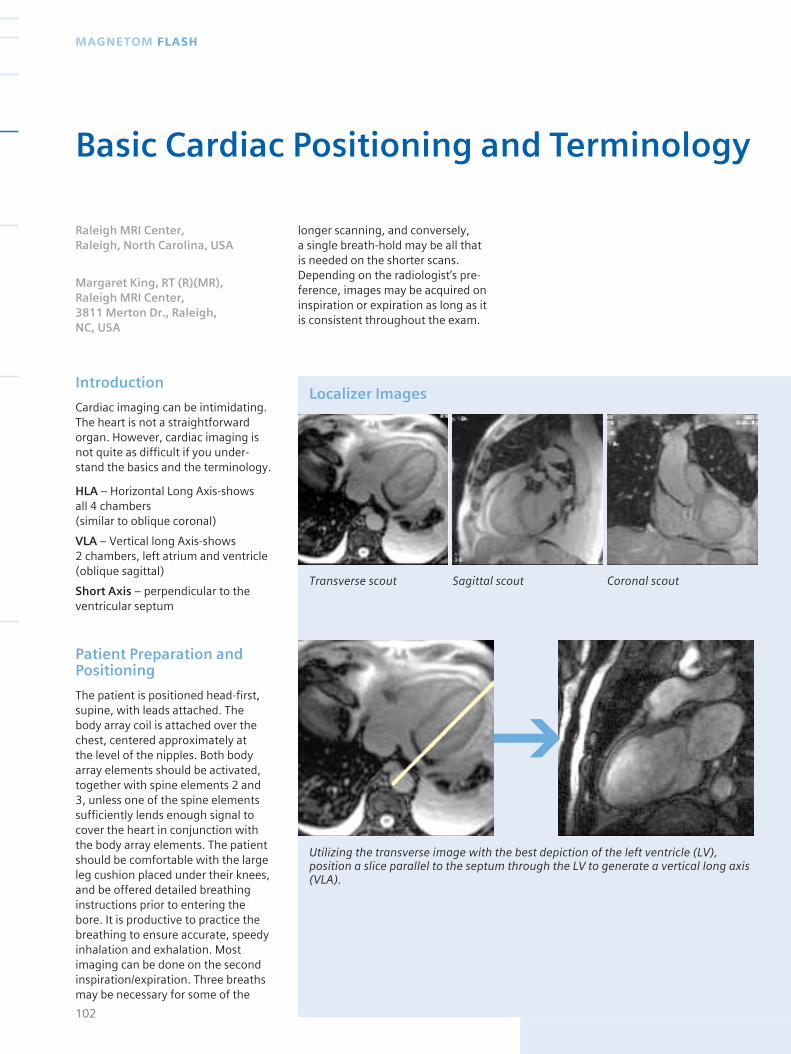
Introduction
Cardiac imaging can be intimidating.The heart is not a straightforwardorgan. However, cardiac imaging isnot quite as difficult if you under-stand the basics and the terminology.
HLA – Horizontal Long Axis-shows all 4 chambers (similar to oblique coronal)
VLA – Vertical long Axis-shows 2 chambers, left atrium and ventricle(oblique sagittal)
Short Axis – perpendicular to theventricular septum
Patient Preparation andPositioning
The patient is positioned head-first,supine, with leads attached. Thebody array coil is attached over thechest, centered approximately at the level of the nipples. Both bodyarray elements should be activated,together with spine elements 2 and3, unless one of the spine elementssufficiently lends enough signal tocover the heart in conjunction withthe body array elements. The patientshould be comfortable with the largeleg cushion placed under their knees,and be offered detailed breathinginstructions prior to entering thebore. It is productive to practice thebreathing to ensure accurate, speedyinhalation and exhalation. Mostimaging can be done on the secondinspiration/expiration. Three breathsmay be necessary for some of the
longer scanning, and conversely, a single breath-hold may be all that is needed on the shorter scans.Depending on the radiologist’s pre-ference, images may be acquired oninspiration or expiration as long as itis consistent throughout the exam.
102
MAGNETOM FLASH
Basic Cardiac Positioning and Terminology
Raleigh MRI Center, Raleigh, North Carolina, USA
Margaret King, RT (R)(MR), Raleigh MRI Center, 3811 Merton Dr., Raleigh, NC, USA
Localizer Images
Transverse scout Sagittal scout Coronal scout
Utilizing the transverse image with the best depiction of the left ventricle (LV),position a slice parallel to the septum through the LV to generate a vertical long axis(VLA).
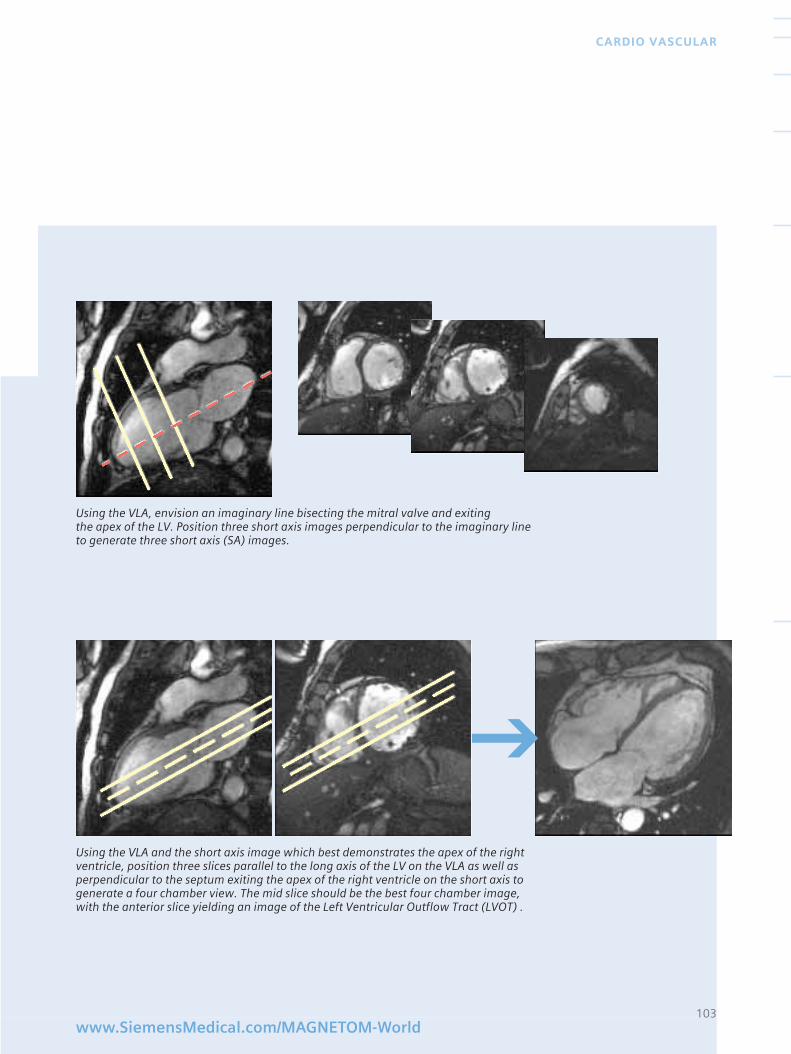
103www.SiemensMedical.com/MAGNETOM-World
CARDIO VASCULAR
Using the VLA and the short axis image which best demonstrates the apex of the rightventricle, position three slices parallel to the long axis of the LV on the VLA as well asperpendicular to the septum exiting the apex of the right ventricle on the short axis togenerate a four chamber view. The mid slice should be the best four chamber image,with the anterior slice yielding an image of the Left Ventricular Outflow Tract (LVOT) .
Using the VLA, envision an imaginary line bisecting the mitral valve and exiting the apex of the LV. Position three short axis images perpendicular to the imaginary lineto generate three short axis (SA) images.
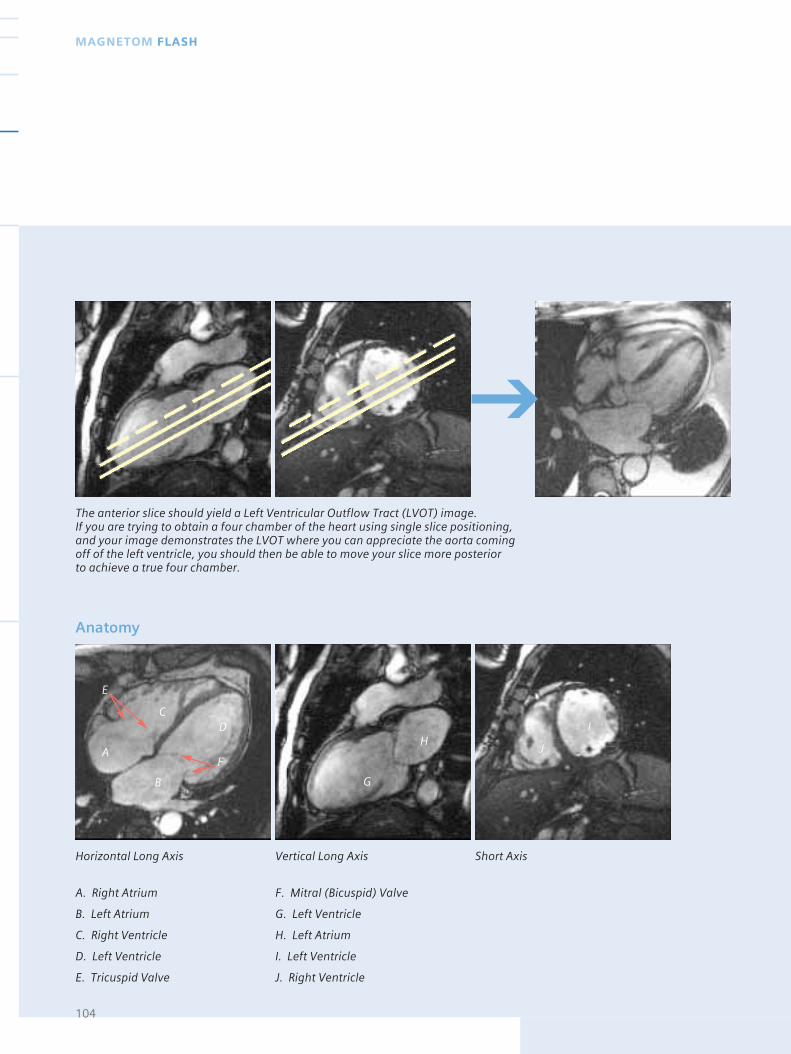
104
MAGNETOM FLASH
Horizontal Long Axis Vertical Long Axis Short Axis
Anatomy
A. Right Atrium F. Mitral (Bicuspid) Valve
B. Left Atrium G. Left Ventricle
C. Right Ventricle H. Left Atrium
D. Left Ventricle I. Left Ventricle
E. Tricuspid Valve J. Right Ventricle
A J
IH
G
F
D
E
C
B
The anterior slice should yield a Left Ventricular Outflow Tract (LVOT) image. If you are trying to obtain a four chamber of the heart using single slice positioning,and your image demonstrates the LVOT where you can appreciate the aorta comingoff of the left ventricle, you should then be able to move your slice more posterior to achieve a true four chamber.
Sequence Details
Cardiac imaging utilizes many se-quences. Most of the images shownabove are a single, phase image froma cine. Depending on the indicationsfor the cardiac MR, a variety ofsequences may be used. Morphologysequences include but are not limitedto T1, T2, HASTE, IR, GRE and True-FISP imaging. Cine imaging mayinclude TrueFISP cine as well asFLASH cine. A list of the parametersfor frequently used sequences arelisted below.
TSE T1, Single Slice (Morphology)
Tse9_db_t1, #slices 1, slice thickness5mm, TR 600, TE 24, TA ~11s, TD 50ms, ETL 9, matrix size 256, 60% FOV 340, Rectangular FOV 82%,AC 1, BW 305, FA 180.
TrueFISP, Single Slice orMulti-Slice (Morphology)
trufi_singleshot_15sl, #slices 1-15,slice thickness 5mm, TR 459, TE 1.56, TA ~9.9s, matrix size 256, 60% FOV 340, Rectangular FOV 82%,AC 1, BW 980, FA 62.
TSE T2, Single Slice (Morphology)
tse15_db_t2, #slices 1, slice thick-ness 5mm, TR 700, TE 70, TA ~8.4s,ETL 15, matrix size 256, 78% FOV 340, Rectangular FOV 82%,AC 1, BW 235, FA 180.
TrueFISP Cine, Multi-Phase (Function)
tf2d15_norm_HR, #slices 1 multi-phase, slice thickness 5mm, TR 47.4,TE 1.58, TA ~11s, ETL 9, matrix size 256, 79% FOV 340,Rectangular FOV 82%, AC 1, BW 930, FA 60, segments 15.
Discussion
The imaging sequences used toobtain the four chamber of the heartare a matter of choice and may varyfrom facility to facility. Frequently,cine images are used to work up tothe four chamber, since scan timesare substantially shorter than in thepast. The HASTE sequence in thelocalizer or morphology protocol treewill yield 7-15 slices in a breath hold,and are also used for multisliceimaging in any given orientation.
Most cardiac work-ups begin with the basic imaging described above.Commonly, a four chamber view isobtained and imaged with T1, T2 orIR, and Cine. From the four chamberimage, a fine tuned VLA or twochamber image is made with T1, T2and Cine. For various pathologies,the cardiac exam will be tailoredfrom that point on. Functionalanalysis will require short axis cinethrough the left ventricle. Viabilityand perfusion can also be performed.The basic terminology and metho-dology for obtaining a four chamber,two chamber and LVOT will demon-strate the basic heart anatomy andcine will demonstrate basic contractilefunction.
All cardiac exams will begin withbasic imaging as described above.The radiologist will choose the typeof imaging sequences. Once a fourchamber view is achieved, the battleis half-won, as those basic imageswill be used for positioning andimaging for the remaining portion of the cardiac exam.
Scanner
MAGNETOM Sonata
Coils used
CP Spine Array Elements 2&3 and CP Body Array Elements 1&2
Software Version
syngo MR 2002B
105www.SiemensMedical.com/MAGNETOM-World
CARDIO VASCULAR
Objective:
■ To perform contrast enhanced MRA of upper extremity from the arch to distal portion of a single extremity
Materials used:
■ Siemens MAGNETOM Sonata with syngo 2002B software and panoramictable option
■ Receive coils used: CP Body Array, CP Spine Array, and the CP large Flex coil.
■ MR compatible power injector **
■ Intravenous catheter **
MR Imaging Protocol:
1. II Scout_lower arm_0mm
3 plane scout with lateral offsets of the sagittal images to include both forearms
2. I Scout_chest_up arm_350mm
3 plane scout with lateral offsets of the sagittal images to include bothhumerii
3. I fl3d_chest_up arm _350mm
3D FLASH coronal sequence
TR: 3.5 matrix: 352x512
TE: 1.2 FOV: 280x400
slice thickness: 1.8 fat sat selected
no. of slices: 52 large FoV filter
4. II fl3d_lower_arm_0mm
3D FLASH sagittal sequence
TR: 4.4 matrix: 416x512
TE: 1.5 FOV: 320x400
slice thickness: 1.4 centric reordered k space filling
no. of slices: 60 large FOV filter
5. Pause for contrast
Trigger for inline pre/post subtraction
6. Carebolus-cor
New inline subtracted gad bolus tracking sequence in the coronal plane
Copy reference “adjust volume” from sequence 3
7. I fl3d_chest_up arm_350
Copy reference "everything” from sequence 3
8. II fl3d_lower_arm_0mm
Copy reference “everything” from sequence 4
106
MAGNETOM FLASH
Upper Extremity CE MRA with CARE-BOLUS Using syngo MR 2002BSteve Rigsby RTR MR
Senior MR Application Specialist
Siemens Medical Solutions, Inc.USA
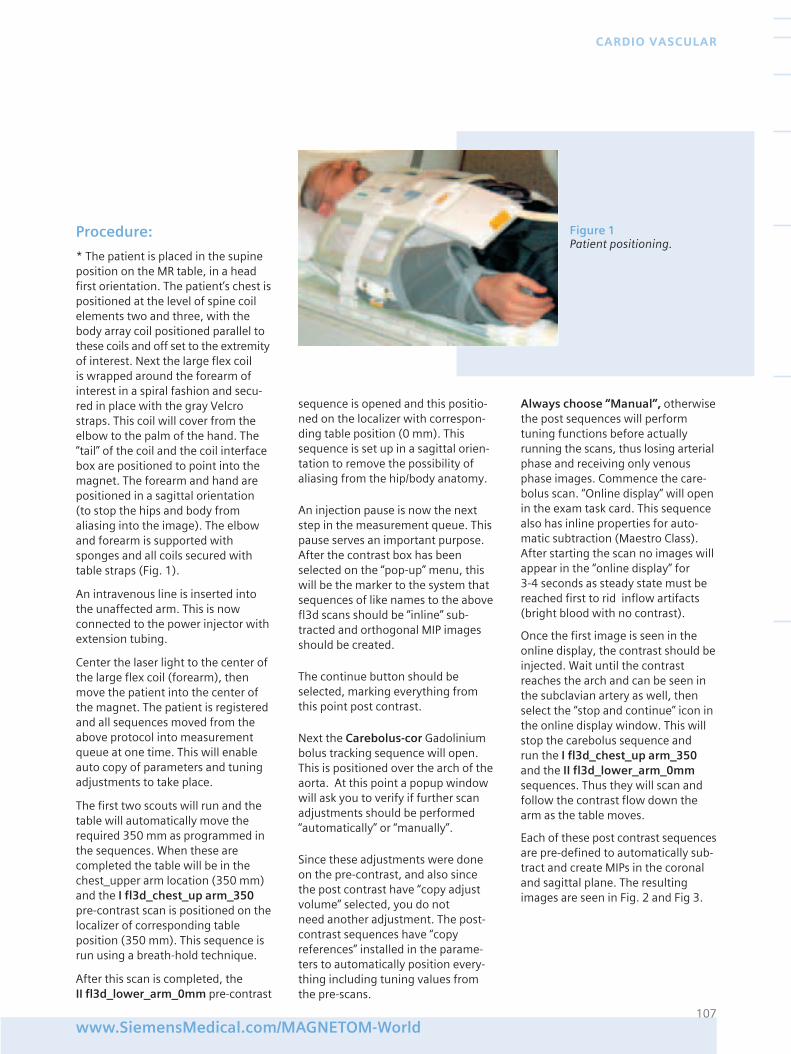
Procedure:
* The patient is placed in the supineposition on the MR table, in a headfirst orientation. The patient’s chest ispositioned at the level of spine coilelements two and three, with thebody array coil positioned parallel tothese coils and off set to the extremityof interest. Next the large flex coil is wrapped around the forearm ofinterest in a spiral fashion and secu-red in place with the gray Velcrostraps. This coil will cover from theelbow to the palm of the hand. The“tail” of the coil and the coil interfacebox are positioned to point into themagnet. The forearm and hand arepositioned in a sagittal orientation(to stop the hips and body fromaliasing into the image). The elbowand forearm is supported withsponges and all coils secured withtable straps (Fig. 1).
An intravenous line is inserted intothe unaffected arm. This is nowconnected to the power injector withextension tubing.
Center the laser light to the center ofthe large flex coil (forearm), thenmove the patient into the center ofthe magnet. The patient is registeredand all sequences moved from theabove protocol into measurementqueue at one time. This will enableauto copy of parameters and tuningadjustments to take place.
The first two scouts will run and thetable will automatically move therequired 350 mm as programmed inthe sequences. When these arecompleted the table will be in thechest_upper arm location (350 mm)and the I fl3d_chest_up arm_350pre-contrast scan is positioned on thelocalizer of corresponding tableposition (350 mm). This sequence isrun using a breath-hold technique.
After this scan is completed, the II fl3d_lower_arm_0mm pre-contrast
sequence is opened and this positio-ned on the localizer with correspon-ding table position (0 mm). Thissequence is set up in a sagittal orien-tation to remove the possibility ofaliasing from the hip/body anatomy.
An injection pause is now the nextstep in the measurement queue. Thispause serves an important purpose.After the contrast box has beenselected on the “pop-up” menu, thiswill be the marker to the system thatsequences of like names to the abovefl3d scans should be “inline” sub-tracted and orthogonal MIP imagesshould be created.
The continue button should beselected, marking everything fromthis point post contrast.
Next the Carebolus-cor Gadoliniumbolus tracking sequence will open.This is positioned over the arch of theaorta. At this point a popup windowwill ask you to verify if further scanadjustments should be performed“automatically” or “manually”.
Since these adjustments were doneon the pre-contrast, and also sincethe post contrast have “copy adjustvolume” selected, you do not need another adjustment. The post-contrast sequences have “copyreferences” installed in the parame-ters to automatically position every-thing including tuning values fromthe pre-scans.
Always choose “Manual”, otherwisethe post sequences will performtuning functions before actuallyrunning the scans, thus losing arterialphase and receiving only venousphase images. Commence the care-bolus scan. “Online display” will openin the exam task card. This sequencealso has inline properties for auto-matic subtraction (Maestro Class).After starting the scan no images willappear in the “online display” for 3-4 seconds as steady state must bereached first to rid inflow artifacts(bright blood with no contrast).
Once the first image is seen in theonline display, the contrast should beinjected. Wait until the contrastreaches the arch and can be seen inthe subclavian artery as well, thenselect the “stop and continue” icon inthe online display window. This willstop the carebolus sequence and run the I fl3d_chest_up arm_350and the II fl3d_lower_arm_0mmsequences. Thus they will scan andfollow the contrast flow down thearm as the table moves.
Each of these post contrast sequencesare pre-defined to automatically sub-tract and create MIPs in the coronaland sagittal plane. The resultingimages are seen in Fig. 2 and Fig 3.
107www.SiemensMedical.com/MAGNETOM-World
CARDIO VASCULAR
Figure 1Patient positioning.
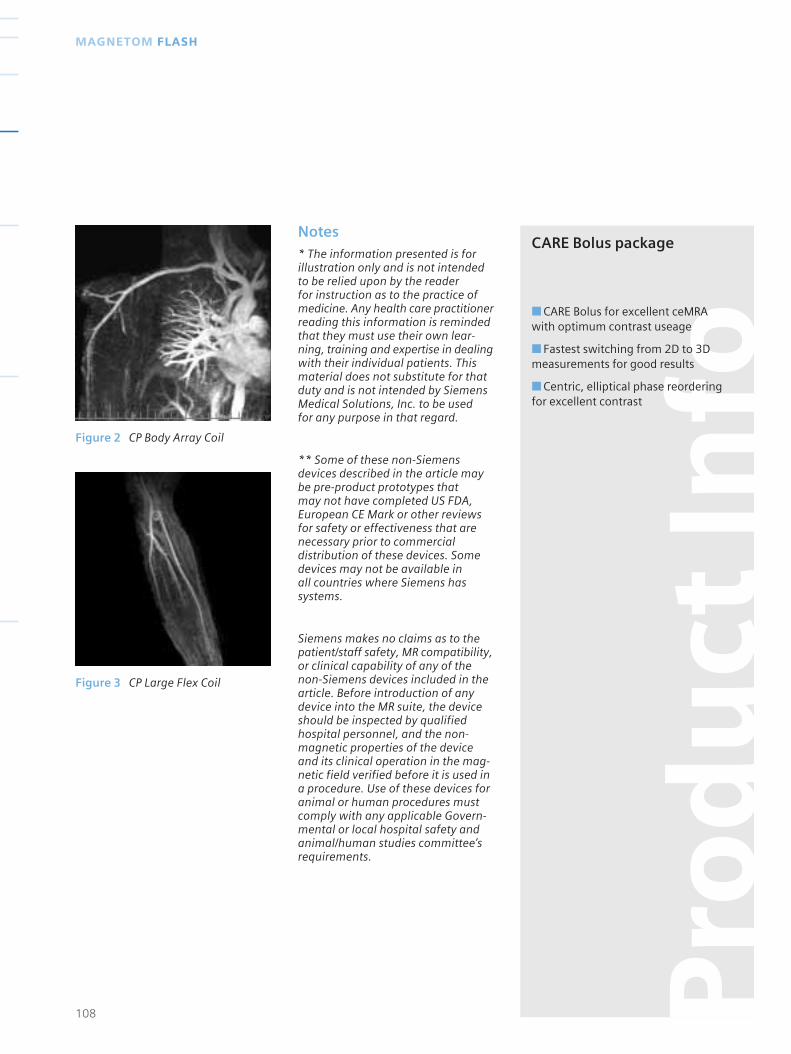
Notes* The information presented is forillustration only and is not intendedto be relied upon by the reader for instruction as to the practice ofmedicine. Any health care practitionerreading this information is remindedthat they must use their own lear-ning, training and expertise in dealingwith their individual patients. Thismaterial does not substitute for thatduty and is not intended by SiemensMedical Solutions, Inc. to be used for any purpose in that regard.
** Some of these non-Siemensdevices described in the article maybe pre-product prototypes that may not have completed US FDA,European CE Mark or other reviewsfor safety or effectiveness that arenecessary prior to commercialdistribution of these devices. Somedevices may not be available in all countries where Siemens hassystems.
Siemens makes no claims as to thepatient/staff safety, MR compatibility,or clinical capability of any of thenon-Siemens devices included in thearticle. Before introduction of anydevice into the MR suite, the deviceshould be inspected by qualifiedhospital personnel, and the non-magnetic properties of the deviceand its clinical operation in the mag-netic field verified before it is used ina procedure. Use of these devices foranimal or human procedures mustcomply with any applicable Govern-mental or local hospital safety andanimal/human studies committee’srequirements.
108
MAGNETOM FLASH
Figure 2 CP Body Array Coil
Figure 3 CP Large Flex Coil
Pro
du
ct In
fo
CARE Bolus package
■ CARE Bolus for excellent ceMRAwith optimum contrast useage
■ Fastest switching from 2D to 3Dmeasurements for good results
■ Centric, elliptical phase reorderingfor excellent contrast
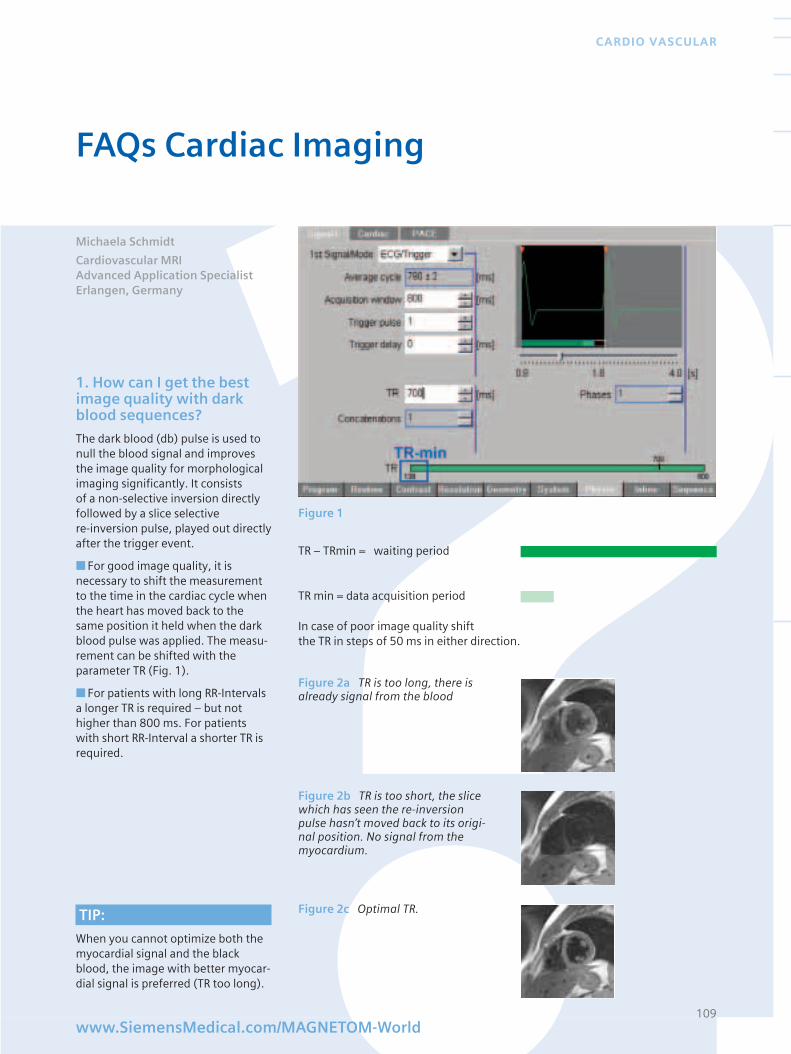
1. How can I get the bestimage quality with darkblood sequences?
The dark blood (db) pulse is used tonull the blood signal and improvesthe image quality for morphologicalimaging significantly. It consists of a non-selective inversion directlyfollowed by a slice selective re-inversion pulse, played out directlyafter the trigger event.
■ For good image quality, it isnecessary to shift the measurementto the time in the cardiac cycle whenthe heart has moved back to thesame position it held when the darkblood pulse was applied. The measu-rement can be shifted with theparameter TR (Fig. 1).
■ For patients with long RR-Intervalsa longer TR is required – but nothigher than 800 ms. For patientswith short RR-Interval a shorter TR isrequired.
In case of poor image quality shift the TR in steps of 50 ms in either direction.
109
CARDIO VASCULAR
Figure 1
FAQs Cardiac Imaging
www.SiemensMedical.com/MAGNETOM-World
TR – TRmin = waiting period
TR min = data acquisition period
Figure 2a TR is too long, there isalready signal from the blood
Figure 2b TR is too short, the slicewhich has seen the re-inversionpulse hasn’t moved back to its origi-nal position. No signal from themyocardium.
Figure 2c Optimal TR. TIP:
When you cannot optimize both themyocardial signal and the blackblood, the image with better myocar-dial signal is preferred (TR too long).
Michaela Schmidt
Cardiovascular MRIAdvanced Application Specialist Erlangen, Germany
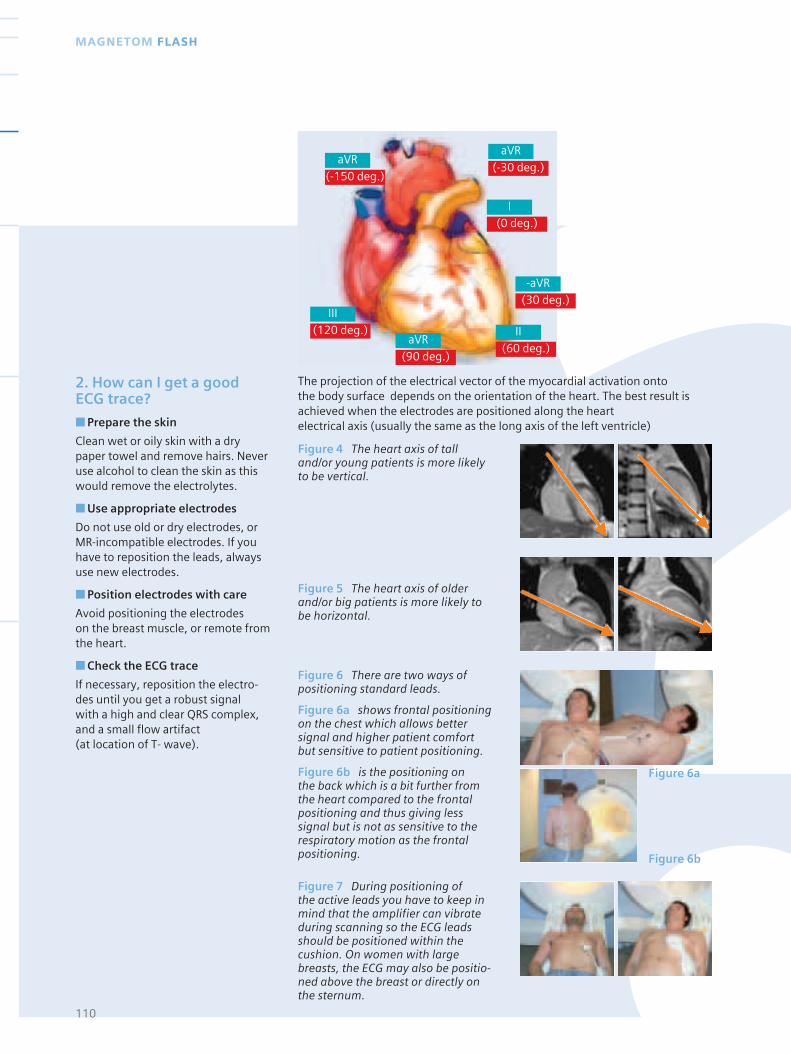
110
MAGNETOM FLASH
2. How can I get a goodECG trace?
■ Prepare the skin
Clean wet or oily skin with a drypaper towel and remove hairs. Neveruse alcohol to clean the skin as thiswould remove the electrolytes.
■ Use appropriate electrodes
Do not use old or dry electrodes, orMR-incompatible electrodes. If youhave to reposition the leads, alwaysuse new electrodes.
■ Position electrodes with care
Avoid positioning the electrodes on the breast muscle, or remote fromthe heart.
■ Check the ECG trace
If necessary, reposition the electro-des until you get a robust signal with a high and clear QRS complex,and a small flow artifact (at location of T- wave).
The projection of the electrical vector of the myocardial activation onto the body surface depends on the orientation of the heart. The best result isachieved when the electrodes are positioned along the heart electrical axis (usually the same as the long axis of the left ventricle)
Figure 4 The heart axis of talland/or young patients is more likelyto be vertical.
Figure 5 The heart axis of olderand/or big patients is more likely tobe horizontal.
Figure 6 There are two ways ofpositioning standard leads.
Figure 6a shows frontal positioningon the chest which allows bettersignal and higher patient comfortbut sensitive to patient positioning.
Figure 6b is the positioning on the back which is a bit further fromthe heart compared to the frontalpositioning and thus giving lesssignal but is not as sensitive to therespiratory motion as the frontalpositioning.
Figure 7 During positioning of the active leads you have to keep inmind that the amplifier can vibrateduring scanning so the ECG leadsshould be positioned within thecushion. On women with largebreasts, the ECG may also be positio-ned above the breast or directly onthe sternum.
Figure 6a
Figure 6b
aVR
(-150 deg.)
III
(120 deg.)
aVR
(-30 deg.)
aVR
(90 deg.)
I
(0 deg.)
-aVR
(30 deg.)
II
(60 deg.)
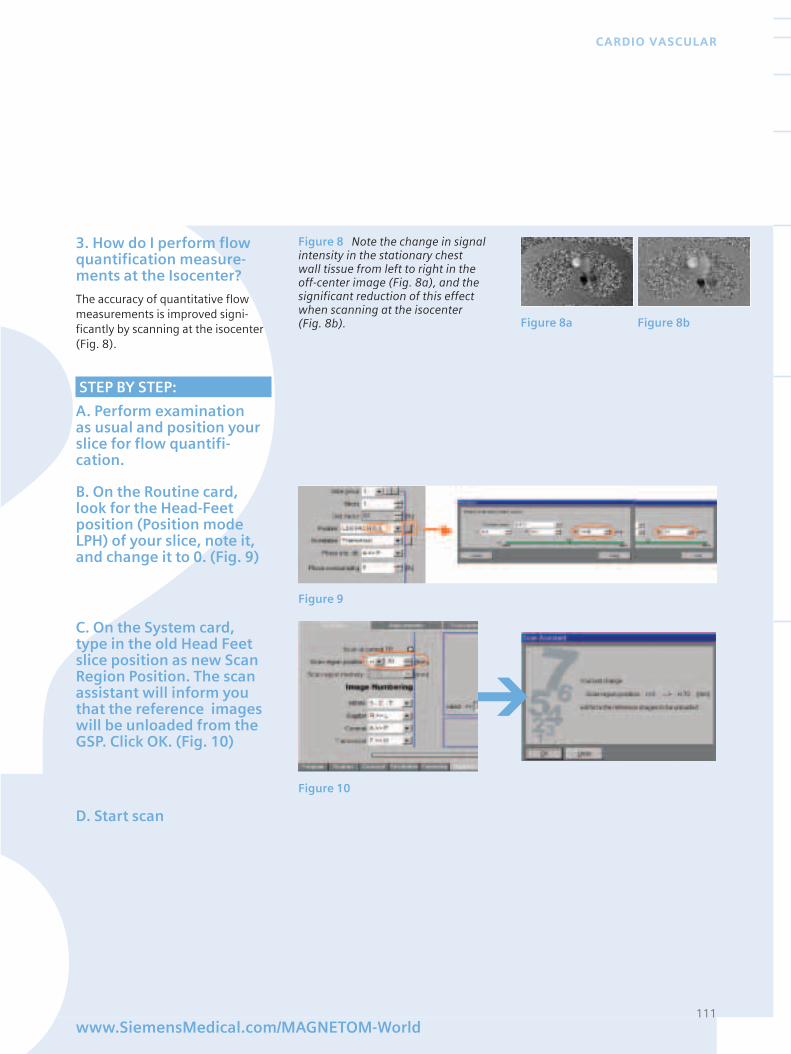
111www.SiemensMedical.com/MAGNETOM-World
CARDIO VASCULAR
3. How do I perform flowquantification measure-ments at the Isocenter?
The accuracy of quantitative flowmeasurements is improved signi-ficantly by scanning at the isocenter(Fig. 8).
STEP BY STEP:
A. Perform examination as usual and position yourslice for flow quantifi-cation.
Figure 8 Note the change in signalintensity in the stationary chest wall tissue from left to right in theoff-center image (Fig. 8a), and thesignificant reduction of this effectwhen scanning at the isocenter (Fig. 8b). Figure 8a Figure 8b
Figure 9
Figure 10
Figure 9
C. On the System card, type in the old Head Feetslice position as new ScanRegion Position. The scanassistant will inform youthat the reference imageswill be unloaded from theGSP. Click OK. (Fig. 10)
D. Start scan
B. On the Routine card,look for the Head-Feetposition (Position modeLPH) of your slice, note it,and change it to 0. (Fig. 9)
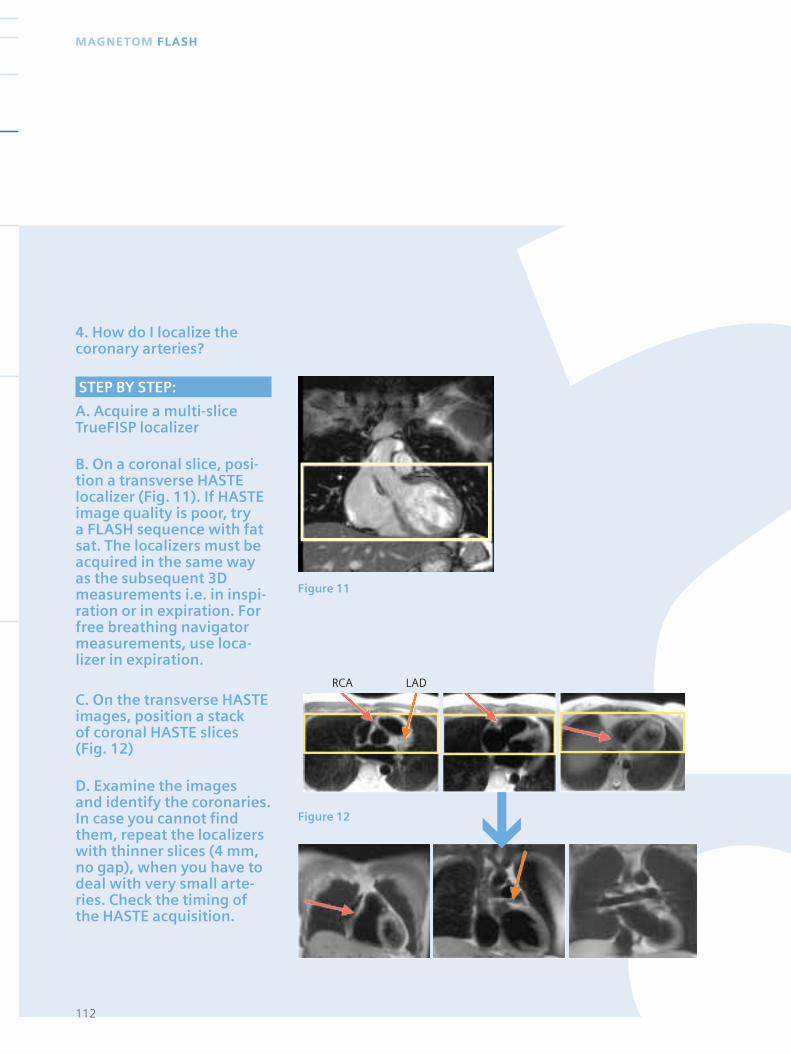
4. How do I localize thecoronary arteries?
112
MAGNETOM FLASH
STEP BY STEP:
A. Acquire a multi-sliceTrueFISP localizer
B. On a coronal slice, posi-tion a transverse HASTElocalizer (Fig. 11). If HASTEimage quality is poor, try a FLASH sequence with fatsat. The localizers must beacquired in the same wayas the subsequent 3Dmeasurements i.e. in inspi-ration or in expiration. Forfree breathing navigatormeasurements, use loca-lizer in expiration.
C. On the transverse HASTEimages, position a stack of coronal HASTE slices (Fig. 12)
D. Examine the images and identify the coronaries.In case you cannot findthem, repeat the localizerswith thinner slices (4 mm,no gap), when you have todeal with very small arte-ries. Check the timing ofthe HASTE acquisition.
Figure 11
Figure 12
RCA LAD
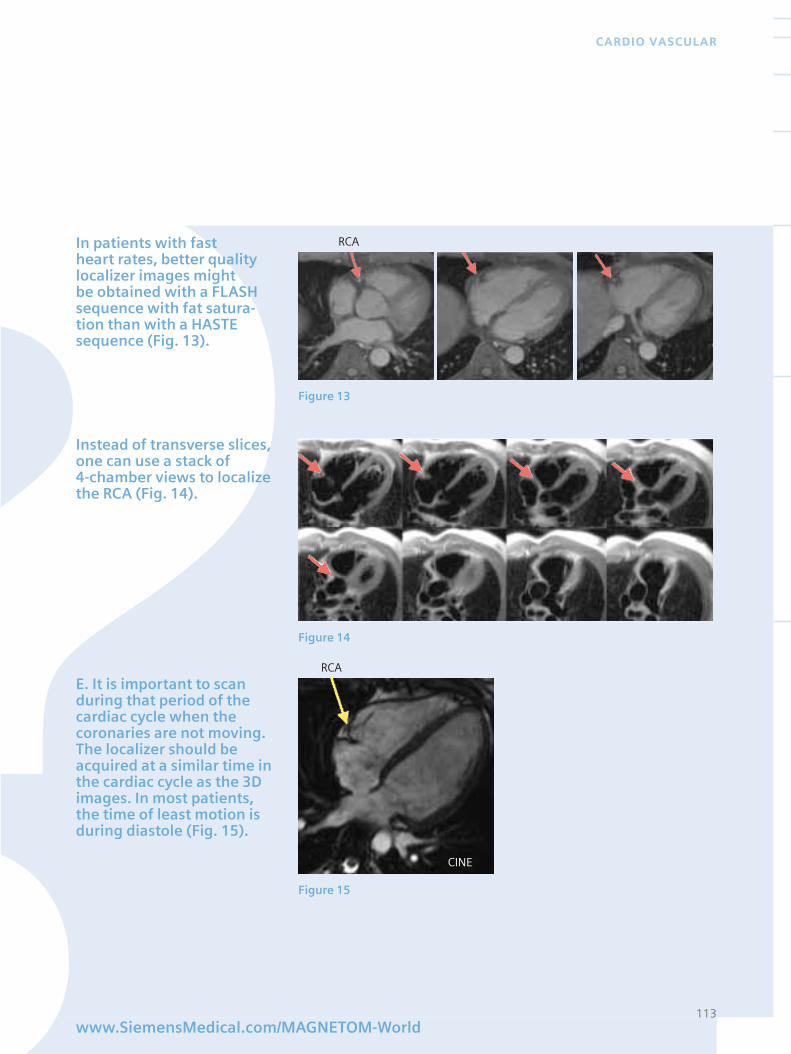
113www.SiemensMedical.com/MAGNETOM-World
CARDIO VASCULAR
In patients with fast heart rates, better qualitylocalizer images might be obtained with a FLASHsequence with fat satura-tion than with a HASTEsequence (Fig. 13).
Instead of transverse slices,one can use a stack of 4-chamber views to localizethe RCA (Fig. 14).
E. It is important to scanduring that period of thecardiac cycle when thecoronaries are not moving.The localizer should beacquired at a similar time inthe cardiac cycle as the 3Dimages. In most patients,the time of least motion isduring diastole (Fig. 15).
RCA
RCA
Figure 13
Figure 14
Figure 15
CINE
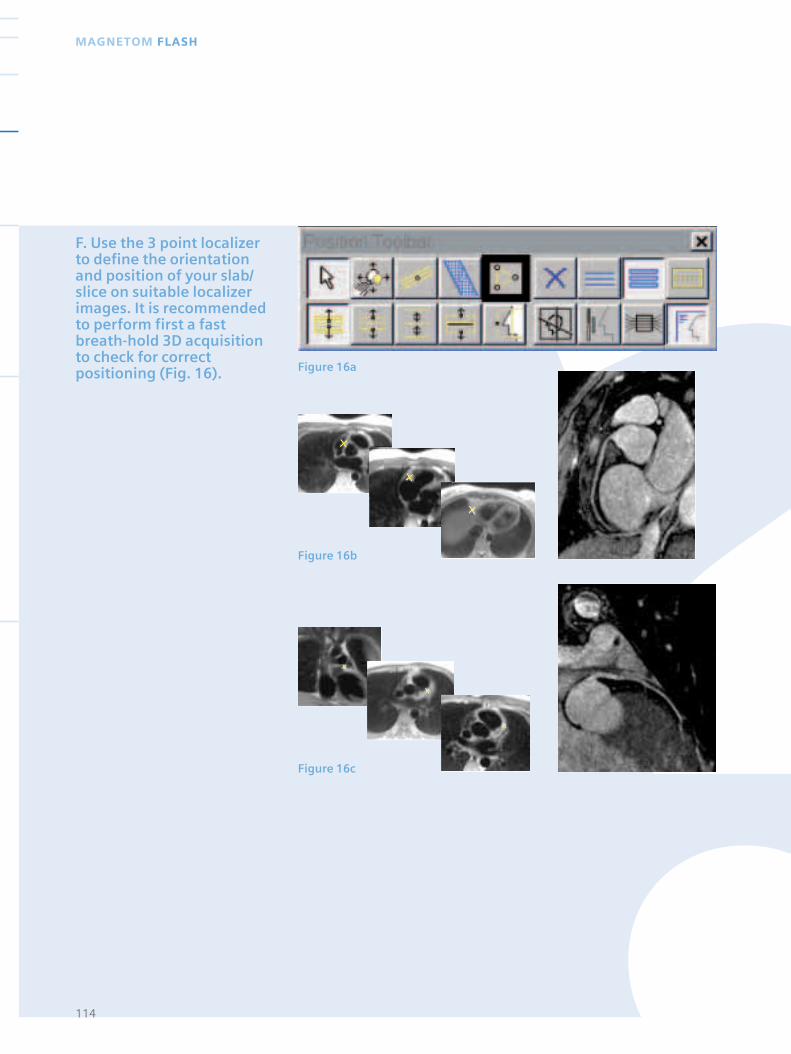
114
MAGNETOM FLASH
Figure 16a
Figure 16b
F. Use the 3 point localizerto define the orientationand position of your slab/slice on suitable localizerimages. It is recommendedto perform first a fastbreath-hold 3D acquisitionto check for correctpositioning (Fig. 16).
Figure 16c
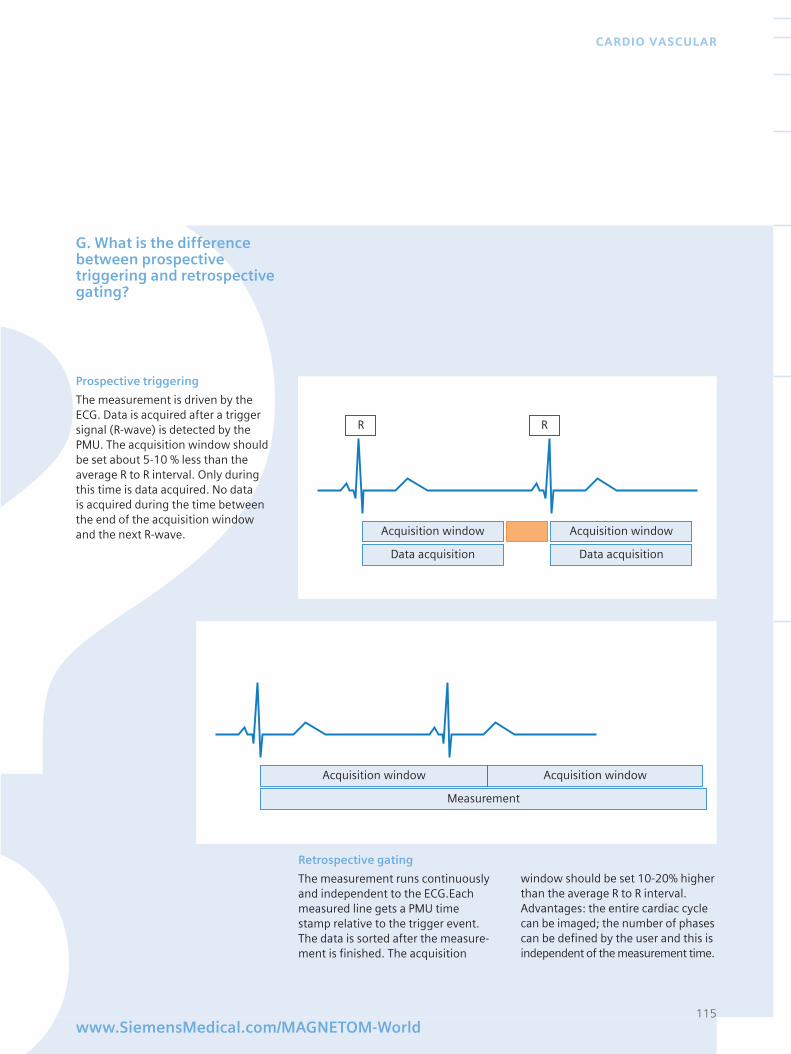
115www.SiemensMedical.com/MAGNETOM-World
CARDIO VASCULAR
G. What is the differencebetween prospectivetriggering and retrospectivegating?
Acquisition window
Data acquisition
Acquisition window
Data acquisition
RR
Acquisition window
Measurement
Acquisition window
Prospective triggering
The measurement is driven by theECG. Data is acquired after a triggersignal (R-wave) is detected by thePMU. The acquisition window shouldbe set about 5-10 % less than theaverage R to R interval. Only duringthis time is data acquired. No data is acquired during the time betweenthe end of the acquisition windowand the next R-wave.
Retrospective gating
The measurement runs continuouslyand independent to the ECG.Eachmeasured line gets a PMU timestamp relative to the trigger event.The data is sorted after the measure-ment is finished. The acquisition
window should be set 10-20% higherthan the average R to R interval.Advantages: the entire cardiac cyclecan be imaged; the number of phasescan be defined by the user and this isindependent of the measurement time.
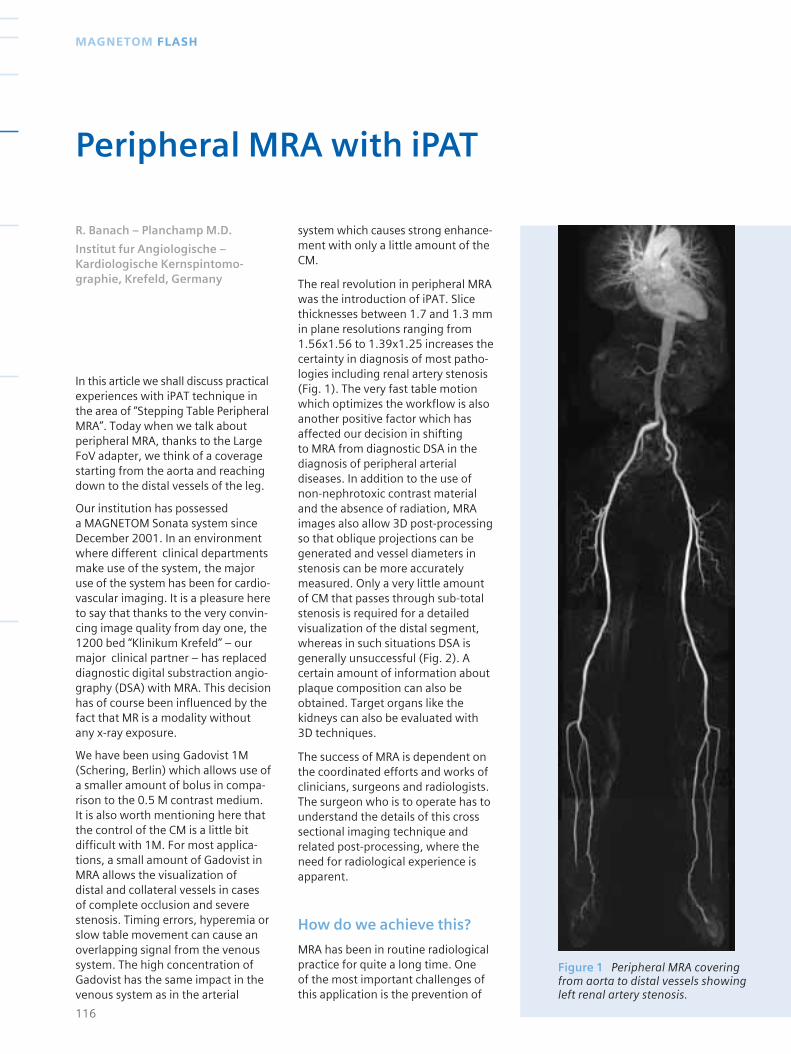
Figure 1 Peripheral MRA coveringfrom aorta to distal vessels showingleft renal artery stenosis.
In this article we shall discuss practicalexperiences with iPAT technique inthe area of “Stepping Table PeripheralMRA”. Today when we talk aboutperipheral MRA, thanks to the LargeFoV adapter, we think of a coveragestarting from the aorta and reachingdown to the distal vessels of the leg.
Our institution has possessed a MAGNETOM Sonata system sinceDecember 2001. In an environmentwhere different clinical departmentsmake use of the system, the majoruse of the system has been for cardio-vascular imaging. It is a pleasure hereto say that thanks to the very convin-cing image quality from day one, the1200 bed “Klinikum Krefeld” – ourmajor clinical partner – has replaceddiagnostic digital substraction angio-graphy (DSA) with MRA. This decisionhas of course been influenced by thefact that MR is a modality withoutany x-ray exposure.
We have been using Gadovist 1M(Schering, Berlin) which allows use ofa smaller amount of bolus in compa-rison to the 0.5 M contrast medium.It is also worth mentioning here thatthe control of the CM is a little bitdifficult with 1M. For most applica-tions, a small amount of Gadovist inMRA allows the visualization of distal and collateral vessels in casesof complete occlusion and severestenosis. Timing errors, hyperemia orslow table movement can cause anoverlapping signal from the venoussystem. The high concentration ofGadovist has the same impact in thevenous system as in the arterial
system which causes strong enhance-ment with only a little amount of theCM.
The real revolution in peripheral MRAwas the introduction of iPAT. Slicethicknesses between 1.7 and 1.3 mmin plane resolutions ranging from1.56x1.56 to 1.39x1.25 increases thecertainty in diagnosis of most patho-logies including renal artery stenosis(Fig. 1). The very fast table motionwhich optimizes the workflow is alsoanother positive factor which hasaffected our decision in shifting to MRA from diagnostic DSA in thediagnosis of peripheral arterialdiseases. In addition to the use ofnon-nephrotoxic contrast materialand the absence of radiation, MRAimages also allow 3D post-processingso that oblique projections can begenerated and vessel diameters instenosis can be more accuratelymeasured. Only a very little amountof CM that passes through sub-totalstenosis is required for a detailedvisualization of the distal segment,whereas in such situations DSA isgenerally unsuccessful (Fig. 2). Acertain amount of information aboutplaque composition can also beobtained. Target organs like thekidneys can also be evaluated with3D techniques.
The success of MRA is dependent onthe coordinated efforts and works ofclinicians, surgeons and radiologists.The surgeon who is to operate has tounderstand the details of this crosssectional imaging technique andrelated post-processing, where theneed for radiological experience isapparent.
How do we achieve this?
MRA has been in routine radiologicalpractice for quite a long time. One of the most important challenges ofthis application is the prevention of
116
MAGNETOM FLASH
Peripheral MRA with iPAT
R. Banach – Planchamp M.D.
Institut fur Angiologische – Kardiologische Kernspintomo-graphie, Krefeld, Germany
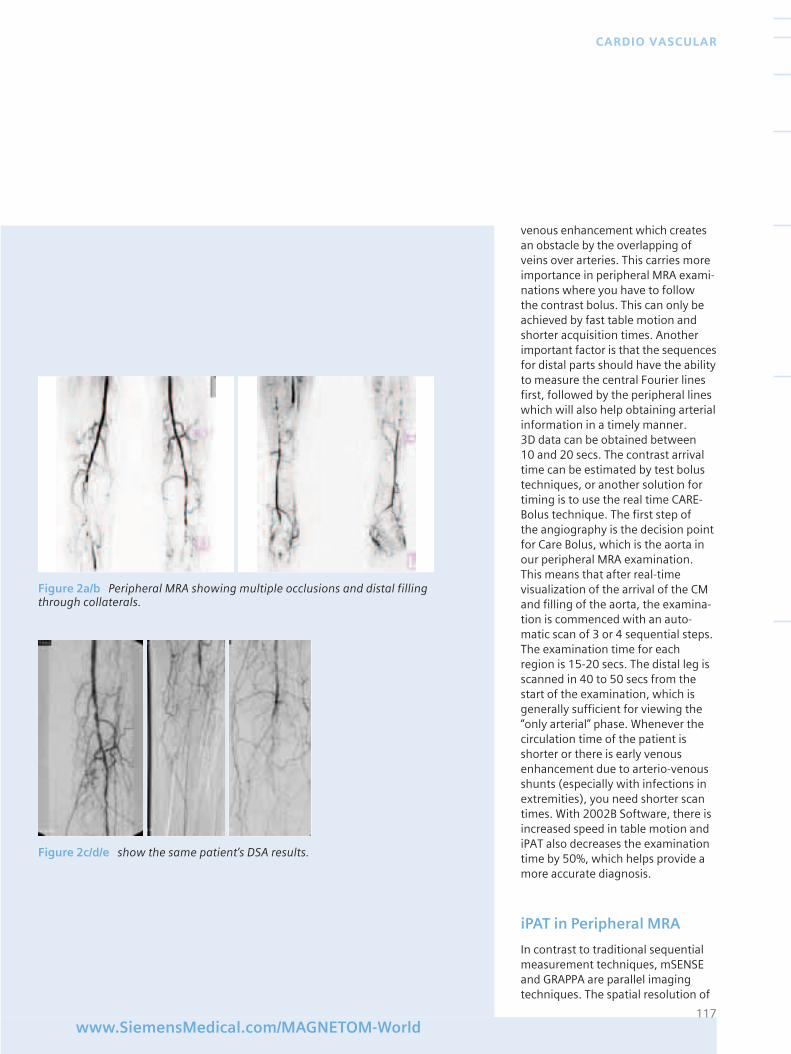
venous enhancement which createsan obstacle by the overlapping ofveins over arteries. This carries moreimportance in peripheral MRA exami-nations where you have to follow the contrast bolus. This can only beachieved by fast table motion andshorter acquisition times. Anotherimportant factor is that the sequencesfor distal parts should have the abilityto measure the central Fourier linesfirst, followed by the peripheral lineswhich will also help obtaining arterialinformation in a timely manner. 3D data can be obtained between 10 and 20 secs. The contrast arrivaltime can be estimated by test bolustechniques, or another solution fortiming is to use the real time CARE-Bolus technique. The first step of the angiography is the decision pointfor Care Bolus, which is the aorta inour peripheral MRA examination.This means that after real-timevisualization of the arrival of the CMand filling of the aorta, the examina-tion is commenced with an auto-matic scan of 3 or 4 sequential steps.The examination time for eachregion is 15-20 secs. The distal leg isscanned in 40 to 50 secs from thestart of the examination, which isgenerally sufficient for viewing the“only arterial” phase. Whenever thecirculation time of the patient isshorter or there is early venousenhancement due to arterio-venousshunts (especially with infections inextremities), you need shorter scantimes. With 2002B Software, there isincreased speed in table motion andiPAT also decreases the examinationtime by 50%, which helps provide amore accurate diagnosis.
iPAT in Peripheral MRA
In contrast to traditional sequentialmeasurement techniques, mSENSEand GRAPPA are parallel imagingtechniques. The spatial resolution of
117www.SiemensMedical.com/MAGNETOM-World
CARDIO VASCULAR
Figure 2a/b Peripheral MRA showing multiple occlusions and distal fillingthrough collaterals.
Figure 2c/d/e show the same patient’s DSA results.
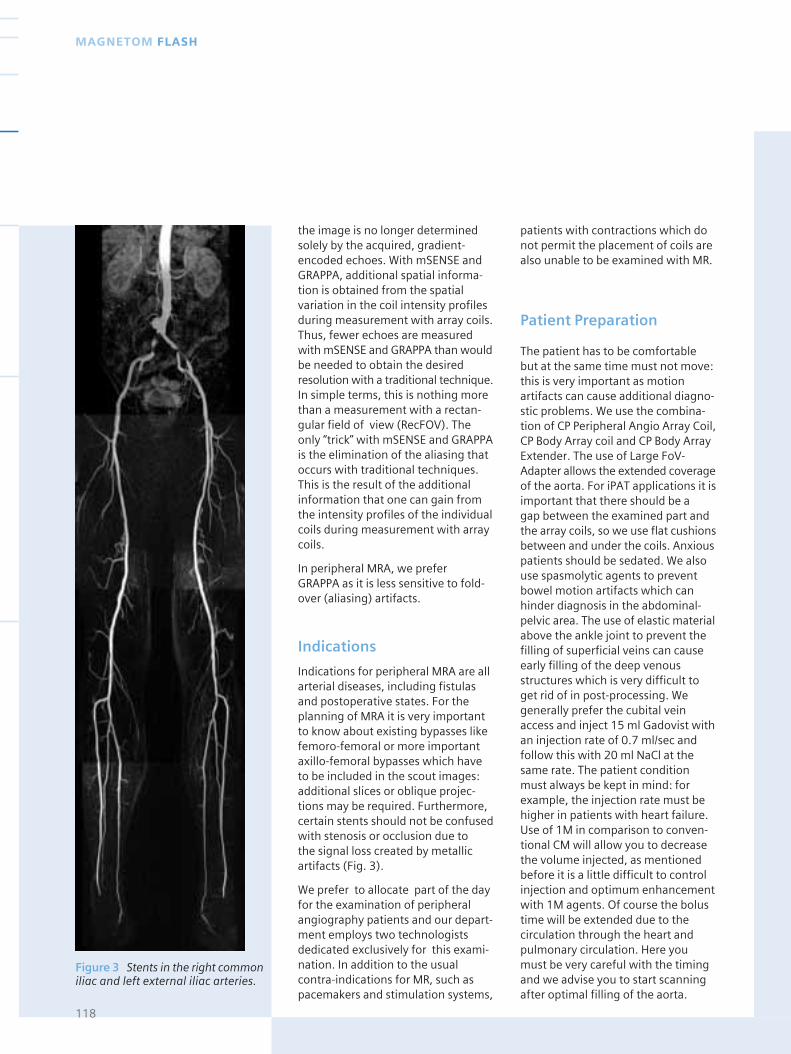
the image is no longer determinedsolely by the acquired, gradient-encoded echoes. With mSENSE andGRAPPA, additional spatial informa-tion is obtained from the spatialvariation in the coil intensity profilesduring measurement with array coils.Thus, fewer echoes are measuredwith mSENSE and GRAPPA than wouldbe needed to obtain the desiredresolution with a traditional technique.In simple terms, this is nothing morethan a measurement with a rectan-gular field of view (RecFOV). Theonly “trick” with mSENSE and GRAPPAis the elimination of the aliasing thatoccurs with traditional techniques.This is the result of the additionalinformation that one can gain fromthe intensity profiles of the individualcoils during measurement with arraycoils.
In peripheral MRA, we prefer GRAPPA as it is less sensitive to fold-over (aliasing) artifacts.
Indications
Indications for peripheral MRA are allarterial diseases, including fistulasand postoperative states. For theplanning of MRA it is very importantto know about existing bypasses likefemoro-femoral or more importantaxillo-femoral bypasses which haveto be included in the scout images:additional slices or oblique projec-tions may be required. Furthermore,certain stents should not be confusedwith stenosis or occlusion due to the signal loss created by metallicartifacts (Fig. 3).
We prefer to allocate part of the dayfor the examination of peripheralangiography patients and our depart-ment employs two technologistsdedicated exclusively for this exami-nation. In addition to the usualcontra-indications for MR, such aspacemakers and stimulation systems,
patients with contractions which donot permit the placement of coils arealso unable to be examined with MR.
Patient Preparation
The patient has to be comfortablebut at the same time must not move:this is very important as motionartifacts can cause additional diagno-stic problems. We use the combina-tion of CP Peripheral Angio Array Coil,CP Body Array coil and CP Body ArrayExtender. The use of Large FoV-Adapter allows the extended coverageof the aorta. For iPAT applications it isimportant that there should be a gap between the examined part andthe array coils, so we use flat cushionsbetween and under the coils. Anxiouspatients should be sedated. We alsouse spasmolytic agents to preventbowel motion artifacts which canhinder diagnosis in the abdominal-pelvic area. The use of elastic materialabove the ankle joint to prevent thefilling of superficial veins can causeearly filling of the deep venousstructures which is very difficult toget rid of in post-processing. Wegenerally prefer the cubital veinaccess and inject 15 ml Gadovist withan injection rate of 0.7 ml/sec andfollow this with 20 ml NaCl at thesame rate. The patient conditionmust always be kept in mind: forexample, the injection rate must behigher in patients with heart failure.Use of 1M in comparison to conven-tional CM will allow you to decreasethe volume injected, as mentionedbefore it is a little difficult to controlinjection and optimum enhancementwith 1M agents. Of course the bolustime will be extended due to thecirculation through the heart andpulmonary circulation. Here youmust be very careful with the timingand we advise you to start scanningafter optimal filling of the aorta.
118
MAGNETOM FLASH
Figure 3 Stents in the right commoniliac and left external iliac arteries.
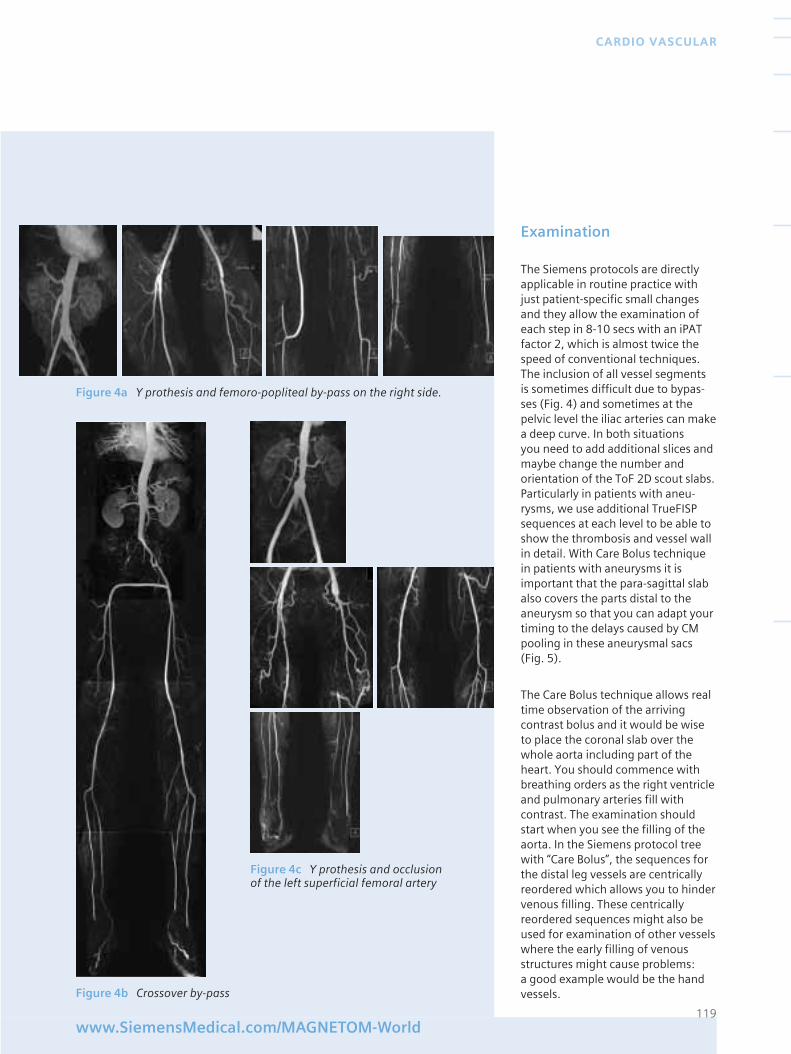
Examination
The Siemens protocols are directlyapplicable in routine practice withjust patient-specific small changesand they allow the examination ofeach step in 8-10 secs with an iPATfactor 2, which is almost twice thespeed of conventional techniques.The inclusion of all vessel segmentsis sometimes difficult due to bypas-ses (Fig. 4) and sometimes at thepelvic level the iliac arteries can makea deep curve. In both situations you need to add additional slices andmaybe change the number andorientation of the ToF 2D scout slabs.Particularly in patients with aneu-rysms, we use additional TrueFISPsequences at each level to be able toshow the thrombosis and vessel wallin detail. With Care Bolus techniquein patients with aneurysms it isimportant that the para-sagittal slabalso covers the parts distal to theaneurysm so that you can adapt yourtiming to the delays caused by CMpooling in these aneurysmal sacs (Fig. 5).
The Care Bolus technique allows realtime observation of the arrivingcontrast bolus and it would be wiseto place the coronal slab over thewhole aorta including part of theheart. You should commence withbreathing orders as the right ventricleand pulmonary arteries fill withcontrast. The examination shouldstart when you see the filling of theaorta. In the Siemens protocol treewith “Care Bolus”, the sequences forthe distal leg vessels are centricallyreordered which allows you to hindervenous filling. These centricallyreordered sequences might also beused for examination of other vesselswhere the early filling of venousstructures might cause problems: a good example would be the handvessels.
119www.SiemensMedical.com/MAGNETOM-World
CARDIO VASCULAR
Figure 4a Y prothesis and femoro-popliteal by-pass on the right side.
Figure 4c Y prothesis and occlusionof the left superficial femoral artery
Figure 4b Crossover by-pass
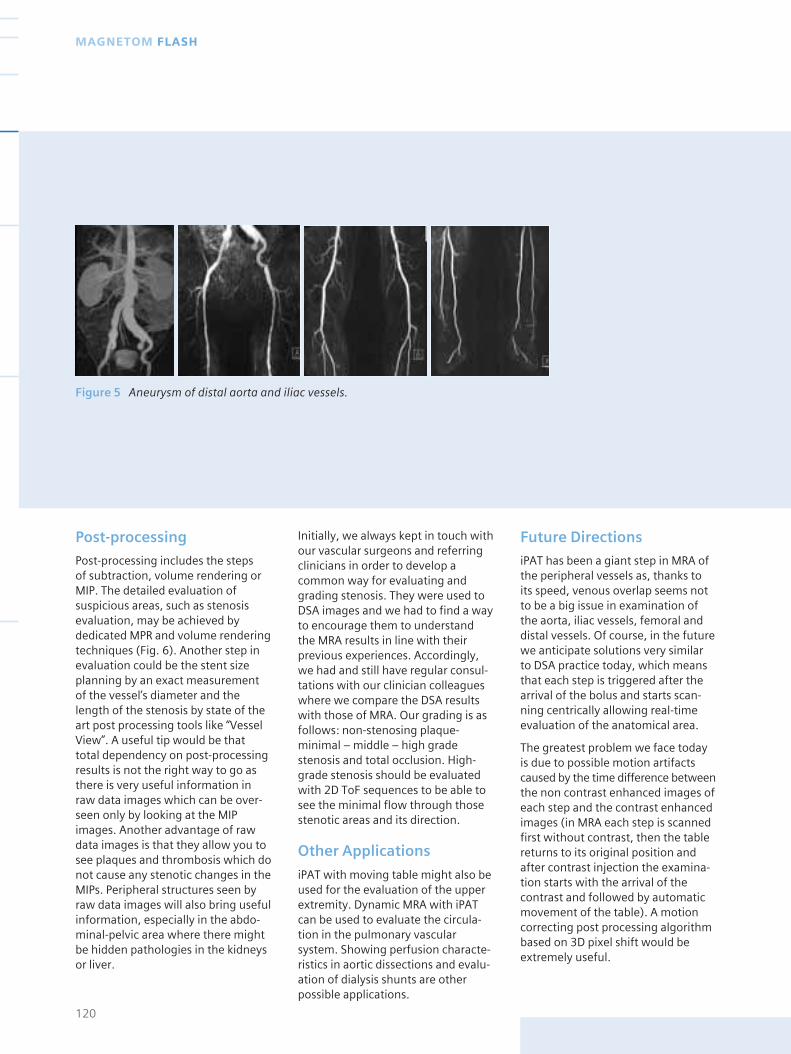
Figure 5 Aneurysm of distal aorta and iliac vessels.
Post-processing
Post-processing includes the steps of subtraction, volume rendering orMIP. The detailed evaluation ofsuspicious areas, such as stenosisevaluation, may be achieved bydedicated MPR and volume renderingtechniques (Fig. 6). Another step inevaluation could be the stent sizeplanning by an exact measurementof the vessel’s diameter and thelength of the stenosis by state of theart post processing tools like “VesselView”. A useful tip would be thattotal dependency on post-processingresults is not the right way to go asthere is very useful information inraw data images which can be over-seen only by looking at the MIPimages. Another advantage of rawdata images is that they allow you tosee plaques and thrombosis which donot cause any stenotic changes in theMIPs. Peripheral structures seen byraw data images will also bring usefulinformation, especially in the abdo-minal-pelvic area where there mightbe hidden pathologies in the kidneysor liver.
Initially, we always kept in touch withour vascular surgeons and referringclinicians in order to develop acommon way for evaluating andgrading stenosis. They were used toDSA images and we had to find a wayto encourage them to understandthe MRA results in line with theirprevious experiences. Accordingly,we had and still have regular consul-tations with our clinician colleagueswhere we compare the DSA resultswith those of MRA. Our grading is asfollows: non-stenosing plaque-minimal – middle – high gradestenosis and total occlusion. High-grade stenosis should be evaluatedwith 2D ToF sequences to be able tosee the minimal flow through thosestenotic areas and its direction.
Other Applications
iPAT with moving table might also beused for the evaluation of the upperextremity. Dynamic MRA with iPATcan be used to evaluate the circula-tion in the pulmonary vascularsystem. Showing perfusion characte-ristics in aortic dissections and evalu-ation of dialysis shunts are otherpossible applications.
120
MAGNETOM FLASH
Future Directions
iPAT has been a giant step in MRA ofthe peripheral vessels as, thanks toits speed, venous overlap seems notto be a big issue in examination ofthe aorta, iliac vessels, femoral anddistal vessels. Of course, in the futurewe anticipate solutions very similarto DSA practice today, which meansthat each step is triggered after thearrival of the bolus and starts scan-ning centrically allowing real-timeevaluation of the anatomical area.
The greatest problem we face todayis due to possible motion artifactscaused by the time difference betweenthe non contrast enhanced images ofeach step and the contrast enhancedimages (in MRA each step is scannedfirst without contrast, then the tablereturns to its original position andafter contrast injection the examina-tion starts with the arrival of thecontrast and followed by automaticmovement of the table). A motioncorrecting post processing algorithmbased on 3D pixel shift would beextremely useful.

Acknowledgements:
I would like to thank our techniciansA.Hünnekens, W.Kaartz, M.Nitsche,N. Zimmermann and of courseW.Chwilka.
Image examples: examinationswere performed with the combinationof CP Body Array, CP Body ArrayExtender, CP Peripheral Angio ArrayCoil, Large FoV Adapter and CP SpineArray Coil. At each step the phaseencoding direction was from right toleft. The PAT factor was chosen as 2 to minimize the examination timeto approximately half that of routineexams. Each table movement was333 mm, FoV 380-400mm. 4 different table positions with 3 table motions are preferred. Forthe abdomen, Body Array Elements1-2 and spine elements 3-6 werechosen. For the pelvis, Body ArrayElemets 3-4, Spine 3-4 and PR 3-4and PL 3-4 were chosen. For upperleg PR 2-4 and PL 2-4 and lower legPR 1-2 and PL 1-2 were chosen.
121www.SiemensMedical.com/MAGNETOM-World
CARDIO VASCULAR
Figure 6 Volume rendered images from peripheral MRA examination.
Figure 7 Dynamic MRA showinganomalous drainage of upper veinsof the lung into superior vena cava.
Future developments in technologywill hopefully allow high resolutionexaminations of the micro andmacro-angiopathies in the hands andfeet.
Institut für Angiologische – Kardiologische Kernspintomographie,Krefeld, Germany
PD Dr. V. Fiedler, Diagnostic Radiology
Prof. Dr. HG. Klues, Internal Medicine/Cardiology
Dr. R. Banach – Planchamp, Diagnostic Radiology
Dr. R. Ott, Internal Medicine/Cardiology
The Institute for CardiovascularMRI was established on December12, 2001.
The objective of this privateinitiative was to install the latestgeneration magnetic resonanceimaging (MRI) system in Krefeld.
In addition to patients from privatepractice, patients from the hospitalin Krefeld are also being examinedin the institution, enabling all tobenefit from this latest diagnostictechnology.
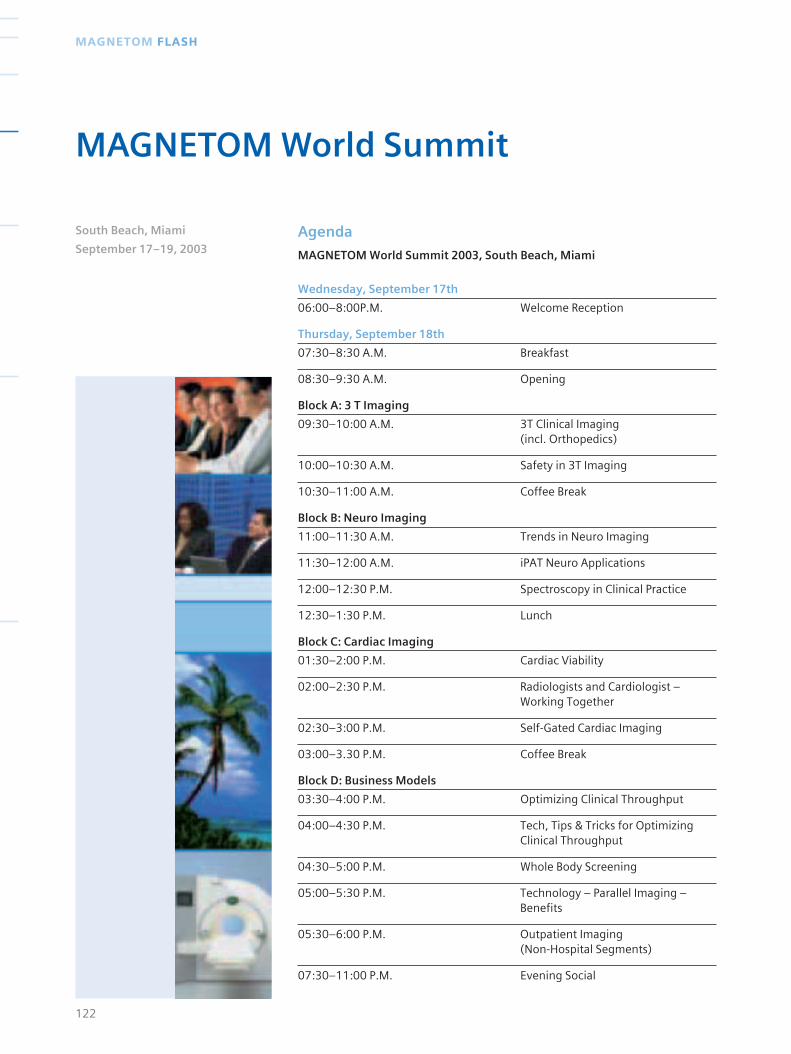
Agenda
MAGNETOM World Summit 2003, South Beach, Miami
Wednesday, September 17th
06:00–8:00P.M. Welcome Reception
Thursday, September 18th
07:30–8:30 A.M. Breakfast
08:30–9:30 A.M. Opening
Block A: 3 T Imaging
09:30–10:00 A.M. 3T Clinical Imaging (incl. Orthopedics)
10:00–10:30 A.M. Safety in 3T Imaging
10:30–11:00 A.M. Coffee Break
Block B: Neuro Imaging
11:00–11:30 A.M. Trends in Neuro Imaging
11:30–12:00 A.M. iPAT Neuro Applications
12:00–12:30 P.M. Spectroscopy in Clinical Practice
12:30–1:30 P.M. Lunch
Block C: Cardiac Imaging
01:30–2:00 P.M. Cardiac Viability
02:00–2:30 P.M. Radiologists and Cardiologist –Working Together
02:30–3:00 P.M. Self-Gated Cardiac Imaging
03:00–3.30 P.M. Coffee Break
Block D: Business Models
03:30–4:00 P.M. Optimizing Clinical Throughput
04:00–4:30 P.M. Tech, Tips & Tricks for OptimizingClinical Throughput
04:30–5:00 P.M. Whole Body Screening
05:00–5:30 P.M. Technology – Parallel Imaging –Benefits
05:30–6:00 P.M. Outpatient Imaging (Non-Hospital Segments)
07:30–11:00 P.M. Evening Social
122
MAGNETOM FLASH
MAGNETOM World Summit
South Beach, Miami
September 17–19, 2003

Friday, September 19th
07:30–8:30A.M. Breakfast
Block E: Body Imaging
08:30–9:00 A.M. Pediatric Imaging
09:00–9:30 A.M. Tech,Tips & Tricks (Pediatric Imaging)
09:30–9:45 A.M. State-of-the-art in Breast Imaging
09:45–10:00 A.M. Advances in Breast Imaging with iPAT
10:00–10:30 A.M. Coffee Break
10:30–11:00 A.M. Angiography in Clinical Practice
11:00–11.30 A.M. Musculoskeletal MR
11:30–12:00 A.M. Virtual Colonoscopy
12:00–1:00 P.M. Lunch
01.00–1.30 P.M. iPAT Imaging in Clinical Practice
01.30–2.00 P.M. Perfusion of Kidneys and Lung with MRI
Registration Form
Please complete this form below. If several people from your institution will beparticipating, please complete this form for each attendee. Forms must bereceived before July 20, 2003. You may either fax it to 610-448-1534 or mail itto Raya Dubner, Siemens Medical Solutions, USA, Inc., 51 Valley Stream Park-way, Malvern, PA 19355, USA.
(Please Print Clearly)
Name:
Title:
Institution:
Mailing Address (Include Country):
Telephone (Include Country Code):
E–mail address:
Will you be bringing a guest
❏ YES ❏ NO
Arrival Date: Departure Date:
❏ Single Occupancy ❏ Double Occupancy
Name of roommate, if also Ambassador attendee:
Please indicate specific issues that you would like addressed by Siemens during this session:
123www.SiemensMedical.com/MAGNETOM-World
EVENTS
Terms & Conditions
Upon submission of the registration formattached, or completion of registrationthrough SiemensMedical.com/MAGNETOM-World, you will automatically be registered for the MAGNETOM World Summit 2003 Meeting on September 17–19, 2003, in SouthBeach, Miami.
You do not have to call the hotel to reserve a room, it will automatically be reserved foryou.
Please register no later then August 1, 2003. If you need to cancel, please do so by August31, 2003.
✂
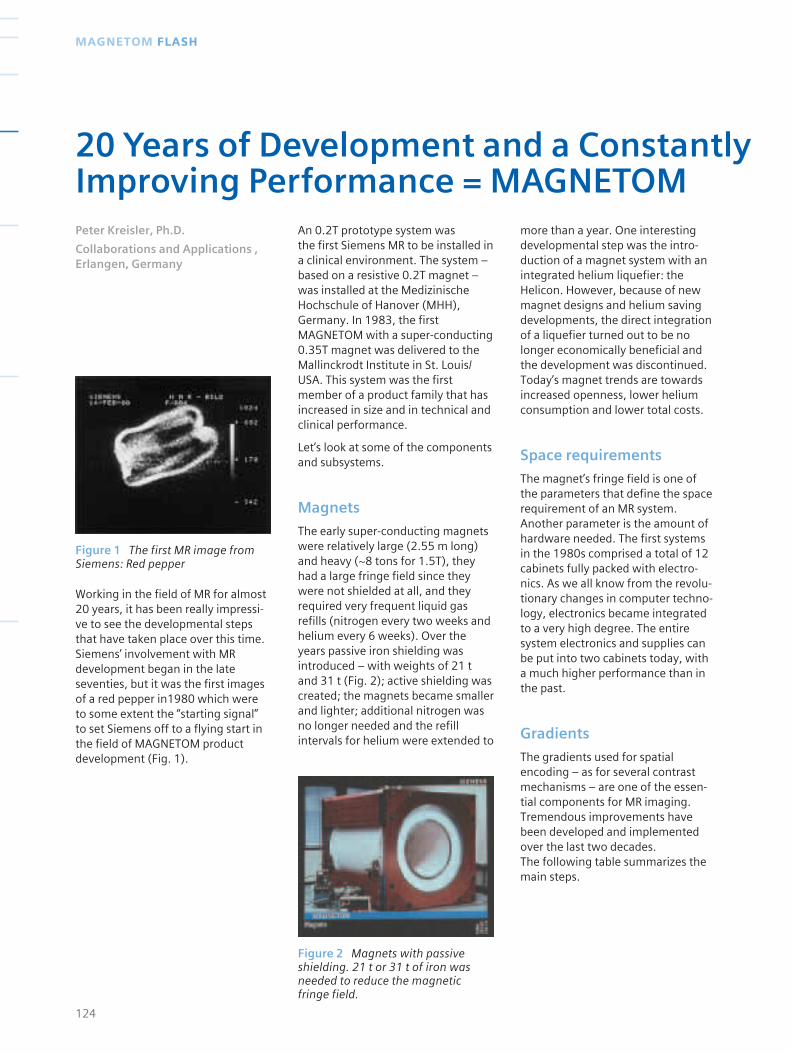
Figure 2 Magnets with passiveshielding. 21 t or 31 t of iron wasneeded to reduce the magneticfringe field.
Figure 1 The first MR image fromSiemens: Red pepper
Working in the field of MR for almost20 years, it has been really impressi-ve to see the developmental stepsthat have taken place over this time.Siemens’ involvement with MRdevelopment began in the lateseventies, but it was the first imagesof a red pepper in1980 which wereto some extent the “starting signal” to set Siemens off to a flying start in the field of MAGNETOM productdevelopment (Fig. 1).
An 0.2T prototype system was the first Siemens MR to be installed in a clinical environment. The system –based on a resistive 0.2T magnet –was installed at the MedizinischeHochschule of Hanover (MHH),Germany. In 1983, the firstMAGNETOM with a super-conducting0.35T magnet was delivered to theMallinckrodt Institute in St. Louis/USA. This system was the firstmember of a product family that hasincreased in size and in technical andclinical performance.
Let’s look at some of the componentsand subsystems.
Magnets
The early super-conducting magnetswere relatively large (2.55 m long)and heavy (~8 tons for 1.5T), theyhad a large fringe field since theywere not shielded at all, and theyrequired very frequent liquid gasrefills (nitrogen every two weeks andhelium every 6 weeks). Over theyears passive iron shielding wasintroduced – with weights of 21 tand 31 t (Fig. 2); active shielding wascreated; the magnets became smallerand lighter; additional nitrogen wasno longer needed and the refillintervals for helium were extended to
more than a year. One interestingdevelopmental step was the intro-duction of a magnet system with anintegrated helium liquefier: theHelicon. However, because of newmagnet designs and helium savingdevelopments, the direct integrationof a liquefier turned out to be nolonger economically beneficial andthe development was discontinued.Today’s magnet trends are towardsincreased openness, lower heliumconsumption and lower total costs.
Space requirements
The magnet’s fringe field is one ofthe parameters that define the spacerequirement of an MR system.Another parameter is the amount ofhardware needed. The first systemsin the 1980s comprised a total of 12cabinets fully packed with electro-nics. As we all know from the revolu-tionary changes in computer techno-logy, electronics became integratedto a very high degree. The entiresystem electronics and supplies canbe put into two cabinets today, witha much higher performance than inthe past.
Gradients
The gradients used for spatialencoding – as for several contrastmechanisms – are one of the essen-tial components for MR imaging.Tremendous improvements havebeen developed and implementedover the last two decades. The following table summarizes themain steps.
124
MAGNETOM FLASH
20 Years of Development and a ConstantlyImproving Performance = MAGNETOMPeter Kreisler, Ph.D.
Collaborations and Applications ,Erlangen, Germany
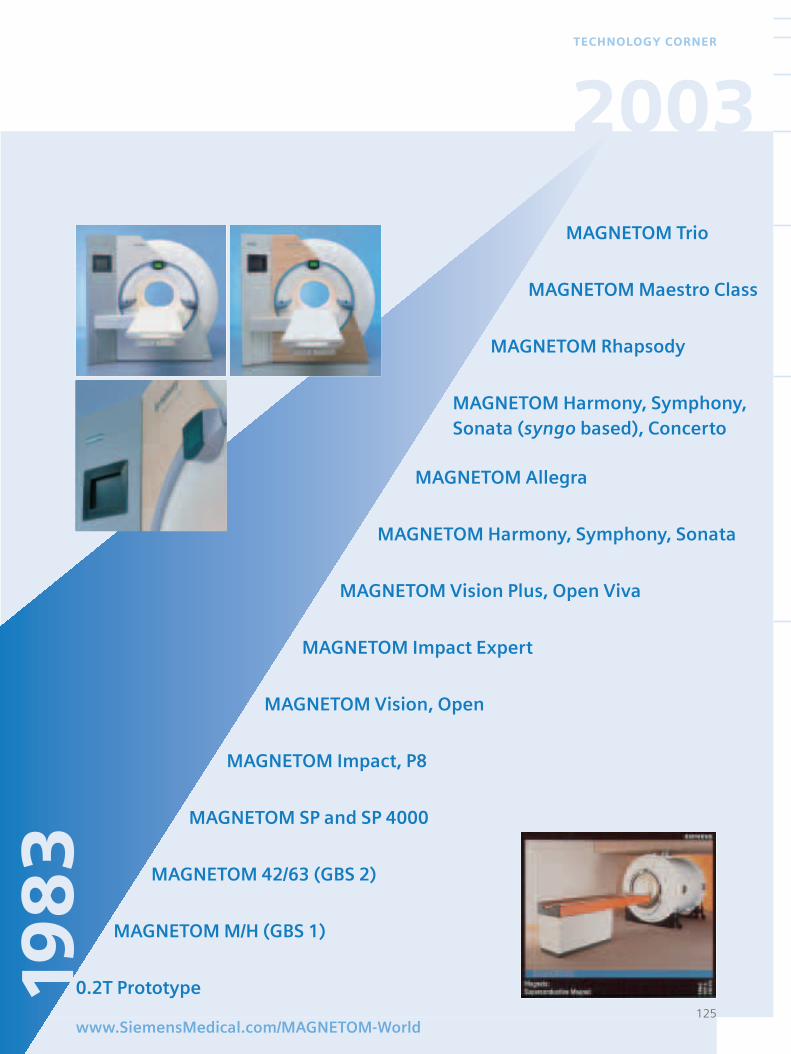
MAGNETOM Trio
MAGNETOM Maestro Class
MAGNETOM Rhapsody
MAGNETOM Harmony, Symphony,Sonata (syngo based), Concerto
MAGNETOM Allegra
MAGNETOM Harmony, Symphony, Sonata
MAGNETOM Vision Plus, Open Viva
MAGNETOM Impact Expert
MAGNETOM Vision, Open
MAGNETOM Impact, P8
MAGNETOM SP and SP 4000
MAGNETOM 42/63 (GBS 2)
MAGNETOM M/H (GBS 1)
0.2T Prototype125
www.SiemensMedical.com/MAGNETOM-World
TECHNOLOGY CORNER
198
32003
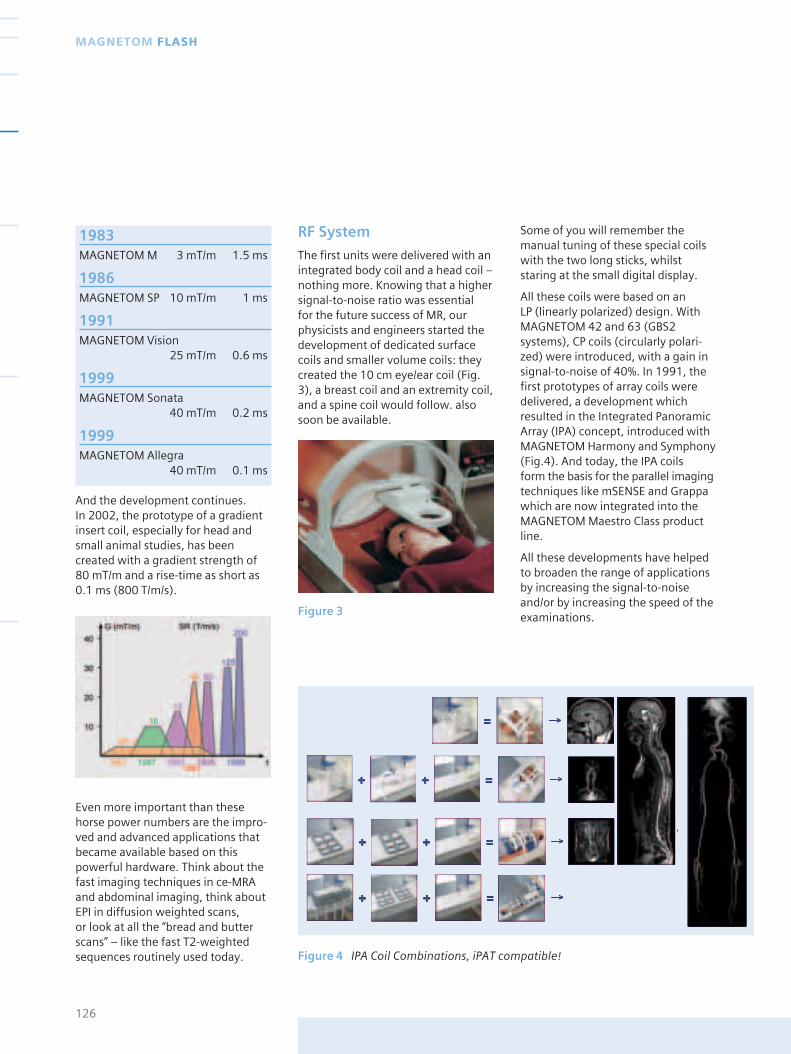
Figure 4 IPA Coil Combinations, iPAT compatible!
1983 MAGNETOM M 3 mT/m 1.5 ms
1986 MAGNETOM SP 10 mT/m 1 ms
1991 MAGNETOM Vision
25 mT/m 0.6 ms
1999 MAGNETOM Sonata
40 mT/m 0.2 ms
1999 MAGNETOM Allegra
40 mT/m 0.1 ms
And the development continues. In 2002, the prototype of a gradientinsert coil, especially for head andsmall animal studies, has beencreated with a gradient strength of80 mT/m and a rise-time as short as0.1 ms (800 T/m/s).
Even more important than thesehorse power numbers are the impro-ved and advanced applications thatbecame available based on thispowerful hardware. Think about thefast imaging techniques in ce-MRAand abdominal imaging, think aboutEPI in diffusion weighted scans, or look at all the “bread and butterscans” – like the fast T2-weightedsequences routinely used today.
RF System
The first units were delivered with anintegrated body coil and a head coil –nothing more. Knowing that a highersignal-to-noise ratio was essential for the future success of MR, ourphysicists and engineers started thedevelopment of dedicated surfacecoils and smaller volume coils: theycreated the 10 cm eye/ear coil (Fig.3), a breast coil and an extremity coil,and a spine coil would follow. alsosoon be available.
Some of you will remember themanual tuning of these special coilswith the two long sticks, whilststaring at the small digital display.
All these coils were based on an LP (linearly polarized) design. WithMAGNETOM 42 and 63 (GBS2systems), CP coils (circularly polari-zed) were introduced, with a gain insignal-to-noise of 40%. In 1991, thefirst prototypes of array coils weredelivered, a development whichresulted in the Integrated PanoramicArray (IPA) concept, introduced withMAGNETOM Harmony and Symphony(Fig.4). And today, the IPA coils form the basis for the parallel imagingtechniques like mSENSE and Grappawhich are now integrated into theMAGNETOM Maestro Class productline.
All these developments have helpedto broaden the range of applicationsby increasing the signal-to-noiseand/or by increasing the speed of theexaminations.
126
MAGNETOM FLASH
Figure 3
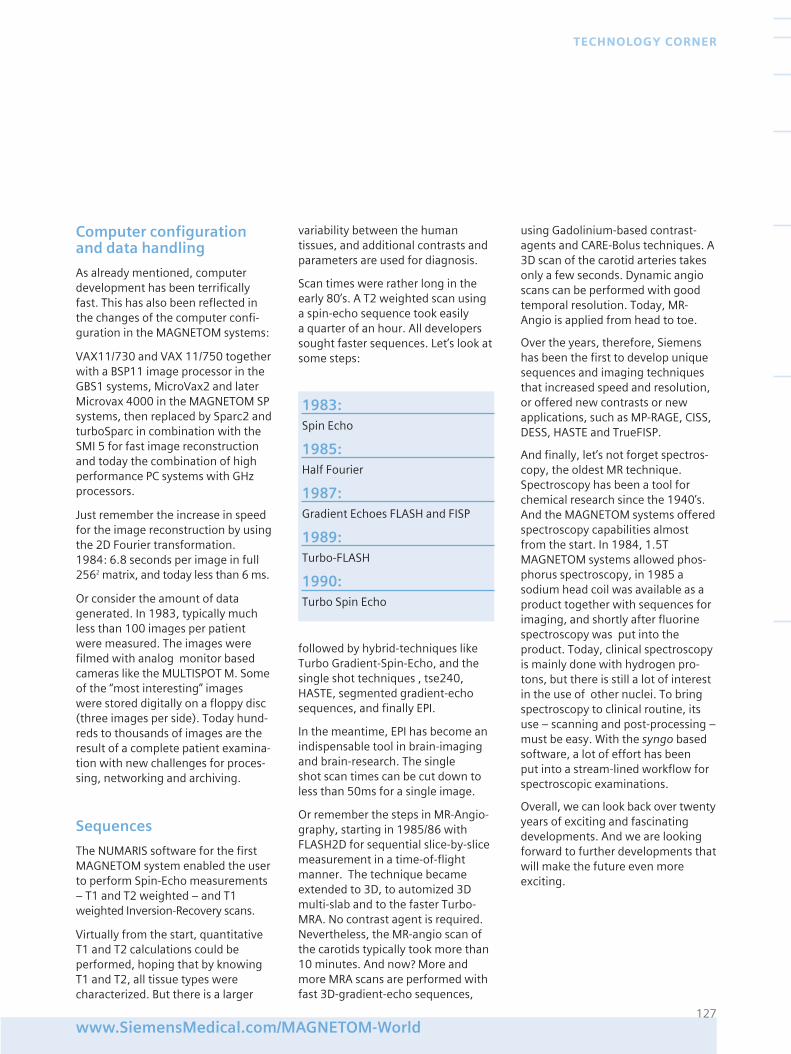
Computer configurationand data handling
As already mentioned, computerdevelopment has been terrificallyfast. This has also been reflected inthe changes of the computer confi-guration in the MAGNETOM systems:
VAX11/730 and VAX 11/750 togetherwith a BSP11 image processor in theGBS1 systems, MicroVax2 and laterMicrovax 4000 in the MAGNETOM SPsystems, then replaced by Sparc2 andturboSparc in combination with theSMI 5 for fast image reconstructionand today the combination of highperformance PC systems with GHzprocessors.
Just remember the increase in speedfor the image reconstruction by usingthe 2D Fourier transformation.1984: 6.8 seconds per image in full2562 matrix, and today less than 6 ms.
Or consider the amount of datagenerated. In 1983, typically muchless than 100 images per patientwere measured. The images werefilmed with analog monitor basedcameras like the MULTISPOT M. Someof the “most interesting” imageswere stored digitally on a floppy disc(three images per side). Today hund-reds to thousands of images are theresult of a complete patient examina-tion with new challenges for proces-sing, networking and archiving.
Sequences
The NUMARIS software for the firstMAGNETOM system enabled the userto perform Spin-Echo measurements– T1 and T2 weighted – and T1weighted Inversion-Recovery scans.
Virtually from the start, quantitativeT1 and T2 calculations could beperformed, hoping that by knowingT1 and T2, all tissue types werecharacterized. But there is a larger
variability between the humantissues, and additional contrasts andparameters are used for diagnosis.
Scan times were rather long in theearly 80’s. A T2 weighted scan usinga spin-echo sequence took easily a quarter of an hour. All developerssought faster sequences. Let’s look atsome steps:
1983: Spin Echo
1985: Half Fourier
1987: Gradient Echoes FLASH and FISP
1989: Turbo-FLASH
1990: Turbo Spin Echo
followed by hybrid-techniques likeTurbo Gradient-Spin-Echo, and thesingle shot techniques , tse240,HASTE, segmented gradient-echosequences, and finally EPI.
In the meantime, EPI has become anindispensable tool in brain-imagingand brain-research. The single shot scan times can be cut down toless than 50ms for a single image.
Or remember the steps in MR-Angio-graphy, starting in 1985/86 withFLASH2D for sequential slice-by-slicemeasurement in a time-of-flightmanner. The technique becameextended to 3D, to automized 3Dmulti-slab and to the faster Turbo-MRA. No contrast agent is required.Nevertheless, the MR-angio scan ofthe carotids typically took more than10 minutes. And now? More andmore MRA scans are performed withfast 3D-gradient-echo sequences,
using Gadolinium-based contrast-agents and CARE-Bolus techniques. A3D scan of the carotid arteries takesonly a few seconds. Dynamic angioscans can be performed with goodtemporal resolution. Today, MR-Angio is applied from head to toe.
Over the years, therefore, Siemenshas been the first to develop uniquesequences and imaging techniquesthat increased speed and resolution,or offered new contrasts or newapplications, such as MP-RAGE, CISS,DESS, HASTE and TrueFISP.
And finally, let’s not forget spectros-copy, the oldest MR technique.Spectroscopy has been a tool forchemical research since the 1940’s.And the MAGNETOM systems offeredspectroscopy capabilities almostfrom the start. In 1984, 1.5TMAGNETOM systems allowed phos-phorus spectroscopy, in 1985 asodium head coil was available as aproduct together with sequences forimaging, and shortly after fluorinespectroscopy was put into theproduct. Today, clinical spectroscopyis mainly done with hydrogen pro-tons, but there is still a lot of interestin the use of other nuclei. To bringspectroscopy to clinical routine, itsuse – scanning and post-processing –must be easy. With the syngo basedsoftware, a lot of effort has been put into a stream-lined workflow forspectroscopic examinations.
Overall, we can look back over twentyyears of exciting and fascinatingdevelopments. And we are lookingforward to further developments thatwill make the future even moreexciting.
127www.SiemensMedical.com/MAGNETOM-World
TECHNOLOGY CORNER

128
MAGNETOM FLASH
198
3
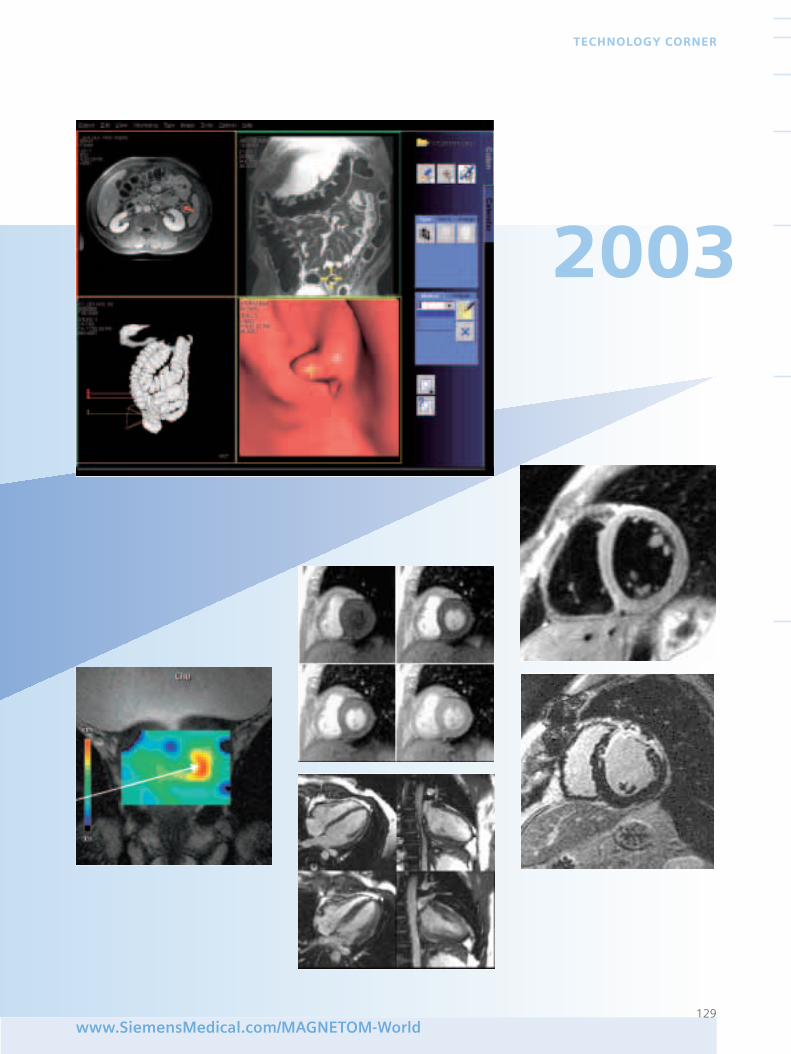
129www.SiemensMedical.com/MAGNETOM-World
TECHNOLOGY CORNER
2003

130
MAGNETOM FLASH

Fax-Answer: +49-9131-84-2186
Yes, I would like to order the MAGNETOM Flash magazine for one year free of charge.
Name:
Title:
Institution:
Department:
Street:
Postal Code/City
Country:
E-mail:
MR-Systems in Institution
Yes, I consent to the above information being used for future contact regarding product updates and other important news from Siemens Medical Solutions.
Date Signature
Order your personal MAGNETOM FLASHmagazine for one yearYour subscription is free. Please complete the form belowand fax it today!
Siemens AG Medical SolutionsMagnetic Resonance, MRM BlueTeamHenkestrasse 127D-91052 ErlangenGermany
smedical
Issue no. 1.2003 MAGNETOMF L A S H
MAGNETOM World MeetingSheraton Perdana HotelLangkawi, Malaysia17.-18. Jan 2003
free of charge +++ free of charge +++ free of c
MAGNETOM FLASH
Siemens reserves the right to modify the design and
specifications contained herein without prior notice.
Please contact your local Siemens Sales representative
for the most current information.
Original images always lose a certain amount of detail
when reproduced.
This brochure refers to both standard and optional
features. Availability and packaging of options varies by
country and is subject to change without notice.
Some of the features described are not available for
commercial distribution in the US.
The information in this document contains general
descriptions of the technical options available, which
do not always have to be present in individual cases.
The required features should therefore be specified in
each individual case at the time of closing the contract.
Please contact in the USA:Siemens Medical Solutions USA, Inc.51 Valley Stream Parkway Malvern, PA 19355Tel.: +1 888-826-9702Tel.: 610-448-4500Fax: 610-448-2254
in Asia:Siemens Medical Solutions Asia Pacific Headquarters Blk 28 Ayer Rajah Crescent #06-06 Singapore 139959 Tel.: +65 6341 0990 Fax: +65 6778 6722
in Japan:Siemens-AsahiMedical Technologies Ltd.Takanawa Park Tower 14 F20-14, Higashi-Gotanda 3-chomeShinagawa-kuTokyo 141-8641(03) 54 23 40 01
Or contact your local SiemensSales präsentation
Order No. A91100-M2220-F000-4-7600
Printed in Germany
CCA 60000 WS 050320.
Siemens AG, Medical SolutionsMagnetic ResonanceHenkestr. 127, D-91052 Erlangen, GermanyTelephone: ++49 9131 84-0www.SiemensMedical.com
MAGNETOM Flash – Reader ServiceLetters to the Editor – We welcome your comments
about the content of MAGNETOM Flash. Please send
comments to the Editor. Include your name, address,
and phone number or e-mail.
World Wide Web – Visit us at
www.siemensmedical.com and
www.siemensmedical.com/MAGNETOM-World
This sites provides information about all Siemens
medical products.
Publish articles? – You are invited to publish articles in
the newsletter to share your experience with
MAGNETOM MR users all over the world. To submit an
article please contact the Editor.
Subscription – You have seen the newsletter and want
to get it on a regular basis? In the US, please contact the
Applications Helpline (phone 800-888-SIEM) and give
us your name and business address (no home
addresses, please). Outside the US, MAGNETOM Flash is
distributed through the local Siemens offices. Please
contact the Editor and we will make sure that you are
included on your local support office’s distribution list.
Editor
Ali Nejat Bengi, M.D, [email protected]
Published by
Siemens AG Medical Solutions
P.O.Box 3260, D-91052 Erlangen
Correspondence and
International Distribution
Ali Nejat Bengi, M.D., Editor in Chief
MAGNETOM FLASH
Siemens AG Medical Solutions,
MR Marketing
Allee im Röthelheimpark 3
D-91052 Erlangen
Phone: 49 - 91 31 - 84 - 75 99
Fax: 49 - 91 31 - 84 - 21 86
US Distribution
MR APPLICATIONS HELPLINE
Siemens Uptime Service Center
110 MacAlyson Court
Cary, NC 27511
Phone: 800 - 888 - SIEM
Fax: 919 - 319 - 28 64
All articles represent the techniques and opinions
of the authors and may not represent specific
recommendations or endorsements from Siemens
Medical Solutions. Contact the authors directly for
further information about their techniques and
opinion.


![[1] Magnetom Flash_Jan 2001](https://img.pdfslide.us/doc/110x75/577cdc331a28ab9e78aa1b8e/1-magnetom-flashjan-2001.jpg)


![[32] Magnetom Flash_32_apr 2006](https://img.pdfslide.us/doc/110x75/55cf9d8b550346d033ae170f/32-magnetom-flash32apr-2006.jpg)