Embed Size (px)
Citation preview
Velocity of Blood Flow in NormalHuman Venae CavaeBy Lewis Wexler, M.D., Derek H. Bergel, M.B., Ph.D., Ivor T. Gabe, M.D.,
Geoffrey S. Makin, Ch.M., and Christopher J. Mills, B.Sc.
ABSTRACTThe velocity of flow and pressure in the venae cavae of four normal
conscious subjects was studied. Velocity was measured with a catheter-tipelectromagnetic transducer. The effects of respiration, Valsalva and Miillermaneuvers, coughing, and exercise were studied. Caval blood velocities duringbreath holding showed marked cardiac pulsations, being maximal at the timeof ventricular systole and minimal or reversed at atrial systole. Peak velocitiesduring ventricular systole ranged from 30 to 45 cm/sec in the inferior, andfrom 10 to 35 cm/sec in the superior, vena cava. A second diastolic forwardflow velocity ranged from 36 to 76% of the systolic peak. During inspiration,velocity transiently increased. Reduction of flow velocity in abdominal breath-ing and the Miiller maneuver is consistent with the formation of a local areaof inferior vena caval collapse at the diaphragm. During the Valsalva maneu-ver, abrupt reduction in caval flow was seen that persisted throughout thestrain. There was immediate overshoot when the strain was released. Coughingproduced a reduction of flow velocity with backflow in the superior vena cava.In leg exercise, inferior caval flow velocity rose immediately, and it remainedhigh during recovery. Marked respiratory velocity variations with inspiratoryincreases occurred during and after exercise.
ADDITIONAL KEY WORDScatheter-tip electromagnetic velocity transducerexercise deep breathing collapsible tubes
Valsalva maneuverMiiller maneuver
coughing
• To understand the mechanisms involvedin the return of blood to the heart accuratemeasurements of vena caval blood flow arenecessary. While data have been obtainedfrom animal experiments involving, at least,surgical exposure of the vessels in order toplace flowmeters, recordings have not pre-viously been obtained from conscious, co-operative human subjects.
Brecher (1) has shown that caval bloodflow in the dog has two forward flow phases,and Tafur and Guntheroth (2) confirmedthis finding with an ultrasonic flow trans-
From the M.R.C. Cardiovascular Research Unit,Royal Postgraduate Medical School, Ducane Road,London, W. 12, England.
Dr. Wexler was an Advanced Fellow in AcademicRadiology of the James Picker Foundation. His pres-ent address is Department of Radiology, StanfordUniversity School of Medicine, Stanford, California94305. Mr. Makin is a Senior Surgical Research Fel-low of the Tobacco Research Council.
Accepted for publication July 1, 1968.
ducer. They believed that the concept thatthe flow of venous blood into the heart isaffected by events within the heart itselfexplains the pulsatile nature of caval bloodflow. Evidence that left atrial filling is alsoinfluenced by intracardiac activity has alsobeen provided (3, 4).
Respiratory effects on venous return areknown to exist, although their nature andmechanisms remain uncertain (1, 4-7). It isgenerally assumed that inspiration increases,and expiration decreases, venous return. Thechanges in caval blood flow during and fol-lowing exercise and due to various respiratoryefforts such as the Valsalva and Miiller ma-neuvers, deep thoracic or abdominal breath-ing, and coughing are less well known andpoorly understood.
The present report summarizes the resultsof our investigations of vena caval blood flowin healthy unsedated human volunteers.
Circulation Research, Vol. XXIII, September 1968 349
by guest on May 9, 2018
http://circres.ahajournals.org/D
ownloaded from
350 WEXLER, BERGEL, GABE, MAKIN, MILLS
MethodsAPPARATUS
The instrument used for the measurement ofblood velocity was a catheter-tip electromagnetictransducer that has been described else-where (8). It measures blood velocity past its tipwith equal sensitivity in either direction. Thefrequency response (relative amplitude 95% at15 Hz with 4-msec delay) is adequate for thepresent purpose, and the transducer may be cali-brated in vitro. To convert the recordings intovolume flow rates the cross-sectional area of thevessel must be known and some assumption madeabout the form of the velocity profile. Pressurewas measured through a no. 1 nylon catheterincorporated into the velocity transducer withits orifice at the extreme end of the transducer.When used with the Statham P23Gb pressuretransducer, a resonant frequency greater than 45Hz and relative damping of about 0.2 could beachieved. Before each experiment, the manom-eter frequency response of the saline-filled trans-ducer-catheter system was obtained by the pres-sure-transient method (9), and the apparatuswas flushed free of entrapped air until the aboveresonant frequency was attained.
In two subjects, right atrial pressure wasmeasured with a PE60 radiopaque catheter, 105cm long (Portex), introduced into an antecubitalvein by the Seldinger method and positionedunder radiological control. In the other two sub-jects, intrathoracic pressure was estimated with aballoon-tipped esophageal catheter.
The two pressures, velocity of venous flow,and the electrocardiogram (precordial leads)were recorded with a four-channel direct-writingoscillograph (Devices M4). At intervals, highspeed records were also taken on an ultravioletgalvanometer recorder (S.E. Laboratories, type2005). Before each experiment the phonocardio-gram and ECG were simultaneously recorded bya phonocardiographic amplifier and photographicrecorder (Cambridge Instrument Co.).
Pressure calibrations from a 20-cm column ofwater were obtained frequently during each ses-sion. Zero pressure level was adjusted to lie 5cm below the level of the sternal angle. To cali-brate the velocity transducer a standard electricalsignal was applied to its input. This had previous-ly been related to flow velocities measured invitro, and the sensitivity determined in vitro hasbeen shown to match that obtained in vivo (8).Zero flow velocity signal was obtained with thevelocity transducer in saline before and afterthe experiment, and this was checked against thesignal seen when it lay within an arm vein closeto the point of insertion.
PROCEDURE
Recordings were obtained on four healthy, un-sedated male volunteers aged 29 to 39 (Table 1).Three of the volunteers (L.W., D.B., I.G.) areco-authors of this report and the fourth (J.M.) isa respiratory physiologist. Experiments beganwithin an hour of a light meal and lasted up to3 hours, during which the subject lay quietly ona radiographic table. A small incision was madeover an antecubital vein and the tip of the veloci-ty transducer was introduced into it. At this time,a series of routine safety checks was carried outto ensure the absence of current leakage be-tween the transducer coil windings and the otherleads. At the same time, the zero flow velocitylevel was determined. The transducer was thenpassed under fluoroscopic control through theright atrium and into the inferior vena cava(IVC) and positioned so that its tip lay at thelevel of the llth-12th thoracic intervertebraldisc. This corresponds to a position in the intra-hepatic portion of the IVC between the entrypoints of the hepatic and renal veins.
A standard sequence of measurements wasthen carried out with intervals of 1 to 5 minutesbetween each: control records during quietbreathing and apnea at midinspiratoiy level, deep
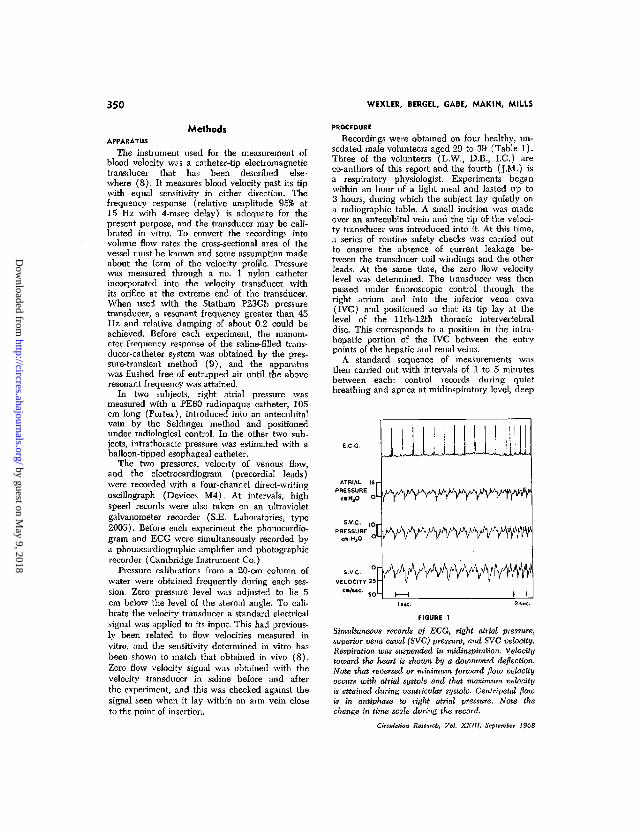
FIGURE 1
Simultaneous records of ECG, right atrial pressure,superior vena caval (SVC) pressure, and SVC velocity.Respiration was suspended in midinspiration. Velocitytoward the heart is shoxon by a downward deflection.Note that reversed or minimum forward flow velocityoccurs with atrial systole and that maximum velocityis attained during ventricular systole. Centripetal flowis in antiphase to right atrial pressure. Note thechange in time scale during the record.
Circulation Research, Vol. XXIII, September 1968
by guest on May 9, 2018
http://circres.ahajournals.org/D
ownloaded from
CAVAL VELOCITY IN MAN 351
cm.HjO
"[O L
cm.H2O
IOi-
oL
cm/sec.
5Or
25ro<-
E.C
| 1G.
ATRIAL PRESSURE
I.V.C. PRESSURE ',
IV.C. VELOCITY . :
miMiuuujmu L AA / IW n V W W Wv TVV-V V A
|_5«c.H : l̂̂ c, :
rV|-
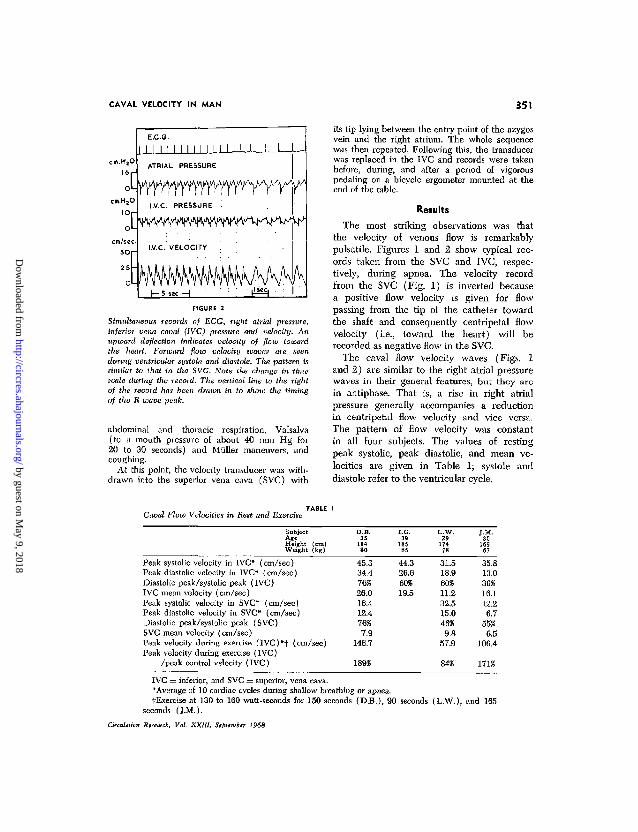
FIGURE 2
Simultaneous records of ECG, right atrial pressure,inferior vena caval (IVC) pressure and velocity. Anupward deflection indicates velocity of flow towardthe heart. Forward flow velocity ivaves are seenduring ventricular systole and diastole. The pattern issimilar to that in the SVC. Note the change in timescale during the record. The vertical line to the rightof the record has been drawn in to show the timingof the R-wave peak.
abdominal and thoracic respiration, Valsalva(to a mouth pressure of about 40 mm Hg for20 to 30 seconds) and Miiller maneuvers, andcoughing.
At this point, the velocity transducer was with-drawn into the superior vena cava (SVC) with
its tip lying between the entry point of the azygosvein and the right atrium. The whole sequencewas then repeated. Following this, the transducerwas replaced in the IVC and records were takenbefore, during, and after a period of vigorouspedaling on a bicycle ergometer mounted at theend of the table.
Results
The most striking observations was thatthe velocity of venous flow is remarkablypulsatile. Figures 1 and 2 show typical rec-ords taken from the SVC and IVC, respec-tively, during apnea. The velocity recordfrom the SVC (Fig. 1) is inverted becausea positive flow velocity is given for flowpassing from the tip of the catheter towardthe shaft and consequently centripetal flowvelocity (i.e., toward the heart) will berecorded as negative flow in the SVC.
The caval flow velocity waves (Figs. 1and 2) are similar to the right atrial pressurewaves in their general features, but they arein antiphase. That is, a rise in right atrialpressure generally accompanies a reductionin centripetal flow velocity and vice versa.The pattern of flow velocity was constantin all four subjects. The values of restingpeak systolic, peak diastolic, and mean ve-locities are given in Table 1; systole anddiastole refer to the ventricular cycle.
Caval Flow Velocities in Rest and Exercise
SubjectAgeHeight (cm)Weight (kg)
D.B.35
18480
I.G.39
18585
L.W.29
17478
J.M.30
16967
Peak systolic velocity in IVC* (cm/sec)Peak diastolic velocity in IVC* (cm/sec)Diastolic peak/systolic peak (IVC)IVC mean velocity (cm/sec)Peak systolic velocity in SVC* (cm/sec)Peak diastolic velocity in SVC* (cm/sec)Diastolic peak/systolic peak (SVC)SVC mean velocity (cm/sec)
Peak velocity during exercise ( IVC)*t (cm/sec)Peak velocity during exercise (IVC)
/peak control velocity (IVC)
45.334.476%26.016.412.476%7.9
146.7
44.326.660%19.5
31.518.960%11.232.515.046%
9.857.9
35.813.036%16.112.26.7
55%6.5
106.4
171%
IVC = inferior, and SVC = superior, vena cava.*Average of 10 cardiac cycles during shallow breathing or apnea.fExercise at 130 to 160 watt-seconds for 150 seconds (D.B.) , 90 seconds (L.W.) , and 165
seconds (J .M.).
Circulation Research, Vol. XXIII, September 1968
by guest on May 9, 2018
http://circres.ahajournals.org/D
ownloaded from
352 WEXLER, BERGEL, GABE, MAKIN, MILLS
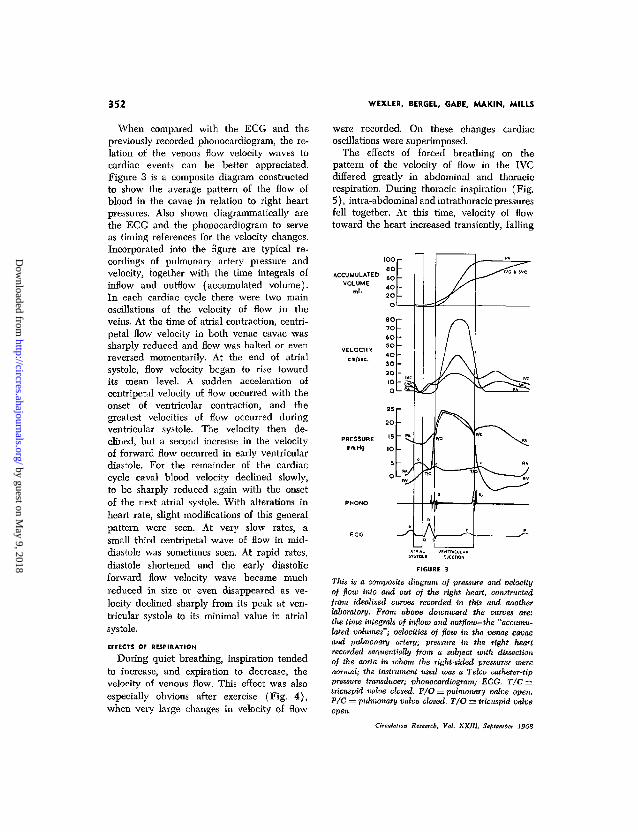
When compared with the ECG and thepreviously recorded phonocardiogram, the re-lation of the venous flow velocity waves tocardiac events can be better appreciated.Figure 3 is a composite diagram constructedto show the average pattern of the flow ofblood in the cavae in relation to right heartpressures. Also shown diagrammatically arethe ECG and the phonocardiogram to serveas timing references for the velocity changes.Incorporated into the figure are typical re-cordings of pulmonary artery pressure andvelocity, together with the time integrals ofinflow and outflow (accumulated volume).In each cardiac cycle there were two mainoscillations of the velocity of flow in theveins. At the time of atrial contraction, centri-petal flow velocity in both venae cavae wassharply reduced and flow was halted or evenreversed momentarily. At the end of atrialsystole, flow velocity began to rise towardits mean level. A sudden acceleration ofcentripetal velocity of flow occurred with theonset of ventricular contraction, and thegreatest velocities of flow occurred duringventricular systole. The velocity then de-clined, but a second increase in the velocityof forward flow occurred in early ventriculardiastole. For the remainder of the cardiaccycle caval blood velocity declined slowly,to be sharply reduced again with the onsetof the next atrial systole. With alterations inheart rate, slight modifications of this generalpattern were seen. At very slow rates, asmall third centripetal wave of flow in mid-diastole was sometimes seen. At rapid rates,diastole shortened and the early diastolicforward flow velocity wave became muchreduced in size or even disappeared as ve-locity declined sharply from its peak at ven-tricular systole to its minimal value in atrialsystole.
EFFECTS OF RESPIRATION
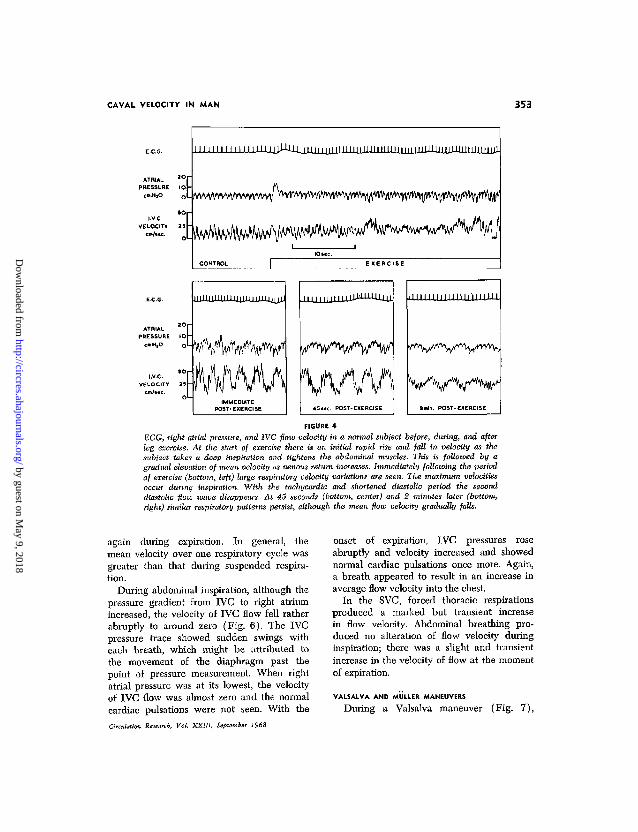
During quiet breathing, inspiration tendedto increase, and expiration to decrease, thevelocity of venous flow. This effect was alsoespecially obvious after exercise (Fig. 4),when very large changes in velocity of flow
were recorded. On these changes cardiacoscillations were superimposed.
The effects of forced breathing on thepattern of the velocity of flow in the IVCdiffered greatly in abdominal and thoracicrespiration. During thoracic inspiration (Fig.5), intra-abdominal and intrathoracic pressuresfell together. At this time, velocity of flowtoward the heart increased transiently, falling
ACCUMULATEDVOLUME
VELOCITY
PRESSUREmm.Hg
FIGURE 3
This is a composite diagram of pressure and velocityof flow into and out of the right heart, constructedfrom idealized curves recorded in this and anotherlaboratory. From above downward the curves are:the time integrals of inflow and outflow—the "accumu-lated volumes"; velocities of flow in the venae cavaeand pulmonary artery; -pressure in the right heartrecorded sequentially from a subject with dissectionof the aorta in whom the right-sided pressures werenormal; the instrument used was a Telco catheter-tippressure transducer; phonocardiogram; ECG. T/C =tricuspid valve closed. P/O = pulmonary valve open.P/C = pulmonary valve closed. T/O = tricuspid valveopen.
Circulation Research, Vol. XXlll, September 1968
by guest on May 9, 2018
http://circres.ahajournals.org/D
ownloaded from
CAVAL VELOCITY IN MAN 353
ATRIALPRESSURE
cm.HjO
I V C .
VELOCITYcm/itc.
l lV\^wmw^^Y^f^^v^
E X E R C I S E
FIGURE 4
ECG, right atrial pressure, and IVC flow velocity in a normal subject before, during, and afterleg exercise. At the start of exercise there is an initial rapid rise and fall in velocity as thesubject takes a deep inspiration and tightens the abdominal muscles. This is followed by agradual elevation of mean velocity as venous return increases. Immediately following the periodof exercise (bottom, left) large respiratory velocity variations are seen. The maximum velocitiesoccur during inspiration. With the tachycardia and shortened diastolic period the seconddiastolic flow wave disappears. At 45 seconds (bottom, center) and 2 minutes later (bottom,right) similar respiratory patterns persist, although the mean flow velocity gradually falls.
again during expiration. In general, themean velocity over one respiratory cycle wasgreater than that during suspended respira-tion.
During abdominal inspiration, although thepressure gradient from IVC to right atriumincreased, the velocity of IVC flow fell ratherabruptly to around zero (Fig. 6). The IVCpressure trace showed sudden swings witheach breath, which might be attributed tothe movement of the diaphragm past thepoint of pressure measurement. When rightatrial pressure was at its lowest, the velocityof IVC flow was almost zero and the normalcardiac pulsations were not seen. With theCirculation Research, Vol. XXIII, September 1968
onset of expiration, IVC pressures roseabruptly and velocity increased and showednormal cardiac pulsations once more. Again,a breath appeared to result in an increase inaverage flow velocity into the chest.
In the SVC, forced thoracic respirationsproduced a marked but transient increasein flow velocity. Abdominal breathing pro-duced no alteration of flow velocity duringinspiration; there was a slight and transientincrease in the velocity of flow at the momentof expiration.
YALSALVA AND MULLER MANEUVERS
During a Valsalva maneuver (Fig. 7),
by guest on May 9, 2018
http://circres.ahajournals.org/D
ownloaded from
354 WEXLER, BERGEL, GABE, MAKIN, MILLS
cm.H2O
em.H2O
IO
o
-10
cm/scc
S
as
ATRIAL PRESSURE
I.V.C- PRESSURE
I.V.C. VELOCITY
FIGURE 5
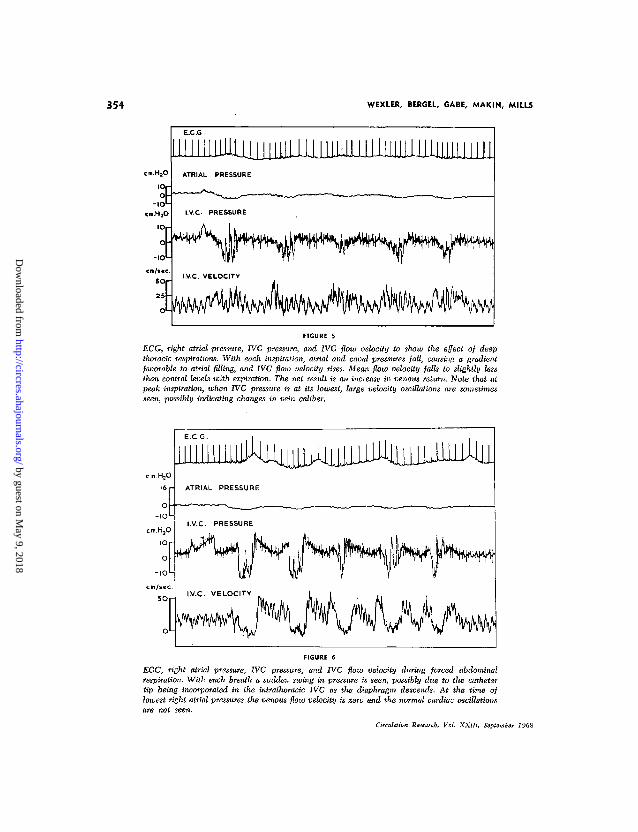
ECG, right atrial pressure, IVC pressure, and IVC flow velocity to show the effect of deepthoracic respirations. With each inspiration, atrial and caval pressures fall, causing a gradientfavorable to atrial filling, and IVC flow velocity rises. Mean flow velocity falls to slightly lessthan control levels with expiration. The net result is an increase in venous return. Note that atpeak inspiration, when IVC pressure is at its lowest, large velocity oscillations are sometimesseen, possibly indicating changes in vein caliber.
cm.H2O
cm.H,O
FIGURE 6
ECG, right atrial pressure, IVC pressure, and IVC flow velocity during forced abdominalrespiration. With each breath a sudden swing in pressure is seen, possibly due to the cathetertip being incorporated in the intrathoracic IVC as the diaphragm descends. At the time oflowest right atrial pressures the venous flow velocity is zero and the normal cardiac oscillationsare not seen.
Circulation Research, Vol. XKllI, September 1968
by guest on May 9, 2018
http://circres.ahajournals.org/D
ownloaded from
CAVAL VELOCITY IN MAN 355
m.HjO
62 -
O -
4O -
2O -
O -
, 0
J
ATRIAL
PRESSURE
v-\^~——•—~—«~*
IV.C.PRESSURE
VELOCITY
liJjJilliJJJJ%i^
1 io-c- 1
jiiiiiuJJJJJii-LUU
\
IAJ 1
FIGURE 7
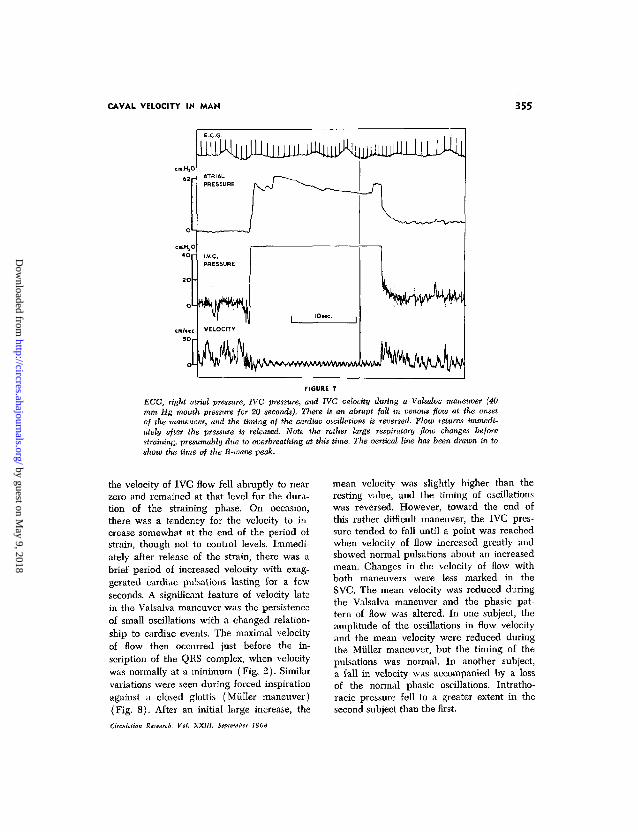
ECG, right atrial pressure, IVC pressure, and IVC velocity during a Valsalva maneuver (40mm Hg mouth pressure -for 20 seconds). There is an abrupt fall in venous flow at the onsetof the maneuver, and the timing of iiie cardiac oscillations is reversed. Flow returns immedi-ately after the pressure is released. Note the rather large respiratory flow changes beforestraining, presumably due to overbreathing at this time. The vertical line has been drawn in toshow the time of the R-wave peak.
the velocity of IVC flow fell abruptly to nearzero and remained at that level for the dura-tion of the straining phase. On occasion,there was a tendency for the velocity to in-crease somewhat at the end of the period ofstrain, though not to control levels. Immedi-ately after release of the strain, there was abrief period of increased velocity with exag-gerated cardiac pulsations lasting for a fewseconds. A significant feature of velocity latein the Valsalva maneuver was the persistenceof small oscillations with a changed relation-ship to cardiac events. The maximal velocityof flow then occurred just before the in-scription of the QRS complex, when velocitywas normally at a minimum (Fig. 2). Similarvariations were seen during forced inspirationagainst a closed glottis (Miiller maneuver)(Fig. 8). After an initial large increase, the
Gradation Research. Vol. XXIII. September 1968
mean velocity was slightly higher than theresting value, and the timing of oscillationswas reversed. However, toward the end ofthis rather difficult maneuver, the IVC pres-sure tended to fall until a point was reachedwhen velocity of flow increased greatly andshowed normal pulsations about an increasedmean. Changes in the velocity of flow withboth maneuvers were less marked in theSVC. The mean velocity was reduced duringthe Valsalva maneuver and the phasic pat-tern of flow was altered. In one subject, theamplitude of the oscillations in flow velocityand the mean velocity were reduced duringthe Miiller maneuver, but the timing of thepulsations was normal. In another subject,a fall in velocity was accompanied by a lossof the normal phasic oscillations. Intratho-racic pressure fell to a greater extent in thesecond subject than the first.
by guest on May 9, 2018
http://circres.ahajournals.org/D
ownloaded from
356 WEXLER, BERGEL, GABE, MAKIN, MILLS
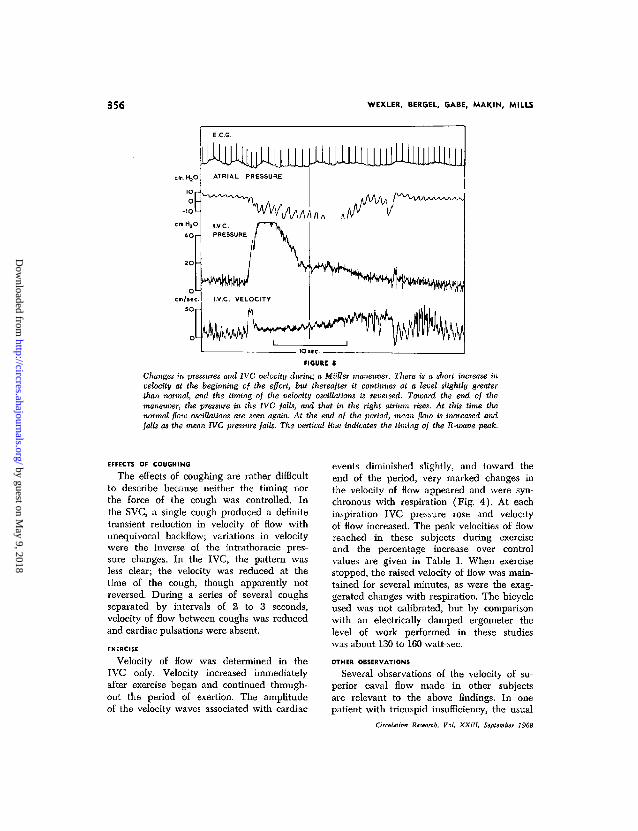
FIGURE 8
Changes in pressures and IVC velocity during a Miiller maneuver. There is a short increase invelocity at the beginning of the effort, but thereafter it continues at a level slightly greaterthan normal, and the timing of the velocity oscillations is reversed. Toward the end of themaneuver, the pressure in the IVC falls, and that in the right atrium rises. At this time thenormal flow oscillations are seen again. At the end of the period, mean flow is increased andfalls as the mean JVC pressure falls. The vertical line indicates the timing of the R-wave peak.
EFFECTS OF COUGHING
The effects of coughing are rather difficultto describe because neither the timing northe force of the cough was controlled. Inthe SVC, a single cough produced a definitetransient reduction in velocity of flow withunequivocal backflow; variations in velocitywere the inverse of the intrathoracic pres-sure changes. In the IVC, the pattern wasless clear; the velocity was reduced at thetime of the cough, though apparently notreversed. During a series of several coughsseparated by intervals of 2 to 3 seconds,velocity of flow between coughs was reducedand cardiac pulsations were absent.
EXERCISE
Velocity of flow was determined in theIVC only. Velocity increased immediatelyafter exercise began and continued through-out the period of exertion. The amplitudeof the velocity waves associated with cardiac
events diminished slightly, and toward theend of the period, very marked changes inthe velocity of flow appeared and were syn-chronous with respiration (Fig. 4). At eachinspiration IVC pressure rose and velocityof flow increased. The peak velocities of flowreached in these subjects during exerciseand the percentage increase over controlvalues are given in Table 1. When exercisestopped, the raised velocity of flow was main-tained for several minutes, as were the exag-gerated changes with respiration. The bicycleused was not calibrated, but by comparisonwith an electrically damped ergometer thelevel of work performed in these studieswas about 130 to 160 watt-sec.
OTHER OBSERVATIONS
Several observations of the velocity of su-perior caval flow made in other subjectsare relevant to the above findings. In onepatient with tricuspid insufficiency, the usual
Orrtihlior, K,,e«rcb, Vol. XXIII, SepUmia 1%8
by guest on May 9, 2018
http://circres.ahajournals.org/D
ownloaded from
CAVAL VELOCITY IN MAN 357
rise in the velocity of forward flow duringventricular systole was replaced by a markedbackflow. In another patient with atrial fibril-lation, forward acceleration was seen duringventricular systole but was not preceded bythe diminished velocity of flow that wouldaccompany a normal atrial contraction. Wehave also found that records taken from thelower IVC in several patients show relativelysteady flow with diminished or absent pul-sations.
Discussion
We did not think it justifiable in thesestudies to perform angiography to determinethe size of the vessels studied, and thereforewe cannot convert our measurements ofblood velocity into volume flow rate. How-ever, it appears that under resting conditionsonly small (about 2%) changes in caval di-ameter are seen in phase with pressure (2).Thus, the waveform of caval blood flowshould be the same as that for blood velocity.
On general grounds, it would be expectedthat the velocity profile in the venae cavaewould not be parabolic. The presence oftributaries and the catheter itself will tendto flatten the velocity profile. In addition,the velocity profile in pulsatile flow at heartrate frequency and in tubes of this sizeshould be essentially flat (9). If the dimen-sions of the veins in these subjects are similarto those measured from cross sections in pre-served cadavers (IVC, 3.83 cm2; SVC, 3.02cm2 [10]), then from the average valuesfor mean velocity of flow in Table 1, thetotal venous return would be 5.6 liters/min,which is a reasonable figure.
Mills and Shillingford have shown (8)that the velocity transducer used here re-sponds linearly to velocity of flow past itstip and that its frequency response is quiteadequate for present purposes. The trans-ducer itself has a cross-sectional area of 7mm2, and thus when placed in a vessel3 cm in diameter, it will occupy 1% of thecross-sectional area. They also showed thatthe output of the transducer is much lesssensitive to the relation between the vessel
Circulation Research, Vol. XXIII, September 1968
axis and the transducer axis than might havebeen expected from a simple cosine relation-ship. The probable explanation for this is thatflow lines tend to follow the wall of thetransducer.
The waveforms of velocity of flow recordedhere are, as far as we know, the first onesto be recorded from the normal human venaecavae. The patterns of flow agree veryclosely with those previously reported fordogs (1, 2, 11). The main features of theflow waves are the acceleration of velocityof flow toward the heart during ventricularsystole and the marked slowing during atrialsystole. That these pulsations are the resultof events within the heart is supported byfindings in the two patients mentioned abovewhom we have studied during diagnosticcatheterization.
Flow in veins, as in other collapsible tubes,depends both on the pressure gradient alongthe vessel and on the transmural pressuredifference (12-14). When the downstreamintravascular pressure is less than the extra-vascular pressure, a localized segment of thevessel at the downstream end undergoespartial collapse. Flow will then be governedby the difference between the upstream in-travascular and the extravascular pressures.Alterations in downstream intravascular pres-sures will not affect flow. As the extravascularpressure is raised, the length of the partiallycollapsed segment increases toward the up-stream end. When the upstream pressure isexceeded, flow ceases altogether and the ves-sel is collapsed for its entire length (12,15). Thus, in such a system, an increase inflow will result when the upstream pressureis raised, but lowering the downstream pres-sure can only increase flow so long asdownstream pressure remains greater thanextravascular pressure.
We believe that this simple model describesthe superior vena cava. For the inferior venacava, however, it is necessary to consider acollapsible vessel surrounded by two extra-vascular chambers separated by the dia-phragm. In this model, which has been stud-ied by Doppman et al. (15), collapse occurs
by guest on May 9, 2018
http://circres.ahajournals.org/D
ownloaded from
358 WEXLER, BERGEL, GABE, MAKIN, MILLS
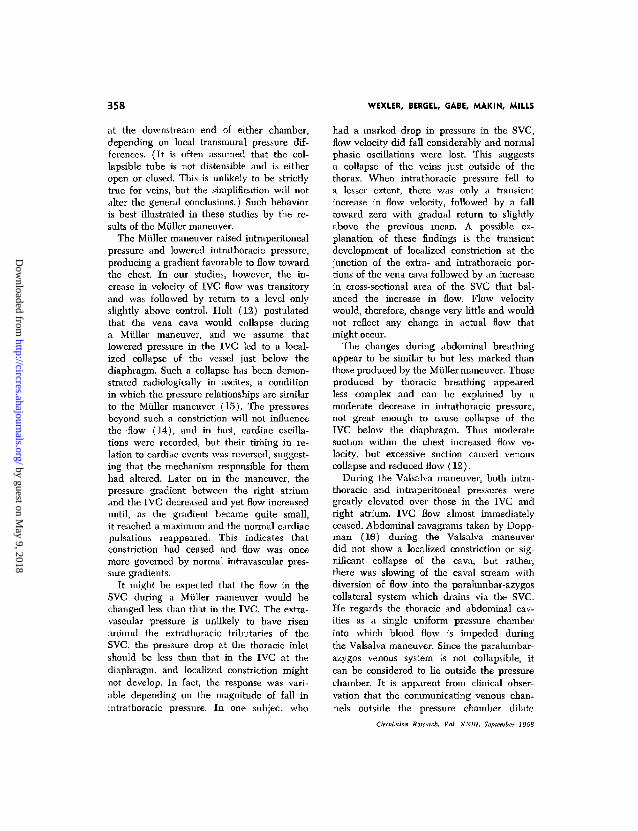
at the downstream end of either chamber,depending on local transmural pressure dif-ferences. (It is often assumed that the col-lapsible tube is not distensible and is eitheropen or closed. This is unlikely to be strictlytrue for veins, but the simplification will notalter the general conclusions.) Such behavioris best illustrated in these studies by the re-sults of the Miiller maneuver.
The Miiller maneuver raised intraperitonealpressure and lowered intrathoracic pressure,producing a gradient favorable to flow towardthe chest. In our studies, however, the in-crease in velocity of IVC flow was transitoryand was followed by return to a level onlyslightly above control. Holt (12) postulatedthat the vena cava would collapse duringa Miiller maneuver, and we assume thatlowered pressure in the IVC led to a local-ized collapse of the vessel just below thediaphragm. Such a collapse has been demon-strated radiologically in ascites, a conditionin which the pressure relationships are similarto the Miiller maneuver (15). The pressuresbeyond such a constriction will not influencethe flow (14), and in fact, cardiac oscilla-tions were recorded, but their timing in re-lation to cardiac events was reversed, suggest-ing that the mechanism responsible for themhad altered. Later on in the maneuver, thepressure gradient between the right atriumand the IVC decreased and yet flow increaseduntil, as the gradient became quite small,it reached a maximum and the normal cardiacpulsations reappeared. This indicates thatconstriction had ceased and flow was oncemore governed by normal intravascular pres-sure gradients.
It might be expected that the flow in theSVC during a Miiller maneuver would bechanged less than that in the IVC. The extra-vascular pressure is unlikely to have risenaround the extrathoracic tributaries of theSVC, the pressure drop at the thoracic inletshould be less than that in the IVC at thediaphragm, and localized constriction mightnot develop. In fact, the response was vari-able depending on the magnitude of fall inintrathoracic pressure. In one subject who
had a marked drop in pressure in the SVC,flow velocity did fall considerably and normalphasic oscillations were lost. This suggestsa collapse of the veins just outside of thethorax. When intrathoracic pressure fell toa lesser extent, there was only a transientincrease in flow velocity, followed by a falltoward zero with gradual return to slightlyabove the previous mean. A possible ex-planation of these findings is the transientdevelopment of localized constriction at thejunction of the extra- and intrathoracic por-tions of the vena cava followed by an increasein cross-sectional area of the SVC that bal-anced the increase in flow. Flow velocitywould, therefore, change very little and wouldnot reflect any change in actual flow thatmight occur.
The changes during abdominal breathingappear to be similar to but less marked thanthose produced by the Miiller maneuver. Thoseproduced by thoracic breathing appearedless complex and can be explained by amoderate decrease in intrathoracic pressure,not great enough to cause collapse of theIVC below the diaphragm. Thus moderatesuction within the chest increased flow ve-locity, but excessive suction caused venouscollapse and reduced flow (12).
During the Valsalva maneuver, both intra-thoracic and intraperitoneal pressures weregreatly elevated over those in the IVC andright atrium. IVC flow almost immediatelyceased. Abdominal cavagrams taken by Dopp-man (16) during the Valsalva maneuverdid not show a localized constriction or sig-nificant collapse of the cava, but rather,there was slowing of the caval stream withdiversion of flow into the paralumbar-azygoscollateral system which drains via the SVC.He regards the thoracic and abdominal cav-ities as a single uniform pressure chamberinto which blood flow is impeded duringthe Valsalva maneuver. Since the paralumbar-azygos venous system is not collapsible, itcan be considered to lie outside the pressurechamber. It is apparent from clinical obser-vation that the communicating venous chan-nels outside the pressure chamber dilate
Cmln /w Risearr.b, Vol. XXIII, September 1968
by guest on May 9, 2018
http://circres.ahajournals.org/D
ownloaded from
CAVAL VELOCITY IN MAN 359
markedly as the pressure within them rises.At the site where these dilated vessels jointhe cavae, a point of relative narrowing, butnot true constriction, can be demonstrated(17).
In the present experiments, the mean ve-locity of flow in the SVC was reduced byabout half, but it tended to rise to normallevels toward the end of the maneuver. Thismight be explained by the relatively smallcompliance of the SVC and its intrathoracictributaries, which led to a relatively rapidrise in intravascular pressure as inflow con-tinued; this would dilate the SVC and in-crease flow. In the records of velocity offlow from both the SVC and IVC during theValsalva maneuver, the normal oscillationswere altered with respect to the cardiaccycle. Under these conditions the drivingpressure for flow is the difference betweenupstream intravascular and the extravascularpressures, so that the influence of right atrialpressure waves on the flow pattern wouldnot be expected.
It is appropriate to say finally that thefindings in this study confirm the work ofBrecher (1), who, using different methods,defined the general features of caval flow.These features have been shown here to bepresent in normal conscious man, who is ableto perform many maneuvers better thananimals.
AcknowledgmentsWe wish to thank Dr. D. Mendel of St. Thomas's
Hospital for the right heart pressure recordings usedin Figure 3. We should also like to acknowledgethe expert technical assistance provided by Mr. P.Burgess, Miss S. Marrington and Miss H. Grove.
References1. BRECHER, G. A.: Venous Return. New York,
Crune & Stratton, 1956.
2. TAFUH, E., AND GUNTHEROTH, W. G.: Simul-
taneous pressure flow and diameter of the venacava with fright and exercise. Circulation Res.19: 42, 1966.
3. MOHCAN, B. C , DILLARD, D. H., AND GUNTHE-ROTH, VV. G.: Effect of cardiac and respiratorycycle on pulmonary vein flow, pressure anddiameter. J. Appl. Physiol. 21: 1276, 1966.
4. GUNTHEROTH, W. G., MORGAN, B. C , AND
MULLINS, G. L.: Effect of heart beat and res-piration on flow patterns in the cavae, pulmo-nary artery, pulmonary vein and aorta in intactdogs. Science 150: 373, 1965.
5. MIXTER, G., JR.: Respiratory augmentation ofinferior vena caval flow demonstrated by a low-resistance phasic flowmeter. Am. J. Physiol.172: 446, 1953.
6. NORDENSTROM, B., AND NORHAGEN, A.: Effectof respiration on venous return to heart. Am. J.Roentgenol., Radium Therapy, Nucl. Med. 95:655, 1965.
7. NORHAGEN, A.: Selective angiography of thehepatic veins: Experimental investigation ofbasal circulatory dynamics. Acta radiol., Suppl.221, 1963.
8. MILLS, C. J., AND SHILLINCFORD, J. P.: A catheter
tip electromagnetic velocity probe and its eval-uation. Cardiovascular Res. 1: 263, 1967.
9. MCDONALD, D. A.: Blood Flow in Arteries. Lon-don, Edward Arnold Ltd., 1960.
10. EYCLESHYMEB, A. C , AND SCHOEMAKER, D. M.:
A Cross Section Anatomy. New York, D. Ap-pleton & Co., 1911.
11. PlNKERSON, A. L., LUIA, M. H., AND FREIS,E. D.: Effect of cardiac rhythm on vena cavalblood flows. Am. J. Physiol. 210: 505, 1966.
12. HOLT, J. P.: Collapse factor in the measurementof venous pressure: Flow of fluid throughcollapsible tubes. Am. J. Physiol. 134: 292,1941.
13. RODBARD, S., AND SAIKI, H.: Flow through col-
lapsible tubes. Am. Heart J. 46: 715, 1953.14. PERMUTT, S., AND RILEY, R. L.: Hemodynamics
of collapsible vessels with tone: The vascularwaterfall. J. Appl. Physiol. 18: 924, 1963.
15. DOPPMAN, J., RUBINSON, R. H., ROCKOFF, S. D.,VASKO, J. S., SHAPIRO, R., AND MORROW, A. G.:
Mechanism of obstruction of the infradia-phragmatic portion of the inferior vena cavain the presence of increased intra-abdominalpressure. Invest. Radiol. 1: 37, 1966.
16. DOPPMAN, J.: Effect of Valsalva maneuver onthe inferior vena cava in man. Invest. Radiol.2: 332, 1967.
17. CANDEL, S., AND EHRLICH, D. E.: Venous blood
flow during the Valsalva experiment: Includ-ing some clinical applications. Am. J. Med.15: 307, 1953.
Circulation Research, Vol. XXIII, Sotumin 1S68
by guest on May 9, 2018
http://circres.ahajournals.org/D
ownloaded from
S. MAKIN and CHRISTOPHER J. MILLSLEWIS WEXLER, DEREK H. BERGEL, IVOR T. GABE, GEOFFREY
Velocity of Blood Flow in Normal Human Venae Cavae
Print ISSN: 0009-7330. Online ISSN: 1524-4571 Copyright © 1968 American Heart Association, Inc. All rights reserved.
Avenue, Dallas, TX 75231is published by the American Heart Association, 7272 GreenvilleCirculation Research
doi: 10.1161/01.RES.23.3.3491968;23:349-359Circ Res.
http://circres.ahajournals.org//subscriptions/
is online at: Circulation Research Information about subscribing to Subscriptions:
http://www.lww.com/reprints Information about reprints can be found online at: Reprints:
document. Permissions and Rights Question and Answer
page under Services. Further information about this process is available in therequested is located, click Request Permissions in the middle column of the Web Once the online version of the published article for which permission is beingRightsLink, a service of the Copyright Clearance Center, not the Editorial Office.
can be obtained viaCirculation Researcharticles originally published in Requests for permissions to reproduce figures, tables, or portions ofPermissions:
by guest on May 9, 2018
http://circres.ahajournals.org/D
ownloaded from
http://circres.ahajournals.org/content/23/3/349services, is located on the World Wide Web at:
The online version of this article, along with updated information and
http://circres.ahajournals.org//subscriptions/
is online at: Circulation Research Information about subscribing to Subscriptions:
http://www.lww.com/reprints Information about reprints can be found online at: Reprints:
document. Permissions and Rights Question and Answer
page under Services. Further information about this process is available in therequested is located, click Request Permissions in the middle column of the Web Once the online version of the published article for which permission is beingRightsLink, a service of the Copyright Clearance Center, not the Editorial Office.
can be obtained viaCirculation Researcharticles originally published in Requests for permissions to reproduce figures, tables, or portions ofPermissions:
by guest on May 9, 2018
http://circres.ahajournals.org/D
ownloaded from