Embed Size (px)
Citation preview

VEHICULAR AD-HOC NETWORK (VANET) SIMULATIONS OF OVERTAKING
MANEUVERS ON TWO-LANE RURAL HIGHWAYS Alice Chu The University of Texas at Austin, Dept of Civil, Architectural and Environmental Engineering 301 E. Dean Keeton St. Stop C1761, Austin, Texas 78712 Phone: 512-471-4535, Fax: 512-475-8744, Email: [email protected] Michael Motro The University of Texas at Austin, Department of Electrical and Computer Engineering 1616 Guadalupe Stop C0803, Austin, Texas 78701 Phone: 512-471-8980, Fax: 512-471-2893, Email: [email protected] Junil Choi The University of Texas at Austin, Department of Electrical and Computer Engineering 1616 Guadalupe Stop C0803, Austin, Texas 78701 Phone: 512-471-8980, Fax: 512-471-2893, Email: [email protected] Abdul Rawoof Pinjari University of South Florida, Department of Civil and Environmental Engineering 4202 E. Fowler Ave., ENC 2503, Tampa, Florida 33620 Phone: 813-974-9671, Fax: 813-974-2957, Email: [email protected] Chandra R. Bhat (corresponding author) The University of Texas at Austin, Dept of Civil, Architectural and Environmental Engineering 301 E. Dean Keeton St. Stop C1761, Austin, Texas 78712 Phone: 512-471-4535, Fax: 512-475-8744, Email: [email protected] and King Abdulaziz University, Jeddah 21589, Saudi Arabia Joydeep Ghosh The University of Texas at Austin, Department of Electrical and Computer Engineering 1616 Guadalupe Stop C0803, Austin, Texas 78701 Phone: 512-471-8980, Fax: 512-471-2893, Email: [email protected] Robert W. Heath Jr. The University of Texas at Austin, Department of Electrical and Computer Engineering 1616 Guadalupe Stop C0803, Austin, Texas 78701 Phone: 512-471-8980, Fax: 512-471-2893, Email: [email protected]

ABSTRACT
The objective of this paper is to evaluate the effectiveness of a dedicated short-range
communication (DSRC)-based wireless vehicle-to-vehicle (V2V) communication system, called
the overtaking assistant, devised for improving safety during overtaking (also referred to as
passing) maneuvers on two-lane rural highways. Specifically, the paper examines the influence
of vehicular kinematics (vehicle speeds and accelerations and distances), driver perception-
reaction behavior (drivers’ perception/reaction time), and DSRC characteristics (power settings,
communication range, packet errors, sensor errors, and estimation inaccuracy) on the
effectiveness of DSRC systems in predicting unsafe overtaking maneuvers. To this end, the
paper utilizes a microscopic traffic simulator called VEhicles In Network Simulation (VEINS)
that supports the simulation of wireless communication protocols in Vehicular Ad-hoc NEtworks
(VANETs). Over 13,000 overtaking maneuvers – with over 10,000 collisions and 3,000 safe
maneuvers – were simulated to consider heterogeneity in vehicular kinematics, driver behavior,
and DSRC performance. The overtaking assistant predicts whether a collision will occur and
warns the driver before the maneuver begins. A descriptive analysis followed by a multivariate
analysis (using binary discrete outcome models) of the simulated data reveals that the majority of
collisions that could not be detected were due to the vehicles being out of communication range
for the communication power settings used in the simulation. Packet errors, or failed
communications, at a rate of up to 50% did not have a significant influence on the ability to
detect collisions. These results suggest that the most important step in paving the way toward
advanced driver assistance systems for rural highway overtaking maneuvers is to broaden the
communication range of DSRC devices. Decreasing packet errors or communication channel
congestion beyond the current DSRC standards may not necessarily yield significant benefits for
rural highway safety.
Keywords: Two-lane rural highways; Overtaking maneuvers; VANETs; Connected vehicles;
DSRC driver assistance systems.
1
1. INTRODUCTION
The National Highway Traffic Safety Administration (NHTSA)’s annual crash statistics indicate
that two-lane rural highways witness a disproportionately high number of fatal crashes. In
particular, although only 19 percent of the US population lives in rural areas, 54 percent of the
traffic fatalities occur on rural highways (see FHWA, 2015; NHTSA, 2014). Many of these
fatality-causing collisions occur during the passing maneuver on two-lane highways when
vehicles attempt to overtake slower moving vehicles ahead. Among the primary reasons behind
these collisions are driver errors, including inattention or distraction, misperception of sight
distances, illegal passing, and excessive speeds. Despite the implementation of various design
solutions and traffic control strategies, such crashes continue to dominate traffic fatality statistics.
Historically, the focus of highway safety has been geared toward implementing passive
safety systems (such as airbags and road barriers) that attempt to reduce the severity of crash
outcomes. With the advancement of technology, however, efforts have expanded to design
advanced driver assistance systems, or ADAS, that attempt to proactively anticipate and prevent
crashes. For example, features such as forward collision warning, blind spot detection, lane
departure warning, and adaptive cruise control are becoming more prevalent and popular in new
vehicle models. However, the development of an overtaking assistant – an ADAS that
determines whether a gap is considered safe for overtaking, given the trajectory information of
the vehicles in the vicinity – has yet to be realized. One particular task of the overtaking
maneuver -- determining the location of oncoming traffic (i.e., traffic in the opposite lane) -- is
not a task that radars, lasers, or cameras have been able to achieve successfully, mainly because
the reported detection ranges of these sensors are shorter than the safe overtaking sight distances
(or passing sight distances) recommended in the transportation literature (see Hegeman et al.,
2005, Harwood et al., 2008, Delphi, 2009, Velodyne, 2016).
An alternative solution is to use wireless connected vehicle technologies, such as
dedicated short-range communication (DSRC) systems, to prevent collisions. Connected vehicle
research in the US suggests that 81 percent of all annual crashes can potentially be addressed by
vehicle-to-vehicle (V2V) and vehicle-to-infrastructure (V2I) systems (United States Department
of Transportation, USDOT, 2015). These technologies rely on wireless communication networks
that enable the anticipation of driving situations (i.e., positions, speeds, and acceleration of
different vehicles within range of the situation, along with distances between vehicles) at a level
2
of coverage and fidelity that is not feasible with human perception or even with technologies
such as radars, cameras, or in-vehicle sensors. Such information can potentially be used to
develop accurate collision warning and avoidance systems aimed at assisting overtaking
maneuvers.
While wireless communication technologies have the potential to enhance safety during
the passing maneuver, most existing studies (see for example Rabadi and Mahmud, 2007; Yang
et al., 2011; Joerer et al., 2014b) have focused on the use of these technologies for urban driving
situations (such as roadway intersections) and not on overtaking assistance. This paper attempts
to fill this gap by undertaking a first assessment of the potential benefits and challenges of using
DSRC-based wireless communication systems in the context of overtaking maneuvers on two-
lane rural highways. In doing so, the impacts of two broad factors are considered: (a) driver
perception-reaction (PR) behavior and vehicular dynamics (speeds and accelerations of different
vehicles involved) and (b) DSRC performance. In this paper, DSRC performance refers to the
accuracy, efficiency, timeliness and robustness of data transmission among vehicles. The tasks of
gathering information (through on-vehicle sensor measurements) to communicate, and of
synthesizing communicated information to create a full picture of the present and projected
future states of all vehicles, are also considered as dimensions of DSRC performance.
Heterogeneity in driver PR time, vehicular dynamics, and DSRC performance that lead to
alternate overtaking situations is explicitly accommodated in the analysis.
The paper assesses the potential of wireless communication technologies to assist in
overtaking maneuvers using a Vehicular ad-hoc network (VANET) simulator. Such simulators
have become the preferred tool for evaluating emerging vehicle safety technologies, offering
many advantages over the traditional method of collecting field data. Foremost among these is
that it is not feasible to use existing field data when penetration rates for the technologies being
assessed are too low or even non-existent (as in our case). VANET simulators, on the other hand,
combine a network simulator – with built in network functionality that adheres to DSRC
standards for communication among vehicles, as well as between vehicles and infrastructure –
with a traffic simulator that allows for flexibility in the design of roadway scenarios and the
scalability to support large traffic flows. The specific VANET simulator used here is the
VEhIcles in Network Simulator (or VEINS; see Sommer et al., 2011) that supports the
simulation of wireless communication protocols in vehicular ad-hoc networks. VANET
3
simulations are run, and the resulting simulated data are analyzed using both descriptive analysis
and discrete choice models.
The rest of this paper is structured as follows. The next section outlines related work in
the area of overtaking maneuver safety. Section 3 focuses on the design of the collision warning
system (called an overtaking assistant) simulated in this paper, along with the assumptions made
for simulating rural highway overtaking maneuvers (and collisions). Section 4 presents and
describes the simulated data, along with a descriptive analysis of the performance indicators of
the overtaking assistant. Section 5 presents a statistical analysis of the simulated data, using
discrete outcome models, and discusses significant findings. Section 6 concludes the paper with
recommendations to improve DSRC-enabled driver assistance systems for rural overtaking
maneuvers and future research directions.
2. RELATED WORK
Overtaking maneuvers are complex cognitive tasks that require the driver to gather and process
multiple sources of information and make decisions in short time durations. Hegeman et al.
(2005) established a conceptual framework that abstracts the complexity of the overtaking
maneuver into 5 different phases – decide to overtake, prepare to overtake, change lane, pass,
and return to own lane – which are, in turn, divided into 20 different subtasks. The authors also
discussed the feasibility of utilizing ADAS for the 20 different subtasks and mentioned that no
ADAS systems existed (then) for complex subtasks such as judging distances with the vehicles
in the opposite lane. Many years prior to Hegeman et al., Wilson and Best (1982) categorized
different overtaking maneuvers into the following four categories:
1) Normal: The passing vehicle follows the lead vehicle at a constant speed and waits for a
sufficient gap to perform an overtaking maneuver. Subsequently, the passing vehicle
accelerates to change lane and perform the overtaking maneuver.
2) Flying: The passing vehicle continues at its current speed when initiating the maneuver,
no acceleration is involved.
3) Piggy backing: The passing vehicle follows behind another vehicle that is overtaking the
lead vehicle.
4) 2+: The passing vehicle performs the overtaking maneuver on two or more vehicles.
4
Since the introduction of V2V communications, several safety applications have been
proposed to reduce the number of accidents caused by unsafe overtaking maneuvers. For
example, Olaverri-Monreal et al. (2010) designed an innovative overtaking assistant termed the
“See-Through System”. By equipping vehicles with DSRC radios, windshield-installed cameras,
and GPS units, the overtaking vehicle was able to send a request to the preceding vehicle to
wirelessly send a video stream of its visual perspective. This combination of DSRC, GPS, and
video-streaming technology was evaluated using a driving simulator. The communicated video
was shown to reduce the time that participants spent behind slower vehicles. All participants who
tested this system using the driving simulator reported that the additional information provided
would be useful for making overtaking decisions. However, the “See-Through System” was not
evaluated with respect to its ability to anticipate and prevent potential collisions. This is possibly
because, in the experiments with the “See-Through System”, the decision of whether an
overtaking maneuver is safe or not was entirely the driver’s responsibility. We, on the other hand,
focus on ADAS that can anticipate potential collisions to help the drivers abort unsafe overtaking
maneuvers. To do so, we use a microscopic traffic simulator to simulate a large number of unsafe
overtaking maneuvers.
As discussed earlier, microscopic simulators are the preferred method (compared to
collecting field data or using driving simulators) for fully evaluating ADAS because of their
ability to easily modify individual drivers’ behavior and vehicular characteristics to emulate
driver assistance systems. Tapani (2008) developed a Rural Traffic Simulator (RuTSim) with
simulation models specific to rural road environments, which Hegeman et al. (2009) used to
evaluate an overtaking assistant in terms of safety and traffic congestion. The assistant calculates
the time-to-collision with the oncoming vehicle, or the time at which the passing and oncoming
vehicles would collide if they were in the same lane, and sends a warning when the time-to-
collision is below a threshold value. They showed that an overtaking assistant could significantly
increase the safety of overtaking maneuvers without influencing (i.e., decreasing) the average
speed of vehicles or the number of successful maneuvers. Another microscopic simulator is the
Open Racing Car Simulator (Espie et al., 2008). Wang et al. (2009) used this simulator to
estimate the conflict probability of an overtaking vehicle with lead and oncoming traffic by
predicting their future positions, using current kinematic information and driver inputs
(acceleration, braking, and wheel angle). Several other research studies have also developed their
5
own customized microsimulators to explore different approaches to modeling overtaking
behavior (see for example Petrov and Nashashibi, 2011; Ghods and Saccomanno, 2011; Ghaffari
et al., 2011; Ghods et al., 2012; Yu et al., 2013). However, all of the above simulators assume
that the ADAS has complete and perfect knowledge of all nearby vehicles, without considering
potential uncertainties (or errors) in the information obtained and utilized for predicting conflicts
or collisions. In fact, most studies mentioned above do not even discuss whether the information
is obtained through sensors, V2V communications, or other means. The complete assessment of
an ADAS requires a realistic evaluation of its information retrieval method.
Unlike RuTSiM and other microsimulators identified above, VANET simulators have
gained traction in the past few years for their ability to evaluate VANET protocols, as well as the
potential of connected systems to alleviate traffic congestion and improve traffic safety. VANET
simulators couple a traffic simulator with a communications network simulator and turn each
vehicle into a wireless node capable of V2V communication. This offers an ability to evaluate
the influence of performance issues associated with V2V communications on the effectiveness of
ADAS.
In the context of utilizing VANET simulators to assess the effectiveness of ADAS, the
main focus in research so far has been on urban intersection scenarios, due to the fact that they
are known to be high-incident locations. The few VANET-based studies concerning rural roads
have focused mainly on evaluating appropriate communication parameter thresholds to use (such
as thresholds in transmission power, beacon rates, and latency) for maximizing throughput
and/or minimizing worst-case delays of communication messages, without considering whether
the vehicle would end up in a collision or not (see for example Huang et al., 2009; Böhm et al.,
2011; Joerer et al., 2014a). However, to determine the effectiveness of safety applications,
metrics such as collision probability and number of avoidable collisions need to be captured and
validated. Van Kooten (2011) designed communication simulations to study the feasibility of
DSRC communication in detecting hazardous overtaking maneuvers, considering failure to
communicate before the beginning of a maneuver as failure of the overtaking assistant. We
similarly analyze several sources of communication failure, but our performance metrics are
defined based on correct detection of potential collisions. In addition, for arriving at the
performance metrics, we consider communication failures as well as the possibility of incorrect
measurements of vehicle dynamics and incorrect assumptions of driver behavior.
6
Trajectory prediction algorithms form the basis of collision detection. In reality, even in
situations without any communication failures, predicted trajectories may not be completely
accurate due to inaccuracies (or errors) in several inputs used in trajectory prediction such as
measurement of vehicular dynamics and the assumptions made on driver behavior. Highly
inaccurate prediction models can lead to unacceptable rates of undetected collisions or
unnecessary warnings, reducing drivers’ trust in the warning system. Vieira et al. (2013)
presented a deterministic trajectory prediction method for flying maneuvers and developed a
communication strategy to deal with inaccuracies in the prediction. However, the simulations
with which they validate their method did not include any error in the trajectory prediction. We
study a warning system for normal surface-based overtaking maneuvers (as opposed to flying
maneuvers). In addition, we concentrate on how heterogeneity in vehicular dynamics (e.g.,
speeds, accelerations, and initial distances between vehicles) and inaccuracy in the inputs for
trajectory predictions impact overtaking safety.
3. SIMULATION SETUP
This section describes the normal overtaking maneuvers simulated on two-lane rural highways,
including the definition of unsafe maneuvers (Section 3.1), the characterization of vehicular
dynamics in the simulation (Section 3.2), the assumptions made for the DSRC-enabled
overtaking assistant (Section 3.3), as well as the metrics used for evaluation of the simulated
overtaking assistant (Section 3.4).
3.1 Phases of the Overtaking Maneuver and Definition of Unsafe Maneuvers
Per the terminology of Wilson and Best (1982), we consider a simple, normal overtaking
maneuver involving three vehicles on a two-lane rural roadway: passing vehicle, lead vehicle,
and oncoming vehicle. In Figure 1, the passing, lead, and oncoming vehicles are represented by
the white, green, and red colored vehicles, respectively. All three vehicles are considered
passenger vehicles, each of length 19 feet.
The simulation is assumed to begin when the passing vehicle indicates its desire to overtake
the lead vehicle traveling ahead of it. At the beginning of the simulation (t = t0 = 0), the passing
vehicle is assumed to be traveling behind the lead vehicle at a constant speed (i.e., no
acceleration, or ap = 0 as in Figure 1) in its travel lane; the speed of the passing vehicle is
7
assumed to remain constant for the duration of its driver’s PR time (tpr) (as discussed later, we
allow this PR time to be heterogeneous in the population of drivers). During the
perception/reaction time (0 ≤ t < tpr), the driver is assumed to perceive and process information
on the lead vehicle and oncoming vehicle and determine whether the gap available is safe for
completing the overtaking maneuver. At the end of the PR time (t = tpr), the passing vehicle is
assumed to accelerate and move into the opposite lane. This is considered the start of the
overtaking maneuver.
Once in the opposite lane, the passing vehicle is assumed to travel at a constant
acceleration ap > 0 until it overtakes the lead vehicle and gains a one second headway ahead of
the lead vehicle. In this context, the term headway refers to the time the lead vehicle will require
to traverse the gap between the front of the lead vehicle and the back of the passing vehicle (i.e.,
the time required for the lead vehicle to travel dl distance shown in the bottom part of Figure 1).
This is equivalent to the time until collision between the lead vehicle and a (hypothetical)
stationary object at the rear end position of the passing vehicle in the bottom part of Figure 1. At
the time instant that the passing vehicle’s headway becomes one second ahead of the lead vehicle,
the passing vehicle is assumed to have returned to the original lane to complete the overtaking
maneuver, if the maneuver were a successful one.
At the moment the passing vehicle’s headway becomes one second ahead of the lead
vehicle (t = tfin), the time-to-collision may be calculated between the passing vehicle and the
oncoming vehicle. The term time-to-collision refers to the amount of time in which the passing
vehicle would collide with the oncoming vehicle, had it continued traveling in the opposite lane.
To be precise, if the passing and oncoming vehicles maintain their speeds and accelerations at
time t = tfin, time-to-collision is the time in which the two vehicles would together travel the
distance between their front bumpers (denoted by do in the last part of Figure 1). If the time-to-
collision is less than one second, we deem this overtaking maneuver as unsafe, as in Harwood et
al. (2008), and label it as resulting in a collision.1 On the other hand, if the time-to-collision is
greater than one second, we deem the overtaking maneuver as safe (and resulting in no collision).
1 Of course, not all situations where the time-to-collision is less than one second may result in collisions. To be precise, a collision happens only when the time gap goes to zero or beyond. However, since it is not safe to be within such a small time-to-collision we deem all such collision-prone situations (with less than one second time-to-collision) as collisions.
8
Throughout the discussed duration (i.e., from the beginning to the end of the simulation),
the lead vehicle and the oncoming vehicle are assumed to travel at their respective constant
acceleration rates in their respective lanes, regardless of the position, speed, and acceleration of
the passing vehicle.
3.2 Characterization of Vehicle Dynamics in the Simulation
Each simulated overtaking maneuver is referred to individually as a scenario. Variability (across
different overtaking scenarios) in driver behavior and vehicular dynamics can cause overtaking
maneuvers to differ from one another. In our simulation, these differences are encapsulated in the
following variables: the initial speeds, accelerations, and relative positions of all the three
vehicles involved in the maneuver and the perception/reaction time of the passing vehicle’s
driver. Each of these variables is drawn randomly for each scenario, with distributional
assumptions appropriate to represent realistic variations across different overtaking scenarios, as
discussed next.
3.2.1 Distributions of Simulation Variables
The passing vehicle’s driver PR time after he/she indicates a desire to overtake is drawn from a
triangular distribution between 1 to 4 seconds with a mode of 2.5 seconds. Since PR times vary
depending on the driver’s state (e.g., alertness, or fatigue), complexity of the driving situation,
and the type of highway (Layton and Dixon, 2012), assuming a maximum of 4 seconds captures
that drivers might need longer PR times in rural settings than in urban settings, and in passing
maneuvers than in simpler driving tasks.
The initial speeds (i.e., speeds at the beginning of each simulation; denoted by vp, vl, and
vo in Figure 1) for the three vehicles are generated from a truncated normal distribution with a
mean value 70 mph, minimum value 55 mph, and maximum value 90 mph. Typical speed limits
for rural interstates in the US range from 55 to 80 mph (National Motorists Association, 2014).
We simulated scenarios over the typical speed limits on rural two-lane highways to capture
excessive speeding situations.
The passing vehicle’s acceleration is assumed to be zero at the beginning of the
simulation. After the perception/reaction time, the passing vehicle is assumed to accelerate at a
constant rate and move into the opposite lane. This acceleration is drawn from a truncated
9
normal distribution with mean 3.6 ft/sec2 and truncated at 1 ft/sec2 and 8.2 ft/sec2 (see Brooks,
2012 for empirical data on accelerations in rural roads). The accelerations for the lead and
oncoming vehicles (denoted by al and ao in Figure 1) are drawn from another normal distribution
with mean zero and truncated at 3.2ft/sec2 on both sides of the distribution (Brooks, 2012).
Deceleration was allowed only for the lead and oncoming vehicles because the passing vehicle
cannot typically overtake (the lead vehicle) while decelerating.
The vehicular dynamics in the simulation begin with positioning the passing vehicle in
the right lane at initialization ( ). Subsequently, the lead vehicle is positioned in the right lane at
an arbitrary location (drawn from uniform distribution) ahead of the passing vehicle’s initial
location as long as its position is within 15 feet of a one second headway in front of the passing
vehicle. The oncoming vehicle’s initial position is set to be uniformly distributed between a
lower bound and an upper bound such that the passing and oncoming vehicles are neither too
close at the beginning of the overtaking maneuver nor very distant at the end of the maneuver.
The lower bound of the allowed distance between the passing and oncoming vehicles was taken
as the minimum distance needed for a vehicle (taking the fastest possible maneuver) to
successfully overtake, minus one second of headway. In other words, a scenario with an initial
passing-oncoming distance at or below the lower bound would never result in a safe maneuver.
The upper bound was obtained from the speed-dependent passing sight distance (PSD)
guidelines from AASHTO (AASHTO Green Book, 2004).2 It is worth noting here that the initial
vehicle-to-vehicle spacing and other parameters were set such that a considerable proportion of
simulated overtaking maneuvers are difficult (but not unrealistic) to complete, since one of the
objectives of this research was to assess the usefulness of V2V communications in preventing
overtaking crashes. At the same time, certain scenarios were discarded to avoid unrealistic
overtaking situations, as discussed next.
2 The PSD calculations from the AASHTO Green Book are used to set the upper bound on the initial distance between the passing vehicle and the oncoming vehicles, because these PSD values are considered to be very conservative in the literature (Harwood et al., 2008).
0t
10
3.2.2 Discarded Scenarios
Since the focus of this research study is to evaluate DSRC’s effectiveness in an overtaking safety
application, some outliers were excluded from the simulated data. Scenarios where the lead
vehicle is travelling more than 10 mph faster than the passing vehicle at PR time were discarded,
as an overtaking maneuver is very unlikely to occur in such circumstances. Scenarios where the
overtaking vehicle failed to pass the lead within 0.621 miles (1 km) were also considered
unrealistic and discarded. Finally, scenarios in which the oncoming vehicle passes the lead
vehicle before the PR time were discarded.
3.3 The Simulated DSRC Setup
In this paper, we simulate a DSRC-enabled overtaking assistant that estimates the trajectory of
all three vehicles in the above-described overtaking scenario. The purpose of the system is to
warn the passing vehicle when it detects a future collision caused by an unsafe overtaking
maneuver.
For simulating the overtaking assistant, we assume that all vehicles involved have
DSRC-enabled V2V communication abilities where each vehicle transmits Cooperative
Awareness Messages (CAMs) containing position, speed, and acceleration information every
100 milliseconds. We assume that the overtaking assistant requires a switch to be activated to
indicate that the passing vehicle would like to overtake the lead vehicle. After this moment ( ),
which is considered the beginning of the scenario, at every 100 milliseconds, the overtaking
assistant uses a simple, kinematics-based trajectory prediction model 3 to predict the future
positions of the passing vehicle as well as those of the lead and oncoming vehicles within the
communication range. Specifically, the overtaking assistant extracts vehicle speed and
acceleration information (of the lead and oncoming vehicles) and uses this in conjunction with
the readings of speed and acceleration from sensors within the passing vehicle itself as inputs
into the trajectory prediction model. In this section, we discuss three different parameters of V2V
communication effectiveness that have a bearing on the performance of the overtaking assistant:
(1) Communication range, (2) Packet error rate, and (3) Sensor and estimation errors or
inaccuracy.
3 The details of the trajectory prediction model are not provided here, since the model is based on simple kinematics involving the three vehicles. Interested readers may contact the authors for details.
0t
11
3.3.1 Communication Range
For the overtaking assistant to estimate the trajectory of the lead or oncoming vehicles, the two
vehicles must be within communication range of the passing vehicle to receive the CAMs
containing position, speed, and acceleration information of the lead and oncoming vehicles. The
communication range, in turn, depends on the maximum transmit power of the DSRC devices.
The Federal Communications Commission defines four classes of DSRC devices depending on
their maximum allowed transmit powers as: Class A, Class B, Class C, and Class D. DSRC
devices are normally in the Class C category; with a maximum transmit power of 20 decibel-
milli Watts (or dBm; dBm is a logarithmic scaled unit of milli Watts) (Kenney, 2011). On the
receiving side, devices are only guaranteed to correctly receive messages above a certain power,
which is referred to as the minimum sensitivity. IEEE requires the minimum sensitivity of
VANET systems to be at least -85 dBm. A wireless signal’s loss in power over distance is
measured by its path loss exponent, which has a value of two in free space. We opted to set the
path loss exponent to 2.1 due to the low density of vehicles on rural roads. Given these
communication strength settings, the communication range in our simulations was approximately
2000 feet. It is worth noting here that Abbas et al. (2012) measured communication range for
vehicles on a highway and obtained similar results for these power settings.
The power settings and therefore the range of communication was not varied in our
simulations, despite its strong effect on the performance of the collision warning system. This is
because its effect is straightforward and deterministic – if an oncoming vehicle is out of
communication range when the overtaking begins, there would be no communication of
information between vehicles. In such situations, there would be no warning issued by the
overtaking assistant, even if the passing maneuver would lead to a collision. Therefore, to ensure
timely onset of communications between vehicles involved in overtaking maneuvers, it is useful
that the communication range be more than the design-speed dependent safe passing distances
given in AASHTO’s Green Book (AASHTO, 2004). At the least, the passing and oncoming
vehicles must come within the communication range before the passing vehicle driver’s PR time.
Note, however, that increasing the communication range has not been a major focus in the
development of DSRC devices since the allocated spectrum is designed to support many other
12
applications (Kenney, 2011); and widely researched applications such as collision warning at
intersections or platooning require a much shorter range.
3.3.2 Packet Error
When the vehicles are within communication range, the receipt of speed and acceleration
information may be affected by communication errors called packet errors that lead to the loss of
some CAMs without their receipt. One major cause of these errors is latency, or the delay
between a message’s initial broadcast and complete reception. The DSRC standard specifies
communication every 100 milliseconds, so a message with latency greater than 100 milliseconds
will be abandoned as the next message is sent. Latency is not constant and is determined by
many factors, such as congestion caused by high vehicle density. Other miscellaneous issues,
including physical interference from precipitation or obstacles and software errors, could also
prevent a single message from being received. The term packet error encompasses all these
reasons (other than vehicles being outside communication range) why timely communication
may not be established between vehicles, and therefore, potential collisions may not be detected
by the overtaking assistant.
The packet error rate represents the probability of packet error, or the probability that a
message sent by one vehicle will not be received by the other vehicles even when the vehicles
are within communication range. In our simulations, the following rates of packet error rate were
simulated: 0 percent, 50 percent, 75 percent, and 87.5 percent.
3.3.3 Sensor and Estimation Inaccuracy
In DSRC enabled connected vehicles, many in-vehicle sensors are used to determine the position,
speed, and acceleration of the vehicles. Such sensor measurements are, of course, subject to
sensing error (or inaccuracy), which in turn influence the accuracy of the trajectory prediction.
To capture this, each simulated measurement of the vehicle position, speed, and accelerations
was subject to random noise to represent sensor error (or inaccuracy) of the variables used for
trajectory prediction. That is, while the values of the position, speed, and acceleration variables
used for simulating each scenario were assumed as “true” values, the corresponding values used
for trajectory prediction were subject to sensor error. This is one reason why the trajectory
predictions could differ from the simulated trajectories.
13
The magnitude of sensor error for all variables was controlled by a single noise parameter
η. When η is 0 percent, information used for trajectory prediction is assumed to be known
perfectly (and same as the simulated values). That is, the values of the vehicle state variables
used for trajectory prediction are exactly the same as the simulated values. At 100 percent η, the
values used for trajectory prediction are randomly generated (within realistic error bounds)
without any regard to the simulated values. For η values between 0 and 100, for a variable X with
a measurement x (i.e., a simulated value x), the after-noise measurement , which is used for
trajectory prediction, is considered to be uniformly distributed with the following bounds:
100∗
100∗
In the above equation, Xrange is 2 meters for position variables, .5 m/s for speed variables, and .25
m/s2 for acceleration variables. As vehicle positioning is typically achieved by a combination of
GPS location and reckoning/filtering, the Xrange value position error was taken as half the
standard RMS of error for GPS (GPS SPS Performance Analysis Report, 2014). For the velocity
and acceleration sensors used within vehicles, the Xrange values are chosen such that the sensor
error is in the similar range as in standard commercial devices (see Analog Devices Inc., 2009,
for an accelerometer example).4
In addition to the above discussed sensor errors, it is important to note that the passing
vehicle's behavior variables – driver’s PR time and acceleration during overtake – cannot be
known with certainty before the beginning of the overtaking maneuver. Therefore, the overtaking
assistant has to estimate the driver's PR time and acceleration for trajectory prediction purposes.
To capture such uncertainty (or errors) in estimation, these two variables were subject to a
random noise, using the same control parameter η used for sensor error. The parameters should
still follow all previously-outlined assumptions on realistic driving parameters (i.e. the maximum
and minimum threshold values assumed in Section 3.2). Thus for a variable X with a
measurement (or simulated value) x and the threshold values and , the estimated value
is considered to be uniformly distributed with the following bounds:
4 The error bounds on each variable are relative to its assumed possible error, not the overall range or significance of its values. A separate study with a different variable to represent error on each of the eight sensed variables is outside the scope of this paper.
14
, 100∗ , 100
∗
In our simulations, multiple levels of settings were tested for the sensor/estimation error
rate (η) in conjunction with the packet error rate. These are: 0, 50, 75, and 100 percent for the
sensor and estimation error parameters (η); and 0, 50, 75, and 87.5 percent for the packet error
rate. Between the packet error rate and sensor/estimation error rate, one is kept fixed at the ideal
value while the other changes. Specifically, to test the effect of packet error rate, a subset (50
percent) of cases were simulated with the sensor and estimation error parameter (η) set to 0
percent, while changing the packet error rates between values of 0, 50, 75 and 87.5 percent.
Similarly, to test the influence of estimation inaccuracy rates, a subset (50 percent) of cases were
simulated with the packet error rate set to 0 percent, while changing the sensor/estimation error
rate between values of 0, 50, 75 and 100 percent. Note that some of these settings, particularly
those with high packet error (higher than 50%) or high sensor inaccuracy rates (higher than 50%)
may not be realistic vis-à-vis the current performance of DSRC devices, but are considered in the
simulations to allow for worst-case communication settings.
3.4 Performance Measurement of the Overtaking Assistant
The purpose of the DSRC-enabled overtaking assistant is to detect a future collision (as defined
in Section 3.1) due to an unsafe overtaking maneuver and warn the passing vehicle prior to its
driver’s PR time. The performance of the overtaking assistant may be measured based on how
effectively it detects a future collision. Specifically, the following two metrics are used to
measure the overtaking assistant’s performance: (1) Undetected collisions and (2) Unnecessary
(or false) warnings, both of which are defined next.
For the overtaking scenarios that result in a collision (i.e., time-to-collision less than a
second), an effective overtaking assistant must predict the collision (i.e., predicted time-to-
collision less than a second) and issue a timely warning before the driver’s PR time. Otherwise,
the driver will begin to encroach on the oncoming lane and it is assumed to be too late to abort
the maneuver. If a scenario results in a collision but a warning is not issued before the driver’s
PR time, it is categorized as an undetected collision. A collision may go undetected because of
two potential reasons: (a) lack of communication between vehicles, or (2) due to errors in the
sensing and/or estimation that lead to misprediction of the vehicle trajectories. There are two
15
reasons why communication would not occur between vehicles. First, the vehicles may not be
within the communication range. Second, for vehicles within the communication range, packet
errors may lead to absence of communication in a timely manner.
Unnecessary warnings are issued when communication has been established between all
three vehicles, but factors affecting the trajectory prediction model (sensor and estimation
inaccuracy) lead to a warning being issued before the driver’s perception/reaction time ends,
when in fact, the passing vehicle could have completed the overtaking maneuver safely. In the
terminology often used for predictive systems, undetected collisions would be considered false
negatives and unnecessary warnings false positives or false warnings.
In our simulations, the warnings issued do not lead to the passing vehicle aborting the
overtaking maneuver. The simulations continue to carry out the maneuver regardless so that we
can simulate the outcome of the overtaking maneuver (collision or not), which can be used to
determine the accuracy of the issued warnings.
4. SIMULATED DATA
The simulated dataset compiled for this research effort includes 13,300 cases, with 10,213
collisions (76.8 percent) and 3,087 (23.2 percent) non-collisions. It is worth noting here that we
purposely simulated a higher than realistic proportion of collisions to obtain a sufficient sample
of collisions to study.
Of the 10,213 collisions, the DSRC-enabled overtaking assistant detected collisions in a
timely manner (i.e., detected collision before driver’s perception reaction time) for 7,011 cases
(69% successful) but did not detect collisions for the remaining 3,202 cases. Among all the 3,087
simulated successful overtaking maneuvers without a collision, passing vehicles took an average
of 9 seconds to complete the overtaking maneuver, which is consistent with the overtaking
maneuver times reported in previous literature (Polus et al., 2000; Mocsári, 2009). The
overtaking assistant detected collisions (i.e., unnecessary or false warnings) for less than 3% of
the 3,087 successful (or safe) overtaking maneuvers.
Table 1 presents the inputs used across all the overtaking maneuver scenarios studied in
this research. These include driver behavior and vehicular dynamics (i.e., PR time, initial speed
and acceleration of all the three vehicles – passing, lead, and oncoming vehicles) and V2V
communication settings. In addition, initial distances between (1) passing and lead vehicles and
16
(2) passing and oncoming vehicles are presented to give a sense of relative positioning of the
vehicles in the beginning of the simulation. As can be observed, the descriptive statistics of the
driver behavior and vehicular dynamics parameters are consistent with the assumptions made on
these parameters in Section 3.2. The parameters defining V2V communication settings include
the frequency of CAM messages, power setting parameters (transmission power, minimum
sensitivity, and path loss exponent, packer error rate, and sensor/estimation inaccuracy rates. As
discussed in Section 3.3, the frequency of CAM messages and power setting parameters (that
result in a certain communication range) were fixed across all simulations, while the packet error
rate and sensor and estimation inaccuracy rates were varied.
Comparison of the descriptive statistics between simulated collisions and non-collisions
provides insight into how driver behavior and vehicular dynamics might influence collision and
non-collision outcomes. Within driver behavior and vehicular dynamics, a higher proportion of
passing vehicles with a longer driver PR time ended up in collisions. This result demonstrates the
importance of quick and correct decisions in overtaking maneuvers and highlights the need for
V2V technologies that can potentially assist in making quick decisions. It can be seen that
passing vehicles in the highest speed category (> 80 mph) show a greater chance of avoiding a
collision, despite the notion that fast driving is more dangerous. Yet, this result needs to be
interpreted with caution, because in our simulations the maximum allowed distances between the
passing and oncoming vehicles are speed-dependent (see Section 3.2.1). So fast passing vehicles
often start farther away (from oncoming vehicles) than slower vehicles, and therefore might lead
to safer simulated maneuvers. Lead vehicles in the slowest speed category (< 70 mph) are also
represented in greater proportions in non-collisions than in collisions. A larger proportion of non-
collisions started with a larger initial gap between the passing and oncoming vehicles (> 2500ft).
A different trend is seen in the case of collisions, where the largest proportion of collision
scenarios start with an initial gap of 2000-2500 ft.
One may note that the V2V communication parameters have no influence on simulated
collision or non-collision outcomes. This is because the simulations allowed all the overtaking
maneuvers to complete despite any warning from the overtaking assistant. Such simulation
outcomes are compared with the trajectory prediction outcomes (which depend on the V2V
communication settings) to understand the performance of the DSRC enabled overtaking
assistant.
17
Table 2 separates the scenarios into four groups of collision outcomes – undetected
collisions, correctly detected collisions, no-collision scenarios without warning, and no-collision
scenarios with an unnecessary (or false) warning – to understand the correlation between the
performance metrics of the overtaking assistant and the collision outcomes. Note from the third
column of the table that V2V communication was established (before PR time of the passing
vehicle) between all vehicles for collisions that were detected. As discussed earlier,
establishment of communication is necessary for the overtaking assistant to be able to detect
potential collisions. On the other hand, note from the second column that V2V communication
was not established for a vast majority (98.8%) of collisions that went undetected, suggesting
that lack of communication is a major reason why collisions were undetected. Such undetected
collisions without V2V communication accounted for a total 3164 scenarios in our simulation.
For a vast majority (>97%) of these 3164 undetected collisions where communication was not
established, the passing and oncoming vehicles had still not come within communication range
(i.e., 2000 feet) before the passing vehicle driver’s PR time. The remaining undetected collisions
where the passing and oncoming vehicles were within communication range (constituting only
2.7% of the total undetected collisions) may be attributed to packet errors. All these results
suggest that the typical DSRC communication range of 2000 feet may not be sufficient to detect
oncoming vehicles in a majority of overtaking scenarios that are prone to collisions.5
The last set of rows in Table 2 corresponds to the distribution of the actual time-to-
collision - i.e., the time it took for the passing vehicle to collide with the oncoming vehicle after
the passing vehicle achieved 1 second headway ahead of the leading vehicle. As expected, the
average value of this variable is relatively small in the case of undetected collisions and high in
the case of no-collision scenarios. At the same time, between non-collisions without a false
warning and non-collisions with a false warning, it may be observed that the time-to-collision is
much smaller for the latter scenarios. Specifically, the mean and median values of the time-to-
collision variable for no-collision scenarios that were issued a false collision warning are less
than 1.5 seconds, suggesting that the majority of scenarios where false warnings were issued
were relatively near collisions. Therefore, the issue of false warning does not appear to be a
5 As discussed earlier, the typically used DSRC power settings employed in our simulations imply a communication range of about 2000 feet. However, this doesn’t necessarily imply that V2V communication is fully present before 2000 feet and becomes completely absent right after 2000 feet. Rather, the strength of the communication is likely to taper continuously (but quickly) beyond 2000 feet.

18
severe issue in the context of DSRC-assisted collision warning systems for overtaking scenarios
on rural highways.
Table 3 presents descriptive statistics to understand the influence of packer error and
sensor/estimation error rate (or noise) on the performance of the overtaking assistant. The
information is presented separately for scenarios that ended up in collisions and scenarios that
did not lead to collisions. In each of these two cases (collisions and non-collisions), the
percentages across each row add up to 100 percent. For the collisions, the table presents the
distribution of the scenarios between undetected collisions and detected collisions for different
levels of packer error and sensor and estimation error rates. Similarly, for non-collisions, the
table presents the distribution of the scenarios between cases where no warning was issued and
cases where a false warning was issued by the overtaking assistant.
As can be observed from the column titled “undetected collisions”, when both packet
error rate and noise were set to 0%, 27.4% of the collisions were undetected. All of these
undetected collisions may be attributed to lack of communication due to vehicles being out of
communication range before the passing vehicles’ PR time. As the packet error increases from
0% to 87.5%, the percentage of collisions that were not detected increases (see the column titled
“undetected collisions) whereas the percentage of collisions that were detected decreases (see the
column titled detected collisions). However, the increase in the percentage of undetected
collisions is small for packet error rates of up to 50%. It is only beyond 50% packet error rates
that the percentage of scenarios with undetected collisions increases considerably. In reality, as
discussed earlier, packet errors of DSRC devises are rarely as high as 75% or more. Therefore,
these results suggest that the influence of packet error rates on missing the detection of a
potential collision is not as high as that of the vehicles being out of communication range. Next,
note from the non-collisions section of the table that increasing packet error rate did not
influence whether or not a false warning is issued for overtaking scenarios that did not end up
collisions. This is expected because packet errors influence only whether communication is
established or not, not the accuracy of trajectory prediction itself.
The second set of rows correspond to the influence of sensor and estimation error rates
(i.e., the noise parameter) on the performance of the overtaking assistant. As can be observed
from the collisions section of the table, increasing the sensor and estimation error rate lead to a
small decrease in the ability to detect collisions. Specifically, the percentage of collisions that
19
were not detected increase from 27.4% at zero noise to only 28.8% at 100% noise. On the other
hand, the percentage of no-collision scenarios that had a false warning issued by the overtaking
assistant increase multifold from 0.2% at zero noise to 3.2% at 25% noise and 6.3% at 50% noise.
These trends suggest that the sensor and estimation errors are more likely to cause the overtaking
assistant to be overly conservative, leading to false warnings, than being overly optimistic,
leading to undetected collisions or false negatives. This is expected because the sensor and
estimation errors simulated in our experiments were symmetric around the true values (i.e., not
biased toward the right or left of the true values) and sensor errors varied with every V2V
message sent. Furthermore, only a single prediction of collision is needed at any time between
the beginning of the scenario and the PR time of the passing vehicle. While the predicted time-
to-collision is equally likely to be conservative or optimistic (because sensor and estimation
errors are symmetric), the collision warning is issued on the first instance the predicted time-to-
collision is less than 1 second. Therefore, sensor and estimation errors combined with our
collision warning protocol primarily increase the likelihood of false warnings. It’s worth noting
that symmetric and time-varying noise is likely to have a stronger effect on the overtaking
assistant’s performance than constant or one-sided noise, for the same reason: the assistant can
overreact to one point in time with exceptional noise.
In summary, the descriptive analysis of the simulated data provides useful insights on the
influence of various V2V communication parameters on the effectiveness of DSRC-enabled
warning systems in predicting and preventing rural road overtaking collisions. Nevertheless, the
univariate descriptive analysis presented here cannot conclusively isolate the influence of
different factors on the performance of the DSRC-enabled warning systems. Therefore, the next
section provides a multivariate analysis to isolate the influence of each of the above factors while
controlling for the influence of vehicular dynamics and driver behavior variables.
5. MODEL ESTIMATION RESULTS
The simulated data discussed above were used to estimate three binary discrete outcome models.
The first model, called collision occurrence model, was estimated on all 13,300 simulated
overtaking maneuvers to examine the influence of driver behavior and vehicular dynamics on
collision occurrence (i.e., whether collision occurred or not). The second model, called collision
detection model, was on only the subset of simulated overtaking maneuvers that resulted in
20
collisions. This model explores the influence of driver behavior, vehicular dynamics, and V2V
communication parameters (packet error rate and sensor/estimation inaccuracy rate) on the
ability of the DSRC-enabled overtaking assistant to detect collisions6 in a timely manner (i.e.,
before the passing vehicle driver’s PR time). The binary outcomes analyzed in this model are: (a)
Undetected collision and (b) Detected collision. The third model, called false warning model,
was on only the subset of simulated overtaking maneuvers that did not result in collisions. This
model was used to examine the influence of various factors on the likelihood of the overtaking
assistant to provide unnecessary warnings (or false alarm of a collision). The binary outcomes
analyzed in this model are: (a) Collision detected but there was no collision (i.e., false warning),
and (b) No collision detected and there was no collision. The parameter estimates of all the three
models are presented in Table 4.
Model #1: Collision Occurrence Model
The collision occurrence model parameter estimates are shown in the second column of the table.
The positive coefficient on the passing vehicle driver’s perception/reaction time suggests that
higher PR times increased the likelihood of collisions in our simulations. This is because the
distance between the passing and oncoming vehicles diminishes as more time elapses from the
beginning of the simulation. Also recall that all our simulations continued to complete the
overtaking maneuver despite any potential for collisions, because the primary goal of this work
is to assess the effectiveness of DSRC-enabled V2V communication systems in predicting and
preventing overtaking collisions. In real life situations, however, longer PR times might provide
the driver an opportunity for the driver to carefully evaluate the situation and abort the
overtaking maneuver if necessary. Similarly, as discussed later, in the context of the DSRC-
assisted collision detection systems, longer PR times increase the likelihood of timely detection
of collisions.
In the context of the vehicular dynamics of the passing vehicle, ceteris paribus, greater
initial speeds and higher overtaking accelerations decreased the likelihood of collisions; perhaps
because such passing vehicles spend less time in the opposite lane. On the other hand, the initial
speed and accelerations of the lead and oncoming vehicles had an opposite influence. Greater
6 Recall that a collision would be detected if the estimated time-to-collision (i.e., time to collision at the instance passing vehicle’s headway is 1 second ahead of the lead vehicle) is less than 1 second.
21
speeds and higher accelerations of either vehicle increased the likelihood of collisions. This is
because the available gap between passing and oncoming vehicles (when the passing vehicle
achieves 1 second headway ahead of the lead vehicle) becomes smaller at higher speeds and
accelerations of the lead or oncoming vehicles.
Finally, as expected, smaller initial distance between passing and lead vehicles increased
the likelihood of collision, while greater initial distance between passing and oncoming vehicles
reduced the likelihood of collision.
Model #2: Collision Detection Model
Model #2 may be used to examine the influence of driver behavior, vehicular dynamics and V2V
communication settings on the likelihood of a missed warning (or undetected collision) for
unsafe overtaking maneuvers. Most of the parameter estimates from this model point to the
relative importance of the passing and oncoming vehicles coming within communication range.
For instance, in the context of driver behavior, longer PR times of passing vehicle drivers
decreased the likelihood of missing the detection of a collision, presumably because longer PR
times provide a greater opportunity for the passing and oncoming vehicles to come within
communication range.7 In addition, increasing the speed of oncoming vehicles also increased the
likelihood of detecting a collision. More importantly, as can be observed from the high t-statistic
values of the variable “initial distance between passing and oncoming vehicles”, this variable
exhibits a significant influence on the ability to detect collisions. Specifically, scenarios that
began with a greater separation between passing and oncoming vehicles and end in collisions are
less likely to be detected in a timely manner. This is again because a greater initial separation
between the two vehicles implies a greater likelihood of them not coming within communication
range in a timely manner (i.e., prior to passing vehicle’s PR time). All these results suggest that
the communication range (of 2000 ft) resulting from the typically-used communication power
settings employed in our simulations may not be sufficient to predict and prevent overtaking
collisions in a timely manner. This is because, as discussed the previous section, for a majority of
unsafe overtaking maneuvers the passing and oncoming vehicles were beyond communication
range to be able to detect collisions in a timely manner. These results suggest that increasing the
7 Longer PR times also result in a higher likelihood for the V2V communication to overcome packet loss, which in turn, increases the likelihood of detecting collisions.
22
DSRC power settings to broaden the communication range may be an effective way of
increasing the performance of DSRC devices for improving the safety of rural highway
overtaking maneuvers.
Both the speed and acceleration of the lead vehicle appear to be positively associated
with the likelihood of undetected collisions. Increasing the lead vehicle speed increases the
amount of time needed for the passing vehicle to complete the overtaking maneuver, thus
increasing the likelihood that a distant oncoming vehicle (one outside of communication range)
could cause a collision. For the same reason, the acceleration at which the passing vehicle
performs the overtaking maneuver is negatively correlated with the likelihood of undetected
collisions.
In the context of V2V communication settings, as the packet error rate increased beyond
50 percent, the likelihood of undetected collisions also increased, presumably because it
increased the likelihood of missed communication among the three vehicles. However, as
discussed earlier, packet error rates of greater than 50% are unlikely in DSRC-enabled V2V
communication systems. Therefore, in the context of rural highways where the vehicular traffic
volumes are not as high as those in urban environments, relieving communication channel
congestion is perhaps not a high-priority concern unless packet error rates increase beyond 50%.
Sensor and estimation errors were not determined to have significant effect on the
detection of collisions. Table 3 shows that higher errors will in fact cause slightly fewer
collisions to go detected, but this amount is so small as to be probabilistically insignificant
according to a multivariate model.
Model #3: False Warning Model
The parameter estimates of Model #3 may be used to understand which safe overtaking scenarios
are associated with an increased likelihood of an unnecessary warning issued by the overtaking
assistant. Specifically, safe overtaking scenarios with lower initial speeds of passing vehicles,
higher lead vehicle speeds, or those with higher oncoming vehicle speeds are associated with a
higher likelihood of a false warning. This is because passing vehicles with lower initial speeds
and lead vehicles with higher speeds tend to require a longer time for completing the overtaking
maneuver. Long overtaking maneuvers and fast oncoming vehicles may lead to situations that
are near collisions but not collisions (i.e., time-to-collision is higher than 1 second but not by
23
much). This is evident from Table 2, where the median and mean values of time-to-collision
variable for no-collision scenarios with a false warning are 1.29 seconds and 1.46 seconds,
respectively (see the column titled “Non-collisions with unnecessary warning”). Such overtaking
scenarios, although safe, are close to being collisions (i.e., the time-to-collision is slightly greater
than 1 second). In such cases, it is perhaps easier for sensor and estimation errors (that influence
the trajectory prediction) to cause an under-estimation of the time-to-collision to be below 1
second, leading to a false warning.
In the context of communication settings, as expected, packet error rates do not
significantly impact the likelihood of unnecessary warnings. However, increasing the sensor and
estimation inaccuracy rates lead to an increase in the likelihood of unnecessary warnings. As
discussed at the end of Section 4, this result may be attributed to the unbiasedness of the
simulated sensor and estimation errors combined with our protocol to issue a warning at the first
instance of predicted time-to-collision falling below 1 second. To reduce such incidence of
unnecessary warnings, Haas and Hu (2010) built in logic to their collision warning model to only
issue a warning to the driver if the vehicle predicts a collision two consecutive times. However,
given the low incidence rate of false warnings (less than 10% at the highest noise setting in our
simulations) and that the warnings occurred for scenarios that were near collisions, the issue of
false warnings does not appear to be a severe concern for DSRC enabled collision warning
systems in rural overtaking settings. Of course, to the extent that sensor and estimation errors in
reality might be biased toward being conservative or optimistic, the predictions may also be
biased in the same manner.
6. CONCLUSIONS
Two-lane rural highways are locations of a disproportionately high number of fatal crashes. A
considerable number of these crashes occur during overtaking maneuvers, where vehicles
attempt to overtake slower moving vehicles ahead. A potential solution to enhance the safety of
rural highways is to utilize connected vehicle technologies such as dedicated short-range
communication (DSRC)-enabled collision warning systems to proactively predict and prevent
collisions in overtaking scenarios on two-lane highways. However, most existing studies use
such connected vehicle technologies in the context of urban driving situations such as urban
highway intersections.
24
The objective of this paper was to assess the effectiveness of a DSRC-enabled collision
warning system, called the overtaking assistant, devised for detecting unsafe overtaking
maneuvers on two-lane rural highways. Specifically, the paper examined the influence of
vehicular kinematics (vehicle speeds and accelerations and distances), driver behavior (drivers’
PR time), and DSRC performance characteristics (power settings, communication range, packet
errors, sensor errors, and estimation inaccuracy) on the effectiveness of DSRC systems in
predicting collisions in overtaking maneuvers. To this end, the paper utilized a microscopic
traffic simulator called vehicles in network simulation (Veins) that supports the simulation of
wireless communication protocols in vehicular ad-hoc networks (VANETs).
In this study, over 13,000 overtaking maneuvers – with over 10,000 collisions and 3,000
safe maneuvers – were simulated to consider heterogeneity in vehicular kinematics, driver
behavior, and DSRC performance. The overtaking assistant predicted collisions successfully for
70% of the simulated collisions and gave false collision warnings for less than 3% of simulated
safe maneuvers. A descriptive analysis followed by a multivariate analysis (using binary discrete
outcome models) of the simulated data reveal that the majority of collisions that could not be
detected were due to the passing and lead vehicles being out of communication range (2000ft)
when the passing vehicle started the overtaking maneuver (at least for the communication power
settings used in the simulation). These results suggest that a promising way forward to enhance
the effectiveness of DSRC devices for improving the safety of rural highway overtaking
maneuvers is by increasing their power settings to broaden the communication range.
Another notable result is that packet errors below 50% error rate did not have a
significant influence on the ability to detect collisions. This result points to how the
communication requirements of rural road overtaking scenarios might differ from those of urban
intersection scenarios with large traffic volumes where decreasing latency (or packet errors) and
relieving communication channel congestion might be a critical need. While still a factor,
channel congestion will not have the same magnitude in rural settings as in urban settings.
Furthermore, the rural road overtaking maneuver is very deliberate and allows a large span of
time in which communication can occur. However, even in rural road settings, latency may be a
key factor for other safety applications such as forward collision warning or emergency brake
warning.
25
Sensor error and estimation inaccuracies were found to increase the rate of false warnings
more than that of undetected collisions. However, since the incidence of false alarms was small
and that a majority of them occurred for scenarios that were near collisions, the issue of false
alarms does not appear to be a major concern in the case. It is important to note, however, that
any systematic biases in sensor and estimation errors, or systematic errors in the trajectory
prediction method, may increase the incidence of false alarms or undetected collisions in ways
not covered by this simulation.
This research may be improved in several directions. First, it would be useful to increase
the complexity of the simulated overtaking maneuvers to make them more representative of real-
life overtaking scenarios. This includes considering the traffic stream beyond the three vehicles
we simulated for each overtaking scenario. Second, considering systematic biases in sensor
errors and estimation inaccuracies that might occur in real-life collision warning systems will
enhance our understanding of the influence of such biases on collision warning systems. Third,
the analysis conducted in this study is based on simulated data, with assumptions drawn from the
literature and intuition to simulate overtaking maneuvers as realistically as possible. A similar
analysis with data collected from the field might help improve the assumptions made to simulate
the data. Finally, this paper focuses only on a collision warning system for overtaking maneuvers.
While it is useful to study such individual safety systems in isolation, it will become necessary to
analyze how the overtaking assistant we simulated (or any other advanced driver assistance
system) will interact with other increasingly prevalent collision warning systems. For instance, it
is important to consider a warning to avoid collision of the passing vehicle with the lead vehicle
(i.e., forward collision warning) while also avoiding the collision between the passing and
oncoming vehicles.
ACKNOWLEDGEMENTS
This research was supported by the U.S. Department of Transportation through the Data-
Supported Transportation Operations and Planning (D-STOP) Tier 1 University Transportation
Center, as well as by TxDOT project 0-6877 entitled “Communications and Radar-Supported
Transportation Operations and Planning (CAR-STOP)”. The authors would like to thank Patricia
Lavieri for her assistance with estimating the binary outcome models in Table 4. The authors are
grateful to Lisa Macias for her help in formatting this document.
26
REFERENCES
AASHTO Green Book (2004). A Policy on Geometric Design of Highways and Street. American Association of State Highway and Transportation Officials, Washington, D.C.
Abbas, T., Tufvesson, F., Karedal, J. (2012). Measurement based shadow fading model for vehicle-to-vehicle network simulations. arXiv preprint.
Analog Devices Inc. (2009). ADXL345 datasheet. http://www.analog.com/en/products/mems/mems-accelerometers/adxl345.html#product-overview.
Böhm, A., Jonsson, M., Uhlemann, E. (2011). Adaptive cooperative awareness messaging for enhanced overtaking assistance on rural roads. Proceedings of 2011 IEEE Vehicular Technology Conference Fall, San Francisco, CA, September.
Brooks, R.M. (2012). Acceleration characteristics of vehicles in rural Pennsylvania. ANALYSIS, 1(5), 5-22.
Delphi (2009). Delphi Electronically Scanning Radar (datasheet). http://delphi.com/docs/default-source/old-delphi-files/b87cda8b-468d-4f8e-a7a8-836c370fc2c2-pdf.
Espie, E., Guionneau, C., Wymann, B., Dimitrakakis, C., Coulom, R., Sumner, A. (2008). TORCS: the open racing car simulator.
Federal Highway Administration, 2015. Local and Rural Road Safety Program. Retrieved from http://safety.fhwa.dot.gov/local_rural/, July 30, 2015.
Ghaffari, A., Alimardani, F., Khodayari, A., Sadati, H. (2011, November). ANFIS based modeling for overtaking maneuver trajectory in motorcycles and autos. Proceedings of 2011 IEEE International Conference on Control System, Computing and Engineering (ICCSCE), November, 68-73.
Ghods, A.H., Saccomanno, F.F. (2011). A micro-simulation overtaking gap acceptance model for rural two-lane highways. In Canadian Institute of Transportation Engineers (CITE) Conference.
Ghods, A.H., Saccomanno, F., Guido, G. (2012). Effect of Car/Truck differential speed limits on two-lane highways safety operation using microscopic simulation. Procedia-Social and Behavioral Sciences, 53, 833-840.
Global Positioning System (GPS) Standard Positioning Service (SPS) Performance Analysis Report (2014). Federal Aviation Administration, Washington, D.C., 410.
Haas, J.J., Hu, Y.C. (2010). Communication requirements for crash avoidance. Proceedings of the seventh ACM international workshop on VehiculArInterNETworking, Chicago, IL, September.
Harwood, D.W., Gilmore, D.K., Richard K.R., Dunn, J.M, Sun, C. (2008). Passing sight distance criteria. National Cooperative Highway Research Program Report 605. Transportation Research Board, Washington D.C.
Hegeman, G., Brookhuis, K., Hoogendoorn, S. (2005). Opportunities of advanced driver assistance systems towards overtaking. European Journal of Transport and Infrastructure Research, 5(4), 281-196.
Hegeman, G., Tapani, A., Hoogendoorn, S. (2009). Overtaking assistant assessment using traffic simulation. Transportation Research Part C, 17(6), 617-630.
27
Huang, C.L., Fallah, Y.P., Sengupta, R., Krishnan, H. (2009). Information dissemination control for cooperative active safety applications in vehicular ad-hoc networks. Proceedings of GLOBECOM 2009: 2009 IEEE Global Telecommunications Conference, Honolulu, HI, November.
Joerer, S., Bloessl, B., Segata, M., Sommer, C., Cigno, R.L., Dressler, F. (2014a). Fairness kills safety: A comparative study for intersection assistance applications. Proceedings of 2014 IEEE 25th Annual International Symposium on Personal, Indoor, and Mobile Radio Communication (PIMRC), Washington D.C., September.
Joerer, S., Segata, M., Bloessl, B., Lo Cigno, R., Sommer, C., Dressler, F. (2014b). A vehicular networking perspective on estimating vehicle collision probability at intersections. IEEE Transactions on Vehicular Technology, 63(4), 1802-1812.
Kenney, J.B. (2011). Dedicated short-range communications (DSRC) standards in the United States. Proceedings of the IEEE, 99(7), 1162-1182.
Layton, R., Dixon, K. (2012). Stopping sight distance. Kiewit Center for Infrastructure and Transportation, Oregon Department of Transportation.
Mocsári, T. (2009). Analysis of the overtaking behaviour of motor vehicle drivers. Acta Technica Jaurinensis, 2(1), 97-106.
National Highway Traffic Safety Administration, 2014. Traffic Safety Facts: Rural/Urban Comparison. DOT HS 812 050, U.S. Department of Transportation, Washington DC, http://www-nrd.nhtsa.dot.gov/Pubs/812050.pdf.
National Motorists Association. (2014). State Speed Limit Chart. Retrieved from https://www.motorists.org/issues/speed-limits/state-chart, July 30, 2015.
Olaverri-Monreal, C., Gomes, P., Fernandes, R., Vieira, F., Ferreira, M. (2010). The See-Through System: A VANET-enabled assistant for overtaking maneuvers. Proceedings of 2010 IEEE Intelligent Vehicles Symposium (IV), San Diego, CA, June, pp. 123-128.
Petrov, P., Nashashibi, F. (2011). Planning and nonlinear adaptive control for an automated overtaking maneuver. Proceedings of 2011 14th International IEEE Conference on Intelligent Transportation Systems (ITSC), Washington, D.C., October, pp. 662-667.
Polus, A., Livneh, M., Frischer, B. (2000). Evaluation of the passing process on two-lane rural highways. Transportation Research Record: Journal of the Transportation Research Board, 1701, 53-60.
Rabadi, N.M., Mahmud, S.M. (2007). Performance evaluation of IEEE 802.11 a MAC protocol for vehicle intersection collision avoidance system. Proceedings of Consumer Communications and Networking Conference-CCNC 2007, Las Vegas, NV, January, pp. 54-58.
Sommer, C., German, R., Dressler, F. (2011). Bidirectionally coupled network and road traffic simulation for improved IVC analysis. IEEE Transactions on Mobile Computing, 10(1), 3-15.
Tapani, A. (2008). Traffic simulation modelling of rural roads and driver assistance systems. PhD dissertation, Department of Science and Technology, Linköping University.
28
United States Department of Transportation. (2015). Connected Vehicle Research in the United States. Office of the Assistant Secretary for Research and Technology (OST-R), Washington, D.C. Retrieved from http://www.its.dot.gov/connected_vehicle/connected_vehicle_research.htm, July 30, 2015.
Van Kooten, V. (2011). Feasibility Study: Advanced Co-operative Overtaking System using Vehicular Ad-Hoc Networks. MS Thesis, Faculty of Electrical Engineering, Math and Computer Science, University of Twente.
Velodyne (2016). HDL-64E High Definition Real Time 3D LIDAR (datasheet). http://velodynelidar.com/docs/datasheet/63-9194_Rev-D_HDL-64E_Data%20Sheet_Web.pdf.
Vieira, A.S., Celestino, J.C., Patel, A., Taghavi, M. (2013). Driver assistance system towards overtaking in vehicular ad hoc networks. Proceedings of AICT 2013: The Ninth Advanced International Conference on Telecommunications, Rome, Italy, June.
Wang, F., Yang, M., Yang, R. (2009). Conflict-probability-estimation-based overtaking for intelligent vehicles. IEEE Transactions on Intelligent Transportation Systems, 10(2), 366-370.
Wilson, T., Best, W. (1982, June). Driving strategies in overtaking. Accident Analysis and Prevention, 14(3), 179-185.
Yang, J., Wang, J., Liu, B. (2011). An intersection collision warning system using Wi-Fi smartphones in VANET. Proceedings of 2011 IEEE Global Telecommunications Conference (GLOBECOM 2011), Houston, TX, December.
Yu, Y., El Kamel, A., Gong, G. (2013). Modeling overtaking behavior in virtual reality traffic simulation system. Proceedings of 2013 9th Asian Control Conference (ASCC), Istanbul, Turkey, June.
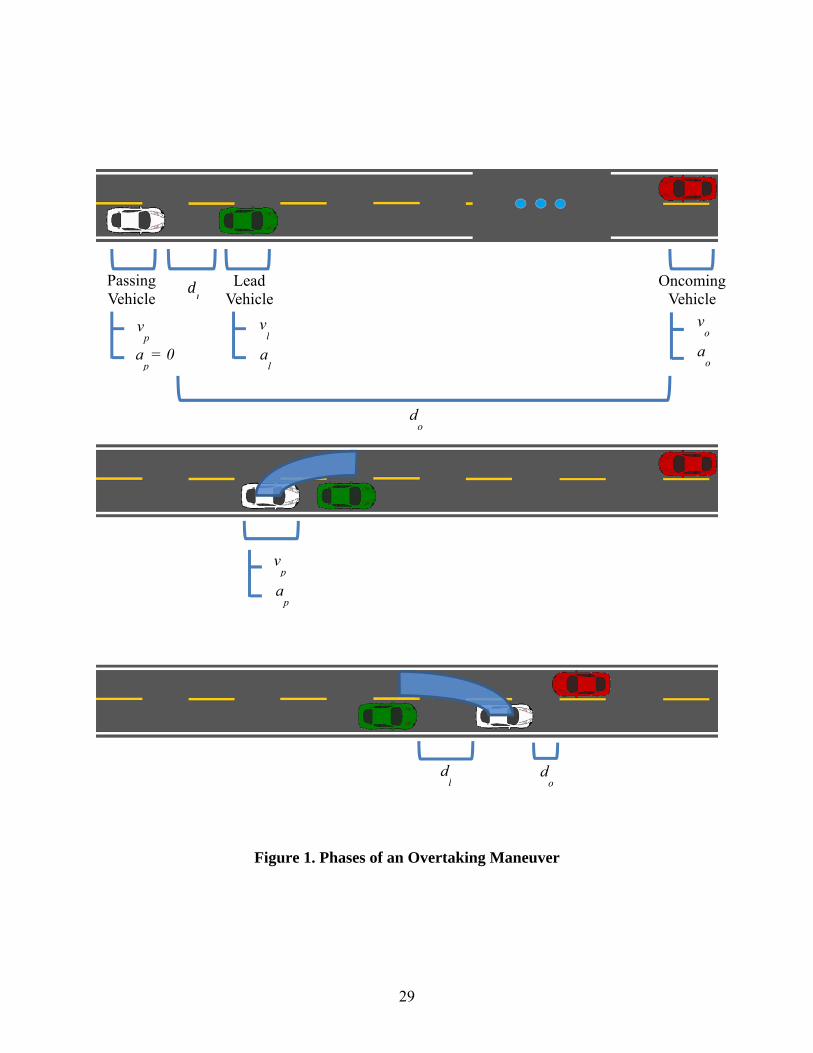
29
Figure 1. Phases of an Overtaking Maneuver
Passing Vehicle
Lead Vehicle
Oncoming Vehicle
dl
vp
ap
= 0
vl
al
vo
ao
vp
ap
do
dl d
o
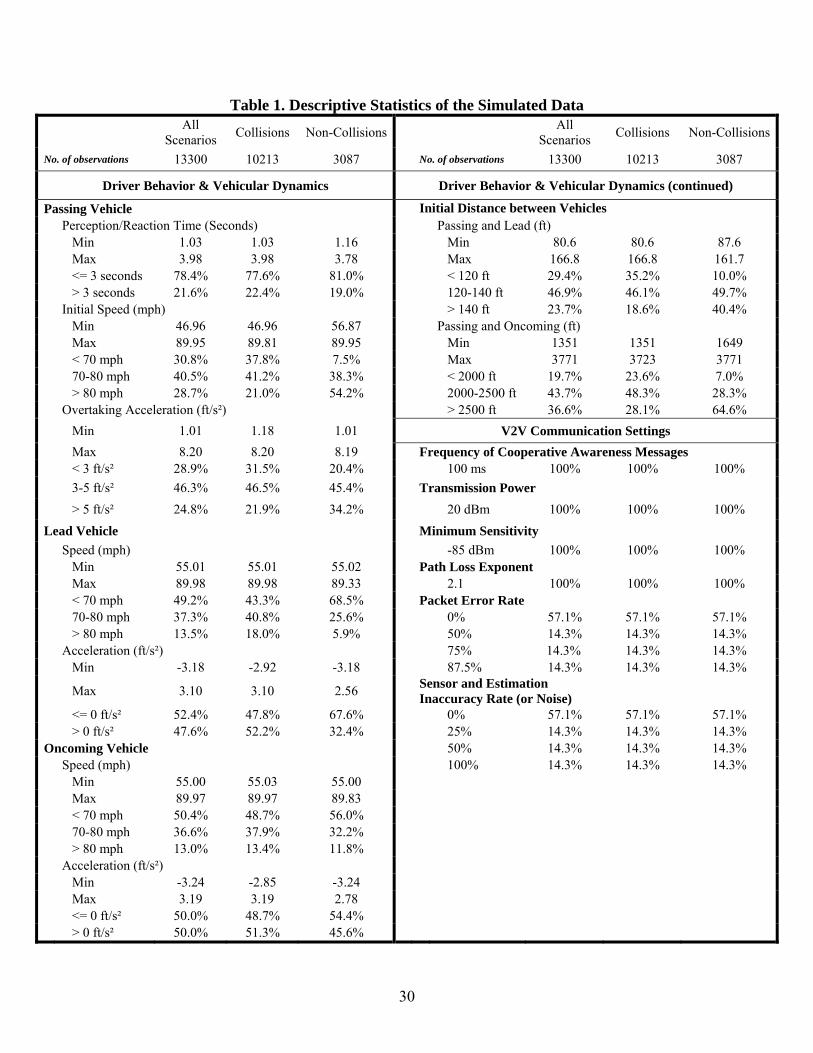
30
Table 1. Descriptive Statistics of the Simulated Data
All
Scenarios Collisions Non-Collisions
All
Scenarios Collisions Non-Collisions
No. of observations 13300 10213 3087 No. of observations 13300 10213 3087
Driver Behavior & Vehicular Dynamics Driver Behavior & Vehicular Dynamics (continued)
Passing Vehicle Initial Distance between Vehicles Perception/Reaction Time (Seconds) Passing and Lead (ft) Min 1.03 1.03 1.16 Min 80.6 80.6 87.6
Max 3.98 3.98 3.78 Max 166.8 166.8 161.7 <= 3 seconds 78.4% 77.6% 81.0% < 120 ft 29.4% 35.2% 10.0%
> 3 seconds 21.6% 22.4% 19.0% 120-140 ft 46.9% 46.1% 49.7% Initial Speed (mph) > 140 ft 23.7% 18.6% 40.4%
Min 46.96 46.96 56.87 Passing and Oncoming (ft) Max 89.95 89.81 89.95 Min 1351 1351 1649
< 70 mph 30.8% 37.8% 7.5% Max 3771 3723 3771 70-80 mph 40.5% 41.2% 38.3% < 2000 ft 19.7% 23.6% 7.0%
> 80 mph 28.7% 21.0% 54.2% 2000-2500 ft 43.7% 48.3% 28.3% Overtaking Acceleration (ft/s²) > 2500 ft 36.6% 28.1% 64.6%
Min 1.01 1.18 1.01 V2V Communication Settings
Max 8.20 8.20 8.19 Frequency of Cooperative Awareness Messages < 3 ft/s² 28.9% 31.5% 20.4% 100 ms 100% 100% 100%
3-5 ft/s² 46.3% 46.5% 45.4% Transmission Power
> 5 ft/s² 24.8% 21.9% 34.2% 20 dBm 100% 100% 100%
Lead Vehicle Minimum Sensitivity
Speed (mph) -85 dBm 100% 100% 100% Min 55.01 55.01 55.02 Path Loss Exponent Max 89.98 89.98 89.33 2.1 100% 100% 100%
< 70 mph 49.2% 43.3% 68.5% Packet Error Rate 70-80 mph 37.3% 40.8% 25.6% 0% 57.1% 57.1% 57.1%
> 80 mph 13.5% 18.0% 5.9% 50% 14.3% 14.3% 14.3% Acceleration (ft/s²) 75% 14.3% 14.3% 14.3%
Min -3.18 -2.92 -3.18 87.5% 14.3% 14.3% 14.3%
Max 3.10 3.10 2.56 Sensor and Estimation Inaccuracy Rate (or Noise)
<= 0 ft/s² 52.4% 47.8% 67.6% 0% 57.1% 57.1% 57.1% > 0 ft/s² 47.6% 52.2% 32.4% 25% 14.3% 14.3% 14.3%
Oncoming Vehicle 50% 14.3% 14.3% 14.3% Speed (mph) 100% 14.3% 14.3% 14.3%
Min 55.00 55.03 55.00 Max 89.97 89.97 89.83
< 70 mph 50.4% 48.7% 56.0% 70-80 mph 36.6% 37.9% 32.2%
> 80 mph 13.0% 13.4% 11.8% Acceleration (ft/s²)
Min -3.24 -2.85 -3.24 Max 3.19 3.19 2.78
<= 0 ft/s² 50.0% 48.7% 54.4% > 0 ft/s² 50.0% 51.3% 45.6%
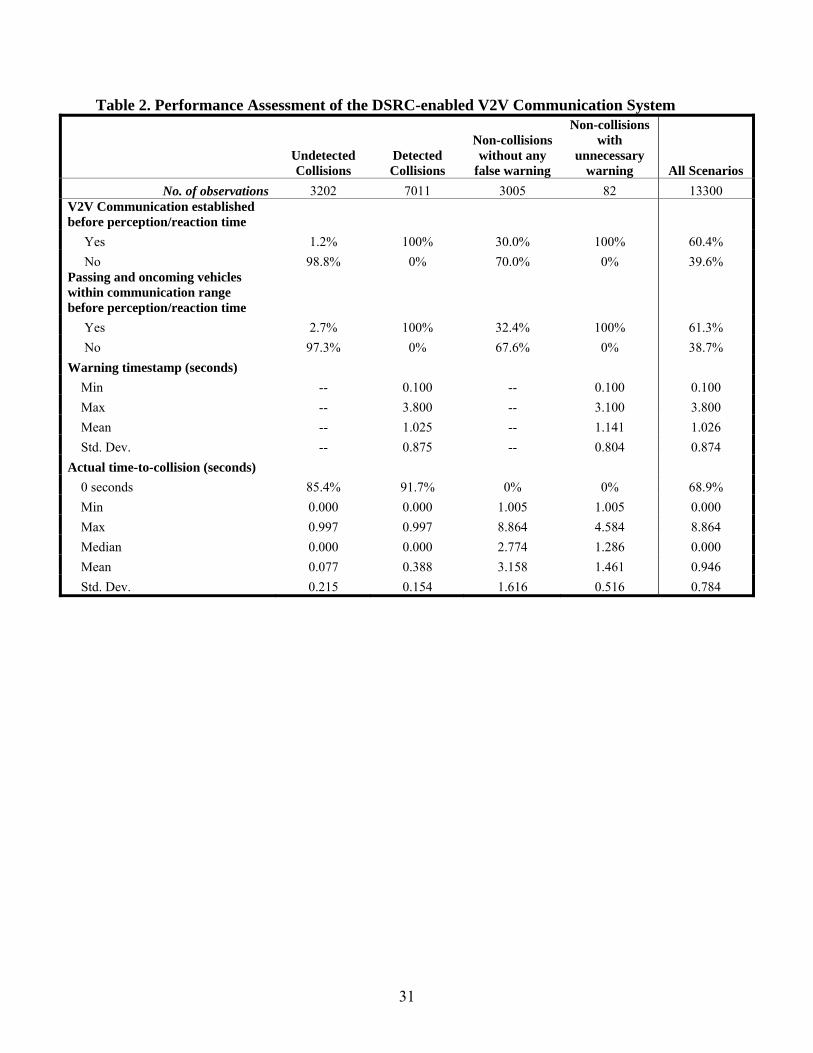
31
Table 2. Performance Assessment of the DSRC-enabled V2V Communication System
Undetected Collisions
Detected Collisions
Non-collisions without any
false warning
Non-collisions with
unnecessary warning All Scenarios
No. of observations 3202 7011 3005 82 13300 V2V Communication established before perception/reaction time
Yes 1.2% 100% 30.0% 100% 60.4%
No 98.8% 0% 70.0% 0% 39.6% Passing and oncoming vehicles within communication range before perception/reaction time
Yes 2.7% 100% 32.4% 100% 61.3%
No 97.3% 0% 67.6% 0% 38.7%
Warning timestamp (seconds)
Min -- 0.100 -- 0.100 0.100
Max -- 3.800 -- 3.100 3.800
Mean -- 1.025 -- 1.141 1.026
Std. Dev. -- 0.875 -- 0.804 0.874
Actual time-to-collision (seconds)
0 seconds 85.4% 91.7% 0% 0% 68.9%
Min 0.000 0.000 1.005 1.005 0.000
Max 0.997 0.997 8.864 4.584 8.864
Median 0.000 0.000 2.774 1.286 0.000
Mean 0.077 0.388 3.158 1.461 0.946
Std. Dev. 0.215 0.154 1.616 0.516 0.784
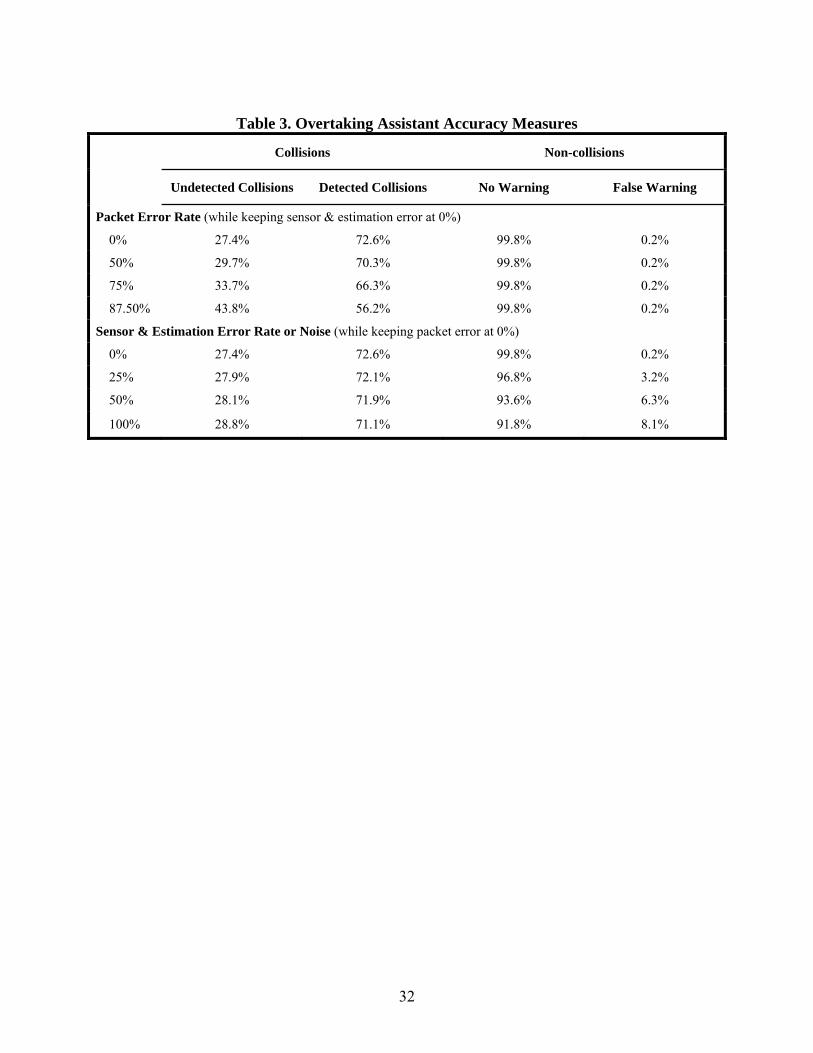
32
Table 3. Overtaking Assistant Accuracy Measures
Collisions Non-collisions
Undetected Collisions Detected Collisions No Warning False Warning
Packet Error Rate (while keeping sensor & estimation error at 0%)
0% 27.4% 72.6% 99.8% 0.2%
50% 29.7% 70.3% 99.8% 0.2%
75% 33.7% 66.3% 99.8% 0.2%
87.50% 43.8% 56.2% 99.8% 0.2%
Sensor & Estimation Error Rate or Noise (while keeping packet error at 0%)
0% 27.4% 72.6% 99.8% 0.2%
25% 27.9% 72.1% 96.8% 3.2%
50% 28.1% 71.9% 93.6% 6.3%
100% 28.8% 71.1% 91.8% 8.1%
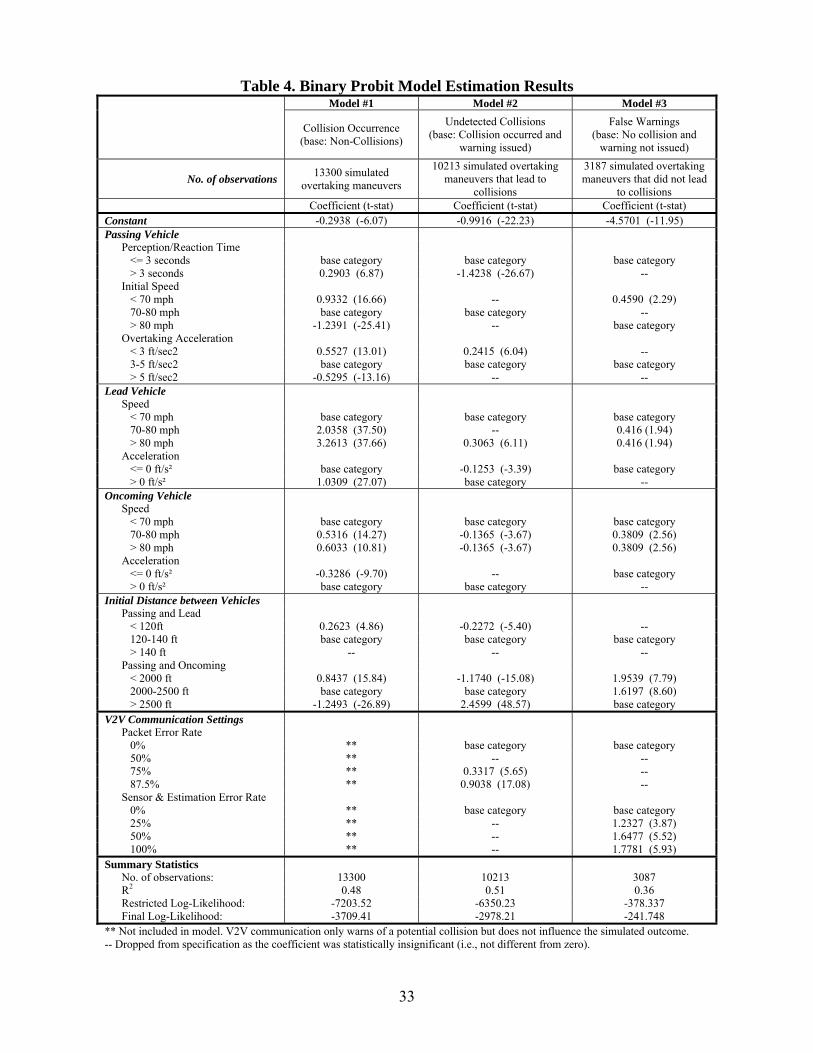
33
Table 4. Binary Probit Model Estimation ResultsModel #1 Model #2 Model #3
Collision Occurrence
(base: Non-Collisions)
Undetected Collisions (base: Collision occurred and
warning issued)
False Warnings (base: No collision and
warning not issued)
No. of observations 13300 simulated
overtaking maneuvers
10213 simulated overtaking maneuvers that lead to
collisions
3187 simulated overtaking maneuvers that did not lead
to collisions Coefficient (t-stat) Coefficient (t-stat) Coefficient (t-stat) Constant -0.2938 (-6.07) -0.9916 (-22.23) -4.5701 (-11.95) Passing Vehicle
Perception/Reaction Time <= 3 seconds base category base category base category > 3 seconds 0.2903 (6.87) -1.4238 (-26.67) -- Initial Speed < 70 mph 0.9332 (16.66) -- 0.4590 (2.29) 70-80 mph base category base category -- > 80 mph -1.2391 (-25.41) -- base category Overtaking Acceleration < 3 ft/sec2 0.5527 (13.01) 0.2415 (6.04) -- 3-5 ft/sec2 base category base category base category > 5 ft/sec2 -0.5295 (-13.16) -- --
Lead Vehicle Speed < 70 mph base category base category base category 70-80 mph 2.0358 (37.50) -- 0.416 (1.94) > 80 mph 3.2613 (37.66) 0.3063 (6.11) 0.416 (1.94) Acceleration <= 0 ft/s² base category -0.1253 (-3.39) base category > 0 ft/s² 1.0309 (27.07) base category --
Oncoming Vehicle Speed < 70 mph base category base category base category 70-80 mph 0.5316 (14.27) -0.1365 (-3.67) 0.3809 (2.56) > 80 mph 0.6033 (10.81) -0.1365 (-3.67) 0.3809 (2.56) Acceleration <= 0 ft/s² -0.3286 (-9.70) -- base category > 0 ft/s² base category base category --
Initial Distance between Vehicles Passing and Lead < 120ft 0.2623 (4.86) -0.2272 (-5.40) -- 120-140 ft base category base category base category > 140 ft -- -- -- Passing and Oncoming < 2000 ft 0.8437 (15.84) -1.1740 (-15.08) 1.9539 (7.79) 2000-2500 ft base category base category 1.6197 (8.60) > 2500 ft -1.2493 (-26.89) 2.4599 (48.57) base category
V2V Communication Settings Packet Error Rate 0% ** base category base category 50% ** -- -- 75% ** 0.3317 (5.65) -- 87.5% ** 0.9038 (17.08) -- Sensor & Estimation Error Rate 0% ** base category base category 25% ** -- 1.2327 (3.87) 50% ** -- 1.6477 (5.52) 100% ** -- 1.7781 (5.93)
Summary Statistics No. of observations: 13300 10213 3087
R2 0.48 0.51 0.36 Restricted Log-Likelihood: -7203.52 -6350.23 -378.337
Final Log-Likelihood: -3709.41 -2978.21 -241.748 ** Not included in model. V2V communication only warns of a potential collision but does not influence the simulated outcome. -- Dropped from specification as the coefficient was statistically insignificant (i.e., not different from zero).