Embed Size (px)
Citation preview
International Journal of Engineering and Management Sciences (IJEMS) Vol. 5. (2020). No. 2
DOI: 10.21791/IJEMS.2020.2.35.
309
Vehicle Dynamic Simulation Possibilities Using AVL
Cruise M
D. NEMES, T. PÁLFI, S. HAJDU
University of Debrecen, Faculty of Engineering, Department of Mechanical Engineering
Abstract. In most cases, when creating vehicle dynamics simulations, we need software that can speed up model
creation and simulation. There are many programs on the market for this purpose, but they have different
knowledge and user interfaces. We present in this article briefly introduces the use of one of the market's leading
vehicle simulation software, the AVL Cruise M.
Introduction
Simulation software has been playing an important role in the automotive industry for decades, in our
days it has become one of the indispensable tools of development, and there is almost no development
range where don’t used simulation software. We can significantly reduce development time and cost
[1],[2][3][4][5]. In this article, we would like to introduce the simulation capabilities and use of AVL
Cruise M software, a product of one of the world's largest companies developing propulsion systems
[6][7].
In addition to the vehicle industry, AVL Cruise software is used by many research teams and
knowledge centers. In this chapter, we will briefly present the potential of the software through their
research.
The research of Hungarian universities focused on the comparison of different hybrid drive line. The
[8] This article investigates the fuel consumption and emissions of different drives based on different
driving cycles. The [10] study, supplementing the previous one, deals with the selection of the drive
line according to the application requirements.
Researchers at a university in Romania have converted and tested an internal combustion engine
driven car into an AVL environment [11].
We can be used to select gear ratios [12],[13][14], and optimizing gear selection strategies for
adaptive transmissions [15][16][17][18] or to align the engine with the transmission [19],[20].
Several studies focus on driving chain analysis based on different driving cycles [21][22][23][24][25],
and comparison of driving cycles [21][26][27][28]. We can simulate consumption in different traffic
situations [3][13][24][29]. The most important goal of development today is to reduce of the CO2
emissions [23][30][31][32][33][34][35][36][16] or reduction of harmful substances [37]. This can be
done by selecting an optimal driveline [12][38][39][40] or by upgrading an existing one
International Journal of Engineering and Management Sciences (IJEMS) Vol. 5. (2020). No. 2
DOI: 10.21791/IJEMS.2020.2.35.
310
[14][41][42][43]. Other researchers have investigated the possibility of reducing torsional vibrations
[44], or reducing the noise of driveline [45] studied with the program.
1. The structure of the program
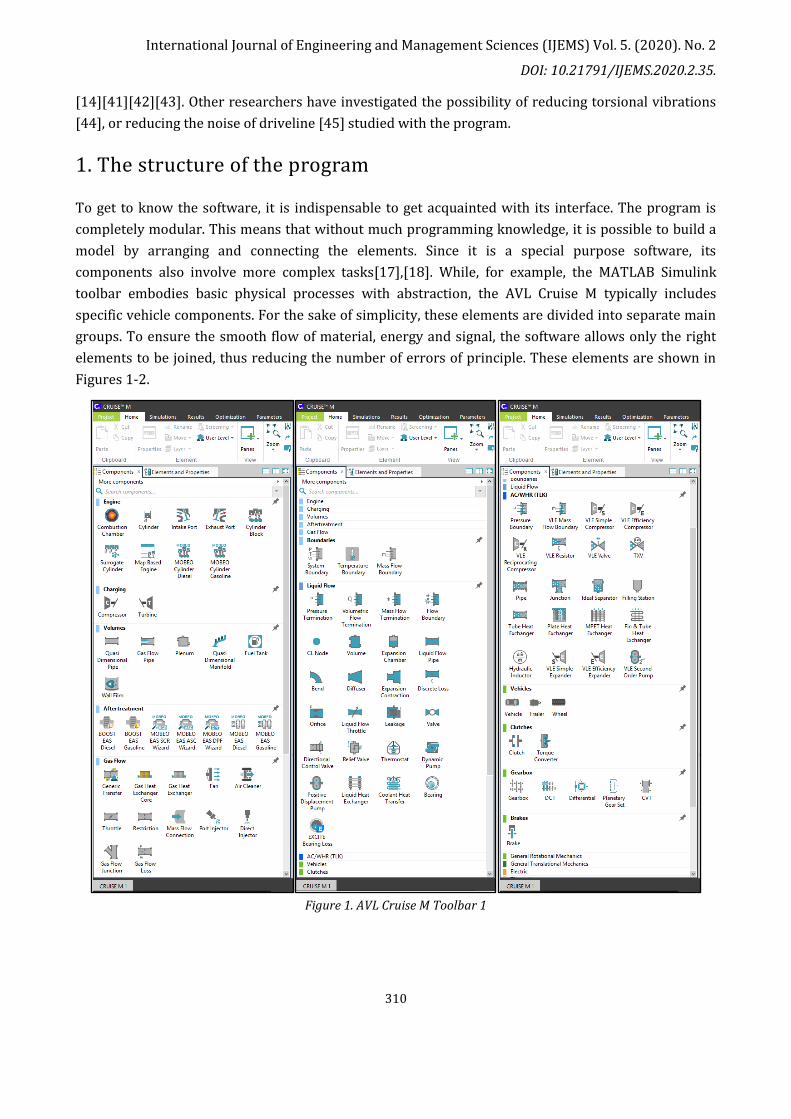
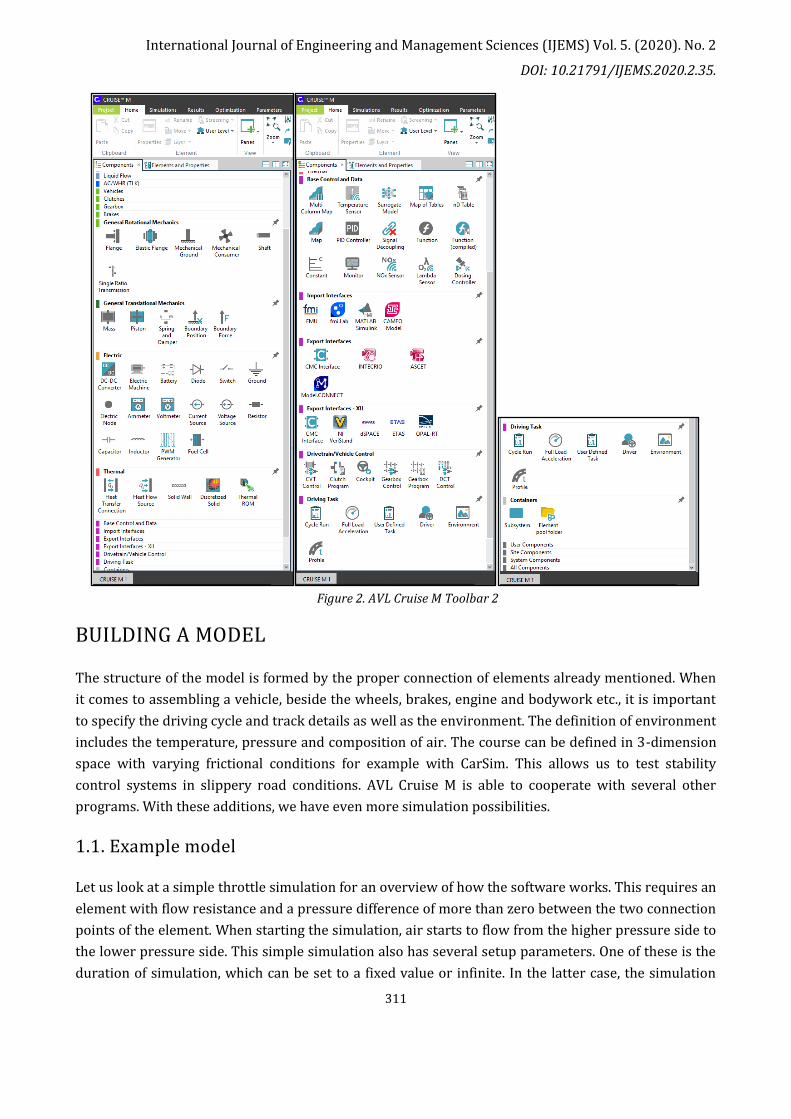
To get to know the software, it is indispensable to get acquainted with its interface. The program is
completely modular. This means that without much programming knowledge, it is possible to build a
model by arranging and connecting the elements. Since it is a special purpose software, its
components also involve more complex tasks[17],[18]. While, for example, the MATLAB Simulink
toolbar embodies basic physical processes with abstraction, the AVL Cruise M typically includes
specific vehicle components. For the sake of simplicity, these elements are divided into separate main
groups. To ensure the smooth flow of material, energy and signal, the software allows only the right
elements to be joined, thus reducing the number of errors of principle. These elements are shown in
Figures 1-2.
Figure 1. AVL Cruise M Toolbar 1
International Journal of Engineering and Management Sciences (IJEMS) Vol. 5. (2020). No. 2
DOI: 10.21791/IJEMS.2020.2.35.
311
Figure 2. AVL Cruise M Toolbar 2
BUILDING A MODEL
The structure of the model is formed by the proper connection of elements already mentioned. When
it comes to assembling a vehicle, beside the wheels, brakes, engine and bodywork etc., it is important
to specify the driving cycle and track details as well as the environment. The definition of environment
includes the temperature, pressure and composition of air. The course can be defined in 3-dimension
space with varying frictional conditions for example with CarSim. This allows us to test stability
control systems in slippery road conditions. AVL Cruise M is able to cooperate with several other
programs. With these additions, we have even more simulation possibilities.
1.1. Example model
Let us look at a simple throttle simulation for an overview of how the software works. This requires an
element with flow resistance and a pressure difference of more than zero between the two connection
points of the element. When starting the simulation, air starts to flow from the higher pressure side to
the lower pressure side. This simple simulation also has several setup parameters. One of these is the
duration of simulation, which can be set to a fixed value or infinite. In the latter case, the simulation
International Journal of Engineering and Management Sciences (IJEMS) Vol. 5. (2020). No. 2
DOI: 10.21791/IJEMS.2020.2.35.
312
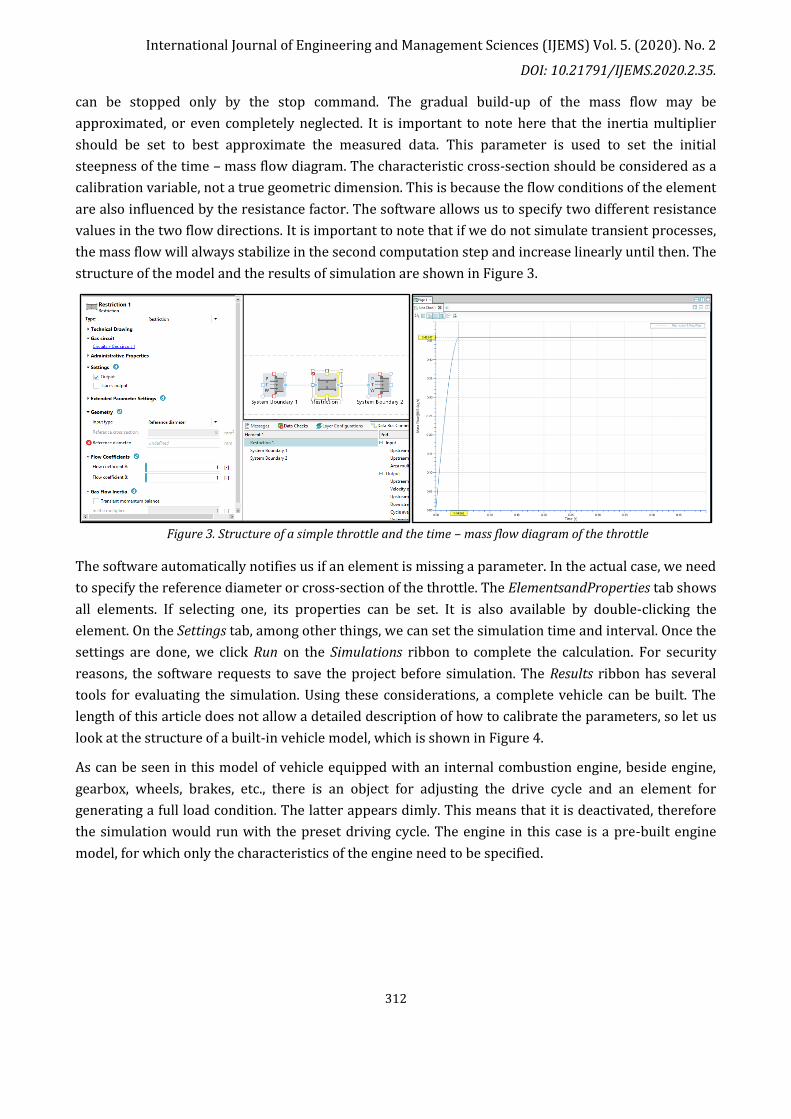
can be stopped only by the stop command. The gradual build-up of the mass flow may be
approximated, or even completely neglected. It is important to note here that the inertia multiplier
should be set to best approximate the measured data. This parameter is used to set the initial
steepness of the time – mass flow diagram. The characteristic cross-section should be considered as a
calibration variable, not a true geometric dimension. This is because the flow conditions of the element
are also influenced by the resistance factor. The software allows us to specify two different resistance
values in the two flow directions. It is important to note that if we do not simulate transient processes,
the mass flow will always stabilize in the second computation step and increase linearly until then. The
structure of the model and the results of simulation are shown in Figure 3.
Figure 3. Structure of a simple throttle and the time – mass flow diagram of the throttle
The software automatically notifies us if an element is missing a parameter. In the actual case, we need
to specify the reference diameter or cross-section of the throttle. The ElementsandProperties tab shows
all elements. If selecting one, its properties can be set. It is also available by double-clicking the
element. On the Settings tab, among other things, we can set the simulation time and interval. Once the
settings are done, we click Run on the Simulations ribbon to complete the calculation. For security
reasons, the software requests to save the project before simulation. The Results ribbon has several
tools for evaluating the simulation. Using these considerations, a complete vehicle can be built. The
length of this article does not allow a detailed description of how to calibrate the parameters, so let us
look at the structure of a built-in vehicle model, which is shown in Figure 4.
As can be seen in this model of vehicle equipped with an internal combustion engine, beside engine,
gearbox, wheels, brakes, etc., there is an object for adjusting the drive cycle and an element for
generating a full load condition. The latter appears dimly. This means that it is deactivated, therefore
the simulation would run with the preset driving cycle. The engine in this case is a pre-built engine
model, for which only the characteristics of the engine need to be specified.

International Journal of Engineering and Management Sciences (IJEMS) Vol. 5. (2020). No. 2
DOI: 10.21791/IJEMS.2020.2.35.
313
Figure 4. Example vehicle structure
Detailed description of example model Elements
1.2. Wheels
The dynamic modeling of the wheels can be simplified with the simple Coulomb friction model and the
moment of inertia of the wheel. Measurements show that the frictional force between the wheel and
the road is also highly dependent on tire pressure, radius and width. For the sake of completeness of
the dynamic model, the wheel’s rolling resistance is also need to be considered. For modeling a wheel,
the Pacejka tire model is generally applied. Since Cruise M calculates from measurement data, it
defines the characteristics of the wheel also with characteristic curves and constants. An example of
this is shown in Figure 5.
Figure 5. Data of wheel model
International Journal of Engineering and Management Sciences (IJEMS) Vol. 5. (2020). No. 2
DOI: 10.21791/IJEMS.2020.2.35.
314
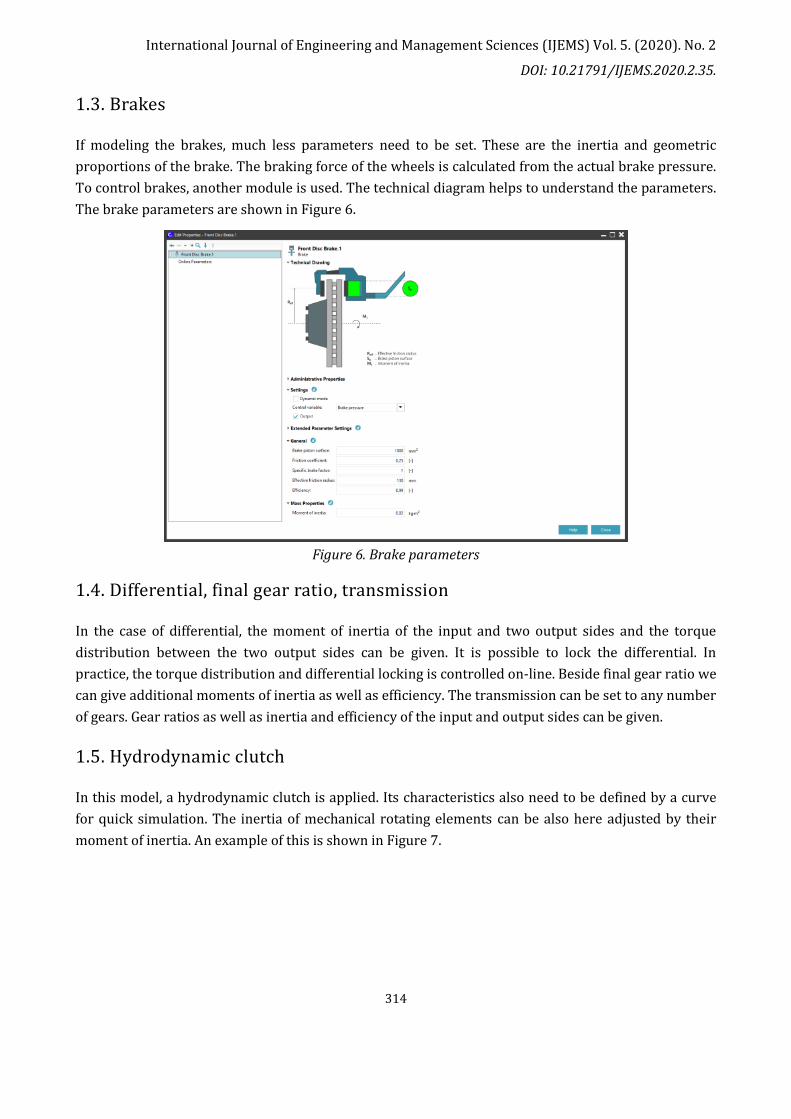
1.3. Brakes
If modeling the brakes, much less parameters need to be set. These are the inertia and geometric
proportions of the brake. The braking force of the wheels is calculated from the actual brake pressure.
To control brakes, another module is used. The technical diagram helps to understand the parameters.
The brake parameters are shown in Figure 6.
Figure 6. Brake parameters
1.4. Differential, final gear ratio, transmission
In the case of differential, the moment of inertia of the input and two output sides and the torque
distribution between the two output sides can be given. It is possible to lock the differential. In
practice, the torque distribution and differential locking is controlled on-line. Beside final gear ratio we
can give additional moments of inertia as well as efficiency. The transmission can be set to any number
of gears. Gear ratios as well as inertia and efficiency of the input and output sides can be given.
1.5. Hydrodynamic clutch
In this model, a hydrodynamic clutch is applied. Its characteristics also need to be defined by a curve
for quick simulation. The inertia of mechanical rotating elements can be also here adjusted by their
moment of inertia. An example of this is shown in Figure 7.
International Journal of Engineering and Management Sciences (IJEMS) Vol. 5. (2020). No. 2
DOI: 10.21791/IJEMS.2020.2.35.
315
Figure 7. Hydrodynamic clutch characteristic curve
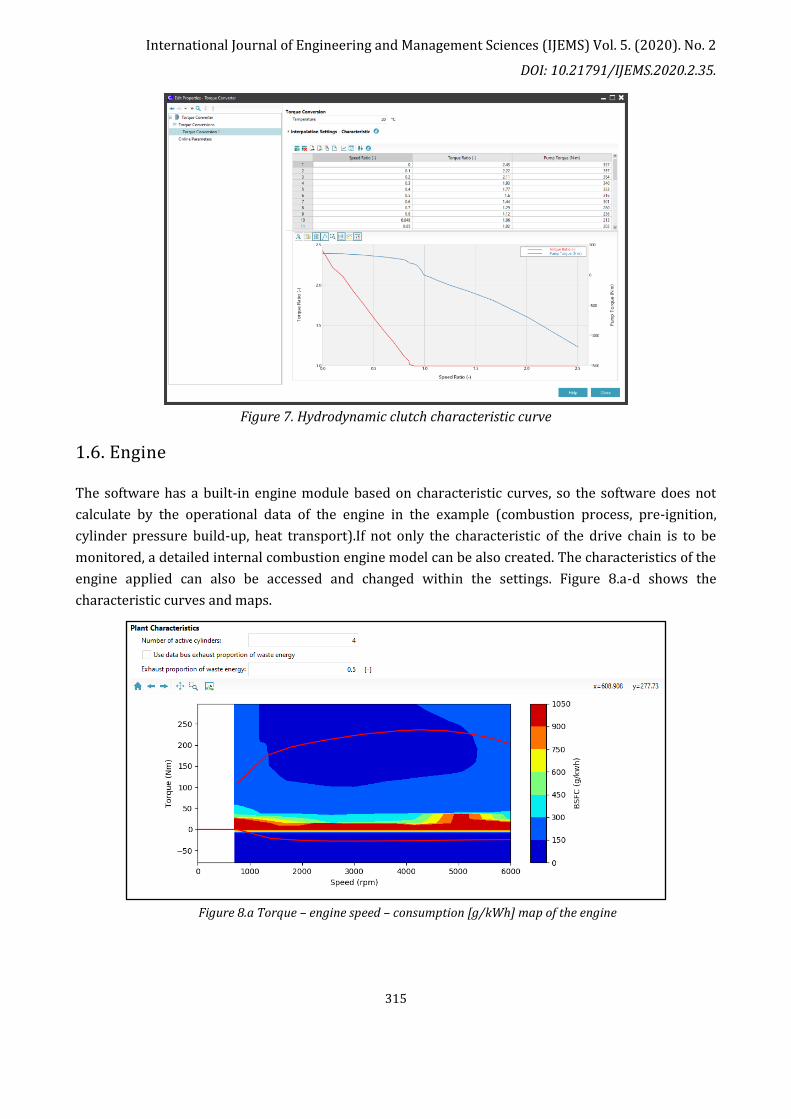
1.6. Engine
The software has a built-in engine module based on characteristic curves, so the software does not
calculate by the operational data of the engine in the example (combustion process, pre-ignition,
cylinder pressure build-up, heat transport).If not only the characteristic of the drive chain is to be
monitored, a detailed internal combustion engine model can be also created. The characteristics of the
engine applied can also be accessed and changed within the settings. Figure 8.a-d shows the
characteristic curves and maps.
Figure 8.a Torque – engine speed – consumption [g/kWh] map of the engine

International Journal of Engineering and Management Sciences (IJEMS) Vol. 5. (2020). No. 2
DOI: 10.21791/IJEMS.2020.2.35.
316
Figure 8.b-c Engine brake and full load torque curves
Figure 8.d Engine speed – torque – consumption [kg/s] map of the engine

International Journal of Engineering and Management Sciences (IJEMS) Vol. 5. (2020). No. 2
DOI: 10.21791/IJEMS.2020.2.35.
317
1.7. Vehicle
Modeling the weight of a vehicle requires the mass of the passengers and fuel to be considered. These
masses influence the overall driving dynamics. The vehicle parameters are shown in Figure 11-12.
Figure 11. Technical scheme of vehicle setup
Figure 12. Vehicle parameters
1.8. Control
In control settings, characteristic curves of brake pedal and accelerator pedal can be defined, too.
Automatic transmission shifting periods are given by limits, but we have the possibility to apply a
complex control strategy. In today’s modern vehicles, this is a combination of a genetic algorithm and a
program based on Fuzzy logic.
1.9. Driving cycle
When creating a driving cycle, the relevant data are often only the change of road surface elevation
and the change of the desired speeds over time. The driving cycle in the example is shown in Figure 13.
The most simulated and measured data are emissions, fuel consumption and efficiency. These also
significantly depend on the driver. In this case, the driver is a PI controller. The driving style – peaceful
or aggressive – can be defined by adjusting the parameters of the controller. Within the driving cycle,

International Journal of Engineering and Management Sciences (IJEMS) Vol. 5. (2020). No. 2
DOI: 10.21791/IJEMS.2020.2.35.
318
we can set variable environment parameters. This is very useful when the composition, temperature
and humidity of air changes due to the changing terrain. In the example simulation, these are given
with constant values.
Figure 13. Driving cycle
1.10.Results of simulation
During simulation it is possible to monitor the evolution of the parameters in graphs, tables and
displays. An example of this is shown in Figure 14.
Figure 14. Displaying results during simulation

International Journal of Engineering and Management Sciences (IJEMS) Vol. 5. (2020). No. 2
DOI: 10.21791/IJEMS.2020.2.35.
319
The results can be evaluated and exported on the Results tab. This is illustrated in Figure 15.
Figure 15. Displaying results on the Results tab
It can be seen in the figure that a 200 seconds simulation of a model of this complexity ran in just over
a second on an average computer. This is due to the fact that the model bases the characteristics of the
elements on measurement curves and maps. If simulating the internal combustion engine in more
detail in the model, the simulation of heat flows and air flows requires high computing power, but it is
much faster than any other model based on mathematical calculations.
Conclusion
The model above perfectly reflects the Cruise M’s zero-dimensional simulation system, where complex
processes are not modeled with calculations or in 3-dimension space, but data are extracted from
characteristic curves and then they are compared. At a given vehicle weight, speed and accelerator
pedal position, the power of the engine can be read from the engine’s characteristic curves. From this,
the torque accelerating the drivetrain can be determined. We can then calculate the acceleration force
of the vehicle from the inertia values of the drivetrain and the grip characteristics of the tire. It follows
that the creation of an accurate vehicle model requires many measured data and calibration. After
adequate measurements and calibrations, various configurations can be properly modeled.
Acknowledgements
The research was financed by the Thematic Excellence Programme of the Ministry for Innovation and
Technology in Hungary (ED_18-1-2019-0028), within the framework of the (Automotive Industry)
thematic programme of the University of Debrecen.
The paper is made by the support of “AVL Advanced Simulation Technologies University Partnership
Program”.

International Journal of Engineering and Management Sciences (IJEMS) Vol. 5. (2020). No. 2
DOI: 10.21791/IJEMS.2020.2.35.
320
References
[1] W. Hasewend, “AVL CRUISE – Driving Performance and,” ATZ worlwide, vol. 103, no. 5, pp. 10–
13, 2001.
[2] A. Iorga, “Road vehicle simulation using AVL Cruise,” no. 25, 2016.
[3] F. O. F. Mechanics, “Simulation of a Passenger Car Performance and Emissions Using the Avl-
Cruise Software,” pp. 95–98, 2011.
[4] AVL - Advanced Simulation Technologies, “Cruise vehicle system analysis, AVL Cruise - Vehicle
System and Driveline Analysis, AVL Product description,” 2009.
[5] S. A. Evangelou and W. Shabbir, “Dynamic modeling platform for series hybrid electric vehicles,”
IFAC-PapersOnLine, vol. 49, no. 11, pp. 533–540, 2016, doi: 10.1016/j.ifacol.2016.08.078.
[6] W. Hasewend, “Avl Cruise,” ATZ - Automob. Zeitschrift, vol. 103, no. 5, pp. 382–392, 2001, doi:
10.1007/bf03224378.
[7] AVL, “AVL PRODUCT DESCRIPTION CRUISE,” Graz, 2009.
[8] Bári Gergyely - Varga Dávid - Kocsis Bence - Trencséni Balázs - Dr. Ailer Piroska, “Hibrid-
elektromos hajtáslánc koncepciók összevetése objektív szempontok alapján,” Jövő járműve, pp.
46–52, 2014.
[9] R. Y. Ilimbetov, V. V. Popov, and A. G. Vozmilov, “Comparative analysis of ‘NGTU - Electro’
electric car movement processes modeling in MATLAB Simulink and AVL Cruise software,”
Procedia Eng., vol. 129, pp. 879–885, 2015, doi: 10.1016/j.proeng.2015.12.117.
[10] Varga Dávid - Kocsis Bence - Trencséni Balázs - Dr. Ailer Piroska, “Hibrid‒elektromos hajtáslánc
koncepciók szubjektív tulajdonságai,” Jövő járműve, pp. 82–87, 2014.
[11] C. C. Cioroianu, D. G. Marinescu, A. Iorga, and A. R. Sibiceanu, “Simulation of an electric vehicle
model on the new WLTC test cycle using AVL CRUISE software,” IOP Conf. Ser. Mater. Sci. Eng.,
vol. 252, no. 1, p. 012060, Oct. 2017, doi: 10.1088/1757-899X/252/1/012060.
[12] J. Ma, “Parameter optimal design and Simulation of Power System of Electric Vehicle Based on
AVL-CRUISE,” J. Phys. Conf. Ser., vol. 1187, no. 3, 2019, doi: 10.1088/1742-
6596/1187/3/032029.
[13] Y. Yang, H. Zhao, and H. Jiang, “Drive train design and modeling of a parallel diesel hybrid
electric bus based on AVL/cruise,” EVS 2010 - Sustain. Mobil. Revolut. 25th World Batter. Hybrid
Fuel Cell Electr. Veh. Symp. Exhib., vol. 4, pp. 75–81, 2010.
[14] J. Soldo, V. Ranogajec, B. Škugor, and J. Deur, “AVL CRUISE Model-based Optimisation of Shift
Scheduling Maps for a Parallel Hybrid Electric Vehicle,” AVL Int. Simul. Conf. 2017, 2017.
[15] E. Kural and B. A. Güvenç, “Integrated Adaptive Cruise Control for parallel hybrid vehicle energy
management,” IFAC-PapersOnLine, vol. 28, no. 15, pp. 313–319, 2015, doi:

International Journal of Engineering and Management Sciences (IJEMS) Vol. 5. (2020). No. 2
DOI: 10.21791/IJEMS.2020.2.35.
321
10.1016/j.ifacol.2015.10.045.
[16] C. Geng, X. Jin, and X. Zhang, “Simulation research on a novel control strategy for fuel cell
extended-range vehicles,” Int. J. Hydrogen Energy, pp. 408–420, 2019, doi:
10.1016/j.ijhydene.2018.04.038.
[17] M. A. Naya, D. Dopico, J. A. Perez, and J. Cuadrado, “Real-time multi-body formulation for virtual-
reality-based design and evaluation of automobile controllers,” Proc. Inst. Mech. Eng. Part K J.
Multi-body Dyn., vol. 221, no. 2, pp. 261–276, Jun. 2007, doi: 10.1243/1464419JMBD74.
[18] Z. Kong, D. Pi, X. Wang, H. Wang, and S. Chen, “Design and Evaluation of a Hierarchical Control
Algorithm for an Electric Active Stabilizer Bar System,” Strojniški Vestn. - J. Mech. Eng., vol. 62,
no. 10, pp. 565–576, Oct. 2016, doi: 10.5545/sv-jme.2016.3381.
[19] F. Du, Z. W. Guan, C. H. Liu, and Y. S. Wan, “Matching research between engine and transmission
of vehicle based on AVL-Cruise,” in Proceedings of the 2015 International Conference on Power
Electronics and Energy Engineering, 2015, no. Peee, pp. 89–92, doi: 10.2991/peee-15.2015.24.
[20] L. Mihon, A. Negoitescu, A. Tokar, and D. Ostoia, “Motor and Vehicle Optimization Process
Modeling By Using the Avl Cruise in Standard,” Ann. Fac. Eng. Hunedoara - Int. J. Eng., pp. 83–86,
2011.
[21] A. R. SIBICEANU, A. IORGA, V. NICOLAE, D. G. MARINESCU, and C. CIOROIANU, “Considerations
on adapting the new WLTC test cycle for a conventional powertrain to a computerized
simulation using AVL Cruise software,” Univ. Pitesti. Sci. Bull. - Automot. Ser., vol. 28, no. 1, Jan.
2018, doi: 10.26825/bup.ar.2018.003.
[22] G. Canbolat and H. Yaşar, “Performance Comparison for Series and Parallel Modes of a Hybrid
Electric Vehicle,” Sak. Univ. J. Sci., vol. 23, no. 38708, pp. 1–1, 2019, doi:
10.16984/saufenbilder.369149.
[23] A. C. R. Teixeira and J. R. Sodré, “Impacts of replacement of engine powered vehicles by electric
vehicles on energy consumption and CO2 emissions,” Transp. Res. Part D Transp. Environ., vol.
59, pp. 375–384, 2018, doi: 10.1016/j.trd.2018.01.004.
[24] D. R. Zamora, J. M. L. Martínez, C. J. L. Carrasco, and J. J. D. Vaca, “Development of an in-series
hybrid urban bus model and its correlation with on-board testing results,” World Electr. Veh. J.,
vol. 6, no. 2, pp. 405–415, 2013, doi: 10.3390/wevj6020405.
[25] F. Um, M. Allah, M. Bica, and D. Tutunea, “Analysis of Range Extended Hybrid Vehicle with
Rotary Internal Combustion Engine Using AVL Cruise,” pp. 217–224, 2019, doi: 10.1007/978-3-
319-94409-8.
[26] A. Dimaratos, D. Tsokolis, G. Fontaras, S. Tsiakmakis, B. Ciuffo, and Z. Samaras, “Comparative
Evaluation of the Effect of Various Technologies on Light-duty Vehicle CO2 Emissions over
NEDC and WLTP,” Transp. Res. Procedia, vol. 14, pp. 3169–3178, 2016, doi:
10.1016/j.trpro.2016.05.257.
[27] B. Ciuffo and G. Fontaras, “Models and scientific tools for regulatory purposes: The case of CO2
International Journal of Engineering and Management Sciences (IJEMS) Vol. 5. (2020). No. 2
DOI: 10.21791/IJEMS.2020.2.35.
322
emissions from light duty vehicles in Europe,” Energy Policy, vol. 109, no. November 2016, pp.
76–81, 2017, doi: 10.1016/j.enpol.2017.06.057.
[28] V. Co, “Comparative Evaluation of the Effect of Various Technologies on Light-duty Comparative
evaluation of the effect of various technologies on light-duty vehicle CO 2 emissions over NEDC
and WLTP,” Transp. Res. Procedia, vol. 14, no. July, pp. 3169–3178, 2016, doi:
10.1016/j.trpro.2016.05.257.
[29] A. Iorga, “VEHICLE MODEL SERIES WITH HYBRID,” no. 25, 2016.
[30] K. Liu et al., “Effect of asynchronous valve timing on combustion characteristic and performance
of a high speed SI marine engine with five valves,” Energy Convers. Manag., vol. 123, pp. 185–
199, 2016, doi: 10.1016/j.enconman.2016.06.042.
[31] Q. Zhang, N. Cui, K. Li, Y. Shang, and C. Zhang, “Co-simulation of energy management strategy for
hybrid electric vehicle in AVL InMotion,” Proc. - 2017 Chinese Autom. Congr. CAC 2017, vol. 2017-
Janua, no. April 2019, pp. 4932–4937, 2017, doi: 10.1109/CAC.2017.8243653.
[32] B. Wahono, W. B. Santoso, A. Nur, and Amin, “Analysis of range extender electric vehicle
performance using vehicle simulator,” Energy Procedia, vol. 68, pp. 409–418, 2015, doi:
10.1016/j.egypro.2015.03.272.
[33] M. I. Khan, M. Shahrestani, T. Hayat, A. Shakoor, and M. Vahdati, “Life cycle (well-to-wheel)
energy and environmental assessment of natural gas as transportation fuel in Pakistan,” Appl.
Energy, vol. 242, no. March, pp. 1738–1752, 2019, doi: 10.1016/j.apenergy.2019.03.196.
[34] D. R. Cassiano, J. Ribau, F. S. A. Cavalcante, M. L. M. Oliveira, and C. M. Silva, “On-board
Monitoring and Simulation of Flex Fuel Vehicles in Brazil,” Transp. Res. Procedia, vol. 14, pp.
3129–3138, 2016, doi: 10.1016/j.trpro.2016.05.253.
[35] B. Wahono, A. Nur, W. B. Santoso, and A. Praptijanto, “A comparison study of range-extended
engines for electric vehicle based on vehicle simulator,” J. Mech. Eng. Sci., vol. 10, no. 1, pp.
1803–1816, 2016, doi: 10.15282/jmes.10.1.2016.5.0173.
[36] C. D. Iclodean and C. D. Iclodean, “Energetic efficiency evaluation of the Lunar Roving vehicles
using computer simulation,” TEM J., vol. 7, no. 4, pp. 937–943, 2018, doi: 10.18421/TEM74-35.
[37] H. T. Arat, “Simulation of diesel hybrid electric vehicle containing hydrogen enriched CI engine,”
Int. J. Hydrogen Energy, pp. 10139–10146, 2019, doi: 10.1016/j.ijhydene.2018.10.004.
[38] B. Norbert, V. Bogdan-Ovidiu, M. Dan, C. Aron, and K. Dimitrios, “Analysis of Range Extended
Hybrid Vehicle with Rotary Internal Combustion Engine Using AVL Cruise,” 2019.
[39] M. Imre and V. Zolt, “„IFFK 2012” Budapest, 2012. augusztus 29-31. Elektromos meghajtású
járművek menetdinamikai szimulációja,” pp. 149–152, 2012.
[40] A. Praptijanto, W. B. Santoso, A. Nur, B. Wahono, and Y. Putrasari, “Performance and driveline
analyses of engine capacity in range extender engine hybrid vehicle,” in AIP Conference
Proceedings, 2017, doi: 10.1063/1.4968254.

International Journal of Engineering and Management Sciences (IJEMS) Vol. 5. (2020). No. 2
DOI: 10.21791/IJEMS.2020.2.35.
323
[41] X. Fu, Q. Zhang, J. Tang, and C. Wang, “Parameter matching optimization of a powertrain system
of hybrid electric vehicles based on multi-objective optimization,” Electron., vol. 8, no. 8, pp. 7–
10, 2019, doi: 10.3390/electronics8080875.
[42] N. Euler-Rolle, C. H. Mayr, I. Škrjanc, S. Jakubek, and G. Karer, “Automated vehicle driveaway
with a manual dry clutch on chassis dynamometers: Efficient identification and decoupling
control,” ISA Trans., no. xxxx, 2019, doi: 10.1016/j.isatra.2019.08.021.
[43] M. Montazeri-Gh and A. Fotouhi, “Traffic condition recognition using the k-means clustering
method,” Sci. Iran., vol. 18, no. 4 B, pp. 930–937, 2011, doi: 10.1016/j.scient.2011.07.004.
[44] A. Farshidianfar, M. Ebrahimi, H. Rahnejat, M. T. Menday, and M. Moavenian, “Optimization of
the high-frequency torsional vibration of vehicle driveline systems using genetic algorithms,”
Proc. Inst. Mech. Eng. Part K J. Multi-body Dyn., vol. 216, no. 3, pp. 249–262, Sep. 2002, doi:
10.1177/146441930221600305.
[45] T. Resch, M. Sopouch, T. Resch, and P. Herster, “Analysis of Gearbox Acoustics with AVL
EXCITE,” no. June, 2016.