Embed Size (px)
Citation preview

PERMAFROST AND PERIGLACIAL PROCESSESPermafrost Periglac. Process. 14: 103–123 (2003)Published online in Wiley InterScience (www.interscience.wiley.com). DOI: 10.1002/ppp.452
Vegetation-Soil-Thaw-Depth Relationships along a Low-ArcticBioclimate Gradient, Alaska: Synthesis of Information from theATLAS Studies
D. A. Walker,1* G. J. Jia,2 H. E. Epstein,2 M. K. Raynolds,1 F. S. Chapin III,1 C. Copass,1 L. D. Hinzman,3
J. A. Knudson,1 H. A. Maier,1 G. J. Michaelson,4 F. Nelson,5 C. L. Ping,4 V. E. Romanovsky6
and N. Shiklomanov5
1 Institute of Arctic Biology, University of Alaska-Fairbanks, Fairbanks, Alaska, USA2 Department of Environmental Sciences, University of Virginia, Charlottesville, Virginia, USA3 Water and Environmental Research Center, University of Alaska-Fairbanks, Fairbanks, Alaska, USA4 Palmer Research Center, University of Alaska-Fairbanks, Palmer, Alaska, USA5 Department of Geography, University of Delaware, Newark, Delaware, USA6 Geophysical Institute, University of Alaska-Fairbanks, Fairbanks, Alaska, USA
ABSTRACT
Differences in the summer insulative value of the zonal vegetation mat affect the depth of thawalong the Arctic bioclimate gradient. Toward the south, taller, denser plant canopies and thickerorganic horizons counter the effects of warmer temperatures, so that there is little correspondencebetween active layer depths and summer air temperature. We examined the interactions betweensummer warmth, vegetation (biomass, Leaf Area Index, Normalized Difference Vegetation Index),soil (texture and pH), and thaw depths at 17 sites in three bioclimate subzones of the Arctic Slopeand Seward Peninsula, Alaska. Total plant biomass in subzones C, D, and E averaged 421 g m�2,503 g m�2, and 1178 g m�2 respectively. Soil organic horizons averaged 4 cm in subzone C, 8 cm insubzone D, and 14 cm in subzone E. The average late-August thaw depths in subzones C, D, and Ewere 44 cm, 55 cm, and 47 cm respectively. Non-acidic soils in equivalent climates generally haveshorter-stature sedge-dominated canopies and many frost boils, and consequently have thicker activelayers than acidic soils. The trends reported here are useful for palaeo-ecological reconstructions andpredictions of future ecosystem changes in the Low Arctic. Climate change will not lead to uniformthickening of the active layer, and could lead to shallower active layers in some presently dry areasdue to paludification. Copyright 2003 John Wiley & Sons, Ltd.
KEY WORDS: active layer; NDVI; biomass; soil pH; frost boils; bioclimate subzones
INTRODUCTION
A major concern in Arctic climate change researchis that, with warming, active layers will deepen,possibly eliminating permafrost in some areas, and
* Correspondence to: Dr D. A. Walker, Institute of Arctic Biology,University of Alaska - Fairbanks, Fairbanks, Alaska 99775, USA.E-mail: [email protected]
releasing stored carbon to the atmosphere. Deeperactive layers would also release more water to theArctic Ocean, dry the tundra, cause erosion anddamage to infrastructures, and change arctic systemsconsiderably (Kane et al., 1991; Jorgenson et al.,2001; Nelson et al., 2001). Current evidence indicatesthat permafrost has already warmed during the recentrecord in some parts of the Arctic (Lachenbruch
Received 29 January 2003Revised 15 April 2003
Copyright 2003 John Wiley & Sons, Ltd. Accepted 15 April 2003

104 D. A. Walker et al.
and Marshall, 1986). Understanding the interactionsamong vegetation, soils and active layers alongnatural climate gradients can aid in developingcircumpolar maps of active layer depths, and willhelp in predictions of how climate change will affectArctic systems.
The studies summarized here were part of amultidisciplinary project called Arctic Transitions inthe Land-Atmosphere System, or ATLAS (McGuireet al., 2003). Previous studies in the FLUX project(Weller et al., 1995) focused on the 27 278 km2
Kuparuk River region, central Arctic Slope, Alaska,where researchers developed regional approachesto map and model arctic vegetation, soils, active-layers, hydrology, and trace-gas fluxes. The ATLASstudies combined the information from the FLUXstudies with new information from sites in westernAlaska and the Seward Peninsula to achieve anunderstanding of the controls over fluxes across abroader area of the Arctic. One ATLAS goal was toexamine changes in the system at major transitionsor boundaries in the arctic system. The purpose ofthe studies reported in this paper is to examine howvegetation, soils, and thaw depth vary across thearctic bioclimate gradient in northern Alaska (insetto Plate 1). One objective was to determine if thepatterns of vegetation and active layers observedin the Kuparuk River basin could reasonably beextended across the Arctic Slope and expanded tothe warmer tundra on the Seward Peninsula as a steptowards developing a circumpolar map of active layerthickness.
The Effect of Vegetation and Soils on the ActiveLayer
Changes to the active layer caused by climate changeare likely to be affected by simultaneous changesto the vegetation and soils. Numerous studies havedemonstrated the clear linkages between climate,vegetation, soils, and the active layer, but the detailsof these linkages are not well understood (Ben-ninghoff, 1966; Klene et al., 2001; Shiklomanovand Nelson, 2002, 2003, Vasiliev et al. 2003). Formodelling purposes, the thermal effects of vege-tation and a host of edaphic variables affectingthaw have been lumped into an ‘edaphic param-eter’, E, in the equation, ALT D EŁSQRT(DDT),where ALT is the active layer thickness and DDTis the degree days of thawing (Anisimov et al.,2002). At present, the complex effect of vegeta-tion and soil on the edaphic parameter is understoodonly in general terms. Vegetation shades the soilsand provides a blanket of insulation that reduces
summer heat flux. Moss and organic matter in thesoil increase the water holding capacity affectingthe hydrological properties. Thick moss carpets andorganic soil horizons decrease active layer thick-ness, consequently decreasing the depth to whichwater is able to drain because of the presence ofpermafrost (Kane, 1997). This process of waterlog-ging, or paludification, is thought to be the drivingmechanism behind long-term vegetation successionand changes in the active layer thickness in theLow Arctic (Walker and Walker, 1996; Mann et al.,2002).
Palaeodata show that major changes in arcticvegetation have occurred during past climate changes(Mann et al., 2002, Bigelow et al., 2003), andmajor changes are expected in the future undera warming climate (Chapin III et al., 2000; Kittelet al. 2000; McGuire et al., 2000; Cramer, 1997;Kaplan et al., 2003). There is also good evidencethat some changes have already occurred to thevegetation in the recent past. For example, during thelast 50 years, shrub cover has increased over largeareas of northern Alaska (Silapaswan et al., 2001,Sturm et al., 2001b). This may be responsible fora relatively rapid greening observed over 20 yearsof satellite observations from arctic Alaska (Jia,2002, submitted). These changes are expected tohave an effect on the regional energy balances andcarbon budgets (Oechel et al., 1997) and would alsoaffect active layer thickness and permafrost regimes.Regional estimates of trace-gas flux can be linkedto the spatial variation of active layer thickness overlarge regions (Goulden et al., 1998).
Vegetation is known to change in predictableways across the north-to-south arctic temperaturegradient (Figure 1). This is the principal basis forseveral approaches to arctic bioclimate zonation(Alexandrova, 1980; Elvebakk et al., 1999; Walkeret al., 2002). Mapping and modelling of numer-ous ecosystem variables in the Kuparuk Riverbasin of Alaska have shown strong correspondencebetween climate, vegetation, active layer patterns,and regional trace-gas fluxes (Hinzman et al., 1998;Muller et al., 1998; Nelson et al., 1998a; Reeburghet al., 1998; Oechel et al., 2000; Shiklomanov andNelson, 2002, 2003). A 13-year active layer map-ping program in the Kuparuk River region ofnorthern Alaska demonstrated that, although thawdepths can exhibit substantial inter-annual varia-tions in response to climatic forcing, vegetationtype is an important component of proceduresused to model spatial variation in active-layerthickness. Moreover, the ranking of active-layer
Copyright 2003 John Wiley & Sons, Ltd. Permafrost and Periglac. Process., 14: 103–123 (2003)

Arctic Slope Boundary
Plate 1 Location of the study sites with respect to broad vegetation types and bioclimate subzones. The vegetation map of the ArcticSlope is modified from Muller et al. (1999). The map of the Seward Peninsula is modified from an unpublished map (Thayer-Snyder,2000). The inset map shows the bioclimate subzones of the Arctic Zone in northern Alaska based on Walker et al. (2003). Red boundaryoutlines the area of the sand sea.
Copyright 2003 John Wiley & Sons, Ltd. Permafrost and Periglac. Process., 14 (2003)

Subzone C
Subzone E
Subzone D
MaxNDVI<0.03
0.03-0.140.15-0.260.27-0.380.39-0.500.51-0.560.57-0.62
>0.62
Acidic/nonacidic soil boundary
Plate 2 Map of the Max NDVI in northern Alaska derived from AVHRR composite images. The image consists of pixels (1 ð 1-kmpicture elements) with highest NDVI among biweekly images from 1993 and 1995. The southern border of the image is clipped at treeline. The boundary between the yellow and green colours (arrow) is the boundary between primarily acidic tundra to the south andnon-acidic tundra to the north. This boundary approximately coincides with a physiographic boundary separating the Arctic Foothillsfrom the Arctic Coastal Plain, and a bioclimate boundary separating subzones D and E. The yellow areas are mainly tussock tundra.The green areas are less shrubby and dominated by graminoid plants. The light blue (lower NDVI) colours on the northern portion ofthe coastal plain are caused primarily by the abundance of lakes, which have low NDVI. The dark orange and red areas are shrubbierareas, and the darker blue colours are mainly barren areas in the Brooks Range.
Copyright 2003 John Wiley & Sons, Ltd. Permafrost and Periglac. Process., 14 (2003)

Vegetation-Soil-Thaw-Depth Relationships 105
a b
dc
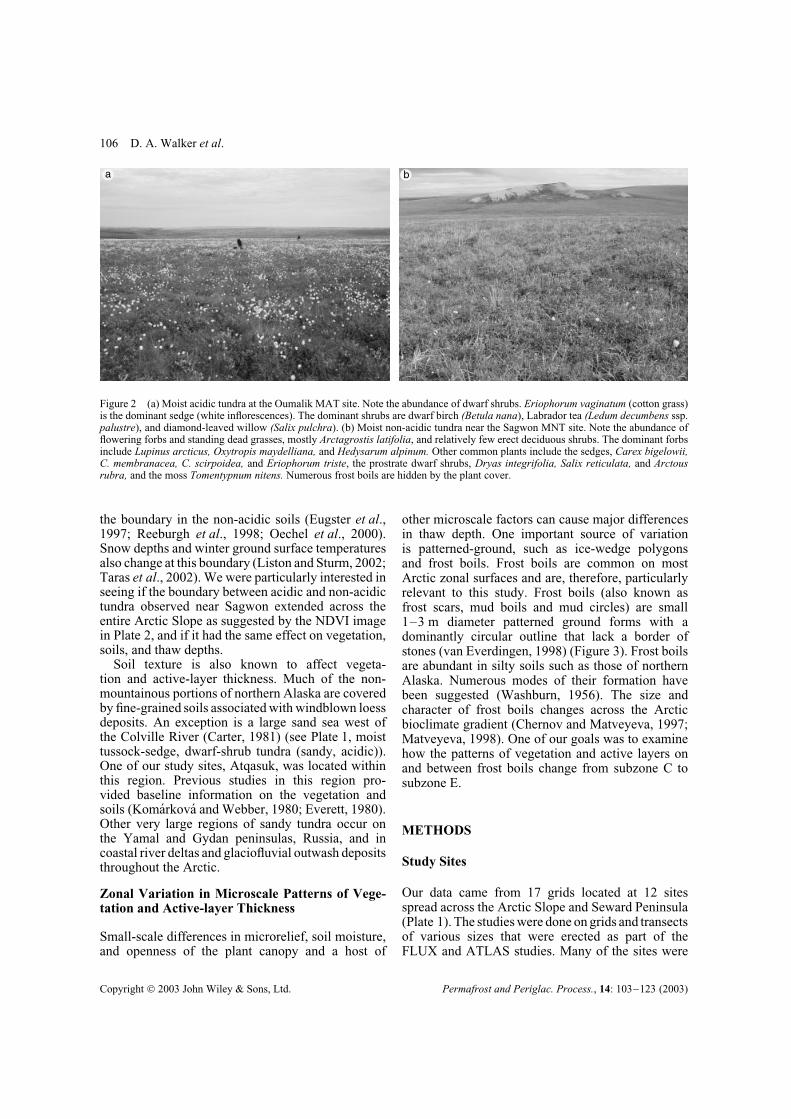
Figure 1 Typical vegetation in each subzone. (a) Moist acidic coastal tundra at Barrow (subzone C). Note the lack of any erect shrubsand the dominance of graminoid plants (mostly Carex aquatilis ssp. stans, Eriophorum angustifolium, Dupontia fisheri, Poa arctica).(b) Moist non-acidic tundra at Franklin Bluffs (subzone D). Note the scattered erect dwarf shrubs (mostly Richardson’s willow (Salixrichardsonii) and dominance of graminoid plants (Carex bigelowii, C. membranacea, Eriophorum triste). (c) Moist acidic tundra atQuartz Creek (subzone E). Note the dominance of tussock cotton grass (Eriophorum vaginatum) and erect shrubs (Betula nana, Ledumpalustre ssp. decumbens, Rubus chamaemorus). (d) Shrub tundra near Council (warm maritime subzone E). Council is at tree line. Thedominant shrubs are about 1.5 m tall and include Betula glandulosa and Salix glauca.
thickness among vegetation classes remains con-sistent from year to year (Shiklomanov and Nelson,2002).
We were also interested in the transitions associ-ated with different soil properties, particularly soilpH and soil texture. Studies across the KuparukRiver basin have noted strong correlations amongsoil pH, active layer thickness, and a wide variety ofecosystem variables (Bockheim et al., 1996). Thesecorrelations were attributed to the different nature ofthe vegetation growing on acidic versus non-acidicsoils (Walker et al., 1998; 2001) (Figure 2). Thestudies noted a boundary separating large regions ofacidic and non-acidic tundra at the northern edge of
the Arctic Foothills (Plate 2). South of the boundary,there were higher values of the Normalized Differ-ence Vegetation Index (NDVI) caused by greenervegetation. North of the boundary, there were morestanding dead vegetation and barren frost boils, whichcontributed to low NDVI values. Studies near theboundary at Sagwon found that the soil pH of theupper mineral horizon averaged 5.2 south of theboundary and 6.9 north of the boundary (Walkeret al., 1998). The amount of bare soil was 10 timesgreater north of the boundary, and active layers were33% thicker (52 cm vs. 39 cm). Other studies foundgreater heat flux, higher diversity of plants, less of acarbon sink, and a smaller source of methane north of
Copyright 2003 John Wiley & Sons, Ltd. Permafrost and Periglac. Process., 14: 103–123 (2003)
106 D. A. Walker et al.
ba
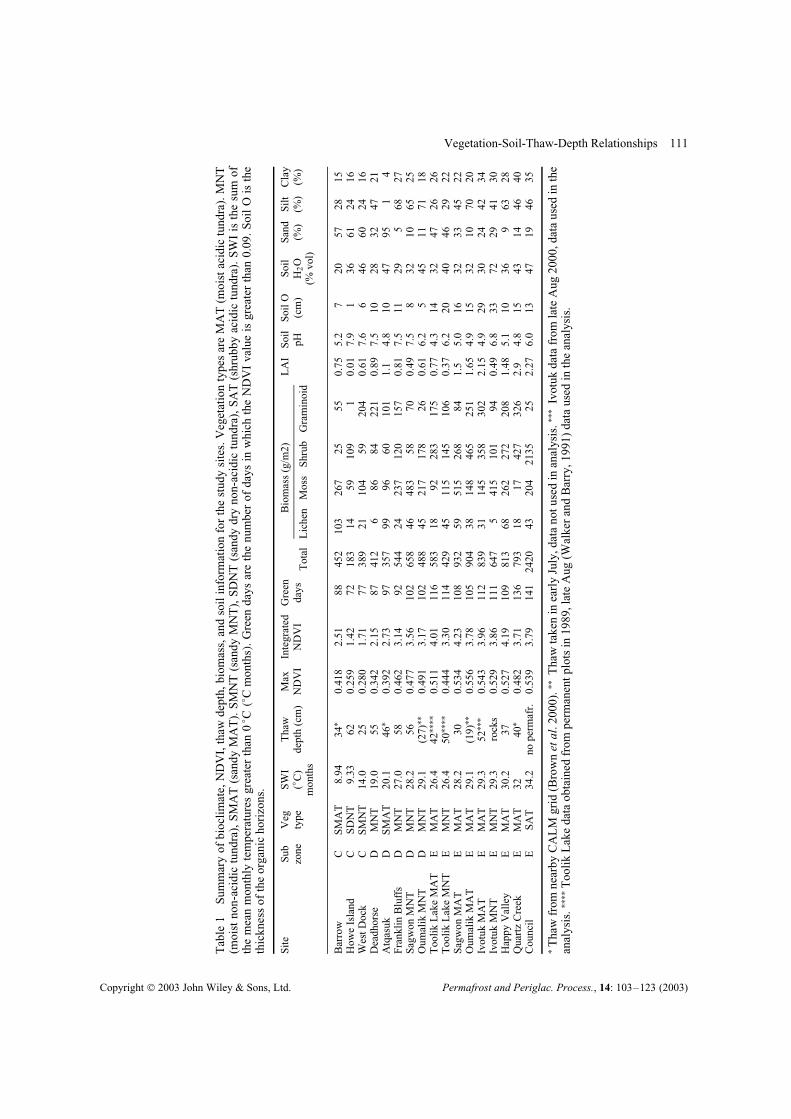
Figure 2 (a) Moist acidic tundra at the Oumalik MAT site. Note the abundance of dwarf shrubs. Eriophorum vaginatum (cotton grass)is the dominant sedge (white inflorescences). The dominant shrubs are dwarf birch (Betula nana), Labrador tea (Ledum decumbens ssp.palustre), and diamond-leaved willow (Salix pulchra). (b) Moist non-acidic tundra near the Sagwon MNT site. Note the abundance offlowering forbs and standing dead grasses, mostly Arctagrostis latifolia, and relatively few erect deciduous shrubs. The dominant forbsinclude Lupinus arcticus, Oxytropis maydelliana, and Hedysarum alpinum. Other common plants include the sedges, Carex bigelowii,C. membranacea, C. scirpoidea, and Eriophorum triste, the prostrate dwarf shrubs, Dryas integrifolia, Salix reticulata, and Arctousrubra, and the moss Tomentypnum nitens. Numerous frost boils are hidden by the plant cover.
the boundary in the non-acidic soils (Eugster et al.,1997; Reeburgh et al., 1998; Oechel et al., 2000).Snow depths and winter ground surface temperaturesalso change at this boundary (Liston and Sturm, 2002;Taras et al., 2002). We were particularly interested inseeing if the boundary between acidic and non-acidictundra observed near Sagwon extended across theentire Arctic Slope as suggested by the NDVI imagein Plate 2, and if it had the same effect on vegetation,soils, and thaw depths.
Soil texture is also known to affect vegeta-tion and active-layer thickness. Much of the non-mountainous portions of northern Alaska are coveredby fine-grained soils associated with windblown loessdeposits. An exception is a large sand sea west ofthe Colville River (Carter, 1981) (see Plate 1, moisttussock-sedge, dwarf-shrub tundra (sandy, acidic)).One of our study sites, Atqasuk, was located withinthis region. Previous studies in this region pro-vided baseline information on the vegetation andsoils (Komarkova and Webber, 1980; Everett, 1980).Other very large regions of sandy tundra occur onthe Yamal and Gydan peninsulas, Russia, and incoastal river deltas and glaciofluvial outwash depositsthroughout the Arctic.
Zonal Variation in Microscale Patterns of Vege-tation and Active-layer Thickness
Small-scale differences in microrelief, soil moisture,and openness of the plant canopy and a host of
other microscale factors can cause major differencesin thaw depth. One important source of variationis patterned-ground, such as ice-wedge polygonsand frost boils. Frost boils are common on mostArctic zonal surfaces and are, therefore, particularlyrelevant to this study. Frost boils (also known asfrost scars, mud boils and mud circles) are small1–3 m diameter patterned ground forms with adominantly circular outline that lack a border ofstones (van Everdingen, 1998) (Figure 3). Frost boilsare abundant in silty soils such as those of northernAlaska. Numerous modes of their formation havebeen suggested (Washburn, 1956). The size andcharacter of frost boils changes across the Arcticbioclimate gradient (Chernov and Matveyeva, 1997;Matveyeva, 1998). One of our goals was to examinehow the patterns of vegetation and active layers onand between frost boils change from subzone C tosubzone E.
METHODS
Study Sites
Our data came from 17 grids located at 12 sitesspread across the Arctic Slope and Seward Peninsula(Plate 1). The studies were done on grids and transectsof various sizes that were erected as part of theFLUX and ATLAS studies. Many of the sites were
Copyright 2003 John Wiley & Sons, Ltd. Permafrost and Periglac. Process., 14: 103–123 (2003)

Vegetation-Soil-Thaw-Depth Relationships 107
Figure 3 Comparison of physical variables for the study sites arranged by subzone. (a) SWI, (b) late-August depth of thaw, and(c) soil texture. Gaps in (b) are due to either missing data (Oumalik MNT and MAT), or rocky soils (Ivotuk MNT), or have nopermafrost (Council).
located within or near 1 ð 1-km grids that wereused for eddy-correlation tower studies of trace-gas and energy fluxes, and which are now part ofthe Circumpolar Active Layer Monitoring (CALM)program (Brown et al., 2000) (Barrow, West Dock,Atqasuk, Happy Valley, Ivotuk). The eight sites inthe western portion of the region (Barrow, Atqasuk,Oumalik MNT (moist non-acidic tundra), OumalikMAT (moist acidic tundra), Ivotuk MNT, IvotukMAT, Council, and Quartz Creek) had 100 ð 100-mgrids with 10-m grid-point spacing. These grids wereestablished in 1998–1999. The vegetation, soils, andclimate were described and monitored at all theselocations. Each site had a climate station whereair and ground temperatures were monitored. Seven
locations near the Dalton Highway (Howe Island,West Dock, Deadhorse, Franklin Bluffs, SagwonMAT, Sagwon MNT, Happy Valley) had 10 ð 10 mgrids with 1-m grid point spacing. These grids wereestablished in 2000–2001. The smaller grid sizewas used to examine high-frequency spatial variationin active layers, vegetation and soils associatedwith frost boils. For Toolik Lake, we used datafrom permanent vegetation plots established in 1989and 1990.
We used the bioclimate subzones of the Pan ArcticFlora and Fauna project (Elvebakk et al., 1999), andthe Circumpolar Arctic Vegetation Map (CAVM)(Walker et al., 2002a, b) as a framework for the study(see inset to Plate 1 and photographs in Figure 1).
Copyright 2003 John Wiley & Sons, Ltd. Permafrost and Periglac. Process., 14: 103–123 (2003)

108 D. A. Walker et al.
Zonal vegetation and soils occur on flat or gentlysloping plains or hills with fine-grained soils and noextremes of snow, soil moisture, soil chemistry, ordisturbance (Vysotsky 1927). The sites were chosensubjectively to represent zonal vegetation whereverpossible. Exceptions occurred at Atqasuk, which hada sandy soil, and Howe Island, which had a dry wind-swept surface, more typical of zonal subzone C sitesin the Canadian High Arctic.
Bioclimate subzone C, the coldest subzone, occursin a narrow strip along the northern coast of Alaska.Subzone D covers most of the Arctic Coastal Plainand the northwest portion of the Seward Peninsula,and subzone E covers most of the Foothills andmost of the non-forested portion of the SewardPeninsula. Barrow, West Dock, and Howe Island arein subzone C. Deadhorse, Franklin Bluffs, SagwonMNT, Atqasuk, and Oumalik MNT are in subzoneD. Sagwon MAT, Oumalik MAT, Happy Valley,Toolik Lake, Ivotuk, Quartz Creek, and Council arein subzone E. The low-shrub site at Council wasselected as representative of the zonal tundra situationat the Arctic tree line; shrublands are abundant onthe majority of mesic gentle slopes in the region.Wherever possible, we also selected sites on acidicand non-acidic soils within the same climate regimeto examine the effects of soil pH. This situationoccurred at Sagwon, Oumalik, and Ivotuk.
The Dalton Highway is the only road that traversesthe area from north to south. Nine of the studysites were located at seven locations along this road(Plate 1). Most of the other sites are located nearremote airstrips. Four study sites were located in eachof the bioclimate subzones along a western transectfrom Barrow to Ivotuk. The most remote location,Oumalik, 100 km southeast of the nearest airstrip atAtqasuk, was accessed by helicopter. It was chosenbecause it is located on the western extension of theacidic/non-acidic boundary, and it has a history ofnearby vegetation and permafrost research (Ebersole,1985). The Quartz Creek and Council sites are on theSeward Peninsula in a warmer climate than anywhereon the Arctic Slope. Discontinuous permafrost ispresent over much of the peninsula (Brown et al.,1997). Quartz Creek is in a hilly tussock-tundraregion similar to the Foothills of northern Alaska,and provides a possible example of how the ArcticSlope might respond to a few degrees of summerwarming.
Summer Warmth Index (SWI)
Climate data came from several sources. The NationalWeather Service data were available for Bar-row, Nome, and Umiat. Howe Island data came
from the Endicott site established by the Min-erals Management Service Beaufort Sea Meteo-rological Monitoring and Data Synthesis project(http://www.resdat.com/mms/index.cfm). The Too-lik Lake data were from the Arctic Lake LongTerm Ecological Research site. The rest of thedata came from sites established by investigatorsin the ATLAS project. A mean SWI was calcu-lated for each site. SWI is the sum of the meanmonthly temperatures greater than 0 °C (thawing-degree months). We chose the SWI over an indexbased on thawing-degree days (TDD) because SWIis readily derived from monthly climate summariesand does not require daily information, a significantadvantage in this study, which used climate data fromseveral sources.
Thaw Depth
The thaw measurements were taken from threedifferent years in mid- to late-August. Data frommost of the Dalton Highway sites (Howe Island,West Dock, Deadhorse, Franklin Bluffs, Sagwon,and Happy Valley) were collected in late-August2001. The Toolik Lake data were from permanentplots sampled in late-August 1989 (Walker andBarry, 1991). Data from Barrow, Atqasuk, Oumalik,Ivotuk, Quartz Creek, and Council were collectedfrom 1999. At Barrow, Atqasuk, and Quartz Creek(also called Kougarok) we used data from thenearby CALM grids (Brown et al., 2000). Thawdepths at Oumalik, although they are reportedhere, were collected too early in the season tobe useful for this study. Since we were interestedin broad geographic differences in zonal thawdepths and not small inter-annual differences, itwas reasonable to use data from different years,especially since the standard deviation of mean end-of-summer thaw is 6 cm or less at all 12 northernAlaska sites in the CALM network (Brown et al.,2000).
The thaw depth was monitored using a blunt tippedsteel probe that was inserted into the soil to the pointof contact with hard frozen soil. Measurements weretaken at 10 m intervals on the 100 ð 100-m grids(121 measurements per grid), and at 0.5 m intervalson the 10-m grids (441 measurements per grid). Thehigh density of sample points on the 10-m gridswas for resolving the pattern of thaw associated withfrost boils in each grid. On the permanent plots atToolik Lake, 10 measurements were taken withineach 10-m2 study plot. More recent informationindicates that the thawed layer can continue todeepen into September or even October; so our
Copyright 2003 John Wiley & Sons, Ltd. Permafrost and Periglac. Process., 14: 103–123 (2003)

Vegetation-Soil-Thaw-Depth Relationships 109
measurements should be considered ‘late-Augustthaw depth’ and not necessarily the full thicknessof the active layer. To maintain this distinction, weuse the term ‘thaw depth’ in subsequent sections ofthis paper.
Vegetation Data
Biomass.Clip harvests were collected from 20 ð 50-cm
(0.1 m2) plots at all sites except Council, wherebiomass was collected from 1 ð 1-m plots. In the100 ð 100-m grids at Barrow, Atqasuk, Oumalik,Ivotuk, Council, and Quartz Creek, samples werecollected from 10 random grid points within thegrids. For the 10 ð 10-m grids in the vicinity ofthe Dalton Highway (Howe Island, West Dock,Deadhorse, Franklin Bluffs, Sagwon, and HappyValley) samples were collected from two 50-mtransects located adjacent to the grids. Three clipharvest samples were collected from each transectat 5 m, 25 m and 45 m points along the transects.The Toolik Lake data were obtained in permanentvegetation plots that were clipped in 1993; threereplicates were obtained from five moist non-acidicsites (15 clip harvests) and four acidic plots (12 clipharvests).
The vascular plants were clipped at the top of themoss layer, or at the base of the green herbaceousshoots. Mosses were clipped at the base of the greenportion of the mosses. All the clip harvests werepartially sorted in the field according to major plantfunctional types (shrubs, graminoids, forbs, mosses,and lichens). They were frozen and sorted into finercategories (live and dead, deciduous and evergreenshrubs, foliar and woody) at a later time. After sorting,the samples were dried at 50 °C to constant weightand stored for later nutrient analysis.
Leaf Area Index (LAI).LAI was measured using a LI-COR LAI-2000
Plant Canopy Analyzer. The instrument gave anindication of canopy cover based on differences indiffuse radiation above and below the plant canopy.At each sample point, an above-canopy reading wasfollowed by four below-canopy readings taken abovethe moss layer. The average of the four readingswas retained for the data analysis. A 90° field-of-view shield was used to prevent interference fromthe observers. All measurements were taken facingaway from the sun. The LAI readings should be takenon cloudy days to prevent problems with reflectionsin the plant canopy. This was not always possible,so on sunny days a sun shield was used to shadethe sensor from direct sunlight while at the same
time providing an unobstructed view of the sky. Wecollected LAI data from 33 random points within thegrids of the six western sites. For the eastern transect,we collected LAI at 2-m intervals along two 50-mtransects (total of 50 points for each location). AtCouncil, LAI readings were taken at 121 points inthe 100 ð 100-m grid, with one up and one downmeasurement at each point. A mean LAI value wascalculated for each grid (N D 33) and each transect(N D 50). We did not make direct comparisons ofthe optical LAI values with destructive measures ofleaf area. A previous study of LAI using the LI-COR 2000 instrument in arctic vegetation showedgenerally good correspondence between LAI, NDVI,and biomass, especially when examined across broadbiomass gradients (Shippert et al., 1995). Because thesites were chosen to be centrally located within largehomogeneous zonal landscapes, we assumed that themeans of the LAI and biomass were representative ofa larger area comparable to a remotely-sensed 1-kmpixel. This assumption, however, was not tested.
NDVI.NDVI is an index of vegetation greenness.
NDVI D �NIR � R)/(NIR C R), where NIR is thespectral reflectance in the near-infrared band(0.725–1.1 µm), dominated by light scattering fromthe plant canopy, and R is reflectance in thered, chlorophyll-absorbing, portion of the spectrum(0.58–0.68µm) (Markon et al., 1995). The NDVIdata were derived from Advanced Very High Resolu-tion Radiometer (AVHRR onboard National Oceano-graphic and Aeronautical Administration (NOAA)satellites) images. AVHRR-derived NDVI time-series data for 1995–1999 were obtained from theUS Geological Survey (USGS) Alaska Data Centeron CD-ROMs. These data were based on 14-daycomposite periods to match the processing of globaldata sets. We used the portion of the data between1 April and 31 October, which consistently brack-ets the snow-free period in northern Alaska andcovers the greenup-to-senescence phase of the veg-etation (Markon, 1999). Only the portion coveringnorthern Alaska and the Seward Peninsula was usedfor the analysis. The original data were convertedinto a GRID coverage using ARC/INFO GRID soft-ware. Cloud and snow contamination were minimizedusing the Best Index Slope Extraction adaptive filter(Viovy, 2000). The filter is also designed to mini-mize registration errors that induce short-lived NDVIpeaks, which may occur in the compositing process.
We used 1 : 60 000-scale colour-infrared aerialphotographs (acquisition dates, 1978 and 1982) todelineate 202 areas of homogeneous vegetation onacidic and non-acidic parent material in the vicinity
Copyright 2003 John Wiley & Sons, Ltd. Permafrost and Periglac. Process., 14: 103–123 (2003)

110 D. A. Walker et al.
of the climate stations. This was the same data setused for the analysis of intra-seasonal patterns ofNDVI in relation to the climate record (Jia et al.,2002). Polygons were drawn around these areas onmylar transparent overlays. The aerial photographsand polygons were then digitized and geo-registeredto the AVHRR imagery using ARC/INFO software.To register the photographs to the AVHRR image, weused 127 control points from 1 : 63 360-scale USGStopographic maps. Of the 202 polygons on the aerialphotographs, 91 were large enough to locate on theAVHRR image. Although the dates of acquisitionfor the photographs and the satellite images weredifferent, we assumed that the broad vegetationpatterns had not changed, especially within largeareas of homogeneous zonal vegetation selected forthis study. The mean maximum NDVI (MaxNDVI)for each polygon was calculated from the set ofannual maximum NDVI values for all pixels withinthe polygon. These MaxNDVI values were then usedfor the correlation analyses with SWI, phytomass, andLAI. The temporally-integrated NDVI (IntegratedNDVI) is the sum of all the biweekly NDVIvalues during the green period. Green days are thenumber of days during which the NDVI exceeds0.9, and is the period during which most plants arephotosynthetically active.
Soils Data
At each site, a soil pit of about 1 ð 1 m2 wasexcavated to 1 m depth with shovels and a gas-powered jackhammer. Soil morphological propertieswere described according to the Soil Survey Manual(Soil Survey Staff, 1993). Soil samples were takenfrom each horizon and shipped to either the PalmerResearch Center Laboratory or the National SoilSurvey Laboratory for characterization analysisaccording to standard USDA procedures (Soil SurveyStaff, 1993). Soil pH was measured in distilled water.Soil pH, sand, silt, and clay values used in thisanalysis are from the top mineral horizon. Particlesize distribution was determined with a hydrometerin the Palmer Laboratory.
Mapped Data
Aerial photographs were taken of each grid from ahelicopter at about 30 m elevation for the 10 ð 10-mgrids, and about 300 m elevation for the 100 ð 100-mgrids. Detailed vegetation maps of all the 10 ð 10-mgrids and some of the 100 ð 100-m grids were madebased on ground surveys. Maps of vegetation, snowcover, and active-layer thickness were made for the
10 ð 10-m grids based on the measured values at thegrid points for snow cover, and at 0.5 m intervals forthe active-layer measurements.
Data Analysis
The climate, soil and vegetation data were assembledinto a matrix (Table 1). The sites were groupedaccording to their bioclimate subzones and SWI.Mean values for each variable were calculated forthe subzones and soil reaction classes. Regressionanalysis was done on a full set of the variables toexamine the strength of the relationships.
RESULTS
Summer Warmth
SWI varied from 8.9 °C months at Barrow to 34.2 °Cmonths at Council (Figure 3a). Three sites, Barrow,Howe Island, and West Dock are in bioclimatesubzone C with summer warmth indices less than15 °C months. There are five sites in subzone D.Sagwon and Oumalik are on the boundary betweensubzones D and E. The MNT sites at both of theselocations are in subzone D, and the MAT sites are insubzone E. Toolik Lake is a high elevation (cooler)site within subzone E. The mean values for summerwarmth were 10.8 °C months in subzone C, 24.6 °Cmonths in subzone D, and 29.5 °C months in subzoneE (Figure 4a). The acidic tundra areas were somewhatwarmer than the non-acidic tundra areas (26.5 °Cmonths vs. 23.1 °C months) because most of the non-acidic sites are subzones D and C, whereas the MATsites are mainly in subzone E.
Thaw Depth
Late-August thaw depth ranged from 25 cm at WestDock to no permafrost at Council (Figure 3b). Theaverage thaw depth values were 44 cm in subzoneC, 55 cm in subzone D, and 47 cm in subzoneE, excluding the Council site, where there was nopermafrost (Figure 4c). Non-acidic tundra areas hadgenerally deeper thaw than the acidic tundra areas(54 cm vs. 45 cm).
Soils
Soil pH ranged from 4.3 at the Toolik MAT sitesto 7.9 at Howe Island. The break between the acidicand non-acidic soils was considered to be at pH 5.5(Bockheim et al., 1998). There were eight locationswith non-acidic soils, and nine with acidic soils.
Copyright 2003 John Wiley & Sons, Ltd. Permafrost and Periglac. Process., 14: 103–123 (2003)
Vegetation-Soil-Thaw-Depth Relationships 111
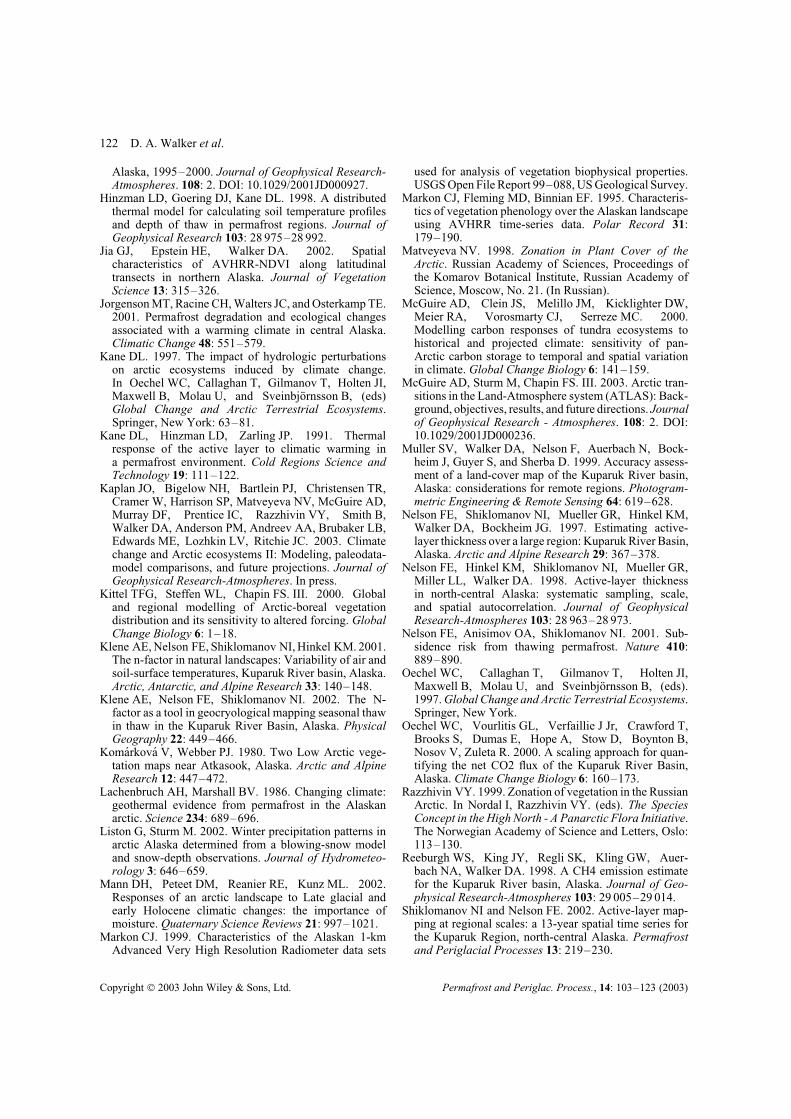
Tab
le1
Sum
mar
yof
bioc
lim
ate,
ND
VI,
thaw
dept
h,bi
omas
s,an
dso
ilin
form
atio
nfo
rth
est
udy
site
s.V
eget
atio
nty
pes
are
MA
T(m
oist
acid
ictu
ndra
).M
NT
(moi
stno
n-ac
idic
tund
ra),
SM
AT
(san
dyM
AT
).S
MN
T(s
andy
MN
T),
SD
NT
(san
dydr
yno
n-ac
idic
tund
ra),
SA
T(s
hrub
byac
idic
tund
ra).
SW
Iis
the
sum
ofth
em
ean
mon
thly
tem
pera
ture
sgr
eate
rth
an0
° C�°
Cm
onth
s�.G
reen
days
are
the
num
ber
ofda
ysin
whi
chth
eN
DV
Iva
lue
isgr
eate
rth
an0.
09.S
oil
Ois
the
thic
knes
sof
the
orga
nic
hori
zons
.
Sit
eS
ubV
egS
WI
Tha
wM
axIn
tegr
ated
Gre
enB
iom
ass
(g/m
2)L
AI
Soi
lS
oilO
Soi
lS
and
Sil
tC
lay
zone
type
(°C
)m
onth
sde
pth
(cm
)N
DV
IN
DV
Ida
ysT
otal
Lic
hen
Mos
sS
hrub
Gra
min
oid
pH(c
m)
H2O
(%vo
l)(%
)(%
)(%
)
Bar
row
CS
MA
T8.
9434
Ł0.
418
2.51
8845
210
326
725
550.
755.
27
2057
2815
How
eIs
land
CS
DN
T9.
3362
0.25
91.
4272
183
1459
109
10.
017.
91
3661
2416
Wes
tDoc
kC
SM
NT
14.0
250.
280
1.71
7738
921
104
5920
40.
617.
66
4660
2416
Dea
dhor
seD
MN
T19
.055
0.34
22.
1587
412
686
8422
10.
897.
510
2832
4721
Atq
asuk
DS
MA
T20
.146
Ł0.
392
2.73
9735
799
9660
101
1.1
4.8
1047
951
4F
rank
lin
Blu
ffs
DM
NT
27.0
580.
462
3.14
9254
424
237
120
157
0.81
7.5
1129
568
27S
agw
onM
NT
DM
NT
28.2
560.
477
3.56
102
658
4648
358
700.
497.
58
3210
6525
Oum
alik
MN
TD
MN
T29
.1(2
7)ŁŁ
0.49
13.
1710
248
845
217
178
260.
616.
25
4511
7118
Too
lik
Lak
eM
AT
EM
AT
26.4
42ŁŁ
ŁŁ0.
511
4.01
116
583
1892
283
175
0.77
4.3
1432
4726
26T
ooli
kL
ake
MN
TE
MN
T26
.450
ŁŁŁŁ
0.44
43.
3011
442
945
115
145
106
0.37
6.2
2040
4629
22S
agw
onM
AT
EM
AT
28.2
300.
534
4.23
108
932
5951
526
884
1.5
5.0
1632
3345
22O
umal
ikM
AT
EM
AT
29.1
(19)
ŁŁ0.
556
3.78
105
904
3814
846
525
11.
654.
915
3210
7020
Ivot
ukM
AT
EM
AT
29.3
52ŁŁ
Ł0.
543
3.96
112
839
3114
535
830
22.
154.
929
3024
4234
Ivot
ukM
NT
EM
NT
29.3
rock
s0.
529
3.86
111
647
541
510
194
0.49
6.8
3372
2941
30H
appy
Val
ley
EM
AT
30.2
370.
527
4.19
109
813
6826
227
220
81.
485.
110
369
6328
Qua
rtz
Cre
ekE
MA
T32
40Ł
0.48
23.
7113
679
318
1742
732
62.
94.
815
4314
4640
Cou
ncil
ES
AT
34.2
nope
rmaf
r.0.
539
3.79
141
2420
4320
421
3525
2.27
6.0
1347
1946
35
Ł Tha
wfr
omne
arby
CA
LM
grid
(Bro
wn
etal
.200
0).ŁŁ
Tha
wta
ken
inea
rly
July
,dat
ano
tuse
din
anal
ysis
.ŁŁŁ
Ivot
ukda
tafr
omla
teA
ug20
00,d
ata
used
inth
ean
alys
is.ŁŁ
ŁŁT
ooli
kL
ake
data
obta
ined
from
perm
anen
tplo
tsin
1989
,lat
eA
ug(W
alke
ran
dB
arry
,199
1)da
taus
edin
the
anal
ysis
.
Copyright 2003 John Wiley & Sons, Ltd. Permafrost and Periglac. Process., 14: 103–123 (2003)

112 D. A. Walker et al.
Figure 4 Summary of means (š standard errors) for three key physical variables by bioclimate subzone and acidic and non-acidictundra: (a) SWI, (b) soil organic horizon thickness, and (c) late-August thaw depth.
Soil textures were predominantly silts and siltloams except for the coastal sites at Barrow, WestDock, Howe Island, and Toolik Lake, which hadsandy loams, and Atqasuk which had sandy soils(Figure 3c).
Soil organic horizons varied from less than 1 cmat Howe Island to 33 cm at the Oumalik MAT site.The mean values for the organic thickness were4 cm in subzone C, 8 cm in subzone D, and 17 cmin subzone E (Figure 4b). Acidic tundra areas hadon average thicker organic horizons than non-acidictundra (14 cm vs. 10 cm).
Volumetric soil moisture values were all in therange from 20 to 47%, except for the Ivotuk MNTsite with 72%, which was caused by drainage from anearby snowbed.
Phytomass and LAI
Above-ground phytomass varied from 183 g m�2 atHowe Island to 2420 g m�2 at Council (Figure 5a).
The very low phytomass at Howe Island was muchless than the subzone C sites at Barrow and WestDock, which had moister soils and more plant coverand biomass close to 400 g m�2.
Mean zonal phytomass was 341 g m�2 in subzoneC, 482 g m�2 in subzone D, and 1050 g m�2 insubzone E (Figure 6a). Graminoid plants showeda steady increase across the subzones, 87 g m�2 insubzone C, 113 g m�2 in subzone D, and 184 g m�2
in subzone E. In subzones C and D, graminoidbiomass exceeded shrub biomass. This was true atall coastal plain sites except Howe Island, wherethe dominant plants were prostrate dwarf shrubs(Dryas integrifolia). In subzone E and all acidictundra sites except Atqasuk, shrub biomass exceededgraminoids. Atqasuk is in subzone D and graminoidswere dominant at this site. Most of the large amountof phytomass in subzone E was due to the shrubbiomass (Figure 6b). There was 64 g m�2 of shrubs insubzone C, 102 g m�2 in subzone D, and 575 g m�2
Copyright 2003 John Wiley & Sons, Ltd. Permafrost and Periglac. Process., 14: 103–123 (2003)

Vegetation-Soil-Thaw-Depth Relationships 113
Figure 5 Summary of (a) phytomass, (b) LAI, (c) peak NDVI, and (d) length of green season at the study sites.
in subzone E. Moss biomass averaged 143 g m�2
of moss in subzone C, 221 g m�2 in subzone D,and 243 g m�2 in subzone E (Figure 6c). Lichensshowed the opposite trend with 46 g m�2 in subzoneC, 36 g m�2 in subzone D, and 37 g m�2 in subzoneE. There was twice as much phytomass on averagein the acidic plots as there was in the non-acidicplots (939 g m�2 vs. 471 g m�2) (Figure 6a), and thiswas also due primarily to the difference in shrubs(501 g m�2 in the acidic sites vs. 103 g m�2 in thenon-acidic sites; Figure 6b).
LAI varied from 0.01 at Howe Island to 2.27 atCouncil (Figure 5b). The trends in LAI along thebioclimate gradient closely reflected the trends intotal above-ground phytomass. The average LAIwas 0.68 in subzone C, 0.92 in subzone D,and 1.65 in subzone E (Figure 6d). Acidic sitesaveraged twice the LAI of the non-acidic sites,1.61 vs. 0.8.
NDVI
Highest Peak NDVI occurred at the Oumalik MATsite (0.56) and the lowest NDVI was at Howe Island(0.26) (Figure 5c). The onset of greening varied fromlate April on the Seward Peninsula to early Juneat the Arctic coastal sites of Barrow, West Dock,Howe Island, Barrow and Deadhorse (Figure 5d).Integrated-NDVI values were 1.88 in subzone C,3.00 in subzone D, and 3.87 in subzone E. The trendsin both MaxNDVI (not shown) and time-integratedNDVI (Figure 6e) follow the trends in total above-ground phytomass and LAI but do not show sucha large increase from subzone D to E as phytomassand LAI. Acidic tundra had higher Integrated NDVIvalues than non-acidic tundra averaging 3.66 vs. 2.85.
One cause of the much larger biomass in sub-zone E is the longer growing season (Figure 6d).Council has nearly twice the number of green daysas Howe Island (141 vs. 72 days). Quartz Creek,
Copyright 2003 John Wiley & Sons, Ltd. Permafrost and Periglac. Process., 14: 103–123 (2003)

114 D. A. Walker et al.
1400
1200
1000
800
600
400
200
0
Tot
al A
bove
-gro
und
Phy
tom
ass(
g/m
2 )
Subzone C Subzone D Subzone E Non-acidicTundra
AcidicTundra
Subzone C Subzone D Subzone E Non-acidicTundra
AcidicTundra
1.8
1.6
1.4
1.2
1
0.8
0.6
0.4
0.2
0
Leaf
Are
a In
dex
a. Above-ground phytomass d. LAI
900
800
700
600
500
400
300
200
100
0
Abo
ve-g
roun
d B
iom
ass
(g/m
2 )
Subzone C Subzone D Subzone E Non-acidicTundra
AcidicTundra
Subzone C Subzone D Subzone E Non-acidicTundra
AcidicTundra
b. Shrub and graminoid biomass e. Time-Integrated-NDVI
Shrub BiomassGraminoidsBiomass
350
300
250
200
150
100
50
0
Abo
ve-g
roun
d B
iom
ass
(g/m
2 )
Subzone C Subzone D Subzone E Non-acidicTundra
AcidicTundra
c. Moss and lichen biomass
Lichen BiomassMosses Biomass
4.5
4.0
3.5
3.0
2.5
2.0
1.5
1.0
0.5
0.0
Tim
e-in
tegr
ated
ND
VI
Figure 6 Summary of means (š standard errors) for key biological variables by bioclimate subzones and soil reactionclass: (a) above-ground phytomass, (b) shrub and graminoid phytomass, (c) moss and lichen phytomass, (d) LAI, and (e) totalIntegrated NDVI.
also on the Seward Peninsula had 136 green days.The next highest number of green days was Too-lik Lake with 116. The Arctic Slope data showthe annual trend in greenup, which starts in thesouthern foothills at Toolik Lake (116 green days)and spreads northward to Ivotuk, Happy Valley,Sagwon. Franklin Bluffs, Atqasuk, Deadhorse, Bar-row, West Dock, and Howe Island (72 green days)(Figure 5d).
Trends of Vegetation Along the Summer-warmthGradient
Total biomass and LAI increased with temperaturein acidic tundra, but showed a weaker relationship
in non-acidic tundra (Figures 7a–c). Organic layerthickness and Integrated NDVI showed a strongerrelationship in non-acidic tundra than in acidic tundra(Figures 7d, e). The stronger NDVI relationship innon-acidic tundra may be partially due to saturation ofthe AVHRR sensors at higher NDVI values (Shippertet al., 1995). Also acidic areas with high biomass donot have corresponding higher NDVI values or LAIbecause much of the biomass is non-green woodytissue. Acidic sites had generally higher values thannon-acidic sites for phytomass, LAI, shrub biomass,and NDVI under comparable climate regimes. Anotable exception was the sandy nutrient-poor site atAtqasuk, which had relatively less phytomass thanthe colder site at Barrow (357 g m�2 vs. 452 g �2).
Copyright 2003 John Wiley & Sons, Ltd. Permafrost and Periglac. Process., 14: 103–123 (2003)

Vegetation-Soil-Thaw-Depth Relationships 115
Figure 7 Trends in five vegetation-related variables along the summer warmth gradient: (a) total phytomass, (b) LAI, (c) shrubbiomass, (d) organic horizon thickness, and (e) Integrated NDVI. Circles and solid lines are acidic sites, and triangles and dashed linesare non-acidic sites.
Trends of Thaw Depth Along Major Gradients
The non-acidic sites generally had deeper thaw thanthe acidic sites along gradients of moisture, warmth,NDVI, and organic-layer thickness (Figure 8). Late-August thaw depth did not show significant (p <0.05) trends with the SWI, NDVI or organic-layerthickness (Figure 8a, b, d). Thaw in non-acidicsites showed a significant negative trend with soilmoisture, likely due to drier near-surface soil horizonsin deeply thawed areas (Figure 8c).
Zonal Variation in Microscale Patterns ofVegetation and Thaw Depth Associated with FrostBoils
The details of trends in frost-boil plant communitiesalong the bioclimate gradient are presented in anotherpaper (Walker et al., 2003, in press). The generaltrends are: (1) from north to south there is a trend ofless bare soil, and more well-vegetated frost boils.
(2) The character of the frost boils change fromlarge nearly totally barren patches in subzone C tomore heterogeneous mixes of bare soil and sparseplant communities in subzone D, to completelyvegetated hummock features in subzone E. (3) Theinter-frost-boil areas change from sparse dry prostratedwarf-shrub plant communities in subzone C, towell-vegetated graminoid, dwarf-shrub, moss tundratypical of moist non-acidic tundra in subzone D,to tussock-graminoid, erect-dwarf shrub, moss plantcommunities typical of moist acidic tundra in subzoneE. Figure 9 illustrates the differences in frost boilsbetween Howe Island, a High-Arctic site on mineralsoils in subzone C, and Kurishka, Russia, a Low-Arctic site with a well-developed vegetation insubzone D.
Thaw depth on the sparsely vegetated subzone Csite at Howe Island was quite deep (Table 2). Inlate August, 2002, thaw averaged 68 cm on the frostboils and 61 cm between the frost boils. In subzone
Copyright 2003 John Wiley & Sons, Ltd. Permafrost and Periglac. Process., 14: 103–123 (2003)

116 D. A. Walker et al.
Figure 8 Trends in thaw depth with (a) SWI, (b) Integrated NDVI, (c) soil moisture, and (d) organic horizon thickness. Circles andsolid lines are data from acidic sites, and triangles and dashed lines are from non-acidic sites.
a b
Figure 9 (a) Frost boils in subzone C, Howe Island. Note the nearly barren frost boils. The sparse vegetation between the frost boilsconsists primarily of the prostrate dwarf-shrub, Dryas integrifolia, and crustose lichens. (b) Frost boils in subzone D, near Kurishka,Kolyma River, Russia. The frost boils are partially barren with many prostrate dwarf shrubs, lichens and mosses. The inter-frost boilareas are well vegetated with prostrate and erect dwarf shrubs (Betula exilis, Ledum palustre ssp. decumbens, Salix sphenophylla,S. pulchra, Vaccinium vitis-idaea), sedges (mostly Carex arctisibirica) and mosses (Dicranum spp., Aulacomnium turgidum andHylocomiium splendens).
D, thaw on the frost boils was consistently deep(68 cm at Deadhors, and 66 cm at Franklin Bluffsand Sagwon MNT), whereas thaw between the frostboils was shallower (55 cm at Deadhorse, and 58 cmat Franklin Bluffs, and Sagwon MNT). In subzone
E, the thaw on the frost boils was 46 cm at SagwonMAT, and 48 cm at Happy Valley. Thaw between thefrost boils was 30 cm at Sagwon MAT, and 37 cm atHappy Valley. The area covered by frost boils wasgreater in subzones C and D, varying from 21% at
Copyright 2003 John Wiley & Sons, Ltd. Permafrost and Periglac. Process., 14: 103–123 (2003)

Vegetation-Soil-Thaw-Depth Relationships 117
Table 2 Thaw in frost boils and inter-boil areas for the Dalton Highway grids: mean, sample size (N), and standarddeviation (s.d.), Aug 16–26, 2002. Area of frost boils is determined by dividing the N of frost boils by the N of theentire plot.
Location Frost boil thaw depth Inter-boil thaw depth Entire Plot Area of FrostBoils (%)Mean
(cm)(N) s.d. Mean
(cm)(N) s.d. Mean
(cm)(N) s.d.
Howe Island 68 (48) 4 61 (73) 6 64 (121) 5 39.7West Dock No frost boils 25 (441) 2 0Deadhorse 68 (167) 4 55 (274) 4 60 (441) 8 37.8Franklin Bluffs 66 (143) 4 55 (298) 4 60 (441) 8 32.4Sagwon MNT 66 (95) 5 56 (346) 10 58 (441) 10 21.5Sagwon MAT 46 (26) 9 30 (415) 8 32 (441) 9 5.9Happy Valley 48 (53) 10 37 (388) 9 38 (441) 10 12
Sagwon MNT to 40% at Howe Island, compared to5–12% in the acidic subzone-E sites at Sagwon MATand Happy Valley.
DISCUSSION
Effects of Summer Warmth on Plant Growth andThaw Depth
The summer insulative effect of the vegetation matclearly affects the depth of thaw on zonal sitesalong the bioclimate gradient. Towards the south,taller, denser plant canopies shade the soil andthick moss carpets and thicker soil organic horizonscounter the effect of warmer air temperature, sothat the thaw depth across the gradient shows littlecorrespondence with air temperature. The studyregion has a strong summer warmth gradient thatdirectly and indirectly affects plant production. TheSWI increased about 3.8 times from 8.9 °C monthsat Barrow to 34.2 °C months at Council. Above-ground phytomass increased about six fold fromabout 400 g m�2 at Barrow and West Dock toabout 2400 g m�2 at Council. Thaw depths, on theother hand, showed only a weak relationship tosummer warmth. Some of the deepest thaw depthswere actually near the Arctic coast at Howe Islandand Deadhorse (62 and 55 cm respectively). Ingeneral, increased plant biomass along the bioclimategradient acts as a negative feedback to increasesin thaw depth, because of the insulative effects ofvegetation and highly organic soil horizons. Thisrelation underscores the importance of vegetation ondevelopment of the active layer (Nelson et al., 1997;Hinkel and Nelson, 2003).
Studies from the Mackenzie River corridor alsohave shown little correspondence between latitude
and active-layer thickness (Brown et al., 2000).However, other studies using the CALM data haveshown strong relationships between thawing-degreedays and active-layer thickness (Nelson et al., 1997;Hinkel and Nelson, 2003). The strong correlationsin these studies are related to several factors. First,the 1 ð 1 km CALM grids are much larger thanour 10 ð 10-m plots. Our plots specifically focuson zonal vegetation, whereas the CALM gridscover broad landscapes with a variety of vegetationtypes. Other research has shown that the thawdepth in many intrazonal vegetation types, suchas wetlands, snowbeds, and dry areas, especiallythose with thin insulative organic layers do showstrong correlations with temperature (Vasiliev et al.,2003).
The zonal vegetation in subzones D and E, exceptat Council, is primarily tussock-tundra that occurs onhigh-ice permafrost soil that is well insulated fromthaw by the vegetation mat, and like peatlands showsonly a weak trend of increasing thickness of theactive layer with increases in regional temperature(Vasiliev et al., 2003). The trend of the active layerwith summer temperature in our study is stronglyaffected by changes at the northern end of our gradientwhere the soils rapidly change from mineral soils withno or thin organic layers to thick organic layers (recallthe deeper thaw in subzone D than in subzone E inFigure 4c).
It also points to the important control of theactive layer on vegetation properties. For example,no permafrost was encountered in the very shrubbytundra at Council. Tundra with dense shrubs over150 cm tall, such as at the Council site, is not typicalof zonal areas with continuous permafrost, but doesoccur in areas of discontinuous permafrost, such asthe southern Seward Peninsula, the northern portionsof the Yukon-Kuskokwim River delta, and the
Copyright 2003 John Wiley & Sons, Ltd. Permafrost and Periglac. Process., 14: 103–123 (2003)

118 D. A. Walker et al.
European Russian Arctic west of the Ural Mountains.It is possible that these dense, relatively tall shrubcommunities require soils without permafrost, as wasthe case at Council. Alternatively, the taller shrubcover may develop primarily in areas with relativelydeep winter snow cover that insulates the soil inwinter and prevents the formation of permafrost(Sturm et al., 2001a). National Weather Service dataindicate that winter snow cover is much deeper onthe southern Seward Peninsula (average of 156 cmof snowfall at Nome vs. 82 cm at Umiat, and 77 cmat Barrow).
Most of the increase in phytomass along thegradient was due to shrubs, which increased about20-fold, from less than 100 g m�2 at the coastto about 2100 g m�2 at Council. Graminoid andmoss biomass showed a smaller increase andlichens decreased, possibly because competition andshading from the taller shrubs limited growth ofthe sedges and cryptogamic plants. The steepness ofthe phytomass-SWI relationship was distorted by thevery large phytomass at Council, which had 2.6 timesgreater above-ground phytomass than the next largestphytomass value at the Sagwon MAT site. If Councilis excluded from the data, phytomass increased bya factor of about two from Barrow to Quartz Creek.Very cold summer temperatures near the BeaufortSea severely limit the amount of plant productionthat can be allocated to woody support tissues. Otherwork has shown a strong increase in the height andbiomass of woody shrubs inland from the Arctic coast(Walker, 1987).
Reflections on the Interactions BetweenPermafrost and Zonal Tundra
Consideration of permafrost-vegetation interactionson zonal arctic sites can help us interpret how changesin regional climate could affect arctic ecosystems.The zonal concept, which originated with Dokuchaevin 19th century Russian soil science (Vysotsky,1927), provides a means to subdivide the greatdiversity of Earth’s vegetation into a manageablenumber of categories, which can then be used for avariety of scientific applications, such as computersimulations of vegetation and ecosystem response toclimate change (Cramer, 1997). Zonal vegetation isthe climatic climax that develops under the prevailingclimate on ‘placor’ sites. Placors are generally flator gently sloping sites with fine-grained soils and noextremes of soil moisture, snow, soil chemistry, soiltexture or disturbance regimes.
Tussock-tundra has traditionally been consideredto be the zonal vegetation in subzones D and E
in much of northern Alaska, northwestern Canada,and northeast Siberia (Beringia) (Alexandrova, 1980;Yurtsev, 1994). Recently, this has been challengedbecause the high-ice-content permafrost of theseregions results in saturated soils, which is not a normalcharacteristic of zonal sites (Razzhivin, 1999). Well-developed zonal tussock-tundra occurs extensivelyon very old terrain that was not glaciated duringthe last glacial episode. Tussock-tundra is widelydistributed across subzones D and E, with somevariation in species composition or structure. Thedifferentiation between the zones is based more ondifferences in intrazonal sites such as streamsides,wetlands, and warmer microsites. This led Razzhivinto suggest that instead of looking for zonal vegetationon flat sites, we should look to moderate slopes withwell-drained soils. Using this approach in subzoneD, the zonal vegetation would consist of erect dwarf-shrub tundra, and in subzone E it would consist oftaller shrubs, like that at Council.
In theory, this approach helps to isolate the effectof summer warmth from the effects of soil drainage.However, in practice it is difficult to find suchrepresentative slopes. For example, in the ArcticFoothills of northern Alaska, most gentle slopeshave the same ice-rich permafrost as flat sites. Evenmoderate slopes of the Arctic Foothills are classifiedas ‘wetlands’ according the US Fish and WildlifeService wetland classification system (Cowardinet al., 1979; Walker et al., 1989). Furthermore,vegetation on slopes is complicated by other factors,including redistribution of snow and differences intotal incident radiation, so it seems unwise to usedifferent criteria for selecting zonal sites in someparts of the Arctic than are used in other zones ofthe globe. It may be better to keep the topographicposition of the placor consistently on flat or gentlysloping terrain, and accept that permafrost is a uniquearctic phenomenon that influences a suite of sitesfactors affecting zonal vegetation.
We can get some idea of the vegetation thatdevelops in the absence of near-surface, ice-richpermafrost at both ends of the bioclimate gradientin northern Alaska. In subzone C, Barrow andWest Dock are typical of maritime sites along thecoast, with moist, ice-rich soils, relatively highbiomass (about 400 g m�2� and shallow thaw depths(<40 cm) (see Figure 1a). In contrast, the HoweIsland site (Figure 9a) is more typical of large areasof subzone C in the High Arctic of Canada, wheredrier soils prevail with more open plant canopies,low biomass (<200 g m�2� and deep active layers(65 cm). So at the northern extreme of the gradient,
Copyright 2003 John Wiley & Sons, Ltd. Permafrost and Periglac. Process., 14: 103–123 (2003)

Vegetation-Soil-Thaw-Depth Relationships 119
zonal sites with thick active layers have much lessbiomass than sites with thin active layers.
The opposite situation occurs in the southern partsof subzone E. Here, zonal sites with ice-rich soils andthin active layers develop tussock-tundra; whereaszonal sites with thick active layers have dense shrub-tundra. This vegetation occurs on extensive areasof discontinuous permafrost, such as the southernSeward Peninsula, the northern portions of theYukon-Kuskokwim River delta, and the EuropeanRussian Arctic west of the Ural Mountains. It is likelythat dense, relatively tall shrub communities requirewarm soils. Snow is a likely contributing factor towarmer winter soil conditions because it insulatesthe soil in winter and prevents the formation ofpermafrost. For example, winter snow cover is muchdeeper on the southern Seward Peninsula (average of156 cm of snowfall at Nome vs. 82 cm at Umiat, and77 cm at Barrow).
Understanding the interaction between permafrostand zonal vegetation types is key to predicting theirlinked response to climate change. In High-Arcticsubzone C, where well-drained mineral soils prevail,we might expect that climate warming would promoteconditions more similar to the Low Arctic (subzones4 and 5) (Walker and Walker, 1996). Warmer high-arctic ecosystems would produce more plant biomass;more extensive moss layers, and thicker soil organichorizons. Paludification would increase soil moisture,and active layers would become less thick. At theother end of the bioclimate gradient in subzoneE, especially near the tree line, we might expectthat climate warming would increase the active-layerthickness, and that permafrost would become morediscontinuous, resulting in patchier landscapes withareas of shrub-tundra or even forests developing onsites without permafrost.
Effects of Soil pH and Frost Boils on TundraEcosystem Properties and Relevance to ClimateChange
The results of this study support the conclusions ofearlier studies that showed generally deeper thaw innon-acidic soils (Nelson et al., 1998). Observations atOumalik indicate that the acidic/nonacidic boundaryobserved near Sagwon extends all along the northernfront of the Arctic Foothills. The cause of theboundary is still not fully understood, but themajor physiographic break at the Foothills boundarycoincides with a major climate boundary (Zhanget al., 1996). The Foothills appear to affect the meanposition of the Arctic Front and affect a major changein the wind regimes. Generally, windier, colder, drier
conditions occur north of the boundary resultingin shallower, denser snowpacks during winter andcolder soil surface temperatures (Liston and Sturm,2002; Taras et al., 2002), and less precipitation andhigher evapotranspiration during the summer. Thenet result is that south of the boundary there aremoister soils, more plant production, thicker organicsoil horizons, and thinner active layers.
Plant communities on either side of the boundaryat Oumalik were similar to those found at Sagwon,and thaw depths followed a similar pattern, withdeeper thaw north of the boundary. Compared tomoist acidic tundra, moist non-acidic soils generallysupported lower amounts of biomass, higher plantdiversity, lower NDVI, and more frost boils. Moistnon-acidic tundra generally has open plant canopiesthat permit more solar radiation to reach the soilsurface. The trend of increasing soil organic horizonsfrom north to south reflects the general increase in thebiomass of the moss layers. Non-acidic tundra mosslayers increased substantially toward the southernend of subzone D. For example, there was about100 g m�2 or less of moss in the non-acidic sitesnear Howe Island, West Dock and Deadhorse. AtFranklin Bluffs, there was 237 g m�2 of moss, and437 g m�2 at Sagwon MNT. The largest increase inmoss biomass occurs within subzone D and is causedmostly by increases in the brown moss Tomentypnumnitens. This moss forms luxuriant carpets in the inter-frost-boil areas at the southern boundary of subzoneD at both Sagwon and Oumalik. These thick carpetsof Tomentypnum appear to have a distinct limitingeffect on the thaw depths.
This observation has implications for past climatechange on the Arctic Slope. Palaeoenvironmen-tal studies in northern Alaska indicate that forb-and grass-rich ecosystems prevailed during the lastglacial maximum. Paludification of arctic Alaskanlandscapes followed the last cold interval, and by8500 years BP, moist acidic tundra was dominant inlarge regions of the Foothills (Mann et al., 2002).Shifts in soil moisture toward a wetter system wereresponsible for the dramatic ecosystem changes thatoccurred during this period. Paludification resultedfrom linked vegetation-permafrost responses. BeforeSphagnum and other acidophilous mosses becameestablished, basiphilous mosses must have caused theinitial trend toward wetter more acidic conditions. Itappears likely from observations along the present-day climate gradient that Tomentypnum nitens wasa primary precursor of acidophilous mosses. WhereTomentypnum forms thick carpets, it changes the ther-mal and hydrological properties of the site in a manner
Copyright 2003 John Wiley & Sons, Ltd. Permafrost and Periglac. Process., 14: 103–123 (2003)

120 D. A. Walker et al.
similar to that of Sphagnum. Eventually, without con-tinual input of base cations from, for example, loessdeposition or through cryoturbation, the system even-tually becomes leached of base cations, and acidictussock-tundra becomes established. More detailedexamination of the boundary near Sagwon may helpin determining how the switch from non-acidic toacidic tundra occurred over large areas of north-ern Alaska at the end of the last glacial maximumand could help predict how this boundary betweensubzones D and E might respond to future climatechange.
Feasibility of a Circumpolar Active-Layer Modeland Map
In the absence of a means to directly determine thepermafrost table using remote sensing, modellingapproaches, in combination with landcover maps,are the most promising for mapping active layerdepth (Nelson et al., 1997). Mapping the active layerrequires spatial information for several factors thatinfluence the thermal properties of the soil, includingsoil density, soil water, soil texture, thickness ofthe organic layer, topographic position, and numberof thawing degree days (Shiklomanov and Nelson,2003, submitted; Klene et al., 2001, 2002). It is verydifficult to obtain spatially distributed estimates ofall these variables for very large areas. However,plant biomass and vegetation type are also functionsof some of these same properties (for example, soiltype, soil water, TDD). Vegetation can thereforebe used in combination with other key spatialdata sets, including soils maps and topographymaps, to compile active-layer maps. This paperprovides insights regarding climate effects on specificcomponents of the zonal vegetation in the Low Arcticand how these are related to changes in thaw depth.Other studies have also emphasized the dependenceof the active layer on vegetation and landscapetype (Vasiliev et al., 2003, in press; Shiklomanovand Nelson, 2003, in press). Extrapolation to thecircumpolar region still requires obtaining moresubstantive information for common substrate andterrain types in the circumpolar Arctic that were notexamined with sufficient replication in this study if atall (e.g., sandy substrates, rocky terrain, High Arcticclimates, zonal shrub tundra, wetlands). Six keycircumpolar maps are now available as ancillary datato help in making a circumpolar active layer map: theCircumpolar Arctic Vegetation Map and circumpolarNDVI maps (Walker et al., 2002a, 2002b, CAVMMap Team, 2003), the Circumpolar Soils Map(Tarnocai et al., 2003), the Circum-Arctic map of
Permafrost and Ground-Ice Conditions (Brown et al.,1997), and the global digital elevation model (Geschet al., 1999). These can provide a first approximationof the variables at coarse scales. Coordinated studies,such as in the ATLAS project, involving soilscientists, permafrost specialists, vegetation, andremote-sensing specialists at many sites across theArctic bioclimate gradient are the best hope to gainsufficient empirical data to develop the circumpolarmodels and maps.
CONCLUSIONS
1. Zonal vegetation is strongly linked to active-layerregimes across the summer climate gradient innorthern Alaska. Active layers are affected bytwo opposing trends along the climate gradient.Warmer air temperatures promote deeper thaw,but the insulation provided by more dense plantcanopies and thicker soil organic horizons counterthis trend. There was little overall increase in thawdepth on zonal sites despite nearly a four-foldincrease in the amount of summer warmth. Thebiomass of tussock-tundra growing in bioclimatesubzones D and E on high-ice-permafrost soils didnot increase as strongly with temperature as mightbe expected in the absence of permafrost. Thebiomass of tussock-tundra appears to be limitedmore by cold wet soils than by air temperature.In the absence of ice-rich permafrost, othervegetation types replace tussock-tundra on zonalsites, including dwarf-shrub tundra in subzone Dand low-shrub tundra in subzone E.
2. The increased warming associated with climatechange will not necessarily lead to uniformthickening of the active layer. In some portions ofsubzone C that currently have mineral soils anddeep active layers, warmer temperatures couldcause thicker moss layers and more dense plantcover and reduce active layer thicknesses. Nearthe boundary between subzones D and E, warmingcould lead to a decrease in active layer variabilitydue in part to colonization of frost boils. In warmerparts of subzone E, expansion of shrub-tundrawith thicker active layers could result in patchierlandscapes with discontinuous permafrost.
3. Soil pH strongly influences plant communityproduction, and indirectly influences the activelayer thickness. Acidic tundra in bioclimatesubzones D and E had consistently greaterphytomass, LAI, and NDVI and shallower thawdepths than non-acidic tundra. The distinctivespectral boundary observed near Sagwon in
Copyright 2003 John Wiley & Sons, Ltd. Permafrost and Periglac. Process., 14: 103–123 (2003)

Vegetation-Soil-Thaw-Depth Relationships 121
previous studies extends across all of the ArcticSlope and is caused by different vegetation onacidic and non-acidic soils on either side of theboundary. The microsite variability associatedwith frost boils is an important cause of thegenerally deeper thaw depths in non-acidic soils.
4. Good information exists from northern Alaskathat could be used to extrapolate the biomass,and active layer results to the Low Arc-tic of much of the circumpolar region. Moresoil/vegetation/active layer information from abroader suite of terrain types and bioclimate sub-zones is needed to develop a circumpolar activelayer map.
ACKNOWLEDGEMENTS
This manuscript was prepared under National ScienceFoundation grant OPP-0120736 and OPP-9908829.This work was performed under several NSF grantsto the participating investigators.
REFERENCES
Alexandrova VD. 1980. The Arctic and Antarctic:Their Division into Geobotanical Areas. CambridgeUniversity Press: Cambridge.
Anisimov OA, Shiklomanov NI, Nelson FE. 2002.Variability of seasonal thaw depth in permafrost regions:a stochastic modeling approach. Ecological Modeling53: 217–227.
Benninghoff WS. 1966. Relationships between vegetationand frost in soils. In Proceedings of Permafrost:First International Conference. National Academy ofSciences, Purdue University: Lafayette, IN; 9–13.
Bigelow NH, Brubaker LB, Edwards ME, Harrison SE,Prentice IC, Anderson PM, Andreev AA, Bartlein PJ,Christensen TR, Cramer W, Kaplan JO, Lozhkin AV,Matveyeva NV, Murray DF, McGuire AD, RazzhivinVY, Ritchie JC, Smith B, Walker DA, Igarashi AD,Kremenetskii KV, Paur A, Pisaric MFJ, VolkovaVS. 2003. Climate change and Arctic ecosystems I:Vegetation changes north of 55 °N between the lastglacial maximum, mid-Holocene and present. Journalof Geophysical Research. In press.
Bockheim JG, Walker DA, Everett LR. 1996. Soil carbondistribution in non-acidic and acidic soils of arcticAlaska. In Advances of Soil Science, Lal R, Kimble JM,Follett RF, Stewart BA (eds). Proc. Internat. Symp. onCarbon Sequestration in Soil. CRC Press, Ohio StateUniversity: Columbus; 143–155.
Bockheim JG, Walker DA, Everett LR, Nelson FE, Shik-lomanov NI. 1998. Soils and cryoturbation in moistnon-acidic and acidic tundra in the Kuparuk river basin,arctic Alaska, U.S.A. Arctic and Alpine Research 30:166–174.
Brown J, Ferrians OJ, Heginbottom JA, and Melnikov ES.1997. Circum-arctic map of permafrost and ground-iceconditions. US Geological Survey Map CP-45, scale1 : 10 000 000.
Brown J, Hinkel KM, Nelson FE. 2000. The circumpo-lar active layer monitoring (CALM) program: researchdesigns and initial results. Polar Geography 24:165–258.
Carter LD. 1981. A Pleistocene sand sea on the AlaskanArctic Coastal Plain. Science 211: 381–383.
CAVM Map Team. 2003. Circumpolar Arctic VegetationMap, Conservation of Arctic. Flora and Fauna (CAFF)Map No. 1. US Fish and Wildlife Service, Anchorage,AK. Scale 1 : 75 000 000.
Chapin FS III, McGuire AD, Randerson J, Pielke R, Bal-docchi D, Hobbie SE, Roulet N, Eugster W, Kasis-chke E, Rastetter EB, Zimov SA, Running SW. 2000.Arctic and boreal ecosystems of western North Americaas components of the climate system. Global ChangeBiology 6: 211–223.
Chernov YL, Matveyeva NV. 1997. Arctic ecosystems inRussia. Wielgolaski FE (ed). Polar and Alpine Tundra.Elsevier, Amsterdam: 361–507.
Cowardin LM, Carter V, Golet FC, LaRoe ET. 1979. Clas-sification of wetlands and deep water habitats ofthe United States. US Government Printing OfficeFWS/OBS-79/31, US Fish and Wildlife Service.
Cramer W. 1997. Modeling the possible impact of climatechange on broad-scale vegetation structure: examplesfrom northern Europe. In Oechel WC, Callaghan T,Gilmanov T, Holten JI, Maxwell B, Molau U, andSveinbjornsson B (eds) Global Change and Arctic Ter-restrial Ecosystems. Springer, New York: 312–329.
Ebersole JJ. 1985. Vegetation disturbance and recovery atthe Oumalik Oil Well, Arctic Coastal Plain, Alaska.Ph.D. Thesis University of Colorado, Boulder.
Elvebakk A, Elven R, and Razzhivin VY 1999. Delimita-tion, zonal and sectorial subdivision of the Arctic for thePanarctic Flora Project. In Nordal I, Razzhivin VY (eds).The Species Concept in the High North—A PanarcticFlora Initiative. The Norwegian Academy of Scienceand Letters, Oslo: 375–386.
Eugster W, McFadden JP, Chapin FS III. 1997. A compar-ative approach to regional variation in surface fluxesusing mobile eddy correlation towers. Boundary-LayerMeteorology 85: 293–307.
Everett KR. 1980. Distribution and variability of soilsnear Atkasook, Alaska. Arctic and Alpine Research 12:433–446.
Gesch DB, Verdin KL, Greenlee SK. 1999. New landsurface digital elevation model covers the Earth. EOSTransactions, American Geophysical Union 80: 69–70.
Goulden ML, Wofsy SC, Harden JW, Trumbore SE, Sut-ton DJ, Bazzaz A, Munger JW. 1998. Sensitivity ofboreal forest carbon balance to soil thaw. Science 279:214–217.
Hinkel KM, Nelson FE. 2003. Spatial and temporalpatterns of active layer thickness at circumpolaractive layer monitoring (CALM) sites in northern
Copyright 2003 John Wiley & Sons, Ltd. Permafrost and Periglac. Process., 14: 103–123 (2003)
122 D. A. Walker et al.
Alaska, 1995–2000. Journal of Geophysical Research-Atmospheres. 108: 2. DOI: 10.1029/2001JD000927.
Hinzman LD, Goering DJ, Kane DL. 1998. A distributedthermal model for calculating soil temperature profilesand depth of thaw in permafrost regions. Journal ofGeophysical Research 103: 28 975–28 992.
Jia GJ, Epstein HE, Walker DA. 2002. Spatialcharacteristics of AVHRR-NDVI along latitudinaltransects in northern Alaska. Journal of VegetationScience 13: 315–326.
Jorgenson MT, Racine CH, Walters JC, and Osterkamp TE.2001. Permafrost degradation and ecological changesassociated with a warming climate in central Alaska.Climatic Change 48: 551–579.
Kane DL. 1997. The impact of hydrologic perturbationson arctic ecosystems induced by climate change.In Oechel WC, Callaghan T, Gilmanov T, Holten JI,Maxwell B, Molau U, and Sveinbjornsson B, (eds)Global Change and Arctic Terrestrial Ecosystems.Springer, New York: 63–81.
Kane DL, Hinzman LD, Zarling JP. 1991. Thermalresponse of the active layer to climatic warming ina permafrost environment. Cold Regions Science andTechnology 19: 111–122.
Kaplan JO, Bigelow NH, Bartlein PJ, Christensen TR,Cramer W, Harrison SP, Matveyeva NV, McGuire AD,Murray DF, Prentice IC, Razzhivin VY, Smith B,Walker DA, Anderson PM, Andreev AA, Brubaker LB,Edwards ME, Lozhkin LV, Ritchie JC. 2003. Climatechange and Arctic ecosystems II: Modeling, paleodata-model comparisons, and future projections. Journal ofGeophysical Research-Atmospheres. In press.
Kittel TFG, Steffen WL, Chapin FS. III. 2000. Globaland regional modelling of Arctic-boreal vegetationdistribution and its sensitivity to altered forcing. GlobalChange Biology 6: 1–18.
Klene AE, Nelson FE, Shiklomanov NI, Hinkel KM. 2001.The n-factor in natural landscapes: Variability of air andsoil-surface temperatures, Kuparuk River basin, Alaska.Arctic, Antarctic, and Alpine Research 33: 140–148.
Klene AE, Nelson FE, Shiklomanov NI. 2002. The N-factor as a tool in geocryological mapping seasonal thawin thaw in the Kuparuk River Basin, Alaska. PhysicalGeography 22: 449–466.
Komarkova V, Webber PJ. 1980. Two Low Arctic vege-tation maps near Atkasook, Alaska. Arctic and AlpineResearch 12: 447–472.
Lachenbruch AH, Marshall BV. 1986. Changing climate:geothermal evidence from permafrost in the Alaskanarctic. Science 234: 689–696.
Liston G, Sturm M. 2002. Winter precipitation patterns inarctic Alaska determined from a blowing-snow modeland snow-depth observations. Journal of Hydrometeo-rology 3: 646–659.
Mann DH, Peteet DM, Reanier RE, Kunz ML. 2002.Responses of an arctic landscape to Late glacial andearly Holocene climatic changes: the importance ofmoisture. Quaternary Science Reviews 21: 997–1021.
Markon CJ. 1999. Characteristics of the Alaskan 1-kmAdvanced Very High Resolution Radiometer data sets
used for analysis of vegetation biophysical properties.USGS Open File Report 99–088, US Geological Survey.
Markon CJ, Fleming MD, Binnian EF. 1995. Characteris-tics of vegetation phenology over the Alaskan landscapeusing AVHRR time-series data. Polar Record 31:179–190.
Matveyeva NV. 1998. Zonation in Plant Cover of theArctic. Russian Academy of Sciences, Proceedings ofthe Komarov Botanical Institute, Russian Academy ofScience, Moscow, No. 21. (In Russian).
McGuire AD, Clein JS, Melillo JM, Kicklighter DW,Meier RA, Vorosmarty CJ, Serreze MC. 2000.Modelling carbon responses of tundra ecosystems tohistorical and projected climate: sensitivity of pan-Arctic carbon storage to temporal and spatial variationin climate. Global Change Biology 6: 141–159.
McGuire AD, Sturm M, Chapin FS. III. 2003. Arctic tran-sitions in the Land-Atmosphere system (ATLAS): Back-ground, objectives, results, and future directions. Journalof Geophysical Research - Atmospheres. 108: 2. DOI:10.1029/2001JD000236.
Muller SV, Walker DA, Nelson F, Auerbach N, Bock-heim J, Guyer S, and Sherba D. 1999. Accuracy assess-ment of a land-cover map of the Kuparuk River basin,Alaska: considerations for remote regions. Photogram-metric Engineering & Remote Sensing 64: 619–628.
Nelson FE, Shiklomanov NI, Mueller GR, Hinkel KM,Walker DA, Bockheim JG. 1997. Estimating active-layer thickness over a large region: Kuparuk River Basin,Alaska. Arctic and Alpine Research 29: 367–378.
Nelson FE, Hinkel KM, Shiklomanov NI, Mueller GR,Miller LL, Walker DA. 1998. Active-layer thicknessin north-central Alaska: systematic sampling, scale,and spatial autocorrelation. Journal of GeophysicalResearch-Atmospheres 103: 28 963–28 973.
Nelson FE, Anisimov OA, Shiklomanov NI. 2001. Sub-sidence risk from thawing permafrost. Nature 410:889–890.
Oechel WC, Callaghan T, Gilmanov T, Holten JI,Maxwell B, Molau U, and Sveinbjornsson B, (eds).1997. Global Change and Arctic Terrestrial Ecosystems.Springer, New York.
Oechel WC, Vourlitis GL, Verfaillie J Jr, Crawford T,Brooks S, Dumas E, Hope A, Stow D, Boynton B,Nosov V, Zuleta R. 2000. A scaling approach for quan-tifying the net CO2 flux of the Kuparuk River Basin,Alaska. Climate Change Biology 6: 160–173.
Razzhivin VY. 1999. Zonation of vegetation in the RussianArctic. In Nordal I, Razzhivin VY. (eds). The SpeciesConcept in the High North - A Panarctic Flora Initiative.The Norwegian Academy of Science and Letters, Oslo:113–130.
Reeburgh WS, King JY, Regli SK, Kling GW, Auer-bach NA, Walker DA. 1998. A CH4 emission estimatefor the Kuparuk River basin, Alaska. Journal of Geo-physical Research-Atmospheres 103: 29 005–29 014.
Shiklomanov NI and Nelson FE. 2002. Active-layer map-ping at regional scales: a 13-year spatial time series forthe Kuparuk Region, north-central Alaska. Permafrostand Periglacial Processes 13: 219–230.
Copyright 2003 John Wiley & Sons, Ltd. Permafrost and Periglac. Process., 14: 103–123 (2003)

Vegetation-Soil-Thaw-Depth Relationships 123
Shiklomanov NI and Nelson FE. 2003. Statistical repre-sentation of landscape-specific active-layer variability.Proceedings of the International Permafrost Confer-ence, Zurich, Switzerland, Swets & Zeitlinger, TheNetherlands. In press.
Shippert MM, Walker DA, Auerbach NA, Lewis BE. 1995.Biomass and leaf-area index maps derived from SPOTimages for Toolik Lake and Imnavait Creek areas,Alaska. Polar Record 31: 147–154.
Silapaswan CS, Verbyla D, McGuire AD. 2001. Landcover change on the Seward Peninsula: The use ofremote sensing to evaluate potential influences of climatechange on historical vegetation dynamics. Journal ofRemote Sensing 5: 542–554.
Soil Survey Staff. 1993. Soil Survey Manual, USDAHandbook No. 18. US Government Printing Office,Washington, DC.
Sturm M, Racine C, Tape K. 2001a. Increasing shrubabundance in Arctic. Nature 411: 547–548.
Sturm M, McFadden JP, Liston GE, Chapin FS III,Racine CH, Holmgren J. 2001b. Snow-shrub interac-tions in arctic tundra: a hypothesis with climatic impli-cations. Journal of Climate 14: 336–344.
Taras B, Sturm M, Liston GE. 2002. Snow-ground inter-face temperatures in the Kuparuk River Basin, ArcticAlaska: measurements and model. Journal of Hydrome-teorology 3: 377–394.
Tarnocai CJ, Kimble J, Waltman S, Swanson D, Gory-achkin S, Naumov YM, Stolbovoi V, Jakobsen, Broll G,Montanarella L, Arnoldussen O, Arnalds O, Yli-Halla M. 2003. Northern Circumpolar Soils. ResearchBranch, Agriculture and Agri-Food Canada, Ottawa,Canada. 1 : 10,000,000-scale map.
Thayer-Snyder C. 2000. A preliminary Landsat MSS-derived land-cover map of the Seward Peninsula, Alaska:Classification methods, and comparison with existingdata sets. Poster presented at the ARCSS LAII ScienceWorkshop, Seattle, WA, 23–26 Feb 2000.
van Everdingen ROe. 1998. Multi-language Glossary ofPermafrost and Related Ground-Ice Terms. Universityof Calgary, Calgary.
Vasiliev AA, Moskalenko NG, Brown J. 2003. A newapproach for interpreting active layer observationsin the context of climate change: a West Siberianexample. Proceedings of the International PermafrostConference, Zurich, Switzerland, Swets & Zeithinger,The Netherlands. In press.
Viovy N. 2000. Automatic classification of time series(ACTS): a new clustering method for remote sensingtime series. International Journal of Remote Sensing 21:1537–1560.
Vysotsky GN. 1927. Theses on soil and moisture (con-spectus and terminology). In Lesovedenie (ed). SbornikLesnogo Obschestva v Leningrade, Leningrad: 67–79(In Russian).
Walker DA. 1987. Height and growth-ring responseof Salix lanata ssp. richardsonii along the coastaltemperature gradient of northern Alaska. CanadianJournal of Botany 65: 988–993.
Walker DA and Barry NC. 1991. Toolik Lake permanentvegetation plots: site factors, soil physical and chemicalproperties, plant species cover, photographs and soildescriptions. Data report to the Department of EnergyR4D Program, Institute of Arctic and Alpine Research,University of Colorado, Boulder, 48 pp C appendices.
Walker DA and Walker MD. 1996. Terrain and vegetationof the Imnavait Creek Watershed. In Reynold JF andTenhunen JD (eds). Landscape Function: Implicationsfor Ecosystem Disturbance, a Case Study in ArcticTundra. Springer-Verlag, New York: 73–108.
Walker DA, Auerbach NA, Bockheim JG, Chapin FS III,Eugster W, King JY, McFadden JP, Michaelson GJ,Nelson FE, Oechel WC, Ping CL, Reeburgh WS,Regli S, Shiklomanov NI, Vourlitis GL. 1998. Energyand trace-gas fluxes across a soil pH boundary in theArctic. Nature 394: 469–472.
Walker DA, Bockheim JG, Chapin FS III, Eugster W, Nel-son FE, Ping CL. 2001. Calcium-rich tundra, wildlife,and the ‘‘Mammoth Steppe’’. Quaternary ScienceReviews 20: 149–163.
Walker DA, Gould WA, Maier HA, Raynolds MK. 2002.The Circumpolar Arctic Vegetation Map: AVHRR-derived base maps, environmental controls, and inte-grated mapping procedures. International Journal ofRemote Sensing 23: 2552–2570.
Walker DA, Epstein HE, Jia GJ, Copass C, Edwards EJ,Gould WA, Hollingsworth J Knudson J, Maier H,Moody A, Raynolds MK. 2003. Phytomass, LAI,and NDVI in northern Alaska: relationships tosummer warmth, soil pH, plant functional types andextrapolation to the circumpolar Arctic. Journal ofGeophysical Research—Atmospheres. 108: 2. DOI:10.1029/2001JD0098.
Walker MD, Walker DA, Everett KR. 1989. Wetland soilsand vegetation, Arctic Foothills, Alaska. US Fish andWildlife Service Report 89 (7).
Washburn AL. 1956. Classification of patterned groundand review of suggested origins. Geological Society ofAmerica Bulletin 67: 823–866.
Weller G, Chapin FS, Everett KR, Hobbie JE, Kane D,Oechel WC, Ping CL, Reeburgh RS, Walker D, Walsh J.1995. The Arctic Flux Study: a regional view of tracegas release. Journal of Biogeography 22: 365–374.
Yurtsev BA. 1994. Floristic division of the Arctic. Journalof Vegetation Science 5: 765–776.
Zhang T, Osterkamp TE, Stamnes K. 1996. Some charac-teristics of the climate in Northern Alaska, U.S.A. Arcticand Alpine Research 28: 509–518.
Copyright 2003 John Wiley & Sons, Ltd. Permafrost and Periglac. Process., 14: 103–123 (2003)