Embed Size (px)
Citation preview

Scientific Society of Advanced Research and Social ChangeSSARSC International Journal of Information and Communication Technology
Volume 1 Issue 1, January-June 2018, ISSN 2581 - 5873
Vegetation change Detection in Delhi using NormalizedDifference Vegetation Index (NDVI).
1Ravindra Nath Tiwari (IPGI Training head,GIS Division), [email protected] Awasthi (M.Sc. Biodiversity and Conservation University School of Environment Management)
[email protected] Guru Gobind Singh Indrasprastha University3S N Rajan, [email protected] IMS Engineering College, Ghaziabad,India
ABSTRACT
This study presents vegetation changeDetection for the analysis of satelliteimageries based on NDVI (NormalizedDifference Vegetation Index) over the periodof Four years from 2011 to 2015. NDVIemploys the Multi-Spectral Remote Sensingdata technique to find Vegetation Index TheVegetation analysis can be helpful inpredicting the unfortunate natural disastersto provide humanitarian aid, damageassessment and furthermore to device newprotection strategies. Here,the vegetationgreenness (NDVI) has been reduced by 5%over the period of time while variousfluctuations has been seen in different areasof Delhi.
KEYWORDS; Vegetation change detection,NDVI, Multispectral, Remote Sensing,Natural Disasters.
INTRODUCTION
The term "remote sensing" generally refersto the use of satellite- or aircraft-basedsensor technologies to detect and classifyobjects on Earth, including on the surface
and in the atmosphere and oceans, based onpropagated signals (e.g. electromagneticradiation).
The Multi Spectral Remote Sensing imagesare very efficient for obtaining a betterunderstanding of the earth environment(Ahmadi & Nusrath,2012).It is the Scienceand Art of acquiring information andextracting the features in form of Spectral,Spatial and Temporal about some objects,area or phenomenon, such as vegetation,land cover classification, urban area,agriculture land and water resources withoutcoming into physical contact of these objects(Karaburun & Bhandari,2010).
The Remote Sensing data has manyapplication areas including: land coverclassification, soil moisture measurement,forest type classification, measurement ofliquid water content of vegetation, snowmapping, sea ice type classification,oceanography (Karaburun &Bhandari,2010).

Scientific Society of Advanced Research and Social ChangeSSARSC International Journal of Information and Communication Technology
Volume 1 Issue 1, January-June 2018, ISSN 2581 - 5873
NDVI
The Normalized Difference VegetationIndex (NDVI) is a numerical indicator thatuses the visible and near-infrared bands ofthe electromagnetic spectrum, and isadopted to analyze remote sensingmeasurements and assess whether the targetbeing observed contains live greenvegetation or not. NDVI has found a wideapplication in vegetative studies as it hasbeen used to estimate crop yields, pastureperformance, and rangeland carryingcapacities among others. It is often directlyrelated to other ground parameters such aspercent of ground cover, photosyntheticactivity of the plant, surface water, leaf areaindex and the amount of biomass.
NDVI was first used in 1973 by Rouse et al.from the Remote Sensing Centre of TexasA&M University. Generally, healthyvegetation will absorb most of the visiblelight that falls on it, and reflects a largeportion of the near-infrared light. Unhealthyor sparse vegetation reflects more visiblelight and less near-infrared light. Bare soilson the other hand reflect moderately in boththe red and infrared portion of theelectromagnetic spectrum (Holme et al1987). Since we know the behavior of plantsacross the electromagnetic spectrum, we canderive NDVI information by focusing on thesatellite bands that are most sensitive tovegetation information (near-infrared andred). The bigger the difference thereforebetween the near-infrared and the redreflectance, the more vegetation there has tobe. The NDVI algorithm subtracts the red
reflectance values from the near-infrared anddivides it by the sum of near-infrared andred bands.
NDVI= (NIR-RED) / (NIR+RED)
This formulation allows us to cope with thefact that two identical patches of vegetationcould have different values if one were, forexample in bright sunshine, and anotherunder a cloudy sky. The bright pixels wouldall have larger values, and therefore a largerabsolute difference between the bands. Thisis avoided by dividing by the sum of thereflectances.
Theoretically, NDVI values are representedas a ratio ranging in value from -1 to 1 but inpractice extreme negative values representwater, values around zero represent bare soiland values over 6 represent dense greenvegetation.
Digital image processing of satellite dataprovides tools for analyzing the imagethrough different algorithms andmathematical indices. Features are based onreflectance characteristics, and indices havebeen devised to highlight the features ofinterest on the image (Deep &Saklani,2014 ). There are several indices forhighlighting vegetation bearing areas on aremote sensing scene. NDVI is a commonand widely used index (Bhandari &Kumar,2012).It is an important vegetationindex, widely applied in research on globalenvironmental and climatic change(Bhandari & Kumar,2012).

Scientific Society of Advanced Research and Social ChangeSSARSC International Journal of Information and Communication Technology
Volume 1 Issue 1, January-June 2018, ISSN 2581 - 5873
Many researchers have reported the use ofNDVI for vegetation monitoring(Yang,Zhu&Liu,2010;Lan et al,2009) assessing thecrop cover(Shikha et al,2007) droughtmonitoring and agricultural droughtassessment at national(Kim,Kwak&Y00,2008;Yamaguchi et al,2010) andglobal level(Smith,2015) Vegetation index(VI) is a simple and effective measurementparameter, which is used to indicate theearth surface vegetation covers and cropsgrowth status in remote sensing field(Smith,2015).
OBJECTIVES-
NDVI Analysis.
To perform a vegetation change
detection using Landsat TM imagery.
Interpret change detection results
STUDY AREA AND DATACOLLECTION
The Investigations were performed as a casestudy on Delhi the capital of thecountry(1484 sq km).Delhi, located in theinterior of the country, is the administrativecapital of India and, therefore, is a center ofa large number of executive buildings andresidential areas Delhi is located betweenthe latitudinal extent of 28°23'17''–28°53'00''N and longitudinal extent of 76°50'24''–77°20'37'' E and covers an area of 1483 km2with an average altitude of 213–305 mabove mean sea level (msl) (Figure 1). It isbordered by Haryana in the north, west andsouth and Uttar Pradesh in the east. It islargely a plain area with the exception of
two main physiographic features viz. theYamuna River and the Delhi Ridge. TheYamuna River divides the city into twoparts, popularly known as East and WestDelhi. The ridge, which is an extension ofAravalli Range, borders Delhi on southernside and extends up to central Delhi. Theridge is covered primarily by thornyvegetation
MATERIAL AND METHOD
DATA COLLECTION-
The Satellite Imageries were downloadedfrom USGS (EARTH EXPLORER)/LandsetTM. Landsat TM images were extracted forthe particular area that is Delhi using spatialanalyst tools using ARCMap.
IMAGE INTERPRETATION-

Scientific Society of Advanced Research and Social ChangeSSARSC International Journal of Information and Communication Technology
Volume 1 Issue 1, January-June 2018, ISSN 2581 - 5873
The downloaded image was extracted usingarc tool box
CALCULATION OF NDVI-
NDVI is calculated using the followingsteps-
NDVI ANALYSIS-
NDVI statistics can be calculated by thefollowing steps-

Scientific Society of Advanced Research and Social ChangeSSARSC International Journal of Information and Communication Technology
Volume 1 Issue 1, January-June 2018, ISSN 2581 - 5873
RESULTS AND DISCUSSION-
Different zones analyzed for their area andno changes in the area of different zones areseen over the period of 4 years. The NDVI have been used widely to
examine the relation between the changes invegetation growth rate. It is also useful todetermine the production of greenvegetation as well as detect vegetationchanges.
Table 1 represents the changes in NDVI that has been detected over the period of 4 years (from2011 to 2015)
NDVI values range from +1.0 to -1.0 Areasof barren rock,sand,or snow usually show
NDVI 2011 NDVI 2015
Maximum NDVI 0.8826 0.8446
Minimum NDVI 0.0305 0.014
Area havingmaximum NDVIvalue
0.8826 (Narela) 0.8446 (Burari)
Area havingMinimum NDVIvalue
0.3063 (Dwarka) 0.3478 (Mustafabad)
Scientific Society of Advanced Research and Social ChangeSSARSC International Journal of Information and Communication Technology
Volume 1 Issue 1, January-June 2018, ISSN 2581 - 5873
very low NDVI (example,0.1 or less).Sparse vegetation such as shrubs andgrasslands or senescing crops may result inmoderate NDVI values (approximately 0.2to 0.5).High NDVI values (approximately0.6 to 0.9) correspond to dense vegetation(may found at vegetation at their peakstage).
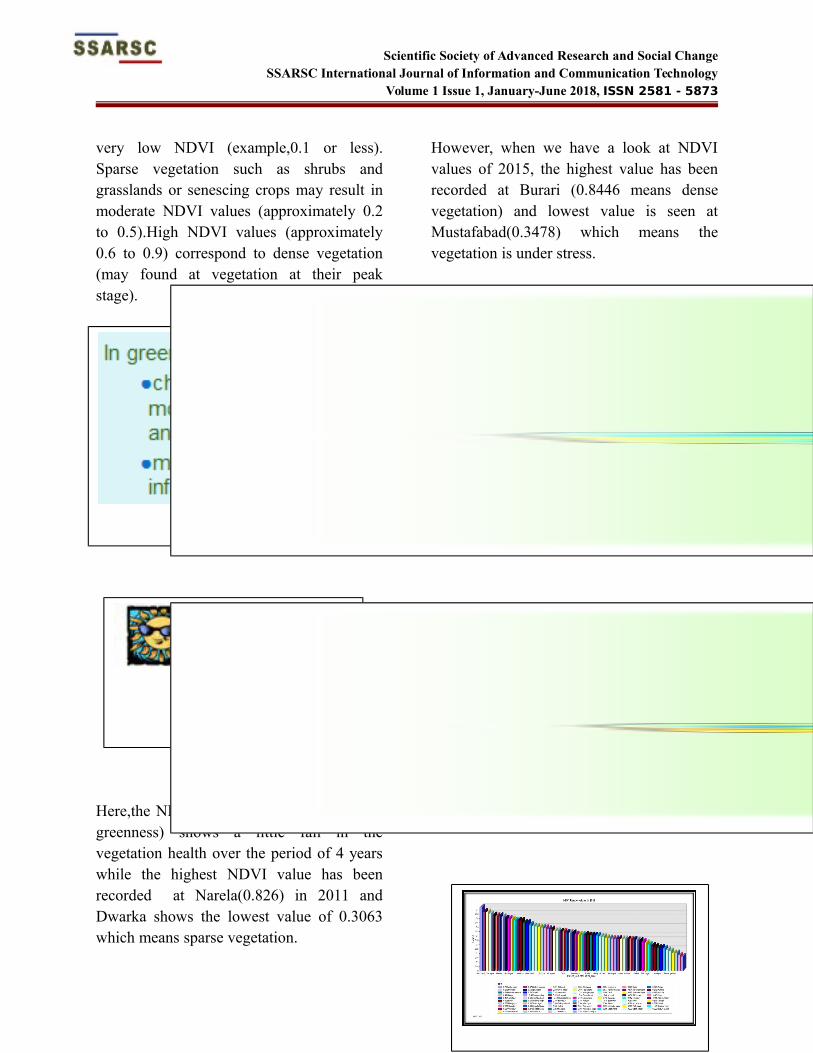
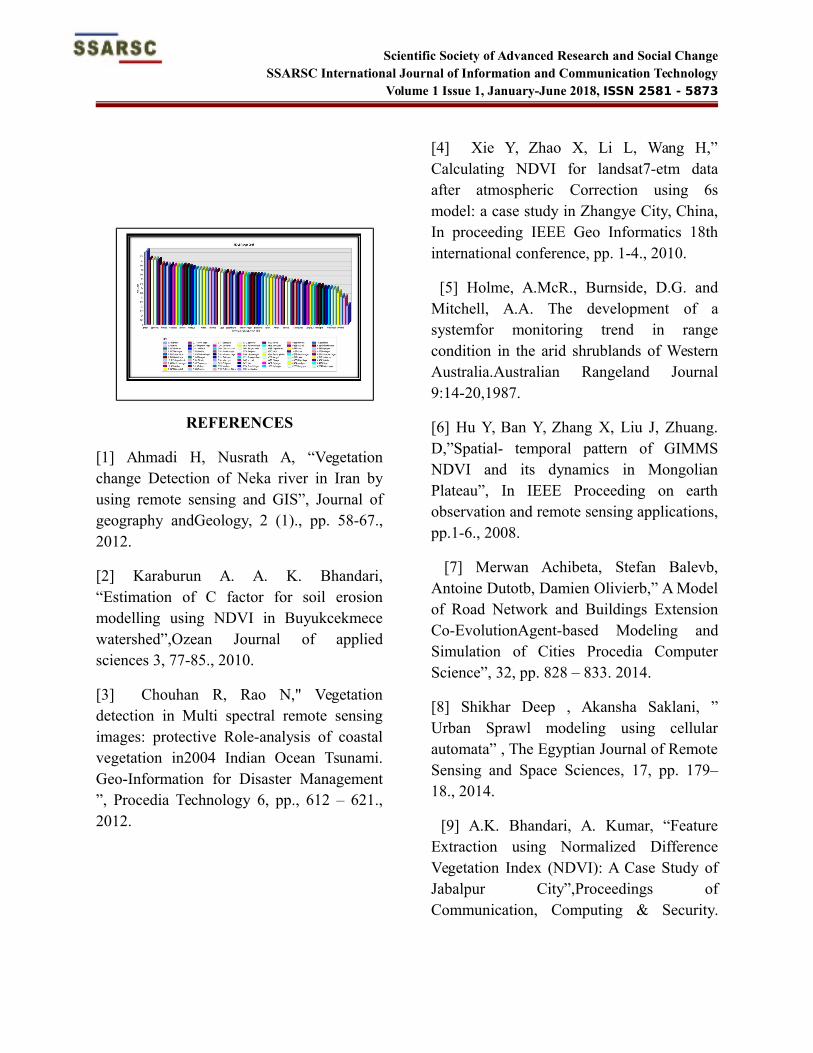
Here,the NDVI values (vegetation health orgreenness) shows a little fall in thevegetation health over the period of 4 yearswhile the highest NDVI value has beenrecorded at Narela(0.826) in 2011 andDwarka shows the lowest value of 0.3063which means sparse vegetation.
However, when we have a look at NDVIvalues of 2015, the highest value has beenrecorded at Burari (0.8446 means densevegetation) and lowest value is seen atMustafabad(0.3478) which means thevegetation is under stress.
Scientific Society of Advanced Research and Social ChangeSSARSC International Journal of Information and Communication Technology
Volume 1 Issue 1, January-June 2018, ISSN 2581 - 5873
REFERENCES
[1] Ahmadi H, Nusrath A, “Vegetationchange Detection of Neka river in Iran byusing remote sensing and GIS”, Journal ofgeography andGeology, 2 (1)., pp. 58-67.,2012.
[2] Karaburun A. A. K. Bhandari,“Estimation of C factor for soil erosionmodelling using NDVI in Buyukcekmecewatershed”,Ozean Journal of appliedsciences 3, 77-85., 2010.
[3] Chouhan R, Rao N," Vegetationdetection in Multi spectral remote sensingimages: protective Role-analysis of coastalvegetation in2004 Indian Ocean Tsunami.Geo-Information for Disaster Management”, Procedia Technology 6, pp., 612 – 621.,2012.
[4] Xie Y, Zhao X, Li L, Wang H,”Calculating NDVI for landsat7-etm dataafter atmospheric Correction using 6smodel: a case study in Zhangye City, China,In proceeding IEEE Geo Informatics 18thinternational conference, pp. 1-4., 2010.
[5] Holme, A.McR., Burnside, D.G. andMitchell, A.A. The development of asystemfor monitoring trend in rangecondition in the arid shrublands of WesternAustralia.Australian Rangeland Journal9:14-20,1987.
[6] Hu Y, Ban Y, Zhang X, Liu J, Zhuang.D,”Spatial- temporal pattern of GIMMSNDVI and its dynamics in MongolianPlateau”, In IEEE Proceeding on earthobservation and remote sensing applications,pp.1-6., 2008.
[7] Merwan Achibeta, Stefan Balevb,Antoine Dutotb, Damien Olivierb,” A Modelof Road Network and Buildings ExtensionCo-EvolutionAgent-based Modeling andSimulation of Cities Procedia ComputerScience”, 32, pp. 828 – 833. 2014.
[8] Shikhar Deep , Akansha Saklani, ”Urban Sprawl modeling using cellularautomata” , The Egyptian Journal of RemoteSensing and Space Sciences, 17, pp. 179–18., 2014.
[9] A.K. Bhandari, A. Kumar, “FeatureExtraction using Normalized DifferenceVegetation Index (NDVI): A Case Study ofJabalpur City”,Proceedings ofCommunication, Computing & Security.

Scientific Society of Advanced Research and Social ChangeSSARSC International Journal of Information and Communication Technology
Volume 1 Issue 1, January-June 2018, ISSN 2581 - 5873
Procedia Technology Volume 6, pp. 612–621, 2012.
[10] Nageswara PPR, Shobha SV, Ramesh,KS, Somashekhar RK,” Satellite -basedassessment of Agricultural drought inKarnataka State,Journal of the Indian societyof remote sensing “, 33 (3), pp. 429-434.,2005
[11] Yang Y, Zhu J, Zhao C, Liu S, Tong,The spatial continuity study of NDVI basedon Kriging and BPNN algorithm” , Journalof Mathematical and computer modelling.,pp. 77 - 85, 2010.
[12] Lan Y, Zhang H, Lacey R, HoffmannWC, Wu W,” Development of an integratedsensor and instrumentation system formeasuring crop conditions”, Agriculturalengineering journal , 11, pp.11-15., 2009.[12] Bechtel A, Puttmann W, Carlson TN,Ripley DA,” On the relationbetween NDVIfractional vegetation cover, and leaf areaindex. Remote Sensing environment, 62 (3),pp. 241 - 252. 1997.
[13] El-Shikha DM, Waller P, Hunsaker D,Clarke T, Barnes E,” Ground-based RemoteSensing for assessing water and nitrogenstatus of broccoli , Agriculture watermanagement, 92, pp. 183-193., 2007.
[14] Kim H, Kwak HS, Yoo JS,” Improvedclustering algorithm for change detection inremote sensing International journal ofdigital content technology and itsappications, 2008; 2 (2), 55-59.
[15] Yamaguchi T, Kishida K, Nunohiro .E,Park JG, Mackin KJ, Matsushita kHK,
Harada I., “Artificial neural network paddy-field classifier using Spatiotemporal remotesensing data”, Artificial life and robotics2010; 15 (2), pp. 221-224.
[16] Demirel H, Ozcinar C, Anbarjafari G., “Satellite image contrast enhancement Usingdiscrete wavelet transform and singularvalue Decomposition. IEEE Geosciencesand remote sensing letters”, 7 (2), pp. 333-337, 2010.
[17] Zhang X, Hu Y, Zhuang D, Oi Y,Ma,“NDVI spatial pattern and itsdifferentiation on the Mongolian plateau”,Journal of geographical Sciences, 19, pp.,403- 415, 2009
[18] GeoSpatial Analysis 5th Edition, 2015Smith, Goodchild, Longley.http://www.spatialanalysisonline.com/HTML/?profiles_and_curvature.htm
[19] Roderick, M., R. C. G. Smith, and G.Ludwick. (1996). Calibrating long termAVHRR derived NDVI imagery. RemoteSensing of Environment 58: 1-12.
[20] Rouse, J. W., R. H. Haas, J. A. Schell,and D. W. Deering (1973). Monitoringvegetation systems in the Great Plains withERTS, Third ERTS Symposium, NASA SP-351 I, 309-317