Embed Size (px)
Citation preview
PERMAFROST AND PERIGLACIAL PROCESSESPermafrost and Periglac. Process., 22: 199–213 (2011)Published online 10 June 2011 in Wiley Online Library(wileyonlinelibrary.com) DOI: 10.1002/ppp.724
Vegetation Canopy and Radiation Controls on Permafrost Plateau Evolution withinthe Discontinuous Permafrost Zone, Northwest Territories, Canada
L. Chasmer,1* W. Quinton,1 C. Hopkinson,2 R. Petrone1 and P. Whittington3
1 Cold Regions Research Centre, Wilfrid Laurier University, Waterloo, ON, Canada2 Applied Geomatics Research Group, NSCC, Lawrencetown, NS, Canada3 Department of Geography, University of Waterloo, Waterloo, ON, Canada
* CoDepaCana
Copy
ABSTRACT
This study examines the links between the spatial distribution of three‐dimensional vegetation structuralcharacteristics and historical permafrost plateau area changes using airborne light detection and ranging and aerialphotography. The results show that vegetation is prone to reduced canopy fractional cover (by up to 50%) andreduced canopy heights (by 16−30%) at the edges of plateaus. Reduced biomass may cause a positive feedback,whereby diminished within‐ and below‐canopy shadowing (by 1 h of shadow time per day) results in increasedradiation incident on the ground surface (16% greater at open‐ vs closed‐canopy plateau sites) and increasedlongwave radiation losses (74% greater at open‐ vs closed‐canopy plateau sites). Increased incident shortwaveradiation may result in augmented thawing of permafrost and increased meltwater runoff, which further inhibitsvegetation and permafrost persistence. Edge influences on ground thaw cause vegetation to die over several years(confirmed using historical aerial photography), thereby exacerbating thaw and plateau area reduction (plateau areareduction = ~27% over 60 years). Permafrost degradation is also evidenced by the increasingly fragmentedcharacteristics of the landscape. Copyright © 2011 John Wiley & Sons, Ltd.
KEY WORDS: vegetation; discontinuous permafrost; peat plateaus; remote sensing; climate change
INTRODUCTION
The southern boundary of the discontinuous permafrostzone of northwestern Canada is characterised by tree‐covered permafrost plateaus that rise 0.5 to 2m above thesurrounding bogs and channel fens (Tarnocai et al., 2004).Previous research within this region indicates that:(1) historically, the size and shape of permafrost plateaushave been highly dynamic and are currently undergoingareal reduction (e.g. Shur and Jorgenson, 2007); and(2) senescence and death of vegetation determined usingaerial photography from 1947 to 2000 occur mainly as aresult of permafrost thaw and ground saturation at theedges of plateaus (Robinson and Moore, 2000; Robinson,2002; Quinton et al., 2010). The conversion from plateausinto permafrost‐free wetlands (bogs and channel fens)affects the hydrological behaviour of drainage basins.Permafrost plateaus generate a large amount of runoff
rrespondence to: L. Chasmer, Cold Regions Research Centre,rtment of Geography, Wilfrid Laurier University, Waterloo, ON,da N2L 3C5. E-mail: [email protected]
right © 2011 John Wiley & Sons, Ltd.
owing to the relatively large hydraulic gradient betweenplateaus and adjacent bogs and fens. Water enteringchannel fens moves downstream towards the basin outletvia lateral flow along broad, hydraulically rough channels(Quinton et al., 2009). The largest proportion of waterenters isolated bogs and is removed through evaporation orgroundwater recharge (Quinton et al., 2009). Therefore,each land cover type has contrasting hydrological functionsthat are affected by area changes over time. Consequently,the current state of northern water resources could change asa result of increasing stresses on permafrost via climatechange and anthropogenic disturbance.
The maximum annual depth of ground thaw is limited bythe cumulative annual energy flux into the ground (Rouse,1984). A sustained increase of this flux could result in thawof the underlying permafrost (Comiso and Parkinson,2004). Numerous studies have related canopy structuralcharacteristics to vegetation succession and the state of theunderlying permafrost. For example, Shur and Jorgenson(2007) demonstrated that late‐succession black sprucecanopies promote permafrost development because theyincrease evapotranspiration, thereby reducing surface soil
Received 20 August 2010Revised 14 February 2011
Accepted 14 February 2011
200 L. Chasmer et al.
moisture. Black spruce canopies efficiently intercept snowwhen compared to patchy shrub vegetation and open areasof mosses. This causes a reduction in ground surface snowcover and reduced insulation (Shur and Jorgenson, 2007).As vegetation regresses from late successional stages (treedcanopies) to low shrubs (with treeless canopies), permafrostis preserved owing to thermal insulation of the accumulatedpeat (Shur and Jorgenson, 2007). Tarnocai et al. (2004)demonstrated that local variability of soil type and texture,soil drainage, vegetation cover and snow interception bycanopies resulted in large local variability of thaw depths ina wide range of organic‐covered permafrost terrains.Pomeroy et al. (2008) showed that the three‐dimensionaldistribution of canopy elements (e.g. foliage area, canopygaps, stems and branches) varied patterns of direct anddiffuse radiation incident on the ground surface. Wright(2009) suggested that sunflecks and shadowing by treesadded to the spatial and temporal variation of shortwaveradiation (K↓) reaching the ground surface below thecanopy. She also reported that the net all‐wave radiation(Q*) was on average ~17 per cent less below the treecanopy of permafrost plateaus than on the adjacent treelesswetland surfaces. The canopy‐controlled pattern ofincident solar radiation affects the spatial distribution ofsnow ablation within open or closed and varying tree canopies(e.g. Pomeroy et al., 2008). During ground thawing, thecanopy also influences the spatial pattern of soil thaw(Anisimov et al., 2002; Wright et al., 2009), and thereforethe pattern of subsurface drainage directions as water flowstoward areas of deeper thaw (Quinton et al., 2009).Ground‐based field observations are essential for gaining
insight into point or plot‐scale thaw processes, but theyshed little light on thaw processes and patterns at the largerscale of individual or groups of plateaus. Furthermore, fieldmeasurements are limited by the relatively long time scaleof some of the governing processes. For large area studiesof landscape transition, the spatial distribution of vegetationcanopy structural characteristics within the discontinuouspermafrost zone may be used as a surrogate for permafrostarea change or reduction, especially along plateau edges.This study uses tower‐based radiation measurements andremote sensing data to: (1) quantify the spatial variability ofvegetation structural characteristics along plateau edgeswhere the greatest historical changes in permafrost areahave occurred; (2) determine if significant differences incanopy structure exist between plateau edges and thetopographically highest parts of plateaus; and (3) determineif plateau fragmentation occurs, in part, as a result ofreduced cumulative tree shadow periods and measuredsolar insolation.
STUDY AREA
Scotty Creek (61.44oN, −121.25oW), located approximately50 km south of Fort Simpson, Northwest Territories,Canada, drains a 152‐km2 wetland‐dominated catchmentwith discontinuous permafrost (Figure 1). The region is
Copyright © 2011 John Wiley & Sons, Ltd.
characterised by short summers and long, cold winters,typical of a dry continental climate. Average annual airtemperature (1971−2000) is −3.2°C and annual precipita-tion is approximately 370mm, of which 46 per cent fall assnow (Quinton et al., 2009). Annual average air tempera-tures measured by Environment Canada at Fort Simpson(located within 15 km of Scotty Creek) have increased byapproximately 1.6°C since 1970.
The watershed is typical of a continental high borealwetland region in the discontinuous permafrost zone(National Wetlands Working Group, 1997). Fens and bogswithin the Scotty Creek basin occupy topographic lows andsupport a water table at or near the ground surface throughoutthe year as they receive drainage water from permafrostplateaus (Quinton et al., 2003). Fens are broad, hydrolog-ically rough channels that support a mat of floating or partlysubmerged Sphagnum riparium (Angstr.) peat, sedges, herbsand short shrubs (Quinton et al., 2003). Bogs contain littlewoody vegetation, except along their margins, and arecharacterised by yellow sphagnum (Quinton et al., 2003).Permafrost plateaus, on the other hand, rise 0.5 to 2m abovethe surrounding fens and bogs and support trees (e.g. Piceamariana Mill.), shrubs, lichens and mosses (Quinton et al.,2003) (Table 1). Approximately 43 per cent of the ScottyCreek watershed consists of permafrost plateaus, 24 per centconnected bogs, 21 per cent channel fens, 9 per cent lakesand 4 per cent isolated bogs (Quinton et al., 2003).
A permafrost plateau forms when a sphagnum mound ina bog grows to a sufficient height above the water table toenable tree growth (Robinson and Moore, 2000; Quintonet al., 2003) and to develop sufficiently cold groundtemperatures (owing to greater exposure to the atmosphereand reduced thermal insulation by snow). This promotes aninterannual ice lens that grows and evolves into permafrost(Wright et al., 2009). The discontinuous permafrost table atScotty Creek exists at a depth of about 1 to 2m below theground surface with the base of the permafrost at up to 10mdepth (Quinton et al., 2009). Vegetation structure, topog-raphy and spectral characteristics of fens, bogs andpermafrost plateaus are unique and allow for relativelyunambiguous classification of land cover features usingspectral remote sensing techniques (Quinton et al., 2003).
Elevations in the study area (Figure 1) range from ~267min the northern part of the basin to 272m in the south. Slopeswithin the Scotty Creek sub‐area vary from approximately 0°to 3° within bogs and channel fens, and typically rangefrom <3° to 20° at the boundaries between fen/bog andpermafrost plateaus. However, at the resolution of thedigital elevation model (DEM) (1m), the slopes of small(within cell) hummocks and hollows are averaged.
Elevation variability and roughness due to hummocks,hollows and fallen/decaying vegetation within permafrostplateaus are greater than within fens and bogs, resulting inwithin‐plateau slope variability (roughness) ranging from3° to 6°. Light Detection And Ranging (LiDAR) returnhorizontal and vertical accuracies at Scotty Creek are beyondthe scope of this study. Other studies (e.g. Hopkinson et al.,2005) have examined horizontal accuracies of ground
Permafrost and Periglac. Process., 22: 199–213 (2011)

Figure 1 (a) Location of the Scotty Creek study area in the Northwest Territories, Canada; (b) map of rivers and lakes near Fort Simpson showing locations ofthe Scotty Creek watershed between the Mackenzie and Liard Rivers and the light detection and ranging (LiDAR) survey; (c) laser return intensity (energy)map (WGS‐84 UTM zone 10) illustrating differences between forested plateaus (reduced intensity due to multiple returns) and brighter bogs and fens(single returns). Also illustrated are the locations of the closed‐canopy and open‐canopy plateaus and bog meteorological stations.
Vegetation and Radiation Controls on Permafrost Plateau Evolution 201
surface elevation and vegetation canopy heights withinnorthern boreal peatland/wetland environments. Hopkinsonet al. (2005) found that saturated ground conditions andstanding water likely reduced the accuracy of ground
Copyright © 2011 John Wiley & Sons, Ltd.
elevations within areas containing aquatic wetland vegeta-tion. Canopy heights were underestimated by 3 per centwithin mature black spruce and aspen forest stands, and byup to 64 per cent within areas containing aquatic vegetation.
Permafrost and Periglac. Process., 22: 199–213 (2011)

Table 1 Vegetation species types, average structural characteristics and average per cent cover observed within 1‐m2 mensurationplots on permafrost plateaus (n = 23) and bogs (n = 10, including bare soil).
Land cover type Dominant species name Vegetation type Range of per cent cover pertype (average of all plots)Common Latin
Permafrost plateau Black spruceSmall bog cranberryCommon Labrador teaGrey reindeer lichenGreen reindeer lichenFalse pixie‐cup lichenRusty peat mossTall clustered thread mossYellow star mossAcute‐leaved peat moss
Picea marianaOxycoccus microcarpusLedum groenlandicumCladina rangiferinaCladina mitisCladonia chlorophaeaMeesia uliginosaBryum pseudotriquetrumCampylium stellatumSphagnum capillifolium
TreeShrubShrubLichenLichenLichenMossMossMossMoss
Trees: 0 to 45 (13)Shrubs: 15 to 100 (56)Lichens: 1 to 100 (65)Moss: 0 to 99 (26)
Bog Black spruceLeatherleafSmall bog cranberryLingonberryDwarf bog rosemaryCommon Labrador teaGrey reindeer lichenGreen reindeer lichenFlattened snow lichenFalse pixie‐cup lichenRusty peat mossTall clustered thread moss
Picea marianaChamaedaphne calyculataOxycoccus microcarpusVacinium vitis‐idaeaAndromeda polifoliaLedum groenlandicumCladina rangiferinaCladina mitisFlavocetraria nivalisCladonia chlorophaeaMeesia uliginosaBryum pseudotriquetrum
TreeShrubShrubShrubShrubShrubLichenLichenLichenLichenMossMoss
Trees: 0 to 25 (8)Shrubs: 17 to 51 (30)Lichens: 11 to 89 (43)Moss: 0 to 89 (40)
Note: Mensuration plots were not examined within fens. Species that occur in one land cover type but not the other are listed in bold.Total and average per cent cover do not equal 100 per cent because a combination of plots were examined, all with varying per centcover per plot.
202 L. Chasmer et al.
DATA COLLECTION AND PROCESSING
LiDAR Data
LiDAR data were collected by the Applied GeomaticsResearch Group (AGRG, Nova Scotia, Canada) on 6 August2008 using an Airborne Laser Terrain Mapper (ALTM)3100 scanning, discrete four‐pulse return system (OptechInc., Toronto, Canada). The LiDAR was flown at a heightof 1300m above ground level (a.g.l.) and a scan angleof ± 18° with 50 per cent overlap of scan lines, ensuring thatvegetation visible to the receiving optics was viewed fromtwo directions, thereby limiting laser return ‘shadowing’within the canopy. A pulse repetition frequency of 71 kHzwas used, resulting in an approximate return spacing of0.82m per scan line ( ~ 0.40m at 50% overlap of scan lines,or up to four returns per m2).All data collected by the ALTM 3100 (laser pulse ranges,
aircraft movement and GPS trajectories) were combinedwithin POSPAC (Applanix Inc., Toronto, Canada) andDashMap (Optech Inc.) proprietary software packages atthe AGRG to create a matrix of x, y and z coordinates andintensities of laser return at the location where the laserpulse reflects from an object near or at the ground surface.Following the initial processing of laser ranges, aircraftmovement and GPS trajectories, laser return files were
Copyright © 2011 John Wiley & Sons, Ltd.
imported into TerraScan software (Terrasolid, Jyväskylä,Finland) for checking/adjustment of horizontal and verticalflight‐line accuracy, classification of ground and non‐ground returns, and subsetting of measurement transects.The 2008 Scotty Creek LiDAR dataset was also filtered forall outlying laser returns (which were removed) and thenclassified into laser returns that reflected from the groundsurface (Pground) and those that reflected from >0.7m abovethe ground surface (Pcanopy) (to include low branches). Thecombined returns (or ‘all returns’) were saved into aseparate ‘all’ file (Pall).
Spectral Remote Sensing Data
High‐resolution aerial photography (1947, 1970 and 1977,pixel resolution ranging between 0.53m and 1.1m) anddigital imagery (acquired in September 2000, IKONOS,pixel resolution = 4m; and 2008, pixel resolution = 0.18m,resampled to 1m) were used to quantify vegetation change(as a proxy for permafrost plateau area change). Methodsand error analysis are described in Chasmer et al. (2011).Multispectral (blue, green, red (visible) and near‐infrared(NIR) bands) IKONOS satellite imagery was subset to matchthe area of LiDAR data coverage (Quinton et al., 2003).Panchromatic NIR digital aerial photography was acquiredcoincident to and integrated with the ALTM 3100 between
Permafrost and Periglac. Process., 22: 199–213 (2011)
Vegetation and Radiation Controls on Permafrost Plateau Evolution 203
1700 h and 1800 h (local time). Digital images were thenmosaiced, clipped, colour‐balanced and orthorectified withinTerraphoto software (Terrasolid, Jyväskylä, Finland). Forcomparison purposes, the NIR channel of the IKONOSimagery was compared with the 2008 (NIR) aerial imagery sothat spectral differences as a result of vegetation and groundsurface characteristics between land cover types (plateau, bogand fen) would be maintained.
Radiation Measurements
Three sites containing meteorological and hydrologicalinstrumentation were established at Scotty Creek between2001 (open‐canopy permafrost plateau, PPopen) and 2007(closed‐canopy permafrost plateau, PPclosed and flat bog,Bog) (Hayashi et al., 2007; Wright et al., 2009). Net radiation(Q*) and incident and reflected shortwave (K↓, K↑) andlongwave (L↓, L↑) radiation were measured every minute andaveraged over 30‐min intervals from 1 January to 31 December2007 (PPopen and Bog) and from 8 April to 17 August 2007(PPclosed) using a four‐component net radiometer (Wm‐2)(CNR1, Kipp and Zonen Inc., Delft, The Netherlands).Radiation sensors were located at approximate heights of1.5m a.g.l (Bog), 1.7m a.g.l. (PPopen) and 1.3m a.g.l.(PPclosed) in areas of slightly varying topography (all sensorslocated at approximately 1.5m a.g.l. when average topographysurrounding the sensor was considered). Sensors were used toquantify daily average energy balance differences between sitesand canopy characteristics.
ANALYTICAL METHODS
Remote Sensing Change Detection
To determine differences in area extent of permafrostplateaus from historical imagery, plateaus were manuallydelineated based on vegetation canopy spectral character-istics, assuming a high spatial correlation between forestcover and plateau area (Chasmer et al., 2011). Manualdelineation was performed using spectral thresholding ofbogs/fens and forested plateaus. This method divides areasof spectrally bright (high and intermediate albedo) bogsand fens and spectrally dark (low albedo) forest cover.Spectral classification procedures were also applied usingup to 40 training areas per land cover type. This resultedin significant confusion (> 30%) between water‐saturated(low albedo) and dry (high albedo) areas in bogs and fensand other land cover types within both IKONOS anddigital imagery. Therefore, it was decided that manualdelineation would likely be more accurate. Forestedpermafrost plateau delineation accuracy and validationusing GPS transects and an airborne LiDAR DEM isdiscussed in Chasmer et al. (2011). Changes in permafrostplateau area coverage between 2000 and 2008 wereestimated by subtracting the manually delineated 2008from 2000 permafrost plateaus.
Copyright © 2011 John Wiley & Sons, Ltd.
LiDAR‐derived Metrics
In this study, LiDAR data are used to measure the spatialvariability in canopy structure on permafrost plateaus. Afterclassification of LiDAR returns within TerraScan, groundreturns (Pground) were used to create a DEM with a 1‐m gridcell size from which Pall and Pcanopy could be normalisedrelative to the ground surface (used to estimate vegetationheight). DEMs were created in Golden Software Surfer(Golden Software Inc., Golden, CO, USA) using an inversedistance‐weighting procedure (IDW) (O’Sullivan and Unwin,2003) with an x, y search radius of 2m and a power of 1,such that return integrity (z‐value) was retained. Canopyheight models (CHMs) were then created based on thenormalised maximum z‐height (m) from Pcanopy, also usingan IDW procedure at 1‐m resolution, a search radius of 2mand a power of 2. Fractional cover estimates from LiDAR( fcover) (where 1 = full canopy cover and 0 = no canopycover) were determined from Pall and Pcanopy returns basedon the ratio between the cumulative number of canopyreturns to all returns within 1m × 1m× height columns:
f cover ¼ ∑Pcanopy
∑Pall
� �: (1)
The ‘return ratio’ method used in Equation 1 has beenexamined in various forms within numerous studies (e.g.Todd et al., 2003; Morsdorf et al., 2006; Solberg et al.,2006; Chasmer et al., 2008; Hopkinson and Chasmer,2009) and is regarded as an effective relative indicator ofvariations in foliage density, despite some underestimationof fcover within short canopies similar to those found atScotty Creek (e.g. Chasmer et al., 2008).
Classification of Vegetation Height Characteristicswithin Low‐lying and Plateau Areas
Classification of permafrost plateaus and low‐lying areaswithin the 2008 Scotty Creek LiDAR dataset was performedusing Surfer and ArcGIS (ESRI Inc., Redlands, CA, USA).Detrending of the north‐to‐south elevation gradient through-out Scotty Creek was required to differentiate betweenrelatively high areas (permafrost plateaus) and lower areas(fens and bogs). The detrending procedure makes theelevation gradient equal to zero so that permafrost plateauswithin higher vs lower elevations can be classified relative tothe surrounding lower elevation terrain. To detrend theelevation gradient, low‐pass moving average filters wereapplied iteratively by decreasing the resolution by 5m, from5m to 41m and from 51m to 201m in 10‐m increments:
W i; jð Þ ¼ 1; ∀i ¼ −S
2
� �;⋯;
S
2
� �∀j ¼ −
T
2
� �;⋯;
T
2
� �; (2)
where S is the neighbourhood height, T is the neighbour-hood width (represented by ∀ i and ∀ j) and W(i,j) isdefined as the weight per specified filter (in this case = 1).
Permafrost and Periglac. Process., 22: 199–213 (2011)

204 L. Chasmer et al.
The low‐pass moving filter smooths or removes high‐frequency topographic variability from the 1‐m resolutionDEM as a function of the grid node centre and theneighbourhood cells (e.g. to 40m, or 40 rows andcolumns). The neighbouring cells are then averaged usingEquation 2 and the filter is then moved to the next gridnode where the procedure is repeated (Pitas, 2000). Afterthe range of low‐pass filters mentioned above were tested,a 41m×41m (including grid node centre) one was chosenbecause it is: (1) large enough to define residualsassociated with small hummocks, hollows and isolatedbogs within permafrost plateaus (problematic using high‐filter resolutions); and (2) is not biased by dominant landcover types (problematic at lower filter resolutions). Thisfilter most effectively and unambiguously classified theelevation gradient throughout the basin. Permafrost plateauswere then extracted by subtracting the 1‐m resolution DEMfrom the detrended dataset and classified in ArcGIS.A classification of the positive residuals (representing
areas above the filtered mean, often plateaus), negativeresiduals (representing areas below the filtered mean, oftenbogs and channel fens) and vegetation height characteristics(canopy heights greater than 1.3m) was used to determinethe area and edges of the permafrost plateaus.
Canopy Shadow Modelling
The spatial distribution of within‐ and below‐canopyshadows has varying influences on lateral permafrostdegradation when combined with other driving mecha-nisms (e.g. soil moisture, soil texture, topographicalcharacteristics, etc.). Canopy height and fcover modelsfrom LiDAR data were used to model spatial coverage ofcumulative daily shadow fractions on the ground surface.The model used in this study is based on radiation modelsapplied in ArcGIS and outlined in Rich (1990), Rich et al.(1999) and Fu and Rich (2000). These follow solargeometry models of Garnier and Ohmura (1970), Oke(1996) and others but extend beyond typical applications ofthe model by including LiDAR‐derived estimates of fcover,elevation and the digital surface model (DSM) (canopyheight, crown diameter and elevation). Numerous studieshave applied radiation models to ellipsoidal primitives(stylised canopy shapes, for example, ellipsoids, cones,spheres, etc.) representing opaque tree canopy elements (e.g.Essery et al., 2008; Ellis and Pomeroy, 2007), but few haveapplied such models to spatially measured canopy structuraldata and in areas of varying topography. A simple radiationmodel has been applied to LiDAR‐measured tree canopies,assuming trees have transmissive characteristics based onleaf area. Here, we do not develop transmissive fractions (e.g.non‐transmitting stems vs partly transmitting crowns).Primitive‐based model studies (e.g. Ellis and Pomeroy,2007) have examined transmissive fractions between stemsand crowns, but applying this to LiDAR DSMs requiresfurther study on the extraction of individual trees, stems andstem diameters (e.g. Reitberger et al., 2007) and is beyond
Copyright © 2011 John Wiley & Sons, Ltd.
the scope of the current study. Here, it is assumed that theentire canopy is a transmissive medium.
According to forest mensuration plots on plateaus (n = 23),trees within the Scotty Creek sub‐area are typically narrow(≤2‐m radius crown), conical in shape, short (averageheights <6m) and have low foliage area (≤45%) that extendsalmost to the ground surface. LiDAR‐measured trees withinthe CHM have been organised into individual shapes basedon an IDW rasterisation procedure applied to the maximumz‐height within a 1‐m raster cell, and with a cell search radiusof 2m. A power of 2 has been applied within the IDWalgorithm to create trees that are narrow and conical in shape.This, in combination with canopy fcover (used interchange-ably with canopy transmissivity (e.g. Hardy et al., 2004;Solberg et al., 2006), but not including the effects of canopyclumping), is used to estimate canopy and ground surfaceshadowing. Canopy shadows were modelled for a single dayduring the thaw period (9 June), and another during thefreezing period (11 November) per pixel location based onthe upward‐looking view factor (including topographicvariability and tree canopy influences) and the amount ofsky visible to the pixel location. For each pixel location, themaximum horizon angle and angle of incidence (
⌢
θ ) aredetermined such that canopy or topography obstruction canbe estimated from adjacent pixels using zenith (Z ) andazimuth angles (
⌢
Ω), slope angle (⌢
β ) and solar azimuth (Ω)(Oke, 1996):
cos⌢
θ¼ cos⌢
β cos Z þ sin⌢
β sin Z cos Ω−⌢
Ω� �
: (3)
Shadow fractions from individual trees were determinedbased on the proportion of the sky visible to the pixel, solong as the sun was not blocked by the surroundingtopography. The shape of shadow fractions were mappedbased on individual tree height (h), vertical canopy cover ortransmissivity ( fcover) and crown radius (rc) estimatedusing an IDW approach.
RESULTS
Reduction in Permafrost Area
Permafrost plateau area reduction from 2000 to 2008was estimated at Scotty Creek using manually delin-eated vegetation cover as a proxy for permafrost plateauarea (determined from IKONOS and digital aerialimagery) (Figure 2).
The total cumulative area of vegetated parts ofpermafrost plateaus as a percentage of the total was 49per cent (± maximum of 12%) in 2000 but by 2008 this areahad declined to 43 per cent (± maximum of 4%). Most ofthe change occurred at the edges of permafrost plateaus,illustrating that edges are prone to vegetation die‐back as aresult of thaw (Figure 2e). For the period 1947 to 2008,vegetated parts reduced by ~27 per cent (Figure 3) (Quintonet al., 2010). These results are similar to those found inBeilman and Robinson (2003) who report that localised
Permafrost and Periglac. Process., 22: 199–213 (2011)

Figure 2 Scotty Creek from (a) IKONOS satellite imagery obtained in 2000 and (b) digital aerial photography obtained in 2008. Permafrost plateau areaswere delineated (using vegetation cover as a proxy) in (c) 2000 and (d) 2008 and subtracted in (e) to illustrate plateau area change from 2000 to 2008. Greyareas in all images are fens, bogs and trails. This figure is available in colour online at wileyonlinelibrary.com/journal/ppp
Vegetation and Radiation Controls on Permafrost Plateau Evolution 205
permafrost degraded between 30 per cent and 65 per centover 100 to 150 years as a result of increased mean annualair temperatures.Decreasing plateau area found from 1947 to 2008
(Figure 3) resulted in the development of isolated bogswithin plateaus, increasingly fragmented and small plateausand increased length of plateau edges (after accounting forpixel resolution influences). Plateau edges in 1947 wereapproximately 22 000m in length and increased linearly as
Copyright © 2011 John Wiley & Sons, Ltd.
a result of fragmentation to approximately 35 000m inlength in 2008 (r2 = 0.47, p= 0.2) (Figure 4). However, ifIKONOS data are not included (outlier caused by lowerresolution pixels and an inability to resolve within‐pixeledge complexity), the relationship improves (r2 = 0.99).Perimeter‐to‐area ratios from 1947 to 2008 increasedlinearly from 0.03 to 0.08, illustrating that increasedfragmentation within the landscape results in a greaterpercentage of plateau edges per unit area.
Permafrost and Periglac. Process., 22: 199–213 (2011)

Figure 3 Cumulative permafrost plateau per cent area degradation (based on vegetation cover) at Scotty Creek determined from aerial photography (1947,1970 and 1977), IKONOS imagery (2000) and digital imagery (2008). Error bars represent maximum and minimum per cent area extents when accounting fordifferences in pixel resolution, sun angles and geo‐registration errors (described in Chasmer et al., 2011).
Figure 4 Length of classified plateau edges from 1947 to 2008 based on the datasets mentioned in Figure 3.
206 L. Chasmer et al.
Spatial Variations of Vegetation Structure
The spatial variability of vegetation structure along theedges of permafrost plateaus may influence the radiationregime at the ground surface and may change spatialvariability of permafrost thaw, especially as plateausbecome increasingly fragmented. Vegetation structuraldifferences at plateau edges, where change between 2000and 2008 is most apparent (Figure 2e), may indicate a long‐term trend of vegetation succession (Shur and Jorgenson,2007). Trees and vegetation greater than 0.7m in heightcover approximately 57 per cent of the area of permafrostplateaus, not including gaps between trees (Figure 5). Yetonly 10 per cent of bogs and fens contain vegetation withsimilar characteristics, and much of this vegetation islocated within 15m of permafrost plateau edges (Figure 6).Trees located at the edges of plateaus (Figure 2e) and in
Copyright © 2011 John Wiley & Sons, Ltd.
lower elevation areas within plateaus are shorter (averageheight ranging from 0.5m to 1.7m) and have less foliage(average canopy gaps comprise 80% to 95% of total treecover) than trees located at higher elevations (averagecanopy height ranges from ~3m to 6m; area of canopygaps = 40% to 60% of total tree cover) (Figure 5). Thisillustrates that canopy structural differences exist betweenvegetation found at plateau edges as opposed to vegetationlocated more centrally on higher elevation plateaus,especially where some trees at plateau edges have fallen.Fens and bogs have the greater proportions of shortvegetation, with heights ranging from 0m to 1m and withlow fcover of tall vegetation (0% to 2%).
Figure 6 shows the spatial distribution of vegetationheights in topographically detrended low‐lying areas, alongplateau edges and within plateaus. Plateau edges (Figure 6,yellow) with short vegetation located adjacent to bogs and
Permafrost and Periglac. Process., 22: 199–213 (2011)

Figure 5 Frequency distributions of (a) maximum canopy height and (b) per cent canopy fractional cover (fcover) per land cover type. Per cent differences incanopy structure between permafrost plateaus and within the 10‐m buffer areas surrounding bogs on plateaus are shown in the insets.
Vegetation and Radiation Controls on Permafrost Plateau Evolution 207
fens will likely undergo the most rapid changes in landcover. Slightly raised parts of the fen are prone to somevegetation growth, with canopies ranging in height from1.5m to 6m. These areas may be indicative of vegetationsuccession and plateau development.
Spatial Variation of Insolation
Reduced biomass at the edges of permafrost plateaus(compared with that located at the centre of plateaus) can
Copyright © 2011 John Wiley & Sons, Ltd.
alter the radiation regimes at the ground surface, which maylead to increased rates of snow melt, ground heating andwater runoff. This results in increased ground saturation,increased depth to permafrost and further vegetation die‐back(Figures 2e and 3). Shur and Jorgenson (2007) suggest thatvertical degradation of permafrost within subarctic regionsmayoccur in areas where canopy cover does not protect permafrostfrom a warmer climate, such as by canopy shadowing.Figure 7 presents a simple conceptual model of permafrostthaw based on energy balance during the growing season.
Permafrost and Periglac. Process., 22: 199–213 (2011)
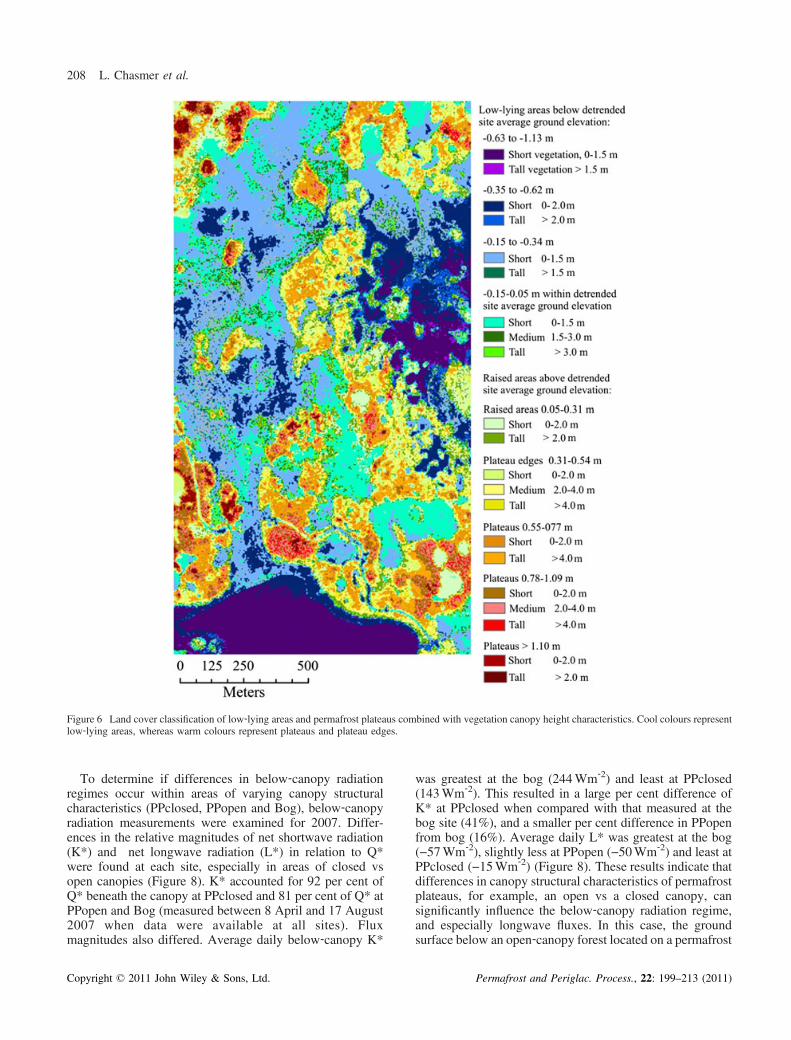
Figure 6 Land cover classification of low‐lying areas and permafrost plateaus combined with vegetation canopy height characteristics. Cool colours representlow‐lying areas, whereas warm colours represent plateaus and plateau edges.
208 L. Chasmer et al.
To determine if differences in below‐canopy radiationregimes occur within areas of varying canopy structuralcharacteristics (PPclosed, PPopen and Bog), below‐canopyradiation measurements were examined for 2007. Differ-ences in the relative magnitudes of net shortwave radiation(K*) and net longwave radiation (L*) in relation to Q*were found at each site, especially in areas of closed vsopen canopies (Figure 8). K* accounted for 92 per cent ofQ* beneath the canopy at PPclosed and 81 per cent of Q* atPPopen and Bog (measured between 8 April and 17 August2007 when data were available at all sites). Fluxmagnitudes also differed. Average daily below‐canopy K*
Copyright © 2011 John Wiley & Sons, Ltd.
was greatest at the bog (244Wm‐2) and least at PPclosed(143Wm‐2). This resulted in a large per cent difference ofK* at PPclosed when compared with that measured at thebog site (41%), and a smaller per cent difference in PPopenfrom bog (16%). Average daily L* was greatest at the bog(−57Wm‐2), slightly less at PPopen (−50Wm‐2) and least atPPclosed (−15Wm‐2) (Figure 8). These results indicate thatdifferences in canopy structural characteristics of permafrostplateaus, for example, an open vs a closed canopy, cansignificantly influence the below‐canopy radiation regime,and especially longwave fluxes. In this case, the groundsurface below an open‐canopy forest located on a permafrost
Permafrost and Periglac. Process., 22: 199–213 (2011)
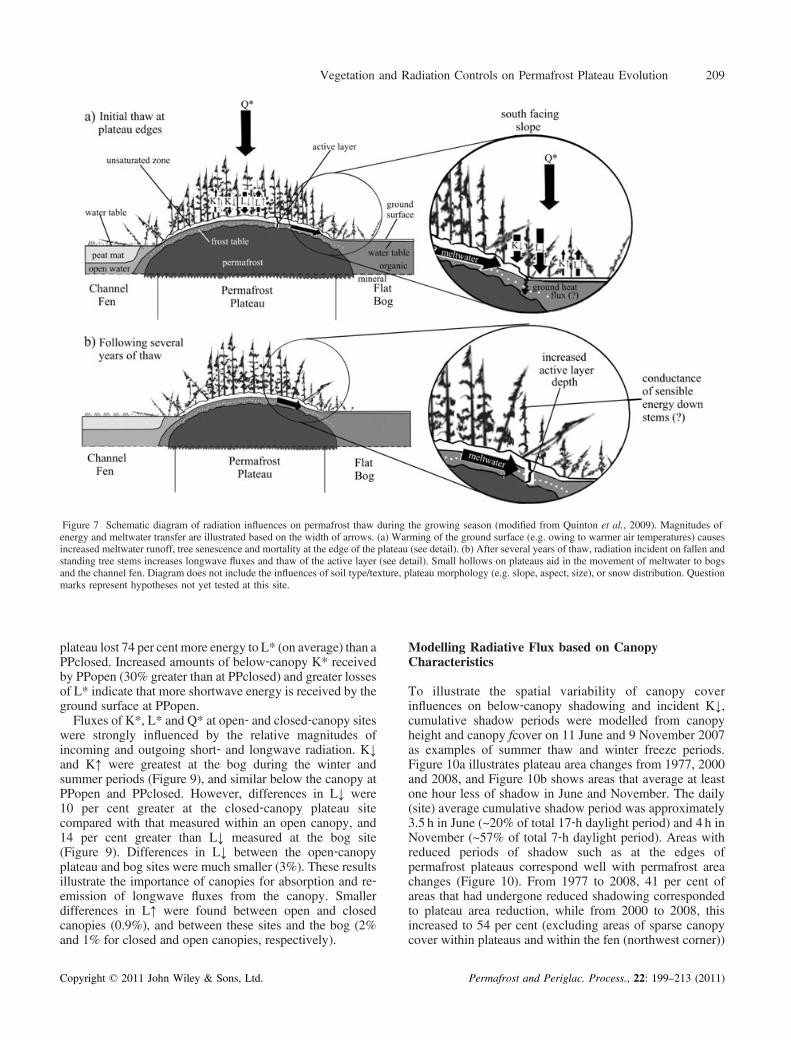
Figure 7 Schematic diagram of radiation influences on permafrost thaw during the growing season (modified from Quinton et al., 2009). Magnitudes ofenergy and meltwater transfer are illustrated based on the width of arrows. (a) Warming of the ground surface (e.g. owing to warmer air temperatures) causesincreased meltwater runoff, tree senescence and mortality at the edge of the plateau (see detail). (b) After several years of thaw, radiation incident on fallen andstanding tree stems increases longwave fluxes and thaw of the active layer (see detail). Small hollows on plateaus aid in the movement of meltwater to bogsand the channel fen. Diagram does not include the influences of soil type/texture, plateau morphology (e.g. slope, aspect, size), or snow distribution. Questionmarks represent hypotheses not yet tested at this site.
Vegetation and Radiation Controls on Permafrost Plateau Evolution 209
plateau lost 74 per cent more energy to L* (on average) than aPPclosed. Increased amounts of below‐canopy K* receivedby PPopen (30% greater than at PPclosed) and greater lossesof L* indicate that more shortwave energy is received by theground surface at PPopen.Fluxes of K*, L* and Q* at open‐ and closed‐canopy sites
were strongly influenced by the relative magnitudes ofincoming and outgoing short‐ and longwave radiation. K↓and K↑ were greatest at the bog during the winter andsummer periods (Figure 9), and similar below the canopy atPPopen and PPclosed. However, differences in L↓ were10 per cent greater at the closed‐canopy plateau sitecompared with that measured within an open canopy, and14 per cent greater than L↓ measured at the bog site(Figure 9). Differences in L↓ between the open‐canopyplateau and bog sites were much smaller (3%). These resultsillustrate the importance of canopies for absorption and re‐emission of longwave fluxes from the canopy. Smallerdifferences in L↑ were found between open and closedcanopies (0.9%), and between these sites and the bog (2%and 1% for closed and open canopies, respectively).
Copyright © 2011 John Wiley & Sons, Ltd.
Modelling Radiative Flux based on CanopyCharacteristics
To illustrate the spatial variability of canopy coverinfluences on below‐canopy shadowing and incident K↓,cumulative shadow periods were modelled from canopyheight and canopy fcover on 11 June and 9 November 2007as examples of summer thaw and winter freeze periods.Figure 10a illustrates plateau area changes from 1977, 2000and 2008, and Figure 10b shows areas that average at leastone hour less of shadow in June and November. The daily(site) average cumulative shadow period was approximately3.5 h in June (~20% of total 17‐h daylight period) and 4 h inNovember (~57% of total 7‐h daylight period). Areas withreduced periods of shadow such as at the edges ofpermafrost plateaus correspond well with permafrost areachanges (Figure 10). From 1977 to 2008, 41 per cent ofareas that had undergone reduced shadowing correspondedto plateau area reduction, while from 2000 to 2008, thisincreased to 54 per cent (excluding areas of sparse canopycover within plateaus and within the fen (northwest corner))
Permafrost and Periglac. Process., 22: 199–213 (2011)
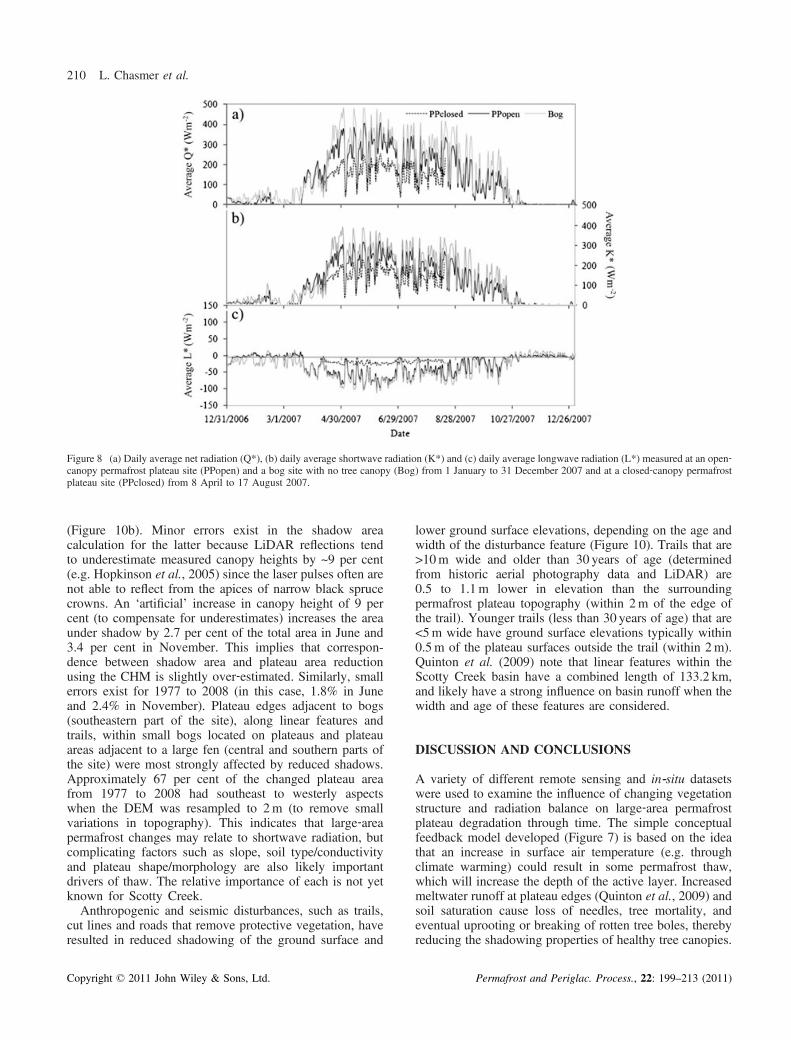
Figure 8 (a) Daily average net radiation (Q*), (b) daily average shortwave radiation (K*) and (c) daily average longwave radiation (L*) measured at an open‐canopy permafrost plateau site (PPopen) and a bog site with no tree canopy (Bog) from 1 January to 31 December 2007 and at a closed‐canopy permafrostplateau site (PPclosed) from 8 April to 17 August 2007.
210 L. Chasmer et al.
(Figure 10b). Minor errors exist in the shadow areacalculation for the latter because LiDAR reflections tendto underestimate measured canopy heights by ~9 per cent(e.g. Hopkinson et al., 2005) since the laser pulses often arenot able to reflect from the apices of narrow black sprucecrowns. An ‘artificial’ increase in canopy height of 9 percent (to compensate for underestimates) increases the areaunder shadow by 2.7 per cent of the total area in June and3.4 per cent in November. This implies that correspon-dence between shadow area and plateau area reductionusing the CHM is slightly over‐estimated. Similarly, smallerrors exist for 1977 to 2008 (in this case, 1.8% in Juneand 2.4% in November). Plateau edges adjacent to bogs(southeastern part of the site), along linear features andtrails, within small bogs located on plateaus and plateauareas adjacent to a large fen (central and southern parts ofthe site) were most strongly affected by reduced shadows.Approximately 67 per cent of the changed plateau areafrom 1977 to 2008 had southeast to westerly aspectswhen the DEM was resampled to 2m (to remove smallvariations in topography). This indicates that large‐areapermafrost changes may relate to shortwave radiation, butcomplicating factors such as slope, soil type/conductivityand plateau shape/morphology are also likely importantdrivers of thaw. The relative importance of each is not yetknown for Scotty Creek.Anthropogenic and seismic disturbances, such as trails,
cut lines and roads that remove protective vegetation, haveresulted in reduced shadowing of the ground surface and
Copyright © 2011 John Wiley & Sons, Ltd.
lower ground surface elevations, depending on the age andwidth of the disturbance feature (Figure 10). Trails that are>10m wide and older than 30 years of age (determinedfrom historic aerial photography data and LiDAR) are0.5 to 1.1m lower in elevation than the surroundingpermafrost plateau topography (within 2m of the edge ofthe trail). Younger trails (less than 30 years of age) that are<5m wide have ground surface elevations typically within0.5m of the plateau surfaces outside the trail (within 2m).Quinton et al. (2009) note that linear features within theScotty Creek basin have a combined length of 133.2 km,and likely have a strong influence on basin runoff when thewidth and age of these features are considered.
DISCUSSION AND CONCLUSIONS
A variety of different remote sensing and in‐situ datasetswere used to examine the influence of changing vegetationstructure and radiation balance on large‐area permafrostplateau degradation through time. The simple conceptualfeedback model developed (Figure 7) is based on the ideathat an increase in surface air temperature (e.g. throughclimate warming) could result in some permafrost thaw,which will increase the depth of the active layer. Increasedmeltwater runoff at plateau edges (Quinton et al., 2009) andsoil saturation cause loss of needles, tree mortality, andeventual uprooting or breaking of rotten tree boles, therebyreducing the shadowing properties of healthy tree canopies.
Permafrost and Periglac. Process., 22: 199–213 (2011)

Figure 10 (a) Permafrost plateau area change for 1977 and 2000 compared to plateau area in 2008 (from aerial photography, IKONOS and digital imagery;(b) corresponding areas of reduced canopy shadowing at the edges of plateaus as a result of shorter canopies and lower biomass. Both (a) and (b) are overlaidonto a shaded relief digital elevation model.
Figure 9 (a) Daily average incoming shortwave radiation (K↓), (b) daily average outgoing shortwave radiation (K↑), (c) daily average incoming longwaveradiation (L↓) and (d) daily average outgoing longwave radiation (L↑) measured at an open‐canopy permafrost plateau site (PPopen) and a bog site with notree canopy (Bog) from 1 January to 31 December 2007 and at a closed‐canopy permafrost plateau site (PPclosed) from 8 April to 17 August 2007.
Vegetation and Radiation Controls on Permafrost Plateau Evolution 211
Copyright © 2011 John Wiley & Sons, Ltd. Permafrost and Periglac. Process., 22: 199–213 (2011)

212 L. Chasmer et al.
Shortwave radiation incident on the ground surface at theedges of plateaus warms the soil profile and exacerbatespermafrost thaw. Further, fallen (dead) tree boles intercept-ing incident shortwave radiation increase longwave fluxeswithin the canopy, and may transfer heat within the activelayer (although this has not yet been tested). It is notknown whether or not this positive feedback will continueindefinitely, as there also appear to be new stages ofvegetation succession in the channel fen, which may berelated to surface water routing. New vegetation growthmay result in permafrost plateau development in thefuture.Vegetation cover (as a proxy indicator of permafrost
plateau area) decreased by ~27 per cent from 1947 to 2008(Quinton et al., 2010). Vegetation heights and canopy coverare greatest near the centre of plateaus, if they are not highlyfragmented, but are reduced at plateau edges (Figure 5).Reduced tree heights at plateau edges are indicative of treemortality (e.g. fallen/broken tree boles, reduced leaf area).Comparisons between radiation fluxes within structurallydifferent canopy types showed that tree shadowing withinclosed canopies reduces shortwave fluxes incident on theground surface and increases longwave fluxes within theupper canopy (Figures 8 and 9). As canopy cover isreduced, shortwave radiation incident on the ground surfaceincreases causing ground heating (evidenced by slightlyincreased longwave fluxes from the soil surface) and theformation of depressions within the permafrost topography.For example, field measurements indicate that higherelevations are positively correlated to shallower depths ofpermafrost within five of seven transects (r2 ranged from0.47 to 0.76, p < 0.01, unpublished data). This confirms theresults of Quinton et al. (2009), if we assume that theground surface sinks (elevation decreases) as the depth topermafrost increases. This is also evident when examiningthe influence of linear features such as seismic explorationlines and roads on ground surface elevation. Oncedepressions have formed, water from surrounding areasdrains into the depression causing an increase in thethickness of the thawed saturated layer, increased soilmoisture and increased bulk thermal conductivity of thepeat above the depression (Quinton et al., 2009; Wrightet al., 2009).
Copyright © 2011 John Wiley & Sons, Ltd.
At the basin scale, large areas of shadow reduction(calculated for June and November) at the edges of plateauscorrespond with areas that have undergone biomassreduction from 1977 to 2008. Further, southeast towesterly facing slopes correspond with 67 per cent ofthe areas that have undergone change over the last30 years, indicating that radiation is an important driverof permafrost change, along with other complicating factorsthat have not been examined in this study (e.g. plateaumorphology, soil type/conductance, geology, etc., influ-ences on soil moisture).
Lower resolution, historic remote sensing data thereforemay be used to assess basin‐scale variability, aided byairborne LiDAR, which can quantify plateau topographicand area change over a period of years (using baseline andsubsequent surveys). Such technologies could be used toquantify major climatic influences on vegetation successionand permafrost plateau change, especially if climatic eventsstrongly influence annual thaw penetration, as is suggestedin Tarnocai et al. (2004). This corresponds with results ofQuinton et al. (2009) who found a strong relationshipbetween total water input and the depth to permafrost at theend of summer from 1999 to 2006. Greatest water input anddeepening of the permafrost from 1999 to 2006 alsocorresponded with abnormally warm years (e.g. 2005−06).
ACKNOWLEDGEMENTS
We acknowledge support from the Improved Processes andParameterisation for Prediction in Cold Regions network,including Dr Masaki Hayashi, Dr John Pomeroy, Liidlii KueFirst Nation and Jean‐Marie River First Nation. Dr NicoleWright and Tyler Veness helped with instrumentation andfieldwork. LiDAR and digital imagery data were processedby Allyson Fox and SuzanneMonette at the AGRG. Fundingfor this project was provided by the Canadian Foundation forClimate and Atmospheric Sciences and the Natural Sciencesand Engineering Research Council. Logistical support wasprovided by the Aurora Research Institute, Water Survey ofCanada. We would also like to thank two anonymousreviewers, Dr Benjamin Crosby and Dr Antoni Lewkowiczfor helpful comments and insights.
REFERENCES
Anisimov OA, Shiklomanov N, Nelson F.2002. Variability of seasonal thaw depth inpermafrost regions.A stochasticmodeling ap-proach. Ecological Modelling 153: 217−227.
Beilman DW, Robinson SD. 2003. Peatlandpermafrost thaw and landform type along aclimatic gradient. In Proceedings of theEighth International Conference on Perma-frost, Phillips M, Springman SM, ArensonLU (eds). A. A. Balkema: Lisse; 61−65.
Chasmer L, Hopkinson C, Treitz P,McCaughey H, Barr A, Black A. 2008. A
lidar‐based hierarchical approach forassessing MODIS fPAR. Remote Sensingof Environment. 112: 4344–4357.
Chasmer L, Hopkinson C, Quinton W. 2011.Quantifying errors in discontinuous perma-frost plateau change from optical data,Northwest Territories, Canada: 1947 to2008. Canadian Journal of Remote Sens-ing. 36(2): S211‐S223.
Comiso JC and Parkinson CL. 2004. Satellite‐Observed Changes in the Arctic. PhysicsToday Aug: 38–44.
Ellis C and Pomeroy J. 2007. Estimating sub‐canopy shortwave irradiance to melting
Permafros
snow on forested slopes. HydrologicalProcesses 21: 2581–2593.
Essery R, Bunting P, Hardy J, Link T,Marks D, Melloh R, Pomeroy J, Rolands A,Rutter N. 2008. Radiative transfer modelingof a coniferous canopy characterized byairborne remote sensing. Journal of Hydro-meteorology. NASA Cold Land ProcessesExperiment(CLPX)SpecialIssue.9:228–241.
Fu P and Rich PM. 2000. A geometric solarradiation model and its applications inagriculture and forestry. In Proceedings ofthe Second International Conference onGeospatial Information in Agriculture
t and Periglac. Process., 22: 199–213 (2011)

Vegetation and Radiation Controls on Permafrost Plateau Evolution 213
and Forestry, I: 357–364. Lake BuenaVista, 10–12 January 2000.
Garnier BJ and Ohmura A. 1970. Theevaluation of surface variations in solarradiation income. Solar Energy 13: 21–34.
Hardy JP, Melloh R, Koenig G, Marks D,Winstral A, Pomeroy JW, Link T. 2004.Solar radiation transmission throughconifer canopies. Agricultural and ForestMeteorology 126: 257–270.
Hayashi M, Goeller N, Quinton W, Wright N.2007. A simple heat‐conduction methodfor simulating the frost‐table depth in hydro-logical models. Hydrological Processes 21:2610–2622.
Hopkinson C and Chasmer L. 2009. Testing alidar intensity based model of canopyfractional cover across multiple forestecozones. Remote Sensing of Environment113: 275–288.
Hopkinson C, Chasmer L, Sass G, Creed I,Sitar M, Kalbfleisch W, and Treitz P. 2005.Assessing vegetation height and canopyvolume in a Boreal wetland complex usingairborne scanning LiDAR. Canadian Jour-nal of Remote Sensing. 31(2): 191–206.
Morsdorf F, Kotz B, Meier E, Itten K, andAllgower B. 2006. Estimation of LAIand fractional cover from small footprintairborne laser scanning data based on gapfraction. Remote Sensing of Environment.104: 50–61.
National Wetlands Working Group. 1997. TheCanadian Wetland Classification System,2nd Edition. Warner BG, Rubec CDA,Wetland (eds.). Research Centre, Universityof Waterloo, Waterloo ON.
Oke TR. 1996. Boundary Layer Climates.Routledge: London; 435pp.
O’Sullivan D, Unwin DJ. 2003. GeographicInformation Analysis. John Wiley & Sons:Hoboken, NJ.
Copyright © 2011 John Wiley & Sons, Ltd.
Pitas I. 2000. Digital Image ProcessingAlgorithms and Applications. John Wileyand Sons, New York; 419pp.
Pomeroy J, Rowlands A, Hardy J, Link T,Marks D, Essery R, Sicart J, Ellis C. 2008.Spatial variability of shortwave irradiance forsnowmelt in forests. Journal of Hydromete-orology CLPX Special Issue. 9: 1482–1490.
Quinton W, Hayashi M, and Chasmer L.2009. Peatland hydrology of discontinuouspermafrost in the Northwest Territories:Overview and synthesis. Canadian WaterResources Journal. 34(4): 311–328.
Quinton W, Hayashi M, and Chasmer L.2010. Permafrost thaw induced land‐coverchange in the Canadian subarctic: Implica-tions for water resources. HydrologicalProcesses Scientific Review. In review.
Quinton WL, Hayashi M, and Pietroniro A.2003. Connectivity and storage functions ofchannel fens and flat bogs in northern basins.Hydrological Processes. 17: 3665–3684.
Reitberger J, Krzystek P, and Stilla U. 2007.Combined tree segmentation and stemdetection using full waveform lidar data. InProceedings of the ISPRS Workshop onLaser Scanning 2007 and SilviLaser 2007.Espoo, Finland.
Rich PM. 1990. Characterizing plant canopieswith hemispherical photographs. RemoteSensing Review. 5(1):13–29.
Rich PM, Wood J, Vieglais DA, Burek K, andWebb N. 1999. Guide to HemiView:software for analysis of hemisphericalphotography. Delta‐T Devices, Ltd:Cambridge, England.
Robinson SD. 2002. Peatlands of theMackenzieValley: Permafrost, fire, and carbon accumu-lation. InProc. CarbonDynamics of ForestedPeatlands, Edmonton, Alberta. 21−24.
Robinson SD, Moore, TR. 2000. Theinfluence of permafrost and fire upon
Permafros
carbon accumulation in High Boreal peat-lands, Northwest Territories, Canada.Arctic, Antarctic, and Alpine Research.32: 155–166.
Rouse WR. 1984. Microclimate of arctic treeline 2. Soil microclimate of tundra andforest. Water Resources Research, 20(1):67–73.
Rouse WR. 2000. Progress in hydrologicalresearch in the Mackenzie GEWEX study.Hydrological Processes. 14: 1667–1685.
Shur YL and Jorgenson MT. 2007. Patterns ofpermafrost formation and degradation inrelation to climate and ecosystems.Permafrost and Periglacial Processes.18: 7–19.
Solberg S, Naesset E, Hanssen KH, andChristiansen E. 2006. Mapping defoliationduring a severe insect attack on Scots pineusing airborne laser scanning.Remote Sensingof Environment. 102: 364–376.
Tarnocai C, Nixon FM, and Kutny L. 2004.Circumpolar‐Active‐Layer‐Monitoring(CALM) sites in the Mackenzie Valley,northwestern Canada. Permafrost andPeriglacial Processes. 15: 141–153.
Todd KW, Csillag F, Atkinson PM. 2003Three‐dimensional mapping of light trans-mittance and foliage distribution usinglidar. Canadian Journal of Remote Sensing.29(5): 544–555.
Wright N. 2009. Water and energy fluxes froma permafrost peat plateau: examining thecontrols on runoff generation. PhD thesis,Simon Fraser University, BC, Canada,175pp.
Wright N, Hayashi M, Quinton WL. 2009.Spatial and temporal variations in activelayer thawing and their implication onrunoff generation in peat‐covered perma-frost terrain. Water Resources Research 45:W05414. DOI: 10.1029/2008WR006880
t and Periglac. Process., 22: 199–213 (2011)


![Seasonal dynamics of spectral vegetation indices at leaf ... · Leaf level: Norway spruce [-] /g] [-] /g] Date of 2017 Top canopy Low canopy • PRI (and CCI) showed clearly seasonal](https://img.pdfslide.us/doc/110x75/5f132e7f65f3fa1b0213dea8/seasonal-dynamics-of-spectral-vegetation-indices-at-leaf-leaf-level-norway.jpg)