Embed Size (px)
Citation preview
Staff Paper
Vegetable Farm Business Analysis Workbook
by
Roger Betz, Mike Staton, Janice Knuth,Gerald Schwab, and Sherrill Nott
Staff Paper 2001-12 June, 2001
Copyright: 2001 by Sherrill B. Nott. All rights reserved. Readers may make verbatim copies of thisdocument for non-commercial purposes by any means, provided that this copyright notice appears on all
such copies.
Department of Agricultural EconomicsMICHIGAN STATE UNIVERSITY
East Lansing, Michigan 48824
MSU is an Affirmative Action/Equal Opportunity Institution
Vegetable Farm Analysis Workbook - Financial [PAGE 2]
Vegetable Farm Business Analysis Workbook
Staff Paper 2001-12, 26 pagesby
Roger Betz <[email protected]>, Mike Staton <[email protected]>,Janice Knuth <[email protected]>, Gerald Schwab <[email protected]>, and
Sherrill Nott <[email protected]>
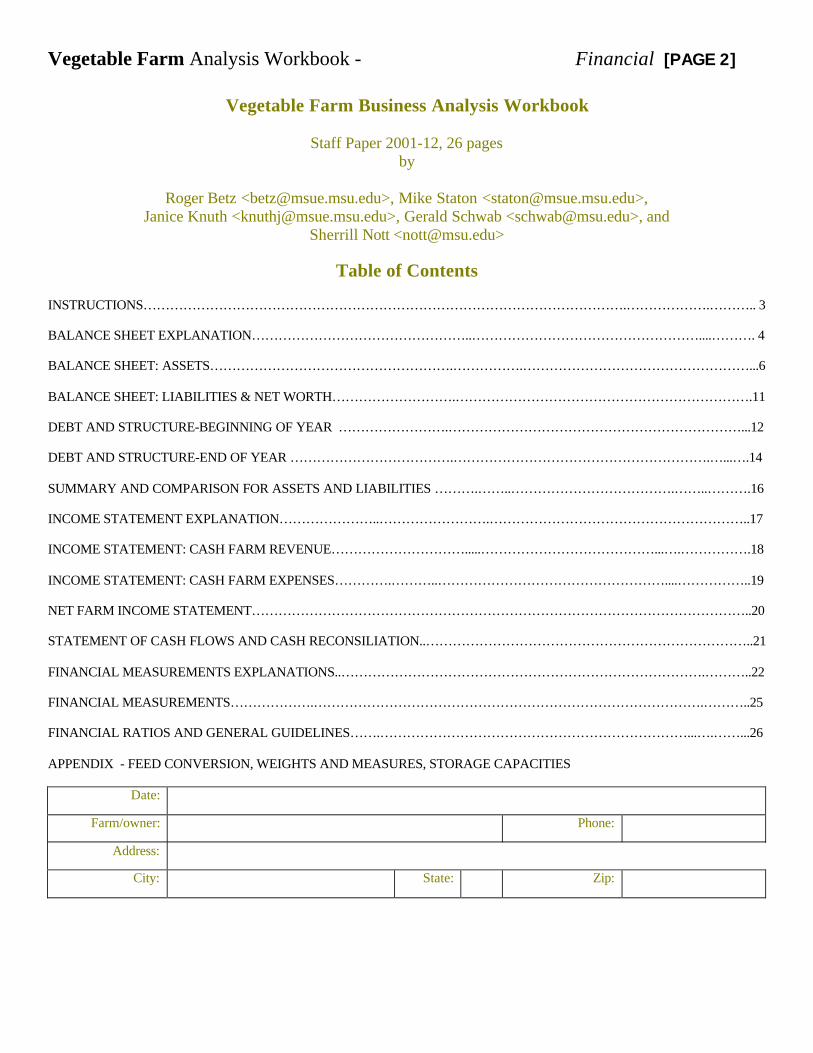
Table of Contents
INSTRUCTIONS……………………………………………………………………………………………….……………….……….. 3
BALANCE SHEET EXPLANATION…………………………………………..……………………………………………....………. 4
BALANCE SHEET: ASSETS……………………………………………….…………….……………………………………………...6
BALANCE SHEET: LIABILITIES & NET WORTH……………………….………………………………………………………….11
DEBT AND STRUCTURE-BEGINNING OF YEAR …………………….…………………………………………………………...12
DEBT AND STRUCTURE-END OF YEAR ……………………………….………………………………………………….…...….14
SUMMARY AND COMPARISON FOR ASSETS AND LIABILITIES ……….……..……………………………….……..……….16
INCOME STATEMENT EXPLANATION…………………..…………………….…………………………………………………..17
INCOME STATEMENT: CASH FARM REVENUE………………………….....…………………………………...….…………….18
INCOME STATEMENT: CASH FARM EXPENSES………….………..……………………………………………....……………..19
NET FARM INCOME STATEMENT…………………………………………………………………………………………………..20
STATEMENT OF CASH FLOWS AND CASH RECONSILIATION..………………………………………………………………..21
FINANCIAL MEASUREMENTS EXPLANATIONS..……………………………………………………………………….………..22
FINANCIAL MEASUREMENTS……………….…………………………………………………………………………….………..25
FINANCIAL RATIOS AND GENERAL GUIDELINES…….……………………………………………………………...….……...26
APPENDIX - FEED CONVERSION, WEIGHTS AND MEASURES, STORAGE CAPACITIES
Date:
Farm/owner: Phone:
Address:
City: State: Zip:

Vegetable Farm Analysis Workbook - Financial [PAGE 3]
INSTRUCTIONS
Goal: For a one-year period, develop an accrual adjusted income statement. This means preparing the followingfinancial reports:
1. Balance Sheet statement at beginning of year, with both cost and market valuations.2. Balance Sheet statement at end of year, with both cost and market valuations.3. Income statement, showing inventory adjustments and depreciation.4. Summary of cash flows including principal borrowings and repayments.
From the accrual income statement and other documents, various profit and financial ratios indicating strengthsand weaknesses of the farm business can be calculated. This financial analysis should be performed every yearto monitor the business.
Choices: You have three ways to accomplish this.
1. Fill in the worksheets in the following pages to perform a manual “paper” business analysis. Once this workbook is completed it can easily be used for FINPACK computerized business analysis input. Your Extension Agent can help you with the FINPACK program.
or
2. Run Finpack software, using the Year End Analysis (FINAN) option.a. Contact your county Michigan State University Extension office and ask to be put in contact with
your District Extension Farm Management Agent or with your Local Agent. They have the softwareon their computers and will arrange to do the analysis.
b. Buy the FINPACK software from the Center for Farm Financial Management at the University ofMinnesota, 249 Classroom Office Building, 1994 Buford Avenue, St. Paul, Minnesota 55108 orphone 800-234-1111. To preview what FINPACK does, visit their web site at:http://www.cffm.umn.edu/finpack.htm
or
3. Your consultant or accountant may already have prepared statements that meet the above for completeness. Have these available. From these consultant prepared statements, calculate the ratios on page 26 of this document. Work with your consultant, District Farm Management Agent, and/or Local Agent to identify strengths and areas of potential improvement. With their help, establish a strategic planto implement improvements within your business.

Vegetable Farm Analysis Workbook - Financial [PAGE 4]
Balance Sheet Instructions andExplanations
The balance sheet or net worth statement is asnapshot of the financial position of the farmbusiness at a given point in time. Everything thebusiness owns and owes is listed on the balancesheet. It provides a summary of how funds havebeen invested in the business (assets) and thefinancing methods (liabilities) used at a given pointin time. Accurate and detailed balance sheets areneeded to accomplish the following:§ Analyze the financial performance of the
business.§ Secure credit and financing from lenders§ Monitor financial progress over time§ Make financial projections§ Understand the financial risk position§ Provide information for Estate Planning
The first step in building an accurate balance sheetis to select the date that the balance sheet represents.It needs to be consistent from year to year.December 31st is the preferred date as thiscorresponds to the end of the previous cashaccounting year and the beginning of the next.Accurate balance sheets for the beginning and endof the cash accounting period enables adjustment ofcash accounting for inventory changes that occurredduring the year. This is essential to understandingthe farm’s financial performance.
The next step is to decide what business entity thebalance sheet represents (partnership, individual orthe whole farm). Clearly identify the person(s) orentity being described at the top of the balance sheetand be consistent each year. Within the balancesheet, it is important to keep separate farm fromnon-farm assets and liabilities.
ASSETSAssets are all the things owned or coming to thebusiness as of the date of the statement. There maybe a liability against the asset. This will beaccounted for in the liability part of the BalanceSheet
Current Farm AssetsCurrent assets are cash or other assets that are
expected to be realized in cash or consumed (feed,etc.) in production during a business year.
All supplies on hand should be priced at their cost.Growing crops such as wheat or alfalfa, should belisted at the actual cash costs invested to date.
See appendix 1 for information on calculating thequantity of crops in storage and pricing corn silageand haylage.
Government payments should reflect payments yetto come as a result of past activities, not futureactivities. A crop under loan can be valued andlisted with crops held for sale only if offset later bya loan against it in the liability section.
The Market Value and Cost Value values are thesame for current assets.
Valuation Methods for Intermediate and Long-term Assets
Values for intermediate and long-term assets shouldbe determined using both their Cost Value and theirMarket Value. The Cost Value is the purchase priceminus the depreciation taken to date. This shouldbe consistent with income tax records. The MarketValue is the amount that would be received if theasset were sold on the open market. It is importantto use consistent values from year to year.
This formula may be helpful to help be consistentfrom year to year on Market Value:“beginning value” PLUS “purchases made duringthe year” MINUS “cash sales” TIMES “90%”(The 90% can be changed to reflect the years of theasset. 90% would be a 10% or 10 year life. 85.71%would be 7year life and 95% would be 20 year life.)
Lenders want to see the Market Value of term assetsso they can determine ability to repay the loan ifthey had to foreclose. The accrual incomestatements (over several years) should be used todetermine ability to repay without foreclosure.

Vegetable Farm Analysis Workbook - Financial [PAGE 5]
There is significant value in both Market Value andCost Value balance sheets. Market Value only canbe very misleading in determining profitability andmonitoring financial progress over time. Net worthcalculated from a Market Value balance sheet isaffected by inflation or deflation as well as actualearned income. The Cost Value balance sheet is notaffected by inflation or deflation and is more usefulin monitoring the businesses financial profitabilityand progress since only the changes in net worthresulting from earnings are included. There isspace to enter both the Cost Value and the MarketValue of term assets in the worksheet.
Intermediate Farm AssetsIntermediate-term assets are those resources thatsupport production. They are not intended forimmediate sale. Such assets are expected to have auseful line of 1 to 7 years. They include machineryand equipment (marketable value and un-depreciated value; be consistent year to year),breeding livestock, and securities not readilymarketable.
Long-Term Farm AssetsLong-term assets include items of a morepermanent nature, such as farmland, buildings andimprovements, and non-farm real estate. Landshould be listed separately from farm buildings andimprovements.
Non-Farm AssetsNon-farm Assets are those assets not used in thefarm business. These could be profits taken fromthe business for personal use. Personal residence,house hold items, retirement funds and cash valueof life insurance typically are non-farm assets.
LIABILITIESLiabilities are all obligations that are owed as of the
statement date. Do not change the classification ofa liability as it matures. Make sure principal andunpaid accrued interest are separated. The principalbalances should not include unpaid interest.Accrued unpaid interest is listed separately.Statements from lending institutions should be usedto verify balances.
Current Farm LiabilitiesCurrent liabilities are those due and payable ondemand or within the operating year. Commoditycredit loans should be added to this section. If aCCC loan is entered, make sure the product is listedon the asset side of the balance sheet as well.
It is important to separate and understand thedifference between borrowed money and unpaidbills. In cash accounting, unpaid bills have not yetbeen claimed as a tax-deductible expense.
Intermediate Farm Liabilities-Intermediate liabilities and debts are againstintermediate assets. These typically are due within7 or 10 years. Loans for machinery and equipmentpurchases and breeding livestock tend to fall intothis category. Leases, such as on silos andmachinery, should be added here.
Long-term Farm LiabilitiesLong-term liabilities are against long term Assets.Typically these are land contracts and mortgages onland and buildings. These typically were set uporiginally with 10 or more year to repay.
Non-Farm LiabilitiesNon-Farm Liabilities are those liabilities againstnon-farm Assets.
B=Beginning, E=Ending, C=Cost Value,M=Market Value
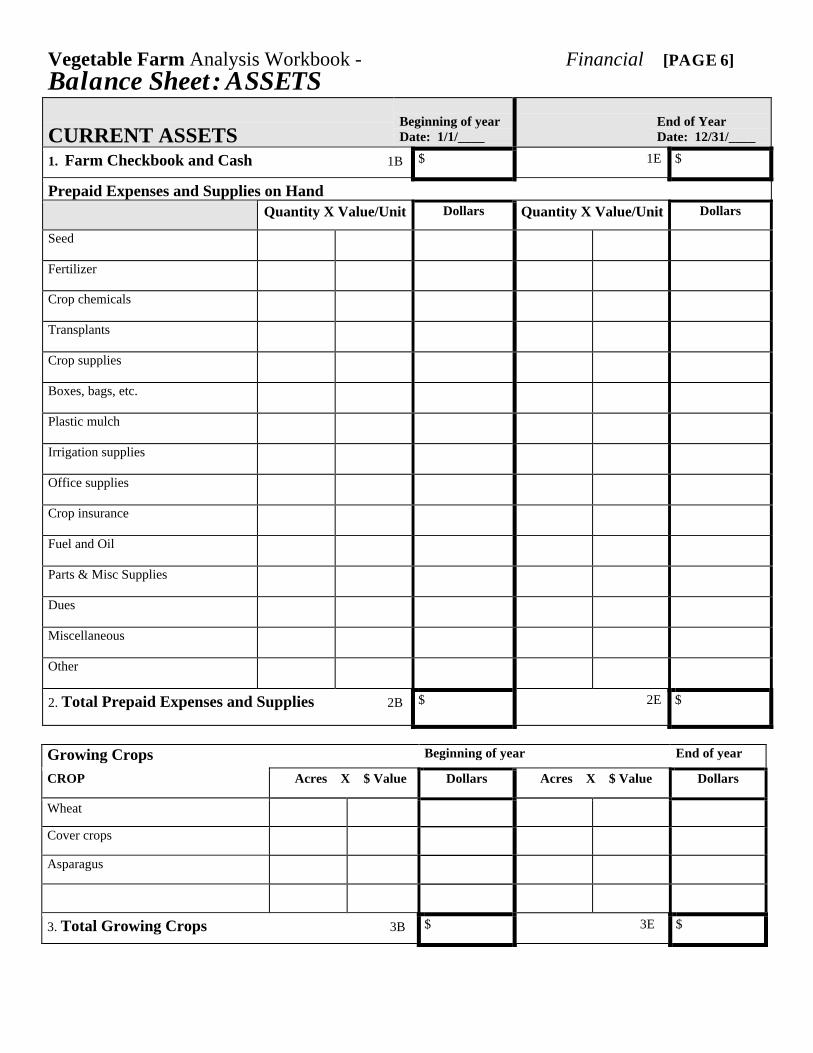
Vegetable Farm Analysis Workbook - Financial [PAGE 6]Balance Sheet: ASSETS
CURRENT ASSETSBeginning of yearDate: 1/1/____
End of YearDate: 12/31/____
1. Farm Checkbook and Cash 1B $ 1E $
Prepaid Expenses and Supplies on HandQuantity X Value/Unit Dollars Quantity X Value/Unit Dollars
Seed
Fertilizer
Crop chemicals
Transplants
Crop supplies
Boxes, bags, etc.
Plastic mulch
Irrigation supplies
Office supplies
Crop insurance
Fuel and Oil
Parts & Misc Supplies
Dues
Miscellaneous
Other
2. Total Prepaid Expenses and Supplies 2B $ 2E $
Growing Crops Beginning of year End of year
CROP Acres X $ Value Dollars Acres X $ Value Dollars
Wheat
Cover crops
Asparagus
3. Total Growing Crops 3B $ 3E $
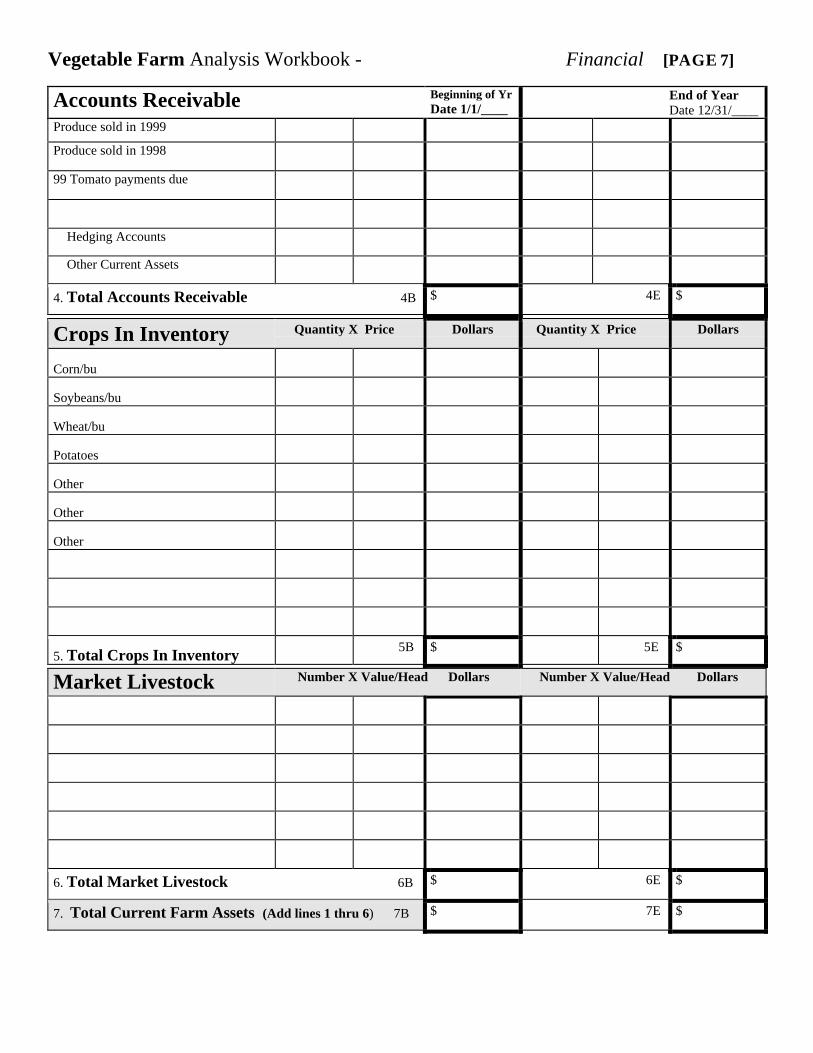
Vegetable Farm Analysis Workbook - Financial [PAGE 7]
Accounts Receivable Beginning of YrDate 1/1/____
End of Year Date 12/31/____
Produce sold in 1999
Produce sold in 1998
99 Tomato payments due
Hedging Accounts
Other Current Assets
4. Total Accounts Receivable 4B $ 4E $
Crops In Inventory Quantity X Price Dollars Quantity X Price Dollars
Corn/bu
Soybeans/bu
Wheat/bu
Potatoes
Other
Other
Other
5. Total Crops In Inventory 5B $ 5E $
Market Livestock Number X Value/Head Dollars Number X Value/Head Dollars
6. Total Market Livestock 6B $ 6E $
7. Total Current Farm Assets (Add lines 1 thru 6) 7B $ 7E $

Vegetable Farm Analysis Workbook - Financial [PAGE 8]
INTERMEDIATE FARM ASSETSBeginning of YrDate: 1/1/____
End of YrDate: 12/31/___
Breeding Livestock Number X Value/Head Dollars Number X Value/Head Dollars
8. Total Breeding Livestock 8B $ 8E $
Machinery & Equipment(Cost value is the remaining un-depreciated tax basis)
Cost Value Market Value Cost Value Market Value
Machinery
Other
9. Total Machinery & Equipment $ $ $ $
9BC 9BM 9EC 9EM
Other Intermediate Assets
Co-op Stock
Plant material (Nursery Stock)
Grape Certificates
Other
10. Total Other Intermediate Assets $ $ $ $
10BC 10BM 10EC 10EM
11. Total Intermediate Assets (add lines 8, 9, 10) $ $ $ $
11BC 11BM 11EC 11EM

Vegetable Farm Analysis Workbook - Financial [PAGE 9]
LONG TERM FARM ASSETS Beginning of YearDate: 1/1/____
End of YearDate: 12/31/___
Farm Land Cost value is the remaining un-depreciated tax basis (what you paid for it minus tax depreciation claimed)Acres X ValueEquals Market
Cost Value Market Value Cost Value Market Value
Home Farm
12. Total Land $ $ $ $
12BC 12BM 12EC 12EM
Farm Buildings & Improvements Cost Value is the remaining un-depreciated tax basisFarm Buildings
Improvements including Tile
Grates, Plants & Trellis
13. Total Farm Buildings & Improvements $ $ $ $
13BC 13BM 13EC 13EM
Other Long-Term AssetsFCS Long Term Stock
Other
14. Total Other Long-Term Assets $ $ $ $
14BC 14BM 14EC 14EMTOTAL LONG-TERM FARM ASSETS Cost Value Market Value Cost Value Market Value
15. Tot. L. Term Farm Assets (Add lines 12,13,14) $ $ $ $
15BC 15BM 15EC 15EM

Vegetable Farm Analysis Workbook - Financial [PAGE 10]
NON-FARM ASSETSBeginning of Year
Date: 1/1/____End of Year
Date: 12/31/____Cost Value Market Value Cost Value Market Value
16. Savings and Checking $ $ $ $
16BC 16BM 16EC 16EMStocks and Bonds
Other Current Assets
Household Furnishings & Appliances
Non-farm Vehicles
Cash Value of Life Insurance
Retirement Accounts and IRA’s
Other Intermediate Assets
Non-Farm Real Estate Your House
Other Long Term Assets
17. Total Non-Farm Assets (Include line 16) $ $ $ $
17BC 17BM 17EC 17EM
TOTAL COMBINED FARM AND NON-FARM ASSETS18. (add lines 7*, 11, 15 and 17 for each column ) $ $ $ $
18BC 18BM 18EC 18EM
* NOTE: Line 7 (Current Farm Assets) - Use cell 7B for both the Cost Value and Market Value columns for the Beginning ofthe Year, and cell 7E for both the Cost Value and Market Value columns for the End of the Year figures.

Vegetable Farm Analysis Workbook - Financial [PAGE 11]Balance Sheet: LIABILITIESCURRENT FARM LIABILITIES
Beginning of YearDate: 1/1/____
End of YearDate: 12/31/____
Farm accounts payable (unpaid bills & credit cards if not shown as principal debt)
Quantity X Value/Unit Dollars Quantity X Value/Unit Dollars
Fertilizer
Crop chemicals
Drying Fuel
Misc. Crop Expenses
Purchased Vegetables
Seed
Custom work
Fuel & Oil
Repairs
Labor Related Items
Land Rents
Machinery Unpaid
Real Estate Taxes
Insurance or Other
Unpaid Utilities
Unpaid Dues
Misc. Unpaid
19. Total Unpaid Bills $ $
19B 19E
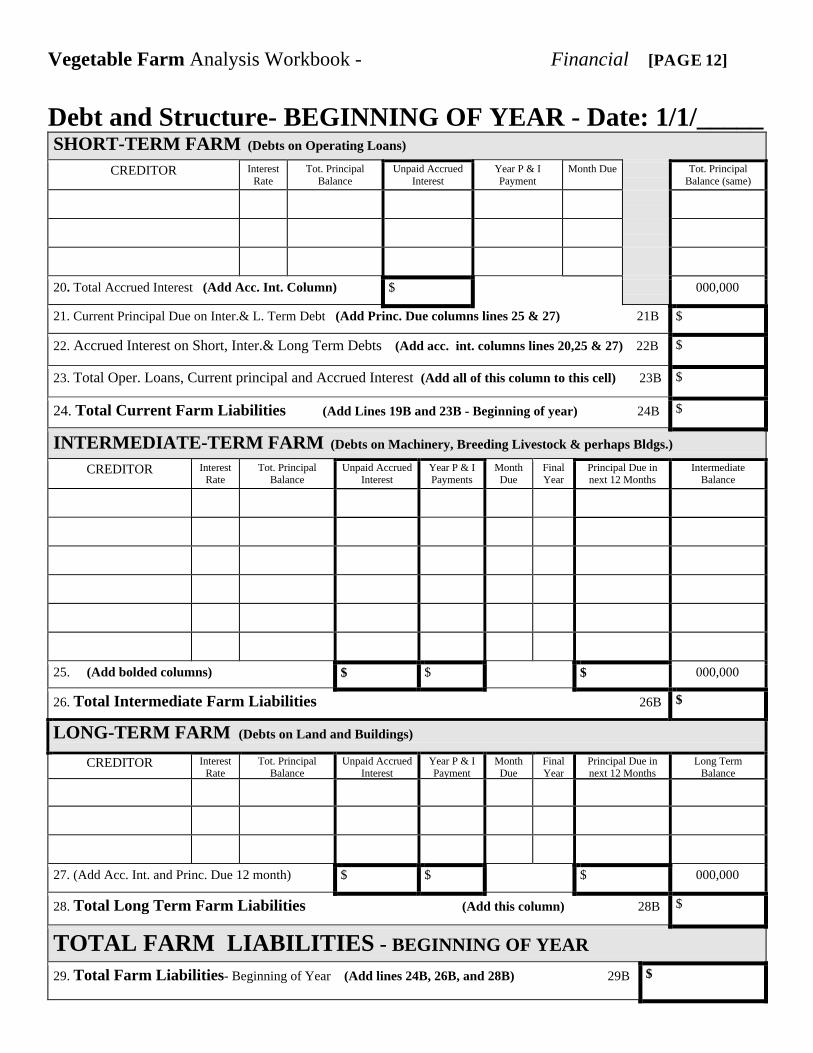
Vegetable Farm Analysis Workbook - Financial [PAGE 12]
Debt and Structure- BEGINNING OF YEAR - Date: 1/1/_____SHORT-TERM FARM (Debts on Operating Loans)
CREDITOR InterestRate
Tot. PrincipalBalance
Unpaid AccruedInterest
Year P & IPayment
Month Due Tot. PrincipalBalance (same)
20. Total Accrued Interest (Add Acc. Int. Column) $ 000,000
21. Current Principal Due on Inter.& L. Term Debt (Add Princ. Due columns lines 25 & 27) 21B $
22. Accrued Interest on Short, Inter.& Long Term Debts (Add acc. int. columns lines 20,25 & 27) 22B $
23. Total Oper. Loans, Current principal and Accrued Interest (Add all of this column to this cell) 23B $
24. Total Current Farm Liabilities (Add Lines 19B and 23B - Beginning of year) 24B $
INTERMEDIATE-TERM FARM (Debts on Machinery, Breeding Livestock & perhaps Bldgs.)
CREDITOR InterestRate
Tot. PrincipalBalance
Unpaid AccruedInterest
Year P & IPayments
MonthDue
FinalYear
Principal Due innext 12 Months
IntermediateBalance
25. (Add bolded columns) $ $ $ 000,000
26. Total Intermediate Farm Liabilities 26B $
LONG-TERM FARM (Debts on Land and Buildings)
CREDITOR InterestRate
Tot. PrincipalBalance
Unpaid AccruedInterest
Year P & IPayment
MonthDue
FinalYear
Principal Due innext 12 Months
Long TermBalance
27. (Add Acc. Int. and Princ. Due 12 month) $ $ $ 000,000
28. Total Long Term Farm Liabilities (Add this column) 28B $
TOTAL FARM LIABILITIES - BEGINNING OF YEAR
29. Total Farm Liabilities- Beginning of Year (Add lines 24B, 26B, and 28B) 29B $

Vegetable Farm Analysis Workbook - Financial [PAGE 13]NON FARM LIABILITIES - BEGINNING OF YEAR
Accounts payable and other accrued expenses
Credit Cards
30. Total Non Farm accounts payable, accrued expenses, Credit Cards and other $
CREDITOR Interest Rate
Tot. PrincipalBalance
Unpaid AccruedInterest
Year P & IPayments
MonthDue
FinalYear
PrincipalDue
12mnth
TermBalance
Current Curr All $0,000
Curr. All $0,000
Curr All $0,000
Intermediate
Long Term
31. Totals of Principal & AccruedInterest
$ $
32. Total Non Farm Liabilities (add the three bolded cells with $ signs in line 30 and line 31) 32B $
TOTAL COMBINED FARM AND NON-FARM LIABILITIES- BEGINNING OF YEAR
33. Total Combined Farm and Non Farm Liabilities (Add Lines 29B & 32B) 33B $

Vegetable Farm Analysis Workbook - Financial [PAGE 14]
Debt and Structure - END OF YEAR - Date: 12/31/_____SHORT-TERM FARM (Debts on Operating Loans)
CREDITOR InterestRate
Tot. PrincipalBalance
Unpaid AccruedInterest
Year P & IPayment
MonthDue
Total PrincipalBalance (same)
(same)
34. Total Accrued Interest (Add Acc. Int. Column) $ 000,000
35. Current Principal Due on Inter.& L. Term Debts (Add Princ. Due columns lines 39 & 41) 35E $
36. Accrued Interest on Short, Inter.& Long Term Debts (Add acc. int. columns lines 34,39 &41) 36E $
37. Total Oper. Loans, Current principal and Accrued Interest (Add all of this column to this cell) 37E $
38. Total Current Farm Liabilities (Add Lines 19E and 37E - End of Year) 38E $
INTERMEDIATE-TERM FARM (Debts on Machinery, Breeding Livestock & perhaps Bldgs.)
CREDITOR InterestRate
Tot. PrincipalBalance
Unpaid AccruedInterest
Year P & IPayment
MonthDue
FinalYear
Principal Due innext 12 Months
IntermediateBalance
39. (Add bolded columns) $ $ $ 000,000
40. Total Intermediate Farm Liabilities 40E $
LONG-TERM FARM (Debts on Land and Buildings)
CREDITOR InterestRate
Tot. PrincipalBalance
Unpaid AccruedInterest
Year P & IPayment
MonthDue
FinalYear
Principal Due innext 12 Months
Long TermBalance
41. (Add Acc. Int. and Princ. Due 12 month) $ $ $ 000,000
42. Total Long Term Farm Liabilities 42E $
TOTAL FARM LIABILITIES - END OF YEAR
43. Total Farm Liabilities – End of Year (add lines 38E, 40E, and 42E) 43E $

Vegetable Farm Analysis Workbook - Financial [PAGE 15]
NON FARM LIABILITIES - END OF YEAR Accounts payable and other accrued expenses
Credit Cards
44. Total Non Farm accounts payable, accrued expenses, Credit Cards and other $
CREDITOR InterestRate
Tot. PrincipalBalance
Unpaid AccruedInterest
Year P & IPayment
MonthDue
FinalYear
Principal Due12mnth
TermBalance
Current Curr. All 000,000
Curr. All 000,000
Curr. All 000,000
Intermediate
Long Term
45. Totals of Principal & Int. $ $
46. Total Non Farm Liabilities (add the three bolded cells with $ signs in line 44 and line 45) 46E $
TOTAL COMBINED FARM AND NON-FARM LIABILITIES - END OF YEAR
47. Tot. Comb. Farm and Non Farm Liab. End of Year (Add Lines 43E & 46E) 47E $
Note 2
Cost Value versus Market Value Balance Sheets - Apositive Cost Value farm net worth indicates thatthe business has had greater profits and/orcontributed capital than what it has pulled out of thebusiness. A business with negative Cost Value networth indicates that the business has had lossesand/or has pulled more money out of the businessthan profits generated. The term Retained Earningsis sometimes used which basically equals the Cost
Value net worth.The difference between Cost Value net worth andMarket Value net worth is called market valuationequity. This is commonly from land inflation andfrom machinery being valued greater than theremaining tax cost basis. Having both cost andmarket valuation balance sheets allows the managerto see where equity is coming from; retained profitsor from inflation.

Vegetable Farm Analysis Workbook - Financial [PAGE 16]
Summary and Comparison Sheet for Assets and LiabilitiesASSETS Beginning of Year
Date: 1/1/____End of Year
Date: 12/31/____NOTE: For Total Farm Current Assets use cell 7B for bothCost Value & Market Value for Beginning Year; use cell 7Efor both Cost Value & Market Value for End of Year
Cost Value MarketValue
Cost Value MarketValue
48. Total Farm Current Assets (line 7)
49. Total Farm Intermediate (line 11)
50. Total Farm Long-Term Farm (line 15)
51. Total Farm Assets (add lines 48, 49, 50) $ $ $ $
52. Non Farm Assets (line 17)
53. Total Combined Farm & Non-Farm Assets (add lines 51 and 52)
$ $ $ $
LIABILITIES (Cost and Market Values will be the same)
NOTE: Cost Value and Market Values are the same for theBeginning of Year and Cost Value and Market Values arethe same for the End of the Year columns for Liabilities
Cost Value MarketValue
Cost Value MarketValue
Beg. of Yr. End of Yr.54. Total Farm Current Liabilities (24B) (38E)
55. Total Farm Interm. Liabilities (26B) (40E)
56. Total Farm L. T. Liabilities (28B) (42E)
57. Total Farm Liabilities (add lines 54, 55 & 56) $ $ $ $
58. Non Farm Liabilities (32B) (46E)
59. Total Combined Farm & Non-Farm Liabilities (add lines 57 & 58)
$ $ $ $
BALANCE SHEET OR NET WORTH COMPARISONCost Value Market
ValueCost Value Market
Value60. Farm Net Worth (line 51 minus line 57) $ $ $ $
61. Farm Contingent Tax Liability (optional)
62. Farm Net Worth after Contingent Tax Liability (line 60 minus 61)
$ $ $ $
63. Non Farm Net Worth (line 52 minus line 58) $ $ $ $
64. Non Farm Contingent Tax Liability (optional)
65. Non Farm Net Worth after Contingent Tax Liability (line 63 minus line 64)
$ $ $ $
66. Tot. Combined Farm & Non Farm Net Worth (add lines 62 and 65)
$ $ $ $
67. Farm Market Valuation Equity (See note 2) (line 51Market Value minus line 51 Cost Value for each year)
XXXXXXXX $ XXXXXXXX $
68. Change in Combined Net Worth for the year (use line66 for both CV and MV, Ending minus Beginning)
XXXXXXXX XXXXXXXX $ $

Vegetable Farm Analysis Workbook - Financial [PAGE 17]INCOME STATEMENT - Explanations
The profit and loss statement or NET FARMINCOME presents a summary of income, relatedexpenses and the resultant profit or loss fromoperations for a given period, normally one year.The income statement starts with the NET CASHFARM INCOME and then makes inventoryadjustments to determine NET OPERATINGPROFIT. Depreciation and other capitaladjustments are made next to determine NETFARM INCOME.
By comparing profit and loss statements for severalyears, you can see trends in your business. If youuse a profit and loss statement along with a balancesheet, you can calculate your return on investment.
An income statement must include adjustments forinventories, and depreciation.
NET CASH FARM INCOME is simply the
difference between total cash income and total cashexpenses. This value minus tax depreciation iswhat are subject to cash basis income taxes.
NET OPERATING PROFIT takes into accountinventory changes of current assets and unpaid bills.These changes are often huge and make significantdifferences to the income statement. A feedshortage due to drought often will not show in cashflow until next year.
NET FARM INCOME takes into accountdepreciation and other capital activities. This iswhere the cost of machinery, buildings and otherassets with a life of more than one year getsaccounted for. The change in inventory of BreedingLivestock is accounted for in this section. The NetFarm Income is the return to unpaid labor andmanagement and the farm equity used in thebusiness.
B=Beginning, E=Ending, C=Cost Value, M=Market Value

Vegetable Farm Analysis Workbook - Financial [PAGE 18]Income Statement: CASH FARM REVENUE for the YearCASH FARM INCOME
Quantity Dollars
Corn Bu $
Soybeans Bu
Sugar beets Ton
Wheat Bu
Other Grains Bu
Hay and straw
Fresh market tomatoes Ton
Processing tomatoes
Cantaloupe and other melons
Sweet Corn
Cucumbers and pickles
Peppers
Cabbage and other cole crops
Pumpkins
Squash
Potato sales Cwt
Potato seed Cwt
Deficiency Payments
CRP payments
Other Government Programs
Custom Income
Patronage Dividends, Cash
Insurance Income
Cash from Hedging
Other Farm Incomes
PA 116 and Homestead
69. Gross Cash Farm Income $

Vegetable Farm Analysis Workbook - Financial [PAGE 19]Income Statement: CASH FARM EXPENSES for the YearCASH FARM EXPENSES (expenses paid) Quantity & Unit Dollars
Seed UnitsFertilizer
Transplants
Crop Chemicals
Crop Insurance
Drying Fuel
Irrigation Energy
Packaging and Supplies
Utilities
Hauling and Trucking Crop
Marketing Crops
Inspection fees
70. Interest $
Fuel and Oil
Repairs
Custom Hire
Hired Labor
Land Rent
Machinery and Building Leases
Real Estate Taxes
Farm Insurance
Other farm utilities
Dues and professional fees
71. Total Cash Farm Expenses $

Vegetable Farm Analysis Workbook - Financial [PAGE 20]
72. NET CASH FARM INCOME (Line 69 minus Line 71) $
INVENTORY CHANGES*Note: The numbers below the cell or box is where you find your value.
Crop & Feed MarketLivestock
Receivables &other
income items
PrepaidExpenses
Payables &AccruedExpenses
73. Ending Inventory
(line 5E) (line 6E) (line 4E+3E) (line 2E) (line 19B+22B)(Beginning)
74. Beginning Inventory
(line 5B) (line 6B) (line 4B+3B) (line 2B (line 19E+36E)(Ending)
75. Inventory Change (line 73 minus line 74)
$ $ $ $ $
76. Total Inventory Change $
(Combine all cells in line 75. Make sure to add or subtract depending on the cell’s individual value.)
77. NET OPERATING PROFIT (Line 72 combined with line 76)$
DEPRECIATION AND OTHER CAPITAL ADJUSTMENTSBreedingLivestock
Machinery &Equipment
Building &Improvements
OtherAssets
78. Ending Inventory
(line 8E) (line 9EC) (line 13EC) (line 10EC+14EC)
79. Capital Sales ( + )
(Separate out sales by categories) (line 85) (line 85) (line 85) (line 85)
80. Beginning Inventory ( - )
(line8B) (line 9BC) (line 13BC) (line 10BC+14BC)
81. Capital Purchases ( - )
(Separate out purchases by categories) (line 90) (line 90) (line 90) (line 90)
82. Depreciation/Capital Adjust. ( = )(Line 78 plus L. 79 minus L. 80 minus L. 81)
$ $ $ $
83. Total Depreciation/Capital Adjustment (Combine all cells in line 82. Make sure to add or subtract depending on your cell’s individual value.)
$
84. NET FARM INCOME (Cost Value) (line 77 combined with line 83) $

Vegetable Farm Analysis Workbook - Financial [PAGE 21]
Statement Of Cash Flows and Cash Reconciliation
SOURCE OF FUNDS USE OF FUNDSBeginning Cash Balance (line 1B) Ending Cash Balance (line 1E)
Gross Cash Farm Income (line 69) Total Cash Farm Expense (line 71)
85. Farm Capital Sales (sum of line 79blocks)
90. Farm Capital Purchases (sum of line 81blocks)
86. Net Non-Farm Income 91. Income Tax and S.S. Paid
87. Money Borrowed 92. Principal Payments
88. Gifts and Inheritances 93. Cash Gifts Given
Beg. Non-Farm Savings (line 16BC) End. Non-Farm Savings (line 16EC)
89. Total Cash Inflows $ 94. Subtotal Cash Outflows $
95. Apparent family living expense (line 89 minus line 94) $
96. Family living expense reported $
97. Discrepancy (Unaccounted Cash) (line 95 minus line 96) $
This section is used to help determine the accuracyof the information. With large unaccounted cash,one should question the accuracy of the financialinformation. Your accounting system should be
able to account for these activities. For assistancecontact your local extension agent to learn about theMSU Extension Telfarm farm record keepingsystem.
B=Beginning, E=Ending, C=Cost Value, M=Market Value

Vegetable Farm Analysis Workbook - Financial [PAGE 22]
FINANCIAL MEASUREMENTS - Explanations
Having an understanding of the financial ratios andmeasurements for specific farms can givesignificant guidance of where to investigate foropportunities and improvements in the business.Expansion feasibility can be more realisticallyevaluated with good financial information. Highprofitability and adequate cash flow is the result ofmany factors. Information from the beginning andending balance sheets and the income statement canbe used to calculate these financial measurements.The indicators should be calculated each year todocument and monitor financial progress.
Side-by-side comparisons of the efficiency ratios toother Michigan farms will help the manager identifywhere improvements may be made. The financialmeasures allow the farm manager to identify wherestrengths and weaknesses of the business are. Arethey having a profitability problem, a cash-flowproblem, or a debt structure problem? Are theefficiencies within reason, or should managementenergies by focused to enhance the strengths andminimize the weaknesses? A low asset turnoverrate may indicate the necessity to liquidateunproductive assets, including machinery,unproductive land, or high valued land.
The National Standards Task Force on farmaccounting has sixteen ratios divided into five majorgroupings. We will utilize eleven of these ratios.The five main sections are: Liquidity, Solvency,Profitability, Repayment Capacity and Efficiency.
LiquidityThe Current Ratio is the total current farm assetsdivided by total current farm liabilities. The currentratio tells us if we have enough current assets tocover our current liabilities, and the current portionsof intermediate and long-term debts are included inthis ratio. The current ratio is static in nature in thatno timing of cash flows are involved and it ignoreslines of credit that may be available. Current isdefined as a 12-month planning horizon. Desiredlevel varies by type of farm, with dairy able to havea lower value compared to fruit or cash cropoperations. A ratio less than (<) 1 is considered“weak”, with the ratio greater than (>) 2 consideredto be “strong”. A business with weak current ratio
and cash flow problems should evaluate stretchingprincipal payments over more years. It is alsovaluable to look at how this ratio has changed overrecent years and relate to production and/orinvestment occurrences.
SolvencyThe farm Debt to Asset Ratio tells us whatpercentage of business assets are owed to creditors.This is calculated by taking total farm liabilitiesdivided by total farm assets. The debt to asset ratiomeasures the financial position of the business. Itgives us a measure of risk exposure and the abilityof the business to take hits. The debt to asset ratiois not a measurement of profitability. Ratios > than65% are considered to be “weak”, with ratios < than35% considered to be “strong”. The equity to assetratio is simply the reverse of the debt to asset ratio,and the debt to equity ratio is computed using thesame values. It is also called the leverage ratio andlenders tend to use it. This is an important value tomonitor over time and as major investments areconsidered or made. A goal may be a Debt to Assetratio below 60% even during a major expansion.
ProfitabilityThe Rate of Return on Farm Assets is a goodoverall measure of profitability. It is calculated bytaking the net farm income plus interest expenseminus the value of unpaid operators, labor andmanagement; and this all is divided by the averagetotal farm assets. Including the value of unpaidlabor and management is important, andsignificantly influences this ratio. The ratio tells ushow our business compares from prior years and tooutside investments. The ratio tells us what thereturn on the business is if there were no debts andafter the value of unpaid labor and management ispaid. This ratio can be greatly influenceddepending on whether you’re using cost value ormarket value. We’ve chosen to calculate on marketvalue. Non-farm income items should not beincluded. Comparisons across farms are moremeaningful using market values, while comparisonsfrom year-to-year of an individual farm is moremeaningful using cost values. For rate of return onfarm assets, ratios <4% are considered “weak”,while >10% are considered to be “strong”.

Vegetable Farm Analysis Workbook - Financial [PAGE 23]
The Rate of Return on Farm Equity measureshow well your equity capital is being employed bythe business. It is calculated by taking the net farmincome, minus the value of operator’s unpaid laborand management, divided by the average total farmequity. Highly leveraged and under capitalizedfarms can get wild results. If your debt is workingfor you, the return on equity will be higher than thereturn on assets. If the farm has no debt, the returnon equity will be the same as the return on assets.Rate of return on farm equity should be higher thanrate of return on assets, but ratios <6% areconsidered “weak”, while ratios >12% areconsidered “strong”.
The Operating Profit Margin ratio measures theefficiency in terms of the return per dollar of sales.The operating profit is before interest expense, butafter taking a charge for the value of unpaid laborand management. A low operating profit margincan be caused by low production, low prices, orhigh input costs. These input costs include all theexpenses included under cash farm expenses, butnot including interest. Interest expense does notaffect the operating profit margin. A high value ofunpaid labor management will reduce the operatingprofit margin. Depreciation is also not part of theratio. Operating profit margin ratios <10% areconsidered “weak”, while ratios >20% areconsidered “strong”. The operating profit marginratio calculates the profit of the business withouttaking into consideration interest, but after takinginto account the value of unpaid labor andmanagement.
A farm heavily leveraged must have a strong rate ofreturn on farm assets, while a business that hasrelatively low debt, or no debt, can be quiteprofitable from an income tax standpoint, andprovide significant family living and some increasein net worth.
Repayment CapacityThe Term Debt Coverage Ratio measures theability of businesses to cover all intermediate andlong-term debt payments. It is calculated by takingnet earnings, which includes farm and non-farmearnings plus depreciation, plus interest on the
intermediate and long-term debts divided by theannual scheduled principle and interest on theintermediate and long-term debts. Notice that theamount of money available for debt servicing of theintermediate and long-term debts does not includethe interest that is paid on short-term one year andoperating loans. The ratio of 1 or 100% means thatthere is just enough money to service the debt.Ratios less than 115% are considered “weak”, whileratios greater than 140% are considered “strong”.The farm with a weak repayment capacity may ormay not have a profitability problem. Repaymentcapacity is a measurement of the ability of thebusiness to pay interest and principal in relationshipto how debt is structured. A fast debt repaymentstructure will generate a lower repayment capacity.The farm may be experiencing cash flow problems,creating a weak current ratio, because of the fastrepayment schedule. A farm with a relatively goodrate of return on assets and net farm income ratio,but a weak repayment capacity can restructure itsdebt to spread out payments and improve cash flow.
Efficiency MeasuresThe Asset Turnover Rate measures how efficientlyassets are being utilized in the business togenerating revenue. A low asset turnover ratioindicates that the business has a lot of assets notefficiently being utilized. However, a business canhave a low asset turnover ratio if it has a high profitmargin ratio. The asset turnover ratio times theprofit margin ratio gives you the rate of return onfarm assets; in other words, how much profit isbeing generated in relationship to the amount ofassets employed by the business. A farm businessthat owns most of its assets, including land andfacilities will have a relatively low asset turnoverrate, compared to a business that rents most of itsland and facilities, which should have a high assetturnover rate, but may have a low operating profitmargin. It’s the combination of these two that isimportant to determine overall profitability in thebusiness.
The Operating Expense Ratio is used to comparethe individual farm to industry averages orstandards. It is used to measure expense control. Itis calculated by taking total operating expensesdivided by total revenue. The operating expensesare the items listed in the cash farm expense section,

Vegetable Farm Analysis Workbook - Financial [PAGE 24]
but do not include interest. It is similar to the profitmargin, except it looks at the expenses versus theincome, and the operating expenses ratio does notinclude a value for unpaid labor and management,where the operating profit margin does include avalue for unpaid labor and management. Theoperating expense ratio is commodity specific, butratios >80% are considered “weak”, while values<70% are considered “strong”.
The same items that affect the operating profitmargin also directly inversely affect the operatingexpense ratio, with the exception of the value ofunpaid labor and management. So to some degree,the same items that affect the operating profitmargin also affect the operating expense ratio.
The Depreciation Expense Ratio is used to look atthe amount of income being used for capital items.A ratio >10% is considered “weak”, while a ratio<5% is considered “strong”.
The depreciation expense ratio should not includethe depreciation on purchased breeding livestock,nor should it include the appreciation ordepreciation on raised breeding livestock. The onlyway to decrease the depreciation ratio, without amajor change in the business, is to decrease theamount of capital purchases each year. It will takea few years to work out of a high ratio. A farm thathas new facilities will also experience a highdepreciation ratio, but highly utilized facilities,especially the milking parlor, can keep thedepreciation ratio <10%.
The Interest Expense Ratio is used to measure theinterest expense compared to gross income from theoperation. The high interest expense ratio indicatesthat the business is not generating much income inrelationship to the amount of interest being paid. Ahigh or weak interest expense ratio indicates that thebusiness needs to reduce debt or increase the outputwith the investment that it has. Highdepreciation/high interest ratios often go together.If these two items are high, the operating expenseratio needs to be relatively low in order to have asatisfactory net farm income ratio
The Net Farm Income Ratio is the amount ofmoney left over after operating, depreciation andinterest expenses. It is different than the operatingprofit margin because interest and depreciation isincluded, while the value of unpaid family labor andmanagement is not included in NFIR. A net farmincome ratio <7% is considered “weak”, while>15% is considered “strong”. A low net farmincome ratio indicates the farm is not generatingmuch profit for the unpaid labor or for net worthgain. Businesses that do not have any unpaid labor,i.e.: a corporate structure where the owners are paidthrough salaries, will tend to have a lower farmincome ratio because the value of unpaid labor isincluded in the cash expenses.

Vegetable Farm Analysis Workbook - Financial [PAGE 25]
Year _________FINANCIAL MEASUREMENTS
Beginning of Year End of Year
LIQUIDITY98. Current Farm Assets (line 7B) and (line 7E) $ $
99. Current Farm Liabilities (line 24B) and (line 38E) $ $
100. Farm Current Ratio (line 98 divided by line 99)
SOLVENCY101. Total Farm Debt (line 29 B) and (line 43 E) $ $
102. Total Farm Assets (line 51 BM) and (Line 51 EM) $ $
103. Debt to Asset Ratio (Farm,Market) (line 101 divided by line 102) X 100 % %
PROFITABILITY _____
104. Net Farm Income (Market Value) (Line 84 plus line 67EM minus line 67BM) $
105. Farm Total Accrual Interest (line 70 plus line 36E minus line 22B) $
106. Value of Unpaid Family labor and Management (what is yours and others time worth) $
107. Average Farm Assets (Market Value) ((line 102B plus line 102E) divided by 2) $
108. Rate of Ret. on Farm Assets ((line104 plus line105 minus line106) divided by line107) X 100 %
109. Average Total Farm Equity ((line 60BM plus line 60EM) divided by 2) $
110. Rate of Return on Farm Equity ((line 104 minus line 106) divided by line 109) X 100 %
111. Operating Profit Margin (line104 plus line105 minus line106) divided by line116) X 100 %
REPAYMENT CAPACITY – Accrual112. Cash Available for Principal and Interest (line 77 plus line 105 minus interest expense only onoperating and short term debts plus line 86 minus line 95 minus line 91)113. (sum of scheduled yearly P & I payments on Interm. And Long Term Debts from lines 25 and 27)
114. Term Debt Coverage Ratio - Accrual (line 112 divided by line 113) X 100 %
EFFICIENCY115. Gross Farm Income (line 69 plus line 3E plus line 4E plus line 5E plus line 6E minus line 3B minusline 4B minus line 5B minus line 6B)
$
116. Value of Farm Production (line 115 minus purchased livestock and purchased feed from line 71) $
117. Asset Turnover Ratio (Market Value) (line 116 divided by line 107) X 100 %
118. Operating Expense Ratio (Cost Value) ((line71 minus line105 plus line19E minus line19Bminus line2E plus line2B) divided by line115) X 100
%
119. Depreciation Expense Ratio (Cost Value) (line 83 divided by line 115) X 100 %
120. Interest Expense Ratio (Cost Value) (line 105 divided by line 115) X 100 %
121. Net Farm Income Ratio (Cost Value) (line 84 divided by line 115) X 100 %
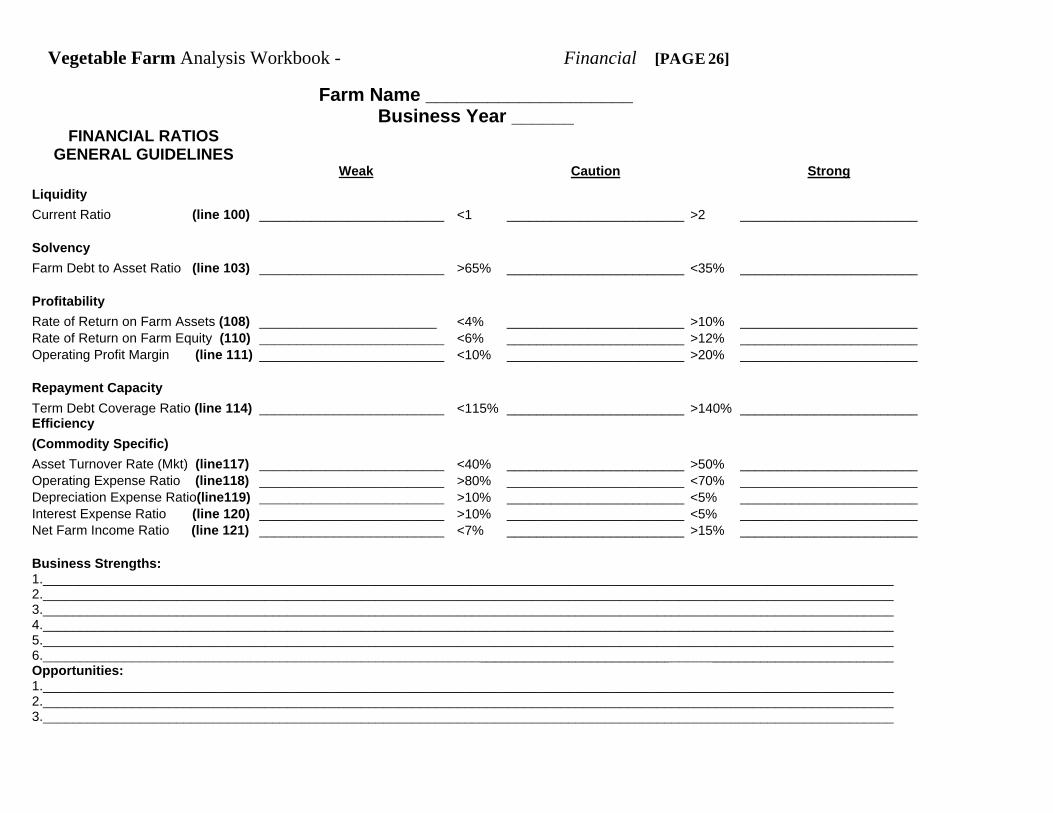
Vegetable Farm Analysis Workbook - Financial [PAGE 26]
Farm Name ____________________Business Year ______
FINANCIAL RATIOSGENERAL GUIDELINES
Weak Caution Strong
Liquidity
Current Ratio (line 100) _________________________ <1 ________________________ >2 ________________________
Solvency
Farm Debt to Asset Ratio (line 103) _________________________ >65% ________________________ <35% ________________________
Profitability
Rate of Return on Farm Assets (108) ________________________ <4% ________________________ >10% ________________________Rate of Return on Farm Equity (110) _________________________ <6% ________________________ >12% ________________________Operating Profit Margin (line 111) _________________________ <10% ________________________ >20% ________________________
Repayment Capacity
Term Debt Coverage Ratio (line 114) _________________________ <115% ________________________ >140% ________________________Efficiency
(Commodity Specific)
Asset Turnover Rate (Mkt) (line117) _________________________ <40% ________________________ >50% ________________________Operating Expense Ratio (line118) _________________________ >80% ________________________ <70% ________________________Depreciation Expense Ratio(line119) _________________________ >10% ________________________ <5% ________________________Interest Expense Ratio (line 120) _________________________ >10% ________________________ <5% ________________________Net Farm Income Ratio (line 121) _________________________ <7% ________________________ >15% ________________________
Business Strengths:1.___________________________________________________________________________________________________________________2.___________________________________________________________________________________________________________________3.___________________________________________________________________________________________________________________4.___________________________________________________________________________________________________________________5.___________________________________________________________________________________________________________________6.___________________________________________________________________________________________________________________Opportunities:1.___________________________________________________________________________________________________________________2.___________________________________________________________________________________________________________________3.___________________________________________________________________________________________________________________

Appendix I
COMPARE NEEDS WITH SUPPLYRequirements Needed Supplies Available Difference
Hay, tons DMHaylage, tons DMCorn silage, tons DMTotal roughage
Total grain, tons
Corn, tonsProtein supplement, tonsOther cereal grainsOther Other
SupplementsTM salt (+/- .004 DM intake)Mineral (+/- .005 DM intake)Other
ESTIMATED FEED NEEDS OF DAIRY COWS - 365 days*FORAGE QUALITY
Forage** Grain*** Forage** Grain*** Forage** Grain***lb/yr lb/day lb/cow/day ton DM lb DM ton DM lb DM ton DM lb DM
20,000 66 47 4.7 7,300 5.1 6,600 5.3 6,20018,000 60 45 4.7 6,800 4.9 6,500 5.1 6,00016,000 52 43 4.7 6,200 4.9 5,700 5.1 5,40014,000 46 41 4.6 5,700 4.9 5,200 5.2 4,600
Heifers, 1-2 yr ----- +/-20 3.9 200 3.8 100 3.6 100Heifers, 1 yr ----- ----- 1.4 1,300 1.5 1,050 1.6 900* Values given are for DM needed/animal/365 days. This includes a dry period of 60 days for milking cows fed about 28 lb DM hay/day. Areasonable estimate of DM consumed can be obtained from the equation DM intake = (2 + [.02 x milk lb/day]) x cwt body wt. This doesnot include feeding and storage losses, which are included in the above table. The value from that equation can be used for any givenperiod. That value can then be multiplied by the percent concentrate and forage in the ration (DM basis) to give lb DM of each neededfor that period.**Forage values are in tons of dry matter. To convert to as-fed basis, divide lb or ton hay DM by .87; to convert DM to lb or ton of 55% DMhaylage, divide lb DM by .55; to convert DM to ton or lb of 35% DM silage, divide by .35.***Grain values are total DM for 1 yr. A 12% grain mix requires 90% corn and 10% soybean meal (44% protein SBM) or equivalent; a 14%mix requires 15% SBM; 16% requires 20% SBM; and 18% requires 26% SBM or equivalent.To convert lb corn DM to lb of HM corn as fed, divide lb DM obtained from table and footnote *** by percent DM in the HM corn; ex., thecow needs 4,000 lb dry corn plus 2,000 lb SBM. Amount of HM corn is 4,000 divided by .70 (70% DM in HMSC) = 5,714 lb of HMSC.
SILO CAPACITIES OF CORNAGE PER FOOT OF HEIGHT
8 10 12 14 16 18 20 22 24 26 30
15.5(*) 1.0 40 63 90 123 160 204 251 304 362 424 64024 .93 37 58 84 114 148 188 233 281 334 392 59228 .89 35 56 80 109 142 180 224 270 320 376 56832 .85 34 53 77 105 136 173 214 258 307 360 543
15.5 1.0 26 41 59 80 103 131 162 196 233 274 41324 .90 23 37 53 72 94 119 148 176 213 250 37528 .86 22 35 50 69 90 114 141 169 203 238 35832 .83 21 34 48 66 86 109 134 162 193 227 342
(*) This first line is for dry grain and can be used to measure capacity of round bins for all small grains.Conversion factor - For any size not listed, multiply the dry grain capacity of the storage by this factor as listed moisture content to determine equivalent in dry grain.Density increases with depth but no allowance was made for compaction in this table. Silos 40 feet or higher may have 10 percentgreater capacity than shown in table.
LOW MEDIUM HIGHMilk production per cow DM consumed
Inside silo diameter (feet)
APPROXIMATE BUSHELS OF DRY GRAIN (15.5%)Conversion
factor
Kernel moisture content
SHELLED CORN (1.25 cubic feet per bushel at 15.5 percent moisture)
GROUND EAR CORN (1.94 cubic feet per bushel at 15/5 percent kernel moisture)

Appendix I
CAPACITIES OF BINS AND CRIBS IN DRY GRAIN
To find the capacities in bushels, first find the volume For round bins, you may use the top line in table and multiply byin cubic feet; height in feet.For a crib or cube, multiply the length x width x height(all in feet). Crib capacities in bushels for ear corn per foot of length:
For round bins, cribs, or silo, multiply the radius 8' 10' 12' 14' 16'(1/2 diameter) x radius x 3.1416 x height. 5 16 20 24 28 32Then, to convert cubic feet to bushels: 6 19.2 24 28.8 33.6 38.4Multiply by .8 for small grain or shelled corn.Multiply by .4 if ear corn.Multiply by .515 if ground ear corn.
STANDARD WEIGHTS OF FARM PRODUCTS PER BUSHEL
Product lb Product lb Product lbAlfalfa 60 Corn (shelled) 56 Ryegrass 24Apples (average) 42 Corn kernel meal 50 Ryegrass 56Barley (common) 48 Corn (sweet) 50 Soybeans 60Beans 60 Cowpeas 60 Spelt 30-40Bluegrass (Kentucky) 14-28 Flax 56 Sorghum 56Bromegrass, orchardgrass 14 Millet (grain) 50 Sudangrass 40Buckwheat 50 Oats 32 Sunflower 24Clover 60 Onions 52 Timothy 45Corn (dry ear) 70 Peas 60 Wheat 60Corn and cob meal 45 Potatoes 60 Milk, per gallon 8.6
RULE OF THUMB ON SILO CAPACITIES TO CONVERT HIGH MOISTURE FORAGE20' X 60' = 500 tons TO DRY HAY EQUIVALENT20' x 50' = 390 tons20' x 40' = 280 tons Method A:20' x 70' = 575 tons Read the tonnage from the silo capacity table. Then divide thisFor any other size silo, the radius squared expressed as figure by 3 to convert to dry hay equivalent. This will be a closea decimal (divided by 100) times the tonnage of a 20-foot estimate, regardless of the moisture content of the grass or haylage.silo will give the capacity in tons
Method B:Examples: Multiply the tonnage of green or wet material by the dry hay per ton30' x 60' - 15 x 15 = 2.25 x 500, or 1,145 tons equivalent in the following table:16' x 50' - 8 x 8 = .64 x 390, or 250 tons12' x 40' - 6 x 6 = .36 x 280, or 101 tons Hay or forage % moisture Dry hay per ton
Green chop 88 .25 tonGrass silage 70 .34Grass silage 65 .40Haylage 60 .45Haylage 50 .57Haylage 40 .68
MEASUREMENT STANDARDS, BUNKER SILO CAPACITY FOR CORNHAY AND STRAW SILAGE, 70 PERCENT MOISTURE
Avg. cu. Ft/ton Range cu. Ft/ton Formula:Hay, baled 275 Average length x width x settled depth (all in feet) x 40 lb = TonsHay, chopped - field cured 425 2,000 lb.Hay, chopped - mow cured 325Hay, long 500 Weight per cubic ft will vary by amount of packing, fineness ofStraw, baled 450 cut, moisture content and depth of material. Use the followingStraw, chopped 600 table to estimate pounds per cubic ft according to depth of pile:Hay, loose 480Straw, loose 800 Depth of silage (ft) Pounds per cubic ft
6 328 3612 4020 45
Height (in feet)Width (in feet)
250-300400-450300-350475-525400-500575-625370-390750-850

Appendix I
SILO CAPACITY:TONS OF CORN OR GRASS SILAGE (68% MOISTURE) IN SETTLED UNOPENED SILOS
12' 14' 16' 18' 20' 24' 26' 30'11 15 20 25 31 45 52 7019 25 33 42 52 75 88 11728 38 49 62 77 111 130 17338 51 67 85 105 151 177 23649 66 87 110 135 194 228 30461 83 108 137 169 243 286 38074 100 131 166 205 295 346 46187 118 155 196 242 348 409 545
101 138 180 229 280 403 473 630117 159 207 261 320 461 541 720137 186 248 310 389 560 673 875--- 212 283 365 444 639 750 999--- --- 319 415 500 720 845 1,125--- --- --- --- 574 827 970 1,290--- --- --- --- 650 1,100 1,330 1,880--- --- --- --- --- --- --- 2,470
NOTE: When a silo is partially unloaded from the top, the remaining silage is more tightly packed and heavier than the same volume inan unopened silo. Therefore, compute the weight remaining as follows:1. Use the table to find the original contents before the silo was opened. (Example: 50' of settled silage in a 20' silo = 389 tons).2. Estimate depth of silage removed and determine its weight from table (Example: Weight removed in 32' = 205 tons).3. Subtract tonnage removed from original contents to find tonnage remaining.(Example: 389 tons (original contents) - 205 tons (removed in 32') = 184 tons (remaining in 18').
CONVERSION TABLES FOR COMMON WEIGHTS AND MEASURES
Metric conversions: Weight conversions: Other conversions:1 pound = 454 grams 8 tablespoons = 1/4 lb. 1% = .012.2 pounds = 1 kilogram 3 teaspoons = 1 tablespoon 1% = 10,000 parts per million (ppm)1 quart = 0.946 liter 1 pint = 1 pound 1 Megacalorie (M-cal) = 1,000 calories1 gram = 15.43 grains 2 pints = 1 quart 1 calorie (big calorie) = 1,000 calories (small calorie)1 metric ton - 2.205 bands 4 quarts = 1 gallon = 8 lbs. 1 M-cal = 1 therm1 inch = 2.54 centimeters 2,000 lbs. = 1 ton1 centimeter - 10 millimeters = .39 inches 16 ounces = 1 pound1 meter = 39.37 inches 27 cubic feet = 1 cubic yard1 acre = .406 hectare 1 peck = 8 quarts
1 bushel = 4 pecks
Bushel weights and volumes:
Oats = 32 lb/buBarley = 48 lb/buShelled corn = 56 lb/buWheat = 60 lb/buCorn & cob meal = 70 lb/buSoybeans = 60 lb/buRye - 56 lb/buSoybean oil meal = 54 lbDairy feed = 35 lb
Storage and Feeding Dry MatterLosses of Alfalfa
Storage methodSmall bales, stored insideRound bales, stored insideHay stacks, stored insideRound bales, stored outsideHay stacks, stored outsideHaylage, vertical siloHaylage, bunk silo
Depth of silage (in feet)Inside diameter of silo in feet
2638.4
8
90
1216202428323640445055607080
lb/cubic ft cubic ft/ton
44.848
775345427242453757
28
44.848
.16
.07
Storage loss Feeding loss04.04
.13
.05
.14
.16
.14
.16
.11
.11
.04
.12