Embed Size (px)
Citation preview
DEPARTMENT OF AGRICULTURAL AND RESOURCE ECONOMICS/APID POLICY DIVISION OF AGRICULTURE AND NATURAL RES&RCES
. UNIVERSITY OF CALIFORNIA AT BERKELEY
WORKING PAPER NO. 695
REVENUE INSTABILITY INDUCED BY CONSERVATION RATE STRUCTURES: AN EMPIRICAL
INVESTIGATION OF COPING STRATEGIES
by
Thomas W. Chesnutt, Anil Bamezai, and W. Michael Hanemann
California Agricultural Experiment Station Giannini Foundation of Agricultural Ecouoinics

REVENUE INSTABILITY INDUCED BY CONSERVATION RATE STRUCTURES: AN EMPIRICAL
INVESTIGATION OF COPING STRATGEGIES
Thomas W. Chesnuttt, Anil 6amezait, W. Michael HanemannL
SUMMARY
Water suppliers have been adopting new rate structures to promote conservation. The shift away from rates based on historical average cost toward rates based on marginal cost has been motivated by the desire to send consumers the 'righf price signal about the need to conserve drinking water. The shift toward conservation a te structures, though perhaps providing better Incentives to use scarce water resources wisely, has predictable effects-it changes who pays what and it increases the variability of future revenue streams to the water agency. Though the definition of the "correct" rate etructure can rightfully vary in different communities-depending on the marginal cost of new supplies or avoided demand and on the community's understanding of equity-the managerial strategies necessary to cope with the uncertainty brought about by conservation rate structures are -4. Revenue instability creates direct costs for water suppliers in the form of increased costs for borrowing, to say nothing of the indirect but very real costs of more complicated planning to provide for a reliable supply of water in the future. This study empirically examines the experience of water agencies that have adopted conservation rate structures and proposes ways for using quantitative tools to: 1) measure and cope with the added uncertainty; and 2) make explicit the magnitude of tradeoffs between revenue stability, equlty, and the provision of incentives for efficient use of water resources.
'A & N Technical Services, Inc., 1460 Fourth Street, Suite 307, Santa Monica CA 90401, (31 0) 458-7266. '~e~artment of Agricultural and Resource Economics, University of California, Berkeley CA 94720, ~ 5 1 ~ ) 642-2670.

I. INTRODUCTION
Because of concerns over possible water supply shortages, there is a growing interest among water utilities in many pam of the country in the use of novel rate structures to promote conservation and bring about more efficient patterns of water use. A sign of this interest is A W s publication of a manual on Alternative Rates (M34). The shift away from traditional rate structures based on embedded or historical average cost is motivated by the desire to send users the "righti' price signal about the scarcity value of water. While the goals of providing correct price signals and giving customers strong incentives to use scarce water resources efficiently are laudable, accomplishing them is by no means a simple task. For example, defining what is the "correct" price signal in any given case ih; not easy; the appropriate definition can righifully vary in different communitiw, depending on the nature of the marginal source of supply and on whether shortages are met through additional supply or avoided demand. Moreover, while promoting the efficient use of water is an important objective for water utility managers, it is not their only objective.This balancing of alternative objectives is the focus of our study, We are interested, in particular, in the tensions that can arise between the new conservation-oriented rate structures and the twin objectives of revenue stabiiity and equity among water utility customers.
Almost all conservation rats structures increase the variability associated with water utility revenues in the short-run. Since a large part of a water utility's costs are fixed in the short run, the safest way to ensure revenue stability is to raise revenues entirely through a fixed monthly service charge and to dispense with any commodity charge, This rate structure totally insulates revenues from fluctuations in the volume of water delivered; but it is likely to be extremely unattractive from the perspective of efficiency because it provides no incentive to use water sparingly and it takes no account of the costs of system expansion that very in the long run wlity is inherent in any rate structures which has commodity charges. Indeed, the more complex the rate structure, the greater the care required to manage this Instability, This is illustrated in Figure 1, which shows monthly water use in the Los Angeles Department of Water & Power's service area by single-family residential customers and precipitation. In the face of this pattern of demand, a rate structuresince July, 1885 During this period, water use by these customers has fluctuated by a factor of about 100 percent from the lowest to the highest month, driven primarily by the seasonal variation in temperature with a single, uniform-rate commodity charge will generate
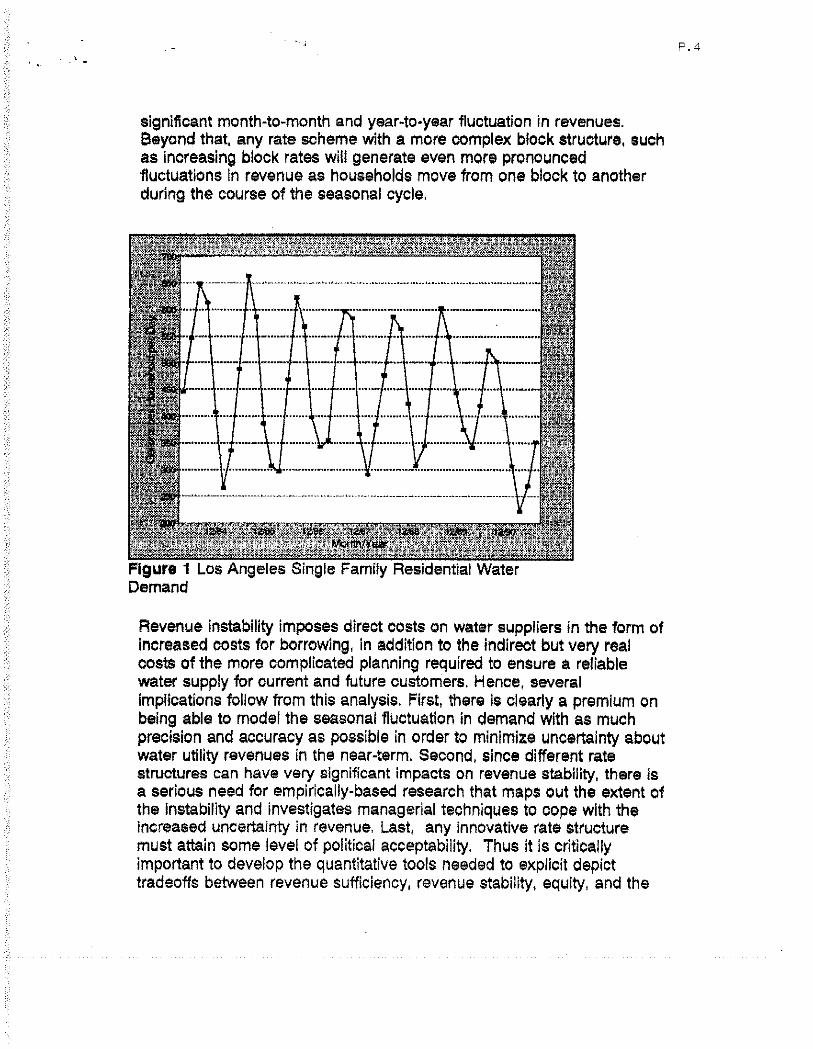
significant month-to-month and year-to-year fluctuation in revenues. Beyond that, any rate scheme with a more complex block structure, such as increasing block rates will generate even more proncunced fluctuations in revenue as households move from one block to another during the course of the seasonal cycle,
Revenue instability imposes direct costs on water suppliers in the form of increased costs for borrowing, in addition to the indirect but very real costs of the more complicated planning required to ensure a reliable water supply for current and future customers. Hence, several implications follow from this analysis, First, there is clearly a premium on being able to model the seasonal fluctuation in demand with as much pracision and accuracy as possible in order to minimize uncertainty about water utility revenues in the near-term. Second, since different rate structures can have very significant impacts on revenue stability, there is a serious need for empirically-based research that maps out the extent of the instability and investigates managerial techniques to cope with the increased uncertainty in revenue, Last, any innovative rate structure must attain some level of political acceptability. Thus it is critically important to develop the quantitative tools needed to explicit depict tradeoffs between revenue sufficiency, revenue stability, equity, and the

provision of incentives for efficient resource use.
Rate Desian and EauiR In addition to revenue volatility, there is the issue of equity- how
does any given rate structure affect the allocation among different customer groups of the burden of raising revenues sufficient to cover water utility costs? To the extent that water use varies among different customers, any rate structure invalving commodity Charges has the potential to impose unequal expenditure burdens on customer groups that the water utility managers had intended to treat equally-or conversely, to impose the same burden on groups the managers had intended to treat differently-unless this is anticipated ahead of time and factored into the design of the, rate structure. Since heterogeneity among patterns of water use is an ubiquitous fact of life among water utility customers, the equity implications must be considered seriously in desianinn any complex rate structure. This is illustrated in Fiaure 2. which s&withe s&e distribution of daily water use among &~gle-family
the residential accounts used an average of more than 1500 gallons per

day (five single-family residential accounts used an average of over 22,000 gallons per day), Ten percent of the accounts used an average of more than 700 gallons per day, while about 20 percent of the accounts used an average of less than 200 gallons per day. Hence, just where the blocks are placed in the design of any block-rate structure can matter greatly from both an equity and efficiency point of view.
With regard to equity, the significance of the size distribution can be thought of in terms of the variance in water use relative to the mean (i.e,, the coefficient of variation). Consider two communities, both with the same mean household use, but with different coefficients of variation: one community has a much larger variance in household use across residential customers than the other. If bath communities were to adopt the same rate structure with, say, some form of increasing block rates, the transfers of revenue burden from one group of customers (those with below-avera$e water use) to another (those with above-average water use) would be far more pronounced in the community with the larger coefficient of variation. Hence, the size distribution of use matters greatly with complex rate structures. It also has obvious implications for revenue stability-of these two communities, the one with the larger variance might expect to raise more revenue with the same rate structure than the one with the smaller variance. These considerations of the size distribution of water use have not been raised in most of the existing literature on water rate design-probably because of the absence of the micro-data required for their analysis-but they have obvious import and deserve more serious consideration,
~ a & & Q g g i a n ! This study proposes to examine empirically the experience of
water utilities that have adopted conservation rate structures with regard to the issues of revenue stability and customer equity, We will examine what their experience was and what management strategies they adopted to cope with the added complexity and uncertainty, Building on this analysis, we will model the seasonal patterns and size distribution of water use for the different customer classes within their service area and then attempt to simulate the impacts of alternative rate structures, in terms of revenue stability and equity as well as effectiveness in promoting conservation. By combining the analysis of what actually happened in these water agencies with the simulation of what might have happened had alternative structures been selected, we expect to generate important insights into the pr~noiples that should guide the design of conservation rates. We recognize that the development of a rate structure involves trade-offs and questions of policy that will differ

4 across water agencies. Our aim is to develop a conceptual framework for using quantitative tools which water utilities can employ in order to make these trade-offs for themselves, in pursuit of the objectives they define.
It. AREAS OF STUDY 2
Case 1: The Citv of Phoenix: The City of Phoenix constitutes a good case for several reasons. The Water and Wastewater Department of the City of Phoenix has been actively involved in using rate structures as a conservation tool for the last decade. This has produced a very Interesting history of experience with several different rate structures. Second, the Water and Wastewater Department has maintained a tracking sample of individual household water use and household characteristics. This existing data base forms a good basis for developing a robust model of individual household water demand. Last, the understanding of what constitutes the "marginal wst" of new or avoidwl water has changed rapidly in the last decade. We fully expect other agencies to experience similar shifts in their understanding of what constitutes conservation rate structures in the future. We discuss the estimation of household water demand models and simulation techniques in the next section.
Case 2: The Citv of Los Anaeles: The City of LOS Angeles constitutes the second case. Having recantly undergone a year-long study by a mayor appointed citizens' Blue Ribbon Committee, the Los Angeles Department of Water and Power is considering adoption of a two-tiered ~ncreasing block rate struoture with adjustments to the blooks in times of severe water shortages. This rate structure replaces a penalty based rate smcture adopted in March, 1991. Prior to that time, a seasonal rate structure had been used The Los Angeles Department of Water and Power also maintains a better than average database of historical customer billings. This database was used to develop a set of individual household water demand models that were used in the evaluation of their ULF toilet rebate program, We discuss the estimation of household water demand modeis and simulation techniques in the next section.
I l l . TECHNICAL APPROACH
y&l- A Monte Carlo simulation uses specific assumptions about the
stochastic properties of a set of variables in order to develop an
empirical picture of the stochastic properties of another set'. It does so by repeatedly drawing Vandom"samples trom the assumed distributions. In our case, we must first explicitly state distributions for the struotural forces that explain household demand, These are taken directly from the household demand model. Second, we must derive a model to generate distributions of potential climate, This requires specifying a model of climate and estimating its parameters from historical data, Given these distributions, a random draw is made for future values of climate (from the climate generator) and other predictors of water use important in the model of demand, This draw generates one prediction of median water use over the course of one year. To this is attached an smpirioal estimate of the distribution of household water use. This realization of future water use is then fed through a given rate structure to yield the estimated revwue realization. The process is repeated many times. By recording each prediction, one ends up with an empirical distribution of revenue that reflects the combined effect of the different sources of uncertainty. In the section that follows, we describe each component-the climate generator, the water demand model, and the empirical estimate of the distribution of water use.
Following research performed at A & N Technical Services on estimating models to simulate climate, we will specify and estimate models of the random properties of rainfall and temperature to use as climate generators in the Monte Carla simulation. The report Water Forecast Uncertaintv: Simulatina Monthlv Ciimate Measures, (May 1990) specifies and estimates autocorrelated Tobit models of monthly rainfall and temperature. Another report, A Model-Based Jm~utation b r
(July 1991) documents the estimation of a two-part model of daily climate measures,
Household Water Demand Models This section describes the form of the household water demand
models. We have developed and estimated household water demand models using billing system micro-data in our research on water demand
'Our early work on the use of Monte Carlo simulation in .the context of water demand models is set forth in Chesnun, T.W. and C.N. McSpadden, B - m a n d in Southern California, A report for the Metropolitan Water District of Southern California, December 1989.
forecasting and water conservation" Most recently we developed a set of econometric demand models representing the water use, of more than 23,000 households in Los Angeles and Santa Monica to evaluate the impact of the Ultra Low Flush toilet rebate programs in these, cities3, This research served as the basis for the California Urban Water Conservation Council's recommendation to the State Board of Water Resources concerning achievable conservation h m ULF toilets (WRINT CUWCC N0.2).
These models express individual household water demand as functions of season; changes in climate; socioeconomic characteristics of the househoid; physical characteristics of the property; water-using behavior patterns; the full price of water; and installation of water-saving conservation devices. The functional relationship among the above factors is estimated from historical household-specific water use data. By explicitly including measures of season, climate, and different househoid characteristics, an empirical model of household water demand yields an estimate of the structural forces that drive water demand, This section describes the structure of the residential water demand models.
First, we allow the nature of the available water use data from billing system records to dictate the structure of our models, not the reverse. Although water meters are read on a predetermined cycle, the cycles do not represent the same calendar period for each household. Researchers in the past have avoided this problem by changing the structure of the data-either by aggregating water use to an annual level or by prorating water use data to a monthly level. Both techniques attenuate the "peaks" and "valleys"normally displayed by water use and
W e report titled Statistical Analysis of Water Demands Durina the Current Drouaht, (January 198Q) gives exposition of the derivation of the form of an aggregate water demand model use for water demand forecasting. Household water demand models based on billing system micro-data were used evaluating water conservation programs in &&&Based Evaluation of - ~ t g r Water Conservation
(January 1991) and A Model-Based Evaluation of the lrvine m u t e r District Residential Retrofit and Survev Conservation Proarams, (April 1992) .
*See -0~s-Time Error Components Models of Residential Water Demand (June 1992) and aa0-a &w-s (June 1982.)

thus wipe out important information that can be used in subsequent estimation of water demand. Destroying variability in water use, for example, will necessarily underestimate the effect of climate on water use. To avoid this problem, We specify a mathematical structure for water demand that is a continuous function of time. This functional form permits a more accurate depiction of how climate affects demand and, thus, how water demand and conservation vaty through the year.
By working with daily climate data we can construct an appropriate bimonthly measure of climate that corresponds to a household's water use in the same bimonthly period given by the meter read. Geographic climatic differences can be introduced bv workina with different weather stations for different climatic zones, We are thereby able to estimate how climate affects true water use (measured at the meter) in a very detailed fashion. The water demand models can capture separate effects for rainfall and temperature and allows for these contemporaneous effects to vary through the year (temperature affects water demand differently in the winter than in the summer). The water demand models can detect lagged effects of climate; rainfall two months ago may affect water demand today. As a result, the specified climatic effect upon water demand is more complete and accurate than what could otherwise be achieved, The estimated climate effect from the water demand model can be used to remove the effect of weather-{.en, to "normalize" the measure of water use. The remaining measures of water use can be used to characterize the distribution of water use. This distribution can be parameterized for use in the simulation or can be directly implemented from the empirical histogram.
Second, our estimation methodology differs from previous efforts by explicitly accounting for the effects of unmeasured or mismeasured household characteristics in a random effects context. This feature substantially increases the accuracy of our forecasts and improves the resolution of our statistical inference. All water demand models are based on self-reported household information that is never entirely free of errors. Rather than explicitly dealing with this issue, earlier studies tended to sweep it under the rug. However, the impact of mismeasured and unmeasursd household characteristics on the estimation of water demand models is not trivial and must be formally accounted for in an empirical model.
One issue that appears to be obligatory in discussions of estimating water demand models concerns how price should enter into a model of water demand. Should average price or marginal price be

used? If the historical period used for estimation contains block rate structures (nonlinear pricing) what is the appropriate specification? The theoretical effort expended in the literature on water demand appears to be quite out of proportion to quality and quantity of data needed to empiricaliy establish the dominance of one price specification over
'We are sympathetic to the assertion that, given a non-zero cost of information, customers may use an approximation of price (e.g., average price) in lieu of the true marginal cost of the next unit of water necessitated by microeconomic theory of rational consumption. Unfortunately, throwing a measure of average price into a water demand equation means that quantity enters both sides of the equation, creating the technical condition of endogeneity, that is ofLen ignored come estimation time. ignoring the endogeneity is, of course, a wonderful way to increase the magnitude of an estimated price effect-if quantity goes up, average price goes down, and voila, a significant negative association will be found.
?his is another case of the chicken and egg endogeneity problem. The quantity of water demanded is a function of the water rate which is a function of water demanded. Michael Hanemann has written on a theoretical framework within which the problem of modeling nonlinear pricing can be viewed-consumers make a discrete choice of which block to end up in and then decide exactly how much water to consume within that block. See Discrete/Continuous Models of Consumer Demand, Econometrics, vol. 52, no. 3, 1984, Even within this context, anticipatory effects are possible from nonobserved rate blocks.
Lest the incorrect impression be left, we do believe that the endogeneity problem is real. The technical problem it poses is more complicated than many believe. The use of a bill differencelrate premium term (Nordin, 1976) is not a "solution" to the problem as any measure of a rate premium is a function of quantity demanded and, as such exhibits the exact same endogeneity problem found in direct use of average price. The solution generally put fonvard for endogeneity, simultaneous equation methods, require considerable judgment from the individual researcher as to what constitutes a good instrument for the endogenous variable, While there are objective criteria for what constitutes a good instrument (one variable or a linear combination)-the instrument must be uncorrelated with the demand equation error and highly correlated with the endogenous variable-these issues have not received sufficient attention in much of the literature. As with many econometric "corrections," the cure can sometimes be worse than the disease,

anothe?. We fundamentally disagree with the premise underlying much of the ongoing debate-there is one price elasticity and the only issue involved is the exact form taken on by that one parameter7. Instead, a more accurate picture would reveal that total water demand comes from a composite of many individual water demands for a composite of different end uses. Some uses (e.g. outdoor water use) may be more price sensitive than others (e.g. toilet Rushing). Some individuals way be more price sensitive than others.
This notion that there may be distinct market segments for different end uses andlor different user groups, with different price elasticities of demand, has received very little attention in the literature on the demand for water, although it is currently the focus of a considerable research effort in the literature on the demand for electricity, telephone service, and certain other commodities where product unbundling and exploitation of market segmentation are of direct commercial value, We believe that this is of no less importance for water. In particular, it could lead to more effective rate design, through the targeting of price incentives on particular end uses or classes of users whose demand is especially price sensitive. Hence, a fuller understanding of the heterogeneity in the price-responsiveness of demand can improve the performance of the conservation rate
"Ne believe that it is an empirical fact that the response of water use to changes in price is extremely inelastic in the short run. In the long- run, the response to price may be merely very inelastic. Thus, researchers attempting to measure the response of water demand to price must breath a sigh of humility and admit that they are fishing for a very small effect. This is difficult and requires a considerable amount of high qualrty data, Of course, it is a boon to the rationale for the proposed study that a direct implication of demand inelasticity is that increases in price result in increased revenue. The fact of demand inelasticity can help explain why rate design is such a risky and difficult undertaking.
7 The estimation problem can be transformed into a simulation problem by incorporating different a prior; estimates of price elasticity to observe the effect upon revenue sufficiency and volatility. In our simulations, we will include runs that allow the price response to vary over the internal of likely values implied by our empirical estimates. These simulation runs have the additronai value of depicting the implications of differing beliefs about the magnitude of the price elasticity of water demand with respect to price.

structures, which in turn may make it easier to minimize the revenue volatility and equity impacts that could be associated with them.
We plan to pursue this "unbundling" of the price elasticity of demand through two distinct, but complementary, lines of research. One is the investigation of flexible functional forms andlor the use of semiparametric or nonparametric regression techniques for the estimation of demand functions. The aim here is to Dursue wavs of specifying the nonstochastic component of the demand function that permit the elasticity of demand to vary with the level of water consumption or other variables, including climatic conditions, in a more flexible manner than current models allow. The other line of research is modeling the heterogeneity across individual members of a specific user group as represented by the stochastic component of the demand function (i.e., the random error term in the regression equation)', The goal here is to explore a fuller range of statistical models for the stochastic component in order to do a better job of capturing heterogeneify that is observed under real-world conditions, Moreover, we intend to explore the factors that affect the degree of heterogeneity--i,e., the variance or skewness terms-o that we can investigate whether and how this varies in response to either demographic variables or water policy variables (prices, conservation programs, etc.) which water managers can mntrol. The main point is that these empirical techniques are a tool to arrive at a richer specification of unbundled demand-how rates effect water use and, ultimately, revenue.
IV. CONCLUSION
This paper presents the approach of an AWWARF-funded study on the revenue instability induced by conservation rate structures, The study examines the experience of two cities that have adopted consezvation rate structures--the cities of Los Angeles, California and Phoenix, Arizona. Predicting revenue under a conservation rate structure
EFollowing recent work in the area of nonparametric demand estimation, our exploratory analysis will relate estimated residuals from a demand equation without price to price orthogonalized on the remaining demand variables, If this quantity can be ordered by discrete categories (customer class) or continuous functions (income), then a nonparametric representations can be adduced. These then serve as input into the parametric specification of a variance functron in a random coefficients framework.

requires more than a model of average water demand; it requires a model of the distribution of water demand. Water demand models are estimated using micro-data from the above two cities. Based on the estimated empirical relationships among forces driving the distribution of water use, Monte Gar10 simulations are run to quantify uncertainty around the future revenue stream to the water agency under a variety of scenarios.
Ignoring uncertainty does not make it go away. To the contrary, ignoring uncertainty sets you up to be blindsided. If the amount of uncertainty can be quantified and turned into a measure of risk, then a water manager will have some basis for knowing how to best cope with a more uncertain world. The oral presentation will provide preliminary results from this AWWARF-funded research project.