Embed Size (px)
Citation preview
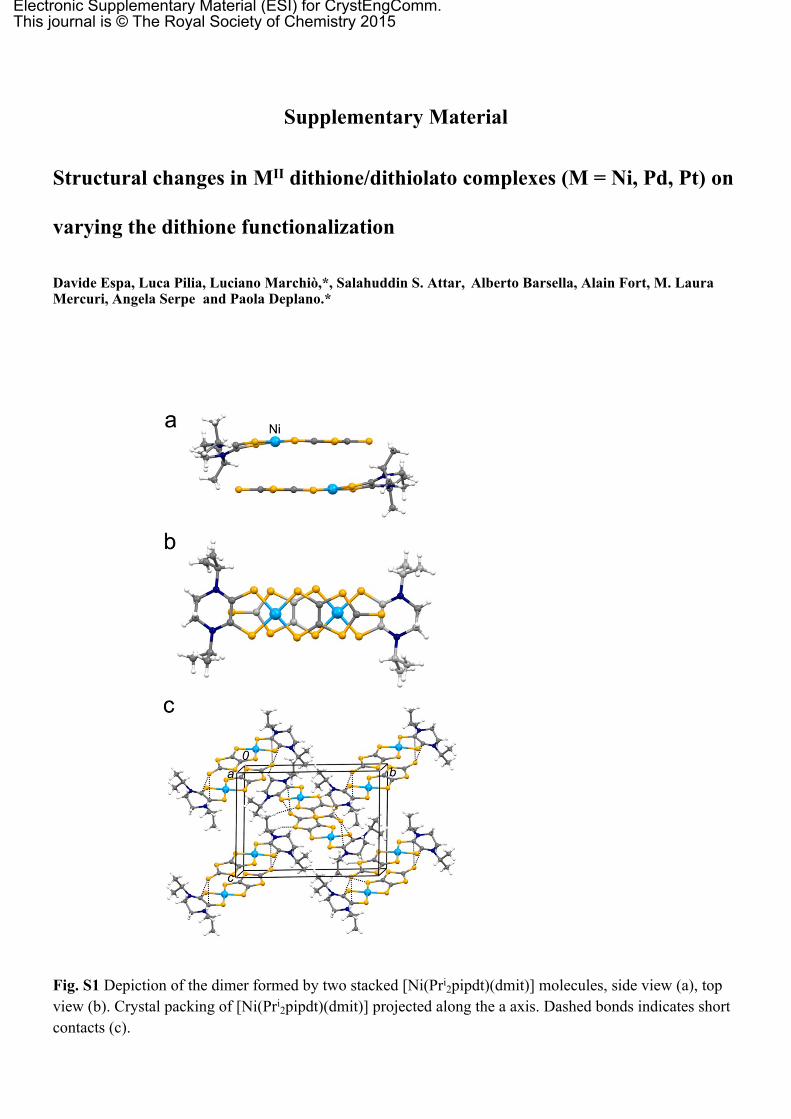
Supplementary Material
Structural changes in MII dithione/dithiolato complexes (M = Ni, Pd, Pt) on
varying the dithione functionalization
Davide Espa, Luca Pilia, Luciano Marchiò,*, Salahuddin S. Attar, Alberto Barsella, Alain Fort, M. Laura Mercuri, Angela Serpe and Paola Deplano.*
Fig. S1 Depiction of the dimer formed by two stacked [Ni(Pri2pipdt)(dmit)] molecules, side view (a), top
view (b). Crystal packing of [Ni(Pri2pipdt)(dmit)] projected along the a axis. Dashed bonds indicates short
contacts (c).
Electronic Supplementary Material (ESI) for CrystEngComm.This journal is © The Royal Society of Chemistry 2015
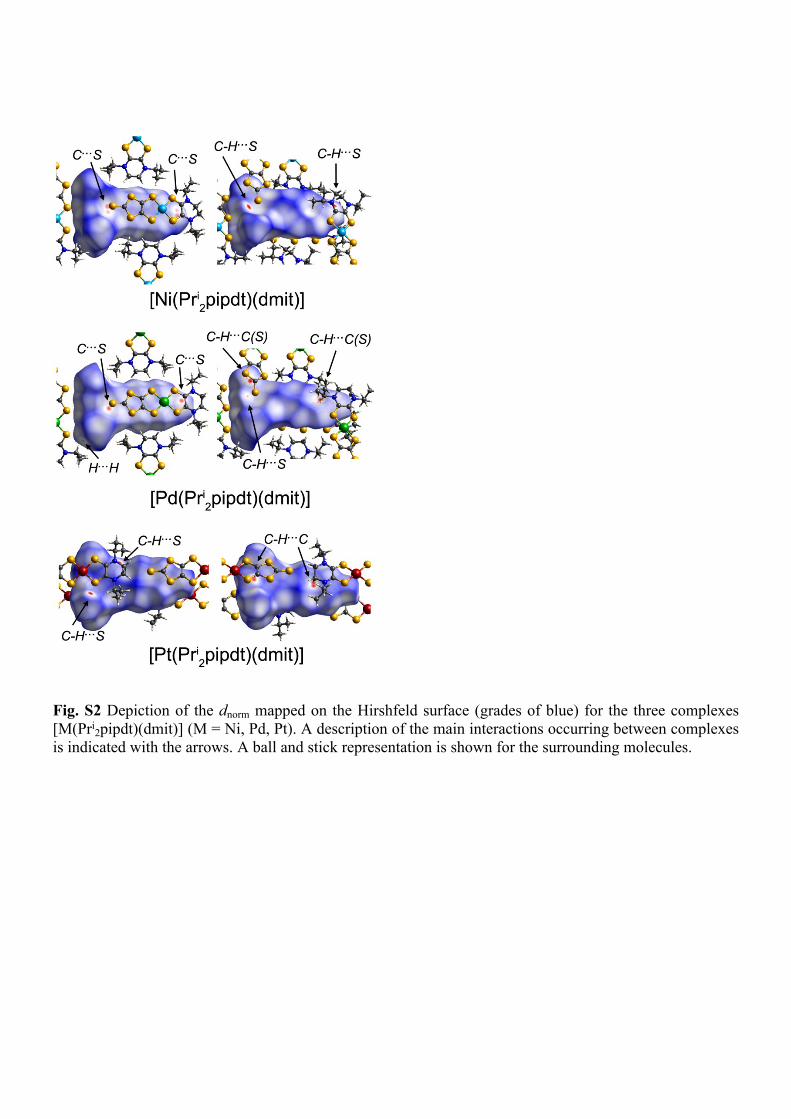
Fig. S2 Depiction of the dnorm mapped on the Hirshfeld surface (grades of blue) for the three complexes [M(Pri
2pipdt)(dmit)] (M = Ni, Pd, Pt). A description of the main interactions occurring between complexes is indicated with the arrows. A ball and stick representation is shown for the surrounding molecules.
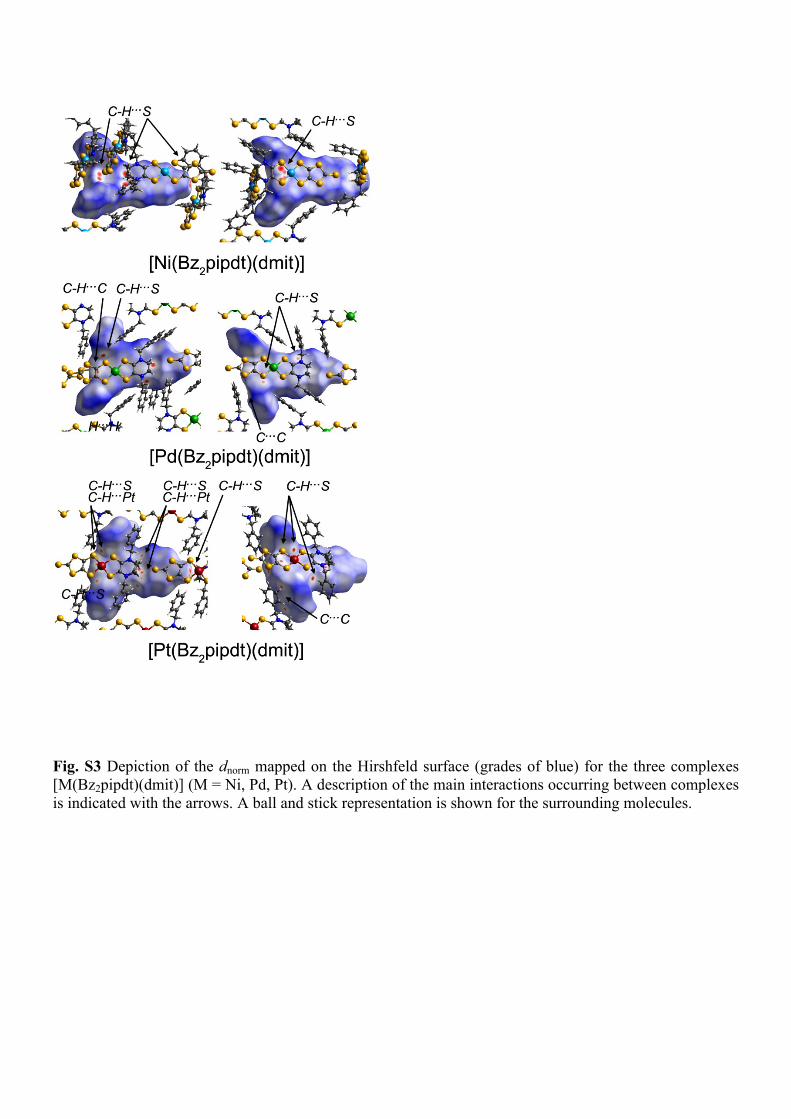
Fig. S3 Depiction of the dnorm mapped on the Hirshfeld surface (grades of blue) for the three complexes [M(Bz2pipdt)(dmit)] (M = Ni, Pd, Pt). A description of the main interactions occurring between complexes is indicated with the arrows. A ball and stick representation is shown for the surrounding molecules.
0
5000
1 104
1,5 104
400 500 600 700 800 900 1000 1100
NiPdPt
/ M
-1 c
m-1
103
Wavelength (nm)
400 500 600 700 800 900 1000 1100
DMSONitrobenzeneDMF
A.U
.
Wavelength (nm)
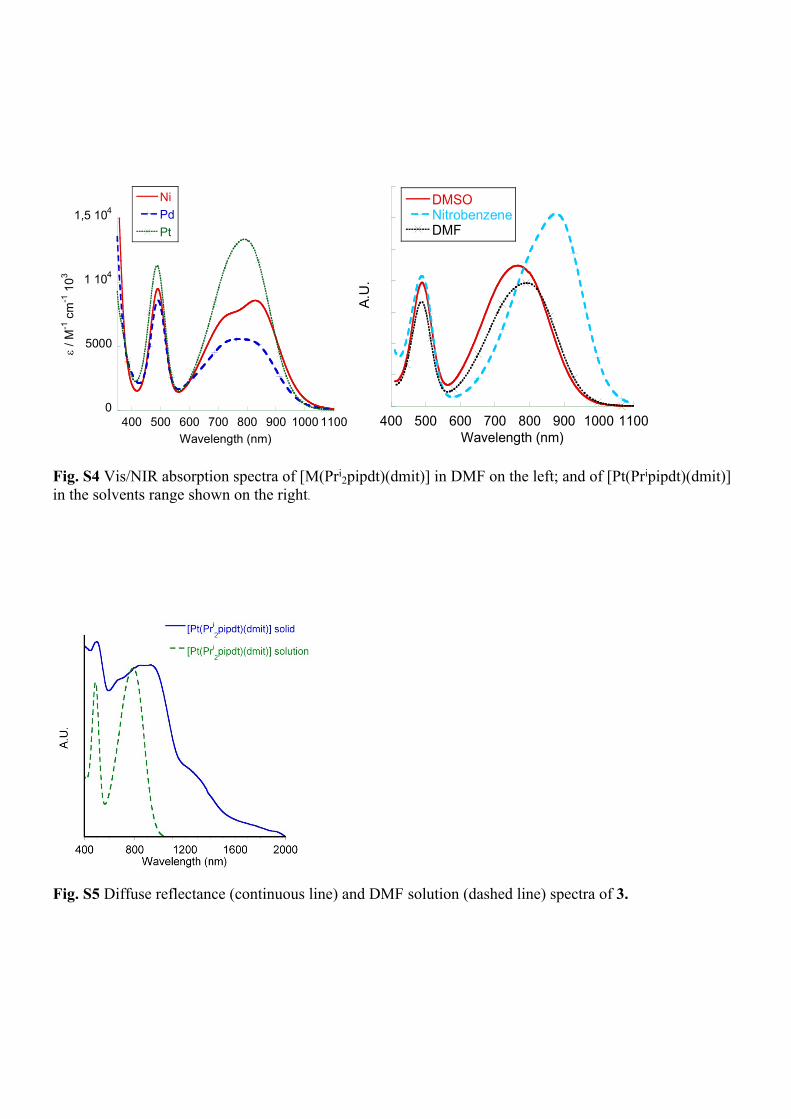
Fig. S4 Vis/NIR absorption spectra of [M(Pri2pipdt)(dmit)] in DMF on the left; and of [Pt(Pripipdt)(dmit)]
in the solvents range shown on the right.
Fig. S5 Diffuse reflectance (continuous line) and DMF solution (dashed line) spectra of 3.
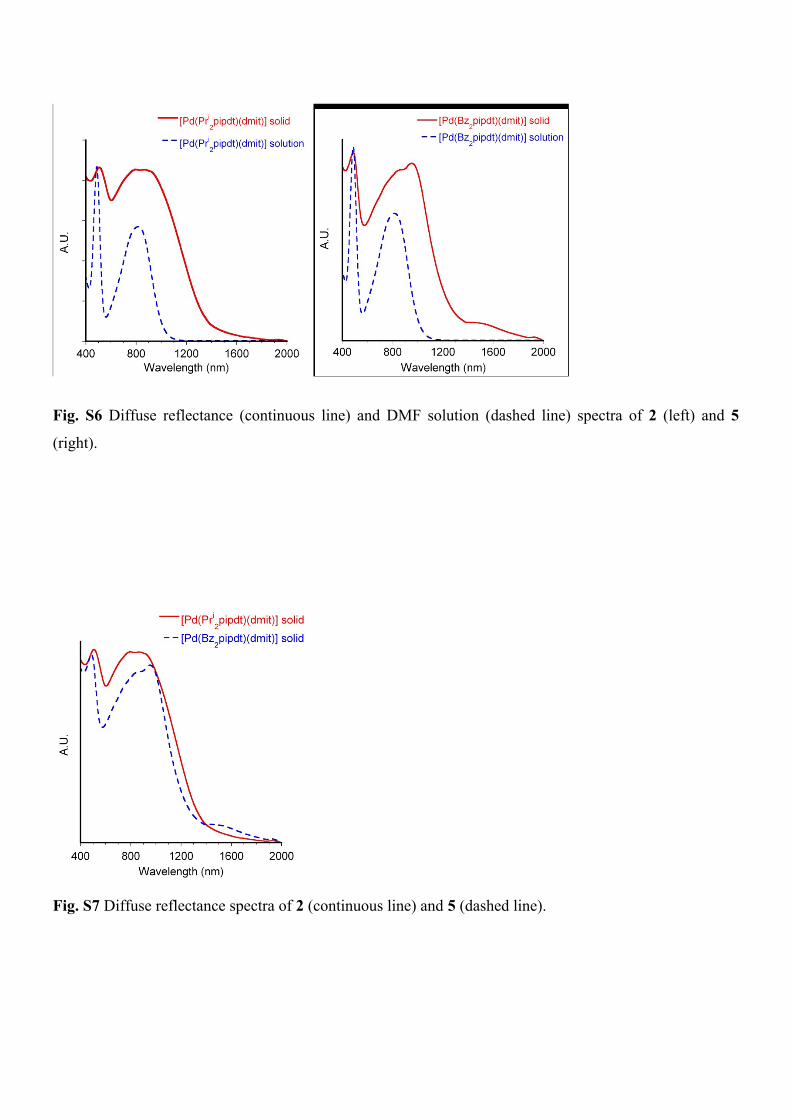
Fig. S6 Diffuse reflectance (continuous line) and DMF solution (dashed line) spectra of 2 (left) and 5
(right).
Fig. S7 Diffuse reflectance spectra of 2 (continuous line) and 5 (dashed line).
-2 10-6
-1,5 10-6
-1 10-6
-5 10-7
0
5 10-7
1 10-6
-1,4 -1,2 -1 -0,8 -0,6 -0,4 -0,2 0
0.02 V/s0.04 V/s0.06 V/s0.10 V/s0.08 V/s
i / A
E / V
-2 10-6
0
2 10-6
4 10-6
6 10-6
8 10-6
0,6 0,8 1 1,2 1,4
0.02 V/s0.04 V/s0.06 V/s0.08 V/s0.10 V/S
i / A
E / A
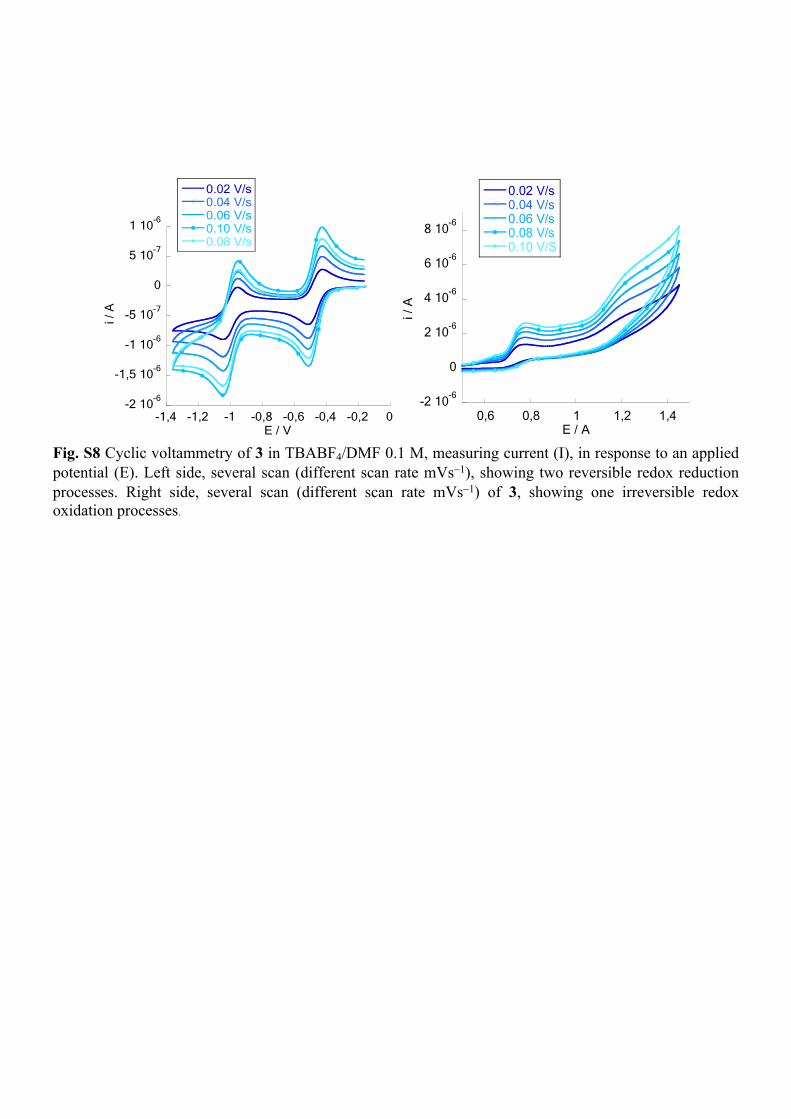
Fig. S8 Cyclic voltammetry of 3 in TBABF4/DMF 0.1 M, measuring current (I), in response to an applied potential (E). Left side, several scan (different scan rate mVs1), showing two reversible redox reduction processes. Right side, several scan (different scan rate mVs1) of 3, showing one irreversible redox oxidation processes.

![Time-varying jump tails - Duke Universitypublic.econ.duke.edu/~boller/Published_Papers/joe_14.pdf · varying± ± ± ± ± − (+ −]) ± (+ − ±, =,..., −] = −, −] = −,),](https://img.pdfslide.us/doc/110x75/5f9eb1e298e27c43de4b3c12/time-varying-jump-tails-duke-bollerpublishedpapersjoe14pdf-varying-.jpg)