Embed Size (px)
Citation preview
Vol.:(0123456789)
SN Applied Sciences (2019) 1:412 | https://doi.org/10.1007/s42452-019-0447-y
Research Article
Variations in magnetic properties caused by size dispersion and particle aggregation on CoFe2O4
Fernando Arteaga‑Cardona1 · Nery Gabriela Martha‑Aguilar1 · José Octavio Estevez2 · Umapada Pal1 · Miguel Ángel Méndez‑Rojas3 · Ulises Salazar‑Kuri1
© Springer Nature Switzerland AG 2019
AbstractSize dispersion and particle aggregation are the key parameters that affect the magnetic properties at nanoscale due to interparticle interactions. However, few efforts have been devoted so far to understand how these param-eters affect the magnetic properties of nanoparticles. Here, we experimentally demonstrate how the magnetic properties such as magnetic saturation (Ms), coercivity (Hc), Curie temperature (Tc), and blocking temperature (TB) of cobalt ferrite (CoFe2O4) nanoparticles having the same composition and near-average size are affected by size dispersion (σ) and aggregation. Cobalt ferrite nanoparticles of similar average sizes but different size dispersions and aggregations were fabricated through different synthesis routes. The results clearly demonstrate that just by reducing the size dispersion and aggregation, it is possible to modify the magnetic properties, e.g., achieving a superparamagnetic state of cobalt ferrite even under applied magnetic field as low as 100 Oe as indicated by ZFC measurements. The Stoner–Wohlfarth model with thermal agitation was used to simulate the blocking tempera-ture of the different size dispersion and aggregation nanoparticles confirming that low size dispersion and non-aggregated particles have great influence to achieve the superparamagnetic state, especially for high coercivity materials such as cobalt ferrite.
Keywords Superparamagnetism · Curie temperature · Saturation magnetization · Blocking temperature
1 Introduction
The control of the materials properties at the nanoscale is an enormous challenge for the materials scientists [1, 13, 40], as the specific application of nanomaterials needs their highly controlled fabrication [41]. Chemical synthetic routes have attracted much attention for the synthesis of nanoparticles, as they are cheaper alternatives than other physical synthetic routes [2, 27, 35, 39]. However, most of the time the material presents poor crystallinity, high defect content, a considerable size dispersion (σ), and particle aggregation. All these factors are important to
consider as they affect strongly their magnetic behavior. One example can be that the interparticle interactions in agglomerated or assembled magnetic nanoparticles strongly affect their magnetic and other physical proper-ties, mainly by increasing the overall effective anisotropy (Keff) [22].
Superparamagnetism is due to the small size of the nanoparticles; each one acts as one individual crystalline magnetic domain with a net spin. The net magnetization of the individual nanoparticle is a consequence of the addi-tion of the magnetic moments of hundreds of atoms, and thus, the result is thousands of times greater than a normal
Received: 5 February 2019 / Accepted: 2 April 2019 / Published online: 5 April 2019
* Fernando Arteaga-Cardona, [email protected]; * Ulises Salazar-Kuri, [email protected] | 1Instituto de Física, Benemérita Universidad Autónoma de Puebla, Apdo. Postal J-48, 72570 Puebla, Pue, Mexico. 2Departamento de Materia Condensada/Instituto de Física UNAM, Circuito de la Investigación Científica Ciudad Universitaria, C.P. 04510 Ciudad de Mexico, Mexico. 3Departamento de Ciencias Químico-Biológicas, Universidad de las Américas Puebla, ExHda. Sta. Catarina Mártir s/n, San Andrés Cholula, Puebla 72810, Mexico.
Vol:.(1234567890)
Research Article SN Applied Sciences (2019) 1:412 | https://doi.org/10.1007/s42452-019-0447-y
paramagnetic material [33]. Depending on its nature, this state cannot be achieved for nanoparticles with sizes above 20 nm [29, 42].
Being in the superparamagnetic state, nanoparticles are able to flip their magnetic spin according to the exter-nal applied magnetic field following the Néel relaxation model (τ = τ0exp(EB/ET), being τ0 the attempt time) over time, as long as the energy barrier (EB = KeffVsin2(θ), V being the volume of the nanoparticles, and θ the angle between the magnetization and the easy axis) is lower than the thermal energy (ET = kBT). As a result, superparamagnetic nanoparticles are excellent candidates for several applica-tions, such as sensors and medical applications [14, 16, 26, 43].
Nevertheless, particle aggregation and size dispersion are recurrent problems for all nanomaterials; however, disaggregation of non-magnetic nanomaterials can be easily achieved, but not for magnetic materials. Aggre-gation can drastically affect the magnetic properties as it changes the effective anisotropy of the sample due to changes in the dipole energy by the extreme contact (Ed ≈ µ0µ
2/4πd3, being µ0 the permeability of free space, and µ the average magnetic moment and d, interparticle distance) [4, 9].
The dispersion and aggregation of magnetic nanoparti-cles generate uncertainty to the measured magnetic proper-ties as there are numerous nanoparticles with different sizes, shapes, and interactions among themselves, resulting in a non-homogeneous EB, which cannot be used as the overall EB for all the samples [10, 36].
One of the most used chemical routes for the synthesis of magnetic nanomaterials is co-precipitation [10, 28]. How-ever, in most of the cases, this route produces nanoparticles with a broad range size dispersion and heavy aggregation [17]. Most papers usually just report a histogram with a standard deviation (σ) to show how much the sample devi-ates from monodispersion, as truly monodisperse samples are rare and considerably difficult to achieve [24]. In addition, the aggregation influence on the magnetic properties meas-ured for the overall material is rarely considered to explain the magnetic results [4, 27, 33].
Here, cobalt ferrite nanoparticles of near-average size, but with different particle aggregation and size disper-sion degrees, were synthesized by using different synthetic routes. Cobalt ferrite was chosen for the present study because it is a popular magnetic material with high anisot-ropy. Due to this anisotropy, small variations in size result in drastic changes in the magnetic properties [23], especially in the blocking temperature (TB), as TB for the cobalt ferrite is rarely seen.
2 Materials and methods
Three different synthetic routes were followed to obtain nanoparticles with distinct aggregations and size dis-persions: co-precipitation of metal nitrates followed by a thermal treatment; co-precipitation of metal chlorides followed by an acid treatment; and thermal decompo-sition of metal acetylacetonates in high-boiling-point organic solvent. These preparation routes were chosen as it has been reported that metal nitrates yield higher size dispersion and aggregation than their corresponding chlo-rides [19], while co-precipitation using metal chlorides is a widely used synthetic method for metal oxide particles and produces materials with both large size dispersion and aggregation; finally, the thermal decomposition of metal acetylacetonates is a well-known route that allows the preparation of small-sized nanoparticle with both low dispersion degree and aggregation.
2.1 Co‑precipitation of nitrates followed by a thermal treatment (CoFe2O4 TT)
Stoichiometric amounts of Co(NO3)2.6H2O (5 mmol) and Fe(NO3)3.9H2O (10 mmol) were dissolved in deionized water and heated up to 70 °C, and then, a 2 M solution of NaOH was slowly added to the metal ion solution. The solution was left stirring for 1 h after NaOH was added. The final measured pH was 14. After this time, the super-natant was decanted and the precipitate was washed sev-eral times with distilled water. The obtained sample was heated at 80 °C for several hours, and then the tempera-ture was increased up to 500 °C for 1 h [36].
2.2 Co‑precipitation of chlorides followed by an acid treatment (CoFe2O4 acid)
Stoichiometric amounts of CoCl2.6H2O (5.0 mmol) and FeCl3.6H2O (10.0 mmol) were dissolved in 5 mL deionized water with 250 µL of HCl (37%) and heated up to 70 °C. Then a second solution of 2 M solution of NaOH was heated to 100 °C. The solution with the metallic cations was rapidly added to the hot NaOH solution. The mix-ture was left stirring for 30 min, and the final PH was 14. After this time, the supernatant was decanted and the obtained precipitate was washed several times with dis-tilled water. Without completely drying, 15 mL of a 2 M solution of HNO3 was added to the black precipitate and left stirring at room temperature for 15 min; after which the acid was decanted. Twenty milliliters of a 1 M solu-tion of Fe(NO3)3.9H2O was then added and left stirring at boiling temperature for 30 min. After this, the sample was
Vol.:(0123456789)
SN Applied Sciences (2019) 1:412 | https://doi.org/10.1007/s42452-019-0447-y Research Article
left cooling at room temperature and the supernatant was decanted [6]. Finally, another 15 mL of a 2 M solu-tion of HNO3 was added to the precipitate and left stirring for 15 min. After the 15 min, the acid was decanted and the black precipitate was washed with acetone and some water was added to form a stable ferrofluid [3].
2.3 Thermal decomposition of metal acetylacetonates (CoFe2O4 TD)
In a round-bottomed flask, 0.2 g (0.55 mmol) of Co(acac)3, 0.396 g (1.1 mmol) of Fe(acac)3, 200 µL of ethyleneglycol, 2 mL of oleic acid, and 0.476 g of CTAB were added to 20 mL of 1-octadecene. The mixture was left under stir-ring at 100 °C for 15 min to get rid of all the possible water in the flask. After 15 min, the mixture was heated at 190 °C for 1 h. The color of the mixture slowly changed from red-dish to deep black. After the reaction time finished, the mixture was left cooling at room temperature. The formed precipitate was collected and washed several times with ethanol. Finally, the collected sample was re-dispersed in isooctane for storage to avoid the aggregation of the nanoparticles [27].
3 Characterization
Size, morphology, and size dispersion of the obtained nanostructures were analyzed by TEM using a Jeol JEM-2010F high-resolution transmission electron microscope (HRTEM). The samples for TEM were prepared by dispers-ing the samples CoFe2O4 TT and CoFe2O4 acid in water, and CoFe2O4 TD sample in hexane, placing one droplet of each over a carbon-coated copper grid, followed by drying at room temperature. The size distribution histograms were obtained by measuring the size of over 300 nanoparticles for each sample and fitting the histogram to a lognormal distribution [20]. EDS of the samples was carried out in an ultra-high-resolution scanning electron microscope MAIA with field emission gun at 15 keV.
Hydrodynamic volume and size dispersion of the samples CoFe2O4 acid and CoFe2O4 TD were obtained by using a Nanotrac Wave II from Microtrac Inc. The sample CoFe2O4 acid was measured by diluting the sample in dis-tilled water (refractive index, 1.33); meanwhile, the sample CoFe2O4 TD was diluted in toluene (refractive index, 1.50). The refraction index used for both CoFe2O4 samples was 2.42. DLS measurement was not performed on CoFe2O4 TT sample, because the nanoparticles in the sample were so aggregated that they precipitate almost immediately from their colloidal dispersion, thus obtaining non-reliable and non-reproducible results.
The identification of the crystals phases of the fabri-cated cobalt ferrite nanostructures was performed by recording their X-ray diffraction patterns in a PANalytical Empyrean diffractometer using copper Kα radiation at 45 kV and 40 mA; the data were collected from 20° to 80° in 2θ. The average crystallite size was determined by using the Scherrer equation [21, 30]:
where α is a shape constant with a typical value of 0.9 for quasi-spherical nanoparticles, λ is the measure wavelength (1.5406 Å), β represents the FWHM of the (311) peak and θ is the half of the angle where the (311) peak appears.
Thermogravimetric analysis was used to determine the organic mass from sample CoFe2O4 TD and the ferro-magnetic Curie temperature for all the samples using a TA instruments SDT 650 simultaneous thermal analyzer under a nitrogen flux of 5 mL/min, from room temperature up to 800 °C. A permanent magnet (B = 50 Oe) was placed on top to reduce the weight of the sample by 2–5%, recording both heating and cooling data [18]. To assure the adsorbed water or other organic components at the surface of the nanoparticles do not contribute to the recorded signals producing errors in the estimated Curie temperature of the samples, the measurements were repeated for the TG and DSC immediately after finishing the first ones, keeping all parameters the same.
Magnetometry measurements were carried out in a vibrating sample magnetometer VSM attached to a Dyna-cool 9 physical properties measurement system (PPMS) from Quantum design. Magnetization hysteresis curves were recorded under an external magnetic field up to 2 T at 10, 100, 300, and 350 K. The zero-field-cooled (ZFC) and field-cooled (FC) magnetization curves were measured from 10 K to 350 K with an external magnetic field of 100 Oe. The blocking temperature for the sample measured at 100 Oe was obtained by the maximum value of the ZFC curve.
4 Results and discussion
4.1 Size, morphology and dispersion
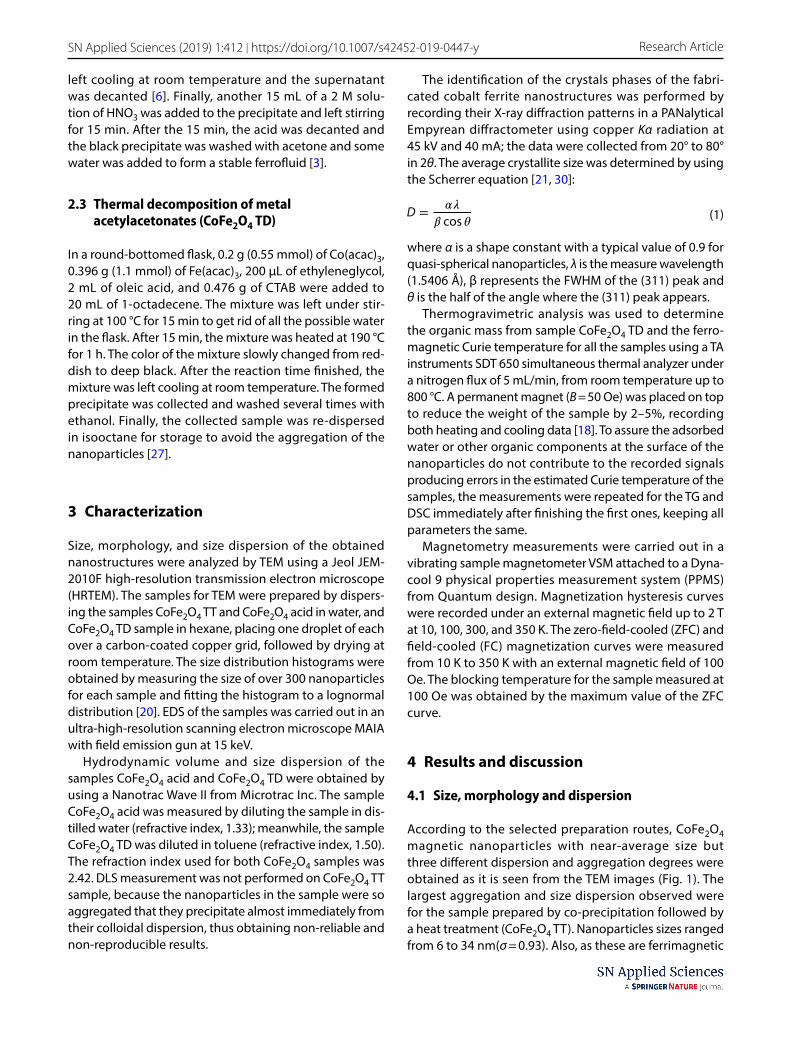
According to the selected preparation routes, CoFe2O4 magnetic nanoparticles with near-average size but three different dispersion and aggregation degrees were obtained as it is seen from the TEM images (Fig. 1). The largest aggregation and size dispersion observed were for the sample prepared by co-precipitation followed by a heat treatment (CoFe2O4 TT). Nanoparticles sizes ranged from 6 to 34 nm(σ = 0.93). Also, as these are ferrimagnetic
(1)D =��
� cos �
Vol:.(1234567890)
Research Article SN Applied Sciences (2019) 1:412 | https://doi.org/10.1007/s42452-019-0447-y
nanoparticles, they are greatly attracted to each other due to the magnetic dipole moment and disaggrega-tion is almost impossible as there is no surface coating or surfactant.
The sample prepared by co-precipitation followed by an acid treatment, CoFe2O4 acid, presents a moderate dis-persion and aggregation (Fig. 1b). The nanoparticles sizes range from 5 to 18 nm (σ = 0.61). As can be noticed, the nanoparticles from this sample are smaller in size than the particles formed in the previous sample (CoFe2O4 TT), because this time there was no heat treatment favor-ing the formation of larger particles; in addition, the acid treatment can dissolve nanoparticles with smaller sizes, favoring a lower dispersion. Also, this treatment gives a superficial charge to the nanoparticles [6]; this superficial charge reduces the agglomeration through Coulombic repulsive forces, improving the stability of the particles in water forming a water stable ferrofluid.
Finally, the third sample synthesized by a thermal decomposition procedure, CoFe2O4 TD, produced nano-particles with the lowest size aggregation and disper-sion (Fig. 1c). These results can be attributed to the use of surfactants (oleic acid and CTAB), controlling the size of the formed nanoparticles and avoiding their aggrega-tion. The organic surfactants that cover the nanoparticles make them stable in nonpolar solvents, such as isooctane
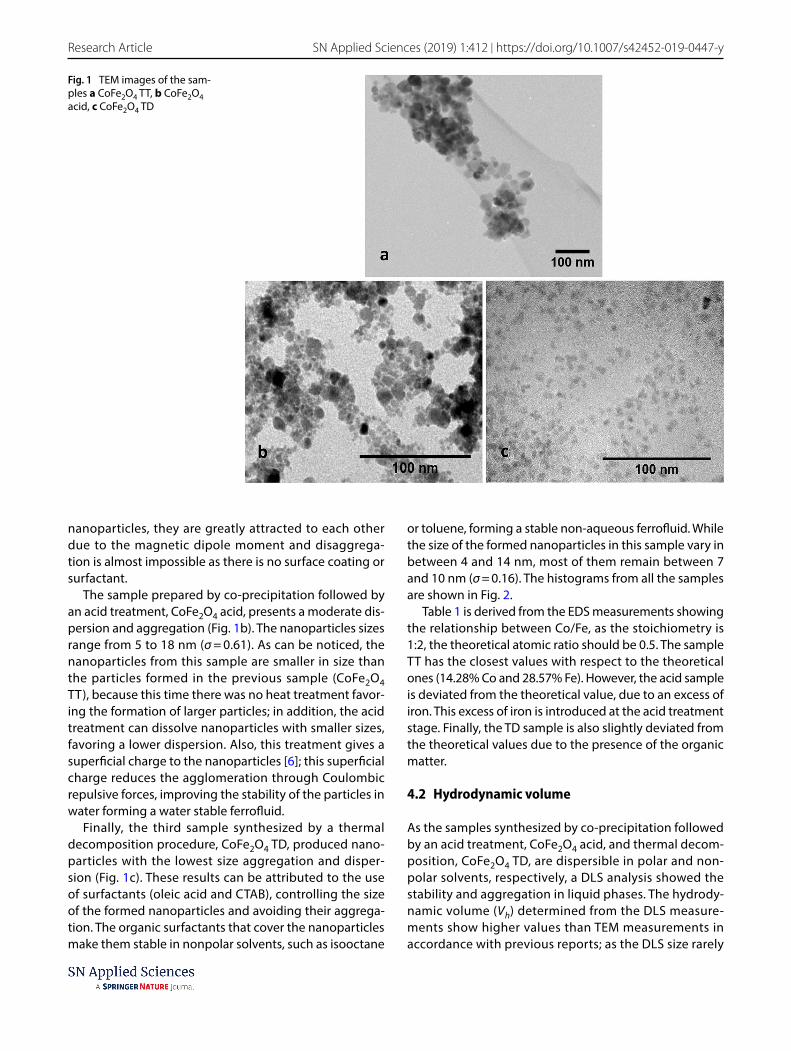
or toluene, forming a stable non-aqueous ferrofluid. While the size of the formed nanoparticles in this sample vary in between 4 and 14 nm, most of them remain between 7 and 10 nm (σ = 0.16). The histograms from all the samples are shown in Fig. 2.
Table 1 is derived from the EDS measurements showing the relationship between Co/Fe, as the stoichiometry is 1:2, the theoretical atomic ratio should be 0.5. The sample TT has the closest values with respect to the theoretical ones (14.28% Co and 28.57% Fe). However, the acid sample is deviated from the theoretical value, due to an excess of iron. This excess of iron is introduced at the acid treatment stage. Finally, the TD sample is also slightly deviated from the theoretical values due to the presence of the organic matter.
4.2 Hydrodynamic volume
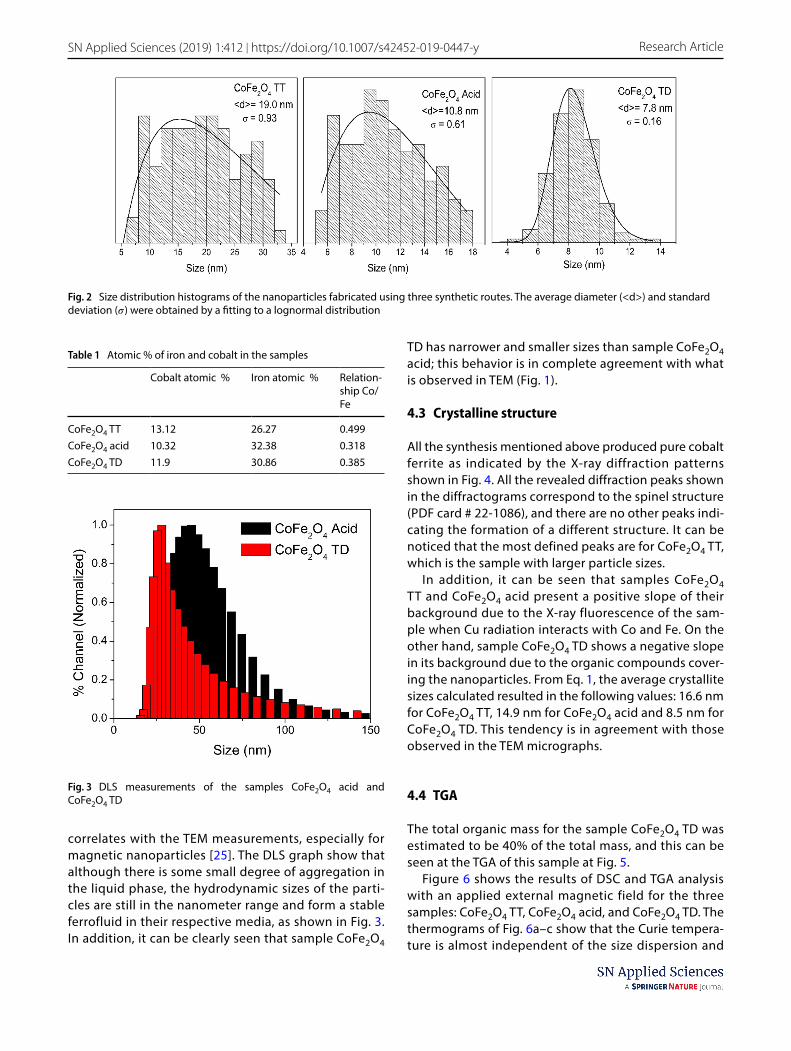
As the samples synthesized by co-precipitation followed by an acid treatment, CoFe2O4 acid, and thermal decom-position, CoFe2O4 TD, are dispersible in polar and non-polar solvents, respectively, a DLS analysis showed the stability and aggregation in liquid phases. The hydrody-namic volume (Vh) determined from the DLS measure-ments show higher values than TEM measurements in accordance with previous reports; as the DLS size rarely
Fig. 1 TEM images of the sam-ples a CoFe2O4 TT, b CoFe2O4 acid, c CoFe2O4 TD
Vol.:(0123456789)
SN Applied Sciences (2019) 1:412 | https://doi.org/10.1007/s42452-019-0447-y Research Article
correlates with the TEM measurements, especially for magnetic nanoparticles [25]. The DLS graph show that although there is some small degree of aggregation in the liquid phase, the hydrodynamic sizes of the parti-cles are still in the nanometer range and form a stable ferrofluid in their respective media, as shown in Fig. 3. In addition, it can be clearly seen that sample CoFe2O4
TD has narrower and smaller sizes than sample CoFe2O4 acid; this behavior is in complete agreement with what is observed in TEM (Fig. 1).
4.3 Crystalline structure
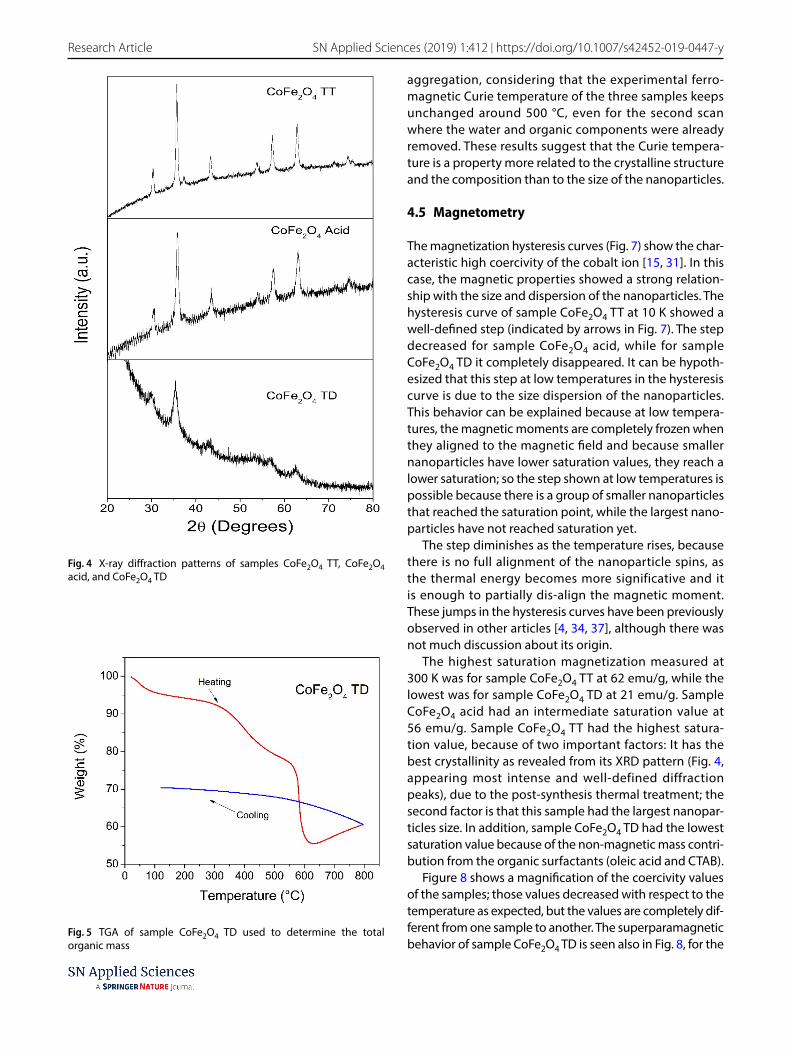
All the synthesis mentioned above produced pure cobalt ferrite as indicated by the X-ray diffraction patterns shown in Fig. 4. All the revealed diffraction peaks shown in the diffractograms correspond to the spinel structure (PDF card # 22-1086), and there are no other peaks indi-cating the formation of a different structure. It can be noticed that the most defined peaks are for CoFe2O4 TT, which is the sample with larger particle sizes.
In addition, it can be seen that samples CoFe2O4 TT and CoFe2O4 acid present a positive slope of their background due to the X-ray fluorescence of the sam-ple when Cu radiation interacts with Co and Fe. On the other hand, sample CoFe2O4 TD shows a negative slope in its background due to the organic compounds cover-ing the nanoparticles. From Eq. 1, the average crystallite sizes calculated resulted in the following values: 16.6 nm for CoFe2O4 TT, 14.9 nm for CoFe2O4 acid and 8.5 nm for CoFe2O4 TD. This tendency is in agreement with those observed in the TEM micrographs.
4.4 TGA
The total organic mass for the sample CoFe2O4 TD was estimated to be 40% of the total mass, and this can be seen at the TGA of this sample at Fig. 5.
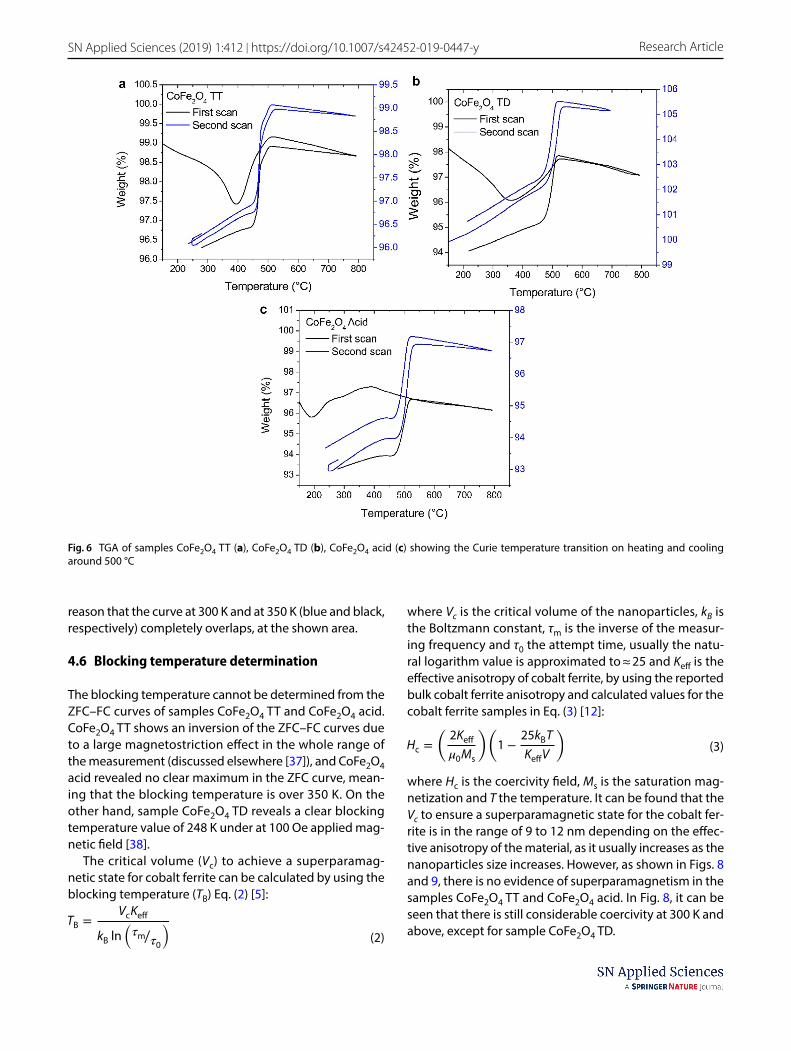
Figure 6 shows the results of DSC and TGA analysis with an applied external magnetic field for the three samples: CoFe2O4 TT, CoFe2O4 acid, and CoFe2O4 TD. The thermograms of Fig. 6a–c show that the Curie tempera-ture is almost independent of the size dispersion and
Fig. 2 Size distribution histograms of the nanoparticles fabricated using three synthetic routes. The average diameter (<d>) and standard deviation ( � ) were obtained by a fitting to a lognormal distribution
Table 1 Atomic % of iron and cobalt in the samples
Cobalt atomic % Iron atomic % Relation-ship Co/Fe
CoFe2O4 TT 13.12 26.27 0.499CoFe2O4 acid 10.32 32.38 0.318CoFe2O4 TD 11.9 30.86 0.385
Fig. 3 DLS measurements of the samples CoFe2O4 acid and CoFe2O4 TD
Vol:.(1234567890)
Research Article SN Applied Sciences (2019) 1:412 | https://doi.org/10.1007/s42452-019-0447-y
aggregation, considering that the experimental ferro-magnetic Curie temperature of the three samples keeps unchanged around 500 °C, even for the second scan where the water and organic components were already removed. These results suggest that the Curie tempera-ture is a property more related to the crystalline structure and the composition than to the size of the nanoparticles.
4.5 Magnetometry
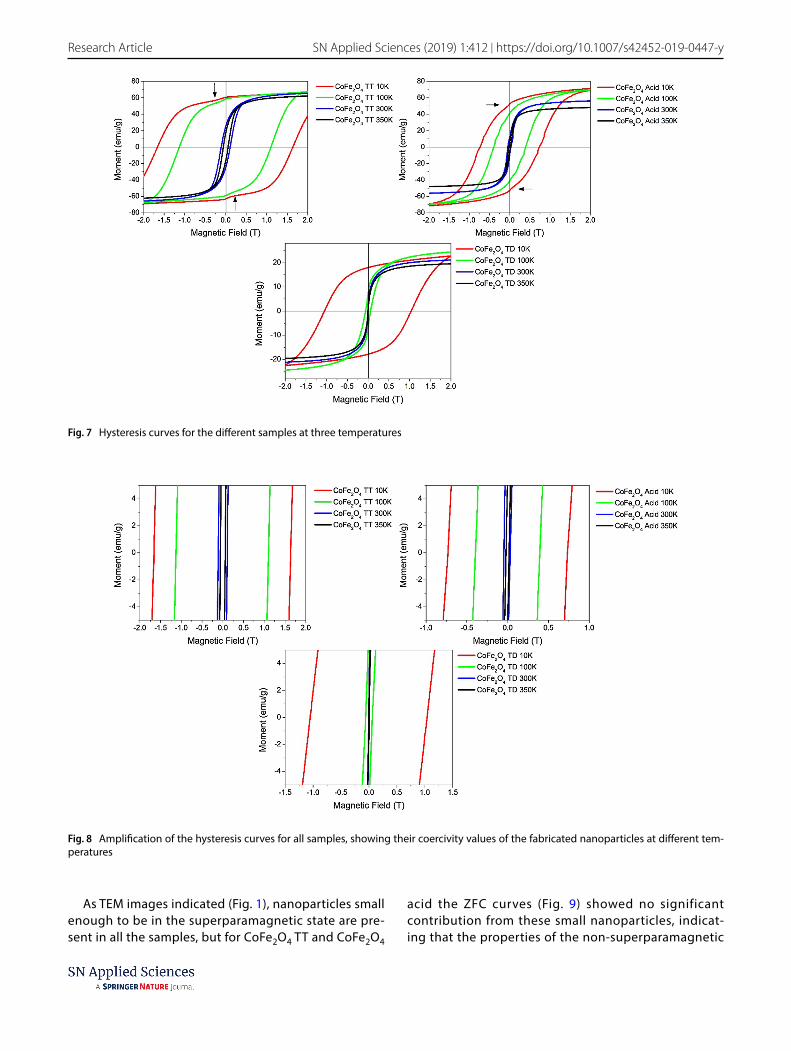
The magnetization hysteresis curves (Fig. 7) show the char-acteristic high coercivity of the cobalt ion [15, 31]. In this case, the magnetic properties showed a strong relation-ship with the size and dispersion of the nanoparticles. The hysteresis curve of sample CoFe2O4 TT at 10 K showed a well-defined step (indicated by arrows in Fig. 7). The step decreased for sample CoFe2O4 acid, while for sample CoFe2O4 TD it completely disappeared. It can be hypoth-esized that this step at low temperatures in the hysteresis curve is due to the size dispersion of the nanoparticles. This behavior can be explained because at low tempera-tures, the magnetic moments are completely frozen when they aligned to the magnetic field and because smaller nanoparticles have lower saturation values, they reach a lower saturation; so the step shown at low temperatures is possible because there is a group of smaller nanoparticles that reached the saturation point, while the largest nano-particles have not reached saturation yet.
The step diminishes as the temperature rises, because there is no full alignment of the nanoparticle spins, as the thermal energy becomes more significative and it is enough to partially dis-align the magnetic moment. These jumps in the hysteresis curves have been previously observed in other articles [4, 34, 37], although there was not much discussion about its origin.
The highest saturation magnetization measured at 300 K was for sample CoFe2O4 TT at 62 emu/g, while the lowest was for sample CoFe2O4 TD at 21 emu/g. Sample CoFe2O4 acid had an intermediate saturation value at 56 emu/g. Sample CoFe2O4 TT had the highest satura-tion value, because of two important factors: It has the best crystallinity as revealed from its XRD pattern (Fig. 4, appearing most intense and well-defined diffraction peaks), due to the post-synthesis thermal treatment; the second factor is that this sample had the largest nanopar-ticles size. In addition, sample CoFe2O4 TD had the lowest saturation value because of the non-magnetic mass contri-bution from the organic surfactants (oleic acid and CTAB).
Figure 8 shows a magnification of the coercivity values of the samples; those values decreased with respect to the temperature as expected, but the values are completely dif-ferent from one sample to another. The superparamagnetic behavior of sample CoFe2O4 TD is seen also in Fig. 8, for the
Fig. 5 TGA of sample CoFe2O4 TD used to determine the total organic mass
Fig. 4 X-ray diffraction patterns of samples CoFe2O4 TT, CoFe2O4 acid, and CoFe2O4 TD
Vol.:(0123456789)
SN Applied Sciences (2019) 1:412 | https://doi.org/10.1007/s42452-019-0447-y Research Article
reason that the curve at 300 K and at 350 K (blue and black, respectively) completely overlaps, at the shown area.
4.6 Blocking temperature determination
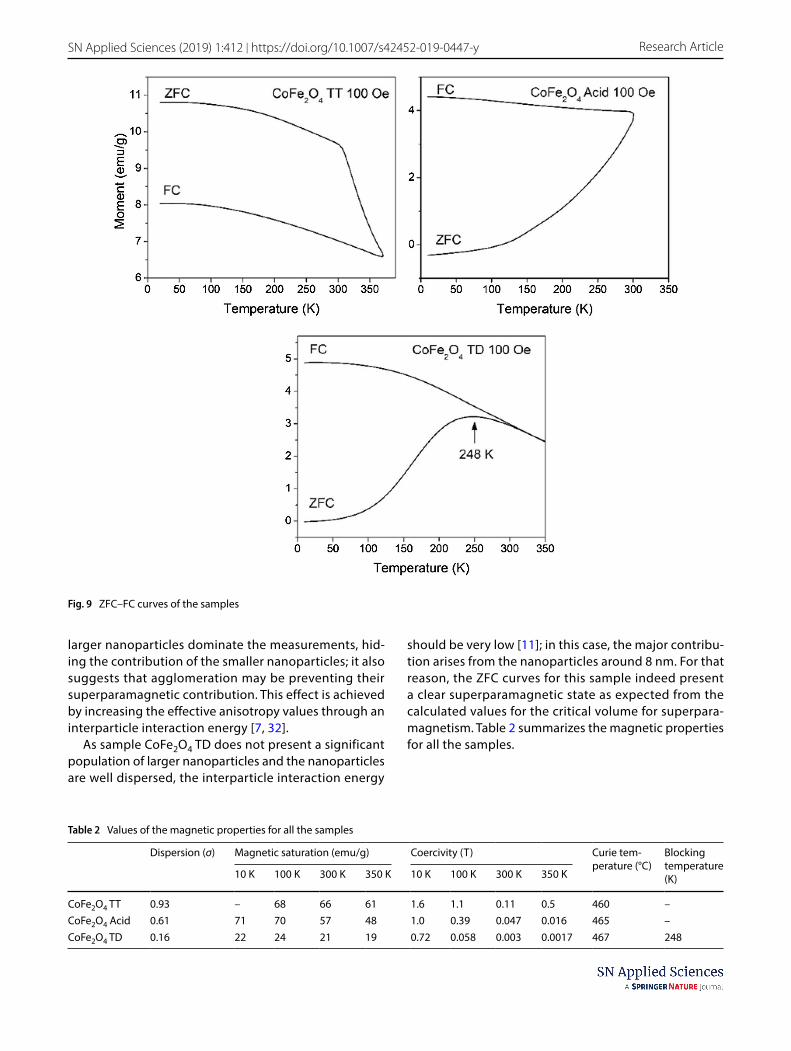
The blocking temperature cannot be determined from the ZFC–FC curves of samples CoFe2O4 TT and CoFe2O4 acid. CoFe2O4 TT shows an inversion of the ZFC–FC curves due to a large magnetostriction effect in the whole range of the measurement (discussed elsewhere [37]), and CoFe2O4 acid revealed no clear maximum in the ZFC curve, mean-ing that the blocking temperature is over 350 K. On the other hand, sample CoFe2O4 TD reveals a clear blocking temperature value of 248 K under at 100 Oe applied mag-netic field [38].
The critical volume (Vc) to achieve a superparamag-netic state for cobalt ferrite can be calculated by using the blocking temperature (TB) Eq. (2) [5]:
(2)TB =
VcKeff
kB ln
(
�m∕�0
)
where Vc is the critical volume of the nanoparticles, kB is the Boltzmann constant, τm is the inverse of the measur-ing frequency and τ0 the attempt time, usually the natu-ral logarithm value is approximated to ≈ 25 and Keff is the effective anisotropy of cobalt ferrite, by using the reported bulk cobalt ferrite anisotropy and calculated values for the cobalt ferrite samples in Eq. (3) [12]:
where Hc is the coercivity field, Ms is the saturation mag-netization and T the temperature. It can be found that the Vc to ensure a superparamagnetic state for the cobalt fer-rite is in the range of 9 to 12 nm depending on the effec-tive anisotropy of the material, as it usually increases as the nanoparticles size increases. However, as shown in Figs. 8 and 9, there is no evidence of superparamagnetism in the samples CoFe2O4 TT and CoFe2O4 acid. In Fig. 8, it can be seen that there is still considerable coercivity at 300 K and above, except for sample CoFe2O4 TD.
(3)Hc =
(
2Keff
�0Ms
)(
1 −25kBT
KeffV
)
Fig. 6 TGA of samples CoFe2O4 TT (a), CoFe2O4 TD (b), CoFe2O4 acid (c) showing the Curie temperature transition on heating and cooling around 500 °C
Vol:.(1234567890)
Research Article SN Applied Sciences (2019) 1:412 | https://doi.org/10.1007/s42452-019-0447-y
As TEM images indicated (Fig. 1), nanoparticles small enough to be in the superparamagnetic state are pre-sent in all the samples, but for CoFe2O4 TT and CoFe2O4
acid the ZFC curves (Fig. 9) showed no significant contribution from these small nanoparticles, indicat-ing that the properties of the non-superparamagnetic
Fig. 7 Hysteresis curves for the different samples at three temperatures
Fig. 8 Amplification of the hysteresis curves for all samples, showing their coercivity values of the fabricated nanoparticles at different tem-peratures
Vol.:(0123456789)
SN Applied Sciences (2019) 1:412 | https://doi.org/10.1007/s42452-019-0447-y Research Article
larger nanoparticles dominate the measurements, hid-ing the contribution of the smaller nanoparticles; it also suggests that agglomeration may be preventing their superparamagnetic contribution. This effect is achieved by increasing the effective anisotropy values through an interparticle interaction energy [7, 32].
As sample CoFe2O4 TD does not present a significant population of larger nanoparticles and the nanoparticles are well dispersed, the interparticle interaction energy
should be very low [11]; in this case, the major contribu-tion arises from the nanoparticles around 8 nm. For that reason, the ZFC curves for this sample indeed present a clear superparamagnetic state as expected from the calculated values for the critical volume for superpara-magnetism. Table 2 summarizes the magnetic properties for all the samples.
Fig. 9 ZFC–FC curves of the samples
Table 2 Values of the magnetic properties for all the samples
Dispersion (σ) Magnetic saturation (emu/g) Coercivity (T) Curie tem-perature (°C)
Blocking temperature (K)10 K 100 K 300 K 350 K 10 K 100 K 300 K 350 K
CoFe2O4 TT 0.93 – 68 66 61 1.6 1.1 0.11 0.5 460 –CoFe2O4 Acid 0.61 71 70 57 48 1.0 0.39 0.047 0.016 465 –CoFe2O4 TD 0.16 22 24 21 19 0.72 0.058 0.003 0.0017 467 248
Vol:.(1234567890)
Research Article SN Applied Sciences (2019) 1:412 | https://doi.org/10.1007/s42452-019-0447-y
4.7 Stoner–Wohlfarth model for ZFC simulation
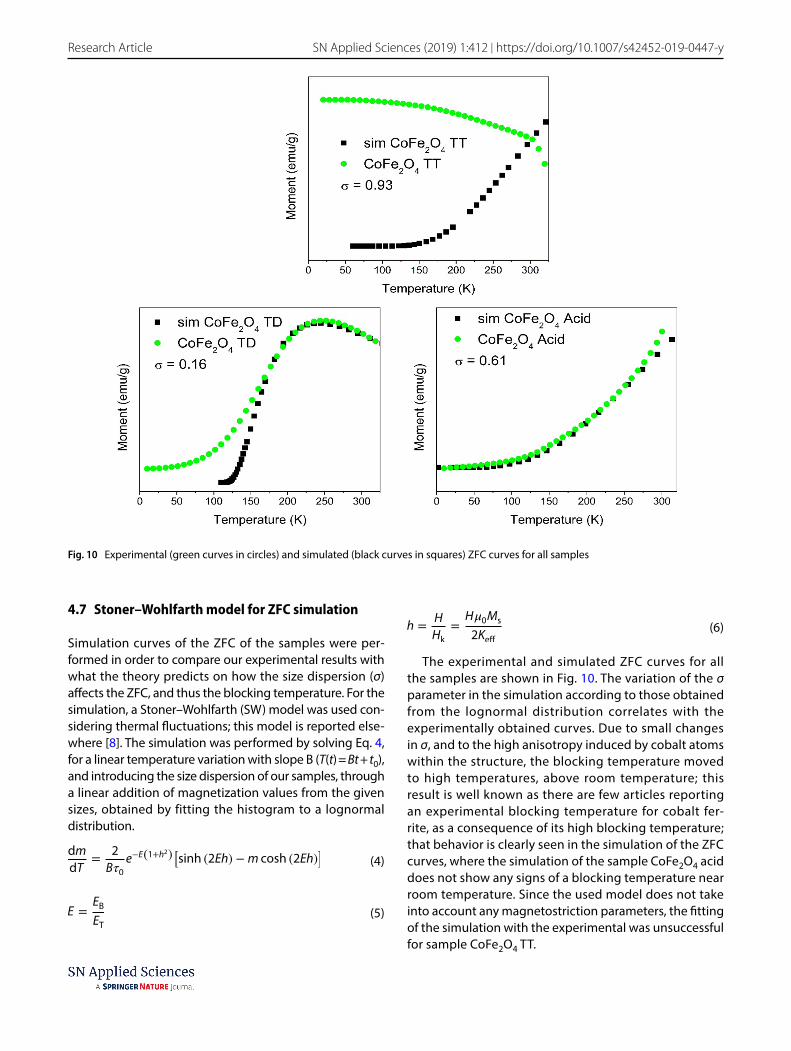
Simulation curves of the ZFC of the samples were per-formed in order to compare our experimental results with what the theory predicts on how the size dispersion (σ) affects the ZFC, and thus the blocking temperature. For the simulation, a Stoner–Wohlfarth (SW) model was used con-sidering thermal fluctuations; this model is reported else-where [8]. The simulation was performed by solving Eq. 4, for a linear temperature variation with slope B (T(t) = Bt + t0), and introducing the size dispersion of our samples, through a linear addition of magnetization values from the given sizes, obtained by fitting the histogram to a lognormal distribution.
(4)dm
dT=
2
B�0e−E(1+h2)
[
sinh (2Eh) −m cosh (2Eh)]
(5)E =EB
ET
The experimental and simulated ZFC curves for all the samples are shown in Fig. 10. The variation of the σ parameter in the simulation according to those obtained from the lognormal distribution correlates with the experimentally obtained curves. Due to small changes in σ, and to the high anisotropy induced by cobalt atoms within the structure, the blocking temperature moved to high temperatures, above room temperature; this result is well known as there are few articles reporting an experimental blocking temperature for cobalt fer-rite, as a consequence of its high blocking temperature; that behavior is clearly seen in the simulation of the ZFC curves, where the simulation of the sample CoFe2O4 acid does not show any signs of a blocking temperature near room temperature. Since the used model does not take into account any magnetostriction parameters, the fitting of the simulation with the experimental was unsuccessful for sample CoFe2O4 TT.
(6)h =H
Hk
=H�0Ms
2Keff
Fig. 10 Experimental (green curves in circles) and simulated (black curves in squares) ZFC curves for all samples
Vol.:(0123456789)
SN Applied Sciences (2019) 1:412 | https://doi.org/10.1007/s42452-019-0447-y Research Article
5 Conclusion
In conclusion, size dispersion and aggregation are always present in the samples synthesized by chemical proce-dures in different degrees, depending on the chosen synthesis route, affecting in a direct way its magnetic properties. As we demonstrate, there are some proper-ties that are not affected by the dispersion and particle aggregation like the Curie temperature. Nevertheless, the hysteresis loops, ZFC–FC curves, and the saturation magnetization and blocking temperature of the magnetic materials are strongly affected by size dispersion and par-ticle aggregation.
Acknowledgements This work was supported by CONACyT, Mexico, through the Grant # INFR-2014-02-23053.
Compliance with ethical standards
Conflict of interest The authors declare no competing financial in-terests.
References
1. Afroz M, Karthikeyan P, Ahmed P, Kumar U (2012) Application of nanotechnology in food and dairy processing: an overview. Pak J Food Sci 22:23–31
2. Ahn T, Kim JH, Yang HM et al (2012) Formation pathways of mag-netite nanoparticles by coprecipitation method. J Phys Chem C 116:6069–6076. https ://doi.org/10.1021/jp211 843g
3. Arteaga-Cardona F, Hidalgo-Tobón S, Pal U, Méndez-Rojas MÁ (2016) Ferrites as magnetic fluids for hyperthermia and MRI con-trast agents. In: AIP conference proceedings
4. Arteaga-Cardona F, Rojas-Rojas K, Costo R et al (2016) Improving the magnetic heating by disaggregating nanoparticles. J Alloys Compd. https ://doi.org/10.1016/j.jallc om.2015.10.285
5. Arteaga-Cardona F, Santillán-Urquiza E, Pal U et al (2017) Unusual variation of blocking temperature in bi-magnetic nanoparticles. J Magn Magn Mater 441:417–423. https ://doi.org/10.1016/j.jmmm.2017.06.024
6. Auzans E, Zins D, Blums E, Massart R (1999) Synthesis and prop-erties of Mn-Zn ferrite ferrofluids. J Mater Sci 34:1253–1260. https ://doi.org/10.1023/A:10045 25410 324
7. Branquinho LC, Carrião MS, Costa AS et al (2013) Effect of mag-netic dipolar interactions on nanoparticle heating efficiency: implications for cancer hyperthermia. Sci Rep 3:2887. https ://doi.org/10.1038/srep0 2887
8. Bruvera IJ, Calatayud MP, Goya GF (2015) Determination of the blocking temperature of magnetic nanoparticles: the good, the bad and the ugly. J Appl Phys 118:1–8. https ://doi.org/10.1063/1.49354 84
9. Cardona FA, Urquiza ES, de la Presa P et al (2016) Enhanced mag-netic properties and MRI performance of bi-magnetic core–shell nanoparticles. RSC Adv 6:77558–77568. https ://doi.org/10.1039/C6RA1 4265F
10. Chandekar KV, Kant KM (2017) Effect of size and shape depend-ent anisotropy on superparamagnetic property of CoFe2O4
nanoparticles and nanoplatelets. Phys B Phys Condens Matter 520:152–163. https ://doi.org/10.1016/j.physb .2017.06.001
11. Crespo P (2013) Tuning properties with coatings. J Phys Condens Matter. https ://doi.org/10.1088/0953-8984/25/48/48400 6
12. De La Presa P, Luengo Y, Multigner M et al (2012) Study of heat-ing efficiency as a function of concentration, size, and applied field in γ-Fe2O3 nanoparticles. J Phys Chem C 116:25602–25610
13. Dorozhkin SV (2010) Nanosized and nanocrystalline calcium orthophosphates. Acta Biomater 6:715–734. https ://doi.org/10.1016/j.actbi o.2009.10.031
14. Dutz S, Hergt R (2014) Magnetic particle hyperthermia—a promising tumour therapy? Nanotechnology 25:452001. https ://doi.org/10.1088/0957-4484/25/45/45200 1
15. Fantechi E, Innocenti C, Albino M et al (2015) Influence of cobalt doping on the hyperthermic efficiency of magnetite nanoparticles. J Magn Magn Mater 380:365–371. https ://doi.org/10.1016/j.jmmm.2014.10.082
16. Gutiérrez L, Costo R, Grüttner C et al (2015) Synthesis methods to prepare single- and multi-core iron oxide nanoparticles for biomedical applications. Dalt Trans 44:2943–2952. https ://doi.org/10.1039/C4DT0 3013C
17. Gyergyek S, Drofenik M, Makovec D (2012) Oleic-acid-coated CoFe2O4 nanoparticles synthesized by co-precipitation and hydrothermal synthesis. Mater Chem Phys 133:515–522. https ://doi.org/10.1016/j.match emphy s.2012.01.077
18. Hasier J, Riolo MA, Nash P (2017) Curie temperature deter-mination via thermogravimetric and continuous wavelet transformation analysis. EPJ Tech Instrum 4:5. https ://doi.org/10.1140/epjti /s4048 5-017-0040-y
19. Khalil MI (2015) Co-precipitation in aqueous solution synthe-sis of magnetite nanoparticles using iron (III) salts as precur-sors. Arab J Chem 8:279–284. https ://doi.org/10.1016/j.arabj c.2015.02.008
20. Kiss LB, Niklasson GA, Granqvist CG (1999) New approach to the origin of lognormal size distributions of nanoparticles. Nanotechnology 10:25–28
21. Langford JI, Wilson AJC (1978) Scherrer after sixty years: a sur-vey and some new results in the determination of crystallite size. J Appl Crystallogr 11:102–113. https ://doi.org/10.1107/S0021 88987 80128 44
22. Laokul P, Arthan S, Maensiri S, Swatsitang E (2015) Magnetic and optical properties of CoFe2O4 nanoparticles synthesized by reverse micelle microemulsion method. J Supercond Nov Magn 28:2483–2489. https ://doi.org/10.1007/s1094 8-015-3068-8
23. Leite GCP, Chagas EF, Pereira R et al (2012) Exchange coupling behavior in bimagnetic CoFe2O4/CoFe2 nanocomposite. J Magn Magn Mater 324:2711–2716. https ://doi.org/10.1016/J.Jmmm.2012.03.034
24. Lemine OM, Omri K, Iglesias M et al (2014) γ-Fe2O3by sol-gel with large nanoparticles size for magnetic hyperthermia application. J. Alloys Compd 607:125–131
25. Lim J, Yeap S, Che H, Low S (2013) Characterization of magnetic nanoparticle by dynamic light scattering. Nanoscale Res Lett 8:381. https ://doi.org/10.1186/1556-276X-8-381
26. López-Ortega A, Estrader M, Salazar-Alvarez G et al (2015) Appli-cations of exchange coupled bi-magnetic hard/soft and soft/hard magnetic core/shell nanoparticles. Phys Rep 553:1–32. https ://doi.org/10.1016/j.physr ep.2014.09.007
27. Lu LT, Dung NT, Tung LD et al (2016) Synthesis of magnetic cobalt ferrite nanoparticles with controlled morphology, mono-dispersity and composition: the influence of solvent, surfactant, reductant and synthetic conditions. Nanoscale 7:19596–19610. https ://doi.org/10.1039/c5nr0 4266f
28. Lu RE, Chang KG, Fu B et al (2014) Magnetic properties of differ-ent CoFe2O4 nanostructures: nanofibers versus nanoparticles.
Vol:.(1234567890)
Research Article SN Applied Sciences (2019) 1:412 | https://doi.org/10.1007/s42452-019-0447-y
J Mater Chem C 2:8578–8584. https ://doi.org/10.1039/c4tc0 1415d
29. Mohapatra J, Mitra A, Bahadur D, Aslam M (2013) Surface con-trolled synthesis of MFe2O4 (M = Mn, Fe Co, Ni and Zn) nano-particles and their magnetic characteristics. CrystEngComm 15:524–532. https ://doi.org/10.1039/C2CE2 5957E
30. Monshi A, Foroughi MR, Monshi MR (2012) Modified Scherrer equation to estimate more accurately nano-crystallite size using XRD. World J Nano Sci Eng 02:154–160. https ://doi.org/10.4236/wjnse .2012.23020
31. Morais PC, Garg VK, Oliveira AC et al (2001) Synthesis and char-acterization of size-controlled cobalt-ferrite-based ionic ferro-fluids. J Magn Magn Mater 225:37–40. https ://doi.org/10.1016/S0304 -8853(00)01225 -7
32. Ostenfeld C, Mørup S (2002) Magnetic interactions between nanoparticles of different materials. Hyperfine Interact. https ://doi.org/10.1007/978-94-010-0281-3_21
33. Papaefthymiou GC (2009) Nanoparticle magnetism. Nano Today 4:438–447. https ://doi.org/10.1016/j.nanto d.2009.08.006
34. Pereira C, Pereira AM, Fernandes C et al (2012) Superparamag-netic MFe2O4 (M = Fe Co, Mn) nanoparticles : tuning the par-ticle size and magnetic properties through a novel one-step coprecipitation route. Chem Mater 24:1496–1504. https ://doi.org/10.1021/cm300 301c
35. Polte J (2015) Fundamental growth principles of colloidal metal nanoparticles—a new perspective. CrystEngComm 17:6809–6830. https ://doi.org/10.1039/C5CE0 1014D
36. Salazar-kuri U, Estevez JO, Silva-gonzález NR et al (2017) Struc-ture and magnetic properties of the Co1−xNixFe2O4-BaTiO3
core-shell nanoparticles. J Magn Magn Mater 442:247–254. https ://doi.org/10.1016/j.jmmm.2017.06.126
37. Salazar-kuri U, Estevez JO, Silva-gonzález NR, Pal U (2018) Large magnetostriction in chemically fabricated CoFe2O4 nanopar-ticles and its temperature dependence. J Magn Magn Mater 460:141–145. https ://doi.org/10.1016/j.jmmm.2018.03.074
38. Sugiura N (1980) Field dependence of blocking temperature in magnetite nanoparticles. Earth Planet Sci Lett 46:438–442. https ://doi.org/10.4028/www.scien tific .net/JMNM.20-21.673
39. Thanh NTK, Maclean N, Mahiddine S (2014) Mechanisms of nucleation and growth of nanoparticles in solution. Chem Rev 114:7610–7630. https ://doi.org/10.1021/cr400 544s
40. Tiwari A, Ramalingam M, Kobayashi H, Turner APF (2012) Bio-medical materials and diagnostic devices. Wiley. https ://doi.org/10.1002/97811 18523 025
41. Unni M, Uhl AM, Savliwala S et al (2017) Thermal decomposition synthesis of iron oxide nanoparticles with diminished magnetic dead layer by controlled addition of oxygen. ACS Nano 11:2284–2303. https ://doi.org/10.1021/acsna no.7b006 09
42. Wu W, Wu Z, Yu T et al (2015) Recent progress on magnetic iron oxide nanoparticles: synthesis, surface functional strategies and biomedical applications. Sci Technol Adv Mater 16:023501. https ://doi.org/10.1088/1468-6996/16/2/02350 1
43. Yigit MV, Moore A, Medarova Z (2012) Magnetic nanoparticles for cancer diagnosis and therapy. Pharm Res 29:1180–1188. https ://doi.org/10.1007/s1109 5-012-0679-7
Publisher’s Note Springer Nature remains neutral with regard to jurisdictional claims in published maps and institutional affiliations.