Embed Size (px)
Citation preview
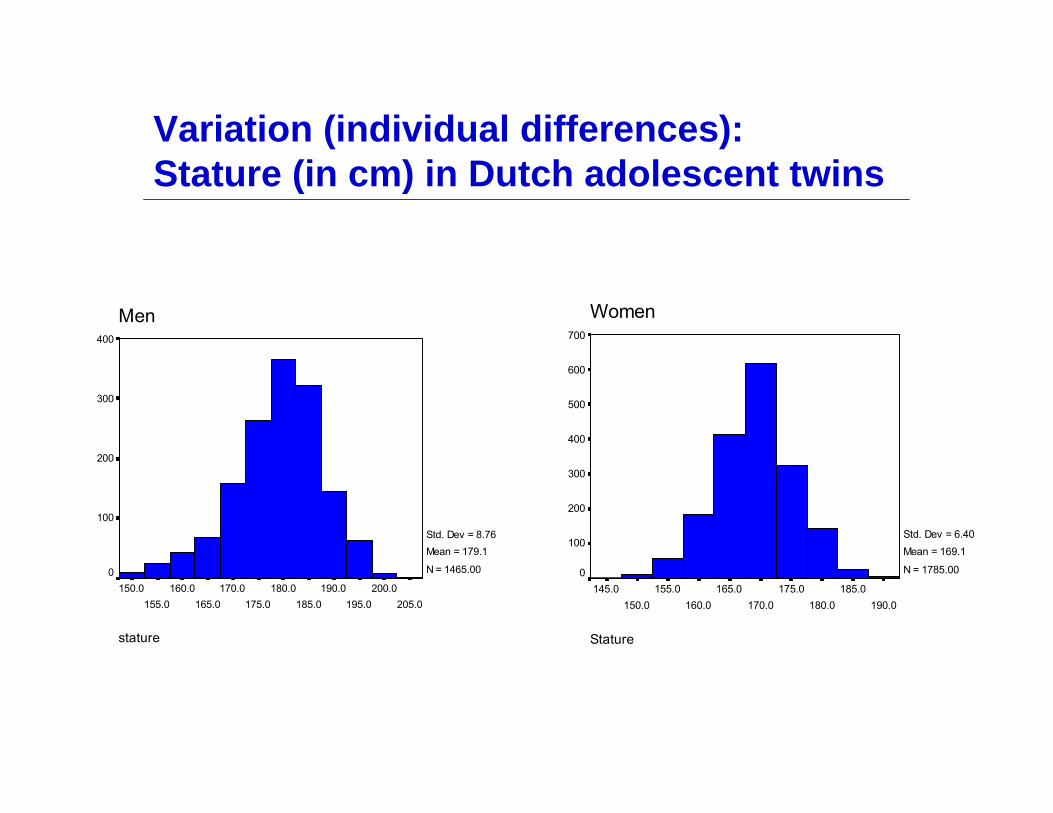
Variation (individual differences):Stature (in cm) in Dutch adolescent twins
stature
205.0200.0
195.0190.0
185.0180.0
175.0170.0
165.0160.0
155.0150.0
Men400
300
200
100
0
Std. Dev = 8.76 Mean = 179.1
N = 1465.00
Stature
190.0185.0
180.0175.0
170.0165.0
160.0155.0
150.0145.0
Women700
600
500
400
300
200
100
0
Std. Dev = 6.40 Mean = 169.1
N = 1785.00
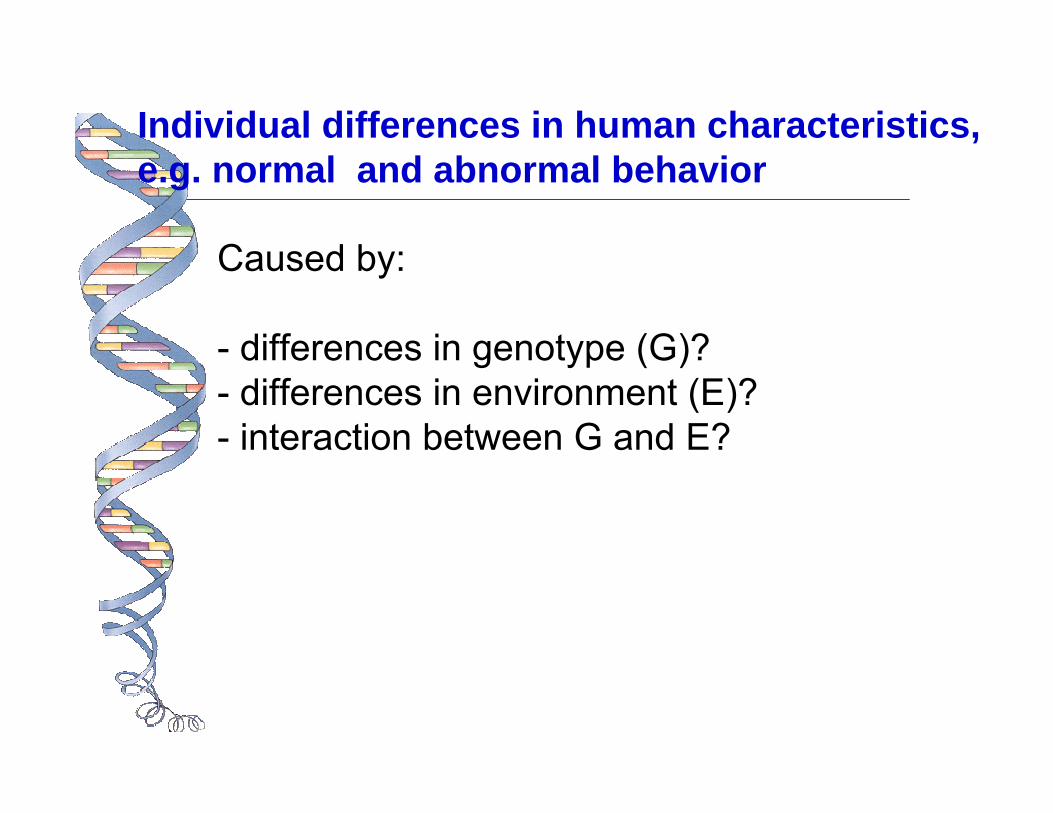
Caused by:
- differences in genotype (G)?- differences in environment (E)?- interaction between G and E?
Individual differences in human characteristics, e.g. normal and abnormal behavior

Complex: Polygenic Traits
0
1
2
3
1 Gene 3 Genotypes 3 Phenotypes
0
1
2
3
2 Genes 9 Genotypes 5 Phenotypes
01234567
3 Genes27 Genotypes 7 Phenotypes
05
1015
20
4 Genes81 Genotypes 9 Phenotypes
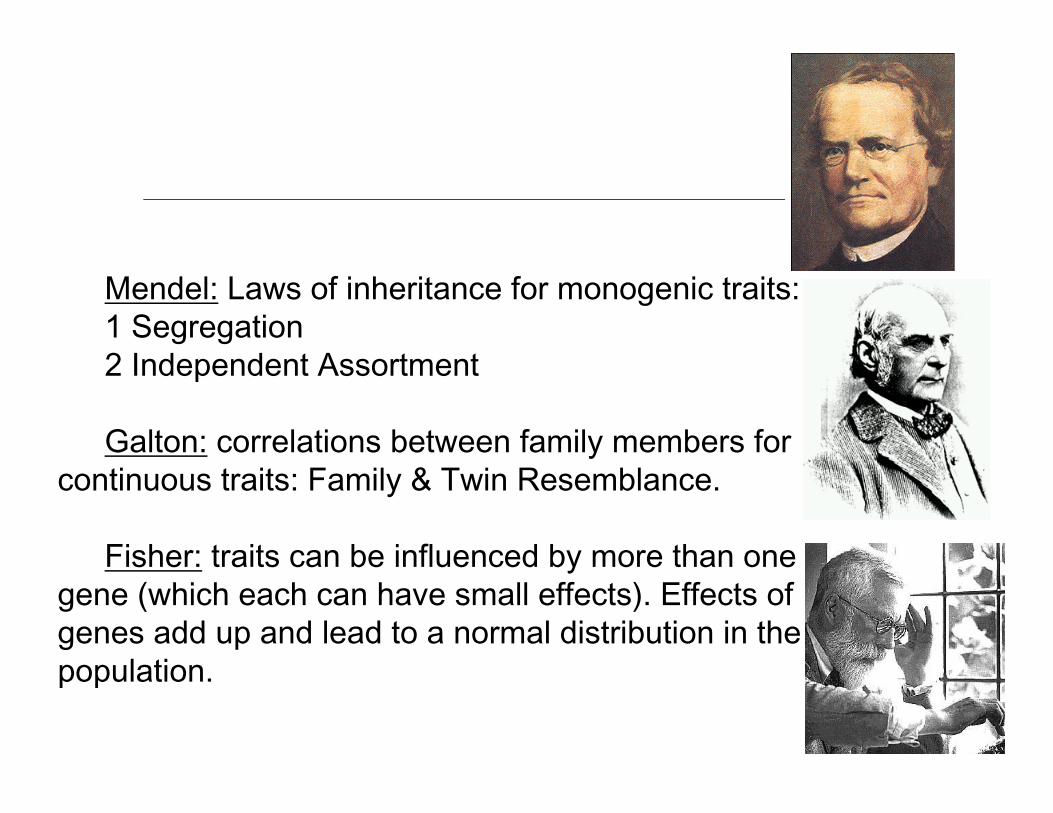
Mendel: Laws of inheritance for monogenic traits:1 Segregation2 Independent Assortment
Galton: correlations between family members for continuous traits: Family & Twin Resemblance.
Fisher: traits can be influenced by more than one gene (which each can have small effects). Effects of genes add up and lead to a normal distribution in the population.
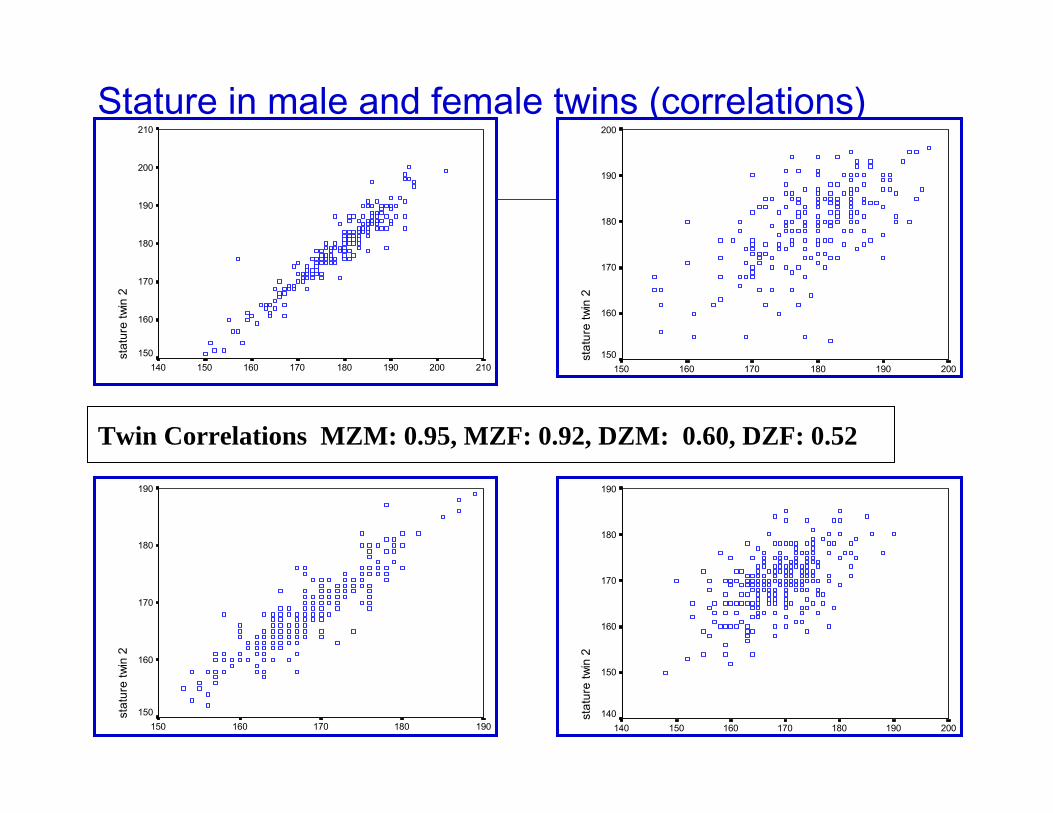
Stature in male and female twins (correlations)
Twin Correlations MZM: 0.95, MZF: 0.92, DZM: 0.60, DZF: 0.52
210200190180170160150140
stat
ure
twin
2210
200
190
180
170
160
150
200190180170160150
stat
ure
twin
2
200
190
180
170
160
150
190180170160150
stat
ure
twin
2
190
180
170
160
150
200190180170160150140
stat
ure
twin
2
190
180
170
160
150
140
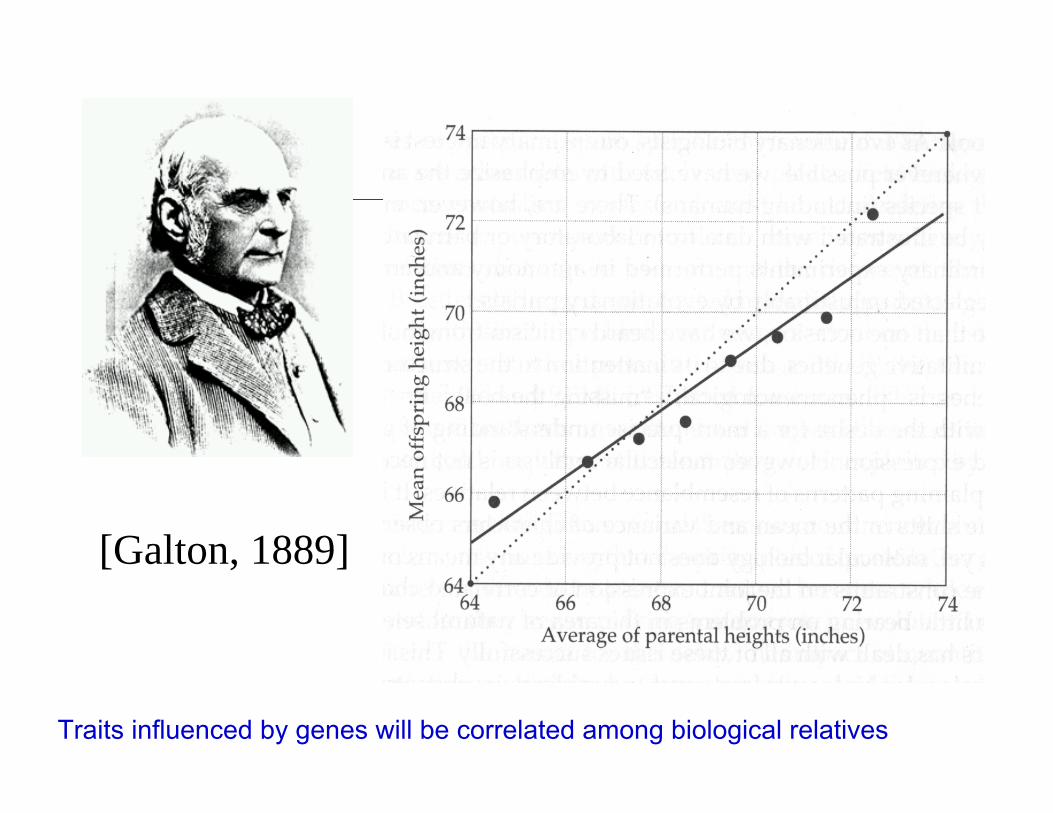
[Galton, 1889]
Traits influenced by genes will be correlated among biological relatives
800
1000
1200
1400
800 1000 1200 1400800
1000
1200
1400
800 1000 1200 1400
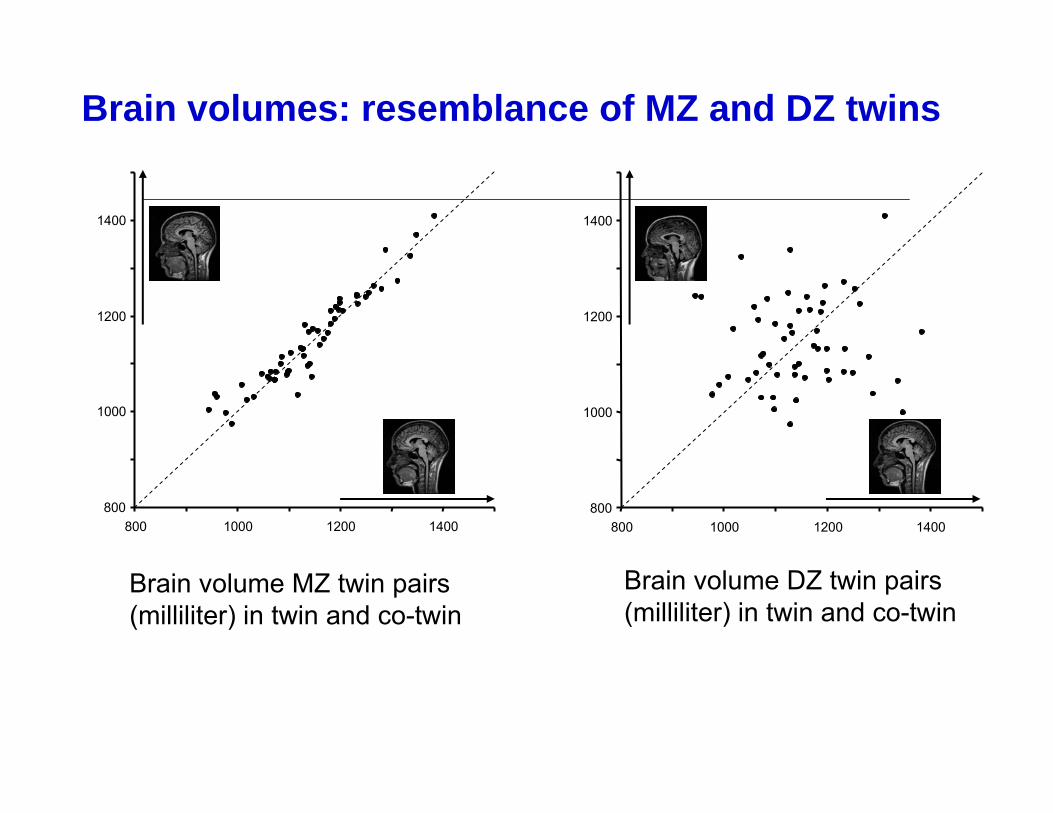
Brain volume MZ twin pairs (milliliter) in twin and co-twin
Brain volumes: resemblance of MZ and DZ twins
Brain volume DZ twin pairs (milliliter) in twin and co-twin
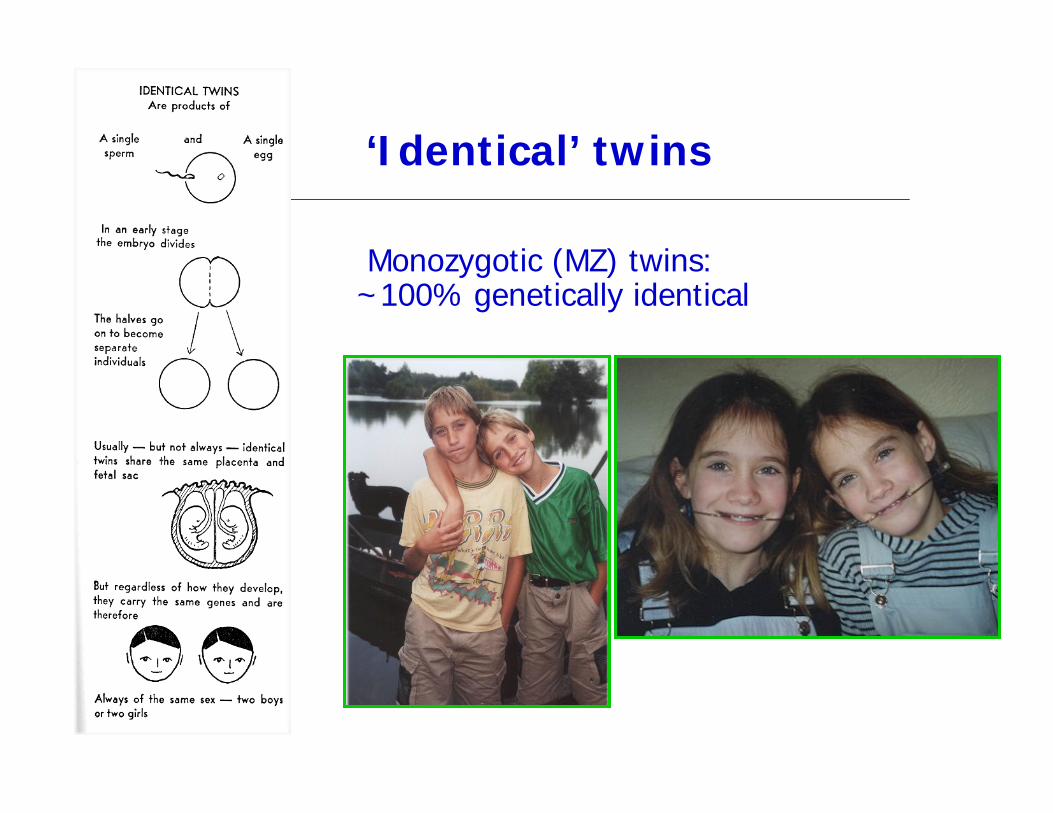
‘Identical’ twins
Monozygotic (MZ) twins: ~100% genetically identical

Fraternal twinsDizygotic (DZ) twins share ~50% of their segregating genes

•Twin correlations for cholesterol levels (17-yr old twins)• rMZ = 0.86 & rDZ = 0.46•Heritability = 80% (=2(.86-.46))
DZ twins
MZ twins
Twin Model
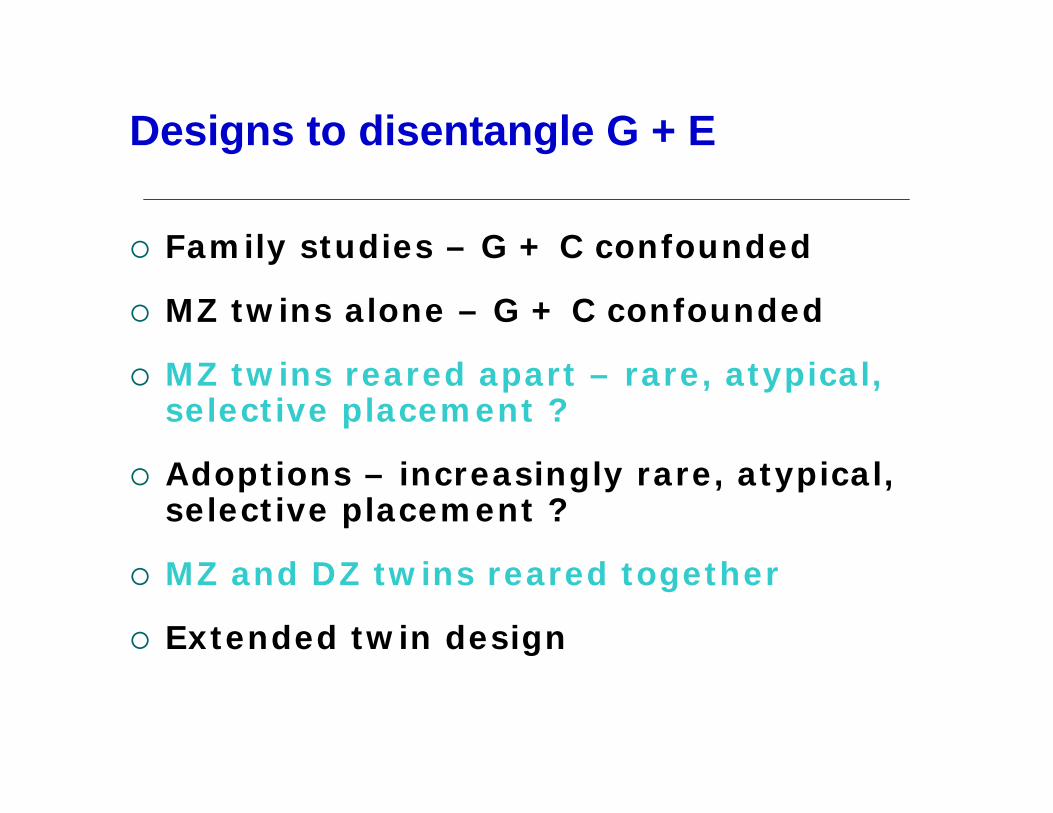
Designs to disentangle G + E
Family studies – G + C confounded
MZ twins alone – G + C confounded
MZ twins reared apart – rare, atypical, selective placement ?
Adoptions – increasingly rare, atypical, selective placement ?
MZ and DZ twins reared together
Extended twin design

Bouchard & McGue: Genetic and environmental influences on human psychological differences (2003)
Intraclass correlations
MZT MZA(626 pairs) (74 pairs)
Positive emotionality .55 .43Negative emotionality .44 .47Constraint .56 .58

* known zygosity* EEA: equal environment (including prenatal)* representative
Classical twin design: Assumptions
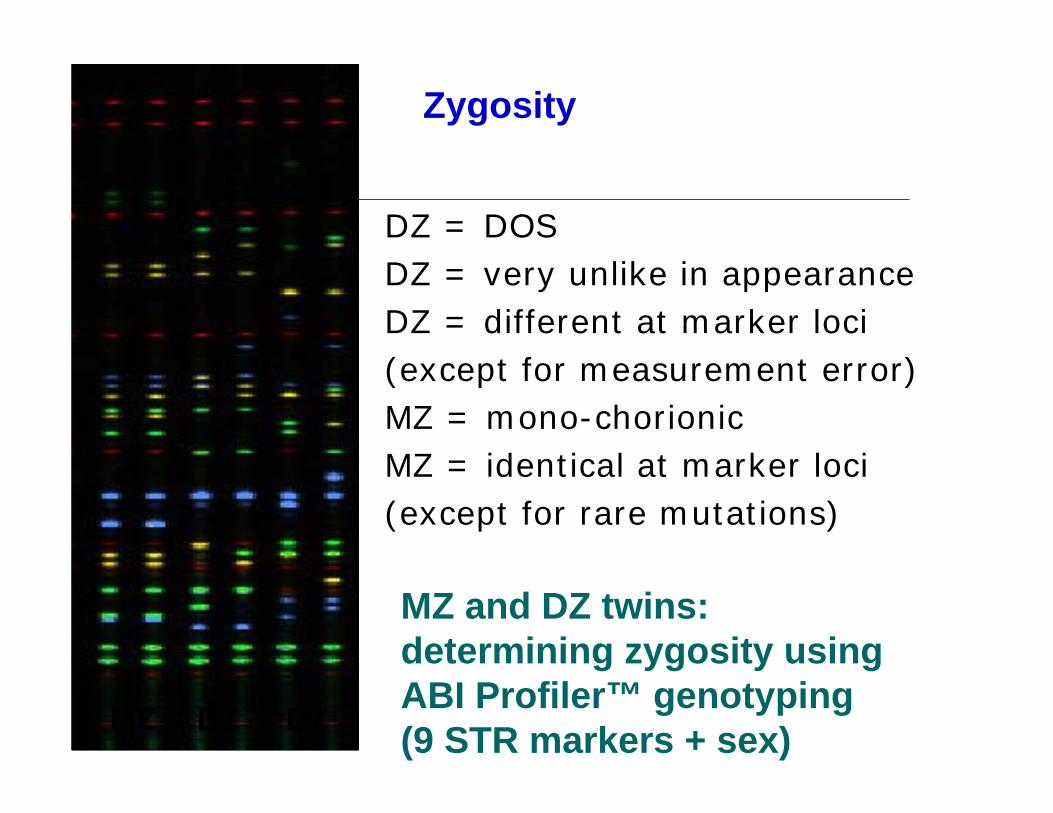
MZ and DZ twins: determining zygosity using ABI Profiler™ genotyping (9 STR markers + sex)MZ DZ DZ
DZ = DOS DZ = very unlike in appearanceDZ = different at marker loci(except for measurement error)MZ = mono-chorionicMZ = identical at marker loci(except for rare mutations)
Zygosity
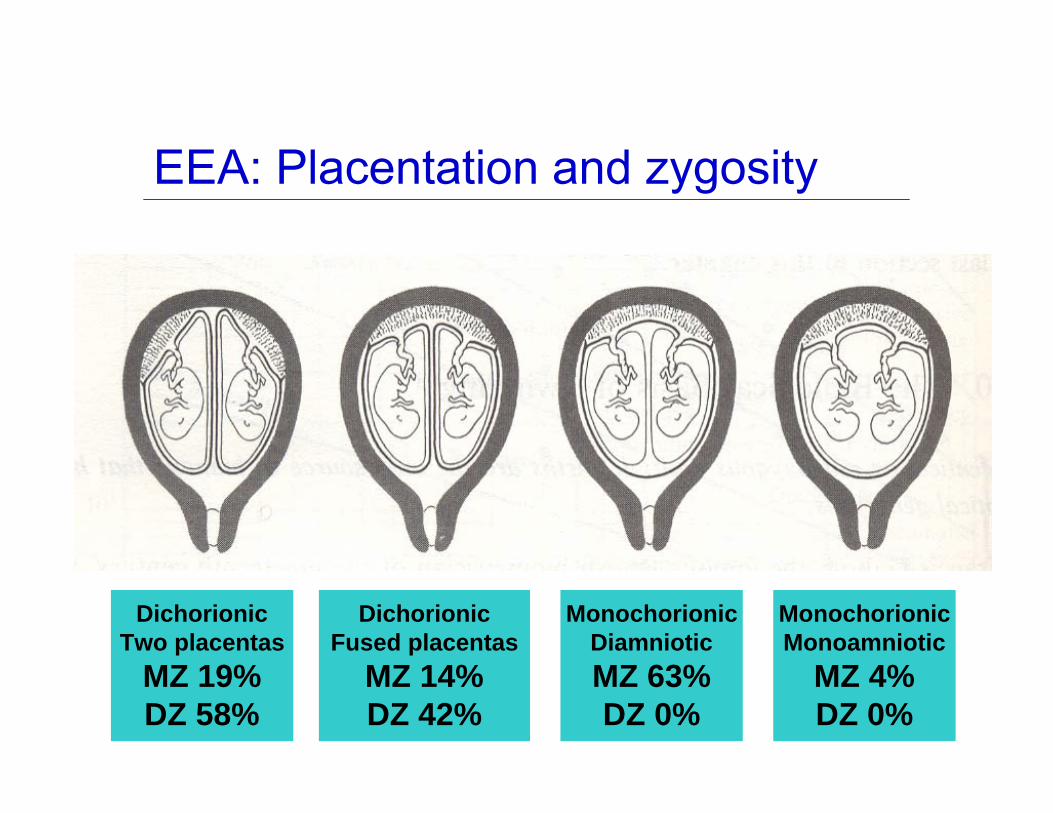
EEA: Placentation and zygosity
DichorionicTwo placentas
MZ 19%DZ 58%
DichorionicFused placentas
MZ 14%DZ 42%
MonochorionicDiamnioticMZ 63%DZ 0%
MonochorionicMonoamniotic
MZ 4%DZ 0%
Representative?
Test for “twin effects”: Include other family members (e.g. siblings of twins)Look at resemblance in twins of mistaken zygosity (parents say DZ, testing says MZ)
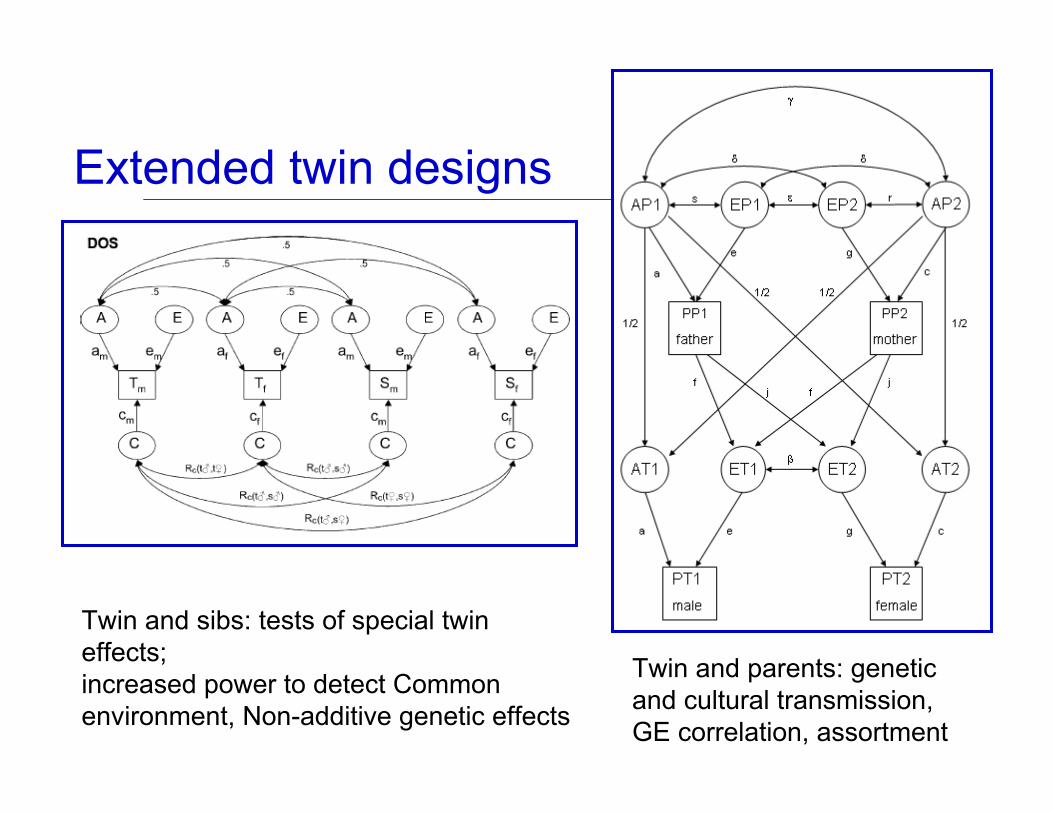
Extended twin designs
Twin and sibs: tests of special twin effects;increased power to detect Common environment, Non-additive genetic effects
Twin and parents: genetic and cultural transmission, GE correlation, assortment
110 - liever van het andere geslacht
2.001.501.00.500.00
4000
3000
2000
1000
0
Std. Dev = .31 Mean = .08
N = 3337.00
5 - andere geslacht
2.001.501.00.500.00
4000
3000
2000
1000
0
Std. Dev = .32 Mean = .08
N = 3346.00
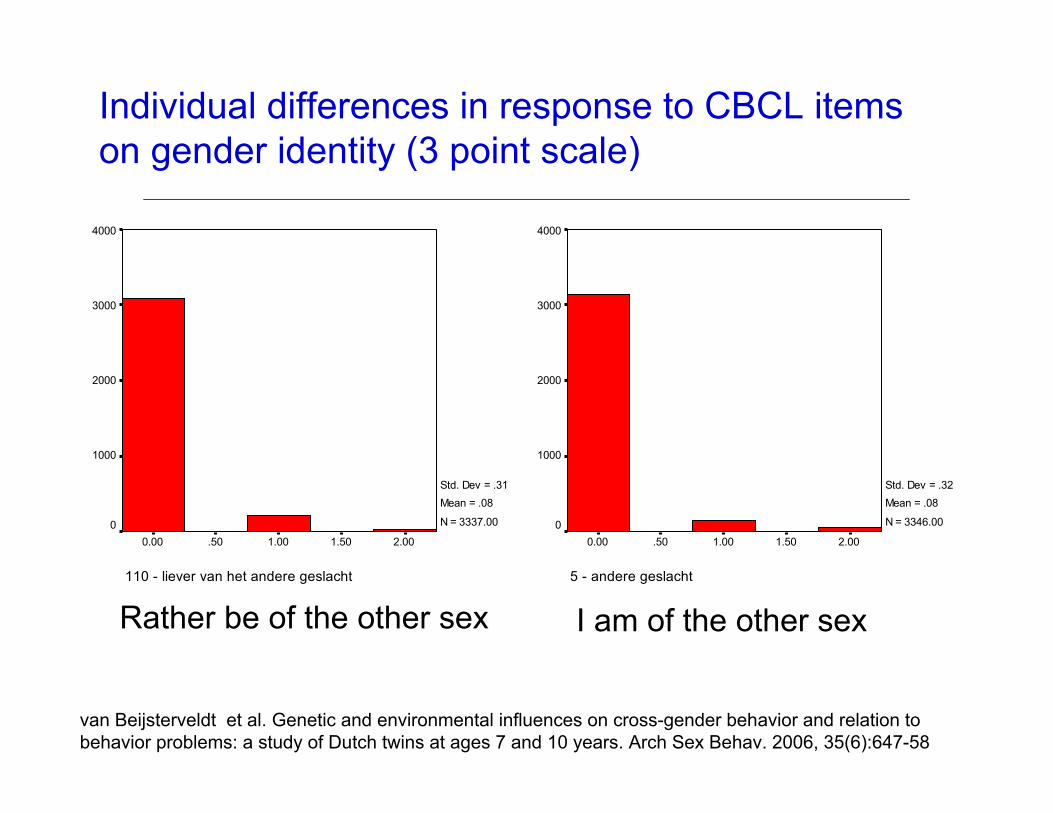
Rather be of the other sex I am of the other sex
Individual differences in response to CBCL items on gender identity (3 point scale)
van Beijsterveldt et al. Genetic and environmental influences on cross-gender behavior and relation to behavior problems: a study of Dutch twins at ages 7 and 10 years. Arch Sex Behav. 2006, 35(6):647-58
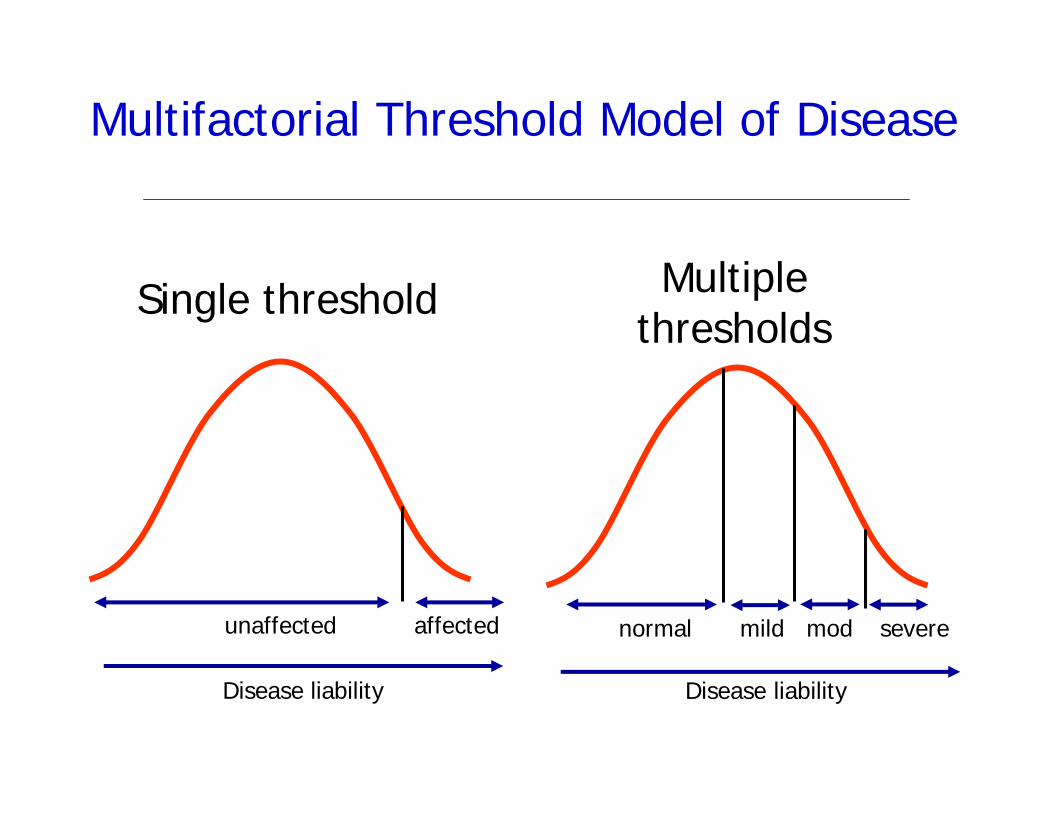
unaffected affected
Disease liability
Single threshold
severe
Disease liability
Multiple thresholds
mildnormal mod
Multifactorial Threshold Model of Disease
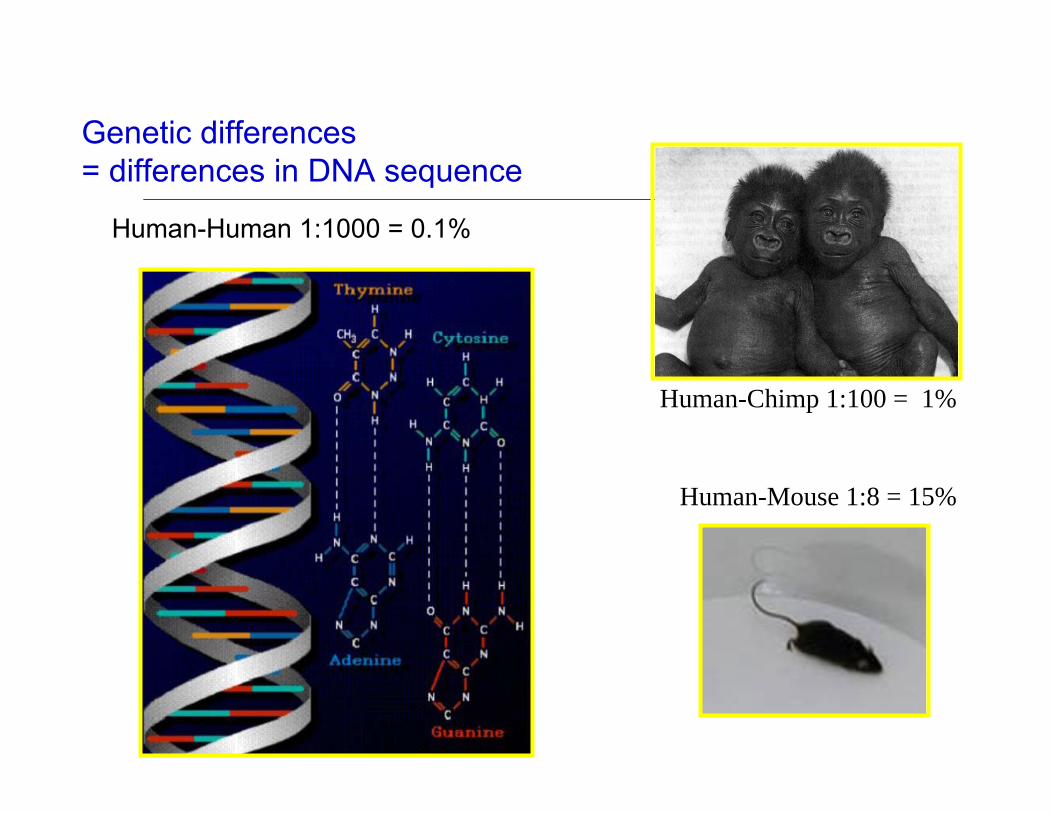
Genetic differences= differences in DNA sequence
Human-Mouse 1:8 = 15%
Human-Chimp 1:100 = 1%
Human-Human 1:1000 = 0.1%
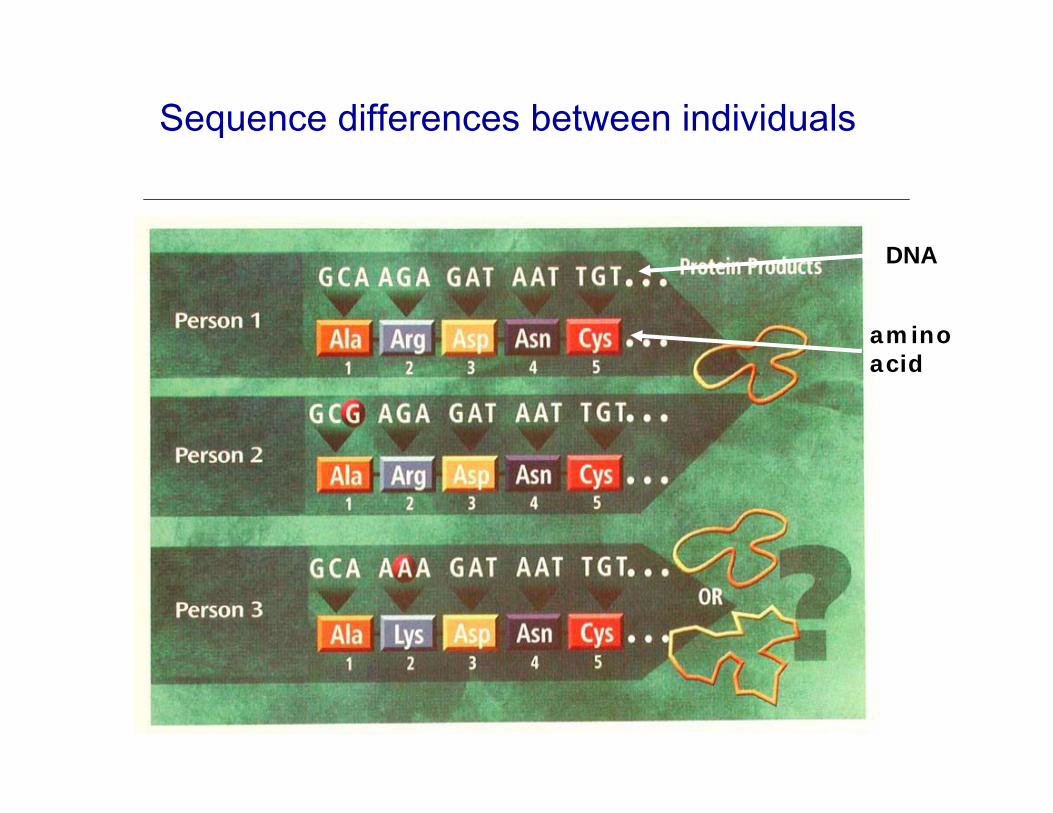
Sequence differences between individuals
DNA
aminoacid
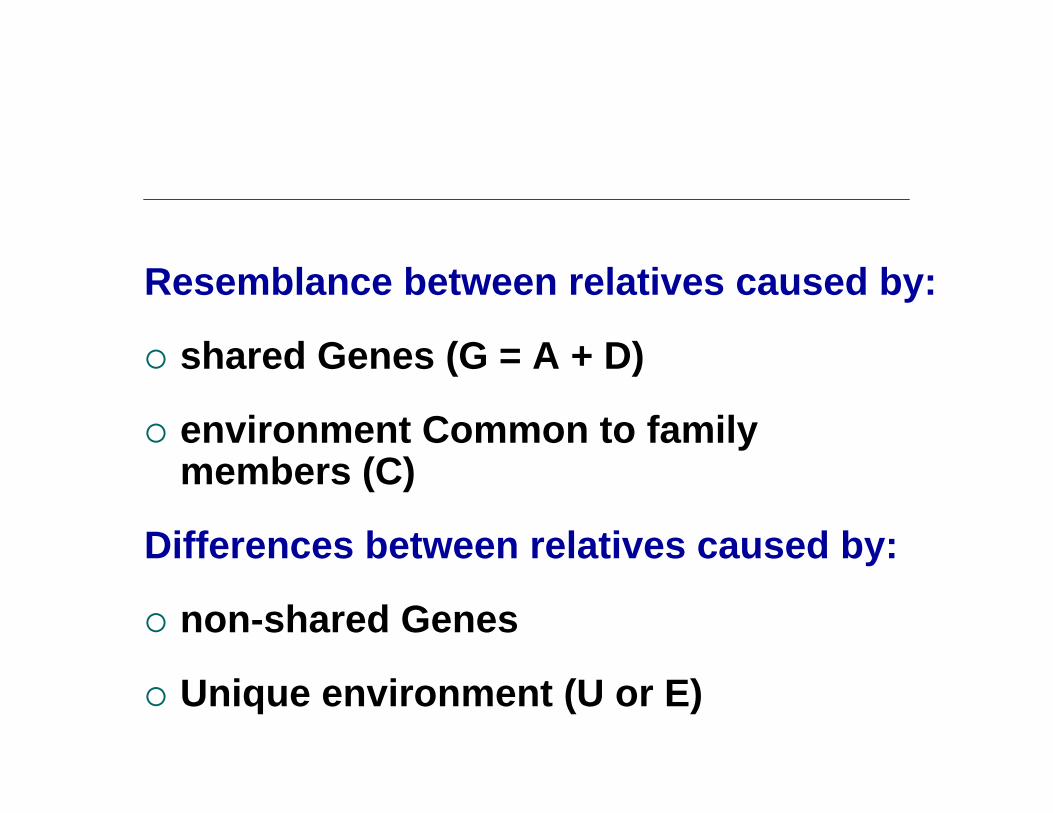
Resemblance between relatives caused by:
shared Genes (G = A + D)
environment Common to family members (C)
Differences between relatives caused by:
non-shared Genes
Unique environment (U or E)

Genetics explains both the resemblances and the differences of family members (e.g. sibs).
Distribution of phenotypes in offspring of two heterozygous parents (AaBb).(2 genes (A & B) with additive allelic effects).
Punnett square
K Mather, Biometrical Genetics, Dover Publ, 1949
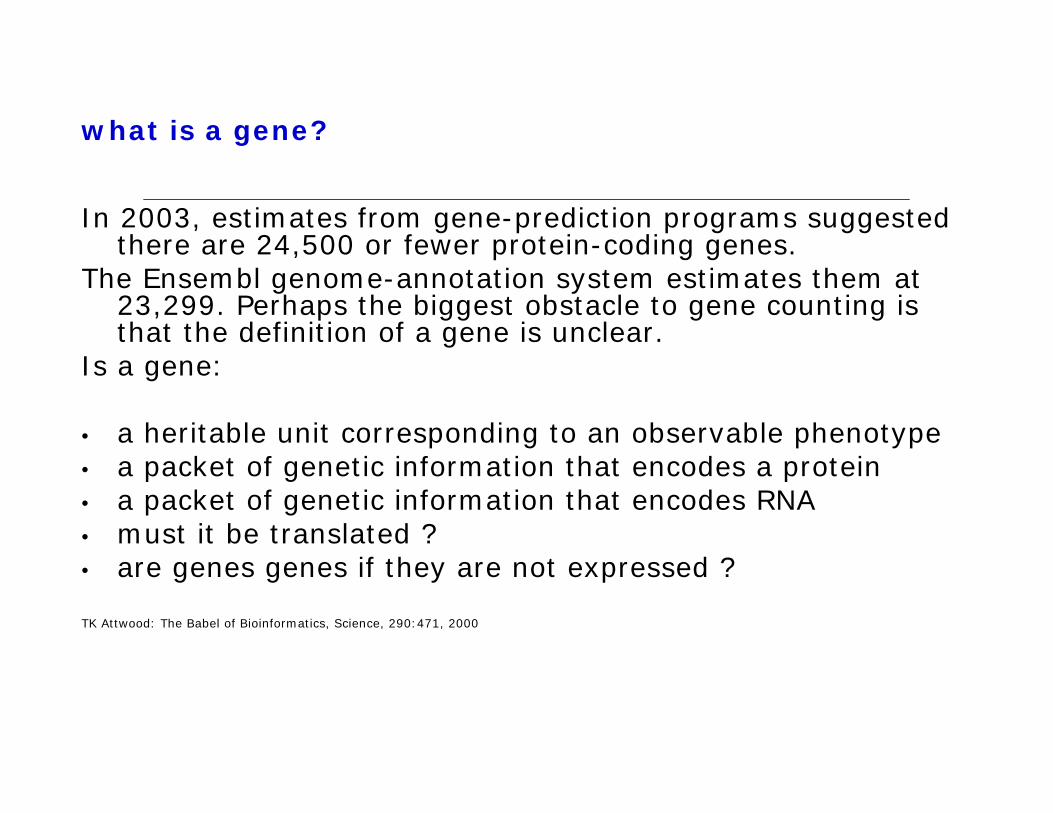
what is a gene?
In 2003, estimates from gene-prediction programs suggested there are 24,500 or fewer protein-coding genes.
The Ensembl genome-annotation system estimates them at 23,299. Perhaps the biggest obstacle to gene counting is that the definition of a gene is unclear.
Is a gene:
• a heritable unit corresponding to an observable phenotype• a packet of genetic information that encodes a protein• a packet of genetic information that encodes RNA• must it be translated ?• are genes genes if they are not expressed ?
TK Attwood: The Babel of Bioinformatics, Science, 290:471, 2000
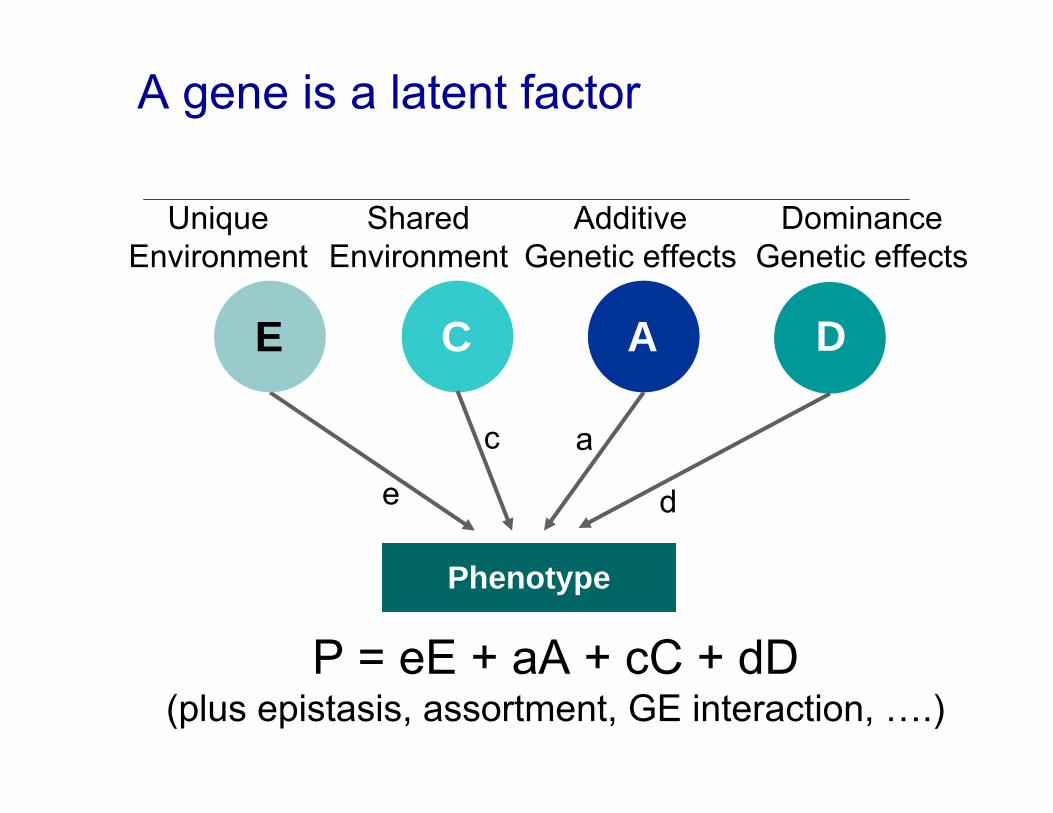
Phenotype
E C A D
UniqueEnvironment
AdditiveGenetic effects
SharedEnvironment
DominanceGenetic effects
e
ac
d
P = eE + aA + cC + dD(plus epistasis, assortment, GE interaction, ….)
A gene is a latent factor
Structural equation modeling
• Both continuous and categorical variables• Systematic approach to hypothesis testing• Tests of significance (for effects of G, D, C)• Can be extended to:
• More complex questions• Multiple variables• Other relatives

ACE Model for univariate twin / sib data
PT1
ACE
PT2
A C E
1
MZ=1.0; DZ/sib=0.5
e ac eca
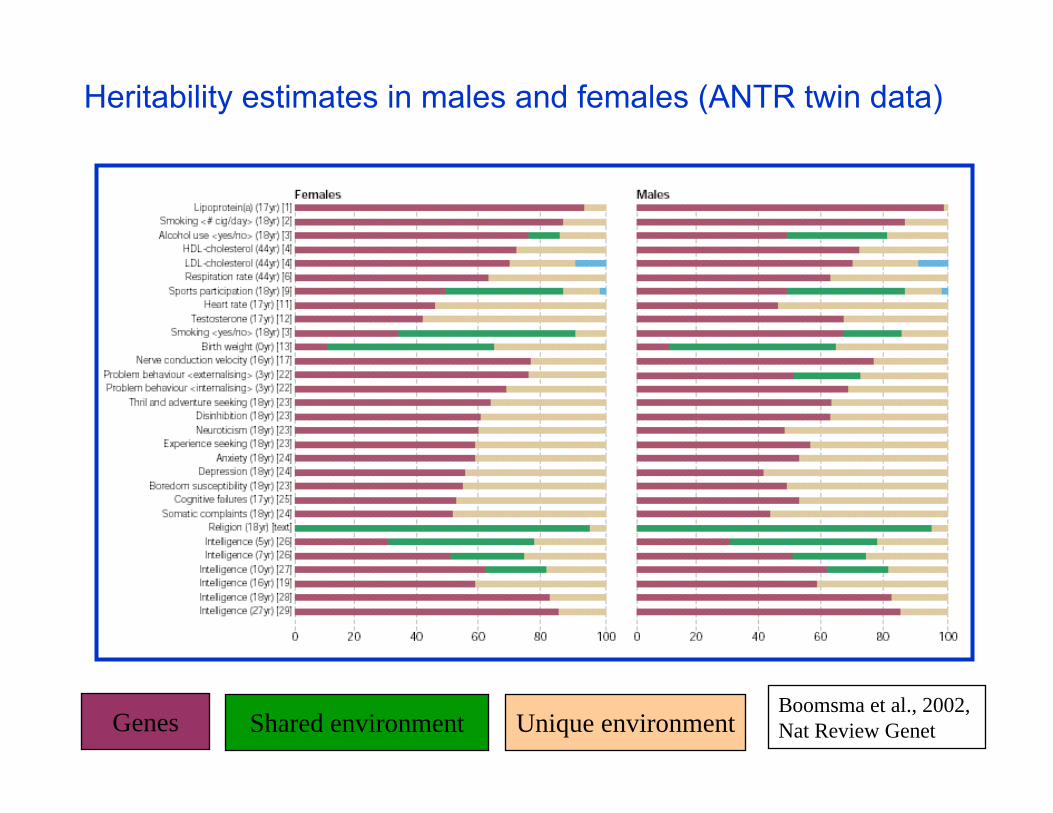
Heritability estimates in males and females (ANTR twin data)
Genes Shared environment Unique environmentBoomsma et al., 2002, Nat Review Genet
3 Stages of Genetic Mapping
Are there genes influencing this trait?Genetic epidemiological studies
Where are those genes?Linkage analysis (look for quantitatve trait loci: QTL)
What are those genes?Association analysis
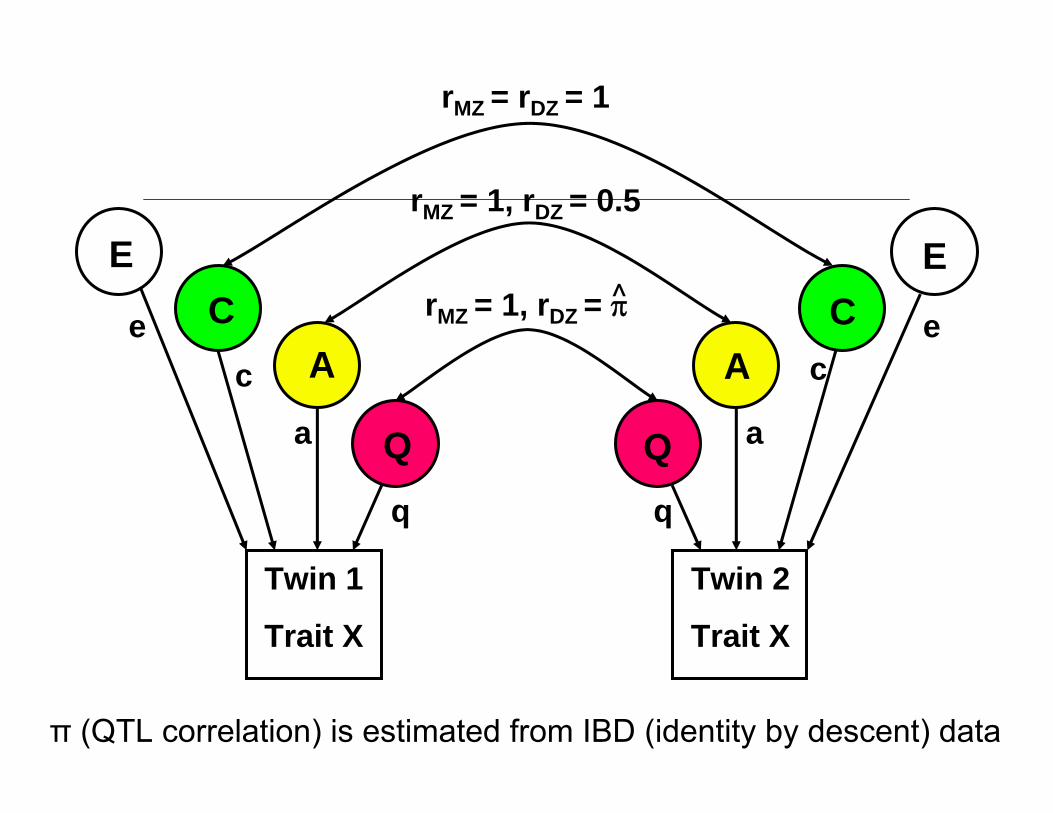
Twin 1
Trait X
Twin 2
Trait X
EC
A
Q Q
AC
ErMZ = 1, rDZ = π̂
rMZ = 1, rDZ = 0.5
rMZ = rDZ = 1
q q
a a
c ce e
π (QTL correlation) is estimated from IBD (identity by descent) data
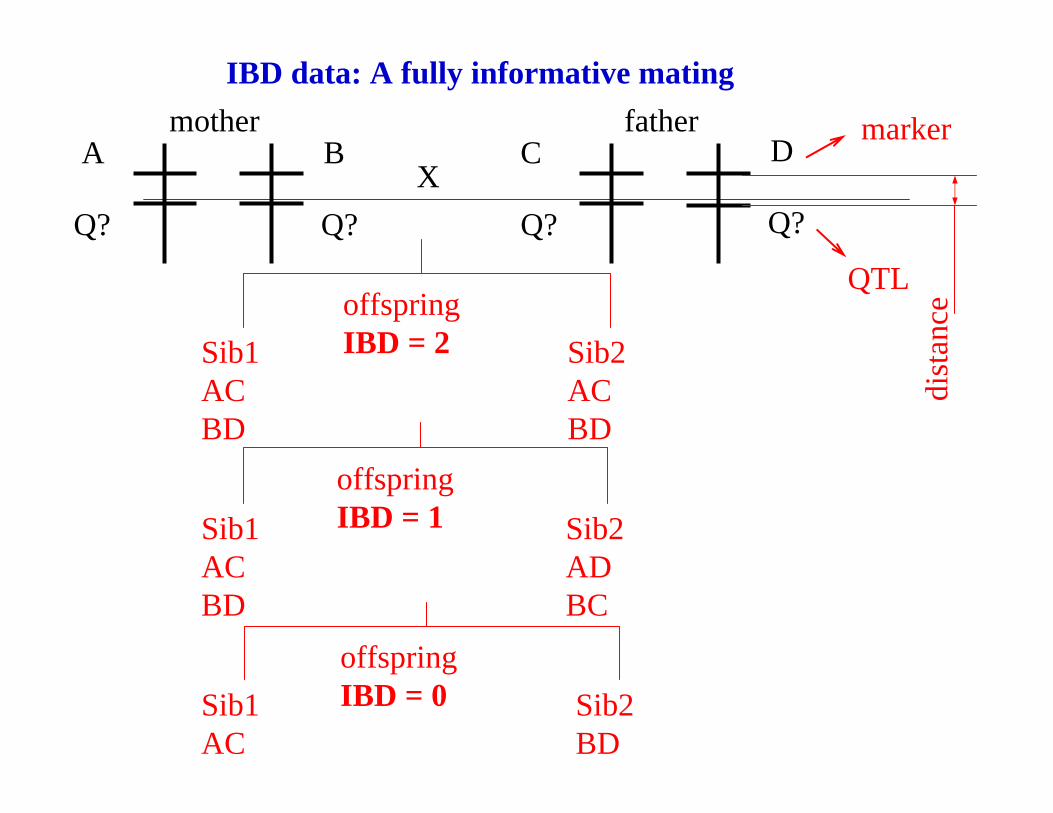
A
Q?
B
Q?X
C
Q?
IBD data: A fully informative matingmother father
offspringIBD = 1Sib1
ACBD
Sib2ADBC
offspringIBD = 0Sib1
ACSib2BD
D
Q?
offspringIBD = 2Sib1
ACBD
Sib2ACBD
QTL
marker
dist
ance

Linkage: tracking anonymous DNA markers close to genes of interest in families / sibling pairs.• “blind” search, low power • new genes, new mechanisms
Genetic association (based on linkage disequilibrium): direct comparison of regulatory and coding sequences in candidate genes (or markers close to candidate genes).• high power, high type I/II error rate • which candidates ?• Genome wide (GWA)
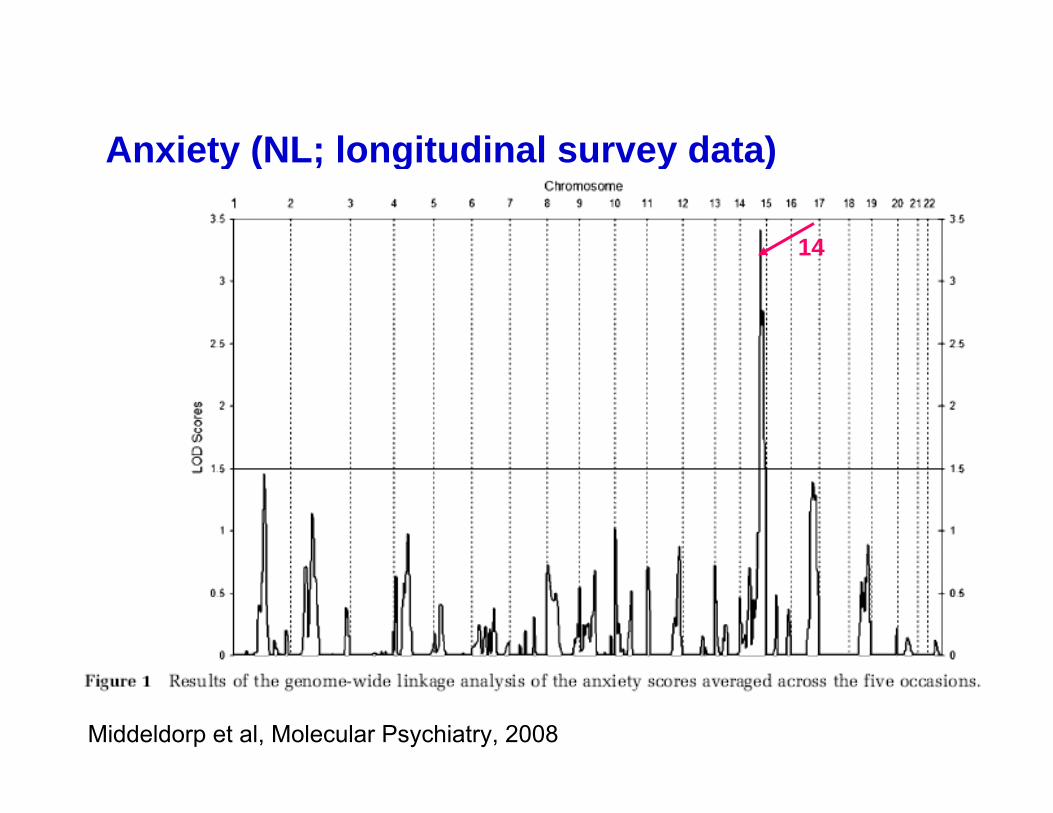
Anxiety (NL; longitudinal survey data)
14
Middeldorp et al, Molecular Psychiatry, 2008
Neuroticism (endophenotype for depression and anxiety) Data from the Netherlands and Australia (Wray et al. (Arch General Psychiatry, in press))
19,635 sibling pairs with data for neuroticism up to five times over a period of up to 22 years.5,424 sib pairs genotyped with microsatellitemarkers; pairs concordant or discordant with respect to extreme neuroticism scores were genotyped preferentially.38% (AU) and 51% (NL) of parents were genotyped.The average distance between markers was 8.2 cM(Australia) and 11 cM (Netherlands). Non-parametric linkage analysis in Merlin-Regress for mean neuroticism score across time.Empirical LOD thresholds for suggestive linkage derived from Merlin – simulate.
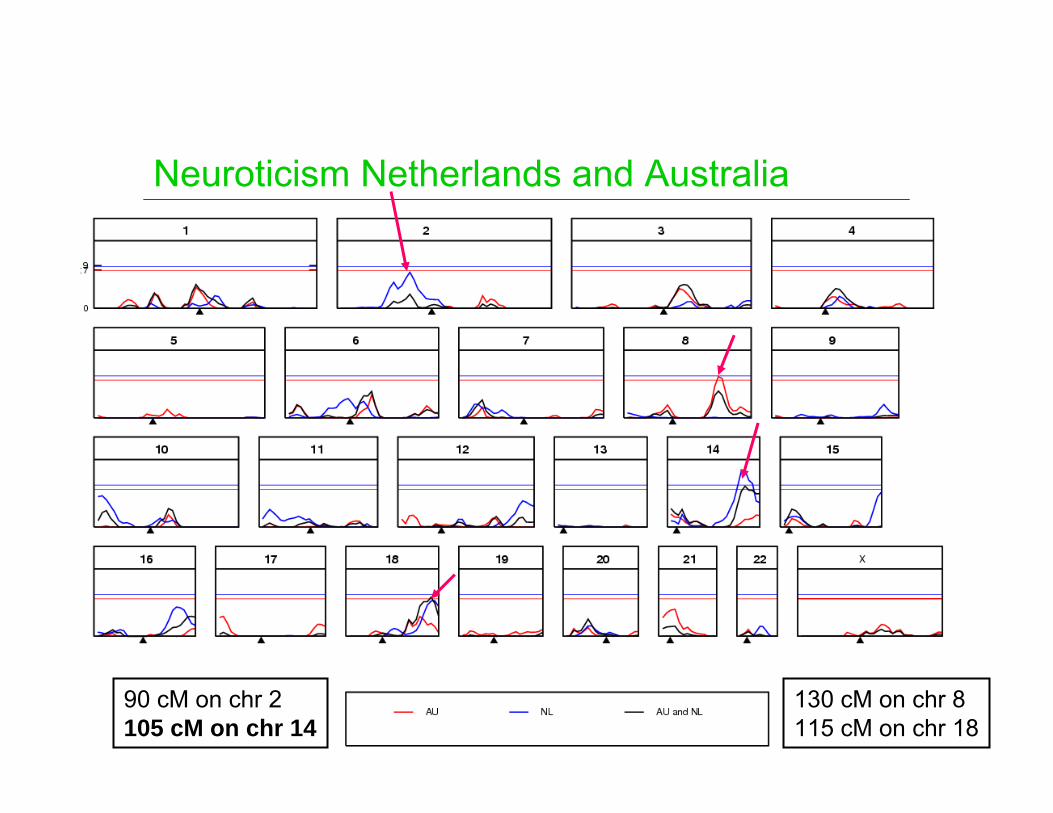
Neuroticism Netherlands and Australia
90 cM on chr 2105 cM on chr 14
130 cM on chr 8115 cM on chr 18
Linkage Analysis
• Models the covariance structure among family members
• Marker sharing between relatives• Identifies large regions
Include several candidates
• Complex disease• Scans on sets of small families popular• No strong assumptions about disease alleles• Low power• Limited resolution
Association
Models “mean” valuesLooks for correlation between specific alleles and a phenotype (quantitative trait value, disease risk) E.g. cases and controls (affected / unaffected)Or high and low scoring Ss
Association
More sensitive to small effectsNeed to “guess” gene/alleles (“candidate gene”) or be close enough for linkage disequilibrium with nearby loci (GWA: Genome Wide Association)May get spurious association (“stratification”) – need to have genetic controls to be convincedMay get too many “positive” results (if the number of tests is large)
Types of Twin Studies I
Classical MZ -DZ comparison:
• age differences in heritability• sex differences in heritability• genotype x environment interaction• causal models• multivariate genetic analyses
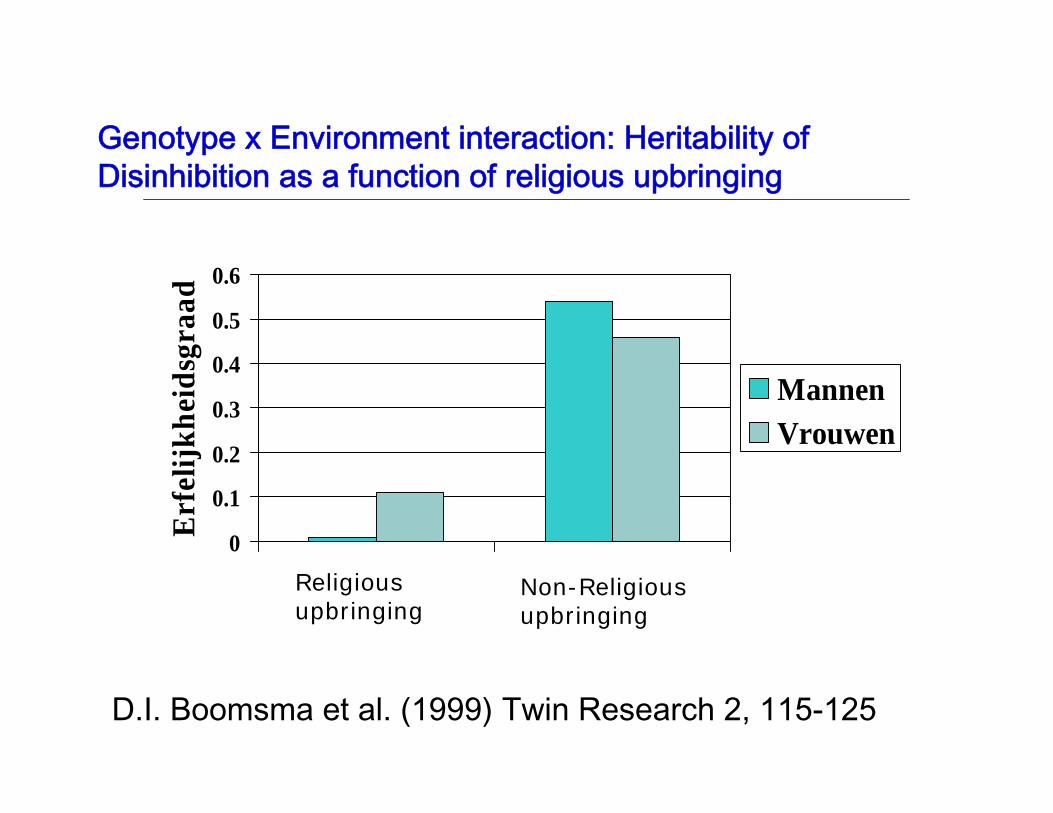
Genotype x Environment interaction: Heritability of Disinhibition as a function of religious upbringing
0
0.1
0.2
0.3
0.4
0.5
0.6
Erf
elijk
heid
sgra
ad
MannenVrouwen
D.I. Boomsma et al. (1999) Twin Research 2, 115-125
Religious upbringing
Non-Religious upbringing
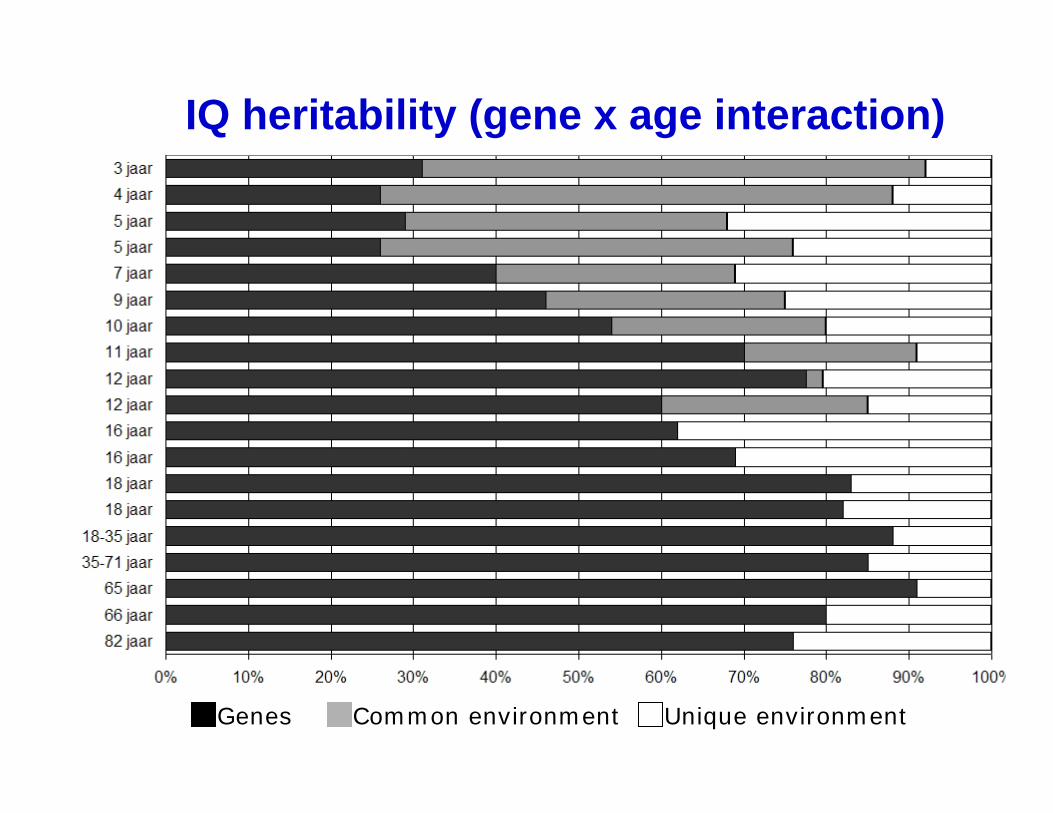
IQ heritability (gene x age interaction)
Genes Common environment Unique environment

VAR 1 VAR 2 VAR 3
G
G G G
E
E E E
Multivariate analysis: Genetic factor model: do the same latent factors influence multiple traits ?
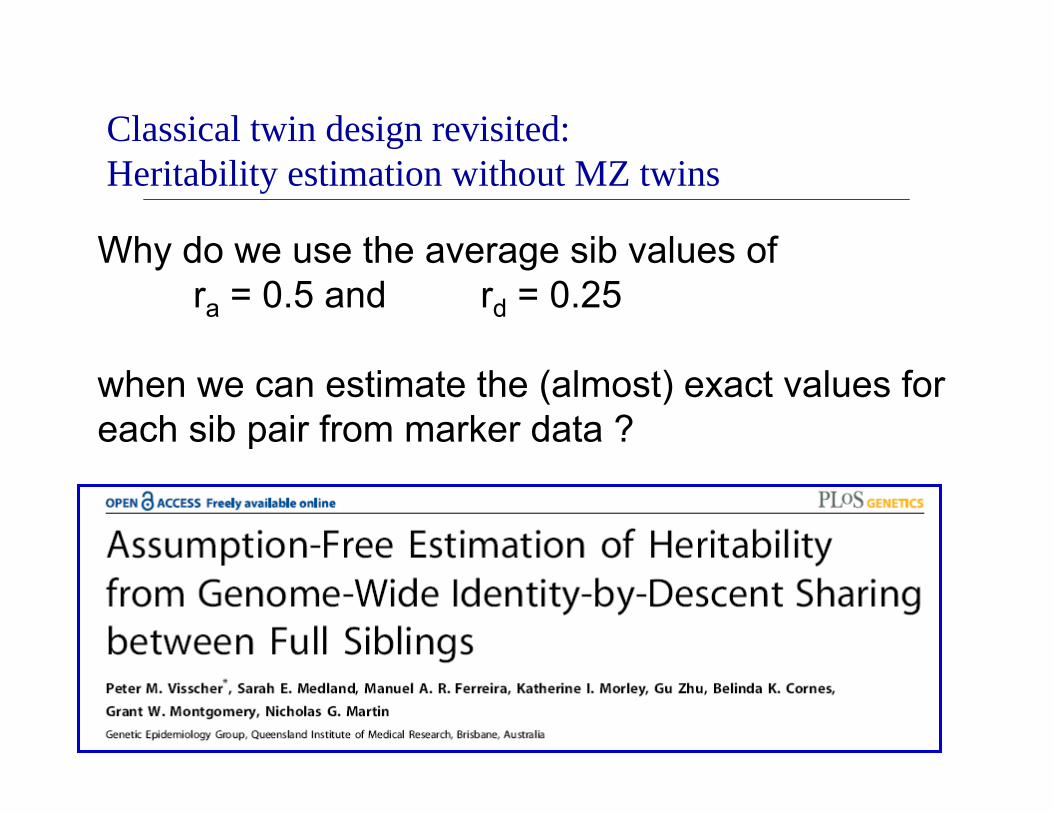
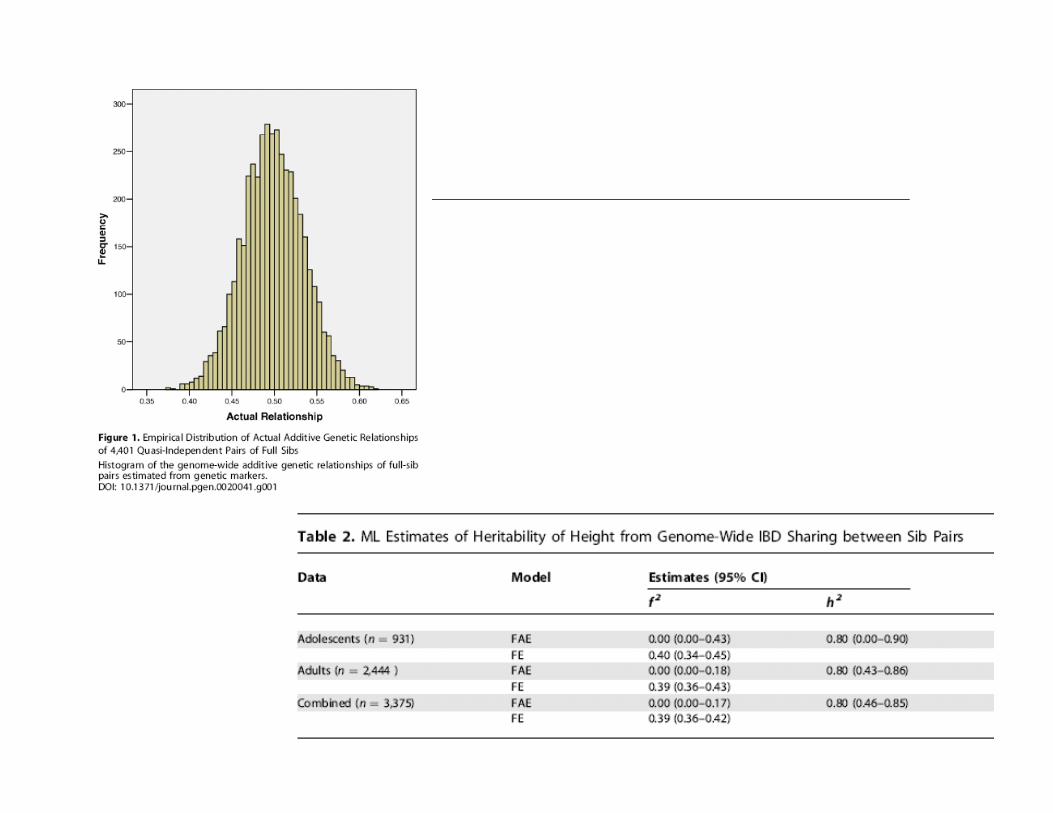
Why do we use the average sib values of ra = 0.5 and rd = 0.25
when we can estimate the (almost) exact values for each sib pair from marker data ?
Classical twin design revisited:Heritability estimation without MZ twins

Types of Twin Studies II
• Co-twin control study• Extended twin study including:
parents: assortative matingcultural transmission
siblings: social interactionMZ offspring: maternal effects
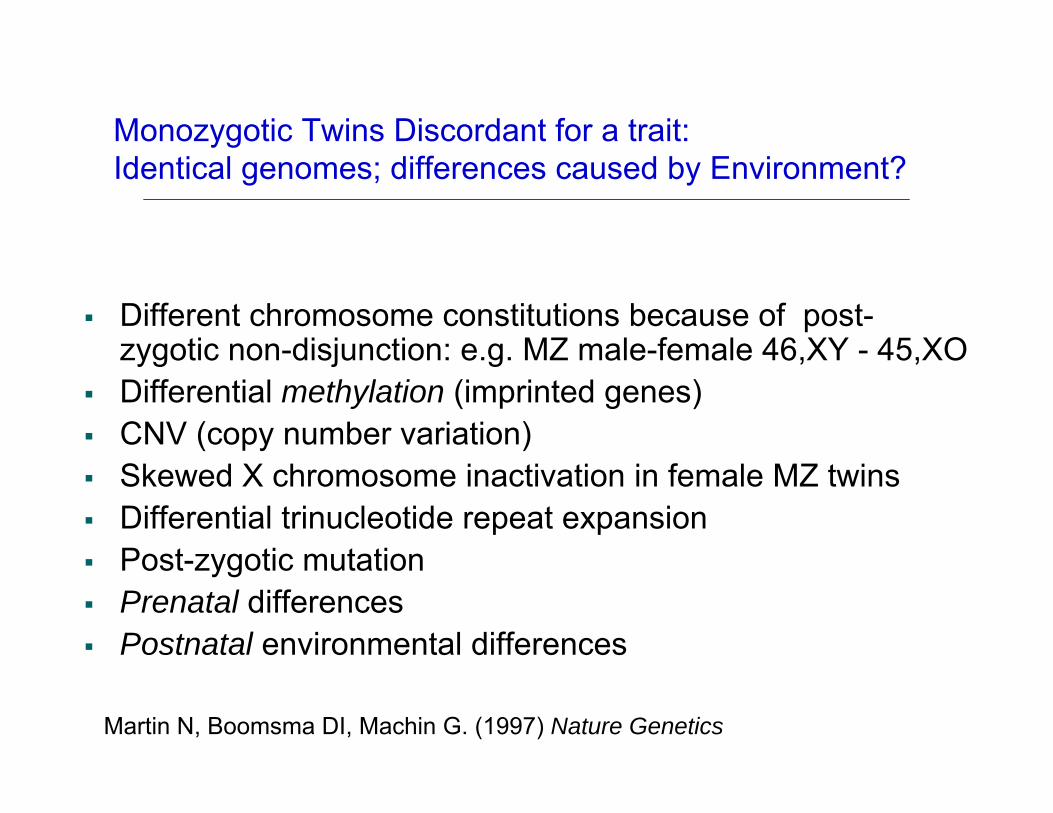
Monozygotic Twins Discordant for a trait: Identical genomes; differences caused by Environment?
Different chromosome constitutions because of post-zygotic non-disjunction: e.g. MZ male-female 46,XY - 45,XODifferential methylation (imprinted genes)CNV (copy number variation)Skewed X chromosome inactivation in female MZ twinsDifferential trinucleotide repeat expansionPost-zygotic mutation Prenatal differencesPostnatal environmental differences
Martin N, Boomsma DI, Machin G. (1997) Nature Genetics
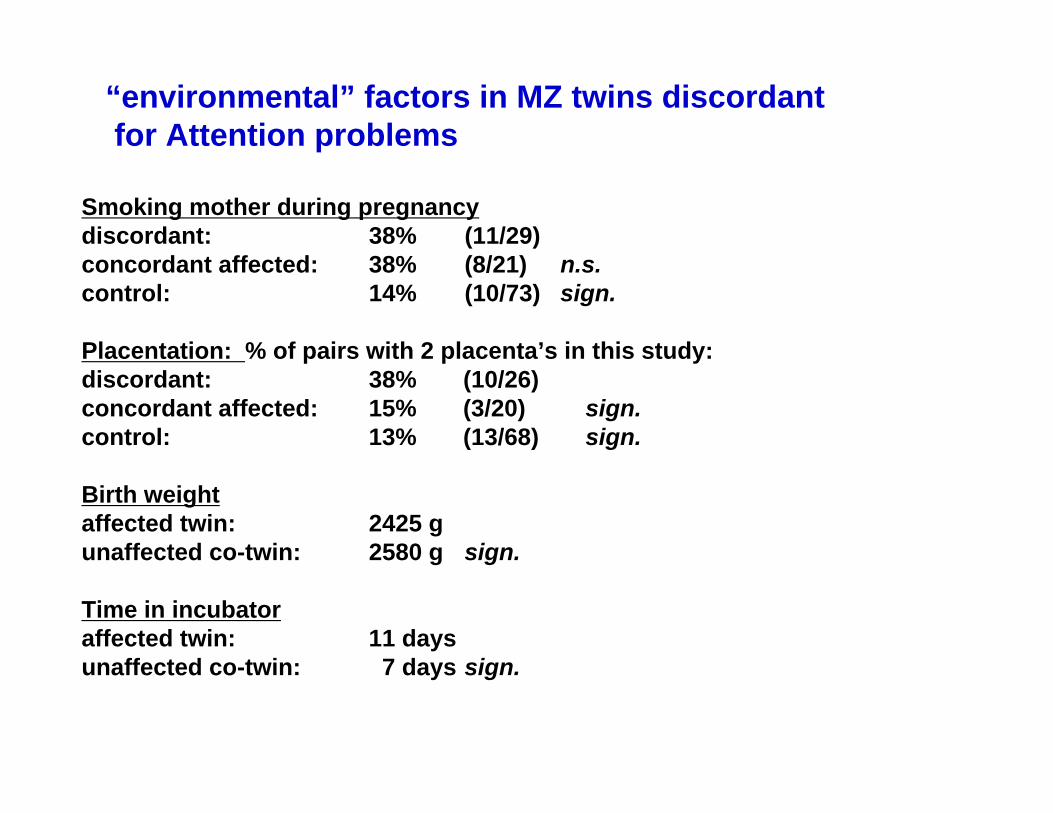
Smoking mother during pregnancydiscordant: 38% (11/29)concordant affected: 38% (8/21) n.s.control: 14% (10/73) sign.
Placentation: % of pairs with 2 placenta’s in this study:discordant: 38% (10/26)concordant affected: 15% (3/20) sign.control: 13% (13/68) sign.
Birth weightaffected twin: 2425 gunaffected co-twin: 2580 g sign.
Time in incubatoraffected twin: 11 daysunaffected co-twin: 7 days sign.
“environmental” factors in MZ twins discordantfor Attention problems

0 10t-value
p<0.001, min 50 voxels
0
0.008
Discordant twin pairs
LH1
LH2
LH3
LH4
LH5
LH6
LH7
LH8
LH9
LH10
0.008Vo
xelin
tensit
y-me
an
fitted modelData
Right parahippocampus
(maximum t =8.08, p < 0.0001 at x=24,y=-34, z=-6 in MNI space)
MZ twins discordant for depression risk:Gray Matter high risk twin < GM low risk twinAP
Right parahippocampus is smaller in the high risk twin from discordant MZ pairs (De Geus et al., 2007)

Types of Twin Studies III
• Genotyping of MZ twins:- to detect variability genes- to estimate penetrance
• Genotyping of DZ twins to detect linkage and association

Gene – environment interaction in GWA
Differences within MZ pairs: (mainly) function of Environmental exposureAre differences within pairs a function of genotype?i.e. is sensitivity to the environment a function of genotype?
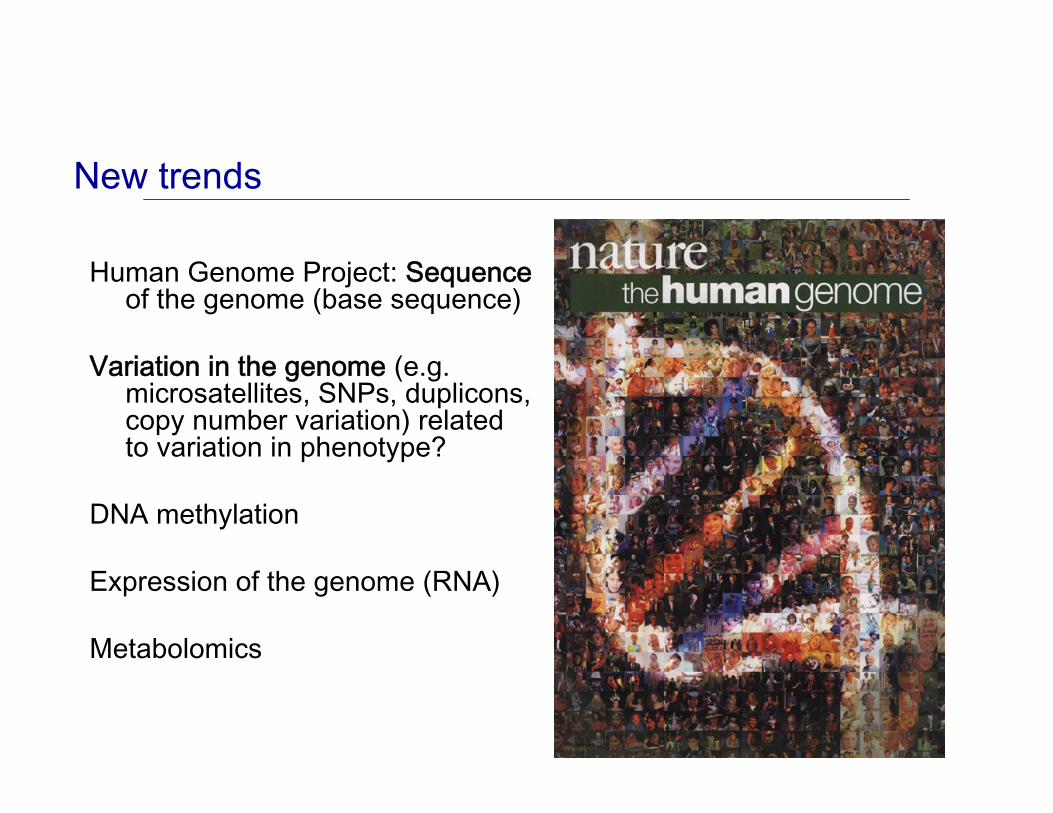
New trends
Human Genome Project: Sequenceof the genome (base sequence)
Variation in the genome (e.g. microsatellites, SNPs, duplicons, copy number variation) related to variation in phenotype?
DNA methylation
Expression of the genome (RNA)
Metabolomics

Co-twin control designDISCORDANCE IN IDENTICAL
TWINS
A role for Epigenetics?
Does epigenetics depend on age?
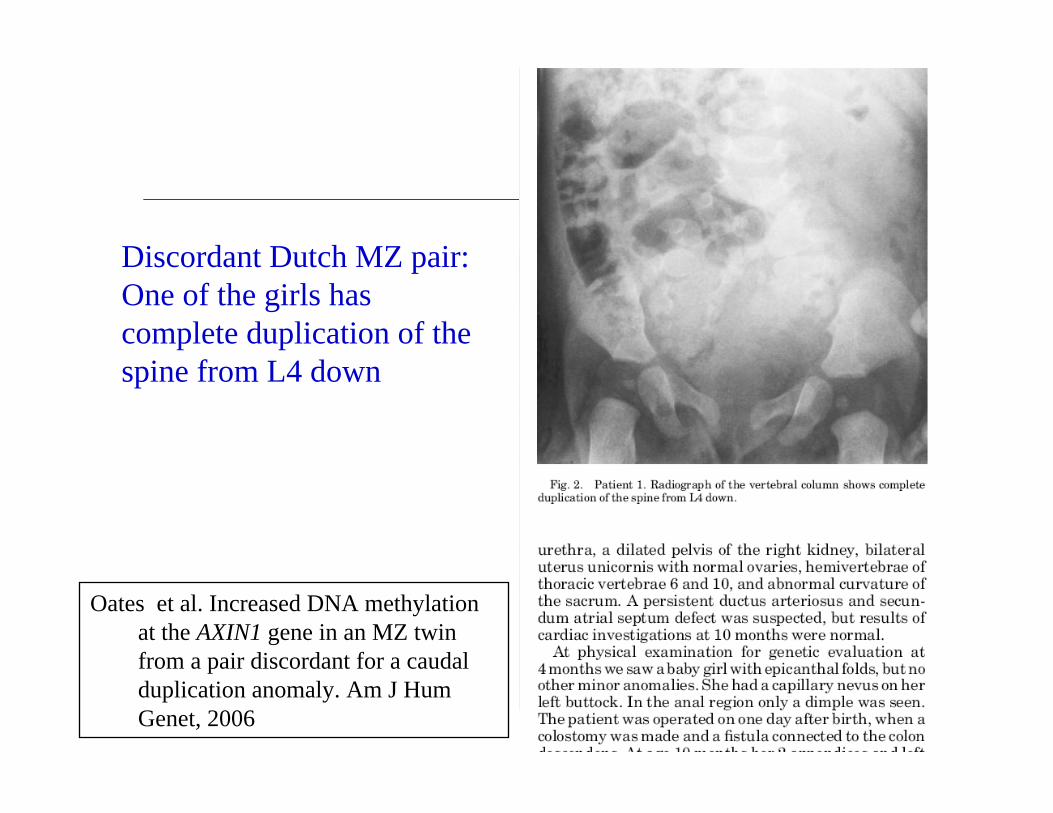
Discordant Dutch MZ pair:One of the girls has complete duplication of the spine from L4 down
Oates et al. Increased DNA methylationat the AXIN1 gene in an MZ twin from a pair discordant for a caudal duplication anomaly. Am J Hum Genet, 2006
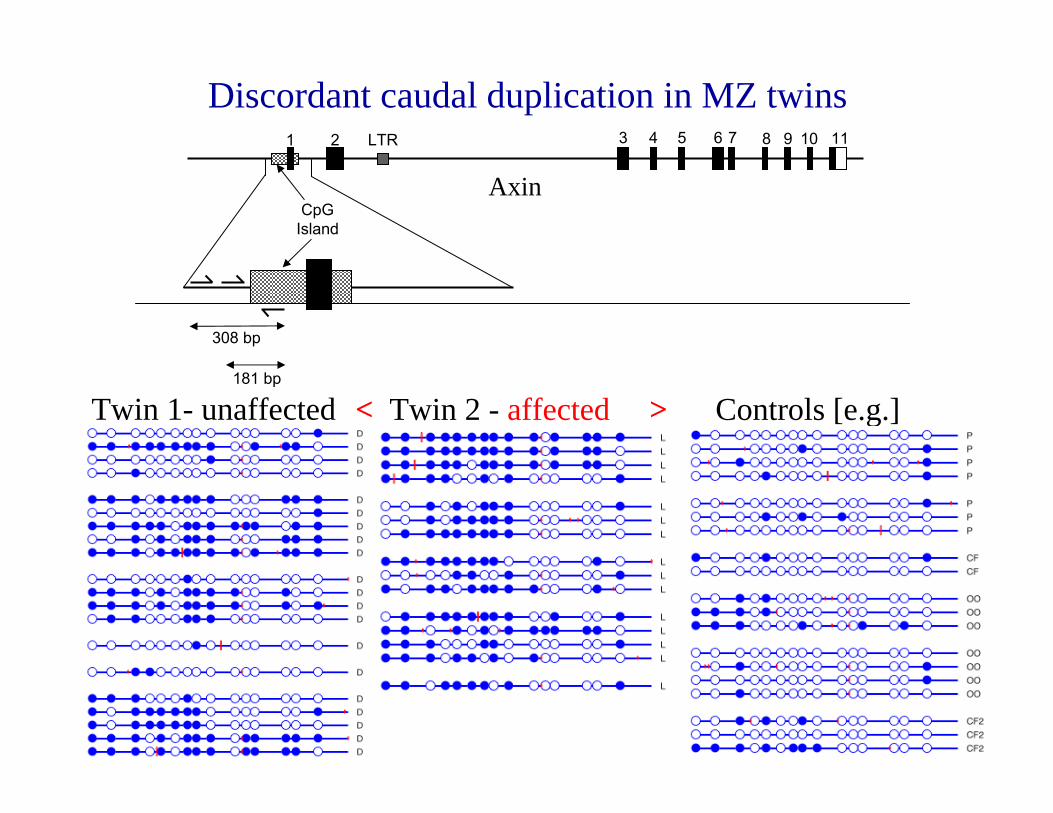
Discordant caudal duplication in MZ twins1 2 3 4 5 6 7 8 9 10 11LTR
CpGIsland
308 bp
181 bp
Axin
Twin 1- unaffected < Twin 2 - affected > Controls [e.g.]


Association of SNPs in the H19 and IGF2/IGF2AS regions and the MTHFR gene with methylation of individual CpGs. Symbols denote –log(p) for the association of individual SNPs with methylation).
@31
@72
@10
5,107
@12
9@
151
@15
8,160
@19
7@
216,2
18@
236
@38
6
@26
@42
@87
@13
6@
278,2
81@
297
-log(
p)
0
5
10
15
20
H19 rs217727H19 rs2839701 H19 rs2251375IGF2 rs680IGF2 rs3213223IGF2 rs3213221IGF2AS rs1003483IGF2AS rs1004446MTHFR rs1801133
p=0.05
H19 IGF2AS
*
**
*
* * ** **
**
rs6
80
rs3
21
32
23
rs3
21
32
21
rs1
00
34
83
rs1
00
44
46
IGF2 IGF2AS

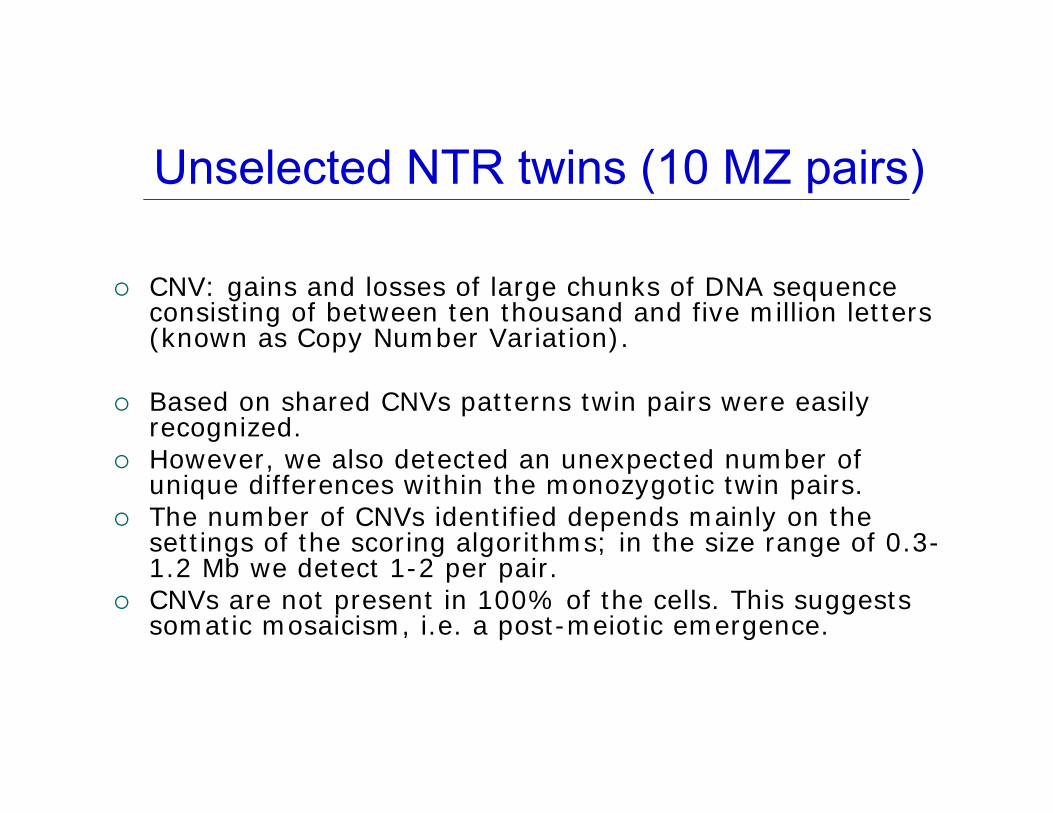
Unselected NTR twins (10 MZ pairs)
CNV: gains and losses of large chunks of DNA sequence consisting of between ten thousand and five million letters (known as Copy Number Variation).
Based on shared CNVs patterns twin pairs were easily recognized. However, we also detected an unexpected number of unique differences within the monozygotic twin pairs.The number of CNVs identified depends mainly on the settings of the scoring algorithms; in the size range of 0.3-1.2 Mb we detect 1-2 per pair.CNVs are not present in 100% of the cells. This suggests somatic mosaicism, i.e. a post-meiotic emergence.
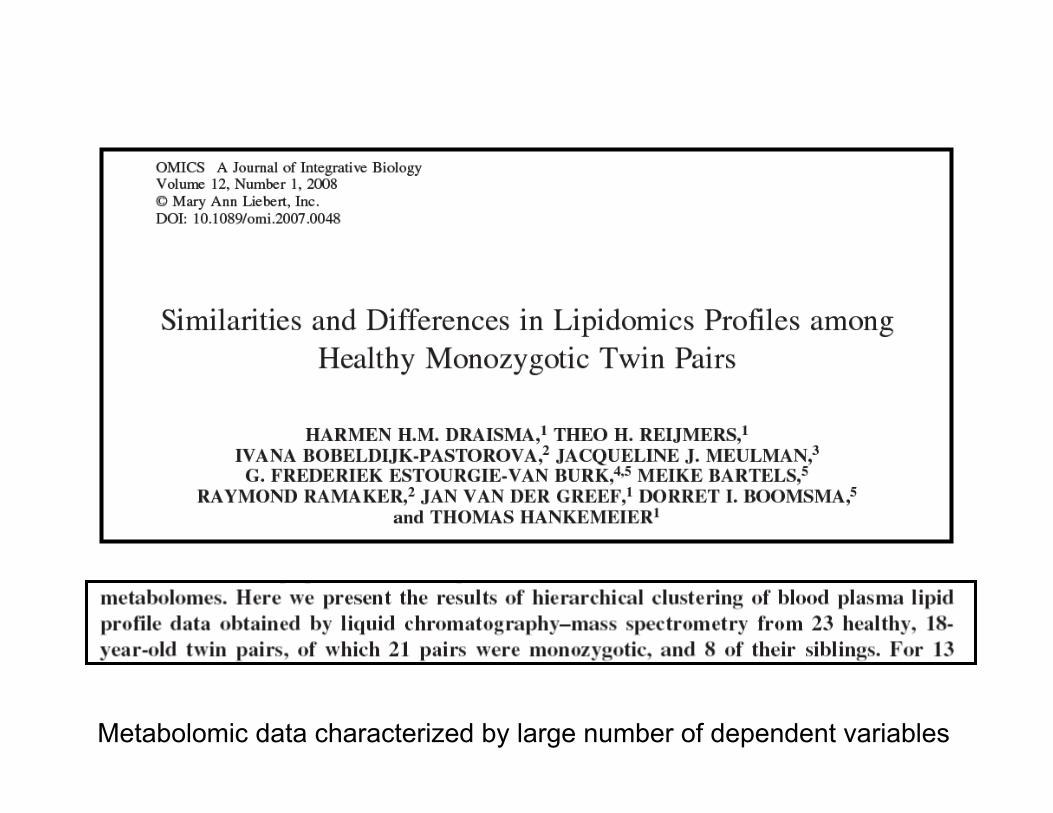
Metabolomic data characterized by large number of dependent variables
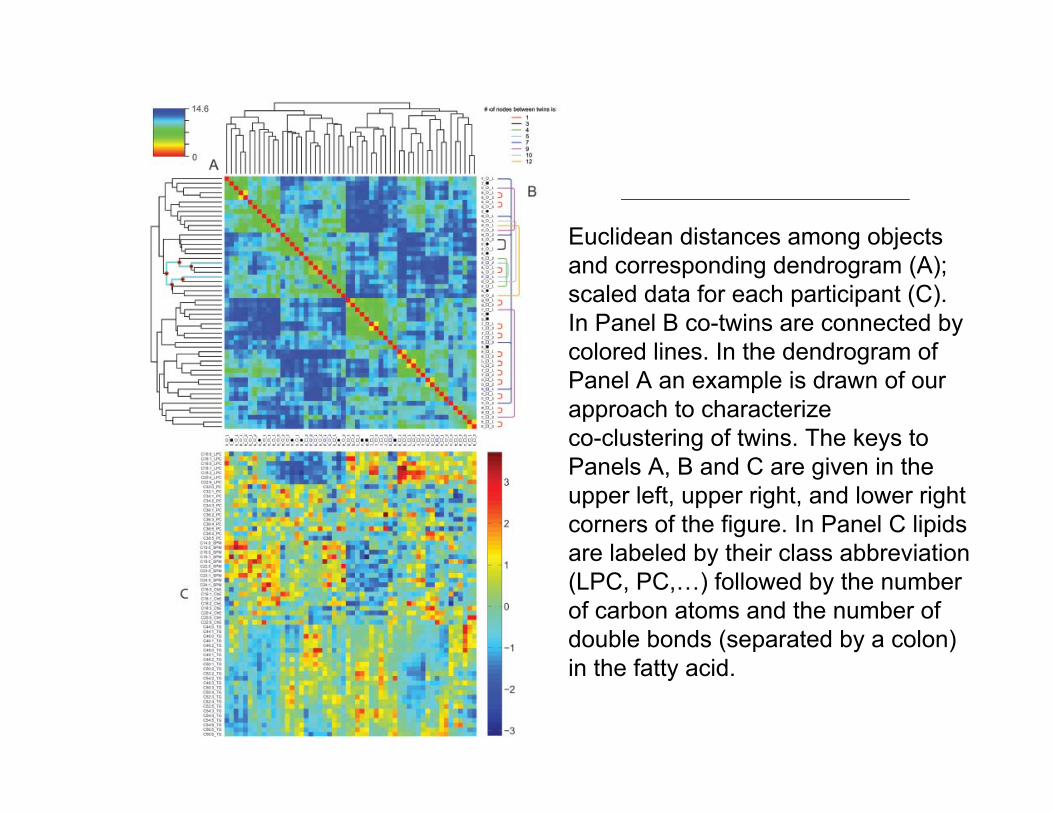
Euclidean distances among objects and corresponding dendrogram (A); scaled data for each participant (C). In Panel B co-twins are connected by colored lines. In the dendrogram of Panel A an example is drawn of our approach to characterize co-clustering of twins. The keys to Panels A, B and C are given in the upper left, upper right, and lower right corners of the figure. In Panel C lipids are labeled by their class abbreviation (LPC, PC,…) followed by the number of carbon atoms and the number of double bonds (separated by a colon) in the fatty acid.
Boulder 2008
Dorret Boomsma, NLStacey Cherny, Hong KongDanielle Dick, USADavid Evans, UKManuel Ferreira, USANathan Gillespie, USAJohn Hewitt, USAMatthew Keller, USAJeff Lessem, USA
Gitta Lubke, USAHermine Maes, USANick Martin, OZSarah Medland, USAKatherine Morley, OZBenjamin Neale, UKMichael Neale, USAIrene Rebollo, NLFruhling Rijsdijk, UKWilliam Valdar, UK