Embed Size (px)
Citation preview
Miscellaneous
Variation in worldwide incidence of
amyotrophic lateral sclerosis: a meta-analysis
Benoıt Marin,1,2,3,4,5,6 Farid Boumediene,1,2,3 Giancarlo Logroscino,5,6
Philippe Couratier,1,2,7 Marie-Claude Babron,8,9
Anne Louise Leutenegger,8,9 Massimilano Copetti,10
Pierre-Marie Preux1,2,3 and Ettore Beghi4,*
1INSERM, U1094, Tropical Neuroepidemiology, Limoges, France, 2Univ. Limoges, UMR_S 1094, Tropical
Neuroepidemiology, Institute of Neuroepidemiology and Tropical Neurology, CNRS FR 3503 GEIST, F-
87000 Limoges, France, 3CHU Limoges, Centre d’Epidemiologie de Biostatistique et de Methodologie de
la Recherche, Limoges, France, 4Laboratorio di Malattie Neurologiche, IRCCS Istituto di Ricerche
Farmacologiche Mario Negri, Milano, Italy, 5Department of Basic Medical Sciences, Neuroscience
and Sense Organs, University of Bari ‘Aldo Moro’, Bari, Italy, 6Unit of Neurodegenerative Diseases,
University of Bari ‘Aldo Moro’, at ‘Pia Fondazione Cardinale G. Panico’, Lecce, Italy, 7CHU Limoges,
Service de Neurologie, Limoges, France, 8INSERM UMR 946, Genetic Variability and Human Diseases,
Paris, France, 9University Paris Diderot, UMR 946, Paris, France and 10Unit of Biostatistics, IRCCS
‘Casa Sollievo della Sofferenza’, San Giovanni Rotondo, Italy
*Corresponding author. Mario Negri IRCCS Institute for Pharmacological Research, Via La Masa 19, 20156 Milano, Italy.
E-mail: [email protected]
Accepted 4 March 2016
Abstract
Background: To assess the worldwide variation of amyotrophic lateral sclerosis (ALS) in-
cidence, we performed a systematic review and meta-analysis of population-based data
published to date.
Methods: We reviewed Medline and Embase up to June 2015 and included all population-
based studies of newly diagnosed ALS cases, using multiple sources for case ascertain-
ment. ALS crude and standardized incidence (on age and sex using the US 2010 popula-
tion) were calculated. Random effect meta-analysis and meta-regression were performed
using the subcontinent as the main study level covariate. Sources of heterogeneity related
to the characteristics of the study population and the study methodology were investigated.
Results: Among 3216 records, 44 studies were selected, covering 45 geographical areas
in 11 sub-continents. A total of 13 146 ALS cases and 825 million person-years of follow-
up (PYFU) were co-nsidered. The overall pooled worldwide crude ALS incidence was at
1.75 (1.55–1.96)/100 000 PYFU; 1.68 (1.50–1.85)/100 000 PYFU after standardization.
Heterogeneity was identified in ALS standardized incidence between North Europe [1.89
(1.46–2.32)/100 000 PYFU] and East Asia [0.83 (0.42–1.24)/100 000 PYFU, China and Japan
P ¼ 0.001] or South Asia [0.73 (0.58–0.89)/100 000/PYFU Iran, P ¼ 0.02]. Conversely,
homogeneous rates have been reported in populations from Europe, North America and
VC The Author 2016. Published by Oxford University Press on behalf of the International Epidemiological Association 57
This is an Open Access article distributed under the terms of the Creative Commons Attribution-NonCommercial-NoDerivs licence (http://creativecommons.org/licenses/by-
nc-nd/4.0/), which permits non-commercial reproduction and distribution of the work, in any medium, provided the original work is not altered or transformed in any way,
and that the work properly cited. For commercial re-use, please contact [email protected]
International Journal of Epidemiology, 2017, 57–74
doi: 10.1093/ije/dyw061
Advance Access Publication Date: 13 May 2016
Original article

New Zealand [pooled ALS standardized incidence of 1.81 (1.66-1.97)/100 000 PYFU for
those areas].
Conclusion: This review confirms a heterogeneous distribution worldwide of ALS, and
sets the scene to sustain a collaborative study involving a wide international consortium
to investigate the link between ancestry, environment and ALS incidence.
Key words: Amyotrophic lateral sclerosis, epidemiology, incidence, ethnic groups
Introduction
Variation in the incidence of amyotrophic lateral sclerosis
(ALS) between geographical areas could support the notion
that genetic factors, especially populations’ ancestries,
along with environmental and lifestyle factors, play a dom-
inant role in the occurrence of the disease.
In 2007, a systematic review argued for a uniform oc-
currence of ALS across populations of European origin
and, by contrast, a lower incidence of ALS among popula-
tions of African, Asian and Amerindian origin.1 It was
nevertheless difficult to draw firm conclusions, as there
was methodological heterogeneity among studies in non-
European populations. Also, both the population-based
and the clinic-based studies were lumped together, render-
ing conclusions even more challenging. These results were
consistent with those of a subsequent systematic review.2
Since then, numerous new incidence or mortality data
have been reported from various parts of the world.3–14 In
addition, considering that in some settings ALS mortality
rates can be considered as valid proxy for ALS inci-
dence rates,15 lower mortality rates of ALS in a mixed
population in Cuba raised the hypothesis that a much
wider variety of and different combinations of at-risk al-
leles lower the overall risk of developing the disease.16
Finally, no formal meta-analyses of ALS incidence have
been performed.
An analysis of worldwide incidence rates may provide
new clues into the role of ancestry and environment in the
occurrence of ALS. We performed a systematic review and
meta-analysis of published data concerning the incidence
of ALS in relation to subcontinents.
Methods
We applied the guidelines for Meta-Analyses and
Systematic Reviews of Observational Studies (MOOSE)17
and followed other specific recommendations for system-
atic reviews and meta-analyses.18 As this review of litera-
ture/meta-analysis did not include ALS patients but only
publications on ALS, informed consent of patients was not
applicable. Approval of an ethics committee was not
applicable.
Definitions
In this study, the disease under consideration was motor
neurone disease (MND), which includes ALS and ALS sub-
types.19 We included only population-based studies. A
population-based study implies using an appropriate meth-
odology, an epidemiological investigation of a sample or
the entire population, within defined geographical and
time boundaries.20 To investigate the worldwide
Key Messages
• Variation of ALS incidence between subcontinents might be related to population ancestries.
• Homogeneous incidence rates have been reported in populations from Europe, North America and New Zealand
(pooled ALS standardized incidence: 1.81 (1.66-1.97)/100 000 PYFU
• Differences were identified in ALS standardized incidence between North Europe [1.89 (1.46-2.32)/100 000 PYFU] and
East Asia [0.83 (0.42-1.24)/100 000 PYFU, China and Japan, P ¼ 0.001] and South Asia [0.73 (0.58-0.89)/100 000/PYFU,
Iran, P ¼ 0.02].
• It is not possible in our study to disentangle the real impact of ancestral origin from lifestyle or environmental
factors.
• An international consortium to perform, with homogeneous methodology, an investigation of the link between ances-
try, environment and ALS, is needed.
58 International Journal of Epidemiology, 2017, Vol. 46, No. 1
heterogeneity of ALS incidence, we considered sub-contin-
ent as our main study-level covariate. Sub-continent classi-
fication was based on the United Nations Statistics
Division.21
Search strategy
Medline and Embase were searched. Period of publication
(until June 2015) and language were unlimited. We did not
use filters as regards species or type of article. Keywords,
defined with a medical librarian, are described in eTable 1
(available as Supplementary data at IJE online). We also
performed hand-searching (reference lists of articles). All
references identified were imported into Endnote X7 and
duplicates were deleted.
Inclusion criteria
Systematic reviews were not included but their references
were examined. Proceedings of conferences were not
included. We included population-based studies of newly
diagnosed ALS cases, using multiple types of sources to en-
sure the highest level of completeness for case ascertain-
ment: (i) ALS referral centres; (ii) hospital discharge data;
(iii) neurologists; (iv) other specialists; (v) health insurance
data; (vi) death certificates; (vii) patients’ associations; and
(viii) primary care physicians. For each study, the number
and type of sources were collected. Appropriate method-
ology was mandatory in terms of definition of the geo-
graphical coverage, study population, investigated period
and diagnostic criteria for ALS cases. Only studies with a
neurological confirmation of the diagnosis were included.
All population-based studies of newly diagnosed ALS
cases were included; nevertheless: (i) when more than one
article was available for the same geographical area, the
one with the longest follow-up and most person-years was
prioritized; (ii) in case of overlap of geographical areas, the
article with the widest geographical coverage was priori-
tized; (iii) and studies from historical ALS foci (Guam
ALS-PDC focus and Wakayama prefecture) were not
included in order to avoid gathering ALS with variants un-
related to sporadic ALS and potentially implying differing
aetiological mechanisms such as toxic exposures, specific
nutritional habits and food and water supplies associated
with toxins.22 Full texts were examined by one author,
who assessed their eligibility. Decision about inclusion was
confirmed by a second author.
Data extraction from included studies
During the collection of data from articles included in the re-
view, we did not calculate a ‘quality score’ as its use has been
criticized for being inaccurate in some cases.18 Instead we
used a checklist, whose components are described below,
based on the basic principles of descriptive epidemiology and
focused on all aspects of the study design that can influence
the quality of case ascertainment and results. The following
data were recorded: investigators, year of publication,
period, location, design, sources of case ascertainment, diag-
nosis criteria, number of patients (male, female), population
understudy (male, female, age structure) and number of cases
by age group and sex. Where not available in the published
material, authors (or their collaborators) were contacted in
order to obtain more information regarding the variables
included in the review. When the attempt to contact the au-
thor failed and the article displayed age and sex-specific inci-
dence in a figure, we performed a graphical reading of the
figure to obtain numerical rates. For each geographical area,
life expectancy at 50 years for men and for women was
retrieved from the demographic yearbook published by the
United Nations at the mid point of the study period.23 For
Libya, we used Egypt life expectancy as proxy due to missing
data, and for Hawaii, data were extracted from the United
States Census Bureau.24 With the help of a geographer, we
accurately identified the geographical area for each study.
We collected Global Positioning System (GPS) coordinates of
the areas in order to create worldwide maps of crude and
standardized incidence.
Data analysis
Crude incidence [number of cases per 100 000 person-years
of follow-up (PYFU)] was re-calculated based on number of
ALS cases, duration of case ascertainment and study popula-
tion extracted from each article. Direct standardizations
were performed on age and sex on the US 2010 popula-
tions.25,26 This reference population was chosen for congru-
ence with usual practices in this field because this is the most
frequently used standard population in ALS. To allow homo-
geneity of reports, we did not exclude any part of the popula-
tion (when authors considered only subjects older than 15 or
18 years of age, we re-included the youngest subjects in the
population under study); 95% confidence intervals (95% CI)
were calculated based on the Poisson distribution.
Meta-analysis was conducted and forest plots were ob-
tained.27 Stratification by subcontinents was performed.
Pooled incidence rates were calculated. Weights were
based on the precision of the incidence estimates for each
study, i.e. the inverse of their standard error assuming a
Poisson distribution. The I2 value was also calculated.28
Because the heterogeneity was statistically significant, ran-
dom effects models were used.
Random effects meta-regression with the DerSimonian
and Laird method29,30 was used to assess sources of
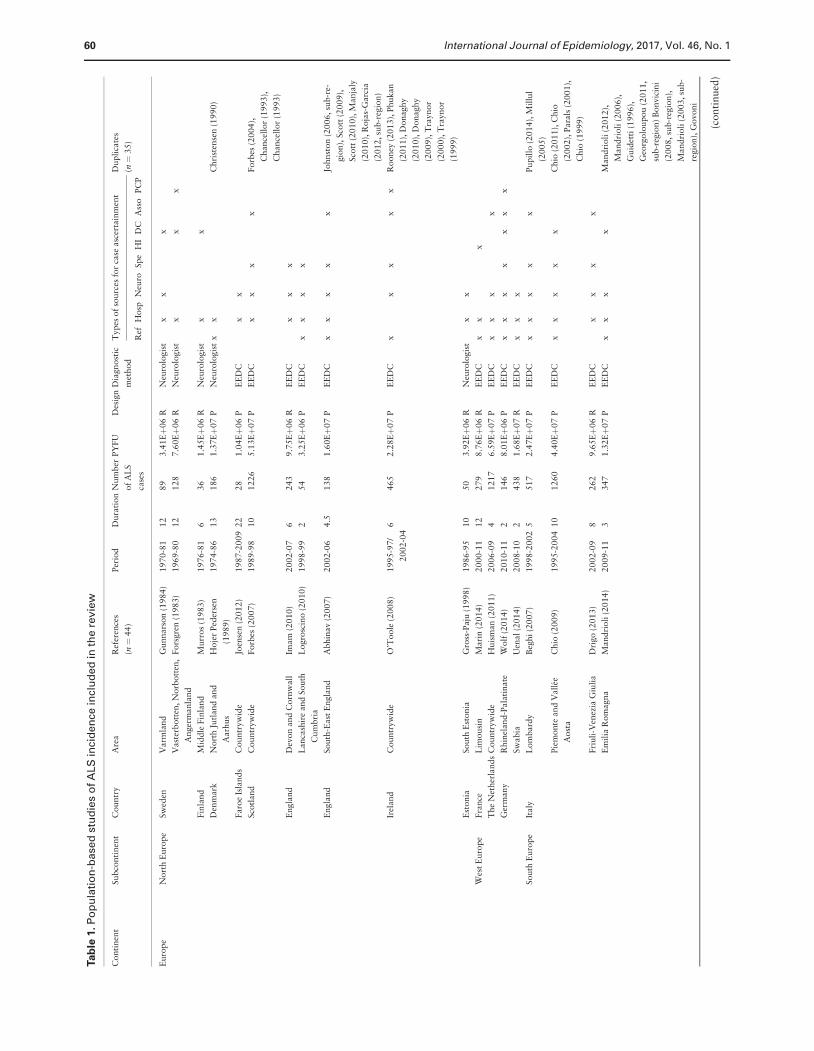
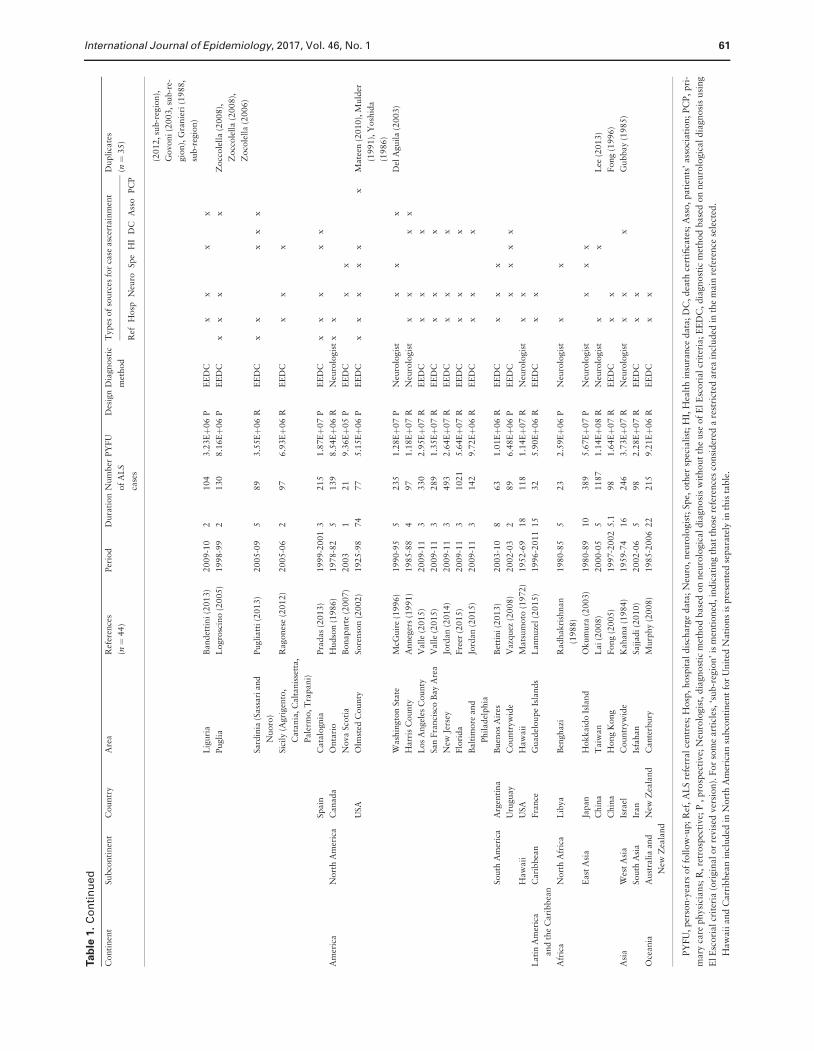
International Journal of Epidemiology, 2017, Vol. 46, No. 1 59
Tab
le1.P
op
ula
tio
n-b
ase
dst
ud
ies
of
AL
Sin
cid
en
cein
clu
de
din
the
rev
iew
Conti
nen
tSubco
nti
nen
tC
ountr
yA
rea
Ref
eren
ces
(n¼
44)
Per
iod
Dura
tion
Num
ber
of
AL
S
case
s
PY
FU
Des
ign
Dia
gnost
ic
met
hod
Types
of
sourc
esfo
rca
seasc
erta
inm
ent
Dupli
cate
s
(n¼
35)
Ref
Hosp
Neu
roSpe
HI
DC
Ass
oPC
P
Euro
pe
Nort
hE
uro
pe
Sw
eden
Varm
land
Gunnars
on
(1984)
1970-8
112
89
3.4
1Eþ
06
RN
euro
logis
tx
xx
Vast
erbott
en,N
orb
ott
en,
Anger
manla
nd
Fors
gre
n(1
983)
1969-8
012
128
7.6
0Eþ
06
RN
euro
logis
tx
xx
Fin
land
Mid
dle
Fin
land
Murr
os
(1983)
1976-8
16
36
1.4
5Eþ
06
RN
euro
logis
tx
x
Den
mar
kN
ort
hJu
tland
and
Aarh
us
Hoje
rPed
erse
n
(1989)
1974-8
613
186
1.3
7Eþ
07
PN
euro
logis
tx
xC
hri
sten
sen
(1990)
Faro
eIs
lands
Countr
yw
ide
Joen
sen
(2012)
1987-2
009
22
28
1.0
4Eþ
06
PE
ED
Cx
x
Sco
tland
Countr
yw
ide
Forb
es(2
007)
1989-9
810
1226
5.1
3Eþ
07
PE
ED
Cx
xx
xForb
es(2
004),
Chance
llor
(1993),
Chance
llor
(1993)
Engla
nd
Dev
on
and
Corn
wal
lIm
am
(2010)
2002-0
76
243
9.7
5Eþ
06
RE
ED
Cx
xx
Lanca
shir
eand
South
Cum
bri
a
Logro
scin
o(2
010)
1998-9
92
54
3.2
5Eþ
06
PE
ED
Cx
xx
x
Engla
nd
South
-East
Engla
nd
Abhin
av
(2007)
2002-0
64.5
138
1.6
0Eþ
07
PE
ED
Cx
xx
xx
Johnst
on
(2006,su
b-r
e-
gio
n),
Sco
tt(2
009),
Sco
tt(2
010),
Manja
ly
(2010),
Roja
s-G
arc
ia
(2012,su
b-r
egio
n)
Irel
and
Countr
yw
ide
O’T
oole
(2008)
1995-9
7/
2002-0
4
6465
2.2
8Eþ
07
PE
ED
Cx
xx
xx
Rooney
(2013),
Phukan
(2011),
Donaghy
(2010),
Donaghy
(2009),
Tra
ynor
(2000),
Tra
ynor
(1999)
Est
onia
South
Est
onia
Gro
ss-P
aju
(1998)
1986-9
510
50
3.9
2Eþ
06
RN
euro
logis
tx
x
Wes
tE
uro
pe
Fra
nce
Lim
ousi
nM
ari
n(2
014)
2000-1
112
279
8.7
6Eþ
06
RE
ED
Cx
xx
The
Net
her
lands
Countr
yw
ide
Huis
man
(2011)
2006-0
94
1217
6.5
9Eþ
07
PE
ED
Cx
xx
x
Ger
many
Rhin
elan
d-P
ala
tinate
Wolf
(2014)
2010-1
12
146
8.0
1Eþ
06
PE
ED
Cx
xx
xx
xx
Sw
abia
Uen
al(2
014)
2008-1
02
438
1.6
8Eþ
07
RE
ED
Cx
xx
South
Euro
pe
Italy
Lom
bard
yB
eghi(2
007)
1998-2
002
5517
2.4
7Eþ
07
PE
ED
Cx
xx
xx
Pupil
lo(2
014),
Mil
lul
(2005)
Pie
monte
and
Vallee
Aost
a
Chio
(2009)
1995-2
004
10
1260
4.4
0Eþ
07
PE
ED
Cx
xx
xx
Chio
(2011),
Chio
(2002),
Para
ls(2
001),
Chio
(1999)
Fri
uli
-Ven
ezia
Giu
lia
Dri
go
(2013)
2002-0
98
262
9.6
5Eþ
06
RE
ED
Cx
xx
x
Em
ilia
Rom
agna
Mandri
oli
(2014)
2009-1
13
347
1.3
2Eþ
07
PE
ED
Cx
xx
xM
andri
oli
(2012),
Mandri
oli
(2006),
Guid
etti
(1996),
Geo
rgolo
upou
(2011,
sub-r
egio
n)
Bonvic
ini
(2008,su
b-r
egio
n),
Mandri
oli
(2003,su
b-
regio
n),
Govo
ni
(conti
nued
)
60 International Journal of Epidemiology, 2017, Vol. 46, No. 1
Tab
le1.
Co
nti
nu
ed
Conti
nen
tSubco
nti
nen
tC
ountr
yA
rea
Ref
eren
ces
(n¼
44)
Per
iod
Dura
tion
Num
ber
of
AL
S
case
s
PY
FU
Des
ign
Dia
gnost
ic
met
hod
Types
of
sourc
esfo
rca
seasc
erta
inm
ent
Dupli
cate
s
(n¼
35)
Ref
Hosp
Neu
roSpe
HI
DC
Ass
oPC
P
(2012,su
b-r
egio
n),
Govoni(2
003,su
b-r
e-
gio
n),
Gra
nie
ri(1
988,
sub-r
egio
n)
Lig
uri
aB
andet
tini(2
013)
2009-1
02
104
3.2
3Eþ
06
PE
ED
Cx
xx
x
Pugli
aL
ogro
scin
o(2
005)
1998-9
92
130
8.1
6Eþ
06
PE
ED
Cx
xx
xZ
occ
ole
lla
(2008),
Zocc
ole
lla
(2008),
Zoco
lell
a(2
006)
Sard
inia
(Sass
ari
and
Nuoro
)
Pugli
att
i(2
013)
2005-0
95
89
3.5
5Eþ
06
RE
ED
Cx
xx
xx
Sic
ily
(Agri
gen
to,
Cata
nia
,C
alt
anis
sett
a,
Pale
rmo,T
rapani)
Ragones
e(2
012)
2005-0
62
97
6.9
3Eþ
06
RE
ED
Cx
xx
Spain
Cata
logn
iaPra
das
(2013)
1999-2
001
3215
1.8
7Eþ
07
PE
ED
Cx
xx
xx
Am
eric
aN
ort
hA
mer
ica
Canada
Onta
rio
Hudso
n(1
986)
1978-8
25
139
8.5
4Eþ
06
RN
euro
logis
tx
x
Nova
Sco
tia
Bonapar
te(2
007)
2003
121
9.3
6Eþ
05
PE
ED
Cx
x
USA
Olm
sted
County
Sore
nso
n(2
002)
1925-9
874
77
5.1
5Eþ
06
PE
ED
Cx
xx
xx
xM
ate
en(2
010),
Muld
er
(1991),
Yosh
ida
(1986)
Wash
ingto
nSta
teM
cGuir
e(1
996)
1990-9
55
235
1.2
8Eþ
07
PN
euro
logis
tx
xx
Del
Aguil
a(2
003)
Harr
isC
ounty
Anneg
ers
(1991)
1985-8
84
97
1.1
8Eþ
07
RN
euro
logis
tx
xx
x
Los
Angel
esC
ounty
Vall
e(2
015)
2009-1
13
330
2.9
5Eþ
07
RE
ED
Cx
xx
San
Fra
nci
sco
Bay
Are
aV
all
e(2
015)
2009-1
13
289
1.3
5Eþ
07
RE
ED
Cx
xx
New
Jers
eyJo
rdan
(2014)
2009-1
13
493
2.6
4Eþ
07
RE
ED
Cx
xx
Flo
rida
Fre
er(2
015)
2009-1
13
1021
5.6
4Eþ
07
RE
ED
Cx
xx
Balt
imore
and
Phil
adel
phia
Jord
an
(2015)
2009-1
13
142
9.7
2Eþ
06
RE
ED
Cx
xx
South
Am
eric
aA
rgen
tina
Buen
os
Air
esB
etti
ni(2
013)
2003-1
08
63
1.0
1Eþ
06
RE
ED
Cx
xx
Uru
guay
Countr
yw
ide
Vazq
uez
(2008)
2002-0
32
89
6.4
8Eþ
06
PE
ED
Cx
xx
x
Haw
aii
USA
Haw
aii
Mats
um
oto
(1972)
1952-6
918
118
1.1
4Eþ
07
RN
euro
logis
tx
x
Lati
nA
mer
ica
and
the
Cari
bbea
n
Cari
bbea
nFra
nce
Guadel
oupe
Isla
nds
Lannuze
l(2
015)
1996-2
011
15
32
5.9
0Eþ
06
RE
ED
Cx
x
Afr
ica
Nort
hA
fric
aL
ibya
Ben
ghaz
iR
adhakri
shnan
(1988)
1980-8
55
23
2.5
9Eþ
06
PN
euro
logis
tx
x
East
Asi
aJa
pan
Hokkaid
oIs
land
Okum
ura
(2003)
1980-8
910
389
5.6
7Eþ
07
PN
euro
logis
tx
xx
Chin
aT
aiw
an
Lai(2
008)
2000-0
55
1187
1.1
4Eþ
08
RN
euro
logis
tx
xL
ee(2
013)
Chin
aH
ong
Kong
Fong
(2005)
1997-2
002
5.1
98
1.6
4Eþ
07
RE
ED
Cx
xFong
(1996)
Asi
aW
est
Asi
aIs
rael
Countr
yw
ide
Kahana
(1984)
1959-7
416
246
3.7
3Eþ
07
RN
euro
logis
tx
xx
Gubbay
(1985)
South
Asi
aIr
an
Isfa
han
Sajj
adi(2
010)
2002-0
65
98
2.2
8Eþ
07
RE
ED
Cx
x
Oce
ania
Aust
rali
aand
New
Zea
land
New
Zea
land
Cante
rbury
Murp
hy
(2008)
1985-2
006
22
215
9.2
1Eþ
06
RE
ED
Cx
x
PY
FU
,per
son-y
ears
of
follow
-up;R
ef,A
LS
refe
rralce
ntr
es;
Hosp
,hosp
ital
dis
charg
edata
;N
euro
,neu
rolo
gis
t;Spe,
oth
ersp
ecia
list
;H
I,H
ealt
hin
sura
nce
data
;D
C,dea
thce
rtifi
cate
s;A
sso,pati
ents
’ass
oci
ati
on;PC
P,pri
-
mary
care
physi
cians;
R,re
trosp
ecti
ve;
P,pro
spec
tive;
Neu
rolo
gis
t,dia
gnost
icm
ethod
base
don
neu
rolo
gic
aldia
gnosi
sw
ithout
the
use
of
ElE
scori
alcr
iter
ia;E
ED
C,dia
gnost
icm
ethod
base
don
neu
rolo
gic
aldia
gnosi
susi
ng
ElE
scori
alcr
iter
ia(o
rigin
alor
revis
edver
sion).
For
som
eart
icle
s,‘s
ub-r
egio
n’is
men
tioned
,in
dic
ati
ng
that
those
refe
rence
sco
nsi
der
eda
rest
rict
edare
ain
cluded
inth
em
ain
refe
rence
sele
cted
.
Haw
aii
and
Carr
ibbea
nin
cluded
inN
ort
hA
mer
ican
subco
nti
nen
tfo
rU
nit
edN
ati
ons
ispre
sente
dse
para
tely
inth
ista
ble
.
International Journal of Epidemiology, 2017, Vol. 46, No. 1 61
heterogeneity. We used sub-continents as the study level
covariate candidate to be the most important source of het-
erogeneity. The referent sub-continent was the one with the
highest number of articles. We considered the following
study level covariates as further sources of heterogeneity: (i)
characteristics of the study population—life expectancy
after 50 years in men and women and sex-ratio (SR) of the
study population; and (ii) methods—study design (prospect-
ive/retrospective), diagnostic criteria [clinical assessment vs
El Escorial original (EEDC)31 or revised (EEDC-R) classifi-
cation],32 duration of the study period, number of PYFU
and period of study. Bubble plots were produced for con-
tinuous study-level covariates. R-squared of the models
were given. Analyses were done using the statistical soft-
ware Stata v11.1 (Stata Corporation, College Station, TX,
USA).
Results
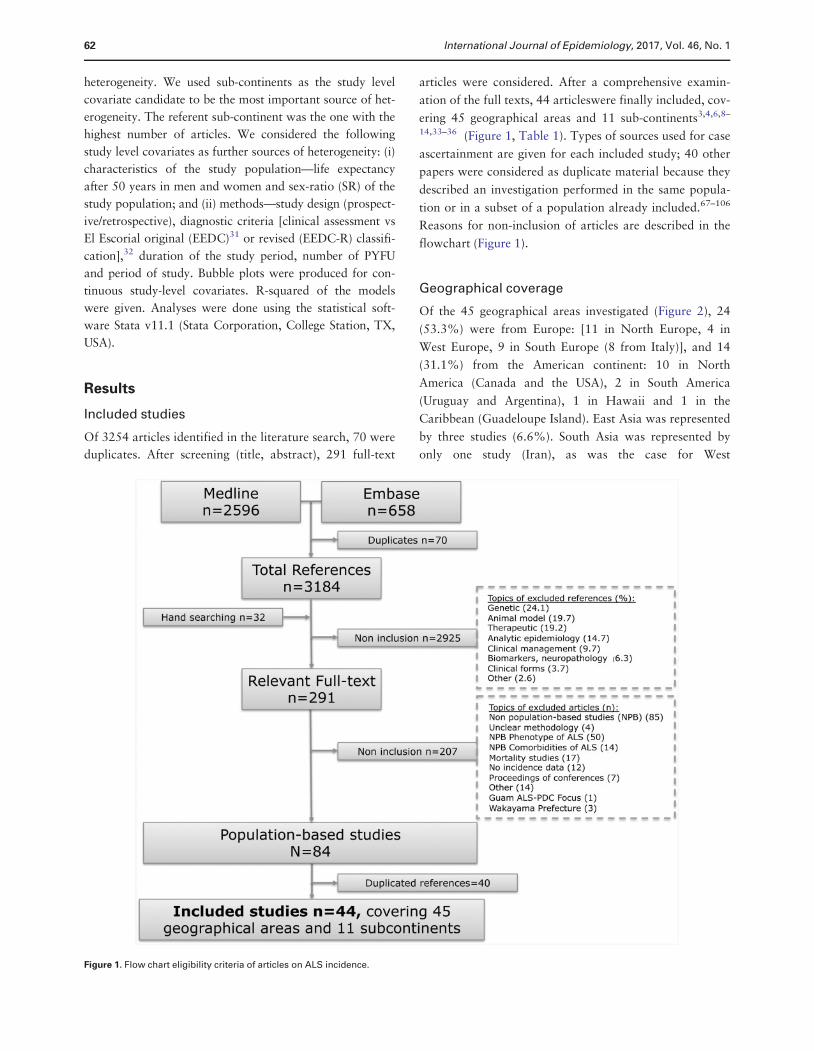
Included studies
Of 3254 articles identified in the literature search, 70 were
duplicates. After screening (title, abstract), 291 full-text
articles were considered. After a comprehensive examin-
ation of the full texts, 44 articleswere finally included, cov-
ering 45 geographical areas and 11 sub-continents3,4,6,8–
14,33–36 (Figure 1, Table 1). Types of sources used for case
ascertainment are given for each included study; 40 other
papers were considered as duplicate material because they
described an investigation performed in the same popula-
tion or in a subset of a population already included.67–106
Reasons for non-inclusion of articles are described in the
flowchart (Figure 1).
Geographical coverage
Of the 45 geographical areas investigated (Figure 2), 24
(53.3%) were from Europe: [11 in North Europe, 4 in
West Europe, 9 in South Europe (8 from Italy)], and 14
(31.1%) from the American continent: 10 in North
America (Canada and the USA), 2 in South America
(Uruguay and Argentina), 1 in Hawaii and 1 in the
Caribbean (Guadeloupe Island). East Asia was represented
by three studies (6.6%). South Asia was represented by
only one study (Iran), as was the case for West
Figure 1. Flow chart eligibility criteria of articles on ALS incidence.
62 International Journal of Epidemiology, 2017, Vol. 46, No. 1
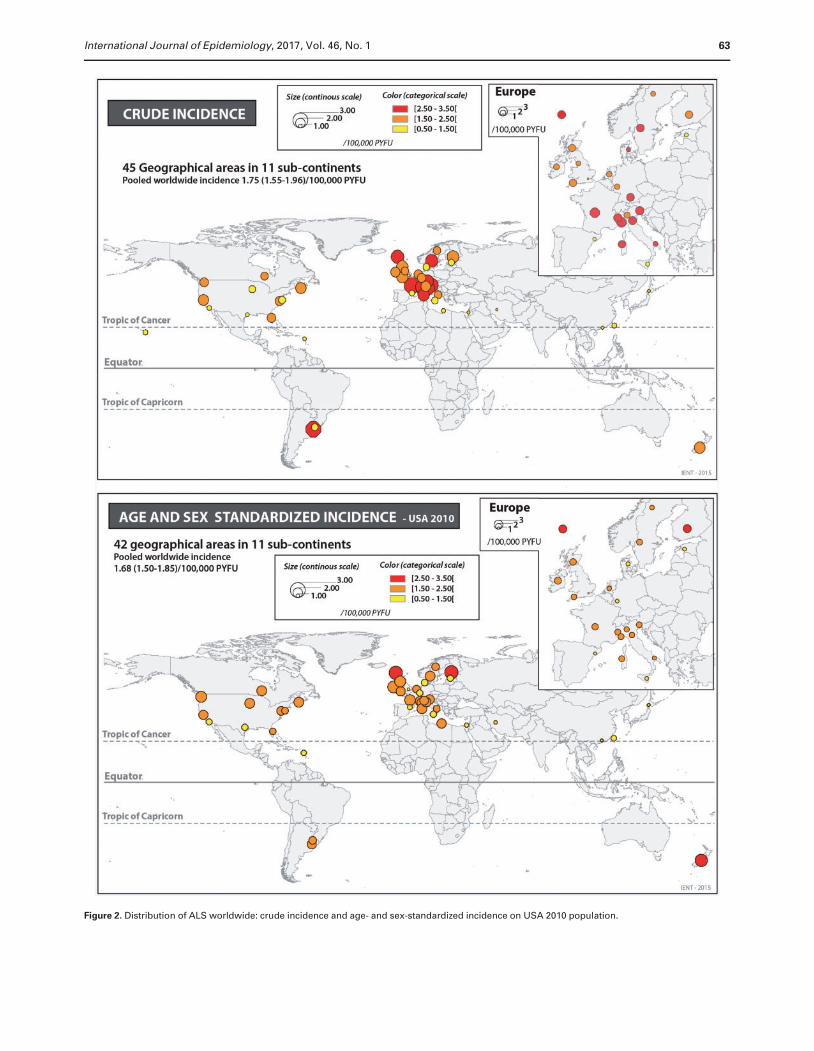
Figure 2. Distribution of ALS worldwide: crude incidence and age- and sex-standardized incidence on USA 2010 population.
International Journal of Epidemiology, 2017, Vol. 46, No. 1 63
Asia (Israel), North Africa (Libya) and Oceania (New
Zealand).
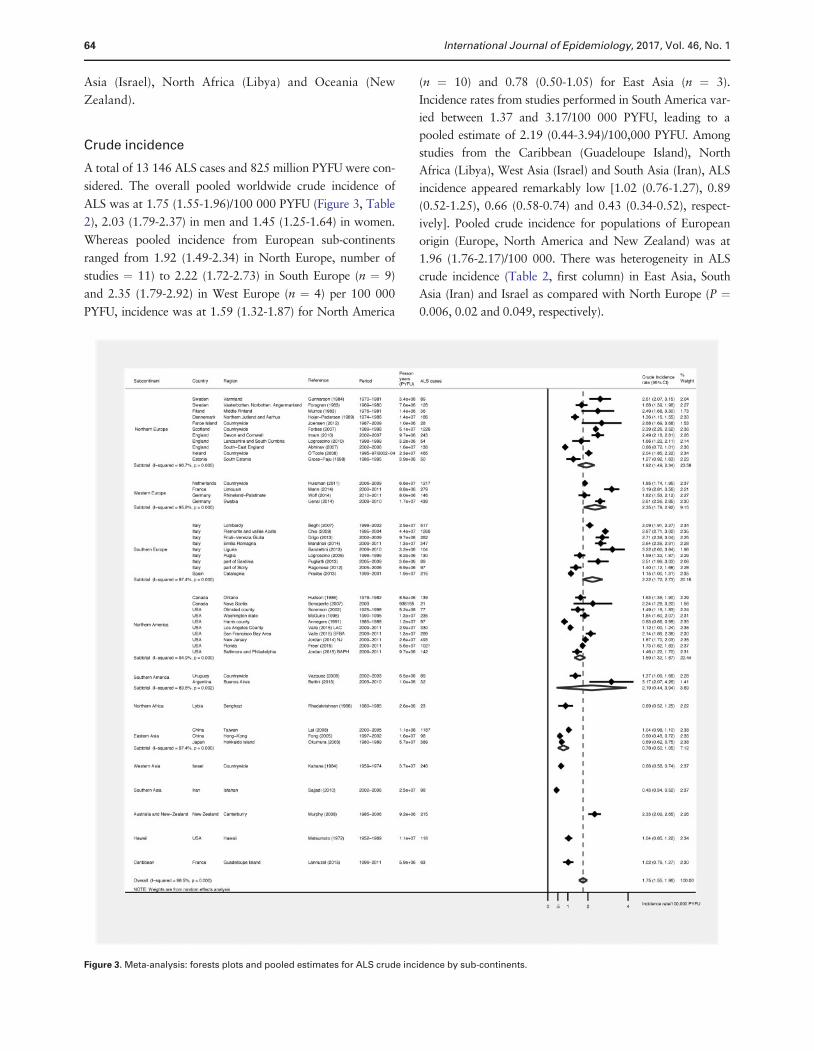
Crude incidence
A total of 13 146 ALS cases and 825 million PYFU were con-
sidered. The overall pooled worldwide crude incidence of
ALS was at 1.75 (1.55-1.96)/100 000 PYFU (Figure 3, Table
2), 2.03 (1.79-2.37) in men and 1.45 (1.25-1.64) in women.
Whereas pooled incidence from European sub-continents
ranged from 1.92 (1.49-2.34) in North Europe, number of
studies ¼ 11) to 2.22 (1.72-2.73) in South Europe (n ¼ 9)
and 2.35 (1.79-2.92) in West Europe (n ¼ 4) per 100 000
PYFU, incidence was at 1.59 (1.32-1.87) for North America
(n ¼ 10) and 0.78 (0.50-1.05) for East Asia (n ¼ 3).
Incidence rates from studies performed in South America var-
ied between 1.37 and 3.17/100 000 PYFU, leading to a
pooled estimate of 2.19 (0.44-3.94)/100,000 PYFU. Among
studies from the Caribbean (Guadeloupe Island), North
Africa (Libya), West Asia (Israel) and South Asia (Iran), ALS
incidence appeared remarkably low [1.02 (0.76-1.27), 0.89
(0.52-1.25), 0.66 (0.58-0.74) and 0.43 (0.34-0.52), respect-
ively]. Pooled crude incidence for populations of European
origin (Europe, North America and New Zealand) was at
1.96 (1.76-2.17)/100 000. There was heterogeneity in ALS
crude incidence (Table 2, first column) in East Asia, South
Asia (Iran) and Israel as compared with North Europe (P ¼0.006, 0.02 and 0.049, respectively).
Figure 3. Meta-analysis: forests plots and pooled estimates for ALS crude incidence by sub-continents.
64 International Journal of Epidemiology, 2017, Vol. 46, No. 1
Age- and sex-standardized incidence
We were able to perform a standardization of ALS incidence
rates on US 2010 population for 42 geographical areas: for
41 areas on age and sex3,4,6,8–14,22,33–64,66–101,107–111 and,
on age only, in one area.65 For the three remaining areas
(Swabia, Lancashire, Hawaii) this was not possible; in these
latter cases, we did not have access to the number of ALS
cases by age and sex groups.9,39,60 Number of cases or
incidence rates of ALS by sex and age groups were available
(present in the article or in supplementary material or pro-
vided on request by authors) for 36 areas.6,8,11–14,35–38,40–
51,54–58,61,63,63,66,100,108,112 For the remaining six articles, a
graphical reading of the figure of age-specific incidence was
performed to obtain rates.4,33,35,52,53,59 The demographic
structure of the study population was fully available in 25
cases,6,8,10–14,37,38,40,41,43–50,55,57,58,61,64,65 and in four
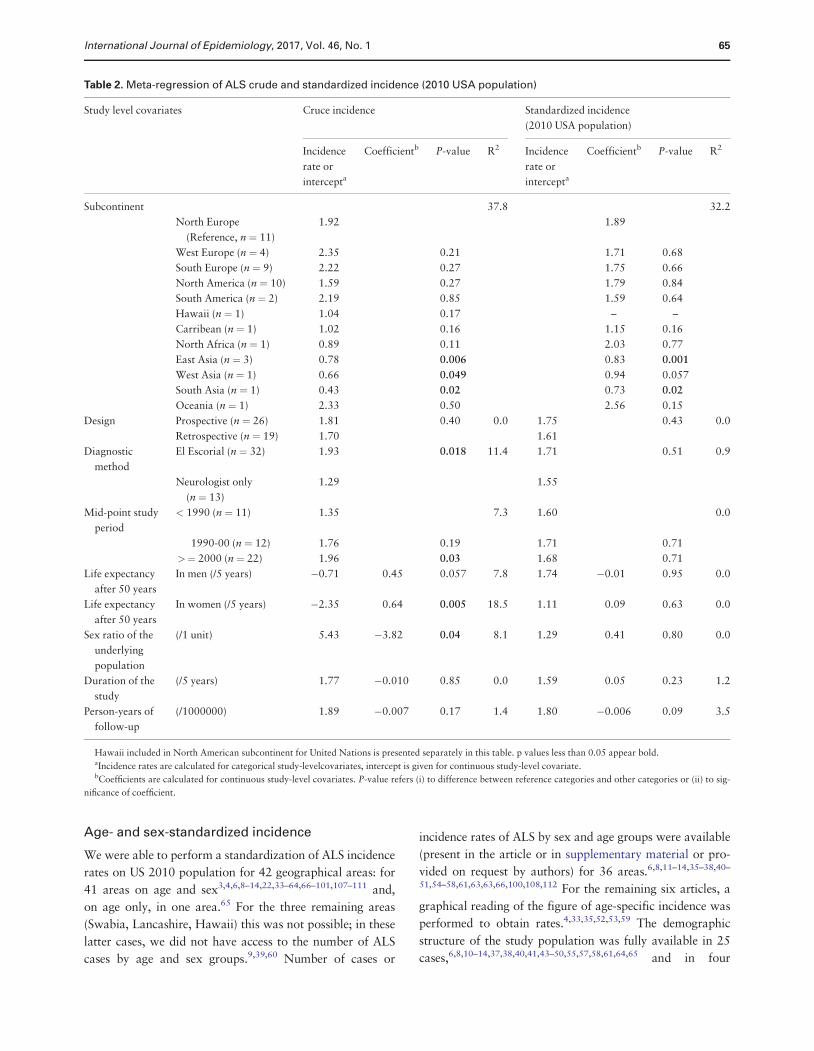
Table 2. Meta-regression of ALS crude and standardized incidence (2010 USA population)
Study level covariates Cruce incidence Standardized incidence
(2010 USA population)
Incidence
rate or
intercepta
Coefficientb P-value R2 Incidence
rate or
intercepta
Coefficientb P-value R2
Subcontinent 37.8 32.2
North Europe
(Reference, n ¼ 11)
1.92 1.89
West Europe (n ¼ 4) 2.35 0.21 1.71 0.68
South Europe (n ¼ 9) 2.22 0.27 1.75 0.66
North America (n ¼ 10) 1.59 0.27 1.79 0.84
South America (n ¼ 2) 2.19 0.85 1.59 0.64
Hawaii (n ¼ 1) 1.04 0.17 – –
Carribean (n ¼ 1) 1.02 0.16 1.15 0.16
North Africa (n ¼ 1) 0.89 0.11 2.03 0.77
East Asia (n ¼ 3) 0.78 0.006 0.83 0.001
West Asia (n ¼ 1) 0.66 0.049 0.94 0.057
South Asia (n ¼ 1) 0.43 0.02 0.73 0.02
Oceania (n ¼ 1) 2.33 0.50 2.56 0.15
Design Prospective (n ¼ 26) 1.81 0.40 0.0 1.75 0.43 0.0
Retrospective (n ¼ 19) 1.70 1.61
Diagnostic
method
El Escorial (n ¼ 32) 1.93 0.018 11.4 1.71 0.51 0.9
Neurologist only
(n ¼ 13)
1.29 1.55
Mid-point study
period
< 1990 (n ¼ 11) 1.35 7.3 1.60 0.0
1990-00 (n ¼ 12) 1.76 0.19 1.71 0.71
>¼ 2000 (n ¼ 22) 1.96 0.03 1.68 0.71
Life expectancy
after 50 years
In men (/5 years) �0.71 0.45 0.057 7.8 1.74 �0.01 0.95 0.0
Life expectancy
after 50 years
In women (/5 years) �2.35 0.64 0.005 18.5 1.11 0.09 0.63 0.0
Sex ratio of the
underlying
population
(/1 unit) 5.43 �3.82 0.04 8.1 1.29 0.41 0.80 0.0
Duration of the
study
(/5 years) 1.77 �0.010 0.85 0.0 1.59 0.05 0.23 1.2
Person-years of
follow-up
(/1000000) 1.89 �0.007 0.17 1.4 1.80 �0.006 0.09 3.5
Hawaii included in North American subcontinent for United Nations is presented separately in this table. p values less than 0.05 appear bold.aIncidence rates are calculated for categorical study-levelcovariates, intercept is given for continuous study-level covariate.bCoefficients are calculated for continuous study-level covariates. P-value refers (i) to difference between reference categories and other categories or (ii) to sig-
nificance of coefficient.
International Journal of Epidemiology, 2017, Vol. 46, No. 1 65
additional studies the number of subjects for the youngest
age groups (0-18) was re-calculated based on national cen-
sus data.3,42,51,66 For the other studies (n ¼ 12), the
structure of the population under study was retrieved from
national demographic databases.4,33–36,52–54,56,59,62,63
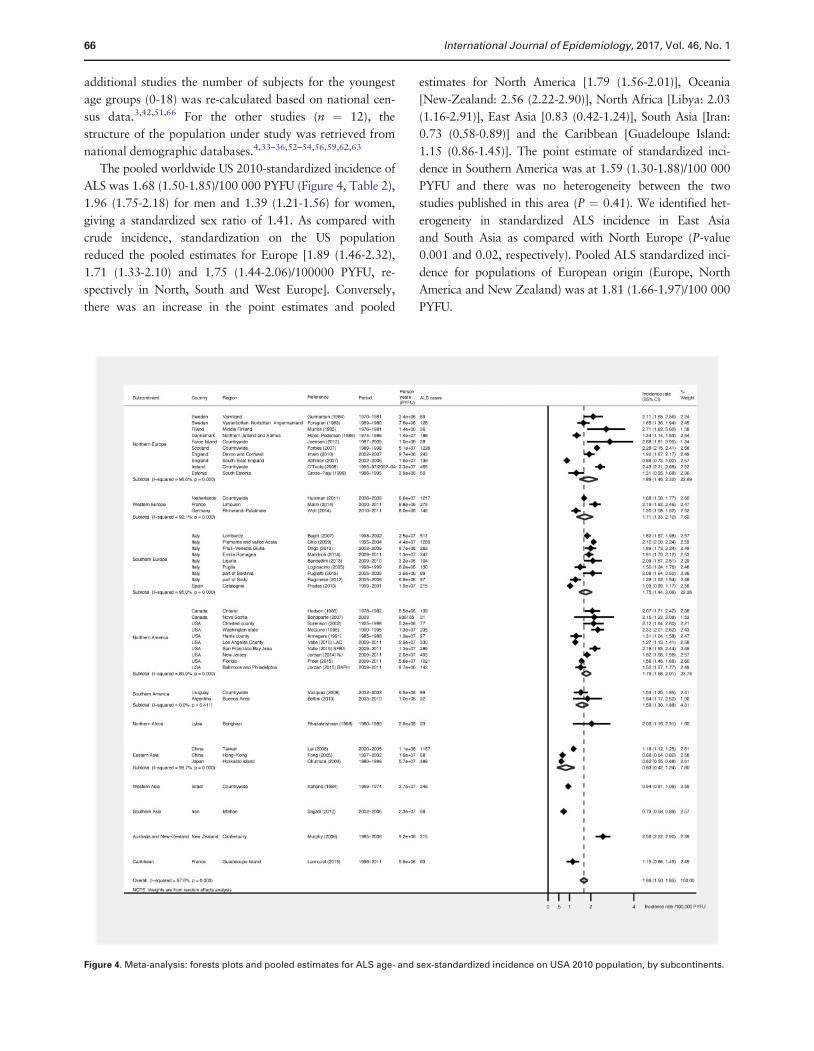
The pooled worldwide US 2010-standardized incidence of
ALS was 1.68 (1.50-1.85)/100 000 PYFU (Figure 4, Table 2),
1.96 (1.75-2.18) for men and 1.39 (1.21-1.56) for women,
giving a standardized sex ratio of 1.41. As compared with
crude incidence, standardization on the US population
reduced the pooled estimates for Europe [1.89 (1.46-2.32),
1.71 (1.33-2.10) and 1.75 (1.44-2.06)/100000 PYFU, re-
spectively in North, South and West Europe]. Conversely,
there was an increase in the point estimates and pooled
estimates for North America [1.79 (1.56-2.01)], Oceania
[New-Zealand: 2.56 (2.22-2.90)], North Africa [Libya: 2.03
(1.16-2.91)], East Asia [0.83 (0.42-1.24)], South Asia [Iran:
0.73 (0.58-0.89)] and the Caribbean [Guadeloupe Island:
1.15 (0.86-1.45)]. The point estimate of standardized inci-
dence in Southern America was at 1.59 (1.30-1.88)/100 000
PYFU and there was no heterogeneity between the two
studies published in this area (P ¼ 0.41). We identified het-
erogeneity in standardized ALS incidence in East Asia
and South Asia as compared with North Europe (P-value
0.001 and 0.02, respectively). Pooled ALS standardized inci-
dence for populations of European origin (Europe, North
America and New Zealand) was at 1.81 (1.66-1.97)/100 000
PYFU.
Figure 4. Meta-analysis: forests plots and pooled estimates for ALS age- and sex-standardized incidence on USA 2010 population, by subcontinents.
66 International Journal of Epidemiology, 2017, Vol. 46, No. 1
Robustness analysis
An additional analysis was performed to explore sources
of heterogeneity related to (i) the characteristics of the
study population and (ii) the study methodology.
Crude incidence.
Using univariable meta-regression, we identified hetero-
geneity (P ¼ 0.018) in ALS crude incidence between stud-
ies that used El Escorial criteria (original or revised
version) for case definition [incidence estimate: 1.93 (1.65-
2.20)/100 000 PYFU] as compared with the neurologist’s
overall judgment [incidence estimate: 1.29 (1.09-1.49)].
Heterogeneity was also identified depending on the
time period of the study, with higher crude incidence
rates for a more recent period of investigation (Table 2,
eFigure 1). An ‘association’ between crude incidence
and life expectancy after 50 years in women (P ¼ 0.005)
was identified (eFigure 1 presents the bubble plots of
these relations, available as Supplementary data at IJE
online).
Standardized incidence.
We did not identify any heterogeneity in standardized
incidence in relation to (i) characteristics of the
study population or (ii) study methodology. Specifically,
we did not identify relevant time trends in standardized
ALS incidence after controlling for age and sex (eFigure
2, P ¼ 0.95, available as Supplementary data at IJE
online).
Discussion
This review is the first to report pooled estimates of ALS
crude and USA-standardized incidence of worldwide popu-
lation-based studies. It emphasizes the heterogeneity be-
tween European ALS incidence and incidence from East
Asia (China, Japan), South Asia (Iran) and West Asia
(Israel). Conversely, there is homogeneity in incidence
among populations from Europe, North America and New
Zealand.
Input of mixed populations
It is not possible in our study to disentangle the real impact
of ancestral origin from lifestyle or environmental factors,
because they are highly associated. In this regard, data
from mixed populations might give useful information.
Such studies allow comparison of incidence rates between
different population subgroups that share, at least par-
tially, the same environment. Table 3 presents ALS inci-
dence data estimated in mixed populations (England,104
USA,55,56,113 Hawaii60 Israel,65 ) or estimated with homo-
geneous methods in different geographical areas (USA,
Japan62).
A recent initiative, using a population-based design,
investigated the racial variations in ALS incidence in three
states (Florida, New Jersey and Texas) and eight metropol-
itan areas (Atlanta, Baltimore, Chicago, Detroit, Las
Vegas, Los Angeles, Philadelphia and San Francisco) of the
USA.113,114 Based on 3819 incident cases identified during
the study period (2009-11), higher crude and standardized
ALS incidences were found in Whites (USA-standardized
incidence 1.48/100 000 PYFU) as compared with African
Americans (0.89) and with Asians (0.78). Based on ethnic
data, a difference was identified between non-Hispanics
(1.36) and Hispanics (0.84). These data are in agreement
with most previous reports on this topic, which showed in
the USA and in the UK a constantly lower point estimate in
non-Whites as compared with Whites.55,56,104 The consist-
ency of the findings would exclude under-ascertainment of
cases as a possible explanation of the differences. Also, a
lower access to health systems for some minorities with
lower socioeconomic status in the USA needs to be dis-
cussed; Whites have traditionally a better access to health
care.115 In this regard in the USA, ALS Asians are less
likely to have a federal payer (e.g. 55.2%) as compared
with White and African Americans (63.3% and 65.2%, re-
spectively).113 The use of self-pay was also higher in
Asians.
Within a given population, a difference in life expect-
ancy between races or ethnic groups might also be impli-
cated in differences of ALS rates. Indeed, a higher
number of old people in some groups (the pool of subjects
most likely to develop ALS) will lead to higher rates if
these are not standardized on race/ethnicity. For
example, Chang et al. showed that healthy life expectancy
in non-Hispanic Whites was 2.6 years higher than in
Hispanics and 7.8 years higher than in non-Hispanic
Blacks.116
In our review, it was not possible to accurately assess
ALS incidence in Africa due to lack of data. Crude inci-
dence in Libya (North Africa) was low [0.89 (0.52-1.25)/
100 000], but after adjustment [2.03 (1.16-2.91)/100 000]
it was in the same range as data from Europe or North
America. Other data from the African continent are needed
to understand more about ALS in this continent.117 Our re-
sults comparing incidence data from Europe and from East
Asia are in favour of a lower incidence in this latter geo-
graphical area. As Eastern Asian studies included in our re-
view are from high-resource areas (Hong Kong, Taiwan,
Japan), an under-ascertainment of ALS cases seems un-
likely. The report by Okumura et al.,62 comparing inci-
dence between Rochester (USA) and Hokkaido
International Journal of Epidemiology, 2017, Vol. 46, No. 1 67

Island (Japan), was also in agreement with ours: i.e. lower
incidence in East Asia as compared with Western
populations.
Additional clues to disentangle genetic and environmen-
tal factors can come from studies on migrants. Chio
et al. 199979 raised the issue of ALS incidence among mi-
grants from South Italy who lived in North Italy.
Authors identified, in comparison with people born in
Piedmont, an increased risk of ALS in migrants from Puglia
(South-East Italy) as well as in men migrating from outside
Italy. This observation was attributed by the authors to an
interaction between environmental and genetic factors or se-
lective migration (people who migrated were of lower
socioeconomic status in their native area and most of them
were farmers: two characteristics supposed to be associated
with an increase in ALS risk).
A clue to a better understanding of ALS incidence
variation
The link between the age structure of the population and
ALS incidence is well known, as age-specific incidence shows
usually a progressive rise with age, with a peak between 65
and 75 years of age followed by a decrease before in men
and then in women.118 We evaluated this link through the
meta-regression of crude incidence, using life expectancy
after 50 years of age as a proxy for the pool of subjects at
risk to develop ALS. This link was identified for crude inci-
dence (P-value 0.005 for life expectancy in women). After
standardization, this association was not confirmed.
In agreement with others,2 we did not identify a correl-
ation between incidence and duration of study, even when
considering the total PYFU. In contrast with others, we did
not identify different incident rates according to the
Table 3. ALS incidence in mixed populations
Continent Subcontinent Reference Period Country Diagnostic
method
Incident cases by
ethnic group, n (%)
Crude incidence
(95% CI)
Standardized
incidence
(95 CI%)
Reference
population for
standardization
Europe North Europe Rojas-Garcia
(2012)
2002-08 England EEDC 88
74 European origin (84.0) 1.97 (1.55-2.48)
14 African origin (16.0) 1.35 (0.72-2.30)
America North America McGuire (1996) 1990-95 USA Neurologist 235 2.11 (1.27-2.93) m
1.87 (1.08-2.66) w
USA 1990
225 White (95.7)
10 non-White (4.3) 0.74 (0.00-1.96) m
0.53 (0.00-1.91) w
America North America Annegers (1991) 1885-1998 USA Neurologist 97 1.27 (0.95-1.69) m
1.03 (0.75-1.38) w
USA 1970
White 1.36 (0.96-1.87) m
1.25 (0.88-1.72) w
Black 1.10 (0.48-2.17) m
0.70 (0.28-1.44) w
Hispanic 1.27 (0.41-2.96) m
0.10 (0.002-0.46) w
America North America Rechtman (2015) 2009-11 USA EEDC 3819 USA 2010
2896 White (75.8) 1.79 1.48 (1.42-1.53)
319 African American (8.4) 0.80 0.89 (0.79-0.99)
127 Asian (3.3) 0.76 0.78 (0.64-0.92)
477 Not reported (12.5)
2957 Non-Hispanic (77.4) 1.65 1.36 (1.31-1.41)
407 Hispanic (10.6) 0.57 0.84 (0.75-0.92)
455 Not reported (12.6)
America North America Matsumoto
(1972)
1952-69 Hawaii Neurologist 118 Hawai 1970
23 Caucasian (19.5) 0.63 0.82
31 Japanese (26.4) 0.85 0.86
42 Filipino (35.6) 3.38 1.56
7 Part-Hawaian (5.9) 0.82 1.21
5 Hawaian (4.2)
7 Chinese (5.9)
2 Korean (1.7)
1 Samoan (0.8)
Asia West Asia Kahana (1976) 1960-70 Israel Neurologist 142
96 European (67.0) 0.72 USA 1970
38 African Asian (26.8) 0.60
7 Israeli (4.9) 0.65
1 origin unknown (0.7)
Okumura (2003) Neurologist 401
America North America 1952-91 USA 46 USA (Rochester) (11.5) 2.30
Asia East Asia 1980-89 Japan 355 Japan (Hokkaido) (88.5) 0.60
M, men; na, not available; w, women; EEDC: El Escorial Diagnosis Criteria; na: non available; 95%CI: 95% confidence interval.
68 International Journal of Epidemiology, 2017, Vol. 46, No. 1
modalities of data collection (prospective or retrospective).
Previous reviews identified lower incidence in retrospective
studies.1,2 However, those reviews considered not only
population-based studies with multi-source cases ascertain-
ment but also clinic-based data.
Our data show that, with time, there was an increase in
crude incidence but not in standardized incidence. This
pattern could be explained, at least partially, by the evolu-
tion of the age structure of the populations at risk (which
aged especially in the North American continent and in
Europe in the past 50 years).
A clue for health care organization
An accurate calculation of synthesized indicators of ALS
incidence for various geographical areas allows the estima-
tion of the number of new cases by year with good preci-
sion. As the burden of the disease on personal, societal
and economic grounds is high, our study can give a better
outline of the needs for research and health care organiza-
tion. Using populations25 and pooled crude incidences esti-
mates, the numbers of incident cases by year are expected
to be around 5500 in the North American continent, 9900
in Europe (summing North, South and West Europe) and
12 300 in East Asia.
Strengths
The main strength of this work relies on the material that
was used (population-based studies using multiple sources
of case ascertainment). The population-based approach
has been consistently shown to be the best suited to de-
scribe the entire spectrum of the ALS incidence and pheno-
type.118,119 The literature search was broad, without
limitations in terms of dates of publication or language,
and exhaustive. The ability to perform systematic stand-
ardization of ALS incidence with such a wide panel of
data, in line with guidelines on meta-analysis of observa-
tional studies17 and recommendations regarding the meta-
analysis of incidence studies in neuroepidemiology,18 is
without antecedents. We assessed the impact of study
methodology and other characteristics (including markers
of study quality, i.e diagnostic method, design) and con-
firmed the robustness of our results.
Limitations
First, as previously mentioned,2 the main body of literature
on ALS epidemiology is large but limited geographically.
This is especially true for population-based investigations.
Most research has been conducted in Europe (53.3% of
studies) or more globally in populations of Caucasian
origin (77.7%, including Europe, North America, New
Zealand).
Second, some methodological requirements chosen dur-
ing the preparation of the study protocol might have influ-
enced our results. The inclusion in four cases, for
homogeneity purposes, of the population aged lower than
15 or 18 years might have diluted the ALS rates.3,42,51,66
The graphical reading of ALS age-specific rates in some
cases4,33,34,52,53,59 might have also influenced the results.
Nevertheless: (i) the number of cases given in the article
and the total number of cases calculated using age-specific
rates were highly concordant and (ii) we were able to verify
an excellent agreement between our graphical reading and
rates that were available in the supplementary web-only
material of one study.42
Third, another important limitation is the variability of
study designs, populations at risk and settings. We did our
best to exclude studies of low quality and we explored
sources of heterogeneity related to the design, diagnostic
method, time period, population size and life expectancy,
and study duration. Nevertheless, we cannot exclude the
possibility that some differences are due at least in part to
the lack of comparability of the reports included in this re-
view. Differences in health care system organization and
access to health care could be also implicated. A differen-
tial referral even within the population-based setting can-
not be excluded for some categories, i.e. elderly, women
and minorities.119,120
Fourth, the criteria for the diagnosis of ALS (clinical as-
sessment versus El Escorial criteria), the evolution with
time of El Escorial criteria (original vs revised) and the El
Escorial categories included might be implicated in the het-
erogeneity of ALS incidence. The real impact of these
methodological differences is difficult to estimate. For ex-
ample, studies based on the original EEDC included all cat-
egories of ALS (Definite, Probable, Possible, Suspected),
n ¼ 12,3,39,40,42–45,48,51,53,66 or excluded cases who, during
follow-up, remained suspected ALS (n ¼ 4)4,37,38,54 or sus-
pected/possible ALS (n ¼ 2).6,59 Conversely, most papers
that used the revised version of EEDC included all types of
ALS (Definite, Probable, Probable laboratory supported,
Possible) (n ¼ 13),8–14,46,47,50,57,64 and only one excluded
cases with possible ALS during follow-up (n ¼ 1).121
However, when looking at standardized rates (i.e when
controlling for age and sex distribution of the underlying
population), ALS heterogeneity was not explained by the
diagnosis (P ¼ 0.51). This might suggest that the key driver
is the modification in populations demographics, which is
related to time.
Fifth, ALS rates were standardized on age and sex only,
therefore results are susceptible to unmeasured confound-
ing factors which may vary by subcontinent or country.
International Journal of Epidemiology, 2017, Vol. 46, No. 1 69
Sixth, it would have been of major interest to perform
subgroup analyses based on ethnic groups. With the excep-
tion of recent data from the US National ALS registry ini-
tiative,113 accurate information on ethnic groups and,
consequently, number of cases by ethnic group among ALS
patients were not given in the original articles.
Seventh, we attempted to consider subcontinent as a
proxy for ancestral origin of the population, but subcontin-
ent does not represent individual population ancestral origin
or ethnicity. Also, within a given subcontinent, the ancestral
origin of subjects is not homogeneous. Human population
groups and level of admixture vary within a given country.
A clue for future research
This work shows the heterogeneity of ALS worldwide inci-
dence between subcontinents. This heterogeneity could be
related to the ancestral origin of the populations.
Nevertheless, we cannot exclude that some differences are
related to differences in environmental factors in connec-
tion with the growing evidence that aetiology relies on
multifactorial effects resulting from the combination of en-
vironmental and genetic factors.122
As is the case for Alzheimer disease,123,124 ALS pheno-
type and natural history also vary with geographical area.
Marin et al. showed that a major explanatory variable for
the variability of ALS phenotype in population-based stud-
ies is subcontinent.125 Some markers of ALS phenotype
have homogeneous distribution in Western countries
(male:female sex ratio, mean age at onset or at time diag-
nosis) but their distributions in other subcontinents are re-
markably different. Other markers (familial ALS, bulbar
onset) present variations in European and in other subcon-
tinents. As a consequence, ALS outcome markedly varies,
with a median survival time since onset ranging from 24
months (North Europe) to 48 months (South Asia).
Considering this important issue, researchers now need
to consider the organization of a wide international con-
sortium to perform with homogeneous methodology an in-
vestigation of the link between ancestry, environment and
ALS incidence and phenotype. Such an initiative might
lead to important advances in the knowledge of the mech-
anisms of ALS.
Supplementary data
Supplementary data are available at IJE online.
Funding
This research received no specific grant from any funding agency in
the public, commercial or not-for-profit sector.
AckowledgementsWe thank the following main authors or co-authors of population-
based articles who answered to our solicitation and for the useful ma-
terial for incidence standardization or phenotype characterization
that they were able to provide: Kari Murros, Poul Joensen, Raeburn
Forbes, Robert Swingler (the Scottish MND Register is funded by
MND Scotland and supported by the Anne Rowling Regenerative
Neurology Clinic), Ibrahim Imam, James Rooney, Albert Ludolph,
Gabriele Nagel, Marwa Elamin, Orla Hardiman, Mark Huisman,
Joachim Wolf, Adriano Chio, Federica Pisa, Jessica Mandrioli,
Monica Bandettini, Stefano Zocollela, Maura Pugliatti, Leslie Parish,
Paolo Ragonese, Valerie Mc Guire, Will Longstreth, Eric J. Sorenson,
Farrah Mateen, James D. Bonaparte, Cristina Vazquez, Carlos
Ketzoian, Kurupath Radhakrishnan, Chien-Hsu Lai, Chung Yan G
Fong, Hitoshi Okumura, Tameko Kihira, Bruce Taylor and A
Lannuzel. We thank Heather Jordan and Jhaqueline Valle for provid-
ing data to calculate US incidence. The data came from surveillance
projects funded by the Agency for Toxic Substances and Disease
Registry’s (ATSDR) National ALS Registry [www.cdc.gov/als] (con-
tract #200-2009-32577 and contract #200-2010-F-36614). We also
thank Walter Rocca and Brandon R. Grossardt for the detailed data
on Olmsted county population with which they provided us, and
Hidenao Sasaki, Robert Miller and Eric Denys as contact persons.
We thank Vanna Pistotti for her advice during the literature search,
as well as Mineko Terao, Lorenzo Moja and Claudio Pelucchi for
their help and comments on the manuscript. We thank Limoges
teaching hospital for its grant initiative for mobility.
Conflict of interest: Authors have no conflict of interest to disclose.
References
1. Cronin S, Hardiman O, Traynor BJ. Ethnic variation in the in-
cidence of ALS: a systematic review. Neurology 2007;68:
1002-07.
2. Chio ., Logroscino G, Traynor BJ et al. Global epidemiology of
amyotrophic lateral sclerosis: a systematic review of the pub-
lished literature. Neuroepidemiology 2013;41:118-30.
3. Joensen P. Incidence of amyotrophic lateral sclerosis in the
Faroe Islands. Acta Neurol Scand 2012;126:62-66.
4. Murphy M, Quinn S, Young J, Parkin P, Taylor B. Increasing
incidence of ALS in Canterbury, New Zealand: a 22-year study.
Neurology 2008;71:1889-95.
5. Gordon PH, Mehal JM, Holman RC, Rowland LP, Rowland
AS, Cheek JE. Incidence of amyotrophic lateral sclerosis among
American Indians and Alaska natives. JAMA Neurol
2013;70:476-80.
6. Sajjadi M, Etemadifar M, Nemati A et al. Epidemiology of
amyotrophic lateral sclerosis in Isfahan, Iran. Eur J Neurol
2010;17:984-89.
7. Bucheli M, Andino A, Montalvo M et al. Amyotrophic lateral
sclerosis: Analysis of ALS cases in a predominantly admixed
population of Ecuador. Amyotroph Lateral Scler
Frontotemporal Degener 2014;15:106-13.
8. Marin B, Hamidou B, Couratier P et al. Population-based epi-
demiology of amyotrophic lateral sclerosis (ALS) in an ageing
Europe - the French register of ALS in Limousin (FRALim regis-
ter). Eur J Neurol 2014;21:1292-300.
9. Uenal H, Rosenbohm A, Kufeldt J et al. ALS registry study
group. Incidence and geographical variation of amyotrophic
70 International Journal of Epidemiology, 2017, Vol. 46, No. 1
lateral sclerosis (ALS) in Southern Germany - completeness of
the ALS registry Swabia. PLoS One 2014;9:e93932.
10. Wolf J, Wohrle JC, Palm F et al.. Incidence of amyotrophic lat-
eral sclerosis in Rhineland-Palatinate, Germany. Amyotroph
Lateral Scler Frontotemporal Degener 2014;15:269-74.
11. Freer C, Hylton T, Jordan HM, Kaye WE, Singh S, Huang Y.
Results of Florida’s Amyotrophic Lateral Sclerosis Surveillance
Project, 2009-2011. BMJ Open 2015;5:e007359.
12. Jordan H, Rechtman L, Wagner L, Kaye WE. Amyotrophic lat-
eral sclerosis surveillance in Baltimore and Philadelphia.
Muscle Nerve 2015;51:815-21.
13. Lannuzel A, Mecharles S, Tressieres B et al. Clinical varieties
and epidemiological aspects of amyotrophic lateral sclerosis in
the Caribbean island of Guadeloupe: A new focus of ALS asso-
ciated with Parkinsonism. Amyotroph Lateral Scler
Frontotemporal Degener 2015;16:216-23.
14. Valle J, oberts E, aulukonis S, Collins N, English P, Kaye W.
Epidemiology and surveillance of amyotrophic lateral sclerosis
in two large metropolitan areas in California. Amyotroph
Lateral Scler Frontotemporal Degener 2015;16:209-15.
15. Marin B, Couratier P, Preux PM, Logroscino G. Can mortality
data be used to estimate amyotrophic lateral sclerosis inci-
dence? Neuroepidemiology 2011;36:29-38.
16. Zaldivar T, Gutierrez J, Lara G, Carbonara M, Logroscino G,
Hardiman O. Reduced frequency of ALS in an ethnically mixed
population: a population-based mortality study. Neurology
2009;72:1640-45.
17. Stroup DF, Berlin JA, Morton SC et al. Meta-analysis of obser-
vational studies in epidemiology: a proposal for reporting.
Meta-analysis Of Observational Studies in Epidemiology
(MOOSE) group. JAMA 2000;283:2008-12.
18. Fiest KM, Pringsheim T, Patten SB, Svenson LW, Jette N. The
role of systematic reviews and meta-analyses of incidence and
prevalence studies in neuroepidemiology. Neuroepidemiology
2014;42:16-24.
19. Mitsumoto H, Chad AD, Pioro EP, Amyotrophic lateral scler-
osis. In: Amyotrophic Lateral Sclerosis. Philadelphia, PA:
Davis, 1998.
20. Szklo M. Population-based cohort studies. Epidemiol Rev.
1998;20:81-90.
21. United Nations Statistics Division. Composition of Macro
Geographical (Continental) Regions, Geographical Sub-
Regions, and Selected Economic and Other Groupings. https://
unstats.un.org/unsd/methods/m49/m49regin.htm (9 January
2015, date last accessed).
22. Plato CC, Garruto RM, Galasko D et al. Amyotrophic lateral
sclerosis and parkinsonism-dementia complex of Guam: chang-
ing incidence rates during the past 60 years. Am J Epidemiol
2003;157: 149-57.
23. United Nations. Demographic Yearbook. https://unstats.un.
org/unsd/demographic/products/dyb/dyb2.html (25 June 2015,
date last accessed).
24. United States Census Bureau. National Estimates by Age, Sex,
Race: 1900-1979. http://www.census.gov/popest/data/national/
asrh/pre-1980/PE-11.html (9 January 2015, date last accessed).
25. United States Census Bureau. International Data Base. 2010.
http://www.census.gov/population/international/data/idb/
informationGateway.php (25 June, 2015, date last accessed).
26. United States Census Bureau. 2010 Census Data Products:
United States. 2010. https://www.census.gov/population/www/
cen2010/glance/(9 January 2015, date last accessed).
27. Sterne J, Bradburn M, Egger M. Meta-analysis in Stata, in
Systematic Reviews in Health Care: Meta-Analysis in Context.
BMJ Publishing 2008:347-69.
28. Higgins JP, Thompson SG, Deeks JJ, Altman DG. Measuring
inconsistency in meta-analyses. BMJ 2003;327:557-60.
29. Thompson SG, Higgins JP. How should meta-regression analyses
be undertaken and interpreted? Stat Med 2002;21:1559-73.
30. Egger M, Davey SG, Altman DG. Systematic Reviews in Health
Care: Meta-Analysis in Context. Chichester, UK: Wiley, 2008.
31. Brooks BR. El Escorial World Federation of Neurology criteria
for the diagnosis of amyotrophic lateral sclerosis. Subcommittee
on Motor Neuron Diseases/Amyotrophic Lateral Sclerosis of the
World Federation of Neurology Research Group on
Neuromuscular Diseases, and the El Escorial Clinical Limits of
Amyotrophic Lateral Sclerosis’ workshop contributors. J
Neurol Sci 1994;124 (Suppl):96-107.
32. Brooks BR, Miller RG, Swash M, Munsat TL. El Escorial re-
visited: revised criteria for the diagnosis of amyotrophic lateral
sclerosis. Amyotroph Lateral Scler Other Motor Neuron
Disord 2000;1:293-99.
33. Gunnarsson LG, Palm R. Motor neuron disease and heavy
manual labor: an epidemiologic survey of Varmland County,
Sweden. Neuroepidemiology 1984;3: 195-206.
34. Forsgren L, Almay BGL, Holmgren G, Wall S. Epidemiology of
motor neuron disease in northern Sweden. Acta Neurol
Scand.1983;68: 20-29.
35. Murros K, Fogelholm R. Amyotrophic lateral sclerosis in
Middle-Finland: an epidemiological study. Acta Neurol Scand
1983;67:41-47.
36. Højer-Pedersen E, Christensen PB, Jensen NB. Incidence and
prevalence of motor neuron disease in two Danish counties.
Neuroepidemiology 1989;8:151-59.
37. Forbes RB, Colville S, Parratt J, Swingler RJ. The incidence of
motor nueron disease in Scotland. J Neurol 2007;254:866-69.
38. Imam I, Ball S, Wright D, Hanemann CO, Zajicek J. The epi-
demiology of motor neurone disease in two counties in the
southwest of England. J Neurol 2010;257:977-81.
39. Logroscino G, Traynor BJ, Hardiman O et al.. Incidence of
amyotrophic lateral sclerosis in Europe. J Neurol Neurosurg
Psychiatry 2010;81:385-90.
40. O’Toole O, Traynor BJ, Brennan P et al. Epidemiology and clinical
features of amyotrophic lateral sclerosis in Ireland between 1995
and 2004. J Neurol Neurosurg Psychiatry 2008;79:30-32.
41. Gross-Paju K, Oopik M, Luus SM et al. Motor neurone disease
in South Estonia. Diagnosis and incidence rate. Acta Neurol
Scand 1998;98:22-28.
42. Huisman MH, de Jong SW, van Doormaal PT et al. Population
based epidemiology of amyotrophic lateral sclerosis using cap-
ture-recapture methodology. J Neurol Neurosurg Psychiatry
2011;82:1165-70.
43. Beghi E, illul A, Micheli A, Vitelli E, Logroscino G. Incidence
of ALS in Lombardy, Italy. Neurology 2007;68:141-45.
44. Chio A, Mora G, Calvo A, Mazzini L, Bottacchi E, Mutani R.
Epidemiology of ALS in Italy: a 10-year prospective popula-
tion-based study. Neurology 2009;72:725-31.
International Journal of Epidemiology, 2017, Vol. 46, No. 1 71
45. Drigo D,Verriello L, Clagnan E et al. The incidence of amyo-
trophic lateral sclerosis in Friuli Venezia Giulia, Italy, from
2002 to 2009: a retrospective population-based study.
Neuroepidemiology 2013;41:54-61.
46. Mandrioli J, Biguzzi S, Guidi C et al. Epidemiology of amyo-
trophic lateral sclerosis in Emilia Romagna Region (Italy): A
population based study. Amyotroph Lateral Scler
Frontotemporal Degener 2014;15:262-68.
47. Bandettini di Poggio M, Sormani MP,, Truffelli R et al. Clinical
epidemiology of ALS in Liguria, Italy. Amyotroph Lateral Scler
Frontotemporal Degener 2013;14:52-57.
48. Logroscino G, Beghi E, Zoccolella S et al. Incidence of amyo-
trophic lateral sclerosis in southern Italy: a population based
study. J Neurol Neurosurg Psychiatry 2005;76:1094-98.
49. Pugliatti M, Parish LD, Cossu P et al. Amyotrophic lateral
sclerosis in Sardinia, insular Italy, 1995-2009. J Neurol
2013;260:572-79.
50. Ragonese P, Cellura E, Aridon P et al. Incidence of amyotrophic
lateral sclerosis in Sicily: A population based study. Amyotroph
Lateral Scler Frontotemporal Degener 2012;13:284-87.
51. Pradas J, Puig T, Rojas-Garcia R, Viguera ML, Gich I,
Logroscino G: and A.-C. Group. Amyotrophic lateral sclerosis
in Catalonia: a population based study. Amyotroph Lateral
Scler Frontotemporal Degener 2013;14:278-83.
52. Hudson AJ, Davenport A, Hader WJ. The incidence of amyo-
trophic lateral sclerosis in Southwestern Ontario, Canada.
Neurology 1986;36:1524-28.
53. Bonaparte JP, Grant IA, Benstead TJ, Murray TJ, Smith M.
ALS incidence in Nova Scotia over a 20-year-period: a pro-
spective study. Can J Neurol Sci 2007;34:69-73.
54. Sorenson EJ, Stalker AP, Kurland LT, Windebank AJ.
Amyotrophic lateral sclerosis in Olmsted County, Minnesota,
1925 to 1998. Neurology 2002;59:280-82.
55. McGuire V, Longstreth WT Jr, Koepsell TD, van Belle G.
Incidence of amyotrophic lateral sclerosis in three counties in
western Washington state. Neurology 1996;47: 571-73.
56. Annegers JF, Appel S, Lee JRJ, Perkins P. Incidence and preva-
lence of amyotrophic lateral sclerosis in Harris County, Texas,
1985-1988. Arch Neurol 1991;48:589-93.
57. Jordan H, Fagliano J, Rechtman L, Lefkowitz D, Kaye W.
Population-based surveillance of amyotrophic lateral sclerosis in
New Jersey, 2009-2011. Neuroepidemiology 2014;43:49-56.
58. Bettini M, Vicens J, Giunta DH, Rugiero M, Cristiano E.
Incidence and prevalence of amyotrophic lateral sclerosis in an
HMO of Buenos Aires, Argentina. Amyotroph Lateral Scler
Frontotemporal Degener 2013;14:598-603.
59. Vazquez MC, Ketzoian C, Legnani C et al. Incidence and preva-
lence of amyotrophic lateral sclerosis in Uruguay: a population-
based study. Neuroepidemiology 2008;30:105-11.
60. Matsumoto N, Worth RM, Kurland LT, Okazaki H.
Epidemiologic study of amyotrophic lateral sclerosis in Hawaii.
Identification of high incidence among Filipino men.
Neurology 1972;22:934-40.
61. Radhakrishnan K, Ashok PP, Sridharan R, Mousa ME.
Descriptive epidemiology of motor neuron disease in Benghazi,
Libya. Neuroepidemiology 1986;5:47-54.
62. Okumura H. Epidemiological and clinical patterns of western
pacific amyotrophic lateral sclerosis (ALS) in Guam and sporadic
ALS in Rochester, Minnesota, U.S.A. and Hokkaido, Japan: a
comparative study. Hokkaido Igaku Zasshi 2003;78:187-95.
63. Lai CH, Tseng HF. Epidemiology and medical expenses of
motor neuron diseases in Taiwan. Neuroepidemiology
2008;31:159-66.
64. Fong G.C, Cheng TS, Lam K et al. An epidemiological study of
motor neuron disease in Hong Kong. Amyotroph Lateral Scler
Other Motor Neuron Disord 2005;6:164-68.
65. Kahana E, Zilber N. Changes in the incidence of amyotrophic
lateral sclerosis in Israel. Arch Neurol 1984;41:157-60.
66. Abhinav K, Stanton B, Johnston C et al. Amyotrophic lateral
sclerosis in South-East England: a population-based study. The
South-East England register for amyotrophic lateral sclerosis
(SEALS Registry). Neuroepidemiology 2007;29:44-48.
67. Christensen PB, Hojer-Pedersen E, Jensen NB. Survival of pa-
tients with amyotrophic lateral sclerosis in 2 Danish counties.
Neurology 1990;40:600-04.
68. Forbes RB, Colville S, Cran GW, Swingler RJ. Unexpected de-
cline in survival from amyotrophic lateral sclerosis/motor neur-
one disease. J Neurol Neurosurg Psychiatry 2004;75:1753-75.
69. Chancellor AM, Slattery JM, Fraser H, Swingler RJ, Holloway
SM, Warlow CP. The prognosis of adult-onset motor neuron
disease: A prospective study based on the Scottish Motor
Neuron Disease Register. J Neurol 1993;240:339-46.
70. Chancellor AM, Swingler RJ, Fraser H, Clarke JA, Warlow CP.
Utility of Scottish morbidity and mortality data for epidemiolo-
gical studies of motor neuron disease. J Epidemiol Community
Health 1993;47:116-20.
71. Rooney J, Byrne S, Heverin M et al. Survival Analysis of Irish
amyotrophic lateral sclerosis patients diagnosed from 1995-
2010. PLoS One 2013;8.e74733.
72. Phukan J, Elamin M, Bede P et al. The syndrome of cognitive
impairment in amyotrophic lateral sclerosis: a population-
based study. J Neurol Neurosurg Psychiatry 2012;83:102-08.
73. Donaghy C, Clarke J, Patterson C, Kee F, Hardiman O,
Patterson V. The epidemiology of motor neuron disease in
Northern Ireland using capture-recapture methodology.
Amyotroph Lateral Scler Frontotemporal Degener 2010;11:
374-78.
74. Donaghy C, O’Toole O, Sheehan C, Kee F, Hardiman O,
Patterson V. An all-Ireland epidemiological study of MND,
2004-2005. Eur J Neurol 2009;16:148_53.
75. Traynor BJ, Codd MB, Corr B, Forde C, Frost E, Hardiman O.
Incidence and prevalence of ALS in Ireland, 1995-1997: a
population-based study. Neurology 1999;52:504-09.
76. Traynor BJ,Codd MB, Corr B, Forde C, Frost E, Hardiman
OM. Clinical features of amyotrophic lateral sclerosis accord-
ing to the El Escorial and Airlie House diagnostic criteria: A
population-based study. Arch Neurol 2000;57:1171-76.
77. Pupillo E, Messina P, Logroscino G, Beghi E. Long-term sur-
vival in amyotrophic lateral sclerosis: A population-based
study. Ann Neurol 2014;75:287-97.
78. Millul A, Beghi E, Logroscino G, Micheli A, Vitelli E, Zardi A.
Survival of patients with amyotrophic lateral sclerosis in a
population-based registry. Neuroepidemiology 2005;25:
114-19.
79. Chio A, Cucatto A, Calvo A, Terreni AA, Magnani C, Schiffer
D. Amyotrophic lateral sclerosis among the migrant
72 International Journal of Epidemiology, 2017, Vol. 46, No. 1
population to Piemonte, northwestern Italy. J Neurol
1999;246:175-80.
80. Chio A,Mora G, Leone M et al. Early symptom progression
rate is related to ALS outcome: a prospective population-based
study. Neurology 2002;59:99-103.
81. Chio A, Calvo A, Moglia C et al. Phenotypic heterogeneity of
amyotrophic lateral sclerosis: A population based study.
J Neurol Neurosurg Psychiatry 2011;82:740-46.
82. Piemonte and Valle d’Aosta Register for Amyotrophic Lateral
Sclerosis (PARALS). Incidence of ALS in Italy: evidence for a
uniform frequency in Western countries. Neurology 2001;
56:239-44.
83. Mandrioli J, Faglioni P, Merelli E, Sola P. The epidemiology of
ALS in Modena, Italy. Neurology 2003;60:683-89.
84. Mandrioli J, Faglioni P, Nichelli P, Sola P. Amyotrophic lateral
sclerosis: Prognostic indicators of survival. Amyotroph Lateral
Scler Frontotemporal Degener 2006;7:217-26.
85. Mandrioli J, Salvi F, Sette E et al. Amyotrophic lateral sclerosis
in emilia romagna, Italy: A population based study from 2009
to 2011. the emiliaromagna register for ALS (errals).
Amyotroph Lateral Scler Frontotemporal Degener 2012;
13:128.
86. GovoniV, Granieri E, Capone J, Manconi M, Casetta I.
Incidence of amyotrophic lateral sclerosis in the local health
district of Ferrara, Italy, 1964-1998. Neuroepidemiology 2003;
22:229-34.
87. Granieri E, Carreras M, Tola R et al., Motor neuron disease in
the province of Ferrara, Italy, in 1964-1982. Neurology
1988;38:1604-08.
88. Guidetti D, Bondavalli M, Sabadini R et al. Epidemiological
survey of amyotrophic lateral sclerosis in the province of
Reggio Emilia, Italy: influence of environmental exposure to
lead. Neuroepidemiology 1996;15:301-12.
89. Georgoulopoulou E, Vinceti M, Bonvicini F et al. Changing in-
cidence and subtypes of ALS in Modena, Italy: A 10-years pro-
spective study. Amyotroph Lateral Scler Frontotemporal
Degener 2011;12:451-57.
90. Bonvicini F, Vinceti M, Marcello N, Rodolfi R, Rinaldi M. The
epidemiology of amyotrophic lateral sclerosis in Reggio Emilia,
Italy. Amyotroph Lateral Scler Frontotemporal Degener
2008;9:350-53.
91. Zoccolella S, Beghi E, Palagano G et al. Signs and symptoms at
diagnosis of amyotrophic lateral sclerosis: a population-based
study in southern Italy. Eur J Neurol 2006;13:789-92.
92. Zoccolella S, Beghi E, Palagano G et al Analysis of survival and
prognostic factors in amyotrophic lateral sclerosis: a population
based study. J Neurol Neurosurg Psychiatry 2008;79:33-37.
93. Zoccolella S, Beghi E, Palagano G et al. Predictors of long sur-
vival in amyotrophic lateral sclerosis: a population-based study.
J Neurol Sci 2008;268:28-32.
94. Mateen FJ, Carone M, Sorenson EJ. Patients who survive 5
years or more with ALS in Olmsted County, 1925-2004. J
Neurol Neurosurg Psychiatry 2010;81:1144-46.
95. Mulder DW, Howard FM Jr. Patient resistance and prognosis
in amyotrophic lateral sclerosis. Mayo Clin Proc 1976;51:
537-41.
96. Yoshida S,Mulder DW, Kurland LT, Chu CP, Okazaki H.
Follow-up study on amyotrophic lateral sclerosis in
Rochester, Minn., 1925 through 1984. Neuroepidemiology
1986;5:61-70.
97. del Aguila MA, Longstreth WT Jr, McGuire V, Koepsell TD,
van Belle G. Prognosis in amyotrophic lateral sclerosis: a popu-
lation-based study. Neurology 2003;60:813-19.
98. Lee CT, Chiu YW, Wang KC et al. Riluzole and prognostic fac-
tors in amyotrophic lateral sclerosis long-term and short-term
survival: a population-based study of 1149 cases in Taiwan.
J Epidemiol 2013;23:35-40.
99. Fong KY, Yu YL, Chan YW et al. Motor neuron disease in
Hong Kong Chinese: epidemiology and clinical picture.
Neuroepidemiology 1996;15:239-45.
100. Gubbay SS, Kahana E, Zilber N, Cooper G, Pintov S,
Leibowitz Y. Amyotrophic lateral sclerosis. A study of its pres-
entation and prognosis. J Neurol 1985;232:295-300.
101. Govoni V, Cesnik E, Casetta, I, Tugnoli V, Tola MR, Granieri
E. Temporal trend of amyotrophic lateral sclerosis incidence in
southern Europe: a population study in the health district of
Ferrara, Italy. J Neurol 2012;259:1623-31.
102. Johnston CA,Stanton BR, Turner MR et al. Amyotrophic lat-
eral sclerosis in an urban setting: a population based study of
inner city London. J Neurol 2006;253: 1642-43.
103. Manjaly ZR, Scott KM, Abhinav K et al. The sex ratio in amyo-
trophic lateral sclerosis: A population based study. Amyotroph
Lateral Scler Frontotemporal Degener2010;11:439-42.
104. Rojas-Garcia R, Scott KM, Roche JC et al. No evidence for a
large difference in ALS frequency in populations of African and
European origin: a population based study in inner city
London. Amyotroph Lateral Scler Frontotemporal Degener
2012;13:66-68.
105. Scott KM, Abhinav K, Stanton BR et al Geographical clustering
of amyotrophic lateral sclerosis in South-East England: a popu-
lation study. Neuroepidemiology 2009;32:81-88.
106. Scott KM, Abhinav K, Wijesekera L et al. The association between
ALS and population density: A population based study. Amyotroph
Lateral Scler Frontotemporal Degener 2010;11:435-38.
107. Norris F, Shepherd R, Denys E et al. Onset, natural history and
outcome in idiopathic adult motor neuron disease. J Neurol Sci
1993;118:48-55.
108. Kihira T, Yoshida S, Hironishi M, Miwa H, Okamato K,
Kondo T. Changes in the incidence of amyotrophic lateral
sclerosis in Wakayama, Japan. Amyotroph Lateral Scler Other
Motor Neuron Disord 2005;6:155-63.
109. Yoshida S, Uebayashi Y, Kihira T et al. Epidemiology of motor
neuron disease in the Kii Peninsula of Japan, 1989-1993: active
or disappearing focus? J Neurol Sci 1998;155:146-55.
110. Kihira T, Yoshida S, Kondo T et al. An increase in ALS inci-
dence on the Kii Peninsula, 1960-2009: a possible link to
change in drinking water source. Amyotroph Lateral Scler
Frontotemporal Degener 2012;13:347-50.
111. Wolf J, Safer A, Wohrle JC et al. Variability and prognostic
relevance of different phenotypes in amyotrophic lateral scler-
osis - Data from a population-based registry. J Neurol Sci
2014;345:164-67.
112. Okumura H, Moriwaka F, Tashiro K et al. [Epidemiological
study of motor neuron disease in Hokkaido island - its inci-
dence, prevalence and regional distributions - ALS Study
Group]. No To Shinkei 1992;44:727-32.
International Journal of Epidemiology, 2017, Vol. 46, No. 1 73
113. Rechtman L, Jordan H, Wagner L, Horton DK, Kaye W. Racial
and ethnic differences among amyotrophic lateral sclerosis
cases in the United States. Amyotroph Lateral Scler
Frontotemporal Degener 2015;16:65-71.
114. Wagner L,Rechtman L, Jordan H et al. State and metropolitan
area-based amyotrophic lateral sclerosis (ALS) surveillance.
Amyotroph Lateral Scler Frontotemporal Degener 2015;
17:128-34.
115. Lasser KE, Himmelstein DU, Woolhandler S. Access to care,
health status, and health disparities in the United States and
Canada: results of a cross-national population-based survey.
Am J Public Health 2006;96:1300-07.
116. Chang MH, Molla MT, Truman BI, Athar H, Moonesinghe R,
Yoon PW. Differences in healthy life expectancy for the US
population by sex, race/ethnicity and geographic region: 2008.
J Public Health (Oxf) 2015;37:470-79.
117. Marin B, Kacem I, Diagana M et al. Juvenile and adult-onset
ALS/MND among Africans: incidence, phenotype, survival: a
review. Amyotroph Lateral Scler Frontotemporal Degener.
2012;13:276-83.
118. Logroscino G, Tortelli R, Rizzo G,Marin B, Preux PM,
Malaspina A. Amyotrophic Lateral Sclerosis: An Aging-
Related Disease. Curr Geriatr Rep 2015;4:142–53.
119. Logroscino G, Traynor BJ, Hardiman O et al. Descriptive epidemi-
ology of amyotrophic lateral sclerosis: new evidence and unsolved
issues. J Neurol Neurosurg Psychiatry 2008;79:6-11.
120. Lee JR, Annegers JF, Appel SH. Prognosis of amyotrophic lat-
eral sclerosis and the effect of referral selection. J Neurol Sci
1995;132:207-15.
121. Bettini M, Gargiulo-Monachelli GM, Rodriguez G, Rey RC,
Peralta LM, Sica RE. Epidemiology of amyotrophic lateral
sclerosis patients in a centre in Buenos Aires. Arq
Neuropsiquiatr 2011;69:867-70.
122. Al-Chalabi A, Hardiman O. The epidemiology of ALS: a con-
spiracy of genes, environment and time. Nat Rev Neurol
2013;9:617-28.
123. Mehta KM, Yaffe K, Perez-Stable EJ et al. Race/ethnic differ-
ences in AD survival in US Alzheimer’s Disease Centers.
Neurology 2008;70:1163-70.
124. Helzner EP, Scarmeas N, Cosentino S, Tang MX, Schupf N, Stern
Y. Survival in Alzheimer disease: a multiethnic, population-based
study of incident cases. Neurology 2008;71:1489-95.
125. Marin B, Logroscino G, Boumediene F et al. Clinical and
demographic factors and outcome of amyotrophic lateral scler-
osis in relation to population ancestral origin. Eur J Epidemiol
2016;41:229-45.
74 International Journal of Epidemiology, 2017, Vol. 46, No. 1